Formal thinking about correlation
7
Scand. J. Psycho/. 20, 119-125, 1979 Formal thinking about correlation STEVEGREEN MARGARET JURD IAN SEGGIE The University of Newcastle, Australia Green S., Jurd, Margaret & Seggie, J. L.: Formal thinking about correlation. Scand. J. Psychol. 20, 11!3-125, 1979. Twenty-five adults were administered two tasks involving the data of 12,2x2 matrices. In the first, subjects were invited to make decisions on the basis of data which was presented as involving causal, one-way relationships. Four groups of subjects were distinguished in the level of their operational thinking. In task 2 the subjects were invited to make judge- ments on identical data, but presented as involving two-way noncausal relationships. Results showed changes in the level of thought: subjects employing concrete operations in task 1 regressed to lower levels of thought; subjects employing transitional formal thought in task 1 advanced to fully formal thought in task 2. It was concluded that the first task imposed a ceiling effect on the thought levels of the latter subjects. Results showed that the level of thought employed was a function of the frequency of the data in the cells of the matrices and that the emergence of illogical thought was related to task difficulty. Zan Seggie, Department of Psychology, The University of Newcastle, N.S. W. 2308, Austra- lia. The study of the understanding of correlation is particularly interesting because it suggests the kind of comparisons which people make implicitly in everyday life when considering contingent and cau- sal relations. Such a study was used by Inhelder & Piaget (1958) to exemplify development in logical thinking through adolescence to adulthood. They found that some adolescents, given a distribution of cards which showed the incidence of blue eyes and blonde hair (a), blue eyes and brown hair (b), brown eyes and blonde hair (c), and brown eyes and brown hair (d), found the strength of associa- tion between hair and eye colour by calculating the difference between confirming instances (a +d) and disconfirming instances (b +c). This calculation was said to indicate an understanding of the concept of correlation and coincidentally a use of formal operational thinking in which propositions showed the relations of equivalence and reciprocal exclu- sion. Obviously people may not be aware of making such implicit comparisons, nor may they do so with any great precision unless the task is presented to them explicitly, but a recognition of the develop- mental sequence in thinking which precedes such achievement may increase our understanding of some of the limitations in thinking about causal and contingent relations which occur in everyday life. Such a sequence has been defined by Inhelder & Piaget (1958). Subsequent investigators of the understanding of this concept among adults (Gray, 1976; Ross 1973; Seggie & Endersby, 1972; Seggie, 1975; Smedslund, 1963; Ward & Jenkins, 1965) have found few people who could be said to think at the highest, or late formal operational, level but the studies have sug- gested variables which seem to influence under- standing. While the initial study by Smedslund failed to find any evidence of formal thought among adults, the work of Ward & Jenkins pointed to the importance of the method of presentation of the data in that their material in tabular form led to a degree of success in adults dealing with correlated data. Ward & Jenkins also criticised the criteria used by Inhelder & Piaget, pointing out that such criteria were applicable only to limited instances of correlational items. Seggie & Endersby (1972), using the same nume- rical items as Smedslund, found that when people were asked to make practical decisions on the basis Scand. J. Psychol. 20
-
Upload
steve-green -
Category
Documents
-
view
215 -
download
2
Transcript of Formal thinking about correlation

Scand. J . Psycho/ . 20, 119-125, 1979
Formal thinking about correlation
STEVEGREEN MARGARET JURD IAN SEGGIE
The University of Newcastle, Australia
Green S., Jurd, Margaret & Seggie, J. L.: Formal thinking about correlation. Scand. J . Psychol. 20, 11!3-125, 1979.
Twenty-five adults were administered two tasks involving the data of 12,2x2 matrices. In the first, subjects were invited to make decisions on the basis of data which was presented as involving causal, one-way relationships. Four groups of subjects were distinguished in the level of their operational thinking. In task 2 the subjects were invited to make judge- ments on identical data, but presented as involving two-way noncausal relationships. Results showed changes in the level of thought: subjects employing concrete operations in task 1 regressed to lower levels of thought; subjects employing transitional formal thought in task 1 advanced to fully formal thought in task 2. It was concluded that the first task imposed a ceiling effect on the thought levels of the latter subjects. Results showed that the level of thought employed was a function of the frequency of the data in the cells of the matrices and that the emergence of illogical thought was related to task difficulty.
Zan Seggie, Department of Psychology, The University of Newcastle, N.S. W . 2308, Austra- lia.
The study of the understanding of correlation is particularly interesting because it suggests the kind of comparisons which people make implicitly in everyday life when considering contingent and cau- sal relations. Such a study was used by Inhelder & Piaget (1958) to exemplify development in logical thinking through adolescence to adulthood. They found that some adolescents, given a distribution of cards which showed the incidence of blue eyes and blonde hair ( a ) , blue eyes and brown hair (b), brown eyes and blonde hair (c ) , and brown eyes and brown hair (d), found the strength of associa- tion between hair and eye colour by calculating the difference between confirming instances ( a + d ) and disconfirming instances (b +c) . This calculation was said to indicate an understanding of the concept of correlation and coincidentally a use of formal operational thinking in which propositions showed the relations of equivalence and reciprocal exclu- sion.
Obviously people may not be aware of making such implicit comparisons, nor may they do so with any great precision unless the task is presented to them explicitly, but a recognition of the develop- mental sequence in thinking which precedes such
achievement may increase our understanding of some of the limitations in thinking about causal and contingent relations which occur in everyday life. Such a sequence has been defined by Inhelder & Piaget (1958).
Subsequent investigators of the understanding of this concept among adults (Gray, 1976; Ross 1973; Seggie & Endersby, 1972; Seggie, 1975; Smedslund, 1963; Ward & Jenkins, 1965) have found few people who could be said to think at the highest, or late formal operational, level but the studies have sug- gested variables which seem to influence under- standing. While the initial study by Smedslund failed to find any evidence of formal thought among adults, the work of Ward & Jenkins pointed to the importance of the method of presentation of the data in that their material in tabular form led to a degree of success in adults dealing with correlated data. Ward & Jenkins also criticised the criteria used by Inhelder & Piaget, pointing out that such criteria were applicable only to limited instances of correlational items.
Seggie & Endersby (1972), using the same nume- rical items as Smedslund, found that when people were asked to make practical decisions on the basis
Scand. J . Psychol. 20

120 S. Green et al.
of correlated data a greater percentage of adults did appear to understand the concept. This experiment drew attention to the nature of the task used, how- ever further work suggested that many of the cor- rect decisions made may not have been based upon top formal level reasoning (Seggie, 1975). Another finding was that some items, presented more diffi- culty than others. Both Seggie (1975) and Jurd (1975) found that the interpretation of a zero corre- lation was more difficult than correlations which were clearly positive or negative. Inhelder & Piaget (1958, p. 237) had earlier noted the particular difi- culties occurring with zero correlations and with items in which a=b or c=d but with the other two cells unequal.
It thus appeared that at least four variables should be considered in any further investigation namely: (I) the method of presenting the data; (11) the range of items used; (111) the meaningful nature of the material for the person doing the experiment, and (IV) the criteria being used for the under- standing of the concept.
Some interaction between the last two variables mentioned also seemed possible. In an earlier study Jurd (1975) had noted a difference between the questions used by Seggie and by Ward & Jenkins and those used by Inhelder & Piaget. Both Seggie and Ward & Jenkins asked questions which sug- gested a causal relationship, hospitalisation leading to recovery and cloud-seeding leading to rain. Their questions thus attracted attention to a one-way rela- tionship in that one event must have preceded the other. In this respect their questions differed from a correlation found between hair and eye colour in which no causal relationship is involved. A group test using two ways of phrasing questions about poverty and illness (Jurd, 1975), one way emphasiz- ing causal relations and the other contingent rela- tions, was given to school children. Results showed no significant difference in this regard but compara- tively few students answered even half the items at early formal operational level. The possibility re- mained that a two-way question, where a causal relationship was less likely, might be more difficult and that this difficulty would be apparent between the early formal operational and the late formal operational levels. Furthermore, a pilot study with university students suggested that while Seggie’s decision task based on the one-way question might be useful in leading some people towards a higher level of congnitive functioning, it might also impose
a ceiling level in that subjects may not be encour- aged to consider a noncausal relationship.
A similar difference seemed to be implicit in the two kinds of criteria commonly used for the under- standing of correlations. Ward & Jenkins had sug- gested that the criterion of a comparison of two proportions [ a / ( a + c ) ] : [ b / ( b + d ) ] showed an ade- quate understanding of correlations but it was felt that whereas this might be adequate for causal rela- tions, or as it is called here a one-way question, this criterion would be inadequate for a contingency or two-way relationship. For the two-way relationship Inhelder & Piaget’s formula of the difference be- tween the sums of diagonals was applicable. How- ever, Ward & Jenkins were correct in saying that the range of items to which this latter formula ap- lied was limited to those in which the number of cases was equally divided on one attribute (a+b= c +d or a f c =b +d). In terms of the investigation of logical operations this limitation on the range of items was not considered important by Inhelder & Piaget (1958) but an extension of the range would require the application of Ward & Jenkins’ criterion to a comparison of two sets of proportions (a/a +b : c/c+d anda/a+c :b/b+d).
It thus appeared that an understanding of correla- tions might be judged at either of two levels depend- ing upon the question asked and the criterion used. If a one-way, causal question were asked an ade- quate answer might seem to be provided by a com- parison of two proportions, but if a two-way contin- gency question were asked then either Piaget’s for- mula or a double comparison of two proportions was needed. Such a difference in levels had been indicated in Inhelder & Piaget’s original research (1958, p. 234) where the comparison of two ratios was described as being at an early formal opera- tional level but the use of the difference between diagonals was seen as a distinct step in the attain- ment of late formal operations.
The present study was designed to investigate possible differences in the effect of one-way and two-way questions and the relationship of these to the criteria used for cognitive level. Since the effect of each kind of question on attainment was un- known, and as it was possible that the difference in levels might occur within a limited range, the same group of people was asked both kinds of questions in relation to the same numerical distribution in items. The items were of two kinds: one to which Piaget’s formula could be applied, the other in
Scand. J . Psvchol. 20

Formal thinking about correlation 121
Table 1. Frequencies in the four cells of the 2 ~2 matrices, set out in order of presentation
No. Description a cell b cell c cell d cell
1 P zero 35 15 35 15 2 P positive 50 0 0 50 3 P positive 35 15 15 35 4 P zero 25 25 25 25 5 P negative 20 1 0 0 90 30 6 NP zero 0 0 60 50 7 NP zero 10 20 30 60 8 P positive 30 0 30 60 9 P negative I5 35 35 15
10 P zero 15 35 15 35 1 1 NP zero 40 20 20 10 12 NP negative 20 40 20 20
which the use of this formula would be inappro- priate.
The importance of using material which has in- trinsic interest for subjects has been recognised by both Smedslund (1%3) and Seggie (Seggie & En- dersby, 1972; Seggie, 1975). Their approach was recommended in more general terms by Piaget (1972) when he suggested that formal operational thinking might only be found when the material was of interest t o the person and related t o his own experience.
PROCEDURE Since the purpose of the experiment was to explore higher level thinking about correlations it was decided to present data in the most readily interpretable manner, i.e., a 2x2 matrix of numbers, and to combine this written presenta- tion with a method of critical exploration in an individual interview situation.
The subjects undertaking the two correlation tasks in this experiment were 25 members of the personnel de- partment (aged 18 to 30) of an industrial company respon- sible for the employment and training of trade apprentices. All had completed 5 years of secondary school and the tasks chosen were related to their employment interests. In the first task with the one-way question the instruc-
tions, which were printed and read with the person doing the test, began: “Consider the situation where you are trying to decide who, on the whole, are the better appren- tices, those employed from a country area or those em- ployed from the city. You are to base your decision only on the figures in the matrix below, which shows the num- ber of city and country apprentices who had turned out to be good or bad at their job in the past . . .”
In the second task the instructions began: “Consider the situation where there is a meeting of the management of the company and the management of the technical college to decide whether the job course and the college courses are testing the same skills. You are asked to estimate on the basis of the figures presented in the matrix below, the
strength of the connection between the two courses. The matrix shows the number ofapprentices who were good or bad at college and on the job last year . . .”
Under the instructions were set out twelve 2x2 appro- priately labelled matrices. The same twelve numerical dis- tributions were used for each task and are set out in Table 1 with a description of the salient points likely to influence interpretation. Those distributions to which Pi- aget’s formula could be applied are Labelled P, those to which it could not be legitimately applied are labelled NP.
In scoring the answers it was possible to use Inhelder & Piaget’s defined sequence in the understanding of correla- tions but it was necessary to provide an alternative, top level criterion for those items where Piaget’s formula would be inappropriate. Inhelder & Piaget had noted a progression which began with the explanation in terms of one number, usually the largest. At the next two levels a comparison of two frequencies was used, followed by a comparison of two ratios. Finally the relationships of equi- valence and reciprocal exclusion were understood and calculations were based on the differences between the sums of diagonal cells. The criteria for levels of thinking about correlations were therefore established as:
Level I. Explanation based on a number in one cell of the matrix.
Level 2. Explanation based on numbers in two cells of the matrix, either one column or one row, and concentra- tion on relative frequencies.
Level 3. Explanation based on two proportions, either comparing
a b o r a t o - b c t 0 z a+c b+d or comparing
a t o g , o r a t o C - . b d a + b , c+d
Level 4 (A). Explanation based on the difference be- tween confirming cases ( a +d) and non-confirming cases (b+c) . (B). Explanation based on a comparison of two proportions in two directions
a b - t o - , o r to - b , o r a c to j , o r s b to c+d’ C c d a+c b+d
Scand. J . Psychol. 20
122 S. Green et al.
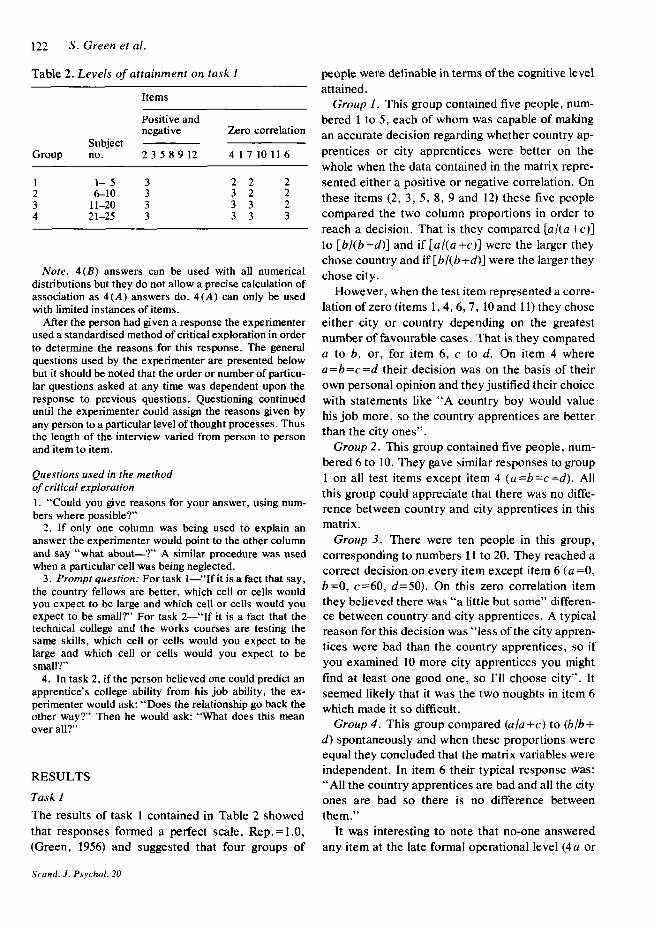
Table 2 . Levels of attainment on task I
Items
Positive and negative Zero correlation
Subject Group no. 2358912 41710116
1 1- 5 3 2 2 2 2 6-10 3 3 2 2 3 11-20 3 3 3 2 4 21-25 3 3 3 3
Note. 4(B) answers can be used with all numerical distributions but they do not allow a precise calculation of association as 4(A) answers do. 4(A) can only be used with limited instances of items.
After the person had given a response the experimenter used a standardised method of critical exploration in order to determine the reasons for this response. The general questions used by the experimenter are presented below but it should be noted that the order or number of particu- lar questions asked at any time was dependent upon the response to previous questions. Questioning continued until the experimenter could assign the reasons given by any person to a particular level of thought processes. Thus the length of the interview varied from person to person and item to item.
Questions used in the method of critical exploration 1. “Could you give reasons for your answer, using num- bers where possible?’ 2. If only one column was being used to explain an
answer the experimenter would point to the other column and say “what about-?’ A similar procedure was used when a particular cell was being neglected. 3. Prompt question: For task 1-“If it is a fact that say,
the country fellows are better, which cell or cells would you expect to be large and which cell or cells would you expect to be small?’ For task 2-“If it is a fact that the technical college and the works courses are testing the same skills, which cell or cells would you expect to be large and which cell or cells would you expect to be small?’ 4. In task 2, if the person believed one could predict an
apprentice’s college ability from his job ability, the ex- perimenter would ask: “Does the relationship go back the other way?’ Then he would ask: “What does this mean over all?”
RESULTS
Task I The results of task 1 contained in Table 2 showed that responses formed a perfect scale, Rep. = 1 .O, (Green, 1956) and suggested that four groups of
people were definable in terms of the cognitive level attained.
Group 1. This group contained five people, num- bered 1 to 5, each of whom was capable of making an accurate decision regarding whether country ap- prentices or city apprentices were better on the whole when the data contained in the matrix repre- sented either a positive or negative correlation. On these items (2, 3, 5, 8, 9 and 12) these five people compared the two column proportions in order to reach a decision. That is they compared [a/(a+c)] to [ b / ( b + d ) ] and if [ a / ( a + c ) ] were the larger they chose country and if [b / (b+d) ] were the larger they chose city.
However, when the test item represented a corre- lation of zero (items 1 ,4 ,6 ,7 , 10 and 11) they chose either city or country depending on the greatest number of favourable cases. That is they compared a to b, or, for item 6, c to d. On item 4 where a=b=c=d their decision was on the basis of their own personal opinion and they justified their choice with statements like “A country boy would value his job more, so the country apprentices are better than the city ones”.
Group 2 . This group contained five people, num- bered 6 to 10. They gave similar responses to group 1 on all test items except item 4 (a=b=c=d). All this group could appreciate that there was no diffe- rence between country and city apprentices in this matrix.
Group 3 . There were ten people in this group, corresponding to numbers 11 to 20. They reached a correct decision on every item except item 6 (a=O, b=O, c=60, d=50). On this zero correlation item they believed there was “a little but some” differen- ce between country and city apprentices. A typical reason for this decision was “less of the city appren- tices were bad than the country apprentices, so if you examined 10 more city apprentices you might find at least one good one, so I’ll choose city”. It seemed likely that it was the two noughts in item 6 which made it so difficult.
Group 4 . This group compared (a/a+c) to (b/b+ d ) spontaneously and when these proportions were equal they concluded that the matrix variables were independent. In item 6 their typical response was: “All the country apprentices are bad and all the city ones are bad so there is no difference between them.”
It was interesting to note that no-one answered any item at the late formal operational level (4a or
Scand. J. Psychol. 20

Formal thinking about correlation 123
Table 3. Levels of attainment on task 2
Items
Positive and negative Zero Zero Neg. Zero
Subject - - Group no. 2 3 5 8 9 4.10 1 1 7 12 1 6
1 & 2 1-10 2 2 2 2 2 2 2 3a 11-14 3 3 3 3 3 3 3 36 15-16 4 4 4a 4a 4a 3 3 3c 17-20 4 4 4 4 a 4a 4 3 4 21-25 4 4 4 4 4 4 4
4 b ) so that the task 1 question looked as though it could be imposing a ceiling level on the answers. On the other hand everyone in each of the four groups was capable of comparing two proportions on at least some of the items. Further, all the zero corre- lations were more difficult than the other items.
Task 2 In scoring the second task the use of Piaget’s formu- la ( 4 a ) , as opposed to the two comparisons of two proportions (4 b ) , was only noted in cases for which Piaget’s formula was inappropriate. In items for which either formula could be used only level 4 was recorded. The levels of attainment gained by the task 1 groups on different items during the second task are indicated in Table 3.
Once again responses to the task formed a perfect scale; also for both tasks the order of cognitive level between subjects was completely maintained. Fur- thermore, with only one exception, the comparative difficulty of items found in task 1 continued into task 2 with the two-way question. Differences were found, however, in the number of groups of people and in the levels at which items were answered.
Firstly, people ranked in order of cognitive level on one task retained the same order on task 2 . However their distribution into homogeneous groups changed, indicating that the two-way ques- tion discriminated at a different operational levels from the one-way question.
Groups I and 2 answered at the same level as each other, level 2 on every item. The effect of the changed question for them was to produce lower operational level answers on question 4 for group 2 and on questions 2 , 3 , 5 , 8 and 9 for both groups. As on task 1 the more difficult items had produced lower level answers, so on task 2 the more difficult question resulted in regression of the operational
level and eliminated the differences between groups 1 and 2. Both groups typically compared a to a +b or to a +c. If their personal opinion was that the tech- nical college course was more important than the job training they compared the number who were good at both college and jobs to the total who were good in the college course; similarly if in their opin- ion the job was more important than college they compared the number good at both to the total doing a good job. Presumably the job skills were being evaluated in the light of the college course, or the course was being evaluated in terms of job re- quirements. In summary, the more difficult ques- tion resulted in regression to lower level answers and a dependence on belief rather than reason.
Group 3 could be divided into three definable sub-groups on task 2. The two-way question
TASK 1 TASK 2
Groups 1 and 2
Group 3a
Group 3b
7 Group
Group 2
Group 3
Fig. 1. Diagram of change in operational levels from task 1 to task 2.
Scnnd. J . Psychol. 20

124 S . Green et al.
seemed to provoke higher level responses on items 1 and 6 (levels moved from 2 to 3) and there was no regression on any item, but these sub-groups could best be discriminated on the degree to which they could use the difference between diagonals (4a, Piaget’s formula). Whereas four people could not use this level at all, two people used it on five items, though it was inappropriate for three of these. The highest four people in this group could use the dif- ference between diagonals on all but item 6 and they realised the inappropriateness of the difference for item 11.
In achieving these higher levels three people (15, 16 and 17) who used level 4 answers, whether ap- propriately or not, seemed to be assisted by the “prompt” question together with the presentation of the perfect correlation of item 2. It is probably of equal interest, however, that four other people (1 1, 12, 13 and 14) could not be helped by this question.
The fact became clear that there was a definite limit beyond which the questions asked could not help people. In items 7 and 11 people 15 to 20 inclusive could be brought through questioning to consider a comparison of two proportions twice (see interviewer’s question 4), but as a consequence of this only persons 17, 18, 19 and 20 realised that there was zero correlation, and this on item 11 only where all four proportions were equal
u+b c+d a+c b+d
On item 7, where
a+b c + d * z = m ’
they continued to maintain that there was some relationship between job and tech skills.
Group 4 the difference between group 3 and group 4 was that group 3 continued to apply Piaget’s formula when trying to solve all items. They lacked the flexibility of the group 4 people who, having both level 4 methods available to them, abandoned the use of diagonals when these were inappropriate. Furthermore, though they had used only level 3 answers on task 1 they spontaneously used level 4 when the question was changed for task 2.
Secondly, with regard to the difficulty of items there was considerable confirmation of the fact that zero correlations were more difficult than items which were either clearly positive or negative. Item 12, a negative correlation, was the only one to in- trude among the zero correlations in task 2, and this
C a b -=-=-- --. a
U C a b -=-
was because people attempted to use Piaget’s for- mula inappropriately with it.
Item dsfficulty: easiest to hardest Task 1: 2 3 5 8 9 124 10 I 1 7 1 6 Task2: 2 3 5 8 9 4 10 11 7 12 1 6
Since the other three items to which Piaget’s for- mula did not apply were also zero correlations there was little evidence that the alternative criterion of level 4b, two comparisons of two proportions, was any more difficult than criterion 4a, the difference between diagonals. Indeed, item 1, for which 4a was appropriate, remained among the most diffi- cult. Item 6 was most difficult, but it combined three problems, a =b and c*d, with zero correlation and with the inapplicability of the difference be- tween diagonals. The main contribution of items which demanded the use of criterion 4b was that they indicated the flexibility available to group 4, people whose thinking clearly included a structure isomorphic to the concept of correlation.
DISCUSSION
These results provide an indication not only of the development of an understanding of the concept of correlation but of the kinds of development which probably occur in all operational thinking. The sta- ble sequences in development show that it is not a matter of whether a person has or has not a concept or a certain level of thinking, but a matter of the extent to which a concept is understood and under what conditions, e.g., with what material or item and in response to what question. For those people between late concrete and late formal operational levels of thinking the items in this study were main- tained in a comparatively stable order of difficulty and the responses formed a scale for each task.
In the definition of criteria leading to achieve- ment at the late formal operational stage the previo- us work of Inhelder & Piaget was confirmed. Yet it should be pointed out that of the 25 adults attempt- ing the second task only 40 % used a formal opera- tional level consistently. For the subjects of group 4 the lack of differences in difficulty between items, and the obvious flexibility in using different kinds of approach, was indicative of the stabilised attain- ment of the appropriate operational structures. Yet it should be noted that even when the problem
Scand. J . Psychol. 20
Formal thinking about correlation 125
posed is within the special interest of the subjects concerned, the data show that a minority achieve fully formal level thinking, contrary to the claims of Piaget (1972).
A number of problems arising from variables which had been noted in previous experiments were resolved in the present investigation. The differen- ce in criteria proposed by Ward & Jenkins and the difference in questions relating to causality, which was an implicit factor in studies by Ward & Jenkins and by Seggie, were shown to be significant. At the early formal operational level the causal, one-way question was more discriminatory but it imposed a ceiling on thinking for those people able to use late formal operational structures and those approach- ing such use. At a higher level the contingency, or two-way, question was more discriminatory. The provision of an alternative criterion for this level, which overcame previous criticism of the limited range of items, did not seem to add to the under- standing of the development of logical relations but it did serve to indicate possible flexibility in thinking.
The study probably has implications for the in- terpretation of fairly common errors in thinking. As Seggie (1975) had found previously, when factual data were difficult to interpret personal opinion and illogical reasoning became more prominent. In the present study it was when answers were given which were below the early formal operational level that the person’s own belief was used to substanti- ate their explanation. Answers at the formal level were justified on more logical grounds. Thus, de- spite the fact that a full understanding of the concept of correlation at the late formal operational level was not available to everyone answering at the formal level (levels 3 and 4) a change did seem to occur in argument from a basis in “reality” to a more logically based argument between concrete and formal operational stages.
Another common error is to interpret correlations as though they prove causal relations. In the light of this experiment this error can be seen as a tendency to simplify thinking by asking only a one-way ques- tion. Neither of these limitations could easily be overcome by short-term, skilled questioning. It seems that by investigation concepts such as cor- relation which have fairly general application it may be possible to gain insight into aspects of cognitive development and into some adult thinking in every- day life.
REFERENCES Gray, C. W. (1976). The concept of dichotomous correla-
tion. Scand. J . Psychol. 17, 153-159. Green, B. F. (1956). A method of scalogram analysis using
summary statistics. Psychometrika 21, 79-88. Inhelder, Barbel & Piaget, J. (1958). The growth of logical
thinking from childhood to adolescence. London: Routledge and Kegan Paul, Ltd.
Jurd, Margaret f. (1975). Some aspects of the under- standing of social science concepts in adolescents. Report to the Afntional Committee for Social Science Teaching.
Piaget, J. (1972). Intellectual evolution from adolescence to adulthood. Hum. Dev. 15, 1-12.
Ross, R. J. (1973). Some empirical parameters of formal thinking. J . Youth Adol. 2 , 167-177.
Seggie, J. L. (1975). The empirical observation of the Piagetian concept of correlation. Canad. J . Psychol. 29, 3242.
Seggie, J. L. & Endersby, Helen (1972). The empirical implications of Piaget’s concept of correlation. dus t . J . Psychol. 24, 3-8.
Smedslund, J. (1%3). The concept of correlation. Scand. J . Psychol. 4 , 165-173.
Ward, W. C. & Jenkins, H. M. (1%5). The display of information in the judgment of contingency. Canad. J . Psychol. 19, 231-241.
Scand. J . Psychol. 20