
Instructions for ETA Form 9089 Page 1 of 11 ETA Form 9089 ...

Form Approved
JMENTATION PAGE OMB No. 0704-0188
ting and reviewing the Collection Of information. Send comments t e arding this burden estmate or a ny other apect of thisicing this burden to Weshington Headquarters Services. Directorate for information Operations and Reports. 1215 Jffersonid tO the Office of Management and Budget. Paperwork Reduction Project (0704-0188), Washington, DC 20503.
1. AGENCY USE ONLY (Leave blank) 2. REPORT DATE 3. REPORT TYPE AND DATES COVERED
1990 ITININ/Disse rtation4. TITLE AND SUBTITLE S. FUNDING NUMBERS
Fighter Agility Metrics
6. AUTHOR(S)
Randall K. Liefer
7. PERFORMING ORGANIZATION NAME(S) AND ADDRESS(ES) 8. PERFORMING ORGANIZATIONREPORT NUMBERAFIT Student at: University of Kansas AFIT/CI/CIA - 90-035
9. SPONSORING/ MONITORING AGENCY NAME(S) AND ADDRESS(ES) 10. SPONSORING/ MONITORING
AFIT/CI AGENCY REPORT NUMBER
Wright-Ptatterson AFB OH 45433
11. SUPPLEMENTARY NOTES
12a. DISTRIBUTION I AVAILABILITY STATEMENT 12b. DISTRIBUTION CODE
Approved for Public Release lAW AFR 190-1Distribution UnlimitedERNEST A. HAYGOOD, 1st Lt, USAFExecutive Officer, Civilian Institution Programs
13. ABSTRACT (Maximum 200 words)
DTICElLECTE f
IAUGO 1 1990
14. SUBJFCT TERMS 15. NUMBER OF PAGES
20616. PRICE CODE
17. SECURITY CLASSIFICATION 18. SECURITY CLASSIFICATION 19. SECURITY CLASSIFICATION 20. LIMITATION OF ABSTRACTOF REPORT OF THIS PAGE OF ABSTRACT
UNCLASSIFIEDNSN 7540-01-280-S500 Standard Form 298 (Rev 2-89)
P c '. rb d by ANSI Sid z39.18- ' 2',i 1i

FIGHTER AGILITY METRICS
by
Randall K. Liefer
B.S., Aeronautical Engineering, USAF Academy, 1977
S.M., Massachusetts Institute of Technology, 1982
Submitted to the Department of Aerospace Engineering andFaculty of the Graduate School of the University of Kansas inpartial fulfillment of the requirements of the degree of Doctorof Engineering.
Advisory Committee
ChairmanC. & 4i
7<
,/
9 I !
ABSTRACT
Proposed new metrics to assess fighter aircraft agility are collected and
analyzed. A framework for classification of these new agility metrics is
developed and applied. A complete set of transient agility metrics is evaluated
with a high fidelity, nonlinear F-18 simulation, provided by the NASA -Dryden
-Flight- Reseaiefr Center-,- Test techniques and data reduction methods are
proposed.
A method of providing cuing information to the pilot during flight test
is discussed. The sensitivity of longitudinal and lateral agility metrics to
deviations from the pilot cues is studied in detail. The metrics are shown to be
largely insensitive to reasonable deviations from the nominal test pilot
commands.
Instrumentation required to quantify agility via flight test is also
considered. With one exception, each of the proposed new metrics may be
measured with instrumentation currently available. Forr
Simulation documentation and user instructions are provided in an d
appendix.I Diti? iin
__Ava1-abItv Codes
* Aall '/orD Ist Spec il
ii, Id

AC KNOWLEDG EMENTS
This project could not have been accomplished without the support of
several special organizations and individuals. I am indebted to the Air Force
for the opportunity to take part in a Doctoral program in the first place and to
the NASA Dryden Flight Research Center for the financial support of this
particular research project.
On a personal level, I thank Dr. David Downing and Dr. Paul Fortin for
their guidance and support during my entire stay at the University of Kansas.
In addition, this project could not have been completed without the efforts and
insights of the other team members, John Valasek and David Eggold. Working
with these bright, motivated people has been the most rewarding aspect of the
program.
Of course, the most important contributions to my endeavors, here or
elsewhere, come from my wife, Deb. Life is a team effort and I could not ask
for a better partner.
Randall K. Liefer
ii

Table of Contents
A bstract . .. . . . . . . . . . . . .. .. . . . . . . . .. .. .. . .. . . .. .. . . . . . i
Acknowledgement ....................................... 1i
Table of Contents ...................................... 1ii
List of Figures ......................................... vii
List of Tables . ......................................... x
List of Abbreviations ..................................... xi
1. Introduction .......................................... I
1.1 Background of Agility ............................. 1
1.2 Current State of Agility . .......................... 3
1.3 Objectives of this Project . ......................... 5
2. Problem Definition . ................................... 8
2.1 Summary of Traditional Metrics .................... 8
2.2 Published Agility Metrics ..................... . . 18
2.2.1 Transient, Functional, Potential ............... 20
2.2.2 Lateral, Pitch, Axial . ....................... 22
iii

2.3 Vehicle Description (F-18 HARV) and
Simulation Overview . .......................... 25
2.4 Sim ulation Plan ................................ 31
3. Sim ulation Study .................................... 33
3.1 A xial A gility .................................. 33
3.1.1 Introduction ............................ 33
3.1.2 Axial Agility Metrics ...................... 33
3.1.3 Power Onset and Power Loss Parameters ........ 34
3.1.4 Axial Agility Test Case Description ............ 36
3.1.5 Axial Agility Data Reduction Methods .......... 41
3.2 Pitch Agility . .................................. 45
3.2.1 Introduction ............................ 45
3.2.2 Published Pitch Agility Metrics ............... 47
3.2.3 Pitch Rate versus Angle of Attack Metric ........ 58
3.3 Lateral A gility ................................. 62
3.3.1 Introduction ............................ 62
3.3.2 Time-to-90 Metric ........................ 66
3.3.3 Test M ethod . ............................ 69
3.3.4 Data Reduction and Analysis ................ 71
iv

3.3.5 Simulation Results ........................ 72
4. Flight Test Issues .................................... .. 76
4.1 Background . .................................. 76
4.2 Analysis of Cuing Method ........................ 79
4.3 Sensitivity to Cue Following Errors .................. 81
4.3.1 Sensitivity of Pitch Agility Metrics ............. 81
4.3.2 Sensitivity of Lateral Agility Metrics ........... 92
4.4 Instrumentation for Agility Flight Testing .............. 1
5. Project History and Management ........................ 10
5.1 Project Planning and Proposal Phase ................. 10,
5.2 Project Team and Responsibilities .................... 107
5.2.1 Technical .............................. 107
5.2.2 Supervisory ............................. 1(9
6. Summary ........................................... 110
6.1 Conclusions . .................................. 112
6.2 Recommendations for Further Research ............... 115
7. References .......................................... 117
Appendices
A. Specific Excess Power (P) ........................ 122
B. Published Agility Metrics ......................... lb
v

C. Simulation Documentation ......................... 148
C.I Introduction ............................. 148
C.2 Capabilities and Models ..................... 15)
C.2.1 Aerodynamics ...................... 15)
C.2.2 Flight Control System ................ 151
C.2.3 Actuators ......................... 151
C.2.4 Equations of Motion ................. 1.2
C.2.5 Integration Method .................. 12
C.2.6 Multi-Rate Calculations ............... 12
C.2.7 Autopilot Modes .................... 153
C.3 Program Organization ...................... 153
C.4 User Instructions .......................... 17
C.5 Check Case Comparisons .................... 178
vi

List of Figures
2.1 T-38 V-n Diagram . .................................. 12
2.2 Typical Ps Diagram for a Single Aircraft .................... 14
2.3 Differential Ps Plot .................................. 15
2.4 Turn Rate, Turn Radius Relationships ...................... 16
2.5 F-5E Turn Performance ................................ 17
2.6 Proposed Classification Framework ....................... 24
2.7 F-18 Physical Characteristics ........................... 26
2.8 Simulation Flow Diagram ............................. 30
3.1 Axial Acceleration Example, Mach .6, Sea level .............. 37
3.2 Axial Acceleration, Mach .4 - .9, Sea level ................. 38
3.3 Axial Deceleration Example, Mach .6, Sea Level ............. 39
3.4 Axial Deceleration, Mach .4 - .9, Sea Level ................. 40
3.5 Power Onset Parameter ............................... 43
3.6 Power Loss Parameter . ................................ 44
3.7 Maximum Pitch Up Time History ......................... 48
3.8 Time to Pitch to Maximum Load Factor ................... 50
3.9 Time to Pitch From Maximum to Zero Load Factor ........... 51
3.10 Maximum Load Factor Rate ............................ 52
3.11 Minimum Load Factor Rate ........................... 53
vii

3.12 Maximum Pitch Rate from Steady Level Flight ............. 55
3.13 Max Neg. Pitch Rate During Unload ...................... 56
3.14 Maximum Pitch Rate Capability at 15,000 ft ............... 59
3.15 Minimum Pitch Rate Capability at 15,000 ft ................ 60
3.16 Kinematics of a Loaded Roll .......................... 63
3.17 Body Axis Rates for Stability Axis Rolls .................. 67
3.18 Control Time History for a Typical T90 Maneuver ............ 70
3.19 Time to Capture (D = 90" at 15,000 ft ................. .. 73
3.20 Time to Capture (D = 90" at 30,000 ft .................... 74
4.1 Time to Max Load Factor Error Sensitivity, 15,000 ft .......... 84
4.2 Pitch Up Load Factor Rate Error Sensitivity, 15,000 ft ......... 86
4.3 Nose Up Pitch Rate Error Sensitivity, 15,000 ft .............. 87
4.4 Time to Zero Load Factor Error Sensitivity, 15,000 ft .......... 89
4.5 Pitch Down Load Factor Rate Sensitivity, 15,000 ft ........... 90
4.6 Nose Down Pitch Rate Error Sensitivity, 15,000 ft ............ 91
4.7 Stick Deflections for Typical Tgo Maneuver ................. 92
4.8 Tg0 Error Sensitivity, Mach .4, 15,000 ft .................... 95
4.9 Tgo Error Sensitivity, Mach .5, 15,000 ft .................... 96
4.10 T9Error Sensitivity, Mach .6, 15,000 ft ................... 97
4.11 Tg0 Error Sensitivity, Mach .7, 15,000 ft ................... 98
viii

4.12 Tgo Error Sensitivity, Mach .8, 15,000 ft .................. . 99
5.1 Task Schedule . ..................................... 105
5.2 Project Organization ................................. 1(8
A. 1 Flight Path Geometry for Accelerated Climb ................ 12
B. 1 Relative Energy State ................................ 15
B.2 Concept of Combat Cycle Time ......................... 38
B.3 Definition of Pointing Margin .......................... 139
B.4 Dynamic Speed Turn Plots ............................ 14
C. 1 Generalized Simulation Flow Diagram .................... 154
C.2 Detailed Simulation Wiring Diagram ..................... 165
C.3 Sample Input File for SIM 2 ........................... 177
C.4 Longitudinal Check Case, Mach .6, 10,000 ft ................ 19
C.5 Longitudinal Check Case, Mach .8, 35,000 ft ................ 181
C.6 Longitudinal Check Case, Mach .0, Sea Level ............... 183
C.7 Lateral Check Case, Mach .4, 20,000 ft .................... 185
C.8 Lateral Check Case, Mach .6, 10,000 ft .................... 187
C.9 Lateral Check Case, Mach .8, 35,000 ft .................... 189
C.10 Lateral Check Case, Mach .9, Sea Level .................. 191
ix

List of Tables
2.1 Typical Wing Loading and Thrust to Weight Ratios ........... 10
4.1 Deviations for Pitch Sensitivity Tests ..................... 83
4.2 Deviations for Lateral Sensitivity Tests ..................... 94
C. I SIM 2 Initialization Sequence .......................... 16D
C.2 Dynamic Loop Sequence for One Frame ................... IT
C.3 Common Simulation Variables .......................... 171
x

List of Abbreviations
C, Nondimensional variation of rolling moment with control surfacedeflection
Cm. Nondimensional variation of pitching moment with control surfacedeflection
CAS Control Augmentation System
E Total mechanical eneigy
Es Specific mechanical energy
D Drag
FCS Flight Control System
HARV High Angle of Attack Research Vehicle
HQDT Handling Qualities During Tracking
Ix I , IZ Moment of inertias about X, Y and Z axes
Ixz XZ product of inertia
L6 Dimensional variation of rolling moment with control surfacedeflection
MBB Messershcmitt-Bblkow-Blohm
M6 Dimensional variation of pitching moment with control surfacedeflection
PS Specific Excess Power
R Turn Radius
xi

S Reference wing area
T90 Time to capture 900 bank angle change
T/W Thrust to weight ratio
TR Turn rate
V Velocity
V/V, Relative Energy State
W Weight
WVR Within Visual Range
W/S Wing Loading
b Wing span
c Mean aerodynamic chord
g Acceleration due to gravity
h Altitude
nz Load factor
p Body axis roll rate
Pstb Roll rate about stability X axis
q Body axis pitch rate
r Body axis yaw rate
r ,b Yaw rate about stability Z axis
E Euler pitch angle
xii

DEuler roll angle
P Euler heading angle
Steady state rate of change of heading angle
(X Angle of attack
Sideslip angle
y Flight path angle
ObT Angle between chord line and thrust line
xiii

1. INTRODUCTION
1.1 Background of Agility
Fighter flying qualities and combat capabilities are currently measured
and compared in terms relating to vehicle energy, angular rates and sustained
acceleration. Criteria based on these measurable quantities have evolved over
the past several decades and are routinely used to design aircraft structures,
..:rodynamics, propulsion and control systems. While these criteria, or metrics,
have the advantage of being well understood, easily verified and repeatable
during test, they tend to measure the steady state capability of the aircraft and
not its ability to transition quickly from one state to another.
Though fighters engaged in close or within-visual-range (WVR) combat
spend little time in steady state flight, the requirement to maneuver for a stable,
rear quarter firing advantage has generally lead to extended engagements for
which the traditional measures of merit are useful. However, the requirement
for a stable, rear quarter firing solution has been dramatically reduced with the
advent of lethal, reliable, all aspect, short range missiles of the AIM-9L class
(Reference 1, 2, 3, 4, 5, 6, 7, 8, 9, 10, 38). Engagement times have been
decreased by nearly an order of magnitude as pilots need only to point their
weapons at the target in order to achieve a high probability of kill.

New measures of merit or metrics are needed to quantify the short time
scale capabilities that are now exploited during WVR, all aspect combat. A
wide variety of measures have been proposed by pilots and researchers and are
generally grouped under the catch all heading of Agility Metrics.
The promise of lethal point-and-shoot weapons has also prompted interest
in controlled flight at angles of incidence well beyond that for maximum lift.
High rate maneuvering in the low speed, high angle of attack part of the
envelop is popularly referred to as supermaneuverability (Reference 11, 12, 13,
14, 15). Though supermaneuverability is motivated by the same new weapons
technology and is being investigated by many of the same researchers, it is
fundamentally different than agility. The successful application of
supermaneuverability will depend on control effectors, pilot aids and propulsion
performance that are not available today. Agility metrics, on the other hand,
are intended to quantify and, eventually, influence the way fighters maneuver
today in conventional flight while engaged in air-to-air combat. The current
work reported in this document will address only the former problem of agility
metrics.
2

1.2 Current State of Agility Research
Fighter agility is a current topic that is receiving attention from a wide
range of government and industry organizations across the country and
overseas. Agility is being addressed simultaneously by academicians,
manufacturers, flight testers and tacticians. The result is a broad based effort
that occasionally suffers from lack of communication, coordination and even a
commonly accepted vocabulary. Following is a description of the ongoing
agility related work which has been made public.
The motivation for agility work originally came from the flying
community and the Air Force Flight Test Center remains actively involved in
measuring aircraft performance in the terms of agility metrics. Test Center
pilots and Test Pilot School students have conducted limited flight tests to
collect data and evaluate the utility of various proposed metrics. Their work
has centered primarily of the F-16 but has included some F-15, F-4 and T-38
flights(Reference 16, 17). In addition, the Flight Test Center is working with
NASA's Dryden Flight Research Facility to extend their agility evaluation to
the X-29 (Reference 18, 19). NASA Dryden intends to study agility during
flight test of the F-18 High Angle-of-Attack Research Vehicle (HARV). The
Italian Air Force has also conducted an agility flight test study using light attack
aircraft.
3

The other central organization in agility work has been the Eidetics
Corporation (Reference 8, 9, 11, 20). Eidetics has worked under contract to
NASA, the Aeronautical Systems Division at Wright-Patterson AFB and the
Armament Division at Eglin AFB. This work has involved the development of
agility metrics, quantifying them via simulation, proposing agility enhancing
modifications to existing aircraft and efforts to relate agility to combat
effectiveness with multi-aircraft engagement simulations. Eidetics is currently
seeking to expand the agility focus to include pilot interfaces and the effects of
weapon constraints on the utility of enhanced aircraft agility. Eidetics is a
small company that seeks to be a link between the operational users and the
aircraft designers.
The idea of incorporating high agility into the fighter design process is
being worked in numerous organizations. The Grumman Aircraft Company
(Reference 21) and NASA's Langley Research Center are trying to relate agility
requirements to the flight control design process. McDonnell-Douglas has
established an Agility Working Group which includes flight controls, flying
qualities, propulsion and structures engineers. McDonnell-Douglas has used its
pilot-in-the-loop domed simulators to relate enhanced agility to combat
effectiveness (Reference 22,23). Those efforts have, so far, focussed on lateral
agility (increased roll rates and smaller roll time constants) and results have
4

been disappointing. Large increases in lateral agility failed to produce
statistically significant combat improvements.
Researchers at Boeing and Lockheed are using trajectory optimization
approaches to look for maneuvers which best use the capabilities that enhanced
agility might provide. Juri Kalviste at Northrop has postulated several new
metrics that deal with large amplitude maneuvers (Reference 24, 25).
Rockwell, in association with Messerschmitt-Boelkow-Blohm (MBB), has
studied agility in the context of the unconventional flight modes to be explored
by the X-31 program (Reference 4, 5, 12, 26). Dr Herbst of MBB has
quantified agility as certain terms resulting from manipulation of the aircraft
equations of motion in velocity coordinates. Interestingly, this development
remains prop- etary to MBB and unpublished.
The University of Kansas and Georgia Tech are the only universities now
doing funded research in fighter agility. Researchers at Georgia Tech (funded
by NASA Langley) are using optimization methods to minimize time to change
heading by 1800 with level turns or half loop (split-s) maneuvers.
1.3 Objectives of This Project
On February 1989, NASA's Dryden Flight Research Facility funded the
University of Kansas Center for Research Inc. (CRINC) to assess the current
5

state of agility metric development and support their plans to conduct agility
related flight testing. Specifically, CRINC was tasked to collect the various
metrics that have been proposed and published in the literature and to evaluate
them via simulation and with whatever existing flight data that could be
obtained. NASA's F-18 HARV simulation was to be the primary analysis tool
and a copy was provided to CRINC in MAY 1989.
Beyond this initial simulation effort, CRINC was also to evaluate the
sensor requirements associated with the eventual agility flight tests at NASA.
Finally, CRINC was asked to study pilot cues for agility maneuvers and to
develop efficient data analysis routines for reducing agility test results.
The remainder of this report describes the results of CRINC's first year
of work on fighter agility metrics. Traditional air combat measures of merit are
described first in Section 2.1 so that the contrast with new agility metrics is
clear. Proposed new agility metrics are discussed and organized into a logical
framework in Section 2.2. A distinction is drawn between short time scale
transient agility metrics and longer term functional metrics that are driven by
aircraft performance rather than agility. A complete set of transient agility
metrics is then evaluated with a high fidelity, nonlinear, six degree of freedom
F-18 aircraft simulation and results are presented in Chapter 3. The simulation
tool used at CRINC is described and thoroughly documented in Appendix C.
6

Instrumentation needed to evaluate an aircraft's agility with these metrics during
flight test and the sensitivity of the metrics to variations in pilot commands is
evaluated in Chapter 4.
7

2. PROBLEM DEFINITION
The new agility metrics are intended to supplement, not replace, the
traditional measures of combat effectiveness. Therefore, it is appropriate to
review the most widely used traditional measures. New agility metrics that
address aspects of fighter capability not traditionally measured can then be
identified from the many metrics published under the title of agility.
2.1 Summary of Traditional Metrics
A first order comparison of fighter airframe capability can be made with
a set of well known parameters calculated at various flight conditions. The
most common of these point performance metrics are summarized here.
a. Wing loading (W/S).
This parameter, with units of force per unit area, is the the ratio
of aircraft weight to wing planform area. It is normally calculated at
maximum gross weight or at some intermediate combat weight consisting
of a partial fuel and weapons load. Since low wing loading reflects high
wing area relative to aircraft weight, a fighter with low wing loading will
generally have a high maximum lift-to-weight ratio and so be able to
generate high instantaneous load factor or turn rate. This generalization,
however, neglects the effects of differing airfoils and the efficiencies of
8

maneuvering flaps or slats. In addition, wing loading does not account
for the lift characteristics of modem, blended fuselage designs.
b. Thrust-to-weight ratio (T/W).
Thrust-to-weight ratio is usually calculated at the same aircraft
weights used for the wing loading parameter and with the static,
uninstalled, sea level thrust of the engine(s). The ratio thus calculated
is much different than the thrust-to-weight ratio available to the pilot at
any given flight condition since thrust is a function of altitude. In
addition, inlets optimized for different flight speeds may cause a fighter
with a relatively high thrust-to-weight ratio at high speed to be inferior
at low speeds. Some wing loading values and thrust-to-weight ratios
(calculated at take-off weight) for current fighters are given in Table 2.1
(Reference 27, 28).
9

FTable 2.1: Typical Wing Loadings and Thrust- to- Weight Ratios
Aircraft W/S (PSF) T/WI
F-4E 103 .66
F-5E 117 .46
F- 106 52 .675
F- 14A 117 .62
F- 15C 73 1.08
F- 16A (no air-to-ground stores) 78 .98
F-18 (no air-to-ground stores) 84 .95
MiG-2 1 83 .55
Saab- 37 76 .75
c. Maximum Level Mach Number.
This number is usually quoted at sea level and at 36,000 feet
(beginning of the standard atmosphere tropopause). For the aircraft
10

listed in Table 2.1, maximum Mach numbers at 36,000 feet range from
1.64 for the F-5E to 2.5 for the F-15.
d. Maximum Rate of Climb.
This parameter is usually reported for sea level conditions. Rate
of climb for the F-5E is 34,500 feet per minute. The F-15's maximum
rate of climb is greater than 50,000 feet per minute.
e. Maximum Instantaneous Turn Rate (t,)-
This is the rate attained by turning at the maximum instantaneous
load factor available at the, given flight condition. The highest maximum
instantaneous turn rate occurs at the airspeed for which the maximum lift
line and the maximum structural limit line on the V-n diagram intersect
(Figure 2.1). This airspeed is referred to as the corner velocity. A V-n
diagram contains none of the thrust and drag information needed to
determine sustained maneuverability.
11

12.000 POUNDS GO0SS WEIGHTa
--- STRUCTURAL L;MIT
DETERMINED~ BYSLISSONIC BUFrET MAXIMUM PERM4ISSIBLE LOAD FACTOR ef 00a3)
* AN1 5UPERSONIC -
I*OMIZONTAL TArt.5 - DEFLEMrION UMrT t-- T -
r00
-2 -lL
=000-4FT-0)FT
IAXIMUM PRMISSiBLE LOAD FACTOR (-2.4G Sj
Figaure 2. 1: T-38 V-n Diagram (Reference 29)
f. Specific Excess Power, (Ps).
Over the last fifteen years, energy maneuverability quantified in
terms of Ps (with units of feet per second) has been the primary tool for
comparing fighter performance. Specific excess power represents an
aircraft's ability to change its specific mechanical energy either by
changing altitude or airspeed. By plotting the airc-raft's Ps at various
points in the flight envelop (altitude, airspeed and load factor) and then
12

comparing these values to those of competing aircraft, it is easy to
visualize areas of advantage or disadvantage. Ps can be calculated as
V(Tcos(a-4.T)-D)Ps- (2.1)W
Here V, T, D and W are the aircraft's velocity, thrust, drag and weight
respectively. Angle of attack is cx and T is the angle between thrust line
and the body X axis. In addition,
P(2.2)g
where h is altitude, so P. is a measure of the aircraft's ability to
accelerate at constant altitude or to climb at constant velocity.
Derivations of these expressions are given in Appendix A. A
common method of plotting P. is shown in Figure 2.2.
In Figure 2.3, the Ps capability of two dissimilar aircraft are
compared. The contours represent levels of Ps advantage and the shaded
portion of the plot shows areas of the flight envelope where only on of
the aircraft is able operate.
f. Sustained, or Constant Energy Turn Rate ('I).
13

F-104G 1-g SPECIFIC EXCESS POWERCOMBAT WEIGHT - 18037 POUNDSCLEAN - MAX POWER - NO MANEUVER FLAP
70
5-
U.2 0.4 0.6 0.8 1.0 1.2 1.4 1.6 1.8 2.0 2.2
MAC H
Figure 2.2: Typical Ps Plot for a Single Aircraft (Reference 29)
This is the maximum turn rate in degrees per second that can be
sustained without loss of either altitude or airspeed. In other words, it
is the turn rate at a given altitude and Mach number for which Ps is
zero. Sustained normal load factor or turn radius are often used instead
of sustained turn rate. The three terms are related since
14

AIRCRAFT "A"
EX L S V -10
I15-
TRUE AIRSPEED, V
Figure 2.3: Differential Ps Plot (Reference 29)
n= t +1 (2.3)
and
RV 2 (2.4)g 2
15

where nz is load factor and R is turn radius.These relationships are
6 7
n 4 5,000 FT
33 2 10,000 FT
I
z
MACH
Figure 2.4: Turn Rate, Radius Relationships (Reference 29)
shown graphicafly in Figure 2.4.
Constant energy turn rate or sustained load factor capability is
calculated at a representative range of altitudes and airspeeds.
Depending on the aircraft design and flight conditions, the maximum
16

constant energy turn rate may be limited by available lift, available thrust
or structural strength.
Turn performance for the F-5E at a single altitude and loading
condition are shown in Figure 2.5. Complete charts like this for fighter
aircraft are normally classified.
23TURN PEPPFaNIANCIE
TURN RATI!. TURNP RADIUSAND LOAD FACTOMAAIMUOA THW.ST
STANDARDO AT
20- -iA4STRUCTURAL. LIMIT
00
a 0.2 0.4 0.6 0.8 1 0 1.2 1.4 I's I a 2 0
INDICATED MACH
Figure 2.5: F-SE Turn Performance (Reference 29)
17

2.2 Published Agility Metrics
Though numerous papers have discussed the need for new ways of
measuring fighter agility characteristics, only a few authors have actually
proposed new metrics that could be used to develop a quantitative measure of
agility. A list and brief definition of each of the metrics that have been
proposed in the open literature is presented below. A more detailed discussion
of the metrics and some graphical examples is attached as Appendix B to this
report.
Pitch Agility Time to pitch to maximum load factor
plus time to pitch from maximum to
zero load factor.
T90 Time to roll to and capture a 900 bank
angle change
Torsional Agility Turn rate divided by T90
Axial Agility The difference between minimum and
maximum Ps available at a given flight
condition divided by the time to
transition between the two levels.
18

Relative Energy State Ratio of aircraft velocity to corner
speed after a 1800 turn.
Combat Cycle Time Time to complete a maximum
acceleration turn and regain lost energy.
Pointing Margin Angle between the nose of an adversary
and the line of sight when the friendly
fighter is aligned with the line of sight.
Dynamic Speed Turn Plot of P. versus turn rate.
Agility Potential Thrust to weight ratio divided by wing
loading.
Pitch Agility Coefficient of pitching moment due to
Criteria control surface deflection scaled with
wing area, aerodynamic chord and pitch
axis inertia.
Roll Reversal Product of time required to reverse a
Agility Parameter turn and the cross range displacement
that occurs during the turn.
19

Since the pilots, engineers and researchers now involved in agility have,
as yet, not reached a commonly accepted definition of the tei,n, it is not
surprising that the proposed agility metrics deal with many different aspects of
fighter capability. The various metrics proposed to measure agility deal in units
of time, velocity, angular rate, distance and combinations of time, rate and
distance. Some framework for organizing the metrics that have emerged from
different points of view is now needed.
After collecting and reviewing the metrics now available in the literature,
it is apparent that they may be categorized in two ways. First, the new metrics
can be grouped by time scale into classes referred to by some authors as
functional and transient (Reference 1, 16). Secondly, the new metrics may be
classified according to type of motion involved, i.e. translational (axial),
longitudinal, and lateral.
Each of these two schemes of metric classification are discussed below.
The resulting framework is then presented in a matrix format.
2.2.1 Transient, Functional, Potential
Regardless of the motion variables involved or the units chosen to
measure the result, all of the proposed new metrics that deal with actual aircraft
maneuvers can be grouped into one of two time scales. Agility in the context
20

of the short time scale, on the order of one to three seconds, is frequently called
transient agility (Reference 1, 8, 9). The transient agility metrics are new ways
to quantify the fighter's ability to generate controlled angular motion and to
transition quickly between minimum and maximum levels of specific excess
power.
A second group of time dependent metrics called large amplitude metrics
(Reference 1) or functional agility metrics (Reference 16) deals with a longer
time scale of ten to twenty seconds. This class seeks to quantify how well the
fighter executes rapid changes in heading or rotations of the velocity vector.
Emphasis is on energy lost during turns through large heading angles and the
time required to recover kinetic energy after unloading to zero load factor.
Many of these functional metrics involve maneuvers made up of a sequence of
brief segments that could each be evaluated with a transient agility metric. For
example, the combat cycle time metric proposed by B. F. Tamrat of Northrop
(Reference 10) consists of a pitch to maximum load factor, a turn at maximum
load factor to some specified new heading angle, a pitch down to zero load
factor and acceleration to the original airspeed. The net effect of combining a
sequence of maneuvers and flight segments into a single metric is that
conventional aircraft performance, that is, thrust to weight ratio and sustained
load factor or turn rate capability, dominates the metric. The transient agility
21

characteristics have only a minor impact on the numerical value of the
functional metric (Reference 16). In addition to measuring the aircraft
capability, these long term metrics also depend heavily on complex pilot inputs
which in turn will be influenced by the pilot's skill, experience, the aircraft's
flying qualities and the effect of cockpit displays and cues.
A third group of metrics has appeared which are independent of time and
so are neither transient or large amplitude. They deal not with the aircraft
characteristics demonstrated via flight test or simulation but with the agility
potential that results from sizing and configuration choices. These agility
potential metrics serve to highlight the (sometimes obvious) relationships
between thrust, weights, inertias, control power and agility. While they have
the advantage of using data available early in the aircraft design cycle, they do
not reflect the impact of cross axis nonlinearity or flight control system
response characteristics (Reference 30).
2.2.3 Lateral, Pitch, Axial
Agility metrics may also be classified according to the type of aircraft
motion being studied independent of time scale. Lateral metrics include those
that deal primarily with rolling motion, especially rolling at high angles of
attack. Longitudinal metrics involve only pitching motion and normal
22

acceleration. Finally, a number of metrics have been proposed to quantify the
ability of the aircraft to transition between energy states or Ps levels. These are
commonly referred to as axial metrics and involve only translational motion.
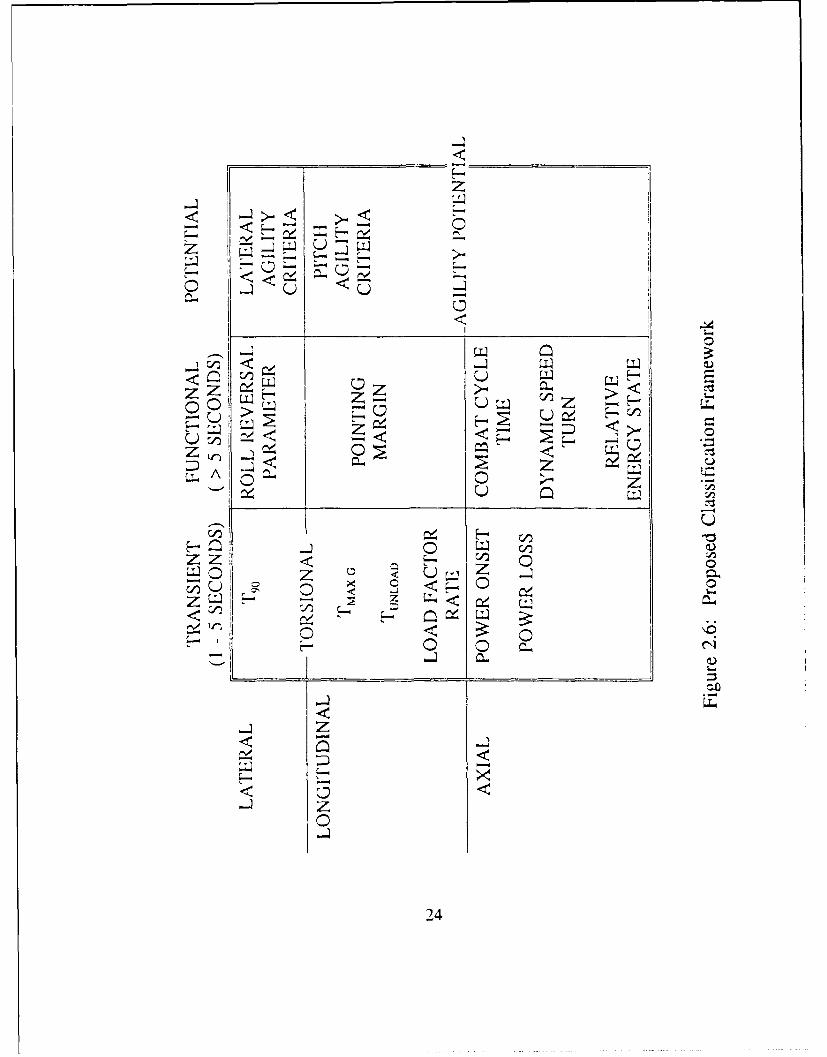
When these two approaches to agility metric classification are
simultaneously applied, the result is a matrix as seen in Figure 2.6. With two
exceptions, each metric can be uniquely placed within this classification matrix.
One exception, Eidetic's Torsional Agility, is deliberately formulated to mix
pitching and rolling characteristics and is the ratio of turn rate to the time to roll
and capture a 900 bank angle change (Reference 9). The other exception,
Agility Potential, is the ratio of two traditional performance metrics, wing
loading, which is related to longitudinal maneuverability, and thrust to weight
ratio. Again, each of the metrics listed in Figure 2.6 is described in more detail
in Appendix B.
In the current report each of the transient agility metrics is evaluated with
the F-18 simulation described in the next section. Results are then presented
in Chapters 3 and 4.
23
z z >U z~
Z < Z
CDH <
24o

2.3 Vehicle Description (F-18 HARV) and Simulation Overview
The McDonnell-Douglas F/A-18 is a single seat, twin engine, supersonic
fighter currently in service with the United States Navy, Marine Corps and
several foreign countries. It has a maximum take off weight, when configured
for an air to ground mission, of more than 49,000 pounds and is powered by
two General Electric F404 low bypass turbofan engines. Planform and external
dimensions are shown in Figure 2.7 (Reference 44).
NASA Dryden's High Angle of Attack Research Vehicle (HARV) is
one of the aircraft from the F- 18 Full Scale Development test program. Except
for thrust vector paddles that are now in the process of being installed, the
aircraft has no significant aerodynamic differences from the fleet configuration
even though the missile rails on the wing tips have been replaced with
instrumentation pods, fences on the wing leading edge extensions have not been
installed and the leading edge flap chord is two inches longer (Reference 31).
The plane is equipped with the current fleet flight control laws though these
also will be modified to accommodate the new thrust vectoring capability.
25

'YPRTIC &L TAIL.
EFFEC7.vE -AEA 104 SO0FT (12 EACH)ASPECT RAT(O 1.2
TAPER RATIO 40"EIGHT 9500 INROOT CHORO if 300 IN
TIP CHORD (THEORETICAL) 4500 IN.SWEEP :c/4) 35"INCIDENCE I' TOE OUTCANT
20 0U'8OAR0
AIRFOIL AND THICKNESSPOOTMO0NACAS6005 W/'STAPP LE. 50XTIP MOO NACA65AO3A W/SMAP L E. 3 0.
RUDDER AREA f5.44 SO FT (7.72 EACHI
CONTP(L SUPCACE RAVE'.AILEPON L25"
DROOPED AILECRON 45* ONINBOAPO L. E. 'LAPS 30" ON
OUTBOARD L. E. FLAPS 30" ONT. E. FLAPS 45 ONRUDDER i-NOIFFTEENTIAL STABILATOR (Lf') 0.5 UP, 24"0N
SYMMETRICAL STABILATOR (LE) IO.UP, 24'',NMAXIMUM STABILATCR TRAVEL (L.E.) IO.5"UP, 24"ON
SPEED :PA'<EAREA 13.9 SO Fr
PR_,PUL. QlN 2 F404-CE'400 TURBOFAN ENGINES
Figure 2.7: F-18 Physical Characteristics (Ref. 44)
26

,PHYCICAL ri-HAACTIFISTICS
-00 AEF -03 ACT SO fTASPECT 8.TIO 31TAPER R I 35
sp..' 8 CF, 17.2 FTA0OT C CQO -90.29 ..*,P C,,0O 6628 '
S-EEP IC/41 23*
AIRFOIL -NO 7,.ICIESS
f.,.'5z9360NOD N:CA 61*A W/1I.IP L. E 357TIP 4.CO N.CA 65A -/S-.8P L.6 E, ) 'X
AILERON AREA 7.8 SO FTAILERON~ S..80u0 AREA A 1 0 FTT f. FLAP AREA 61.9 S0 FT7 E. FLAP SH 8CUO AREA 15.9 $0 FTLE. FLAP AE 556 $0 FT
OWS 0*AT X*4,9. 4" AT TIP CN080 8m X PLANE 80T.TT'N IS
LEASI.NG EDGE E-Y-IENSICN (LEXoEXPOSED AREA -6.6. %0 FT
LEX FUSEL AGEINTERSECTION 816.3/v ' Z -2L68X -ING INTERSECTION X51&/y~....1 04 2
HO PI7?NTAt TASIL
ASPC T RA~I0 2,.41TAPE. AYIO 4
SPA (NEOETCAL(RF.67 FTPOO T 67080 114.70 I.Llip CHO080 - ASA Im.SWEEP KC/41 -2.83
AIRFOIL AND TIIIC8NESS80OT 6%. TmIC W/$17:89 IL -- X 'A4 T 45"
0 TI~P 2.. ThICK *ISNARP LL NAX V, AT .5 % C
0
Figure 2.7 (continued)
27

Because the NASA Dryden Flight Research Center intends to conduct
a flight test study of aircraft agility with their F-18 High Angle of Attack
Research Vehicle, their nonlinear six degree of freedom F-18 simulation was
chosen to study the selected agility metrics. A Fortran listing of NASA
Dryden's simulation was provided with limited documentation to the KU Flight
Research Laboratory. The program includes a complete, nonlinear aerodynamic
package with data to seventy degrees angle of attack and a detailed model of
the F-18 flight control system (version 8.3.3) as described in Reference 45.
None of the thrust vectoring modifications are included in the current version
of the simulation. ft should be noted that while the aerodynamic model of the
F-18 is fully nonlinear, it is does not include any unsteady effects which may
be significant during highly dynamic maneuvers typical of agility testing.
Because the simulation was run interactively at NASA to support their
manned simulation, an extensive amount of reprogramming was required to
adapt the it to the computer hardware at the University of Kansas. The
simulation now runs in a batch mode on an Apollo workstation and has been
validated against check cases provided by NASA Dryden. A simplified flow
diagram is included here as Figure 2.8. A detailed diagram including all
subroutines is in Appendix C. Documentation and user instructions for the
28

Apollo version of the simulation, along with check case results, are also
included in Appendix C. The math models, equations of motion and data
structures are all documented in Reference 46.
29

INITIALIZATION
PILOT INPUTS
CONTROL SYSTEM
VEHICLE DYNAMICS
TIME HISTORY OUTPUT
YES __
TIME < FINAL TIME ?
INOSUMMARY OUTPUT
STOP
Figure 2.8: Generalized Simulation Flow Diagram
30

2.4 Simulation Plan
While each of the proposed new agility metrics has been qualitatively
discussed in the literature, no systematic, quantitative study has been done
before now. Since, as described in Section 2.2, the transient agility metrics deal
with the fundamental capabilities on which the longer time scale, functional
metrics are based, a detailed study of these metrics is the logical first step.
In the following sections, each class of transient agility metric is
discussed and published metrics from each are evaluated with the F-18
simulation at a representative range of subsonic flight conditions. In section 3.1
the axial agility metrics of power onset and power loss are studied. Section 3.2
is an evaluation of several transient pitch agility metrics including time to
maximum and zero load factor, time rate of change of load factor and positive
and negative pitch rates. Section 3.3 addresses the T90 lateral agility metric.
Strengths and limitations of each metric are discussed. The test maneuvers used
in the simulation study are described. Each is a straightforward maneuver that
could be flown in actual flight test.
The flight test maneuvers needed to measure agility will involve large
angular rates and short time scales. Steering cues developed on a ground based
simulator may be used to assist the pilot in executing the test maneuvers
31

accurately and repeatably. The sensitivity of the agility metric values to
deviations in pilot responses to the steering cues are studied in Chapter 4.
32

3. SIMULATION STUDY
3.1 Axial Agility
3.1.1 Introduction
Traditional methods of quantifying the longitudinal translation capability
of fighter aircraft, hereafter called axial capability, have generally consisted of
thrust-to-weight ratio, maximum level Mach number, maximum rate of climb
and Ps as discussed earlier in Chapter Two. These point performance measures
of merit only quantify performance at discrete aircraft states. They are not
indicative of the capability of an aircraft to change its energy rate rapidly.
Axial agility metrics provide a measure of this capability.
3.1.2 Axial Agility Metrics
Eidetics International has suggested that transient agility is an important
additional measure of a fighter aircraft's success in the modem air battle when
all-aspect infra-red missiles are employed (Reference 9). The transient axial
agility metrics measure the rate of change of Ps. These metrics also conform
well to the idea of agility being the rate of change of maneuverability
(Reference 8). Instead of knowing only what level of Ps an aircraft possesses
at a particular point, axial agility reflects how effectively the aircraft can
transition to another P. level. Both the magnitude of the Ps change involved
33

in transitioning from minimum to maximum levels and the time required to
make that transition are important. The aircraft with superior axial agility will
be able to quickly generate large positive and negative Ps at a given flight
condition. The axial agility metrics measure the combined effects of engine
spool time, maximum thrust and drag due to speed brakes. Thus, an aircraft
having greater axial agility possesses superior velocity control (both acceleration
and deceleration). For instance, consider two aircraft with similar energy
maneuverability levels but significantly different engine spool times. A
traditional comparison of energy maneuverability levels will not reflect this
difference. However, measuring both the positive and negative rate of change
of Ps will highlight the advantage of quicker engine response.
3.1.3 The Power Onset and Power Loss Parameters
Eidetics International has proposed two parameters to quantify axial
agility. The first, the power onset parameter, is defined as the increment of
specific excess power (AP) in going from a minimum power/maximum drag
condition, to a maximum power/minimum drag condition, divided by At, the
time in seconds required to complete the transition (Reference 9). The aircraft
begins the maneuver in level flight decelerating at flight idle power with
speedbrake extended. At the test Mach number, the throttle is advanced to the
34

maximum power setting while the speedbrake is simultaneously retracted. The
resulting acceleration is maintained until the maximum net axial force (thrust
minus drag) is attained.
The power loss parameter is the second metric and is also defined as
APJAt, but here AP, is the increment of specific excess power in going from a
maximum power/minimum drag configuration to a minimum power/maximum
drag configuration. Prior to the start of the maneuver, the aircraft is
accelerating in level flight at maximum throttle setting with speedbrake
retracted. The throttle is then reduced to flight idle while the speedbrake is
simultaneously extended. Thrust reversers would also be deployed if the test
aircraft were so equipped. The deceleration is maintained until the minimum
net axial force (i.e. thrust minus drag) is attained. The axial agility parameters
could be easily extended to account not only for how well an aircraft
accelerates and decelerates, but also for any unique capabilities which may be
used to effect velocity changes. These capabilities may consist of engines with
very fast response to throttle commands, thrust vectoring or thrust reversing
nozzles, or even nozzles which permit vectoring in forward flight (VIFFING).
Since a pilot engaged in air combat would likely make maximum use of his
aircraft's capabilities, the axial agility parameters appear to be an important
35

addition to the traditional point performance methods for determining the axial
capabilities.
3.1.4 Axial Agility Test Cases Description
The computer simulations necessary to determine the axial agility
parameters where run on the F-18 HARV simulation. The test case for the
power onset parameter begins with the aircraft setting-up at steady level
trimmed flight with speedbrake extended at a Mach number slightly greater than
the test Mach number; typically Ms-rAT = M=- + 0.03. The throttle is then
ramped down to flight idle setting over one second. A one second ramp was
used to reduce unwanted, large transitory thrust responses. The aircraft begins
decelerating in a minimum thrust/maximum drag configuration. When the test
Mach number is reached, a step command is applied to the throttle, from the
flight idle setting to maximum afterburner, while simultaneously retracting the
speedbrake (Figure 3.1). The resulting acceleration is maintained, holding
altitude constant, until the net axial force reaches amaximum value. This
typically requires approximately three seconds from the beginning of the
maneuver.
36

28
-26 . ..8........... ....... ..... ..t/...
-100--Alttude.....
3 4 5 6 7 8 9 16
Time (sec)Zigure 3.1: Axial Acceleration Example, Mach .6, S.L.
37

The entire test case from dynamic settling (trim), set-up, and maneuver
requires approximately ten seconds. A typical family of P, curves is displayed
800
6 0 0 ............ .........-- ................
.. . . .... .. . -- -- -----
400..... ........... ... ... ... ...
200
0 - .....0 ......I ........; '. .... -......: .............
-- Mach .6-800 ................ *--Mach .9
- 10- 00 ..... ' / '
3 4 5 6 7 8 9 10
Time (sec)
Figure 3.2: Axial Acceleration, Mach .4 - .9, S.L.
in Figure 3.2.
The test case for the power loss parameter is similar to that of the power
onset parameter, except that the aircraft accelerates up to the test Mach number
38

-Throttle commnand WI.400 ----- -PS (P tlSec)
40a
Altitude (Ft)
300 ..... ............. .. . . . . . .
3 -
200
4100
-2. ..- .... .
-200 . . . .. .... . . . .. . . .. ... ... .... .... . . ... .. .....
3 4 5 6 7 a 9 10
Time (sec)Figure 3.3: Axial Deceleration Example, Mach .6, S.L.
at maximum throttle setting with the speedbrake retracted. Upon reaching
MTs r, the throttle command is stepped from maximum setting to flight idle
while simultaneously extending the speedbrake (Figure 3.3). Thrust reversing
would be also engaged at this point if the aircraft was so equipped. Altitude
is held constant during the deceleration using the altitude hold mode of the
autopilot until net axial force reaches a minimum. This requires approximately
39

800
Goo . _ . -, ...... .-- - - -------.. .. --- .. . . M a c h . 4A/ i Macth .6
400 ........... ............- Mach .-Mach .92 00 - -- .. .i ... .i.. ... ... i .. .....i. ......i. .. .....i. ......
L.n
v_ ... .. ... ..... .. .. ... .. ... i .... ..
S -200----u'l -2-----... . - ................. .. . . .. . . . . . .
n\
-400 - - - - -....... ........ ....... ...... .....
- 0 0 ----- ------- . . . . . . . . . . . . .. . . . . . . . . . . . . . . . ..
-800 I I . ... I
3 4 5 6 7 8 9 10
Time (sec)
Figure 3.4: Axial Deceleration, Mach .4 - .9, S.L.
three seconds. The entire test case from dynamic settling, set-up, and maneuver
requires approximately ten seconds. A typical family of Ps curves is displayed
in Figure 3.4.
The power loss parameter is intended to measure the effectiveness and
response times of the engine and drag producing devices of the aircraft. While
40

it is possible to generate large amounts of drag very quickly by pitchirg to high
angles of attack, such a maneuver was not considered here.
Both the power onset parameter and the power loss parameter tests were
simulated at sea level, 15,000 feet and 30,000 feet and at Mach numbers from
0.4 to 0.9. The Mach numbers were selected to be representative of the range
of speeds at which aircraft would most likely be engaged in close air combat.
The altitudes were selected with air combat in mind also. Sea level, 15,000 feet
and 30,000 feet were chosen. The 15,000 feet altitude was specifically selected
because Eidetics International presents much of their data at this condition
(Reference 9). Both the acceleration and deceleration maneuvers described in
this Section are designed to quantify the agility of the airframe. The utility or
acceptability of the maneuvers to an operational pilot and the flying qualities
he would encounter during the maneuver are not addressed here.
3.1.5 Axial Agility Data Reduction Methods
The data reduction methods for the power onset and power loss
parameters are straightforward in concept but can contain some uncertainty. In
order to automate the data reduction process, the simulation was programmed
to output time histories of Ps and net axial force every 25 milliseconds in
addition to the usual time histories of state variables.
41

The equation for the power onset parameter is
APS Pqf-Pyi
At tf-t
where
p = P. at the minimum value of thrust minus dragPsf = Ps at the maximum value of thrust minus drag
= time at which thrust minus drag is minimumtf = time at which thrust minus drag is maximum
Whereas thrust minus drag attains easily identifiable minimum values, the
maximum values in many instances are approached asymptotically. Clearly, a
criteria are required to define the maximum value in such instances. A method
which is easy to use and gives the best results is to examine the difference
between successive values of thrust minus drag. When four successive data
points are identified which do not differ by more than approximately ten pounds
between any successive point, the fourth point is selected to represent the
maximum value. The value of ten pounds was chosen so that the maxima that
are apparent when the data is examined visually closely match those calculated
by the simulation algorithm. With respect to the magnitudes and time intervals
of the data, ten pounds is a reasonable tolerance band. Figure 3.5 displays the
42

608
-0-Sea Level50 5 ,0 0" .......... : .... .... ..........
~se - 30700~0 ft
4-j 0
m 300 - -- - - - *.. . . . . . .. .. . . . .
100 -
0.4 0.5 0.6 0.7 0.8 0.9
Mach No.
Figure 3.5: Power Onset Parameter
power onset parameter in curves of constant altitude for different Mach
numbers. At lower altitudes, the F-18 possesses a greater acceleration
capability. This is due to the larger difference between flight idle thrust and
maximum thrust at these altitudes. As expected, the acceleration capability is
proportional to Mach number for a given altitude.
The computation of the power loss parameter is completely analogous
to that of the power onset parameter. The power loss parameter is plotted
43

-50
-158
-2 0 0 .. .. . .I. . . . . .. .. . .. . . . . - -- - -
. -250 . . . . . . .. .. . .. . . . .
-300 - - - - -- - - -- . . . .- - -
cu -350 . . . . . . . . . . . . . .. ... . . .
-48 -- S- ea Level ..... ...... :.....-40 :
-- 15,~ 00F t
-5508 -3, II
0.4 0.5 0.6 0.7 0.8 0.9
Mach No.
Figure 3.6: Power Loss Parameter
versus Mach number for curves of constant altitude in Figure 3.6. The greatest
deceleration capability is seen to be at lower altitudes, due again to the larger
difference between flight idle thrust 2,-d maximum thrust and the increased drag
at higher dynamic pressures. The deceleration capability is again proportional
to Mach number for a given altitude.
44

3.2 Pitch Agility
3.2.1 Introduction
Pitch agility as originally postulated by Eidetics consists of "time
required to pitch up to maximum lift or to unload to zero g's or to rapidly
change to any desired angle of attack" (Reference 9). Alternate ways of
measuring pitch agility are
1) MBB's curvature agility (Reference 26),
2) the time derivative of load factor (Reference 26),
3) the time to capture an angle of attack,
4) the time to change pitch attitude (Reference 16), and
5) maximum nose up and nose down pitch rates (Reference 9).
During subsequent discussion of pitch agility (at the AFFDL Agility
Workshop, Aug 89, for example), time to capture a specified angle of attack
was generally rejected as a useful metric. Its primary disadvantage is the
difficulty in accurately capturing a specified angle of attack during flight test.
A secondary disadvantage is that the time to capture angle of attack is not an
appropriate quantity for comparison among dissimilar aircraft. Also, aircraft
normal acceleration is generated by lift, which is a function angle of attack and
lift curve slope. This metric neglects the lift curve (lift versus angle of attack)
45

characteristics of the aircraft. For these reasons, the time required to capture
a specified angle of attack is not studied further in this report.
Time to change pitch attitude has been flight tested by students at the
USAF Test Pilots School (Reference 16). During that study, pitch angle
changes of -45' to 450 and -30' to 300 were flown. Pilots and flight test
engineers involved in that evaluation concluded that time to change pitch
attitude was unsuitable due to the large changes in airspeed and altitude that
occurred during the maneuver.
The time derivative of load factor, though difficult to measure directly,
can, in theory, be extracted from flight test or simulation time histories. Since
both pitch up and pitch down capability are tactically important, the rate of
change of load factor during both types of maneuvers are investigated in this
report. It has been shown (Reference 26) that time histories of load factor
derivative and MBB's curvature agility metric are virtually identical when
scaled to account for different units. No further discussion of curvature agility
is included in this report since its technical definition and derivation are not
available in the open literature.
46

3.2.2 Published Pitch Agility Metrics
Based on this discussion, three of the published metrics that quantify
pitch agility are investigated here:
1) time to load to maximum load factor and to unload to zero load
factor,
2) positive and negative load factor rate, and
3) pitch rates during maximum authority pitch up
and pitch down maneuvers.
All three measures of agility are extracted from the same simulation runs. At
each flight condition investigated the aircraft was trimmed to straight and level
flight. Step inputs of 5 inches (maximum aft deflection) were applied to the
longitudinal stick and held for two seconds. Forward stick was then applied to
pitch down to zero load factor. A typical simulation time history from one
these runs is shown in Figure 3.7. Time to load, unload and the associated
pitch rates and load factor rates are then extracted and plotted.
Note that the test technique described above is adequate only for aircraft
like the F-16 and F-18 whose flight control systems incorporate hard load factor
limiters. Applying full aft stick in an F-4 or F-15 will, at many flight
condition, result in an over stressed aircraft and pilot. As a result, it is difficult
to directly compare the pitch agility of two aircraft like the F-18 and F-15
47

5.0 5.5 6.0 6.5 7.0 7.5 8.0 8.5 9.0 9.5 10.0
20.0. .
10.0 K-------------------1-4;~ 0.0, ,
3 - 0 . . . . . - - - - - - - -,-- - . . . - - - - - -
-- --- -20.0--- ------
5.0 5.5 6.0 6.5 7.0 7.5 8.0 8.5 9.0 9.5 10.0
25.0
25.0K.-
S 8.0
2 .0 -- -- -- - -- -- -- I ------
S -2.0 ---- --
5.0 5.5 6.0 6.5 7.0 7.5 8.0 8.5 9.0 9.5 10.0MACH .80 0 15K - MAX PITCH UP THEN UNLOAD
Figure 3.7: Maximum Pitch Up Time History
48

whose flight control systems are fundamentally different. One option is to
define the maximum surface deflection permissible for each aircraft at a given
flight condition and then base the agility measurement on that deflection rather
than on maximum stick input. This would make flight test much more difficult
since the pilot has only indirect control of surface deflection and no infonnation
about surface position is available to the pilot during flight. Also, this method
would not account for the effects of surfaces like maneuvering flaps that operate
on the F-18 but are not available on the F-15.
In the following paragraphs each of the three published metrics is
evaluated in both the nose up and nose down directions. Results are shown at
three representative altitudes over a range of subsonic Mach numbers.
First, time to attain maximum load factor and time to unload from
maximum load factor are plotted against Mach number for altitudes of 0, 15,000
feet and 40,000 feet in Figures 3.8 and 3.9. These two figures show that pitch
agility, as measured by the time to achieve maximum load factor and the time
to unload from maximum load factor, is a strong function of Mach and altitude.
At any altitude, the aircraft's normal acceleration due to angle of attack
increases with Mach number so the resulting time to both load and unload is
smaller, even in cases where the pitch rates at each Mach number are nearly the
sallie.
49

a _
:1-0- 151000 ft
0.4 .56.6 8.70.0..4 Mach No.
Figure 3.8: Time to Pitch to Maximum Load Factor
The 15,000 feet line in Figure 3.8 illustrates a shortcoming of the time-
to-maximum load factor metric. Contrary to the indications from Figure 3.8,
the F-18 is not slower to achieve positive load factor at Mach .7 then it is at
Mach .6. Load factor onset is actually faster at Mach .7 but the maximum peak
load factor is higher so the time to reach that peak is slightly longer. If the
time to maximum load factor is used to compare the agility of dissimilar
50

: --e-- Sea Level.-. -o-15,000 ft
2.1 ... . ............. - x-- 409000 Ft
E ..... . .
, .. . ... .I . ........ ....... .. I..... . ... ..........
8.4 8.5 8.5 8.7 8.8 8.9
Mach No.
Figure 3.9: Time to Pitch From Max Load Factor to 0 G
aircraft, misleading results could occur at flight conditions where the maximum
load factors of the aircraft are different.
A comparison of Figure 3.8 to Figure 3.9 also suggests that the F-18 is
significantly more agile in the nose up direction then in nose down pitching
motion. At lower Mach numbers, the aircraft requires about twice as long to
unload from maximum nz as it does to pitch from straight and level flight to
51

maximum load factor. This result was also noted by Eidetics International
(Reference 9). Their brief analysis of several current fighter aircraft indicates
that all of them possess much less nose down than nose up pitch agility. If
pitch agility in both directions is important to an operational pilot, then nose
down pitch authority is a promising candidate for improvement.
Sea LelvI25 -O-.................... .-*x-40,000 ft
20 .. . .. .I .. ... .. .. . .I .. ...o.. .
m zs --o - 5 00 f.. ............. ......... .......... .:: . - > ! ! - ,
0
o
LLirnl
0
8.4 8.5 0.5 8.7 8.8 8.9
Mach No.
Figure 3.10: Maximum Load Factor Rate
Next. the maximum positive load factor rate generated during pitch up
and the maximum negative rate generated during an unloading maneuver are
52

0
CD
Ln
0
-~. ...... ... . .... . ......... '
Li• ____________
LL-0Sea Levelr -25 -0-15,01 .t ...
30 4 0.5 0.6 0.7 0.8 0.9
Mach No.
Figure 3.11: Minimum Load Factor Rate
again plotted against Mach and altitude in Figures 3.10 and 3.11. These figures
reflect the same dependence on Mach and altitude that was seen in the "time-to-
load-factor" results of the previous paragraph. The load factor rate data shown
here was obtained from the simulation with a -imple differencing scheme since
load factor rate is not available either as a term in the dynamic model of the
aircraft or as an output of a modelled sensor. A similar approach would be
53

needed to obtain this data from a flight test maneuver. In the simulation with
no random atmospheric inputs, buffet or sensor noises applied, the differencing
algorithm produced usable load factor rate data. Application of a differencing
scheme to obtain load factor rate information from flight test would require
extensive smoothing and may not be feasible. Finally, the maximum nose up
pitch rate generated when pitching to maximum load factor and the maximum
nose down pitch rate encountered while pitching down from maximum to zero
load factor are again plotted against Mach and altitude in Figures 3.12 and 3.13.
54

60_ _ _ __ _ _ _ _
I--e Lev2
55 . . ..w. . . .. -- -~ O O F4000,f
50. . .. . ... . . .
wn
45 . . .. .. ... .. .. .I .. ...7 ... .. 0..Mah o
Figure ..3.12 Ma. Pic Rate From .Steady Lee Flight
Q55

The effects of limiters in the flight control system are evident in these figures.
At sea level and at 15,000 feet, pitch rate is reduced above Mach .6 to prevent
the aircraft from exceeding its limit load factor (see Figure 2.1). At 40,000 feet
the aircraft is restricted by available lift to less than its structural limit so no
flight control limiting is needed. High positive and negative pitch capability is
available throughout the subsonic Mach range at this altitude.
-15
-e--Sea Level_ - " -o-15 00 Ft/-2 c.... ...... . . .Li -2 -x-40,000 Ft
.1n
ai' -25 G. . . . . . . . .
- .8 ........., .... ..... .... .... ... .....,, ... ........
0.4 0.5 0.6 0.7 0.8 0.9
Mach No.
Figure 3.13: Max Neg. Pitch Rate During Unload
56

At many flight conditions, maximum load factor cannot be held during
the two second input step. In these cases, aircraft deceleration causes load
factor to decrease immediately after the peak is achieved and before the pitch
down command is initiated. Time to pitch down as shown here is calculated
from the time forward stick is input not from the time that load factor begins
to decay due to airspeed loss. This method minimizes the influence of aircraft
drag characteristics on pitch agility measurements and emphasizes nose down
pitch authority.
The time to achieve maximum load factor and the time to unload metrics
may have limited value for comparison among dissimilar aircraft or even among
various flight conditions for the same aircraft because the maximum load factors
themselves are different. For example, consider two dissimilar aircraft, one
with a 5 g limit and the other with a 9 g capability at the same flight condition.
If each were equally agile in terms of load factor rate, the first aircraft would
have a smaller time to maximum load factor since the maximum is lower.
Likewise, the F-18 simulation at 15,000 feet altitude demonstrates the same
time to maximum load factor at Mach .6 and Mach .7. The reason for this
apparent anomaly is that at Mach .7 the aircraft has both a higher load factor
rate and a higher maximum load factor.
57

In light of the shortcomings of the time to achieve load factor and the
load factor rate metrics, maximum positive and negative pitch rate appear to be
the most useful measures of longitudinal transient agility. Pitch rate is only an
indirect measure of the aircraft's ability to generate normal acceleration and to
unload to zero load factor quickly. Differences in lift curve slopes are
neglected as they would be in measuring time to capture angle of attack.
However, pitch rate is a direct measure of the pilot's ability to move the nose
of his aircraft which is a significant capability particularly during within-visual-
range engagements.
3.2.3 Pitch Rate versus Angle of Attack Metric
If maximum positive and negative pitch rates are used to quantify pitch
agility, then the flight maneuvers used previously are not adequate to fully
evaluate this capability. A full deflection aft stick input followed by pitch
down to zero load factor results in pitch rate data at only one angle of attack
for each flight condition. A more complete picture would show pitch rate
versus initial angle of attack at representative flight conditions. A proposed
flight test maneuver consists of pitching the aircraft with incremental
longitudinal stick inputs. Then full aft (or forward if nose down rates are being
studied) stick is applied. Maximum pitch rate is recorded and plotted against
58

55 ________55 . i ::-e-Mac h .4
58 ....... .. .... . ..... ........ - o--Mach .-,-Mah .6
* . -*-Mach .8.1
a-r 38 . . .
3 8 . ... . .. .... . . . ......... . . . . .I.. . .
8 5 15 28 25 30
Angle of attack
Figure 3.14: Maximum Pitch Rate Capability, 15,000 ft
the angle of attack from which the maximum rate command was initiated. The
full deflection inputs should follow the initial incremental steps quickly enough
that aircraft Mach and altitude remain within acceptable flight test tolerances.
The simulation results from this procedure at 15,000 feet are summarized in
Figures 3.14 and 3.15.
The trends for each Mach number in Figure 3.14 show that as the initial
angle of attack is increased, the pitching moment authority remaining available
59
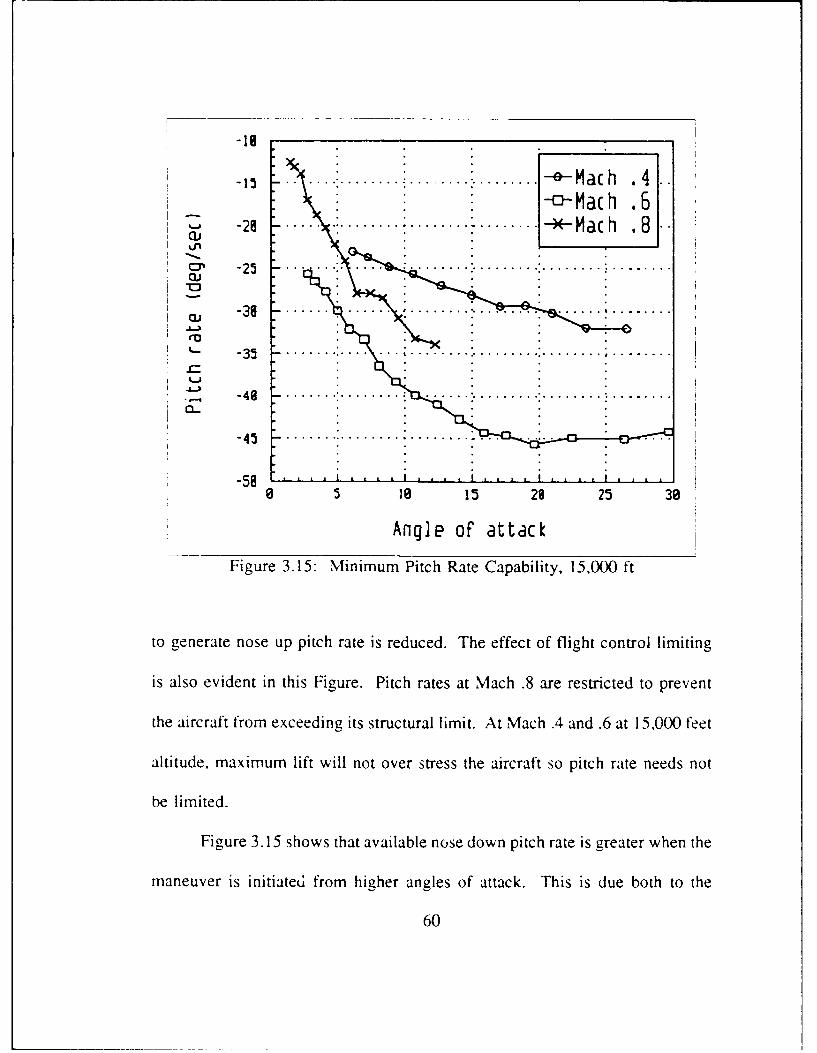
-18
.. ............. ................. -o- M a ch .4-15 --e-Mach .4)
- . .- 0-Mach .6-2B ..... : ....... ................. -x a
-20 -*-Mach .8L1
0' 1 -25 . ...... .................... ........
-45
-3 5 18 15 2 25 3
Angle oF attack
Figure 3.15: Minimum Pitch Rate Capability, 15,000 ft
to generate nose up pitch rate is reduced. The effect of flight control limiting
is also evident in this Figure. Pitch rates at Mach .8 are restricted to prevent
the aircraft from exceeding its structural limit. At Mach .4 and .6 at 15,000 feet
altitude, maximum lift will not over stress the aircraft so pitch rate needs not
be limited.
Figure 3.15 shows that available nose down pitch rate is greater when the
maneuver is initiated from higher angles of attack. This is due both to the
60

natural stability of the aircraft (negative Cmj and the larger net pitch control
surface deflections made when pitching down from higher angles of attack.
Some pitch rate limiting is also evident in Figure 3.15 since nose down pitch
rates at Mach .8 are consistently slower than for Mach .6
Advantages of the pitch rate versus angle of attack approach are first,
that a more complete picture of the aircraft's nose pointing ability is available.
Secondly, since the pilot is not required to capture a specific angle of attack or
load factor, his inputs are simpler and more repeatable. Aircraft characteristics
are highlighted and the impact of individual pilot technique is minimized. The
ability to quickly and accurately capture a desired pitch attitude is, of course,
important. However, that is a flying qualities problem as well as to an agility
issue and is measured with well known Handling Qualities During Tracking
(HQDT) methods (Reference 32, 33).
Just as in the axial case, these longitudinal metrics and the maneuvers
described here are designed to quantify the agility of the aircraft. The
acceptability of such maneuvers to an operational pilot and all the associated
issues of flying qualities, pilot discomfort and g-induced loss of consciousness
require further research.
61

3.3 Lateral Agility
3.3.1 Introduction
Lateral agility is a measure of an airplane's agility in the roll axis. This
agility is a function of Mach number, angle of attack and altitude. A roll that
is performed while holding angle of attack, and thus load factor, is called a
"loaded roll." A coordinated roll (zero sideslip) performed at constant angle of
attack is often called a "roll about the velocity vector" or a "wind axis roll."
Lateral agility measures an airplane's ability to perform a loaded roll maneuver
and is limited by both the roll authority of the aircraft and the ability of the
pilot and flight control system to counter the effects of cross axis coupling into
the pitch and yaw axes. Coupling is introduced through aerodynamic terms
(e.g. yawing moment due to aileron deflection, rolling moment due to yaw rate,
etc.), and kinematic cross coupling and inertial cross coupling.
Figure 3.16 graphically describes the kinematics of a loaded roll
(Reference 34). Assuming, for this illustration, that the aircraft rolls about its
body axis (that is, neglecting the influence of stability and inertia), the initial
positive angle of attack is converted to an equal sideslip angle as the aircraft
rolls from position I to II. If the roll is continued, negative angle of attack and
sideslip also result. Assuming small angles and omitting Y and Z axes forces,
the angle of attack and sideslip rates induced by kinematic coupling are
62

ai
Figure 3.16: Kinematics of a Loaded Roll
approximated by
d[= q - p1 (3.2)
and
63

=pa - r (3.3)
The origins of inertial coupling can be seen in those terms of the moment
equations of motion where rotation rates about two axes cause rotational
accelerations about the third axis. Those terms are extracted from the full
equations of motion and are listed below.
= -qr ( )+(t+qp)If (3.4)
IX IX
koupg = -pr - (p2 - r2)LIi (3.5)Sly(3.5)
r,,j. g = -pq (qr - 0) I (3.6)
The first term in each expression above indicates that inertial coupling is
proportional to the difference between the aircraft's Z axis moment of inertia
64

and its X axis moment of inertia (IZ - I). As fighter designs have evolved
toward shorter, thinner wings with more mass concentrated along the
longitudinal axis, this difference has become more significant.
Cross coupling into all three axes of rotation is also introduced through
the product of inertia term, lI,, in each of the equations above. (I1y and lyz also
appear in the complete equations of motion but are equal to zero for aircraft
symmetric about the x-z plane.) The Iz term can be viewed as a measure of
how the mass is distributed above and below the plane formed by the aircraft's
X and Y axes. The line about which 1,Z is zero is called the inertial axis and
a rolling maneuver about any other axis (e.g. the stability X axis) will result in
pitch and yaw accelerations through the Ix, terms in Equations 3.5 and 3.6.
Many ways of measuring lateral agility have been proposed in the
literature (Reference 1, 9, 11, 25). The choice of a particular lateral agility
metric may be influenced by:
- the facilities used for testing (non-real time simulator, piloted simulator,
flight test),
- the particular aspect of a rolling maneuver of interest (roll acceleration,
capturing a small or large bank angle change),
65

- the flight regime of interest (high or low alpha, high speed or low
speed),
- the use of the data (for design, evaluation or tactics).
3.3.2 Time-to-90 Metric
The most widely used metric today is the minimum time to capture a 90
degree bank angle change while holding a prescribed angle of attack. The
symbol used for this metric is Tg0. The metric is best suited for piloted
simulators and flight testing, and is appropriate for all flight regimes except
possibly at high angles of attack. Its utility to fighter pilots and designers is
currently the subject of research by the Air Force Flight Test Center and several
aircraft manufacturers (Reference 22, 35).
The T9, metric is best suited for man-in-the-loop testing since it requires the
judgement of a pilot to choose a realistic and often complex control input
sequence. Rolling an airplane while holding an angle of attack requires body
axis yaw rate to keep sideslip from building due to kinematic coupling during
the roll. Figure 3.17 shows the required body axis roll and yaw rates for a
perfectly coordinated wind axis roll. For example, at 20 degrees angle of
attack, a wind axis roll of 100 deg/sec requires a body axis roll rate of 94
deg/sec and a body axis yaw rate of 34 deg/sec. Control power during a loaded
66

100. ...
CU
- 80
Ga40 ---- -- -
CD
Ln 20 . . ..
/X -Body Axis Roll Rate/ -Body Axis Yaw Rate
0 . . ....a . .I . . I .. .I . . I .. .I . . . . , ,
CD 0 10 20 30 40 50 60 70 80 90
Angle of Attack (deg)
Pwind 100 deg/sec, ZerO sideslip
Figure 3.17: Body Axis Rates for Wind Axis Rolls
roll is required both to generate the angular rates needed to coordinate the
maneuver and to counter the moments stemming from inertial and aerodynamic
cross coupling.
At low angles of attack, the flight control systems of today's fighters
command enough yaw rate to keep sideslip small even at high roll rates. When
67

using maximum roll control inputs at medium and high angles of attack, several
things can happen that allow sideslip to build up to 5 to 10 degrees First, the
flight control system's roll-yaw interconnect may not provide enough yaw rate
thus requiring the pilot to use the rudder pedals. Second, the airplane will
eventually run out of control power to generate the yaw rate that is required
when rolling at elevated angles of attack. At this point the pilot or the flight
control system must use less body axis roll rate to keep the required body axis
yaw rate within the capabilities of the airplane or accept significant sideslip
excursions.
The maneuver for the T90 metric can be performed on a non-real time,
unpiloted simulation at lower angles of attack where complex pilot control
inputs are not required. This was done on the F-18 HARV simulation by using
step commands of lateral stick position and constant longitudinal stick position.
The choice of reference frames may significantly effect the T90 metric at
high angles of attack. Since the metric measures the time to capture the Euler
roll angle D, it is the integral of D that is important, not the intcg:al of body
axis or wind axis roll rate. The equation for 4 is (Reference 35)
68

b=P + Rcos~tan@ +Qsin~tanO (3.7)
When performing a loaded roll at high angles of attack and low to medium
speeds, pitch angle (E) can become large enough so that the third term of
equation 3.2 above becomes significant. This term is purely kinematic and has
nothing to do with lateral agility of a particular aircraft design. As angle of
attack increases, this term increases $ which reduces the time to capture VD
while the true rolling ability of the airplane continues to decrease.
3.3.3 Test Method
The F-18 HARV simulation described in earlier sections was used to
evaluate the T o agility metric. After the simulation was trimmed to a steady
flight condition, a longitudinal stick command was ramped in over one second.
This set the aiiplane at a given angle of attack. Two seconds later, with the
airplane settled on the commanded angle of attack, full positive lateral stick (3
inches on the F-18) was ramped in over 0.1 seconds. After holding this
command for a short time, the stick was ramped to full negative lateral stick
over 0. 1 seconds. Later the stick was ramped to the neutral position over 0. 1
seconds. Figure 3.18 shows a typical time history of the lateral stick
69

4.0
S 0.0...... ..
- 4.0 I
5.0 6.0 7.0 8.0 9.0 10.040.0
.~ 20 .0 -- - - - - - --, - - - - -- - - - - - - . . . . . . . . . . . . .
0 .0.. .. . . ..- - -- .. -- - -
. - 2 0 .0 -- - - - - - -- - - - - - - - -- - - - - - - - - - - - - - - - - - -
-40.05.0 6.0 7.0 8.0 9.0 10.0
15.0t ~ 10 .0 -- - - - - - - - -- - - -- -- - - - - - -- - - - - - -. . . . . . .
S - 5 .0 . . . . . . . . . . . . . . . . . . . . . . . . . . . . . . . . . . . ..----- ----.. .. . . . .
30.0---
-.0 60 70 80 90 1.
30.0
10.0 ---------
--- - -
5.0
------30.0
- 10.0
-5.0 6.............0.0 8.0--- 9.0----- 10.0-----
Figure 3.18: Control Time History for Typical TO, Maneuver, Mach .5, 15,000 ft
70

commands. The amount of time the lateral stick was held in each position was
determined iteratively to obtain a fast and accurate capture of a 90 degree bank
angle. The throttle was also adjusted manually to maintain the test Mach
number throughout the maneuver.
3.3.4 Data Reduction and Analysis
The simulation was programmed to calculate the time to capture 90
degree bank angle and the average Mach number, angle of attack and load
factor during the roll to 90 degrees. The time at which the lateral stick begins
to move is the beginning of the maneuver and the time at which the airplane
reaches a maximum bank angle is the end of the maneuver. The program does
not determine if that maximum bank angle is "captured." This must be done
by the engineer analyzing the data.
Since it is very difficult for either the simulation user or a test pilot actually
flying the maneuver to stop at an exact bank angle (Reference 16), the time to
reach the maximum bank angle is normalized to a bank angle change of exactly
O , - 90T90 = To (3.8)
71

90 degrees. Equation 3.8 is used for that normalization and was originally
proposed by the Eidetics Corporation (Reference 9). The accuracy of this
method hinges on the assumption that during both the nominal 90 degree bank
angle maneuver and the test maneuver to be normalized the aircraft's maximum
bank angle rate of change is attained. The impact of this assumption is
explored in Section 3.4. The resulting time to capture 90 degrees is plotted at
the average Mach number and angle of attack.
3.3.5 Simulation Results
Figure 3.19 shows the results of testing the T9o metric at 15,000 ft
altitude. Results at 30,000 feet are presented in Figure 3.20. The effect of
Mach number and altitude on the Tgo metric is straightforward. At higher
dynamic pressure the control surfaces are more effective and can give the
airplane higher roll acceleration and, thus shorter T90 values.
The effect of angle of attack is due to kinematic coupling and the roll and
yaw rate capabilities of the airplane. At low angles of attack, the maximum roll
capability of the airplane (and control system) is used in capturing the 90
degree bank angle. Some rudder coordination is required but it is within the
rudder's control power limit.
72

1.7 -- -M ch" ... . ...... ....... :..... ..:J1.7 -sMach .4
1.6 -C-Mach .5 .......... ...... I ......Mach .6
1.5 -U- Mach .7 - - -------1.4 ---Mach .81J .4 -.- -- __ - --- -.....- ........ .. .. . .: ---
LJ
0.39 . -- -' -- - - - ---- -- ------
1.1j
0.8
0 2 4 6 8 10 12 14 16
Angle of Attack (deg)
Figure 3.19: Time to Capture 0 = 900 at 15,000 ft
As the angle of attack of the maneuver increases, so does the yaw rate
required to maintain a coordinated roll. This yaw rate requirement soon
saturates the rudder. At angles of attack where the rudder can become
saturated, the F-18 control system limits the roll rate to maintain a reasonably
coordinated roll and thus the T9 values are increased.
A comparison of Figures 3.19 and 3.20 shows the effects of altitude on
the T. metric. Though dynamic pressure at constant Mach is reduced almost
73

2.5
-e- Mac h .4-n-Mac h .5--- Mac h .6
2 -m M a ct h . 7 -- -- - --- --- ---: . . . . .. .." - J . . . . ..S-u-Mach .8-*-Mach .8
0.5 I , I
0 2 4 6 8 10 12 14 16
Angle oF Attack (deg)
Figure 3.20: Time to Capture $ = 90' at 30,000 ft
50% between 15,000 feet and 30,000 feet, the flight control system is able to
maintain T9. values below 2 seconds for all but the lowest speed tested. The
largest difference in T9. between the two altitudes is less than 30%.
An underlying assumption to all the lateral agility metrics proposed in
the literature is that faster is better at all angles of attack. Lower values of T,)
imply a faster maximum roll rate and a smaller roll mode time constant. When
the roll mode time constant and maximum roll rate are chosen to provide good
74

flying qualities as defined by MIL-F-8785C or its successor, MIL-STD-1797,
the design's Tgo values follow as a direct consequence. Thus, lower values for
T90 must be traded against increased lateral sensitivity. The impact of that
increased sensitivity on pilot orientation and flying qualities, especially at high
angles of attack requires further research.
75

4. Flight Test Issues
4.1 Background
While Simulation is useful to evaluate agility metrics and data reduction
techniques, flight test is required to accurately measure the agility of real
aircraft. Flight test results are also needed to verify that the simulation methods
provide accuracy sufficient to warrant their use in future agility research. Both
the NASA Dryden Flight Research Center and the Air Force Right Test Center
have conducted limited flight tests of several agility metrics. During 1987, a
team of pilots and flight test engineers enrolled in the USAF Test Pilots School
flew a small number of sorties with T-38's and F-16's. Their goal was to
evaluate flight test techniques, data measurement and analysis methods and data
presentation formats to quantify aircraft agility. Pitch and lateral maneuvers
were flown to evaluate metrics about both these axes. Since theirs was a Test
Pilot School student project, time and resources were very limited. However,
the work is thoroughly documented in a final report (Reference 16). In 1_988,
a number of lateral agility maneuvers were flown with NASA Dryden's F-18
HARV aircraft. Results were analyzed both in-house at NASA and by the
Eidetics Corporation. Briefing charts from a March 1989 Dryden Agility
Review represent the only known documentation of this effort.
76

Since these two test programs used different aircraft types and quantified
agility with different metrics, direct comparisons of their results are not
possible. However, a significant conclusion of both studies was that the flight
maneuvers required to measure agility in terms of any of the tested metrics are
very difficult to perform accurately and repeatably. The greatest difficulties
were encountered while executing the loaded rolls required by the proposed
lateral agility metrics. In the case of the Test Pilot School study, at least, the
maneuvers were difficult to fly properly even after they were practiced in
ground based simulators. In both programs, pilots flew the test maneuvers with
only standard cockpit displays. No specialized displays or cuing systems were
developed for these test programs.
A typical loaded roll maneuver used to evaluate lateral agility involves
pitching the aircraft to a target load factor and then rolling to and stopping at
a specified bank angle while holding the desired load factor. This differs from
the Mil Standard Flying Qualities requirement of rolling through a specified
bank angle change at other than a one-g condition (Reference 37). Hence, this
maneuver requires precise lateral and longitudinal flight control inputs. Flight
test time histories and pilot comments indicate that adequate accuracy is
difficult to achieve in both axes simultaneously. Pilots found it difficult to
maintain the de-ired normal acceleration during the rolling maneuver.
77

Specifically, buffet made the T-38 g meter fluctuate rapidly and the digital g
information displayed by the F- 16 heads up display was unsuitable for capturing
and holding a desired acceleration. Pilots also found it difficult to stop the roll
rate precisely at the target bank angle. As a result, pilots often commanded less
than full roll rate in order to gain a more accurate capture of bank angle. The
trade between roll rate and bank angle accuracy, when left to the pilot's
discretion, produced large variations in metric values. Again, only standard
cockpit displays of bank angle were available to the pilots.
Alternative techniques investigated at the Test Pilot School included
rolling with constant aft stick force or at constant angle of attack. Constant
stick force was found impractical without a force gauge. Constant angle of
attack was more flyable only because the angle of attack gauge in both the T-38
and F- 16 is less sensitive than the g meter.
In summary, agility flight testing involves transient, highly dynamic
maneuvers that depend on precise, repeatable but complex pilot input sequences.
Preliminary test experience has shown that sufficient accuracy and repeatability
is difficult to obtain. New approaches to cockpit displays or pilot cues
developed specifically for agility flight testing may reduce test pilot workload
and enhance the validity of the test results. New display concepts and cuing
methods may also be required in operational cockpits to enable tactical pilots
78

to fully utilize the ideas of agility and supermaneuverability (Reference 41, 42,
43).
4.2 Analysis of Cuing Method
There are two fundamentally different ways to approach the problem of
providing better information to the pilot for agility flight testing. The first is
to limit the development of displays and cuing methods to those that can be
implemented with the hardware and software capabilities now available on the
F-18 HARV and in NASA Dryden's flight test facilities. The other is to
postulate new displays and cues without considering the limitations of current
capability. For example, an easily programmable head up display could allow
rapid implementation of displays tailored for specific tests (Reference 31).
Such a system would permit the development of innovative pilot cues for agility
flight testing but specialized displays of this type are not likely to be available
for the F-18 HARV in the near future. Discussion in this report, therefore, will
be restricted to the use of existing equipment cues for agility flight testing will
be passed to the flight test pilot through hardware now available nn the aircraft
and over information channels that already exist. The key issue, then, is how
accurately does the flight test pilot have to follow the cuing direction in order
to produce useful agility data.
79
The most logical means to assist the pilot during agility test maneuvers
involve the transmission of cues to the steering needles on the F-18's Attitude
Direction Indicator (ADI) from Dryden's ground based flight test facility. This
technique for passing information to the cockpit during flight test has been used
before and requires no new equipment. The steering cues are developed on the
ground as the test pilot practices the agility test maneuvers in Dryden's real
time man-in-the-loop simulation. When a satisfactory maneuver is flown on the
simulation, the stick inputs that produced the maneuver are recorded and saved.
During flight test these inputs are transmitted in real time to the F-18 HARV
and displayed to the pilot as steering commands on the ADI. By tracking these
commands, the pilot replicates the stick inputs applied earlier in the ground
based simulator. The test can be reflown as often as necessary to produce
consistent, repeatable maneuvers.
The results of this procedure, however, depend on the pilot's ability to
follow the steering needles accurately. The level of accuracy irequired depends
on the sensitivity of the agility metric to variations in stick input and is the
,ubject of the following sections.
80

4.3 Sensitivity to Cue Following Errors
The F- 18 simulation at the University of Kansas was used to assess this
sensitivity for the pitch and lateral agility metrics discussed in previous sections.
Since no stick commands are required while testing the axial agility metrics
(power onset and power loss parameters), sensitivity to pilot errors in following
steering cues does not apply to those metrics.
4.3.1 Sensitivity of Pitch Agility Metrics
As discussed in Section 3.2, three approaches to measuring pitch agility
have been proposed. These consist of (1) the time to pitch to maximum load
factor and the time to pitch down from maximum to zero load factor, (2) the
maximum load factor rate during a pitch to maximum load factor and the
maximum negative load factor rate during a pitch down from maximum to zero
load factor and (3) the maximum positive and negative pitch rates generated
during a pitch up to maximum load factor followed by a pitch down to zero.
All three metrics could be evaluated with the same test maneuver.
Typical stick inputs for such a maneuver were shown in Figure 3.7. If
these are the nominal commands passed to the pilot with the cuing system
described earlier, the actual pilot inputs could deviate in the following ways.
81

1. The initial aft stick input could be applied at a different rate than
directed by the steering cues.
2. The aft stick input could be less than the full deflection command
directed by the cues.
3. The forward stick input could also be applied at a different rate.
4. The size of the forward stick input may not match the cues.
Each of these errors was imposed, one at a time, on the pitch maneuvers
used to evaluate the published pitch agility metrics (time to load factor, load
factor rate and pitch rate) described in Section 3.2. Runs were made at 15,000
feet altitude to illustrate the behavior. The tested deviations from nominal are
summarized in Table 4.1 below. Forward stick deflection (the fourth error type)
was increased rather than reduced because if the forward deflection was reduced
by 20% the maneuvers failed to achieve the zero load factor as required by the
metric definitions.
82

Table 4.1: Deviations for Pitch Sensitivity Tests
Error Type Magnitude
Aft Stick Rate Reduced 20%
Aft Stick Deflection Reduced 20%
Forward Stick Rate Reduced 20%
Forward Stick Deflection Increased 20%
Only the first two errors listed above, aft stick rate and aft stick
deflection, have an impact on the pitch up portions of the agility metrics.
Changes in the forward stick command rates or magnitudes have no effect on
the time to maximum load factor, positive load factor rate or positive pitch rate
since they occur after the pitch up portion of the test maneuver. Similarly, only
the last three errors above have a direct impact on the pitch down parts of the
agility metrics. The rate at which the initial nose up command is applied does
not effect the pitch down maneuvers. The size of the initial aft stick deflection,
however, effects the attitude from which the pitch down is initiated. Deviations
in the forward stick commands clearly impact the nose down parts of the metrics.
83

1.2 . ........ . ....................................-1.4 -
1.3
0.9
0 .8 7 - - - - - - - - . . . . . . - -
0. 7 -Nomi na I ..................-o-Aft Stick Rate Err.
0 .6 - -- A f t S t ic k M a g n i tu d e E r r .- --------.. . . . . . . . .
8,5
0.4 o.5 0.6 0.7 0.8 0.9
Mach No.
Figure 4.1: Time to Max Load Factor Error
Sensitivity, 15,000 ft
Figure 4.1 indicates that the time to maximum load factor metric is very
insensitive to the errors in aft stick rate or in aft sick deflection. As expected,
reducing the aft stick deflection rate increases the metric but the maximum
change is only 0.15 seconds. Applying four inches of aft stick instead of five
84

has an even smaller effect on this metric since it measures only the time to
maximum load factor and not the size of the load factor itself.
Maximum load factor rate generated in the pitch up portion of the
maneuver is virtually unchanged by either of the deviations in aft stick rate or
aft stick magnitude as shown by Figure 4.2. Neither of these deviations had
significant effects on this metric.
85

30
-*Nom in allu 25 --0-Aft Stick Rate Err.
--&-Aft Stick Magnitude Err.
CO
CL J 1 - - - - - - - - - . . . . . . - - - -
wa
C
060.4 0.5 0.6 0.7 0.8 0.9
Mach No.
Figure 4.2: Pitch Up Load Factor Rate Error
Sensitivity, 15,000 ft
86

As seen in Figure 4.3, the slower aft stick rate also has practically no
effect on the maximum pitch rate encountered during the pitch up. However,
60
50 . ... .. ............ .. .. ........................
oJ
Qj
--x- Nominal-u-Aft Stick Rate Err.
25 ----Aft Stick Magnitude Err. -------
20 ....... . . . . . . . . . . . . . . . .
0.4 0.5 0.6 0.7 0.8 0.3
Mach No.Figure 4.3: Nose Up Pitch Rate Error Sensitivity,
15,000 ft
when the maximum stick deflection is only four inches, maximum pitch rate is
significantly reduced at the lower Mach numbers. The reason this deviation can
87

have a pronounced effect on maximum pitch rate but no impact on the other
metrics is that the value of each metric is established at a different point in the
time history of the maneuver. Maximum load factor rate occurs very quickly,
while pitch rate is still relatively small. The instant of maximum load factor is
later in the maneuver when load factor rate is zero and after pitch rate has
peaked and has begun to decline.
As discussed earlier, three of the four deviations from nominal, forward
stick rate, aft stick magnitude and forward stick magnitude, have an effect on
the nose down part of the pitch agility metrics. However, only one of these
causes a significant change in the time to pitch down to zero load factor (Figure
4.4). Applying 20% more forward stick than for the nominal case causes the
aircraft to reach zero load factor quicker at lower Mach numbers.
As in the nose up case, load factor rate is virtually unaffected by any of
the deviations applied here as can be seen in Figure 4.5.
The effects of changes in forward stick rate, aft stick magnitude and
forward stick magnitude on nose down pitch rate are seen in Figure 4.6.
Commanding more than the nominal forward stick deflection causes slightly
higher nose down rates, while applying the stick input at a slower rate reduces
the resulting pitch rate magnitude. In no case, however, are the changes large
or unpredictable.
88

3
-- Nomi naI2.5 ..... - -.....-a-Forward Stick Rate Err.
-6-Aft Stick Magnitude Err.* -e-Forward Stick Magnitude Err.
LI,
E 1.5
0 .5 ......... ......... ......... ......... .........0.4 0.5 0.6 0.7 0.8 0.9
Mach No.
Figure 4.4: Time to Zero Load Factor Error
Sensitivity, 15,000 ft
This analysis indicates that none of the published metrics for quantifying
pitch agility is unusually sensitive to deviations from the nominal sequence of
stick commands. In the nose up direction, pitch rate is reduced by
approximately ten degrees per second if four inches of aft stick is applied rather
than five. During the pitch down portion of the maneuvers, zero load factor is
89

B
LnC -5{ . .......... ...... -- --.. ......- - ---
U,
a-i
L..
0
-*-Nominal 3
-25 -o-Forward Stick Rate Err., ...........o -- Aft Stick Magnitude Err.
-e-Forward Stick Magnitude Err.
0.4 0.5 0.6 0.7 0.8 0.9
Mach No.
Figure 4.5: Pitch Down Load Factor Rate Error
Sensitivity, 15,000 ft
achieved faster when more forward stick is used. Except for these two
instances, the input deviations studied here had no significant impact. This
shows that useful data for the time to achieve maximum load factor and load
factor rate metrics can be generated with a reasonable tolerance for pilot
variations. When attempting to collect data to measure aircraft pitch rate or the
90

-15 i_-Nominal
-0-Forward Stick Rate Err.-20 -..... ...... l--Aft Stick Magnitude Err.
-e-Forward Stick Magnitude Err.
ci0.-25 -. 5 .. ......... ..... ... . 8 -
"0
S -4 0 .... ... ......... . . . .
0.4 0.5 0.6 0.7 0.8 0.9
Mach No.
Figure 4.6: Nose Down Pitch Rate Error Sensitivity,
15,000 ft
time to achieve zero load factor, special displays may be warranted due to the
sensitivity of these metrics.
91

4.3.2 Sensitivity of Lateral Agility Metrics
The lateral and longitudinal stick commands for a typical loaded roll
maneuver are shown in Figure 4.27. If these inputs represent the desired pilot
Longitudinal Stick Lateral Sticj
......... I ...... ........ .0 .. . . ] . .. . .. . . ... .i i . ., l .. .I . . . . [ I 1 1 1
4 7 a 5 to 4 6 7 e 9 to
Time (sec) lime (sed
Figure 4.7: Stick Deflections for Typical T90 Maneuver
commands for a given maneuver, then the actual commands could deviate in
any one or a combination of the following ways.
1. Aft stick can be relaxed during the roll instead of held constant. This
type of deviation was prevalent during the F-18 HARV test.
2. Less than full lateral stick can be used to initiate the roll.
92

3. Less than full lateral stick in the opposite direction can be used to
stop the roll.
4. Stick inputs may be applied at a different rate than directed by the
steering cues.
5. Lateral stick deflection can be held too long either while initiating the
roll or while stopping the roll with opposite stick.
A deviation of the last kind will result in the roll being stopped at some
bank angle other than the target angle. This error will be corrected by the data
reduction algorithm presented in the earlier Lateral Agility section and will not
effect the resulting value of the agility metric. Each of the other deviations
from the ideal pilot input could result in an erroneous value of lateral agility,
the magnitude of which depends on the type, size and sensitivity of the
deviation introduced. The errors and their sizes are summarized in Table 4.2.
93

Table 4.2: Deviations for Lateral Sensitivity Tests
Error Type Magnitude
Longitudinal Stick Position Reduced 50%
Positive Lateral Stick Deflection Reduced 20%
Negative Lateral Stick Deflection Reduced 20%
Lateral Stick Rates Reduced 50%
(All Directions)
Each of these four errors was introduced to the loaded roll maneuvers
previously used to assess lateral agility. As in the previous section, runs were
made at 15,000 feet altitude to illustrate the method. First, instead of being
held constant as in the nominal maneuver, the aft stick was reduced to half its
initial value when the roll command was reversed . Figures 4.8 to 4.12 indicate
that this input error produced a negligible change in Tgo values. Averaged over
all test cases, the deviation from nominal maneuvers was less than 2%. Closer
inspection of the simulation results show that peak adverse sideslip occurs early
in the roll before the aft stick command is reduced. As a result, the forward
94

2
rn-G-Long. Stick Err.-0-Pos. Lat. Stick Err.
.8-!-Ne?. Lat. Stick Err.CT) - L a . Stick Rate Err. ".........
-4-*Nominal T90
C
aJ. E/1 I I' *
ca_~~. .. . . ..... . . .. . .. .. . ...
CC
S 1.2 -. ---- ----- ----- .................. ...........
0 2 4 6 8 10 12 14 16
Angle of' Attack
Figure 4.8: T90 Error Sensitivity,
Mach .4, 15,000 ft
stick motion does little to speed the roll response even though angle of attack
is reduced during the last half of the maneuver.
Next the effect of initiating the roll with less than nominal lateral stick
deflection was investigated. Without changing the timing of the stick inputs or
the size of the longitudinal stick commands, the magnitude of the initial roll
95

-6-Long. Stick Err.m ---Pos. Lat. Stick Err.
. --o-Neg. Lat. Stick Err."-- Lat. Stick Rate Err.
1.5 - Nominal T9J0ai 1.5 -- - m na Tg ..... . .. .....
€0
1.41-- -
0 1.2 .... ... .. ..... .... ... .... ............
11, - - - - - ....... ..... . ............. . . . . . . .
2 4 6 8 10 12 14 16 18
Angle of Attack
Figure 4.9: T90 Error Sensitivity,
Mach .5, 15,000 ft
commands was reduced by 20%. As expected, this change produced a roll
angle capture short of the desired 900. Results at 15,000 feet altitude show that
a 20% reduction in lateral stick deflection reduced the final captured bank angle
by an average over all test cases of 290. It is possible to use the data reduction
algorithm presented in the lateral agility section to correct for errors in the final
bank angle and calculate a value for Tgo. However, that algorithm assumes that
96
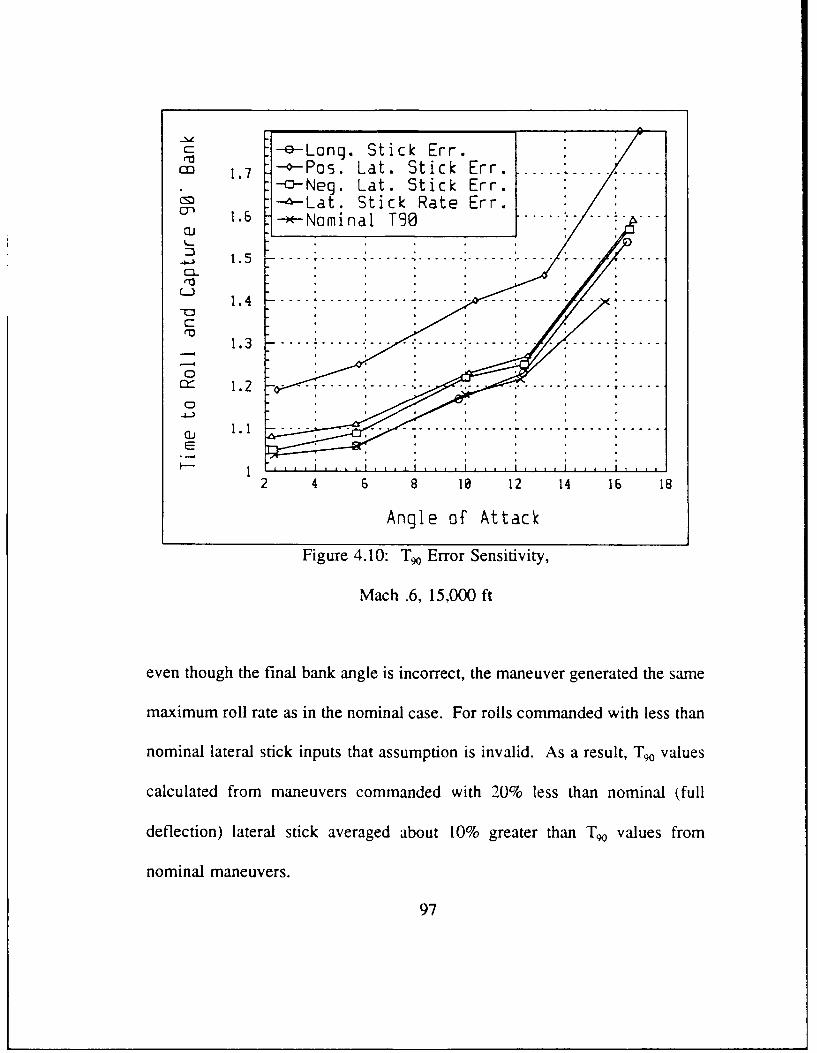
-e-Long. Stick Err.1.7 ---Pos. Lat. Stick Err .. .......--- Neg. Lat. Stick Err.
)-a-Lat. Stick Rate Err._o 1.6 -- Nominal T90
C
1 . ............. .i......... ---/ -----S 1 .4 .. . . . . . . .
ra
0 rr 1.2
1 I.E-
2 4 6 8 10 12 14 16 18
Angle of Attack
Figure 4.10: Tgo Error Sensitivity,
Mach .6, 15,000 ft
even though the final bank angle is incorrect, the maneuver generated the same
maximum roll rate as in the nominal case. For rolls commanded with less than
nominal lateral stick inputs that assumption is invalid. As a result, T90 values
calculated from maneuvers commanded with 20% less than nominal (full
deflection) lateral stick averaged about 10% greater than T9 values from
nominal maneuvers.
97

0
) 1-1.2 Sti.k .... rrrnJ
I-
re ... . .:...... :..... ...... •. . .
Se Long. Stick Err.Figure 4Pos. Lat. Stick Err.
o o t.8 directin.of.te.roll -Ses tot-Neg. Lat. Stick Errf-- )-&-Lat. Stick Rate Err .
E Nomi nal T90
0 2 4 6 8 10 12 14 16
Angle of Attack
Figure 4. 11: T90 Error Sensitivity,
Mach .7, 15,000 ft
As shown in Figure 3.27, the loaded roll maneuvers studied here are
completed by stopping the roll rate with a brief application of full lateral stick
opposite to the direction of the roll. Sensitivity to this opposite stick deflection
was evaluated by reducing the peak of the opposite stick input by 20% while
leaving its starting and stopping time unchanged. As expected, this resulted in
98

a-- --.- - --........ .. .. ... ... ... .. .. ... ...
C
S............... .
4-A
ra
_ .g5 ... . -e-Long. Stick Err .
rrPos. Lat. Stick Err.4- 0. .... -- Neg. Lat. Stick Err.
-.--Lat. Stick Rate Err.-&Nominal T50
1 2 3 4 5 6 7 8 9 1 1
Angle of Attack
Figure 4.12: Tgo Error Sensitivity,
Mach .8, 15,000 ft
a captured bank angle greater than the nominal 90. Over the same test points
used in the preceding paragraph, the captured bank angle exceeded 90' by an
average of 13'. This error in opposite stick deflection produced a smaller roll
angle deviation than the error in positive stick deflection described in the
preceding paragraph because opposite stick is applied for a briefer period of
99

time than positive lateral stick. Also, because the maximum roll rates
experienced here are the same as in the nominal cases (since the initial roll
commands are the same), the data reduction algorithm was able to accurately
correct for the error in final bank angle. The calculated Tgo values varied from
those of the nominal maneuvers by less than 2% across all cases.
Finally, the rate at which the test pilot applies lateral stick movements
could deviate from that directed by his steering cues even while the maximum
stick deflections and times between stick movements match the cues exactly.
The sensitivity of the Tg. metric to this error was investigated by reducing by
half the rate at which lateral stick commands were applied during loaded roll
maneuvers at 15,000 feet altitude. While this change resulted in the captured
bank angle being smaller than the nominal 900, the data reduction algorithm
largely corrected for this difference as it did for other error types described
earlier in this section. Specifically, reducing the lateral stick rate by 50% for
each of the test cases at 15,000 feet changed the values of the Tgo metric by an
average of only 3.%.
In summary, the T90 agility metric is not overly sensitive to inaccuracies
that may be introduced as the pilot follows steering cues designed to replicate
nominal loaded roll maneuvers. As long as the roll is initiated with full lateral
stick deflection, the data reduction algorithm successfully normalizes the
too
maneuver to a 900 bank angle change and thereby compensates for error
introduced as the pilot tracks the subsequent steering cues. However, when the
roll is initiated with a maximum lateral stick deflection less than that directed
by the steering cue, the data reduction scheme normalizes the maneuver with
a lower maximum roll rate and produces T90 results significantly different then
that obtained from the nominal maneuver.
101

4.4 Instrumentation for Agility Flight Testing
The motivation for the development of new metrics is to measure facets
of aircraft capability that have not previously been emphasized. Since current
flight test instrumentation has been designed to support the traditional measures
of merit, there has been some doubt about quantifying the new agility ideas
during flight test. Much of this concern stems from early attempts to define
agility as an entirely new phenomena with terms relating to the second
derivatives of linear and angular velocities (Reference 2, 5, 12). However,
specific agility metrics have been based (see Figure 2.1 and Appendix B) on
useful, measurable capability rather than on theoretical definitions. As a result,
almost all of the published metrics rely on physical quantities that are readily
available from standard flight test instrumentation.
Flight testing axial agility metrics described in Section 3.1 would require
measurement of Mach, altitude, net axial force, time, throttle position and fuel
flow (to obtain aircraft weight). Specific excess power is then easily calculated
and the power onset and power loss parameters follow immediately.
Several ways to quantify pitch agility are presented in Section 3.2. The
time to maximum g and time to unload metrics have the advantage of being
easily evaluated with standard flight test instrumentation. Mach, altitude, stick
position and load factor (or normal acceleration) time histories are the only data
102

required. Pitch rate and angle of attack measurements are also available from
normal flight test instrumentation such as that on NASA Dryden's F-18 HARV.
The time derivative of load factor is not directly measurable so load factor rate
metrics would require data differencing and smoothing algorithms. In fact, the
onset of buffet during flight test will likely prevent the extraction of useful load
factor rate data entirely. The ability to extract load factor rate from flight test
data is a future research topic.
Lateral agility, quantified with the Tgo metric, also relies only on
currently available measurements. Mach, altitude, time, stick position, angle of
attack and bank angle are the required quantities.
103

5. PROJECT HISTORY AND MANAGEMENT
5.1 Project Planning and Proposal Phase
The initial focus and motivation for this project stemmed from a meeting
at the NASA Dryden Flight Research Center during November, 1988 between
Dr. Downing and Mr. Liefer representing the Kansas University Flight Research
Laboratory and members of Dryden's Flight Technology Group headed by Mr.
Joe Gera. As a result of that meeting a proposal was submitted to the NASA
Ames-Dryden Research Facility in December 1988. That proposal is attached
here as Appendix C.
The intent of all parties involved was to use this initial effort to establish
an ongoing, multi-year research relationship between the University of Kansas
Aerospace Engineering Department and NASA Dryden. To support this goal,
the December 1988 proposal included technical tasks and budget requirements
for a two phase effort, each phase being one year long. The proposal outlined
the following tasks for each phase:
1. Phase I
A. Conduct literature search.
B. Propose candidate set of metrics for detailed study.
C. Define sensor requirements for agility flight testing.
D. Define flight test techniques and pilot cues.
104

2. Phase II
A. Specialize test techniques to NASA vehicle.
B. Develop agility flight test data analysis codes.
C. Quantify agility enhancing design characteristics.
D. Propose pilot rating methods for agility flight tests.
E. Collect, reduce and analyze flight test data.
F. Compare flight test and analytic results.
The original program schedule is presented in Figure 5.1
A key feature of this proposed effort was the presence of a University
of Kansas intern at Dryden during Phase II. This individual would work on the
project at the University during Phase I and then complete his or her Masters
Degree thesis requirements while at Dryden during Phase II. The long term
goal called for another student to become involved in the project at the
University during Phase II and then rotate to Dryden as an intern during the
following year.
The proposal phase was successfully concluded by the award of NASA
Cooperative Agreement number NCC 2-588 for $67,272 to fund the Phase I
effort. The Phase II proposal and budget were also approved at that point
contingent upon the availability of funds. The Agreement was awarded in
February 1989 and back dated to I January 1989.
105

Task Schedule88 1989 1990
TASKS DjF MAMJJAS0NDJFMAMJ
Proposal Submitted V I IContract Award
Literature Search
Kick Off Meeting
Simulation Development jSimulation Documentation
Metric Collection and I i _ _Classification
AFFDL AGILITY REVIEW IPitch Agility Study I ILateral Agility Study [ -' _
Axial Agility Study
Midterm Review I i1 iL '
Lateral Sensitivity Study IPitch Sensitivity Study J
Report Preparation,[117
Final Defense ,+ 1
Figure 5.1: Task Schedule
106

A Phase I Progress Report and updated funding request for Phase II was
submitted to NASA in November 1989. With NASA's consent of a no cost
extension, Phase I of the project was continued until 31 January, 1990. The
Phase II funding request was approved and Phase II began on 1 February, 1990.
5.2 Project Team and Responsibilities
The project team and the University of Kansas consisted, during Phase
I, of Dr. David Downing, the principle investigator, Mr. Randy Liefer, the
program manager and two graduate research assistants, Mr. John Valasek and
Mr. David Eggold. A project organization chart is shown in Figure 5.2.
5.2.1 Technical
Mr. Liefer's technical responsibilities included the collection and
qualitative analysis of the various proposed agility metrics. He performed the
simulation studies necessary to evaluate agility metrics associated with aircraft
pitch capability. He was also responsible for the study of pilot cuing methods
and the sensitivity of agility metrics to deviations in pilot commands.
Mr. Valasek was the engineer most responsible for hosting the F-18
HARV simulation on the University computers (with significant contribution
from Mr. Eggold) and he contributed the major portions of the program
107

Z HzUi~
0> 2
H-. LL
a4-
zz
108

documentation and users manual that make up Appendix C of this report.
Because no documentation for the simulation was available from NASA
Dryden, Mr. Valasek authored the detailed documentation presented m
Reference 46. Finally, he was the lead in conducting the simulation evaluation
of the axial agility metrics.
Mr. Eggold assisted in developing the simulation tools at the University
and was the primary engineer responsible for the lateral agility metrics. In
January 1990, he began a one year internship at Edwards AFB where he will
support agility research at the NASA Dyrden Flight Research Center.
5.2.2 Supervisory
The supervisory and management responsibilities of Mr. Liefer included
1. Program planning and direction
2. Coordination with the NASA Dryden Flight Research Center
and the Air Force Flight Dynamics Laboratory
3. Budget control
4. Supervision of graduate research assistants.
109

6. SUMMARY
Fighter agility has been defined in this report to encompass transient
capabilities within the conventional flight envelope that are not emphasized in
the traditional approach to fighter performance and maneuverability. Functional
metrics which consist of longer term flight segments connected by periods of
linear acceleration or nearly constant rate turns do not focus on transient agility
and are not analyzed here. Transient capabilities outside the conventional flight
envelope are popularly called supermaneuverability and are also not studied
here.
A number of researchers have proposed new metrics to quantify agility.
Each proposed metric is briefly presented in the text and discussed in detail in
Appendix B. Within the restricted definition of agility described above, only
a few of the proposed metrics are actually found to be measures of transient
agility. Others focus on longer time scale maneuvers. They are more closely
related to steady state performance and reflect new ways to measure that
capability rather than transient agility. These performance oriented metrics,
called functional metrics in Chapter Two, are not analyzed in this rcport.
The remaining transient agility metrics are further classified in Chapter
Two according to the primary type of aircraft motion involved. Axial agility
110

deals with the ability to quickly change specific excess power levels. Axial
agility metrics, studied in Chapter 3.1, are driven by the transient performance
of the engine and drag producing devices.
Pich agility measures the ability of the aircraft to quickly initiate
symmetric pitching maneuvers. Requirements for the magnitude and
controllability of such maneuvers are contained in the flying qualities standard
and supporting handbook. Several metrics suggested to measure this transient
capability include time to maximum load factor, time rate of change of load
factor and maximum pitch rate. A key contribution of several agility
researchers has been the recognition that both nose up and nose down pitch
agility is important. In Chapter 3.2, each of the proposed pitch agility metrics
is quantified in both the nose up and nose down direction.
Lateral agility concerns the ability to perform precise rolling maneuvers
at elevated angles of attack. Lateral agility metrics emphasize the need for
controlled rolling maneuvers by measuring the time to roll to and capture a
given bank angle change. Ninety degree bank angle changes have been
proposed in the literature and are studied in Chapter 3.3.
Flight testing agility will involve the use of transient maneuvers that are
not now a part of standard flight test technique. Successful test will depend on
the ability of the pilot to fly the maneuvers accurately and repeatably. A
III

method of relaying steering cues to the pilot has been developed at NASA and
will be used to support agility flight tests. Since the pitch and lateral agility
metric requires the most complex pilot inputs, the sensitivity of those metrics
to errors in following the steering cues was studied in Chapter 4.
6.1 Conclusions
1. Agility continues to be discussed and analyzed without the benefit of
a commonly accepted definition. Transient agility metrics studied in this report
offer ways to assess kinds of fighter capability that are not well quantified by
traditional measures of merit. Functional agility metrics deal with longer term
maneuvers and offer little insight that cannot already be gained with the
traditional performance measures.
2. The power onset parameter, power loss parameter, nose up pitch rate,
nose down pitch rate and the Tgo parameter together form a simple set of agility
metrics that encompass the kinds of fighter capability generally grouped under
the term agility.
112

3. Two alternatives to pitch rate for measuring pitch agility have been
published and are evaluated in this report. The metric consisting of time to
maximum load factor and time to unload to zero load factor is not
recommended since misleading values sometimes occur due to variations in the
maximum load factor achievable at different flight conditions (see Section 3.2).
Maximum positive and negative load factor rates are also not recommended as
useful agility metrics since their values cannot be extracted from flight test
results with any confidence using current instrumentation and analysis
techniques (see recommendations).
4. Each of the recommended agility metrics listed above may be
evaluated via flight test with no requirement for instrumentation or sensors not
now available on the F-18 HARV aircraft.
5. None of the published pitch agility metrics, time to maximum load
factor, load factor rate and pitch rate, are overly sensitive to errors in following
steering cues relayed through the ADI steering needles. Nose up pitch rate is
the most sensitive of the metrics. A 20% deviation in aft stick command causes
a 10 to 15 degree per second reduction in that metric at lower air speeds. The
113
load factor rate metric in either the nose up or nose down direction is virtually
unaffected by the pilot input errors studied in this report.
6. The T90 metric is also not excessively sensitive to errors in following
steering cues relayed through the ADI steering needles. The effects of
deviating from the nominal stick inputs were largely corrected by the data
reduction algorithm discussed in Section 3.3. Errors in lateral stick
displacement of 20% caused Tgo values to change on the average by 10%.
Erroneous longitudinal stick motion during the T90 maneuvers and changes in
the stick deflection rates produced variations in Tgo of less than 5%.
114

6.2 Recommendations for Further Research
1. Agility has been quantified here for one aircraft, the F-18. A
necessary next step is to apply the same metrics and test methods to study the
agility of other fighter aircraft. The relative agility of various aircraft can be
studied via simulation at the University of Kansas and by flight test at NASA
Dryden. Methods of graphically displaying different agility levels similar to the
differential Ps plots shown in Section 2 should be explored. To confirm that
agility is a useful concept, the differences in levels of agility must then be
correlated with the experiences of the pilots who employ the aircraft in
operational air-to-air and air-to-ground missions.
2. If agility is an important attribute for future aircraft then the links
between agility and aircraft configuration design should be explored. The F-18
simulation should be expanded to generate linear models of the airframe at
trimmed and transient flight conditions. Linear flight control models are also
needed in transfer function or state space form. These models could then be
used to quantify relationships between agility, as defined by the metrics studied
in this report, to aircraft and control system design parameters, e.g. control
power, wing loading, inertias, time constants, and actuator rates.
115

3. The links between agility and flying qualities should be established.
Thanks to decades of research, much is known about the damping ratios, time
constants and frequencies that are associated w*14 " good flying qualities. Pilot
rating scales similar to the Cooper-Harper system are needed to determine how
much agility is desirable. If agility can be tied to pilot approval, then the
relationships and conflicts between good flying qualities and good agility may
be discovered.
4. Because of the proprietary restrictions placed on reports containing
complete derivations and developments of Dr. Herbst's agility metrics, those
metrics are not evaluated here. If Dr. Herbst's work cannot be evaluated at the
University of Kansas, then it should be reviewed by Mr. Eggold at NASA
Dryden.
5. Load factor rate would be a useful pitch agility metric if that data
could be extracted from flight test results with sufficient reliability. Optimal
estimation methods should be explored as a possible approach to getting useful
load factor rate data from current flight test instruments.
116

7. REFERENCES
1. Dorn, Matthew (USAF). The Science of Aircraft Agility: A Frameworkfor Classification and Exploration," presented at the AIAA AerospaceEngineering Conference and Show, Feb 89.
2. Dom, Matthew (USAF). "Aircraft Agility: The Science and theOpportunities," presented at the AIAA Aircraft, Design Systems and OpsMeeting, Aug 89.
3. Herbst, W.B. (MBB). "Dynamics of Air Combat," Journal of Aircraft,Vol. 20, No. 7, July 83, pp 594-598.
4. Herbst, W.B. (MBB). "Supermaneuverability," Presented at the JointAutomatic Control Conference, June 81.
5. Herbst, W.B. (MBB). "Future Fighter Technologies," AIAA Journal ofAircraft, Vol. 17, No.8, Aug 80, AIAA #80-4077.
6. McAtee, T.P. (GD). "Agility - Its Nature and Needs in the 1990's,"presented at the Society of Experimental Test Pilots Symposium, Sept87.
7. McAtee, T.P. (GD). "Agility in Demaad," Aerospace America, May 88.
8. Skow, A.M. and Hamilton, W.L. (Eidetics). "Advanced Fighter AgilityMetrics," Eidetics Report 84-05 for AFFDL, Sept 84.
9. Skow, A.M. and others (Eidetics). "Transient Agility Enhancements forTactical Aircraft," Eidetics TR-89-001, done for ASD contract #F33657-87-C-2045, Jan 89.
10. Tamrat, B.F. "Fighter Aircraft Agility Assessment Concepts and TheirImplication on Future Agile Fighter Design," AIAA Aircraft Design,Systems and Ops Meeting, Sept 88, AIAA #88-4400.
117

11. Foltyn, R.W. and others (Eidetics). "Development of Innovative AirCombat Measures of Merit for Supermaneuverable Fighters," AFWAL-TR-87-3073.
12. Herbst, W.B. (MBB). "X-31A," presented at NAECON 87, SAE#871346.
13. Herbst, W.B. (MBB). "Future Fighter Maneuverability for AirCombat," presented at the AIAA Design, Systems and Ops Meeting, Oct83.
14. Ray, B.S. and Cord, T.J. "Supermaneuverability and Flying QualitiesIssues," presented at the 1986 IEEE National Aerospace ElectronicsConference (NAECON).
15. Sweetman, B. "X-31, Through the Grape Barrier," Interavia, May 87.
16. Brown P.T. ar others (USAF). "T-38A/F-16B Agility MetricsEvaluatic . gile Lightning)," USAF Test Pilots School TR-87A-S04,Dec 8".
17. S, ott, W.B. (Av Week). "Air Force, NASA Conduct Test to DefineFighter Aircraft Agility," 9 Jan 89.
18. Chin, J. (Grumman). "X-29A Flight Control System PerformanceDuring Flight Test," presented at the AIAA Aircraft Design, Systemsand Ops Meeting, Sept 87, AIAA #87-2878.
19. Trippensee, G.A. and Lux, D.P. (NASA). "X-29A Forward-Swept-WingFlight Research Program Status," NAECON 87, SAE #782418.
20. Foltyn, R.W. and others (Eidetics). "Innovative Cockpit Display andCuing Systems for Operation in an Extended Flight Envelope," NASA-TR-87-215.
21. Beaufrere, Henry. "Integrated Flight Control System Design for FighterAircraft Agility," presented at the Aircraft Design, Systems and OpsMeeting, Sept 88, AIAA #88-4503.
118

22. Riley, Dave and Drajeske, Mark (McAir). "An ExperimentalInvestigation of Torsional Agility in Air-to-Air Combat," presented at theAIAA Atmospheric Flight Mechanics Conference, Aug 89, AIAA #89-3388.
23. Wendel,T.R. (McAir). "Flight Control Synthesis to Meet FlyingQualities Specifications: An Evaluation of Multivariable SynthesisTechniques," AIAA Aircraft Design, Systems and Ops Meeting, Sept 87,AIAA #87-2880.
24. Kalviste, Juri (Northrop). "Spherical Mapping and Analysis of AircraftAngles for Maneuvering Flight," AIAA Journal of Aircraft, Vol. 24, No.8, Aug 87.
25. Kalviste, Juri (Northrop). "Roll Reversal Agility Parameter," AFFDLAircraft Agility Workshop Summary Booklet, Aug 89.
26. Bitten, Robert (Rockwell). "Qualitative and Quantitative Comparison ofGovernment and Industry Agility Metrics," presented at AIAA FlightMechanics Conference, Aug 89.
27. Jane's All the World's Aircraft, Janes Publishing, 1985.
28. Nicolai, L.M. Fundamentals of Aircraft Design, University of DaytonSchool of Engineering, 1985.
29. Anon. USAF Test Pilot School Performance Phase Textbook, USAF-TPS-CUR-86-01, April 1986.
30. Spearman, M.L. (NASA). "Some Fighter Aircraft Trends," presentedat the AIAA Aircraft Design, Systems and Ops Meeting, Nov 84, AIAA#84-2503.
31. Gilbert, W.P. "Overview of NASA High-Alpha Technology Program(HAPT)," presented at the High Alpha Technology Program Workshop,Nov 89.
32. Twisdale, T. and Franklin D. "Tracking Task Techniques for Handling
Qalities Evaluations," AFFTC-TD-75-1, May 75.
119

33. Cord, Tom J. (AFFDL). "A Standard Evaluation Maneuver Set forAgility and the Extended Flight Envelope - An Extension to HQDT,"presented at the AIAA Atmospheric Flight Mechanics Conference, Aug89, AIAA #89-3357.
34. Anon. USAF Test Pilot School Flying Qualities Textbook, USAF-TPS-CU-86-03, April 1986.
35. Anderson, John (USAF). "Agile Fighter Aircraft Simulation," AIAA#89-0015.
36. Walker, H.C. (USAF). AFFTC Agility Flight Test Committee MeetingMinutes, June 1987.
37. Military Specification, Flying Qualitities of Piloted Airplanes, MIL-F-8785-C, Novemever, 1980.
38. Shaw, Robert L. Fighter Combat, Tactics and Maneuvering. UnitedStates Naval Institute Press, 1985.
39. Rutowski, E.S. "Energy Approach to the General Aircraft PerformanceProblem," Journal of Aeronautical Science, Vol. 21, No.3, March 1954,pp. 187-195.
40. Lan, C.E. and Roskam, J. Airplane Aerodynamics and Performance,Roskarn Aviation and Engineering, 1980.
41. Chin, Hubert H. (Grumman). "A Knowledge Based System forSupermaneuver Selection for Pilot Aiding," presented at the AIAAAircraft Design, Systems and Ops Meeting, Sept 88, AIAA #88-4442.
42. Stubben, Mark (USAF). "A Pilot's Perspective of the Advanced FighterTechnology Integration Automated Maneuvering Attack System,"NAECON 87, SAE #871349.
43. Dowden, D.J. (USAF) and Bessette, D.E. (NASA). "Advanced FighterTechnology Integration (AFTI/F-16) Automated Maneuvering AttackSystem Final Flight Test Results," presented at NAECON 87, SAE#871348.
120

44. Linn, D. F-18 Hornet in Detail and Scale, Tab Books, 1982.
45. Moomaw, R.F., Trame, L.W., Hess, R.K. F/A-18 flight control systemDesign Report. McDonnell-Douglas Report MDC A1713, June 1984.
46. Valasek, J. SIM-II F-18 Flight Simulation Program Documentation.KU-FRL-831-1, August, 1990 (projected).
121

Appendix A: Specific Excess Power (Ps)
Over the last fifteen years energy maneuverbility has been the primary
tool for comparing fighter performance. The unit of measurement for this
comparison is Specific Excess Power or P. In this appendix the equations for
P. are derived from first principles.
The energy approach to aircraft performance was originally developed
by Rutowski in the mid 1950's (Reference 39). The derivation here generally
follows that presented in Reference 29. In its most basic form the following
assumptions are made
1. Configuration is fixed.
2. Weight is constant.
3. Load factor is constant.
4. Thrust level is fixed.
5. Kinetic and potential energy can be exchanged instantly and with no
losses.
122

The total energy of an aircraft is the sum of its kinetic and potential
energy and can be written as
E = mgh. MV (A.1)2
Normalizing with aircraft weight gives specific energy,
V 2
ES= - +- h (A.2)2g
An expression for the rate of change of this specific energy is found by
differentiating equation A.2 with respect to time.
dEs V dV +dh(A3- 4- (A.3)dt gdt dt
Summing forces along the flight path of an aircraft in accelerated
climbing flight (Figure A.1) gives
w dVg T cos(a -4 T) - D - W siny (A.4)g dt
123

THRUST T
LJFT
DRAG D
W/EICHT W d
Figure A. 1: Flight Path Geometry for Airplane
in Accelerated Climb (Reference 40)
Multiplying equation A.4 by V, dividing by W and recognizing that
v sin d - (45)dt
gives
124

V dV dh V (T cos(c - OT) - D)
g dt dt W
Therefore,
dE = V (T cos(a - 40T) -D)
dt W
Since thrust times velocity is power, dEjdt is usually called specific
excess power, P. so
P 6dEI& (A.8)dt
125

Appendix B: Published Agility Metrics
Though numerous papers have discussed the need for new ways of
measuring fighter agility characteristics, relatively few authors have actually
proposed new metrics that could be used to develop a quantitative measure of
agility. The agility metrics that have been published deal with many different
aspects of fighter capability. What follows is a brief definition and discussion
of each of the agility metrics found in the literature.
I. Metric Name: Pitch Agility
Proposedq~y: Eidetics ("Transient Agility Enhancements for Tactical Aircraft,"
Eidetics TR-89-001, ASD contract F33657-87-C-2045, Reference 9.)
Definition: (Time to pitch from one g to maximum CL or n,) + (Time to pitch
down from maximum CL or n, to zero g)
Discussion: The authors of the Eidetics report observed that both nose up and
nose down pitch agility are important. However, a number of questions
about pitch agility remain are not addressed in the Eidetics report.
126

1. If the times associated with nose up and nose down pitch
maneuvers are to be summed, should the two be equally
weighted?
2. Is the time to pitch up significantly different than the time to
pitch down?
3. Does an aircraft with better positive pitch agility necessarily
have better negative pitch agility?
Since these questions remain to be resolved by flight testers, engineers
and fighter pilots, values associated with positive pitch maneuvers and
those associated with nose down pitching are treated as separate metrics
through out this report rather than summed into a single figure of merit.
Though the time to achieve maximum load factor and the time to
unload to zero nz are conceptually simple, several difficulties arise when
these metrics are evaluated with realistic aircraft models. While it is
easy to initiate the pitch up from steady level flight conditions, the pitch
down from maximum nZ may start from a condition where airspeed and
altitude are rapidly changing. If pitch agility is to be plotted against
flight condition, the choice of flight condition may often be somewhat
arbitrary.
127

Also, because of flight control and aerodynamic nonlinearities, the
load factor response will often not be well damped. Determining time
to maximum load factor is often subjective when no steady state value
is reached or the maximum value is approached asymptotically.
128

II. Metric Name: Lateral Agility. T90
Proposed by: Eidetics ("Transient Agility Enhancements for Tactical Aircraft,"
Eidetics TR-89-001, ASD contract F33657-87-C-2045, Reference 9).
Definition: Time to roll 900 and stop while maintaining angle of attack. This
metric is a function of Mach, altitude and load factor or angle of attack.
Discussion: Many fighters possess very limited ability to roll quickly at high
angles of attack. How (or should) this maneuver be compared to the
more common technique of unloading first, then rolling at one or zero
g and then pitching to reestablish the initial angle of attack? The
unload-roll-load method is probably faster especially for high angle of
attack conditions. Using the loaded roll method, i.e. holding angle of
attack during the roll, the aircraft heading angle is changed during the
rolling maneuver. However, with the unloaded roll method the aircraft
orientation is changed but the heading angle is not rotated since the roll
is accomplished while unloaded. The opinion of Eidetics and others is
that the loaded roll is important since it measures the ability of the
aircraft to maneuver at high angles of attack even though it is not as
commonly used by current fighters engaged in air combat maneuvering
(Reference 38).
129

Several loaded roll maneuvers could be used to test for the Tgo metric.
Options are to (1) start with wings level, pull to target load factor (or
angle of attack) and then apply lateral stick and roll to 90, or (2) first
roll to 90, pull to the target load factor and then roll to wings level, or
(3) roll to 450, pull to target load factor and then roll to opposite bank
angle. The first method is easiest to simulate. The second is probably
the easiest to fly since the pilot can use the horizon to judge the target
roll angle. Preliminary flight test (Reference 16) used the third method
and found that it was hard for the pilot to hit and hold the target load
factor during the maneuver. Pilots also had to balance fast roll rate
against the ability to stop at the target bank angle. Individual pilots
produced greatly different results because they often did not use the
aircraft's maximum roll rate capability. Manned simulation or flight test
may be required to determine which method is easiest to test and most
meaningful to tactical (as opposed to test) pilot.
An alternate metric is the time to roll 180" instead of 90" while
holding angle of attack. This metric may be more representative of
actual tactics than Tgo. T 80 is also a more demanding test of the flight
control system since the build up of adverse yaw will be more
pronounced over the longer maneuver.
130

The only related MIL SPEC concerning the roll axis is the
requirement that deals with rolls through 90' or 180' at a load factor of
one and at a single loaded condition. There is no requirement stop at a
target bank angle (Reference 37).
131

III. Metric Name: Torsional A2ility, TR/T, (TR = turn rate)
Proposed by: Eidetics ("Transient Agility Enhancements for Tactical Aircraft,"
Eidetics TR-89-001, ASD contract F33657-87-C-2045, Reference 9).
Definition: Turn rate divided by the lateral agility metric, Tgo, as defined for
the lateral agility metric. Resulting units are degrees per sec2.
Discussion: This metric would be calculated from the same flight test results
used to obtain T9o data so all the issues associated with that metric apply
here also. Turn rate is not measured directly during the flight test but
is calculated from test results based on airspeed and load factor as
2
When these quantities change during the rolling maneuver the choice of
which speed and load factor to use in calculating turn rate is unresolved.
This metric indicates that turn rate and T90 are equally critical to
agility. For example, an aircraft with twice the normal acceleration for
a given angle of attack and airspeed is exactly as torsionally agile as one
132

with half the Tg. at the same conditions. This one-to-one ratio is
arbitrary and unsupported (in fact, it is contradicted by the Eidetics
report cited above). As a result this metric seems of little practical use
to a pilot or designer.
133

IV.Metric Name: Axial Agility
Proposed by: Eidetics ("Transient Agility Enhancements for Tactical Aircraft,"
Eidetics TR-89-001, ASD contract F33657-87-C-2045, Reference 9.)
Definition: The difference between the aircraft's Ps in its maximum thrust,
minimum drag configuration and its Ps in the minimum thrust, maximum
drag configuration, Al., divided by the time required to transition
between these two configuration, At. This time increment is affected by
engine spool time, speed brake deployment time and thrust reversers, if
any. Transition from minimum to maximum power is called the power
onset parameter and transition from maximum to minimum power is
termed the power loss parameter.
Discussion: The time increment At is probably driven by engine spool time
since the time constants associated with speed brake deflection and thrust
reversers will be smaller. The axial agility of a fighter is also affected
by the engine's transient performance at elevated angles of attack and
sideslip. The transient behavior of the engine during large scale
maneuvers and high angle of attack flight is an important contributor to
overall combat effectiveness. The power onset and power loss
parameters do not address this aspect of engine performance.
134

V. Metric Name: Relative Energy State, (V/V c)
Proposed by: B.F. Tamrat (Northrop, "Fighter Agility Assessnent C -.-.uepts and
Their Implications on Future Agile Fighter Design," AIAA #88-4400,
Aircraft Systems, Design and Operations Meeting, Sept 88, Reference
10.)
Definition: The ratio of the aircraft's speed to its corner speed at completion
of a 180 turn at maximum g from a given starting position (altitude and
airspeed). This ratio, V/V c , should be as close to 1.0 as possible.
25500 KIAS. 15 kft .
9q] TURN
20 ;
0.5
o ,I1I I0 40 30 120 :60 200
AIRCRAFT HEAOING (deql
Figure B.1: Relative Energy State
135

Discussion: This parameter neglects the turn rate associated with each
configuration and thus the time required to complete the 180' turn.
Relative energy state is a performance parameter driven solely by thrust
and drag characteristics and not a transient agility nietric.
136

VI. Metric Name: Combat Cycle Time
Proposed by: B.F. Tarnrat (Northrop, "Fighter Agility Assessment Concepts and
Their Implications on Future Agile Fighter Design," AIAA #88-4400,
Aircraft Systems, Design and Operations Meeting, Sept 88, Reference
10.)
Definition: t, + th + t22 + t3 + t4 where:
t = time to pitch from one g to the limit load factor
t + t2 = time to turn to a specified new heading angle at maximum
load factor
t3 = time to unload the aircraft to a load factor of one (or zero)
t = time to accelerate to the original energy- level
Discussion: This metric would be calculated for a given set of starting
conditions and some specified heading angle change. It is not clear from
Tamrat's paper whether he intends for the aircraft to be at the same
Mach and altitude at the end of the combat cycle or only to have the
same total energy.
137

Times tj and t are probably negligible relative to the others so
this parameter is dominated by turn rate and Ps. As a result, it also a
performance rather than agility metric.
000 v
Figure B.2: Concept of Combat Cycle Time
138

VII. Metric Name: Pointing Martin
Proposed by: B.F. Tamrat (Northrop, "Fighter Agility Assessment Concepts and
Their Implications on Future Agile Fighter Design," AIAA #88-4400,
Aircraft Systems, Design and Operations Meeting, Sept 88, Reference
10.)
Definition: The angle between the nose of the adversary and the line of sight
at the instant the friendly fighter is aligned with the line of sight.
/NPOINTING MARGIN
7(PMI
I7.2L INE OF T
6.0 AOVERSARY 1N tY 60FIGHTER FIGHTE
\ sc J
Figure B.3: Definition of Pointing Margin
139

Discussion: This metric requires the definition of some standard adversary turn
performance (load factor, speed loss, altitude change, etc). Tamrat's
paper implies that both aircraft are to be constrained to a single
maneuver plane. This metric incorporates the effects of pitch rate, thrust
and drag transient characteristics but long term performance (7 - 10
seconds) will have a greater impact than transient agility. The same
aircraft capabilities could be assessed by measuring the time to reverse
heading by 1800.
140

V111. Metric Name: Dynamic Speed Turns
Proposed by: T.P. McAtee, (General Dynamics, "Agility - Its Nature and Need
in the 1990's," Society of Experimental Test Pilots Symposium, Sept 87
and "Agility in Demand," Aerospace America, May 88, Reference 6, 7.)
Definition: The Dynamic Speed Turn is not actually a new metric but a plot
of Ps against maximum turn rate at a given starting airspeed. The
objective is to clearly show bleed rate for maximum acceleration turns
and the straight and level acceleration capability at various airspeeds.
-' 2 ¢ - ---20 40
____
_I -_
'* '
10 20 30 40 SO to 200 300 400 5 00LEED RATE KTISEC VELOTY KT
Figure B.4: Dynamic Speed Turn Plots
141

IX. Metric Name: Agility Potential and Maneuvering Potential
Proposed by: Spearman (NASA Langley, "Some Fighter Aircraft Trends,"
AIAA #84-2503, Aircraft systems, Design and Operations Meeting, Oct
84, Reference 30.)
Definition: Agility potential is the aircraft's maximum thrust to weight ratio
divided by its wing loading. The maneuvering potential is not explicitly
defined in the referenced paper but is referred to only as a function of
the thrust to weight ratio, the lift to drag ratio, the maximum lift
coefficient and wing loading.
Discussion: These two parameters relate aircraft size and configuration to
agility using traditional measures of merit, wing loading and thrust to
weight ratio. They do not address the flight control characteristics, high
angle of attack capability or body rate controllability. They are not
intended to address transient aircraft agility.
142
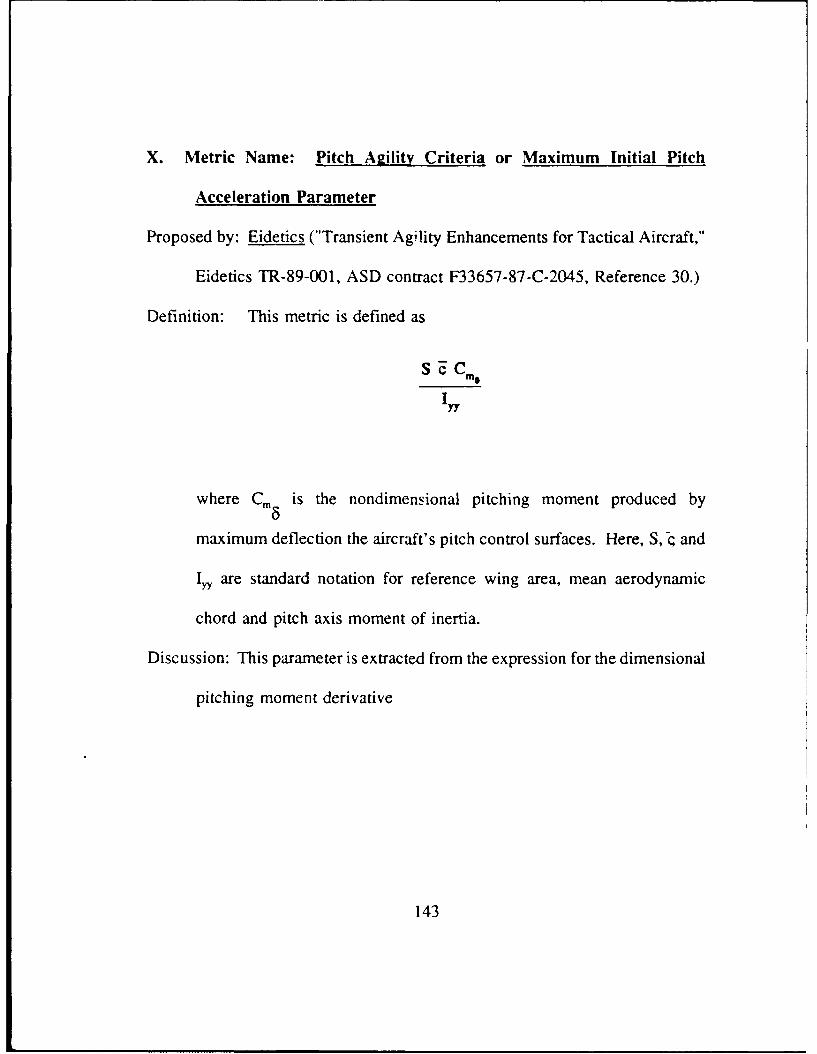
X. Metric Name: Pitch Apility Criteria or Maximum Initial Pitch
Acceleration Parameter
Proposed by: Eidetics ("Transient Agility Enhancements for Tactical Aircraft,"
Eidetics TR-89-001, ASD contract F33657-87-C-2045, Reference 30.)
Definition: This metric is defined as
S C Cm&
I"y
where Cm 5 is the nondimensional pitching moment produced by
maximum deflection the aircraft's pitch control surfaces. Here, S, C and
I. are standard notation for reference wing area, mean aerodynamic
chord and pitch axis moment of inertia.
Discussion: This parameter is extracted from the expression for the dimensional
pitching moment derivative
143

M& S z Cm (B.2)
and is a measure of the airframe's potential to generate pitch
acceleration. It can be calculated directly from aerodynamic coefficients
and configuration data but does not reflect any flight control system
limits. Though the authors of the Eidetics report address only the Pitch
Agility Criteria, their ideas could be easily extended to a Roll Agility
Criteria.
La -- SbI (B.3)
where C, is the nondimensional rolling moment produced by maximum
deflection of the aircraft's roll control surfaces and b is a reference
144

length. Then, the Roll Agility Criteria would be
Sb ,
both of these parameters then have units of feet per slug.
145

XI. Metric Name: Roll Reversal Agility Parameter
Proposed by: Juri Kalviste (Northrop, presented at the Flight Dynamics
Laboratory's Aircraft Agility Workshop, Aug 1989.)
Definition:
RoU Reversal Parameter = (T)(Y) (B.4)
Where T is the time to reverse a turn of some given acceleration to the
opposite direction and Y is the cross range displacement that occurs from
when the reversal is initiated to when the acceleration in the opposite
direction is achieved. Smaller values for this parameter reflect a more
agile aircraft.
Discussion: The parameter would be based on reversing a level turn of a given
load factor or on reversing from +90 to -90' of bank also at some given
normal acceleration level. The metric implies that the pilot would hold
the aircraft at the given load factor while reversing the turn. If he is
allowed to unload first and then change bank angle before reloading to
the entry load factor, the cross range distance, Y, becomes nearly zero
and the roll reversal parameter becomes very small.
146

Cross range distance, Y, is a function of the aircraft's normal
acceleration during the roll.Since turn radius is inversely proportional to
load factor,
2R n1 - (.
and turn rate is directly proportional to load factor,
vn= - (B.6)
V
the Roll Reversal Parameter is very similar to the Torsional Agility
Parameter proposed by Eidetics and defined as turn rate divided by T9o.
147

Appendix C: F-18 Simulation (SIM 2)
Appendix C describes the F-18 HARV simulation used to conduct the
simulation studies described in this report. A brief discussion of the aircraft
models and simulation capabilities is followed by a detailed description of the
program organization. A cross reference of subroutines and Fortran files is
provided along with a detailed flow diagram and tabular listing of the most
common variable names. User instructions are also provided. The math
models, equations of motion and data structures for the simulation are
documented in Reference 46 which also contains a complete listing of the
Fortran source code. Simulation results were compared to a set of check cases
provided by NASA Dryden. Time histories from that exercise are also
presented in this appendix.
C.A Introduction
SIM 2 is a non-real time, high fidelity, six degree-of-freedom, non-linear
aircraft simulation. It is widely used by NASA and the aerospace industry to
model vehicles such as HiMAT, YF-16, F-18 and B-2. SIM 2 was created at
the NASA Flight Research Center in 1977 by Lee Duke and Albert Myers.
148

Their goal was to initiate a standard approach to simulating digital flight control
systems. The internal structure of SIM 2 is highly modular and has proven to
be a very successful design tool. In addition, the modular construction has
permitted SIM 2 to become the basis for real time man-in-the-loop simulations.
In May 1989, NASA Dryden provided the University of Kansas with a
version of SIM 2 that included F-18 aerodynamic, engine and flight control
models that ran interactively in real time on their ELXSI computer system. Mr.
John Valasek and Mr. Dave Eggold rewrote major portions of the input and
output routines and replaced functions that relied on the peculiar capabilities of
the NASA hardware. The program now resides on an Apollo workstation and
runs a non-interactive, non-real time fashion.
149

C.2 Capabilities and Models
C.2.1 Aerodynamics
The F-18 aerodynamic data base is a full set of steady, non-linear
aerodynamic data which is derived primarily from wind tunnel results with
flight test corrections. Of the four aerodynamic data bases available for the F-
18 (clean, high angle of attack, power approach and take-off), only the clean
and high angle of attack sets reside in the Kansas University version of the
simulation. The high angle of attack data includes complete aerodynamics for
flight up to 70" angle of attack. The simulation transitions automatically to this
data set whenever the aircraft exceeds 40' angle of attack.
The modular structure of SIM 2 will accommodate aerodynamic models
of various levels of fidelity. All of the aerodynamic executive and interpolation
routines for a given aircraft model are in the file ARODAT.FTN. Subroutine
CCALC contains the aerodynamic buildup for all of the parameters in body
axes. Each term in the build up is evaluated individually and then summed to
create a parameter. A dictionary of the terms is provided in comment lines at
the top of subroutine CCALC.
The aerodynamic data bookkeeping is handled in a series of subroutines
YYYINDEX where YYY is the name of the data base. Interpolation within
150

the data base is performed in the YYY_TLU subroutines (TLU stands for Table
Look Up).
C.2.2 Flight Control System
The flight control system was coded by NASA from McDonnell-
Douglas's Control System Design Book MDC A7813 (Ref. 45) for prom set
8.3.3. The digital characteristics of the F-18 flight control system including
multiple update rates (see Section C.2.6) are carefully reproduced. The flight
control model includes several autopilot modes which are described below in
Section C.2.7. None of the control system modifications for the thrust vector
control paddles are included in the simulation at the University.
C.2.3 Actuators
The file ACTUAT.FTN contains the actuator models used in SIM 2.
The current actuator models are second order, rate and hinge moment limited.
The actuator for each control surface is modelled separately with its own
frequency, damping ratio and limits. Mr. Valasek extensively rewrote the
actuator code to make the frequencies and damping ratios clearly visible (Ref.
46). A number of test cases were run to ensure that this rewrite did not change
the actuator characteristics.
151

C.2.4 Equations of Motion
The equations of motion are executed in a subroutine named DERIVC
which uses the six degree of freedom equations with expressions for angle of
attack rate and angle of sideslip rate. DERIVC also accounts for center of
gravity shifts.
C.2.5 Integration Method
The equations of motion are integrated with a modified second order
Runge-Kutta algorithm. This algorithm, presumably chosen to allow real time
execution at NASA, has not been modified at the University.
C.2.6 Multi-rate Calculations
All of the calculations in SIM 2 are accomplished in one of three time
frames. Flight control functions run at 20 and 40 Herz depending on the path
involved. The engine model is updated at 40 Herz. All other vehicle and
simulation tasks are performed at 80 Herz.
Subroutine MULTRT in EXEC.FI'N performs the multi-rate clocking
function. It sets and clears flags which indicate when the various calculations
are to be made.
152

C.2.7 Autopilot Modes
Two autopilot modes currently function in SIM 2. The first is an altitude
hold autopilot which permits the user to select an altitude to be maintained.
The required inputs are commanded altitude and the discrete time at which the
autopilot is to be engaged and disengaged. The second mode is bank angle
hold. The user specifies the commanded bank angle and the engage and
disengage times in the same manner as for the altitude hold mode. Autopilot
inputs are made with the user input file (see section C.4).
C.3 Program Organizatio,
The general flow of the simulation portrayed in Figure C.l. A detailed
wiring diagram reflecting interaction of each subroutine is presented later as
Figure C.2.
153

INITIALIZATION
PILOT INPUTS
CONTROL SYSTEM
VEHICLE DYNAMICS
TIME HISTORY OUTPUT
YESI_ _
TIME < FINAL TIME'?
INOSUMMARY OUTPUT
STOP
Figure C.I: Generalized Simulation low Diagram
154

The source code for SIM 2 is contained in nine files, ACTUAT.FTN,
ARODAT.FTN, CLEAN.FTN, HIGH.FTN, CONSYS.FTN, CSINIT.FTN,
ENGINE.FTN, EXEC.FTN and OUTPUT.FTN which must be individually
compiled and linked into a single executable file before running (a sample
command sequence is given in Section C.4). Subroutines and functions, the
files they reside in and a brief description of each are listed below.
Subroutine File Description
ACTDEF CSINIT Initialization routine done once for
each actuator. Calculates first 8 values
of actuator arrays.
ACTDYN ACTUAT Initializes coefficients for actuator
filters. Calls subroutines to get hinge
moments and surface positions.
ACTMOD ACTUAT Second order actuator model with
position and rate limits and hysteresis.
155

ACTSET CSINIT Calls ACTDEF for each actuator.
ADATIN CSINIT Reads in acro data from F18FDAT.
AGILE EXEC Computes several terms needed for
agility testing.
ALTFN EXEC Computes quantities that are functions
of altitude.
AOASEL CONSYS Computes ALPHAT and ALPHAS
based on angle of attack from the
equations of motion.
APCOMP CONSYS Autopilot gain calculations.
ATOPLT CONSYS Autopi!ot system.
156

CCALC ARODAT Executive for determining the total
aerodynamic coefficients in the body
axis frame of reference.
CDFULL_SCALE Entry in CLEANINDEX.
CDAT CSINIT Reads input data from INPUT
CDATI3 ENGINE Computes iirplane weight and
inertias.
CHUTE EXEC Calculates drag of the spin chute.
CLEANINDEX CLEAN Computes indices and interpolation
ratios for the clean configuration
aerodynamics table lookup procedure.
CLEAN_TLU CLEAN Calls functions to evaluate the clean
configuration aerodynamic
coefficients.
157

CLOSEU CSINIT Closes files and devices.
CONINT CSINIT Initializes control system values.
CONSYS CONSYS Executive for control system and
actuator models.
DERIVC EXEC Computes airplane accelerations using
the equations of motion.
EINDEX ENGINE Calculates indices and interpolation
ratios for engine thrust and fuel flow
table lookup.
ENGDIN ENGINE Reads engine data from G4ECRD and
initializes values for the engine
model.
ENGIN 18 ENGINE Computes engine thrust and fuel flow.
158

ENGMDL ENGINE Executive for the engine model.
ENGTLU2 ENGINE Calls functions to evaluate thrust and
fuel flow from tabular data.
FCSENS CONSYS Models cc probe and on-board
accelerometers.
FLAPCMD CONSYS Automatic flap command system.
GLIMIT CONSYS FCS G-limiter.
HEADER1 OUTPUT Writes output file headers.
HEADER2 OUTPUT Writes output file headers.
HIFLEX HIGH Computes indices and interpolation
ratios for the high a flexibility
effects table lookup procedure.
Evaluates the flexibility coefficients.
159

HIGHINDEX HIGH Computes indices and interpolation
ratios for the high alpha aerodynamics
table lookup procedure ( cc ) 39.99
deg).
HIGHTLU HIGH Calls the functions to evaluate the
high Ct aerodynamic coefficients.
HINGE ACTUAT Sets no load actuator rate limits,
maximum hinge moment capability
and computes rate limits based on
hinge moments.
HINGEIN CSINIT Reads hinge moment data from
INGDAT.
HNGINDX ACTUAT Computes indices and interpolation
ratios for the hinge moment table
lookup procedure.
160

HNGTLU ACTUAT Calls functions to evaluate hinge
moments from the tabular data.
ICSET EXEC Sets the airplane states to initial
values.
INTG EXEC Modified second order Runge-Kutta
numerical integration.
MODINT EXEC Entry in MODSET for initialization.
MODSET EXEC Sets and clears simulation and FCS
mode flags.
MULTRT EXEC Called at every time step (80Hz) and
controls the calling of the 40Hz and
20Hz loops.
OPENU CSINIT Opens files and devices.
161

OUTPUT OUTPUT User customized routine for
displaying and recording of results.
PITCAS CONSYS FCS pitch axis control augmentation
system (CAS).
PKCOMP CONSYS Pitch axis gain calculations.
RKCOMP CONSYS Roll axis gain calculations.
ROLCAS CONSYS FCS roll axis CAS.
SETMOD CONSYS Determines if the system is in
degraded or auto mode.
SIM2 EXEC Main program. Simulation
initialization and computation loop.
SPINLOG CONSYS FCS spin logic.
162
STICKIN EXEC Calculates commands for each time
step from the data in the input file.
TFRS CONSYS Performs the transient-free, constant
rate switch function.
TFS CONSYS Performs the transient-free-switch
function.
WINDIN CSINIT Sets wind to zero.
WINDS EXEC Calculates winds aloft (zero in this
case).
YAWCAS CONSYS FCS yaw axis CAS.
YKCOMP CONSYS Yaw axis gain calculations.
163

Function File Description
CLNIAA CLEAN Interpolation functions
CLN2CA to CLN2CS for calculating clean
CLN3EA to CLN3EY aerodynamic coefficients
FLIMIT CONSYS Limits inputs to
maximum and minimum
values.
HI_I AA HIGH Interpoloation functions
HI_2CA to I-i_2CI for calculating high
HI_3EA to HI_3EO alpha aerodynamic
HI_4GA coefficients
HNG2CA to INTG2CG ACTUAT Interpolation hinge
HING3EA to ILNG3EI moment calculations
HNG4GA to HNG4GH
RLIMIT CONSYS Limits maximum change
from the provious value
(rate limit.
164

A detailed flow diagram, Figure C.2, portrays the overall structure of the
program. The initialization sequence performed by the simulation at the start
of each run is shown in Table C.I. Table C.2 lists the sequence of calls
accomplished during each 80 Herz time frame.
165

ASM2 _. ®
CDATFHE-ADER1
-- ALTFN
Figure C.2: Detailed Simulation Wiring Diagram
166

STICKIN GCtX Ss INTG
FCSENS DERIVC
AGILE
TFRS
GLIMIG
Figure C.2 (continued)
167

STEP ONE TIME FRAMEFALSE
T - RTIME ? TRUE CLOS I EFII-q-OUT-PUT
&E FNNG-IN 18I
ENGTW2
- H- INDX
HNG TLU
HIW;)E
ACTMOD
5-E
CLEAN-TLU CD-F
Ulnu-au
Figure C.2 (concluded)
168
.... ........ ........

Table C. 1: Initialization Sequence
Read User input data
2 Initialize Atmospheric properties
3 Initialize Simulation pun parameters
4 Initialize Vehicle system modes
5 Read Aerodynamic data
6 Read Engine data
7 Initialize Flight control constants and past values
8 Initialize Actuator constants and past values
9 Read Hinge moment data
10 Initialize Pilot commands
11 Initialize Flight control system
12 Initialize Equations of motion
13 Write Initial conditions to output file
169

Table C.2: Dynamic Loop Sequence for One Frame
Multi-rate computation
Vehicle system modes
Pilot inputs
Air data
Flight control gains
Flight control system
First integration
Atmospheric properties
Gust model
Actuator model
Aero coefficient buildup
Equations of motion
Second integration
Output
170

A list of the more frequently used simulation variables is given in Table C.3.
Table C.3: Common Simulation Variables
Array Variable Physical Quantity Units
F(l) T Time Seconds
F(2) P Body Axis Roll Rate Rad/sec
F(3) Q Body Axis Pitch Rate Rad/sec
F(4) R Body Axis Yaw Rate Rad/sec
F(5) V Total Velocity Ft/sec
F(6) ALP Angle of Attack Rad
F(7) BTA Sideslip Angle Rad
F(8) THA Euler Pitch Angle Rad
F(9) PSI Euler Heading Angle Rad
F(10) PHI Euler Roll Angle Rad
F(11) H Altitude Feet
F(I 2) X Downrange Position Feet
171

Table C.3: Common Simulation Variables
Array Variable Physical Quantity Units
F(1 3) Y Crossrange Position Feet
DF(2) PDOT Roll Acceleration Rad/seC2
DF(3) QDOT Pitch Acceleration Rad/sec:2
DF(4) RDOT Yaw Acceleration Rad/seC2
DF(5) VDOT Total Acceleration Ft/sec2
DF(6) ALPDOT Angle of Attack Rate Rad/sec:
DF(7) BTADOT Sideslip Angle Rate Rad/sec
DF(8) THADOT Euler Pitch Rate Rad/sec:
DF(9) PSIDOT Euler Heading Rate Rad/sec
DF(1O) [dIDOT Euler Roll Rate Rad/sec
DF(l 1) HIDOT Altitude Rate Ft/sec
DF( 12) XDOT Downrange Velocity Ft/sec
172

Table C.3: Common Simulation Variables
Array Variable Physical Quantity Units
DF(13) YDOT Crossrange Velocity Ft/sec
ANG Load Factor G's
UX(33) Wind Axis Roll Rate Rad/sec
PSUBSI Specific Excess Power Ft/sec
PLAL Throttle Position (Left) % of max
PLAR Throttle Position (Right) % of max
AMCH Mach Number
DAP Lateral Stick Position Inches
DEP Long. Stick Position Inches
DRP Rudder Pedal Input Pounds
CLFT Lift Coefficient
CD Drag Coefficient
173

Table C.3: Common Simulation Variables
Array Vriable Physical Quantity Units
THRST Total Engine Thrust Pounds
TRATED Turn Rate Deg/sec
TRATER Turn Rate Rad/sec
TEMP Ambient Temperature OR
PA Ambient Pressure PSF
RHO Ambient Density Slug/ft3
QBAR Dynamic Pressure PSF
KIAS Indicated Airspeed Knots
VTAS True Airspeed Ft/sec.
QC Compressible Dynamic PSF
Pressure
WEIGHT Aircraft Weight Pounds
VEAS Equivalent Airspeed Ft/sec
174

Table C.3: Common Simulation Variables
Array Variable Physical Quantity Units
AMSS Aircraft Mass Slugs
G Gravitational Acceleration Ft/sec2
175

C.4 User Instructions
Because there is no automatic trim logic on the University's version of
SIM 2, input files have been generated to trim the aircraft at a large number of
subsonic flight conditions. A test case is begun by allowing the aircraft to
settle at the trim condition for five seconds with no control inputs. Stick,
rudder pedal and throttle commands can then be applied in any combination.
A sample input file is shown in Figure C.3. Though the number of input values
cannot he changed without modifying the source code, the spacing of the values
is not critical since the data is read as unformatted. After each of the nine files
containing the Fortran source code have been compiled, the binary code is
linked into a single, executable file with the command SIM2.LINK. Program
execution is begun with the command SIM2.EX. The program then prompts
the user for the name of the input file to be used. Output is displayed on the
screen and saved in two other files, SIM2.PLOT.DAT and SIM2.OUTL.DAT.
The .PLOT.DAT file contains columns of data with no text so the file is
suitable for use by a plotting program. The OUT.DAT file presents the
output in a more readable format along with a summary of the initial conditions
and pilot commands.
176

* * * SIM-II 6-DOF AIRCRAFT SIMULATION * *
** AIRPLANE: F-18 HARV .7/15K LONG. STEP WITH THROTTLE ADVANCE* S B CBAR WGHTOF FUELWG FUELFDT400.0 37.42 11.523 25500. 160. 4880.******** INITIAL CONDITIONS*TYPE ALT MACH ALPHA ANGIC ELEVATOR FLAPS0. 15000. 0.700 8.00 0.0 0. 5.0******** LATERAL STICK (INCHES): MAX +/- 3.0 INCHES0 0. 0.0 0.0 0.0 0.0 00 0 0 0 0 0 0******** LATERAL STICK TIME BREAKPOINTS0 100.0 0.0 0.0 0.0 0.0 00 0 0 0 0 0 0******** LONG STICK (INCHES): MAX +/- 5.0 INCHES0 0. 5. 5. 0. 0. 00 0 0 0 0 0 0******** LONG STICK TIME BREAKPOINTS0 4.9875 5.0 7.0 7.0125 100. 00 0 0 0 0 0 0******** RUDDER PEDAL (POUNDS): 7 LB BREAKOUT, 100 LB LIMIT0 0. 0. 0. 0 0 00 0 0 0 0 0 0******** RUDDER PEDAL TIME BREAKPOINTS
0 100. 0 0 0 0 00 0 0 0 0 0 0******** THROTTLES: 0 < IDLE <= 10% < NON-AB <=65% < AFTERBURNER <= 100%45. 45. 100. 100. 45. 45. 00 0 0 0 0 0 0******** THROTTLE TIME BREAKPOINTS0 4.9875 5.0 7.0 7.0125 100. 00 0 0 0 0 0 0******** SPEEDBRAKE STEP: 0=IN 1=OUT0 0 0. 0 0 0 00 0 0 0 0 0 0******** SPEEDBRAKE TIME BREAKPOINTS0 100. 0 0 0 0 00 0 0 0 0 0 0******** AUTOPILOT ALTITUDE HOLD: 0=OFF >0=COMMANDED ALT15000.0 15000. 0 0 15000. 0 00 0 0 0 0 0 0******** AUTOPILOT ALTITUDE HOLD TIME EREAKPOINTS0 4.9875 5. 7. 7.0125 0 00 0 0 0 0 0 0******** AUTOPILOT PHI HOLD: O=OFF <>0=COMMANDED PHI0 0 0 0 0 0 00 0 0 0 0 0 0******** AUTOPILOT PHI HOLD TIME BREAKPOINTS0 100. 0 0 0 0 00 0 0 0 0 0 0*RTIME10.
Figure C.3: Sample Input File for SIM 2
177

C.5 Check Case Comparisons
Throughout the process of rehosting the F- 18 from the interactive NASA
version to the University of Kansas hardware, no changes were made to the
program logic, dynamic models or data tables. However, numerous other
changes were required due to the considerable hardware differences between the
two computer systems. In order to build confidence in the University's version
of the F-18 simulation, a series of test cases were run to match against cases
provided by NASA Dryden. These cases are not results from NASA's SIM 2
but are output from McDonnell-Douglas's F-18 simulation and were used
originally by NASA to check their SIM 2. Because of this, an exact match
with the McDonnell cases is not expected.
Longitudinal and lateral check cases were flown at four subsonic flight
conditions and compared to the McDonnell-Douglas runs. Results are presented
on the following pages. The solid time history traces are the Kansas University
SIM 2 output while the dashed lines indicate the McDonnell-Douglas data.
Where no dashed lines appear the simulation and check case results are
essentially identical. While some differences are apparent, they are small and
do not grow significantly during the test maneuvers.
178

6.00. W _________- MDooncU-Dojn
check ca
3.0 ........-------- I------------- KU-FRI. Skmuhamf
2.0 -- - - -- - - -- -- - - - - --- - - - - - - - - - - - - - - - - - - - - - -
1 .0 --- -- -- --- ---- --- -- -- -- I -- ----- -------
.- 0.0 __ _ _ _ __
506.0 7.0 809010.0
0
00
5.0 6. 7.0--- 8.0- 9.0 ----- 0.0-
0
-20.
5.0 6.0 7.0 8.0 9.0 10.0
40.
5.0 6.0------- 7.0------ 8.0--9.0--10.0
Figure ~ ~ ~ ~ ------- C.:-ogiuinl-hckCse-ac--,1000-t
---------- 179

*~50.0
o 60.0 L
5.0 6.0 7.0 8.0 9.0 10.0
6o10.0
-2.
5.0 6.0 7.0 8.0 9.0 10.0
8 o.0
0.
5.0 6.0 7.0 8.0 9.0 10.0
8180

6.05. NlcDoncU-Dau5Im
I a check am
3.0 ........................... UIl. ------------- I,
2.0o*~~ 1.0* - 4
5.0 6.0 7.0 8.0 9.0 10.0
1 0.
10.00
-2 .
5.0 6.0 7.0 8.0 9.0 10.0
40.0
S 30.0 --------- ---- -- --- ----- -- ----
~ 0.0
5.0 6.0 7.0 8.0 9.0 10.0
15.0
CO10.0................------ ---------------...............
0.0
5.0 6.0 7.0 8.0 9.0 10.0
Figure C.5: Longitudinal Check Case, Mach .8, 35,000 ft
181
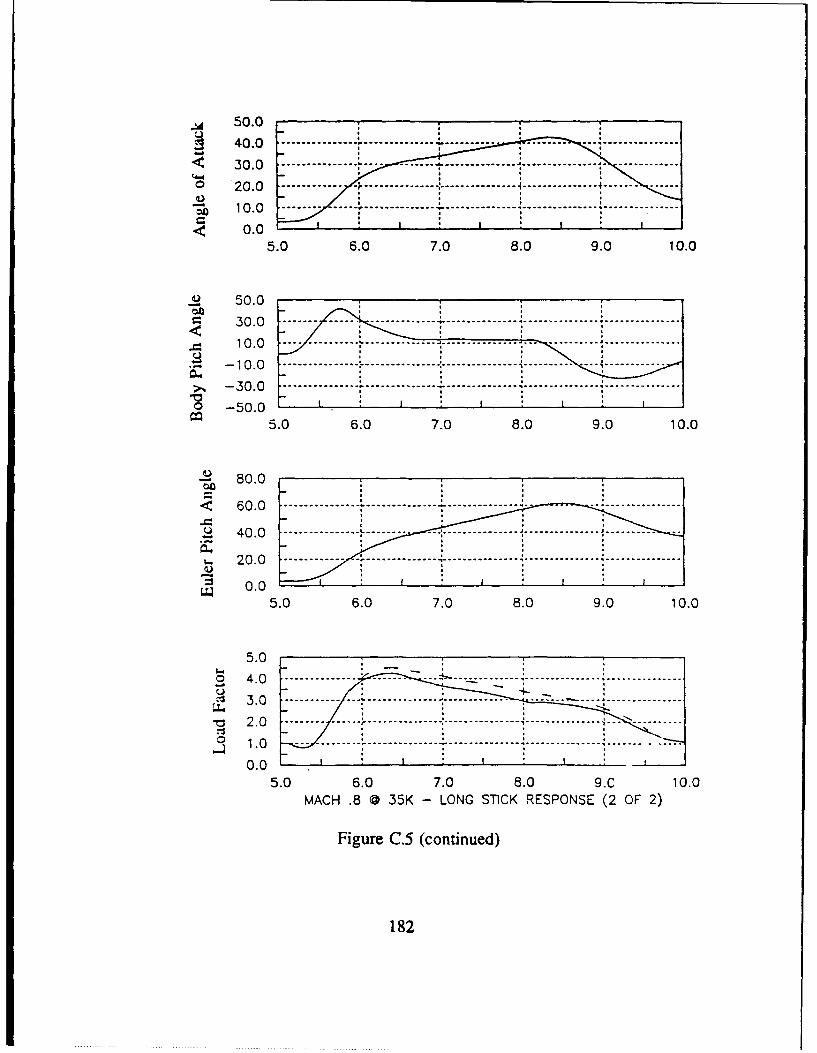
.~50.0
o 4- 00.0 6...............0 7.....0 8.0 9... . 0 10.0--------
0 .0 ----... ------- .... .... ......
0.05.0 6.0 7.0 8.0 9.0 10.0
0.0
5.0 6.0--- 7.0-- 8.0----- - 10.0---------------------
10. MAC .8-- ------ 35K------ ----------- LONG--- STICK RESPO SE-(2OF -2
80182

- 6.0______ ____ _____ _____ - MDomncU.DOugla
5.0 chck cans
- I 4---- KU-MLI Sknuladm
04 W 30................0 T2.0
5.0 6.0 7.0 8.0 9.0 10.0
-6.0
5.0 6.0 7.0 8.0 9.0 10.0
4.0
0 U 2.0 -- - --- -- - -- -- -- --I-- -- - --- --- -- -/ - - --
0.05.0 6.0 7.0 8.0 9.0 10.0
6.0
to
---- ----- - -- - - - - -
5.0 6.0 7.0 8.0 9.0 10.0
Figure C.6: Longitudinal Check Case, Mach .9, Sea Level
183

. 8.0
0.0
5.0 6.0 7.0 8.0 9.0 10.0
.~20.0
1~ 0.0
-10.0
5.0 6.0 7.0 8.0 9.0 10.0
7a5.0
ij 60.0..------- -----.......................................0..-.-----------.-.----------------------.......
0.0 I
5.0 6.0 7.0 8.0 9.0 10.0
8.84

4.0 -M~nw-o~i
S 2.0 --------- LK....... ....... - - U-FRL S3nmadm
1. - - ----- ------------- -------- ----- _ _ _ _ _
S 0.0 a
5.0 6.0 7.0 8.0 9.0 10.0
~j30.0
5.0 6.0 7.0 8.0 9.0 10.0
S 200.0
1 5 0 .0 -- - - - -- - - -- -- - -a-- -- - - - -- -- - - - -- - - - - -
~------------------- - - - - - - - - -- - - - - - -- - - -00.0
6 5 .0 aa
5.0 6.0 7.0 8.0 9.0 10.0
100
0.0
5.0 6.0 7.0 8.0 9.0 10.0
Figure C.7: Lateral Check Case, Mach .4, 20,000 ft.
185

15.0
~-----------
*5.0 6.0 7.0 8.0 9.0 10.0
10.0L
~ .~ -30.05.0 6.0 7.0 8.0 9.0 10.0
20.0
10.0
5.0 6.0 7.0 8.0 9.0 10.0
- ~ 200.0
01 0 0 .0 . . . . . . . . . . . --. . . . . . . ..---. . . . . . . . . . . . . ..-- -
0 .0 .. . . . .. .- -- -- -- - -- - --- - -- - - -- -
S -100.0 --------- --------- ------------- --------200.0 ----
5.0 6.0 7.0 8.0 9.0 10.0MACH .4 0 20K - [AT STICK RESPONSE (2 OF 2)
Figure C.7 (continued)
186
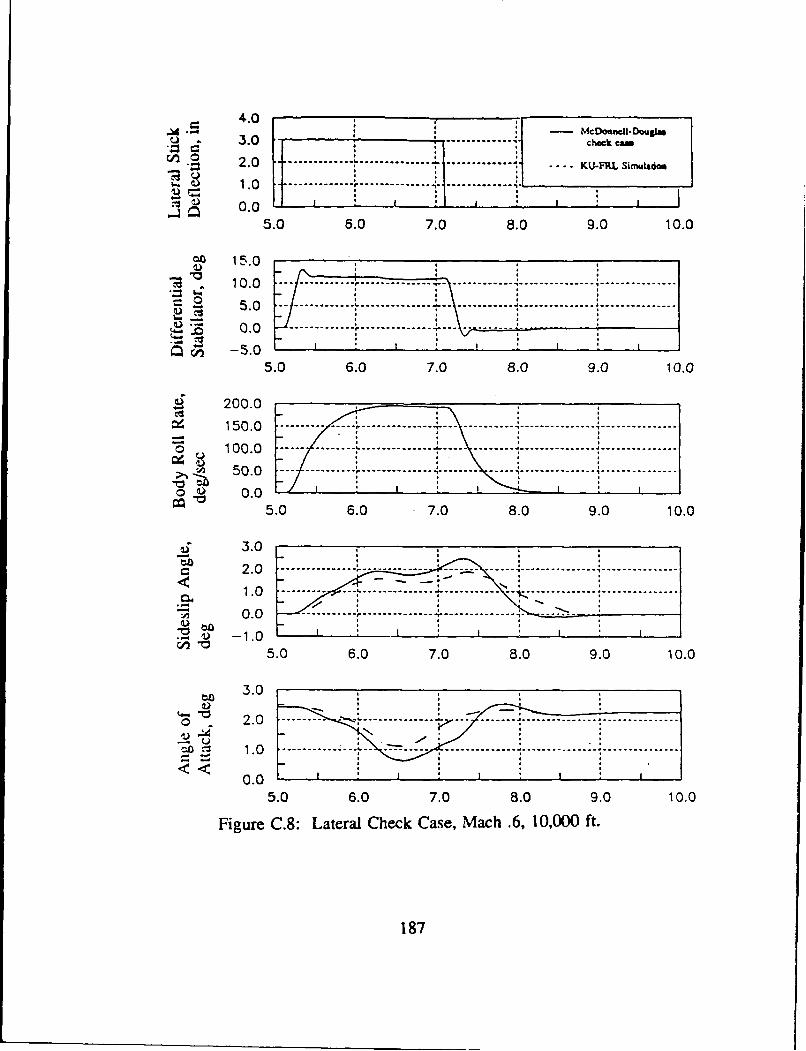
-~ 4.0-- - McDonCl-Douea
U 3 .0 check can
CA 02. .......... ........ ......... ----. KU-FR.L Sifmtado.
5.0 6.0 7.0 8.0 9.0 10.0
Co 15.0 a
10.0
5.0 6.0 7.0 8.0 9.0 10.0
200.0
0.725.0 6.0 7.0 8.0 9.0 10.0
3.0
3.0
-0 5.0 6.0 7.0 8.0 9.0 10.0
Fiur .0 :LtrlCekCs, ah.,1,0 t
2 .-- --- - --- --- --- - ---- -- -- --- --18 7-- --- --

04
h..~ 15.0
~~~------------------
-5.0
5.0 6.0 7.0 8.0 9.0 10.0
5.0
0 .0 -- -----1 ----------- ---
5.0 6.0 7.0 8.0 9.0 10.0
10.0
0 .0 --- - -- - - - -- - - - -- - - -- - - - -- - - -
-5.0 __ _ _ _ _ _ _ _
5.0 6.0 7.0 8.0 9.0 10.0
200.0
100.0 -r-------------------------- ------- --------------- ---------------
0 .0 -- - - -L. . .. . .. .t - - - -- -- -- -- - -- - - - --
-100.0-- - -- ----------------- --------------- ---------------------------
-200.0 *
5.0 6.0 7.0 8.0 9.0 10.0MACH .6 0 10OK - LAT STICK RESPONSE (2 OF 2)
Figure C.8 (continued)
188

4.0
3.0 ............. check cue
2.0~~~~~~~~ ~ ~ ~ -------- -------------- - .... KU-FRI. Siatuladoo1. . .0 ---------------- .............. .-- .............. . U FU i, , ,
0.0 1 .* -
5.0 6.0 7.0 8.0 9.0 10.0
: 15.0S 10 .0 .. .. .. .. .. -- - - - -- - -.. . ...... .....- ............... -...............5_ " .0 -- -- --- --.L. ... ...... ........... ...... ...... ....... ......-....----...-
-5.0 r
5.0 6.0 7.0 8.0 9.0 10.0
200.0
150.0 - - - ... - I
005.0 6.0 7.0 8.0 9.0 10 .0l
4.0L ::, 50 3.0 .
F !' ""__ 0.0 ............. ..
= 5. 0 6..... . 0...................... -7 .0 .... 0. 9 ------.-
2.05.0 6.0 7.0 8.0 9.0 10.0
4.0
5.0 6.0 7.0 8.0 9.0 10.0
Figure C.9: Lateral Check Case, Mach .8, 35,000 ft.
189

15.0
05.0
5.0 6.0 7.0 8.0 9.0 10.0
5.0-0.................--------
-10.0
W.5.0 6.0 7.0 8.0 9.0 10.0
10.0
7.5 -- -- $-V 4- --------- ------ .......
2.5 ------- ---------- -------------------- -- ----------- ---------------
Q~.) 0.0 K-5.0 6.0 7.0 8.0 9.0 10.0
200.0
73 ~ 100.0 - - - - - - - - - - - - - - . . . . . . . - - - - - - - - - - - - - -
- 10 0 .0 -------- ------ -- ------ ------- -------
-200.05.0 6.0 7.0 8.0 9.0 10.0
MACH .8 @ 35K - LAT STICK RESPONSE (2 OF 2)
Figure C.9 (continued)
190

4.0 -MDfOUD 1
2 .0 ......... chwckcan.
C 0.0 -- I I
5.0 6.0 7.0 8.0 9.0 10.0
~o 20.0
5.0 6.0 7.0------------- 8. 9.0- 10.0--- --------
15.0 f_ _
2 00.0
---5.0--------- - -. 2\ - - -......-----...... .
0.0 *
5.0 6.0 7.0 8.0 9.0 10.0
1.0
0.50
5.0 6.0 7.0 8.0 9.0 10.0
2.0
1.011
5.0 6.0 7.0 8.0 9.0 10.0
Figure C-10: Lateral Check Case, Mach .9, Sea Level
191

15.0.10. ---- ---- I ..... ------ I ........ .......
10.0 --* ----- ... n...... . ..... . ....... ........
0 .0 V- -------...... \ -. -J----------
-5.05.0 6.0 7.0 8.0 9.0 10.0
4.
S2 .0 -- -------------- ------- ------ -------
0.0 -- -- - ......... . .. I.. .. ............
=0 -4.05.0 6.0 7.0 8.0 9.0 10.0
2 4.0
2 .0 --- -- -- - - - - - - - - - - -- - - - - - - - - -
0.0 ..... .. .------- ---.----. ...... .. ...-------
-405.0 60 7.0 8.0 9.0 10.0
200.0
z 100.0 ---------- _.._--_........_........--------
-2 0.0 ......... I............... ........ ........ ........
5.0 6.0 7.0 8.0 9.0 10.0MACH .9 0 00K - LAT STICK RESPONSE (2 OF 2)
Figure C.10 (continued)
192