Form DOT F 1700 - CTR Library · The University of Texas at Austin Austin, ... Testing involved the...
109
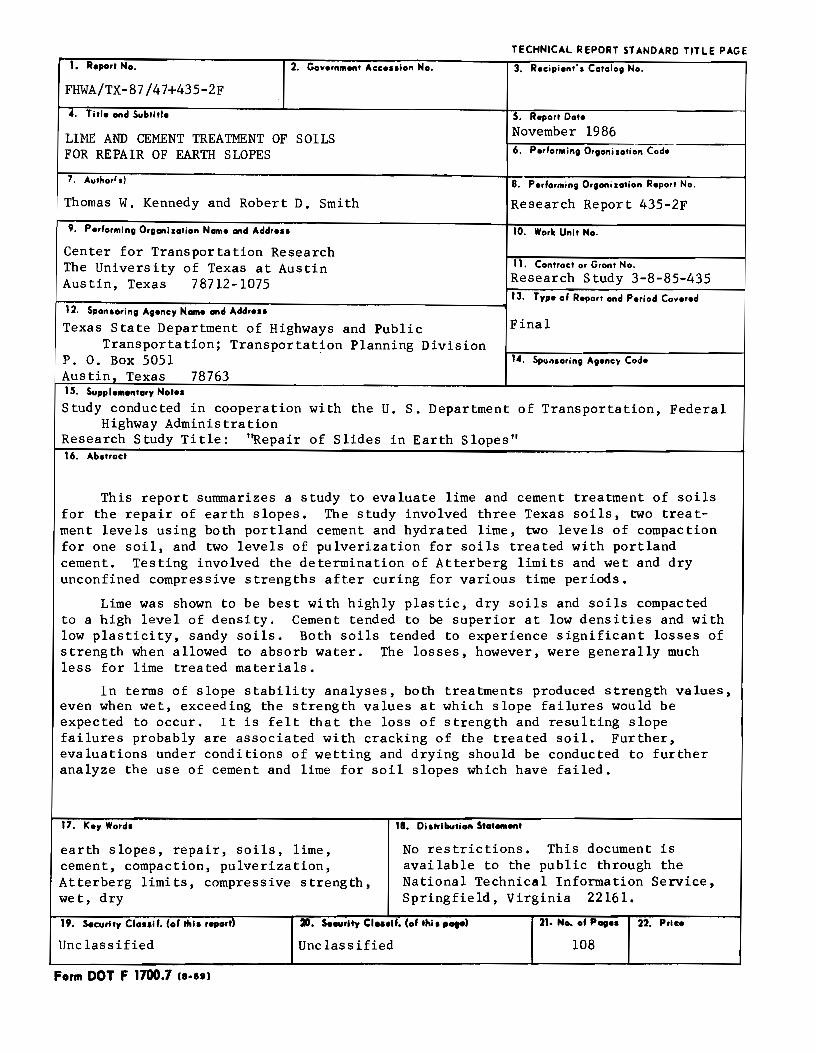
TECHNICAL REPORT STANDARD TITLE PAGE 1. Report No. 2. Government Acceuion No. 3. Recipient' • Catolog No. FHWA/TX-87/47+435-2F -4. Title ond Subtitle LIME AND CEMENT TREATMENT OF SOILS FOR REPAIR OF EARTH SLOPES Thomas W, Kennedy and Robert D. Smith 9. Performing Orgonhotion Nome Gild Addrou Center for Transportation Research The University of Texas at Austin Austin, Texas 78712-1075 5. Report Date November 1986 6. Performing Orgonizotion Cod• B. Performing Organiution Report No. Research Report 435-2F 10. Worlc Unit No. 11. Contract or Gront No. Research Study 3-8-85-435 13. Typo of Report ond Period Covered 12. Sponaoring Agency H-• ond '-ddrou Texas State Department of Highways and Public Transportation; Transportation Planning Division P. 0. Box 5051 · Final 1-4. Sponaoring Agency Code Austin, Texas 78763 15. Suppl-entory Not•• Study conducted in cooperation with the U. S. Department of Transportation, Federal Highway Administration Research Study Title: ''Repair of Slides in Earth Slopes 11 16. Aloatroct This report summarizes a study to evaluate lime and cement treatment of soils for the repair of earth slopes. The study involved three Texas soils, two treat- ment levels using both portland cement and hydrated lime, two levels of compaction for one soil, and two levels of pulverization for soils treated with portland cement. Testing involved the determination of Atterberg limits and wet and dry unconfined compressive strengths after curing for various time periods. Lime was shown to be best with highly plastic, dry soils and soils compacted to a high level of density. Cement tended to be superior at low densities and with low plasticity, sandy soils. Both soils tended to experience significant losses of strength when allowed to absorb water. The losses, however, were generally much less for lime treated materials. In terms of slope stability analyses, both treatments produced strength values, even when wet, exceeding the strength values at which slope failures would be expected to occur. It is felt that the loss of strength and resulting slope failures probably are associated with cracking of the treated soil. Further, evaluations under conditions of wetting and drying should be conducted to further analyze the use of cement and lime for soil slopes which have failed. 17. key Wordt earth slopes, repair, soils, lime, cement, compaction, pulverization, Atterberg limits, compressive strength, wet, dry 18. No restrictions. This document is available to the public through the National Technical Information Service, Springfield, Virginia 22161. 19. Socurlty Clouif. (of lhi1 report) Unclassified 2D, Secvrlty Cloulf, (of thia , ... , Unclassified 21. No. of Pao•• 22. Prlco 108 Form DOT F 1700.7 lt•et)
Transcript of Form DOT F 1700 - CTR Library · The University of Texas at Austin Austin, ... Testing involved the...
TECHNICAL REPORT STANDARD TITLE PAGE
1. Report No. 2. Government Acceuion No. 3. Recipient' • Catolog No.
FHWA/TX-87/47+435-2F
-4. Title ond Subtitle
LIME AND CEMENT TREATMENT OF SOILS FOR REPAIR OF EARTH SLOPES
Thomas W, Kennedy and Robert D. Smith
9. Performing Orgonhotion Nome Gild Addrou
Center for Transportation Research The University of Texas at Austin Austin, Texas 78712-1075
5. Report Date
November 1986 6. Performing Orgonizotion Cod•
B. Performing Organiution Report No.
Research Report 435-2F
10. Worlc Unit No.
11. Contract or Gront No.
Research Study 3-8-85-435
l-;'-:;--;:--"""7-:---:-:--~:-.-;--:-----------------~ 13. Typo of Report ond Period Covered 12. Sponaoring Agency H-• ond '-ddrou
Texas State Department of Highways and Public Transportation; Transportation Planning Division
P. 0. Box 5051 ·
Final
1-4. Sponaoring Agency Code
Austin, Texas 78763 15. Suppl-entory Not••
Study conducted in cooperation with the U. S. Department of Transportation, Federal Highway Administration
Research Study Title: ''Repair of Slides in Earth Slopes 11
16. Aloatroct
This report summarizes a study to evaluate lime and cement treatment of soils for the repair of earth slopes. The study involved three Texas soils, two treatment levels using both portland cement and hydrated lime, two levels of compaction for one soil, and two levels of pulverization for soils treated with portland cement. Testing involved the determination of Atterberg limits and wet and dry unconfined compressive strengths after curing for various time periods.
Lime was shown to be best with highly plastic, dry soils and soils compacted to a high level of density. Cement tended to be superior at low densities and with low plasticity, sandy soils. Both soils tended to experience significant losses of strength when allowed to absorb water. The losses, however, were generally much less for lime treated materials.
In terms of slope stability analyses, both treatments produced strength values, even when wet, exceeding the strength values at which slope failures would be expected to occur. It is felt that the loss of strength and resulting slope failures probably are associated with cracking of the treated soil. Further, evaluations under conditions of wetting and drying should be conducted to further analyze the use of cement and lime for soil slopes which have failed.
17. key Wordt
earth slopes, repair, soils, lime, cement, compaction, pulverization, Atterberg limits, compressive strength, wet, dry
18. Oit~II>Ytion StatM~~ent
No restrictions. This document is available to the public through the National Technical Information Service, Springfield, Virginia 22161.
19. Socurlty Clouif. (of lhi1 report)
Unclassified
2D, Secvrlty Cloulf, (of thia , ... ,
Unclassified
21. No. of Pao•• 22. Prlco
108
Form DOT F 1700.7 lt•et)

LIME AND CEMENT TREATMENT OF SOILS FOR REPAIR OF EARTH SLOPES
by
Thomas W. Kennedy Robert D. Smith
Research Report Number 435-2F
Repair of Slides in Earth Slopes Research Project 3-8-85-435
conducted for
Texas State Department of Highways and Public Transportation
in cooperation with the u.s. Department of Transportation
Federal Highway Administration
by the
Center for Transportation Research Bureau of Engineering Research
The University of Texas at Austin
November 1986
The contents of this report reflect the views of the authors, who are responsible for the facts and the accuracy of the data presented herein. The contents do not necessarily reflect the official views or policies of the Federal Highway Administration. This report does not constitute a standard, specification, or regulation.
There was no invention or discovery conceived or first actually reduced to practice in the course of or under this contract, including any art, method, process, machine, manufacture, design or composition of matter, or any new and useful improvement thereof, or any variety of plant which is or may be patentable under the patent laws of the United States of America or any foreign country.
ii

PREFACE
This is the second and final report summarizing the findings of a
research project concerned with the repair of earth slopes. This report is
concerned with the use of hydrated lime and portland cement to treat soils in
slopes which have failed.
The work required to develop this report was conducted by many people.
Special appreciation is extended to Messrs. James N. Anagnos, Maghsoud
Tahmoressi, and Eugene Betts. In addition, the authors would like to express
their appreciation to Mr. Christopher Goss of the Texas Department of
Highways and Public Transportation for his suggestions, encouragement, and
assistance in this research project. Appreciation is also extended to the
National Lime Association and the Texas lime producer who sponsored a portion
of the study included in this report. Appreciation is also extended to the
Center for Transportation Research and the Bureau of Engineering Research who
assisted in the preparation of this report. The support of the Federal
Highway Administration is acknowledged.
November 1986
Thomas w. Kennedy
Robert D. Smith
iii


LIST OF REPORTS
Report No. 435-1, "Stability Computation Procedures for Earth Slopes
Containing Internal Reinforcement," by Stephen G. Wright and Fernando
Cuenca, contains the fundamental limit equilibrium slope stability
equations for computing the stability of earth slopes containing
synthetic reinforcement.
Report No. 435-2F, "Lime and Cement Treatment of Soils for Repair of Earth
Slopes," by Thomas W. Kennedy and Robert D. Smith, summarizes a study of
the wet and dry unconfined compressive strengths of three Texas soils
treated with portland cement or hydrated lime.
v

ABSTRACT
This report summarizes a study to evaluate lime and cement treatment of
soils for the repair of earth slopes. The study involved three Texas soils,
two treatment levels using both portland cement and hydrated lime, two levels
of compaction for one soil, and two levels of pulverization for soils treated
with portland cement. Testing involved the determination of Atterberg limits
and wet and dry unconfined compressive strengths after curing for various
time periods.
Lime was shown to be best with highly plastic, dry soils and soils
compacted to a high level of density. Cement tended to be superior at low
densities and with low plasticity, sandy soils. Both soils tended to
experience significant losses of strength when allowed to absorb water. The
losses, however, were generally much less for lime treated materials.
In terms of slope stability analyses, both treatments produced strength
values, even when wet, exceeding the strength values at which slope failures
would be expected to occur. It is felt that the loss of strength and
resulting slope failures probably are associated with cracking of the treated
soil. Further, evaluations under conditions of wetting and drying should be
conducted to further analyze the use of cement and lime for soil slopes which
have failed.
vii

SUMMARY
The use of hydrated lime to treat plastic clay soils has long been
recognized as an effective method of improving the engineering
characteristics and behavior of the soil. Lime has also been used to prevent
or repair slope failures. Nevertheless, lime-treated soils in slopes have on
occasion failed. The study summarized in this report was designed as the
first in a series of studies to determine whether hydrated lime could be used
for the repair of slope failures. Included was information related to the
possible use of portland cement.
The study involved three Texas soils, two treatment levels using both
portland cement and hydrated lime, two levels of compaction for one soil, and
two levels of pulverization for soils treated with portland cement. Testing
involved the determination of Atterberg limits and the wet and dry unconfined
compressive strength after curing periods of up to 126 days.
Lime was shown to be best with highly plastic, dry soils and soils
compacted to a high level of density. Cement tended to be superior at low
densities and with low plasticity, sandy soils. Both soils tended to
experience significant losses of strength when allowed to absorb water. The
losses, however, were generally much less for lime treated materials.
In terms of slope stability analyses, both treatments produced strength
values, even when wet, exceeding the strength values at which slope failures
would be expected to occur. It is felt that the loss of strength and
resulting slope failures probably are associated with cracking of the treated
soil.
ix


IMPLEMENTATION STATEMENT
The results summarized in this report are based on a laboratory study to
evaluate hydrated lime and portland cement as a means to repair slope
failures by treating the soil in the slopes. The results indicate that the
treated soils have sufficient strength, under dry and wet conditions, to
prevent failures. Nevertheless, treated soils in slopes have been known to
fail. It is therefore felt that wetting and drying probably cause cracking
and a much more significant loss in strength. This behavior needs to be
further evaluated.
The study, however, did reaffirm the applicability of hydrated lime for
treating plastic clays. The strength losses associated with moisture
absorption were also less for well compacted plastic clays treated with
hydrated lime.
xi

TABLE OF CONTENTS
PREFACE •
LIST OF REPORTS •
ABSTRACT
SUMMARY •
IMPLEMENTATION STATEMENT
CHAPTER 1. INTRODUCTION
CHAPTER 2. EXPERIMENTAL PROGRAM
Experimental Program • Materials
Soils .• Additives •
Laboratory Procedure • Pulverization • Treatment • Compaction Curing Testing •
Properties Analyzed Atterberg Limits Unconfined Compressive Strength •
Experiment Design
CHAPTER 3. PRESENTATION OF RESULTS •
Atterberg Limits . Moisture Content After Curing
Daleo Clay Beaumont Clay • Daleo Sandy Clay
Unconfined Compressive Strength Pulverized Soil • Effect of Pulverization of Cement-Treated Effects of Compactive Effort
xiii
Page
iii
v
vii
ix
xi
1
3
3 3 3 4 4 4 4 5 6 7 7 7 7 7
9
9 9
10 11 11 12 12
Soils . 15 16
CHAPTER 4. CONCLUSIONS • •
Atterberg Limits .•••••• Moisture Content After Curing Unconfined Compressive Strength Moisture Susceptibility • • • • Effects of Degree of Pulverization • Effects of Compactive Effort . . . • . Summary
APPENDIX A. INDIVIDUAL TEST RESULTS
xiv
Page
19
19 19 19 20 20 21 21
71
CHAPTER 1. INTRODUCTION
The use of hydrated lime to treat plastic clay soils has long been
recognized as an effective method of improving the engineering characteris
tics and behavior of these soils. In addition to traditional subgrade
stabilization, hydrated lime has also been used to prevent or repair slope
failures. Nevertheless, lime-treated earth slopes have on occasion failed.
Thus, a study was conducted to evaluate hydrated lime as a means of
repairing slope failures. The study was conducted in conjunction with a
study sponsored by the National Lime Association and Texas Lime Producers
which evaluated both lime and cement treatment of Texas soils.
The study, summarized in this report, involved three Texas soils, two
treatment levels using portland cement and hydrated lime, two levels of
compaction on one soil, and the treatment of pulverized and unpulverized soil
with portland cement. Testing involved the determination of Atterberg Limits
and wet and dry unconfined compressive strengths after curing for various
time periods.
Chapter 2 contains a description of the experimental program. Chapter 3
summarizes and discusses the findings. Conclusions and summary are contained
in Chapter 4.
1

CHAPTER 2. EXPERIMENTAL PROGRAM
The objectives of the study were to compare the dry and wet unconfined
compressive strength characteristics of soils treated with hydrated lime and
portland cement, to evaluate the importance of pulverization on the
unconfined compressive strength of soils treated with portland cement, and to
determine the effect of compactive effort.
EXPERIMENTAL PROGRAM
The experimental program involved three soils, two stabilizing agents
(hydrated lime and portland cement}, two levels of treatment, two levels of
pulverization, two levels of compaction, two levels of moisture conditioning,
and a range of curing times.
MATERIALS
Soils
Three Texas soils were used in the study. Two of the soils were from
Dallas County and are described as Daleo clay and Daleo sandy clay. The
third soil was from Harris County near Houston and is described as Beaumont
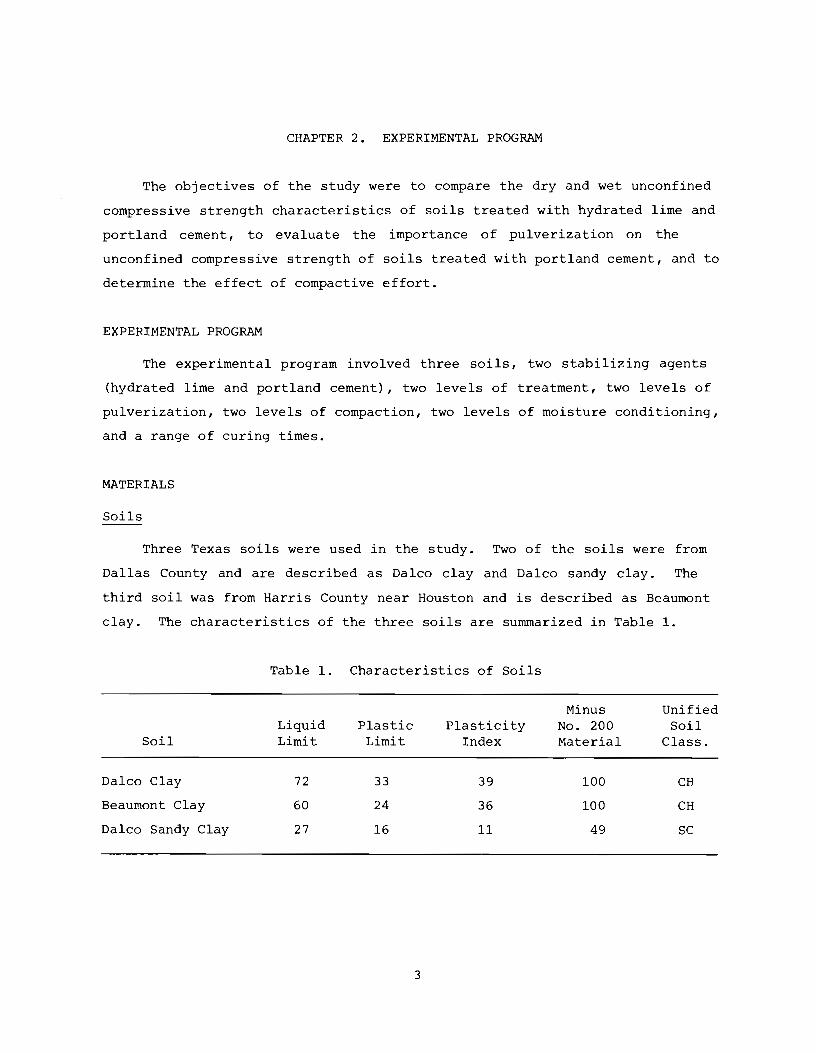
clay. The characteristics of the three soils are summarized in Table 1.
Table 1. Characteristics of Soils
Minus Unified Liquid Plastic Plasticity No. 200 Soil
Soil Limit Limit Index Material Class.
Daleo Clay 72 33 39 100 CH
Beaumont Clay 60 24 36 100 CH
Daleo Sandy Clay 27 16 11 49 sc
3
4
Additives
The three soils were treated with commercially available portland cement
and hydrated lime. The cement was Type I portland cement manufactured by
Alamo Cement Company of San Antonio, Texas. The lime was hydrated lime
manufactured by Austin White Lime Company of Austin, Texas.
The three soils were treated with 4 or 7 percent portland cement or
hydrated lime, based on the dry weight of the soil. These treatment levels
would be expected to fully stabilize the lime-treated soils and modify the
cement-treated soils. However, these application rates are currently being
utilized in Texas and relative performances and costs compared.
LABORATORY PROCEDURE
The following laboratory procedures were utilized in an attempt to
simulate field conditions as closely as possible.
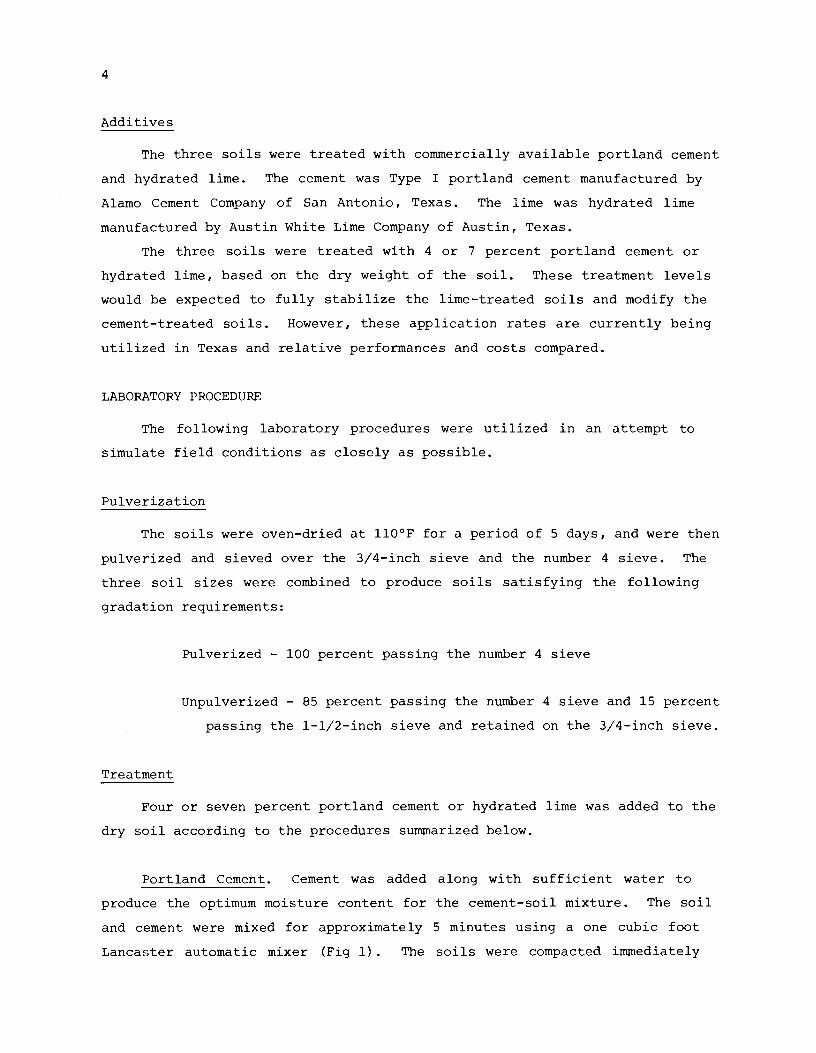
Pulverization
The soils were oven-dried at ll0°F for a period of 5 days, and were then
pulverized and sieved over the 3/4-inch sieve and the number 4 sieve. The
three soil sizes were combined to produce soils satisfying the following
gradation requirements:
Treatment
Pulverized - 100 percent passing the number 4 sieve
Unpulverized - 85 percent passing the number 4 sieve and 15 percent
passing the 1-1/2-inch sieve and retained on the 3/4-inch sieve.
Four or seven percent portland cement or hydrated lime was added to the
dry soil according to the procedures summarized below.
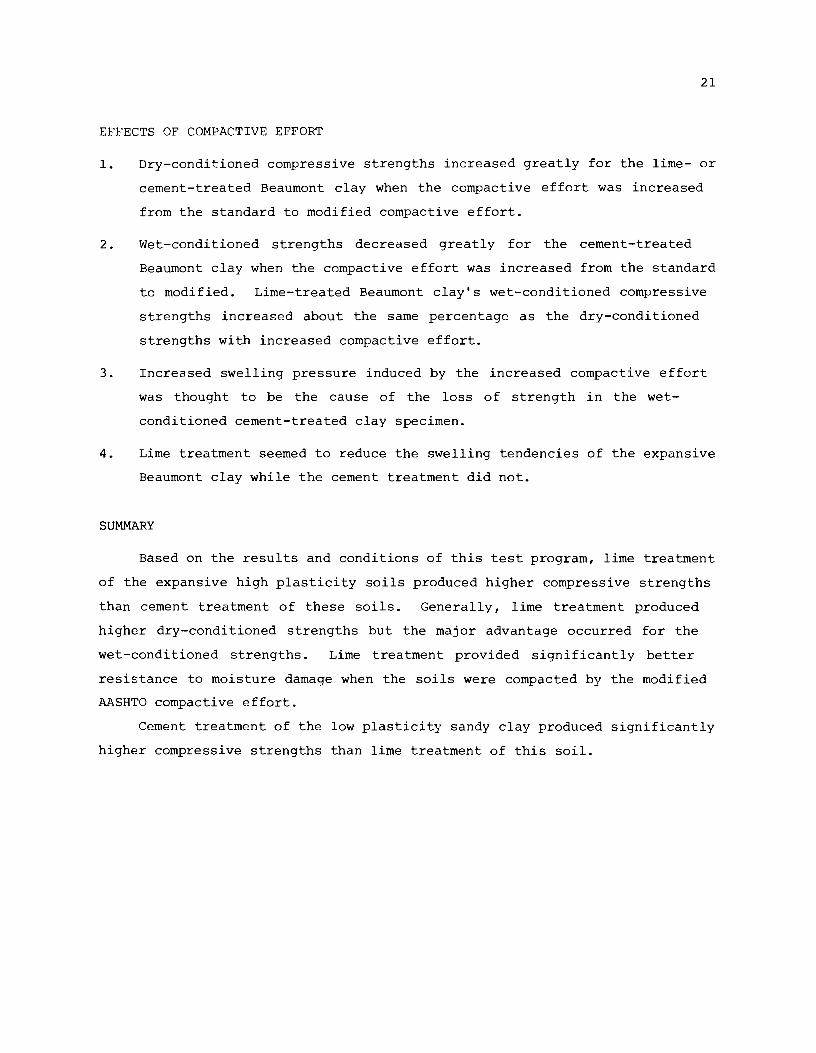
Portland Cement. Cement was added along with sufficient water to
produce the optimum moisture content for the cement-soil mixture. The soil
and cement were mixed for approximately 5 minutes using a one cubic foot
Lancaster automatic mixer (Fig 1) . The soils were compacted immediately
following mixing without curing, which simulates practice currently used on
Texas projects.
5
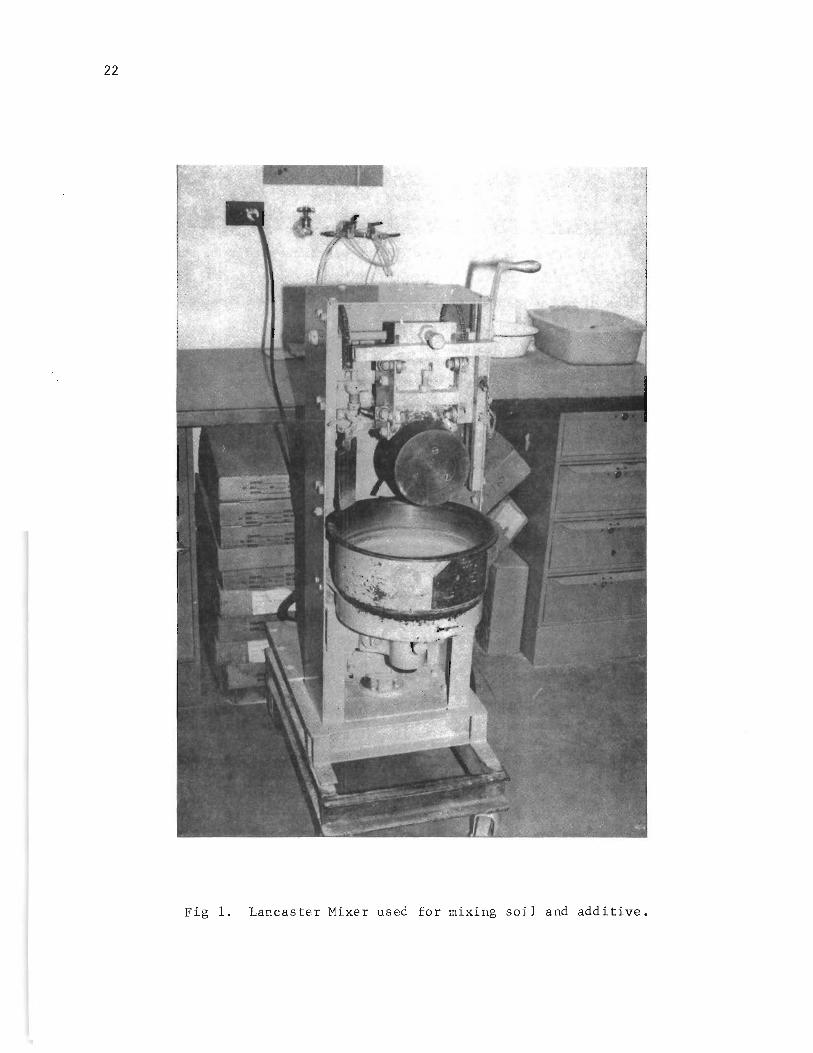
Hydrated Lime. Lime was added to the soil in the form of a lime-water
slurry. The amount of water was equal to that required to produce the
optimum water content for the mixture. The soil and lime were mixed for
approximately 5 minutes using the Lancaster mixer. The lime-treated mixtures
were placed in plastic bags (Fig 2) and allowed to mellow, or cure, for three
days prior to compaction. This curing procedure, which may not be required
if adequate pulverization can be obtained, is similar to the procedure often
used in lime stabilization construction.
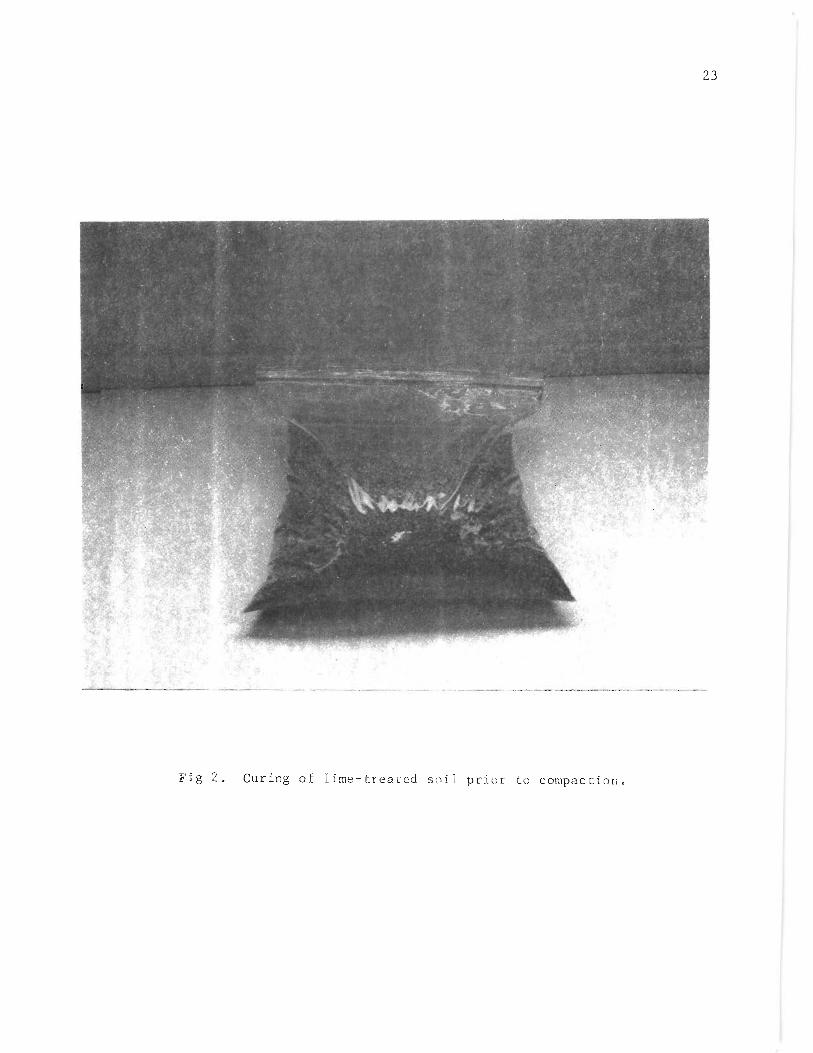
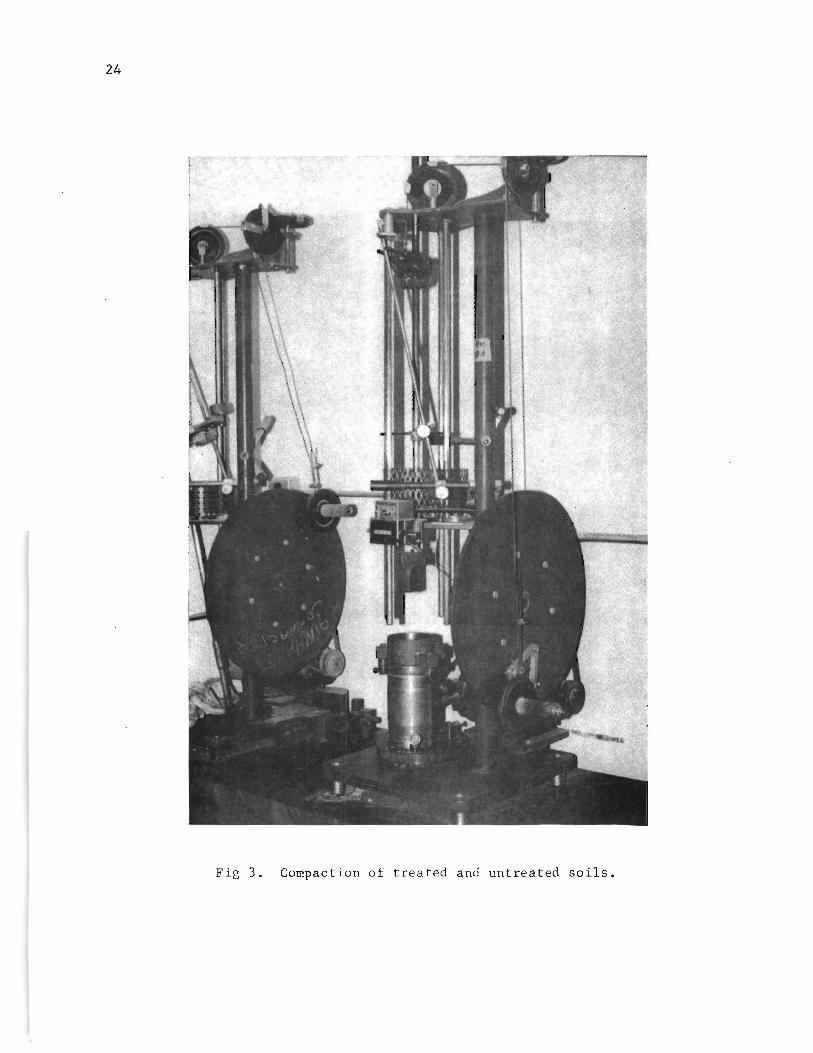
No Treatment. The soil was mixed at the optimum water content for
approximately 5 minutes and compacted immediately after mixing (Fig 3).
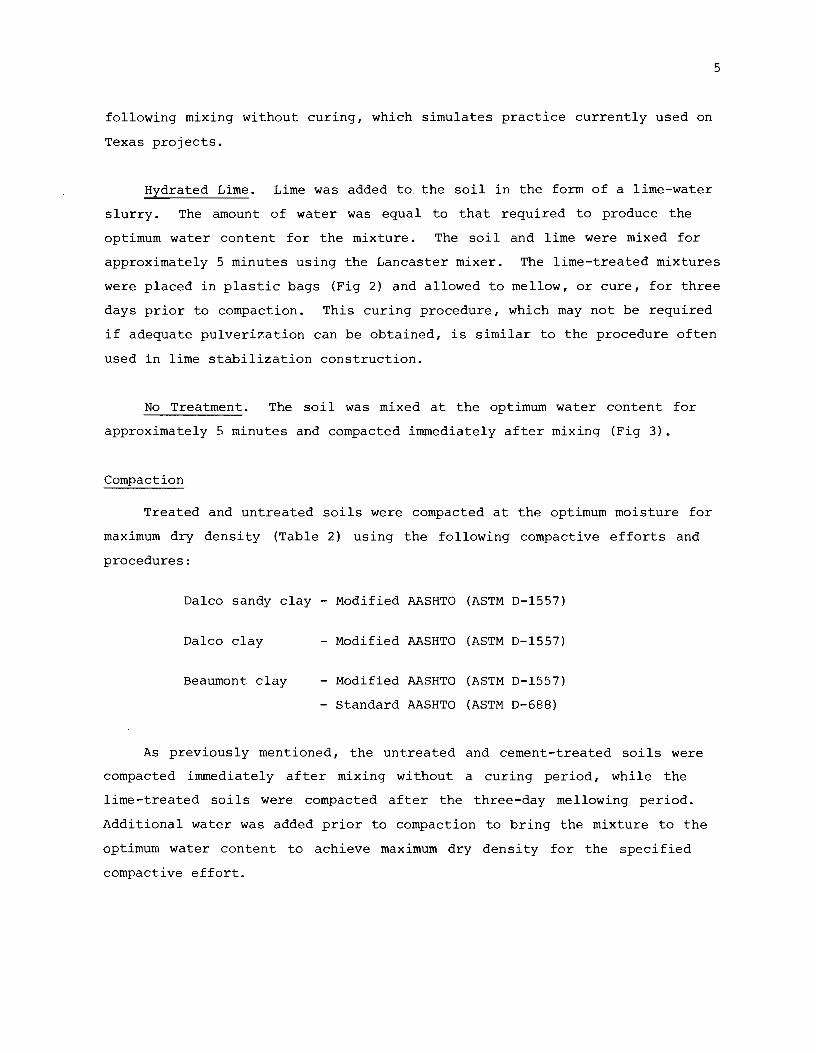
Treated and untreated soils were compacted at the optimum moisture for
maximum dry density (Table 2) using the following compactive efforts and
procedures:
Daleo sandy clay - Modified AASHTO (ASTM D-1557)
Daleo clay - Modified AASHTO (ASTM D-1557)
Beaumont clay - Modified AASHTO (ASTM D-1557)
- Standard AASHTO (ASTM D-688)
As previously mentioned, the untreated and cement-treated soils were
compacted immediately after mixing without a curing period, while the
lime-treated soils were compacted after the three-day mellowing period.
Additional water was added prior to compaction to bring the mixture to the
optimum water content to achieve maximum dry density for the specified
compactive effort.
6
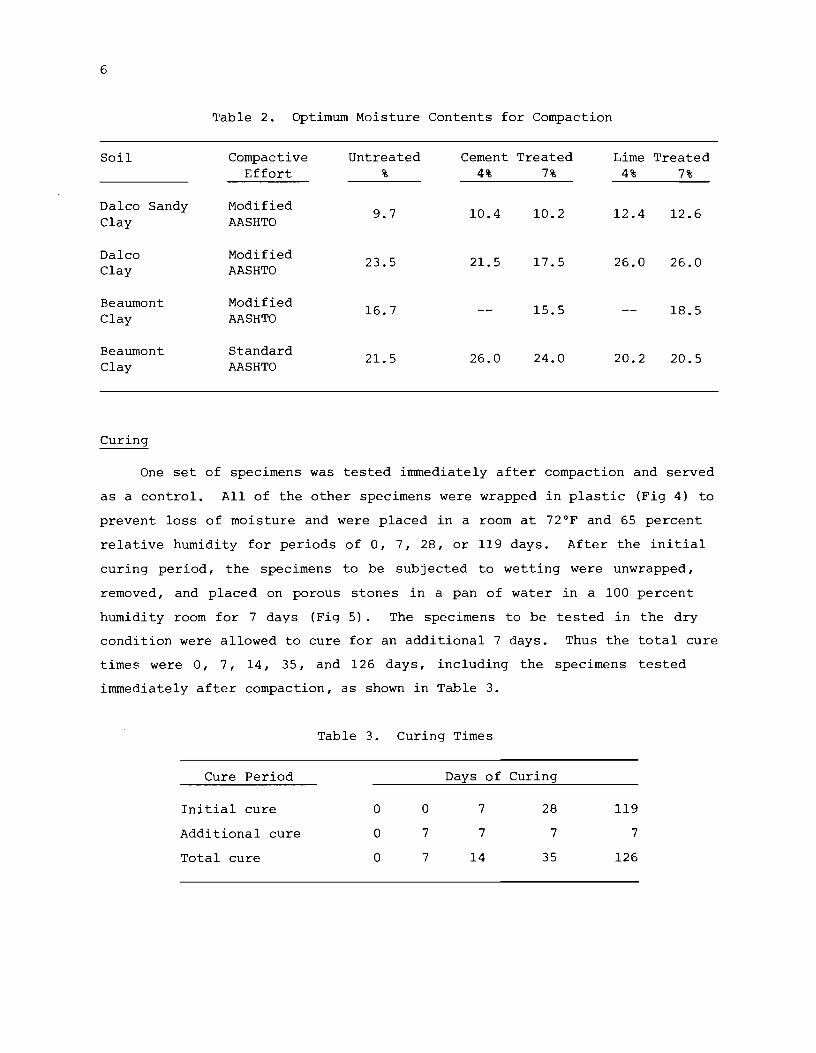
Table 2. Optimum Moisture Contents for Compaction
Soil Compactive Untreated Cement Treated Lime Treated Effort % 4% 7% 4% 7%
Daleo Sandy Modified 9.7 10.4 10.2 12.4 12.6
Clay AASHTO
Daleo Modified 23.5 21.5 17.5 26.0 26.0
Clay AASHTO
Beaumont Modified 16.7 15.5 18.5
Clay AASHTO
Beaumont Standard 21.5 26.0 24.0 20.2 20.5
Clay AASHTO
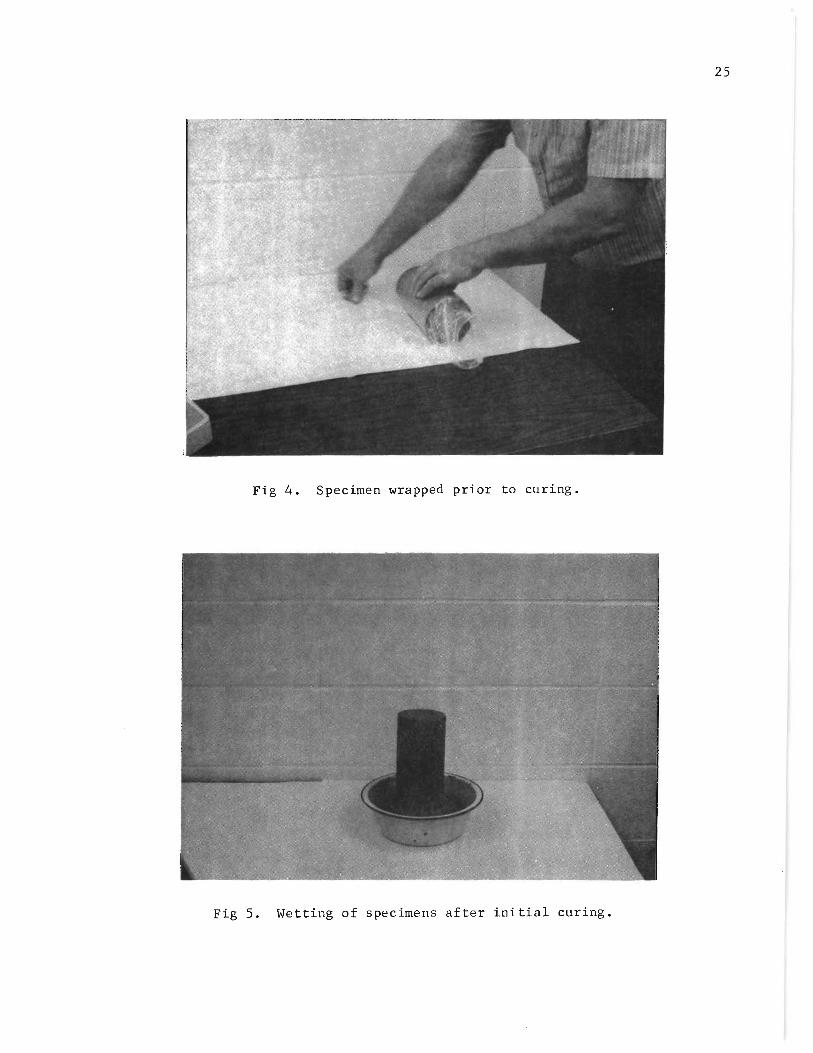
Curing
One set of specimens was tested immediately after compaction and served
as a control. All of the other specimens were wrapped in plastic (Fig 4) to
prevent loss of moisture and were placed in a room at 72°F and 65 percent
relative humidity for periods of 0, 7, 28, or 119 days. After the initial
curing period, the specimens to be subjected to wetting were unwrapped,
removed, and placed on porous stones in a pan of water in a 100 percent
humidity room for 7 days (Fig 5). The specimens to be tested in the dry
condition were allowed to cure for an additional 7 days. Thus the total cure
times were 0, 7, 14, 35, and 126 days, including the specimens tested
immediately after compaction, as shown in Table 3.
Table 3. Curing Times
Cure Period Days of Curing
Initial cure
Additional cure
Total cure
0
0
0
0
7
7
7
7
14
28
7
35
119
7
126

7
Testing
Immediately following the prescribed total curing period, the specimens
were tested in unconfined compression according to ASTM D1663-63. Specimens
were loaded at a constant deformation rate of 0.115 inches per minute at 75°F
and the load and corresponding vertical deformations were recorded on an X-Y
plotter.
PROPERTIES ANALYZED
Plasticity characteristics (Atterberg Limits) and unconfined compressive
strengths were determined for the treated and untreated soils.
Atterberg Limits
The liquid limit, plastic limit, and plasticity index were determined
immediately after treatment for portland cement and after a 3-day mellowing
(cure) period for hydrated lime.
Unconfined Compressive Strength
The unconfined compressive strength was determined over the range of
curing times. Tests were conducted on both dry and wet cured specimens as
described under curing.
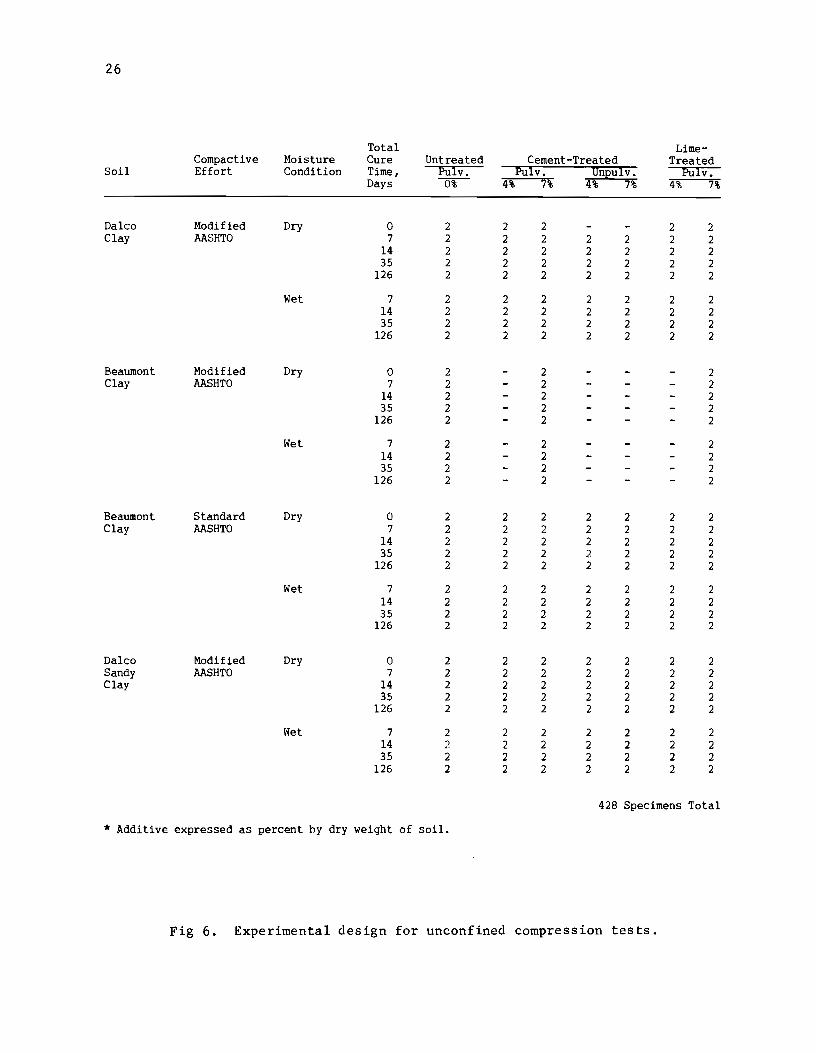
EXPERIMENT DESIGN
The experiment design is summarized in Figure 6. Two replicate
specimens per cell or test condition were tested as indicated by the numbers.
The longer term curing conditions were prepared first in order to minimize
the time required for the study. All treatment levels were coded to minimize
bias during testing.

CHAPTER 3. PRESENTATION OF RESULTS
The primary objective of this study was to compare the strength and
plasticity characteristics of three cement-treated and lime-treated Texas
soils. Unconfined compression tests on compacted specimens were used to
evaluate the strengths of the treated soils. The strengths of dry and
wet specimens were compared to establish the moisture susceptibility, or
retained strength, of the treated soils. The importance of pulverization on
the strength of cement-treated soils and the effects of the degree of
compactive effort on both cement-treated and lime-treated soils were
evaluated.
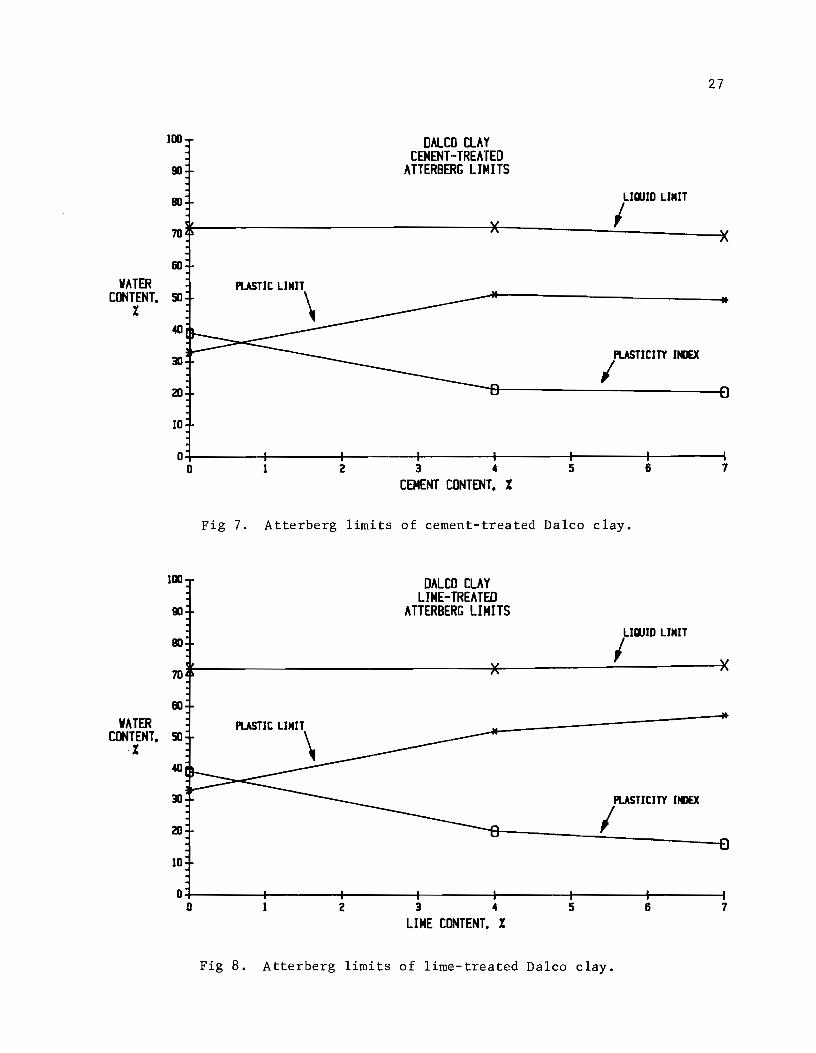
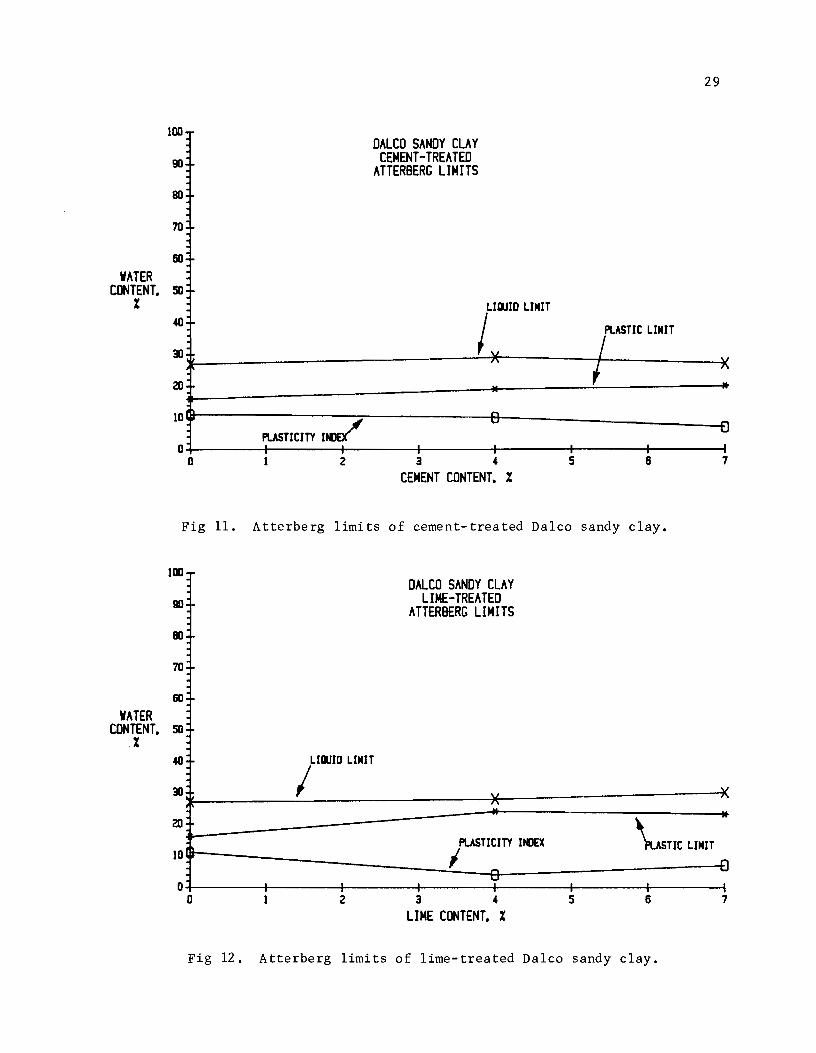
ATTERBERG LIMITS
As shown in Table 4 and Figures 7 through 12, both cement and lime
produced no change or a slight increase in the liquid limits and a large
increase in the plastic limits, thus producing a significant decrease in the
plasticity indices of the treated soils.
The higher plasticity Daleo clay exhibited an approximate 50 percent
decrease in the plasticity index, whereas Beaumont and Daleo sandy clays
exhibited lower reductions of the plasticity index. The lime was slightly
more effective in reducing the plasticity index; however, except for the
Daleo sandy clay, the differences were of no practical significance.
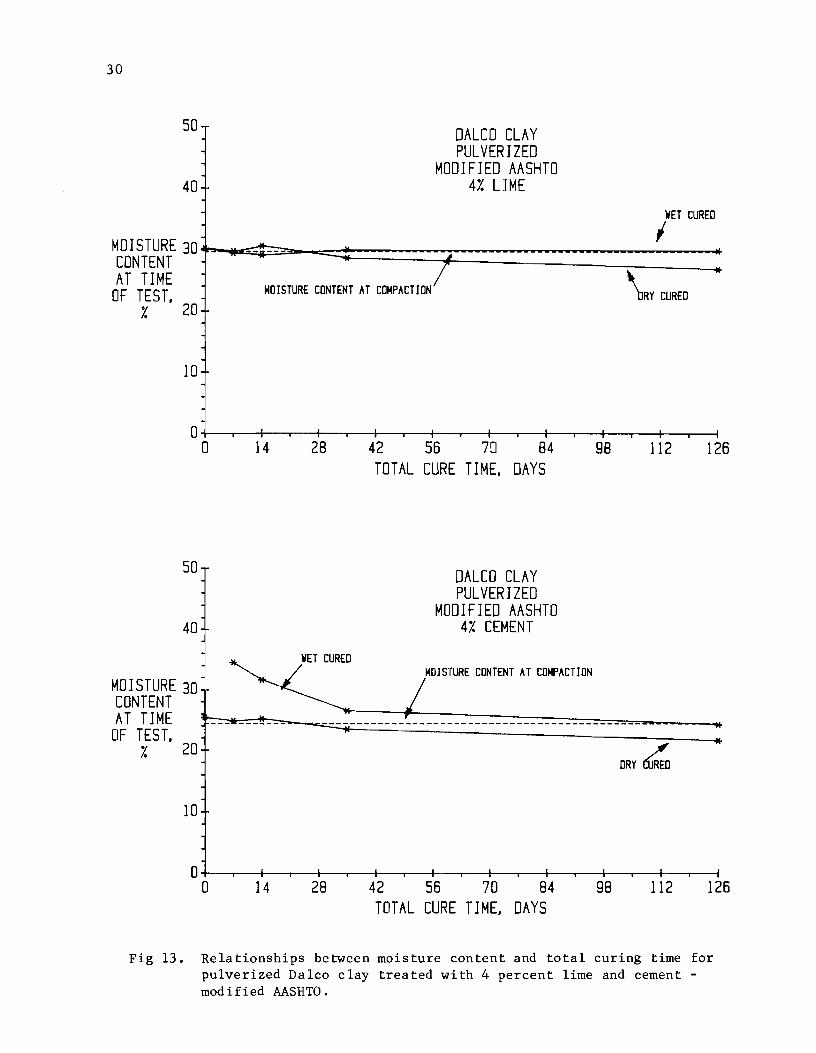
MOISTURE CONTENT AFTER CURING
After testing each specimen, a moisture sample was obtained and the
moisture content for each specimen was determined at the time of testing.
Figures 13 through 22 show the changes in moisture content with time for both
dry and wet cured specimens.
All specimens were subjected to dry curing. The specimens labeleJ
wet cured, however, were subjected to 7 days of wetting prior to testing.
Thus, there were no wet cured specimens at zero days of total cure time. The
dry cured specimens were wrapped and allowed to cure until tested. Thus, the
9

10
Table 4. Atterberg Limits of Untreated and Treated Soils
Treatment Liquid Plastic Plasticity Soil Level Limit Limit Index
Daleo Clay Untreated 72 33 39
4% Cement 72 51 21
7% Cement 69 49 20
4% Lime 72 52 20
7% Lime 73 57 16
Beaumont Clay Untreated 60 24 36
4% Cement 60 38 22
7% Cement 64 41 23
4% Lime 70 49 21
7% Lime 71 49 22
Daleo Sandy Clay Untreated 27 16 11
4% Cement 29 19 10
7% Cement 27 20 7
4% Lime 28 24 4
7% Lime 30 23 7
reductions in moisture content of the dry cured specimens during the curing
period represent the moisture loss of the specimens.
Daleo Clay
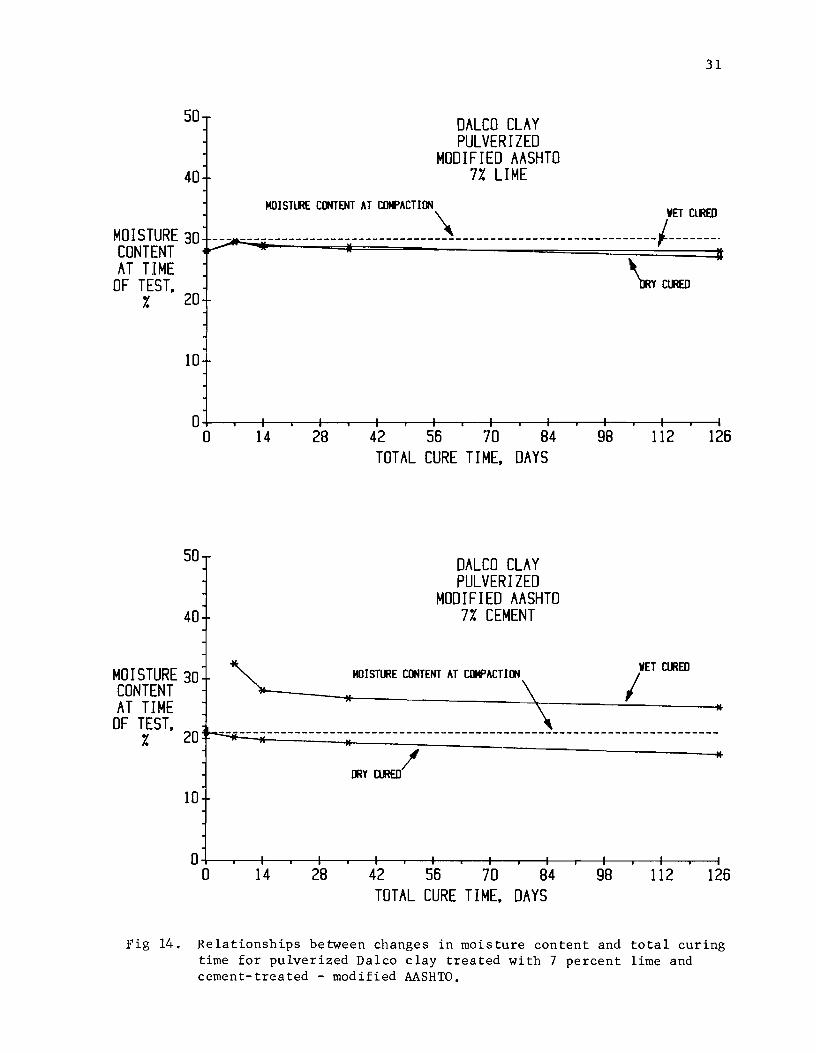
As illustrated in Figures 13 through 15, the pulverized Daleo clay
treated with both cement and hydrated lime and compacted to modified AASHTO
tended to lose about 3 percent moisture during the total curing period. The
unpulverized cement-treated mixtures tended to lose slightly more moisture.
During the 7-day wet cure period the 7 percent lime mixtures indicated
very little moisture increase while the 4 percent lime mixtures exhibited
about 3 percent moisture increase. In contrast, the cement-treated specimens
exhibited much higher moisture gains, especially after relatively short dry
curing periods.
11
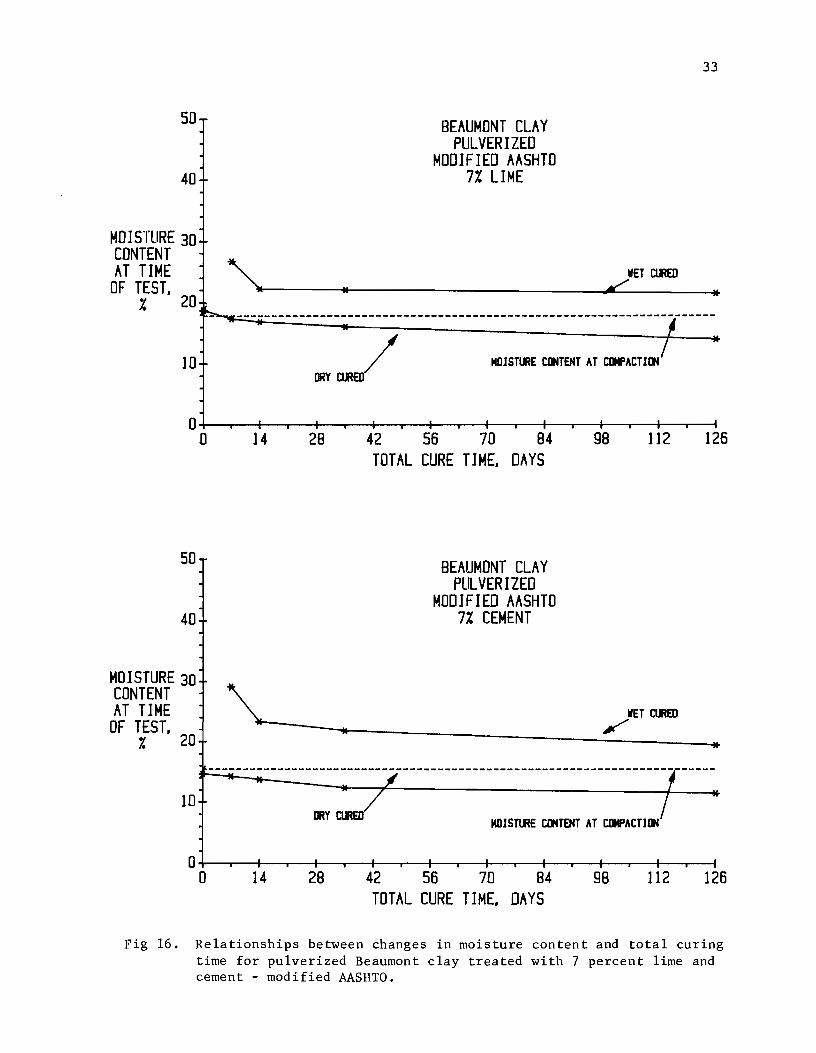
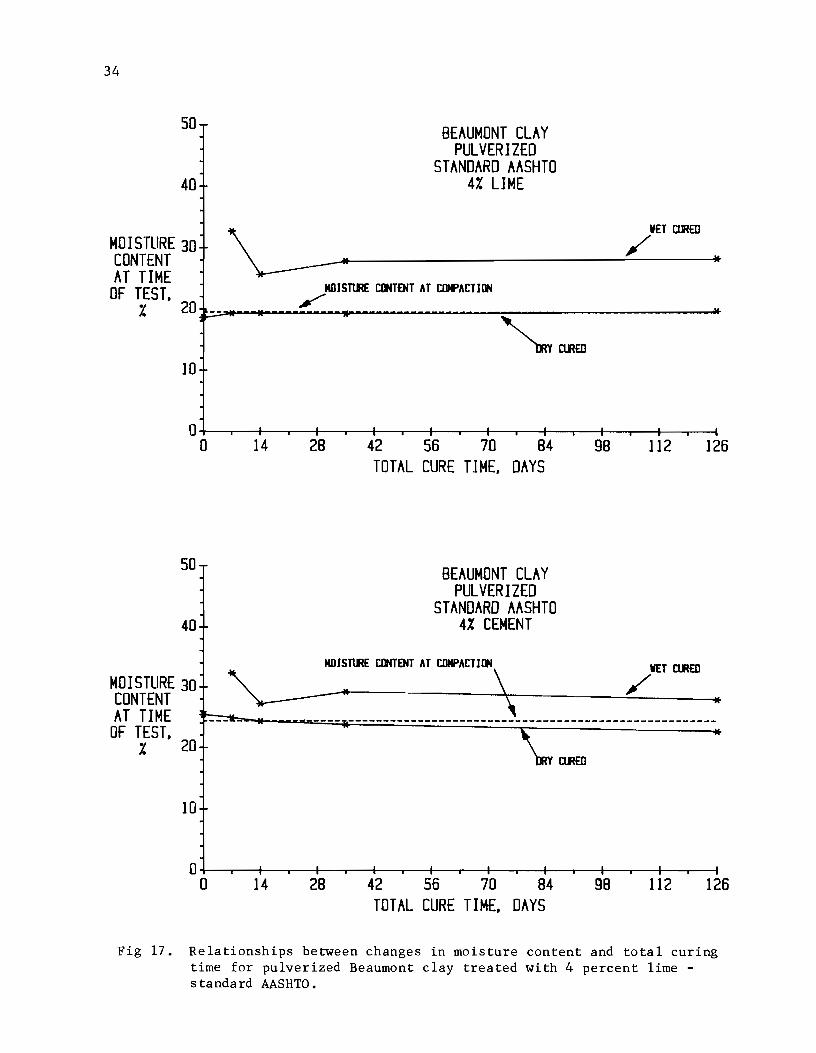
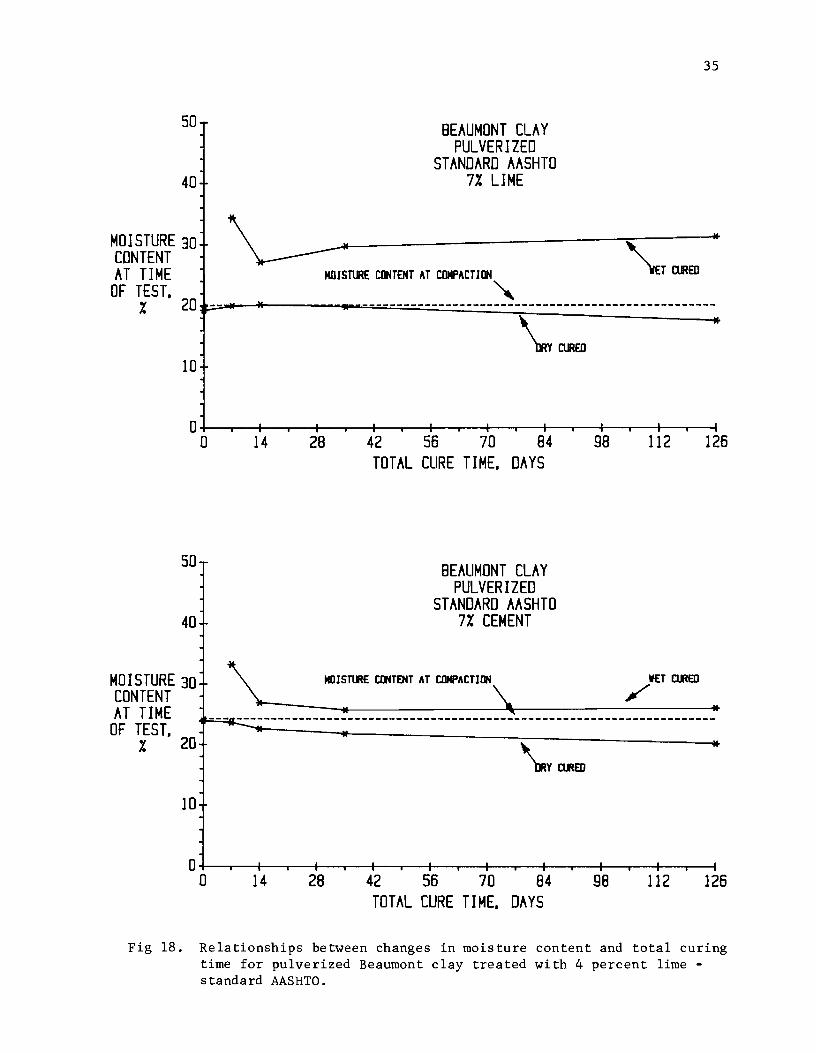
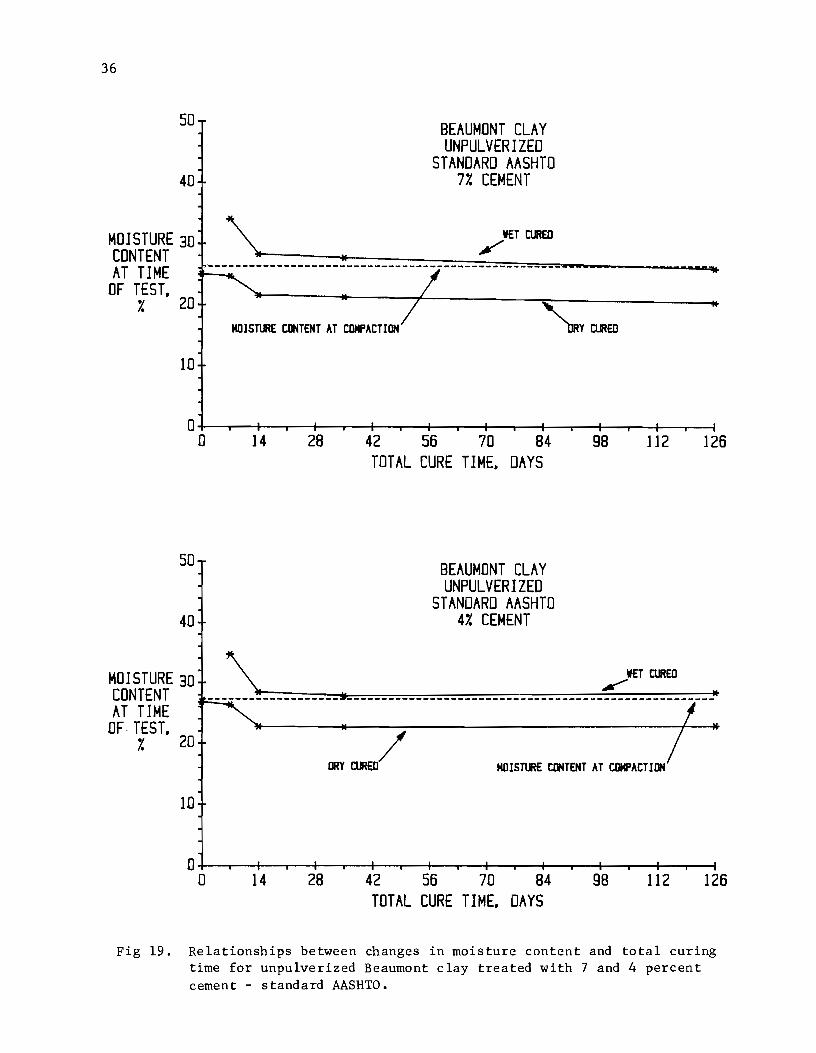
Beaumont Clay
The moisture content relationships for Beaumont clay are illustrated in
Figures 17 through 19. The change in moisture content during the curing
period was highly dependent on degrees of compaction and pulverization. For
pulverized, modified AASHTO compacted specimens, the cement treated mixtures
experienced slightly higher moisture losses during the dry curing periods and
higher moisture gain during wet curing periods. This difference between
cement- and lime-treated material was more evident at early stages of curing.
Lime-treated standard AASHTO compacted Beaumont clay exhibited lower moisture
loss during dry curing than cement-treated Beaumont clay. However, lime
treated specimens gained more moisture than cement-treated specimens when
cured wet. Cement treated unpulverized Beaumont clay showed approximately 5
percent moisture loss for dry cured specimens: however, moisture gain of wet
cured specimens was negligible, except at early stages of curing where
moisture gain was high.
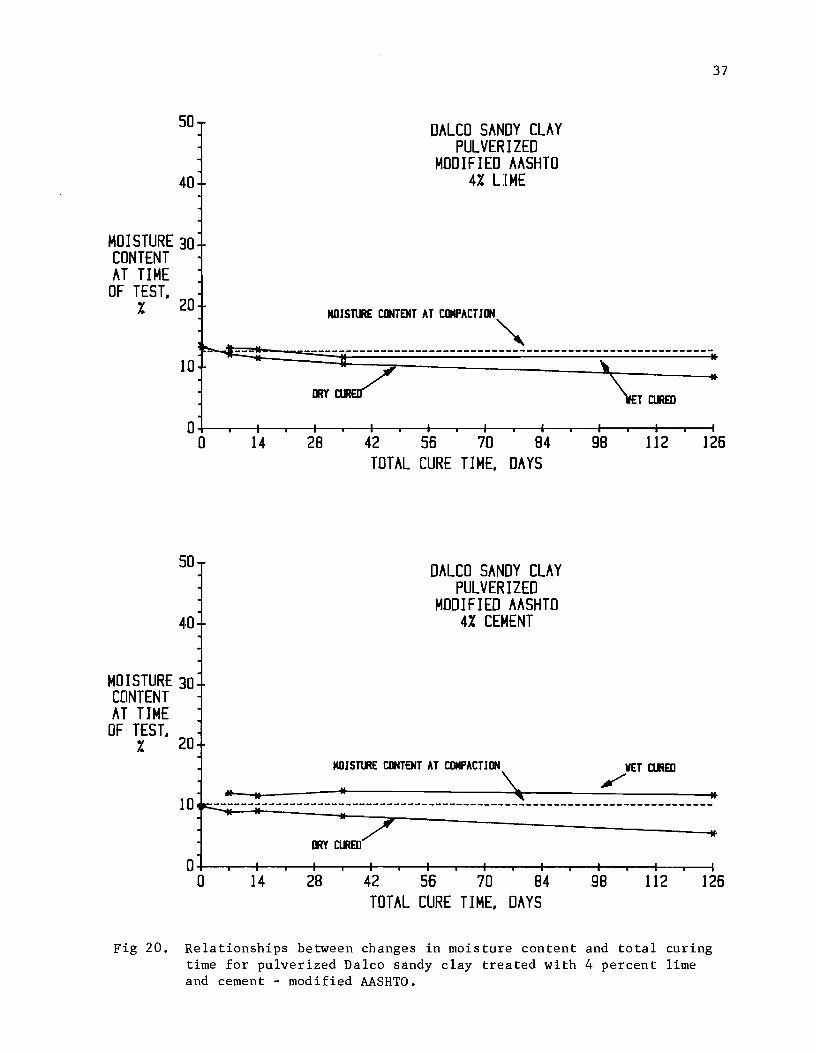
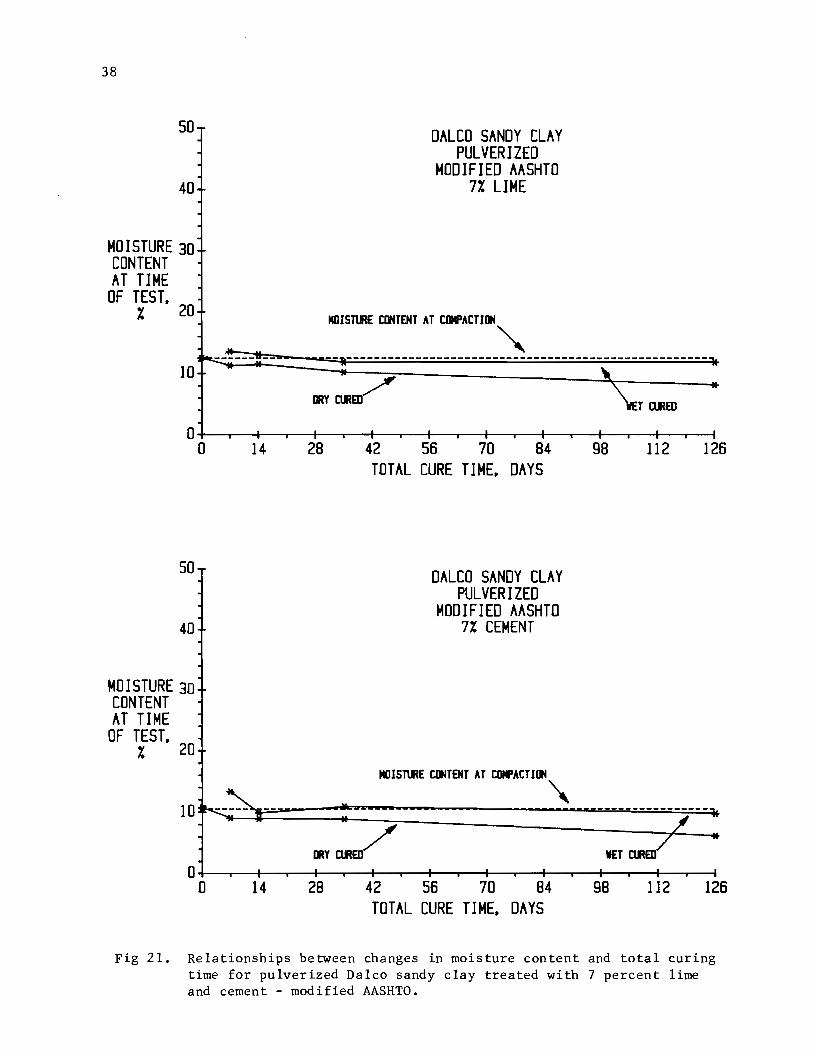
Daleo Sandy Clay
The moisture content relationships for Daleo sandy clay are illustrated
in Figures 20 through 22. Both the lime- and cement-treated materials
exhibited the same amount of moisture loss during dry curing. During wet
curing, all specimens experienced negligible moisture gain except specimens
treated with 4 percent lime which were pulverized and modified AASHTO
compacted. These specimens gained approximately 2 percent moisture. For
Daleo sandy clay, the degree of pulverization generally did not affect
moisture loss during dry curing 1 however, pulverized specimens indicated
lower moisture loss when cured wet. Moisture loss during the wet curing
period means that at the end of 7 days of wet curing, moisture content of the
specimen was less than the moisture content at the time of compaction. This
situation can be possible when the specimen loses more water during the dry
curing period than it can gain during 7 days of wet curing.
In general, the high plasticity Daleo clay and modified compacted
Beaumont clay indicated higher moisture loss when cured wet. It may be
possible that with plastic clays, cement treatment may cause cracking in the
soil which will in turn lead to increased moisture gain. For conditions of
12
this study, this tendency to absorb moisture and cracking is more evident at
early stages of curing.
UNCONFINED COMPRESSIVE STRENGTH
The relationships between unconfined compressive strength and total cure
time are illustrated in Figures 23 through 50. Average strength values are
summarized in Table 5 and individual strength values are contained in
Appendix A.
Both cement and lime treatment increased the strengths of the three
soils, and the magnitude of the strength increase was greater for increased
amounts of lime and cement. The unconfined compressive strength generally
tended to increase with increased curing time. In a few cases, there was a
significant loss in strength between 35 and 126 days of curing, which cannot
be explained except possibly by experimental error.
Pulverized Soil
The effects of cement and lime treatment of soils, which were pulverized
to 100 percent passing the number 4 sieve, were dependent on soil type, or
soil plasticity, and the compactive effort utilized to produce the specimens.
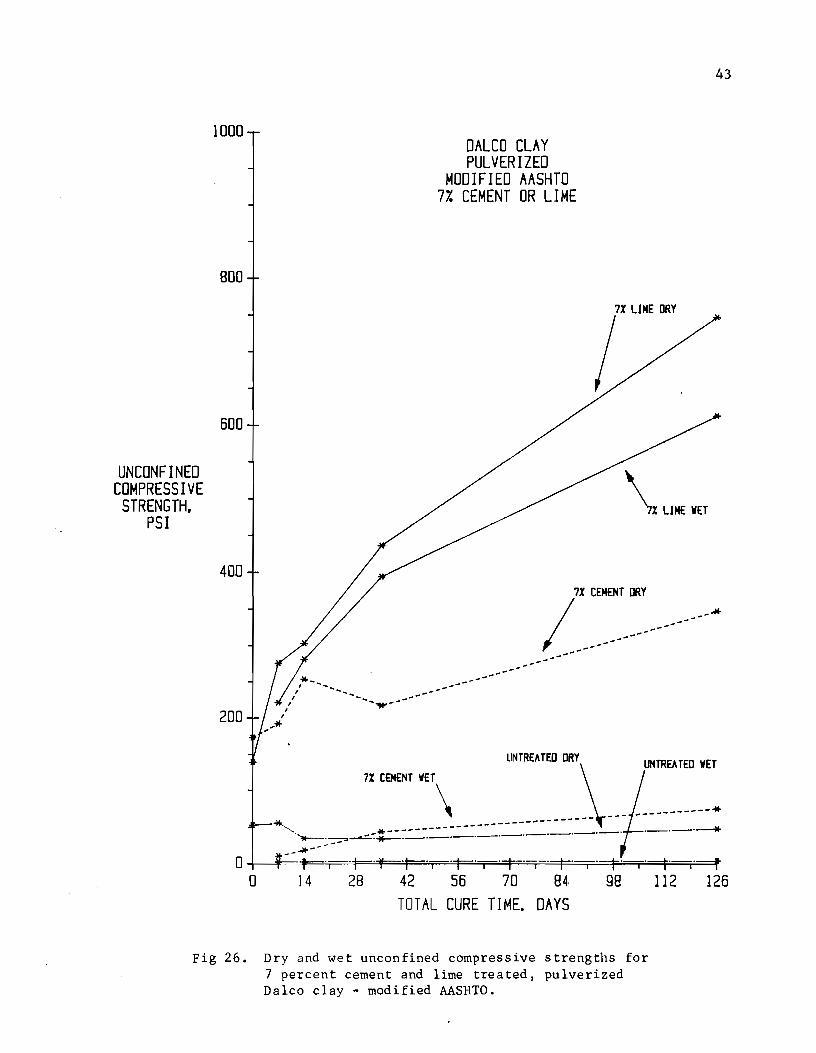
Daleo Clay. The relationships between strength and total curing time
are shown in Figures 23 through 26, and average values are summarized in
Table 5. Lime-treated Daleo clay specimens exhibited significantly higher
strengths than the cement-treated specimens when tested in either the dry or
wet condition.
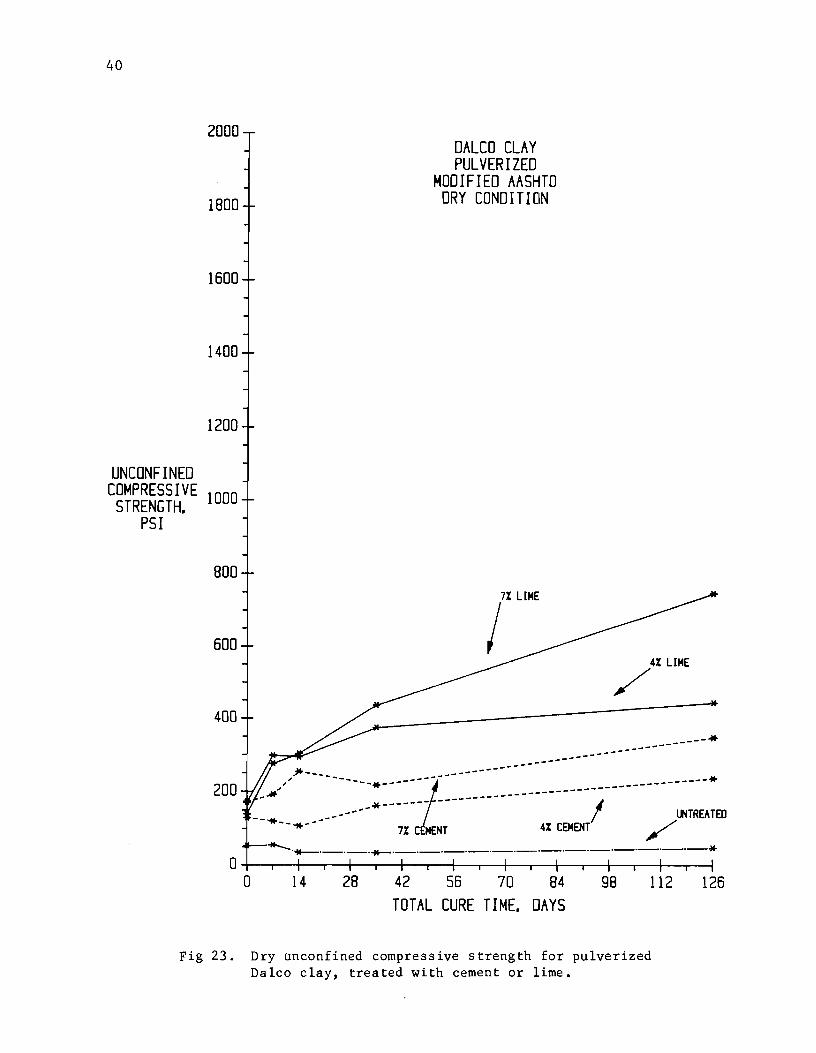
The dry unconfined compressive strengths (Fig 23) of the 4 and 7 percent
lime-treated Daleo clay were relatively high with 126-day strengths of 443
and 746 psi, respectively. The 4 and 7 percent cement-treated clays
exhibited 126-day strengths of 236 and 347 psi, respectively.
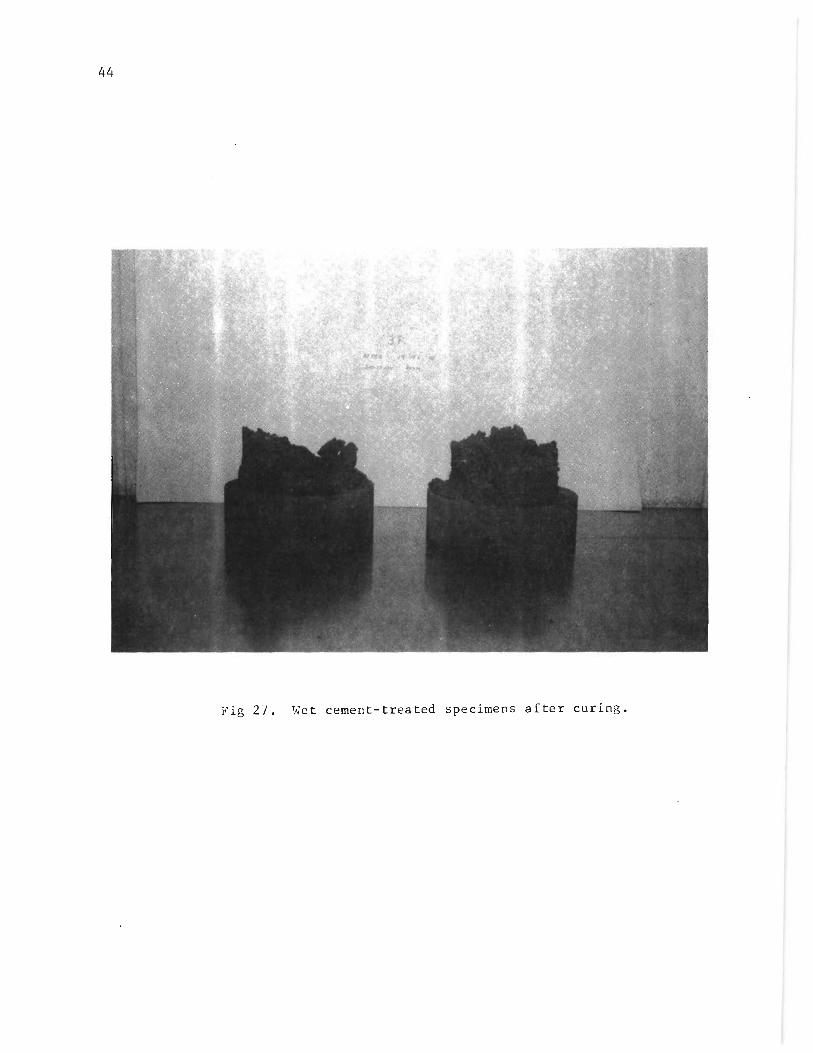
The wet cement-treated soil (Fig 24) had very low strengths at 7 and 14
days of total curing and in some cases the specimens could not be tested
(Fig 27). The strengths increased with further curing but were less than 75
psi after 126 days. In comparison, the 4 and 7 percent lime-treated soils
had wet strengths of 286 and 612 psi after 126 days.

13
Thus, for the dry condition, the lime-treated specimens were
approximately two times stronger than the cement-treated specimens. For the
wet specimens (Fig 24), however, the differences were much greater and in
some cases the lime-treated clays were 10 times stronger than the cement-
treated material. In fact, the wet conditioned compressive strengths of
lime-treated soils were greater than the dry conditioned strengths of the
cement-treated soils at both 4 and 7 percent treatment levels (Figs 25 and
26). These trends occurred throughout the 126-day curing period.
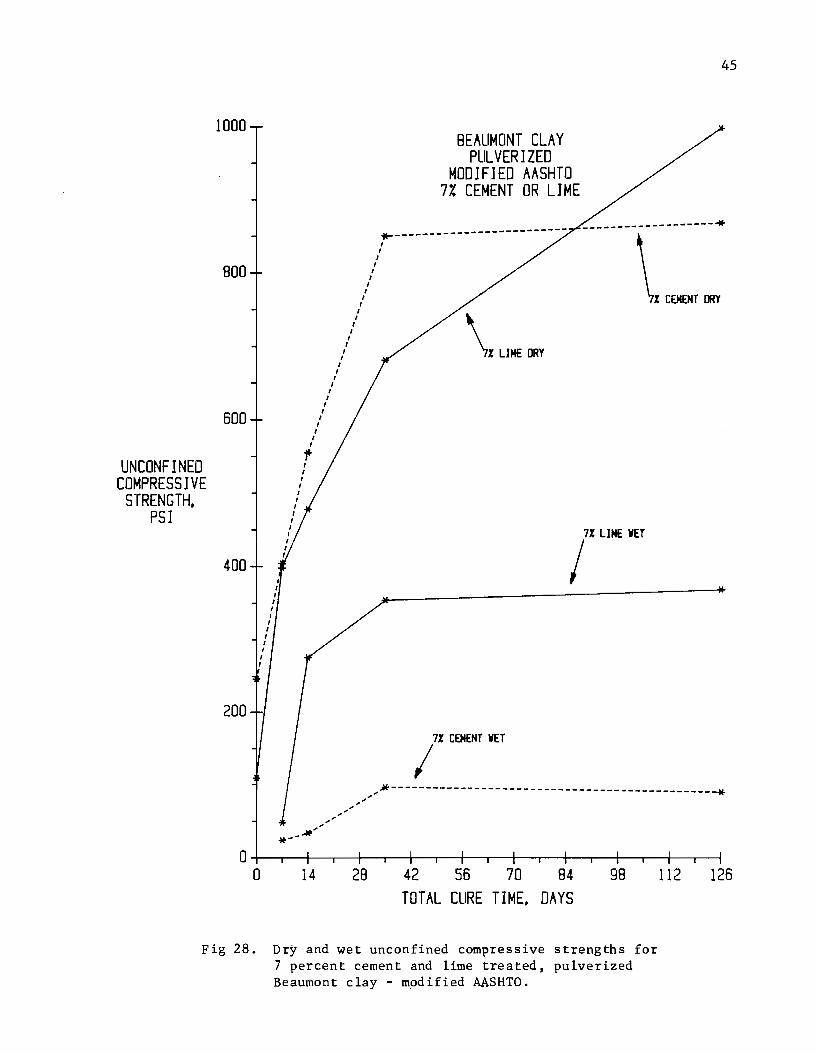
Beaumont Clay. The relationships between strength and curing time are
shown in Figures 28 through 32, and average values are summarized in Table 5.
As shown in Figure 28, the modified compacted Beaumont clay in the dry
condition had essentially equal strengths when treated with 7 percent cement
or lime. After 126 days of curing, however, the lime-treated soils were
slightly stronger than the cement-treated soil. When tested in the wet
condition (Fig 28), however, the strength of the lime-treated soils greatly
exceeded the strength of the cement-treated soil, indicating a significant
loss of strength for the cement-treated specimens. As with the Daleo clay, a
number of wet cement-treated specimens could not be tested, as shown in
Figure 27.
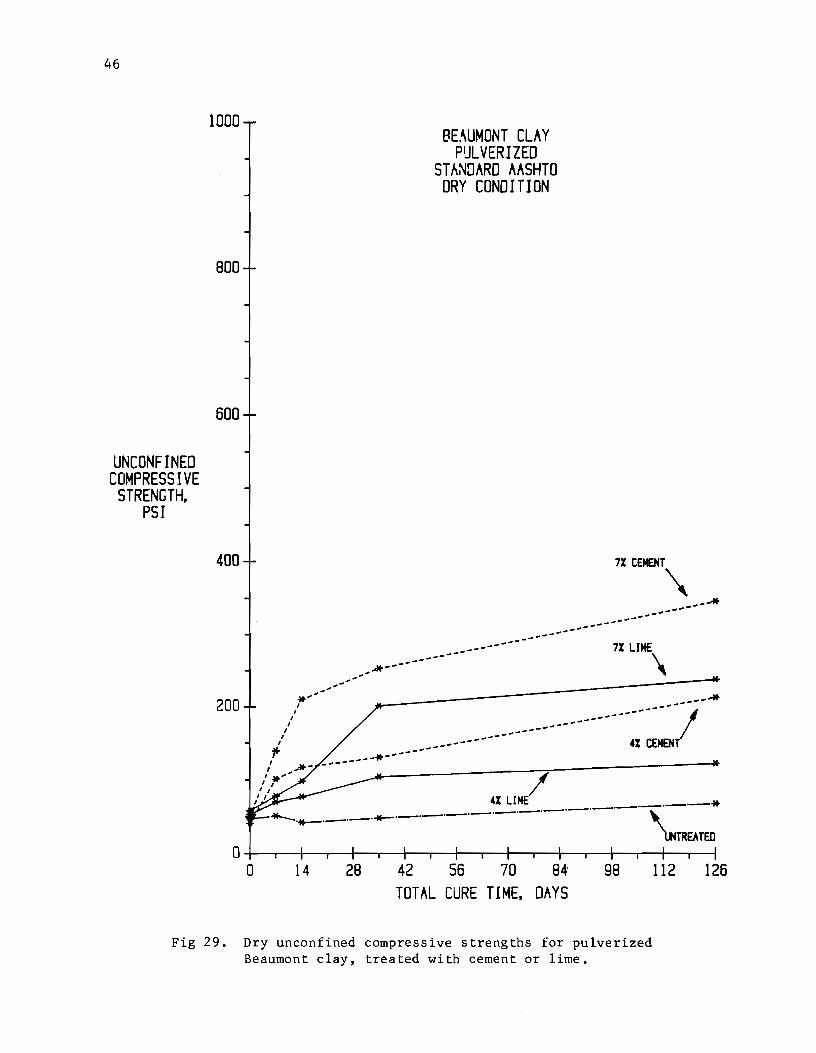
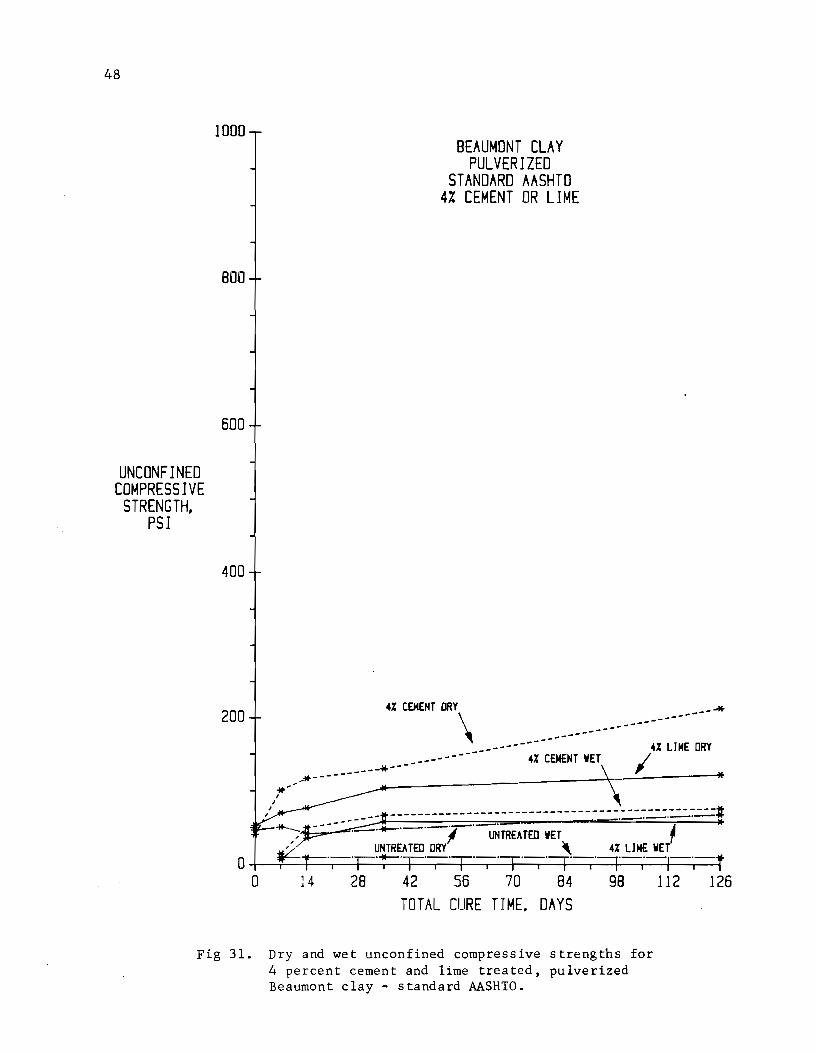
In contrast, for the standard AASHTO compacted Beaumont clay specimens
tested in the dry condition, the cement-treated specimens exhibited greater
strengths than lime-treated specimens (Fig 29) . When tested in the wet
condition (Fig 30), the cement-treated specimens still had higher strengths
but the difference between the dry and wet strengths of the cement-treated
soils was greater than for the lime-treated soils (Figs 31 and 32),
indicating that the cement-treated mixtures suffered a significantly greater
loss in strength as a result of wet curing.
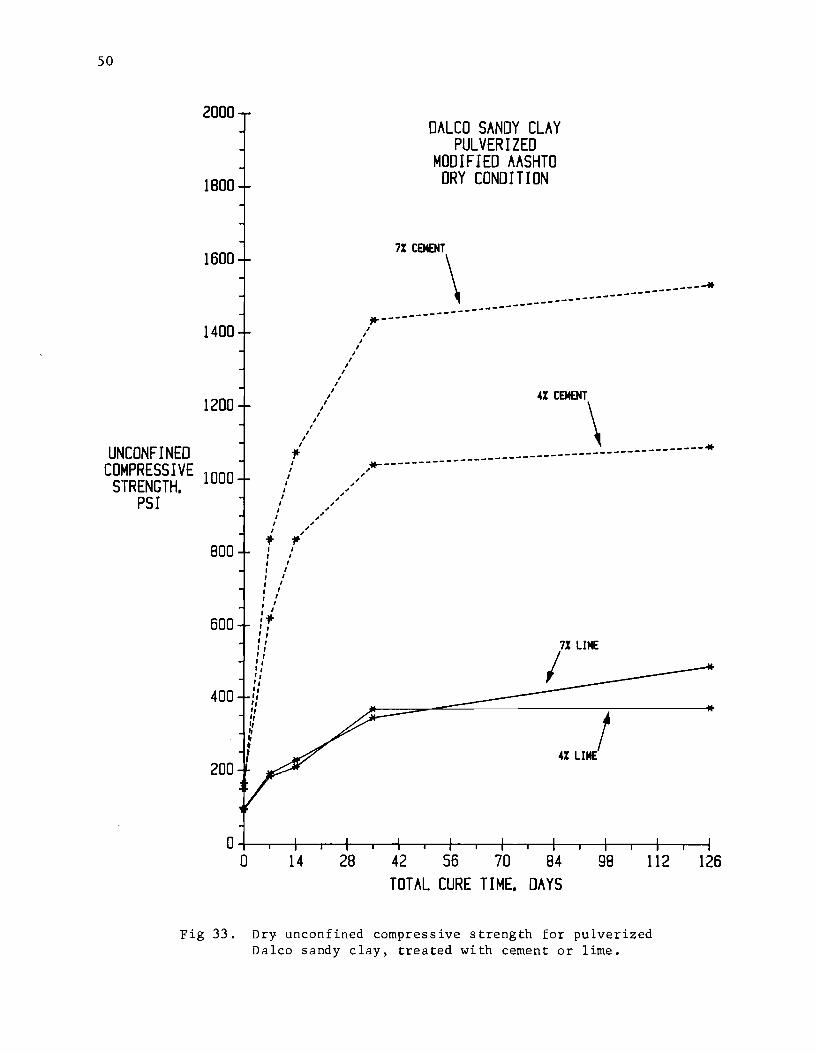
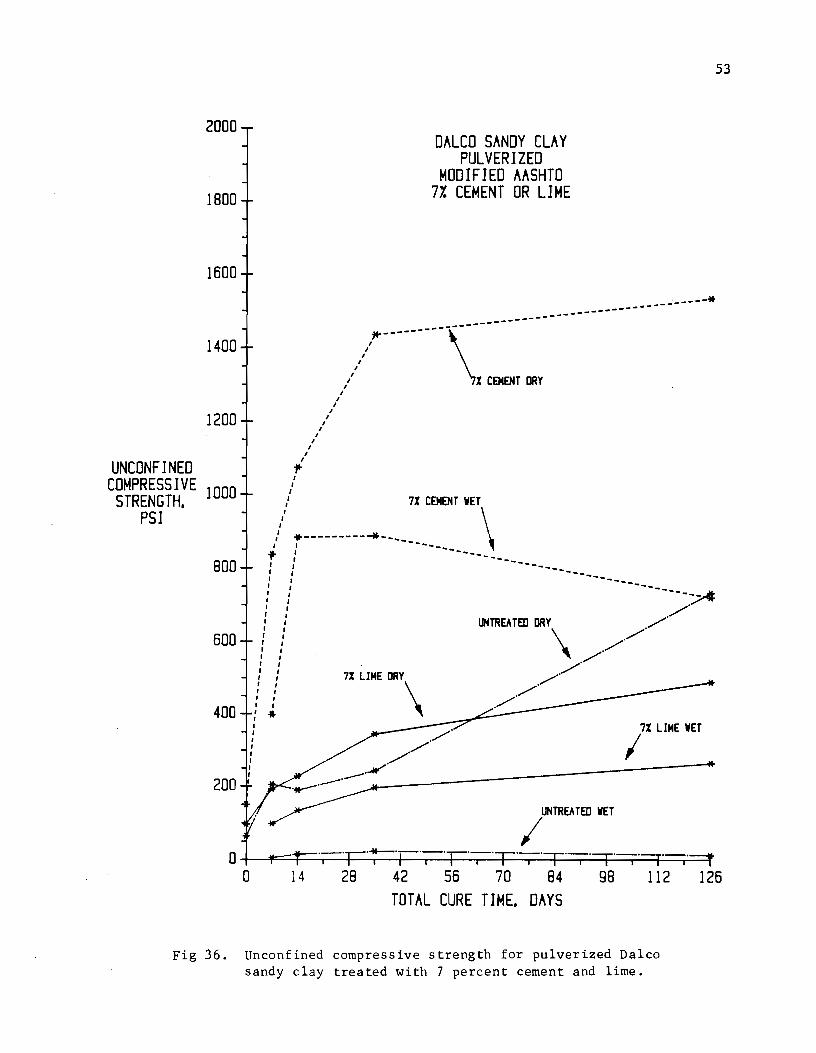
Daleo Sandy Clay. The relationships between strength and curing time
are illustrated in Figures 33 through 36, and average values are summarized
in Table 5. Cement treatment of the Daleo sandy clay produced significantly
greater strengths than lime treatment in both the dry and wet condition (Figs
33 and 34). After 126 days of curing, the dry strengths were 1532 and 1090
for the cement-treated specimens with 7 and 4 percent cement, and 478 and 372
for the lime-treated specimens. In the wet condition, the strengths for the

14
Table 5. Average Unconfined Compressive Strengths
Unconfined ComEressive Stren~ths, J2Si Total Lime-
Compactive ~loisture Cure Untreated Cement-Treated * Treated * Soil Effort Condition Time, PUlv. Pulv. Un2uiv. PUlv.
Days 11% h 7% 4% 7% 4% 7%
Daleo Modified Dry 0 53 129 173 170 139 Clay MSHTO 7 56 120 192 84 172 298 276
14 35 107 254 83 94 294 303 35 34 162 217 96 100 374 436
126 48 236 347 164 167 443 746
Wet 0 7 3 6 11 3 8 234 221
14 3 4 19 0 2 265 281 35 4 59 44 36 23 346 394
126 4 66 75 42 21 286 612
Beaumont Modified Dry 0 144 246 109 Clay MSHTO 7 208 404 398
14 251 555 478 35 319 850 681
126 724 866 995
Wet 7 0 24 48 14 0 34 276 35 0 96 354
126 0 89 368
Beaumont Standard Dry 0 47 41 49 41 46 53 58 Clay MSHTO 7 51 101 139 72 151 70 78
14 42 117 210 91 172 77 98 35 48 130 253 117 229 104 201
126 68 213 346 203 294 122 238
Wet 7 1 15 25 4 13 7 12 14 0 50 104 20 20 36 59 35 0 67 152 25 46 58 133
126 0 76 110 21 71 58 133
Daleo Modified Dry 0 65 166 150 153 155 94 97 Sandy MSHTO 7 205 621 836 525 513 184 192 Clay 14 189 836 1074 668 721 210 228
35 243 1040 1435 934 907 368 344 126 731 1090 1532 816 1305 372 487
Wet 7 6 384 397 31 271 113 98 14 16 632 883 251 410 140 134 35 23 643 887 419 470 213 196
126 12 406 718 175 565 216 263
* Additive expressed as percent by dry weight of soil.

15
cement-treated specimens were 718 and 406 psi and strengths for the lime
treated specimens were 263 and 216 psi. Thus, a greater loss was exhibited
for the cement-treated soils than for the lime-treated soils (Figs 35 and
36). Nevertheless, the cement-treated soils with both 4 and 7 percent cement
were stronger than the lime-treated soils. This is basically opposite to the
trends exhibited by the Daleo clay and is attributed to the coarser grain
size and lower plasticity.
Effect of Pulverization of Cement-Treated Soils
It has been suggested that a high degree of soil pulverization is not
necessary prior to adding portland cement. This in effect would leave small
clods of soil coated with cement and would not allow the cement to be
intimately mixed with the soil particles. Thus, for the cement-treated
portion of the study, the soil was also mixed with unpulverized soil as
described under Laboratory Procedure - Pulverization, p. 4.
The relationships between unconfined compressive strength and total cure
time for unpulverized and pulverized cement-treated specimens are contained
in Figures 37 through 48.
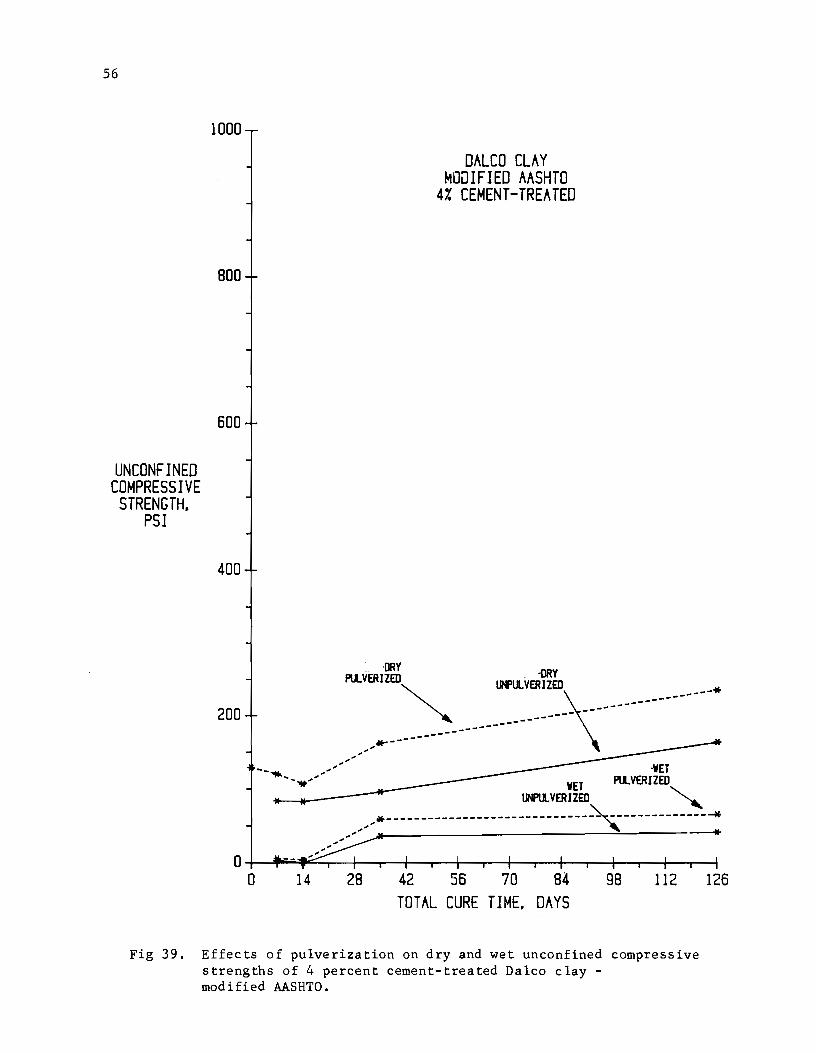
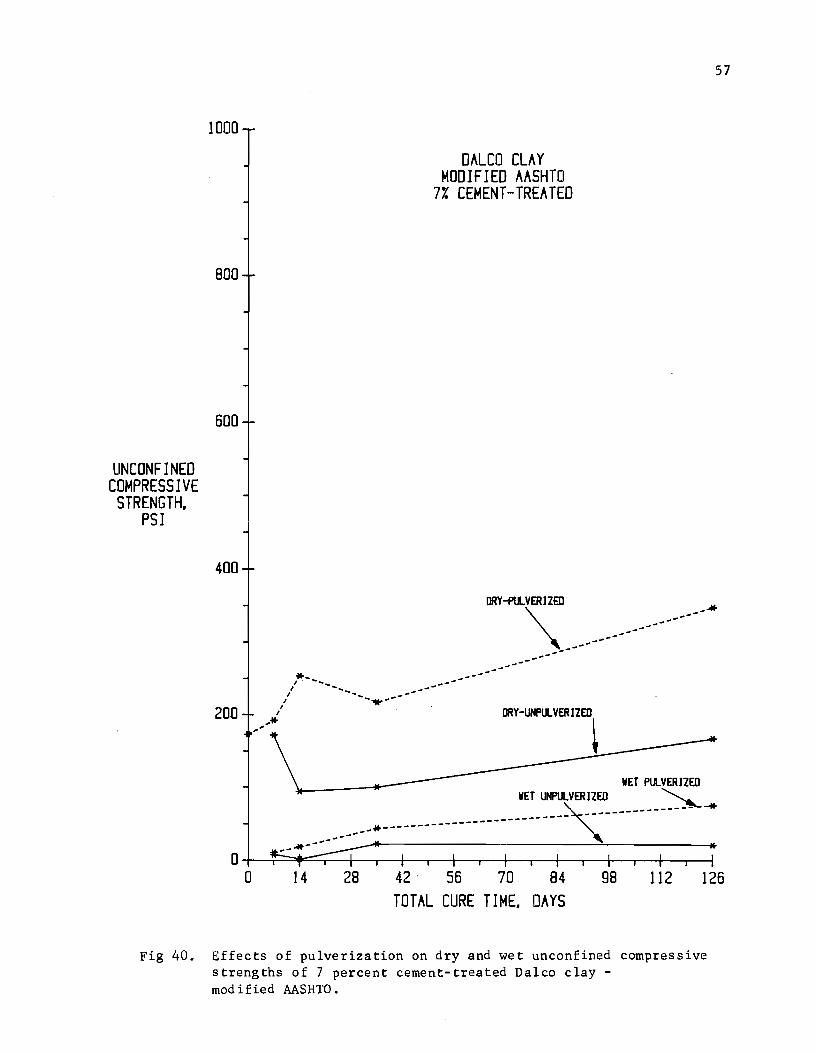
Daleo Clay. In the dry condition, modified compacted specimens
containing unpulverized soil were significantly weaker than specimens
containing pulverized soil (Fig 37). After 126 days of curing, the specimens
with 7 percent cement and unpulverized soil were only 50 percent as strong as
the specimens containing pulverized soil. Similarly, with 4 percent cement
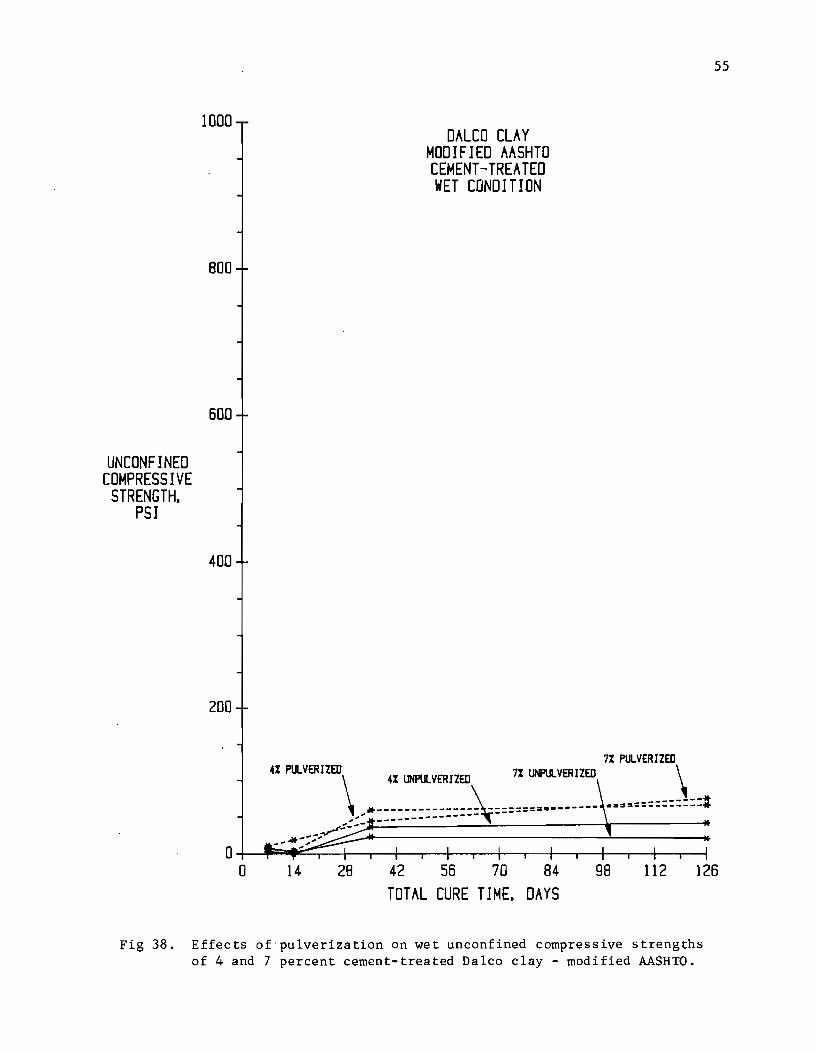
the unpulverized specimens were about 67 percent as strong. In the wet
condition, the losses were even greater, as shown in Figure 38. A comparison
of the strength of unpulverized and pulverized specimens, tested wet and dry,
illustrates the importance of pulverization (Figs 39 and 40).
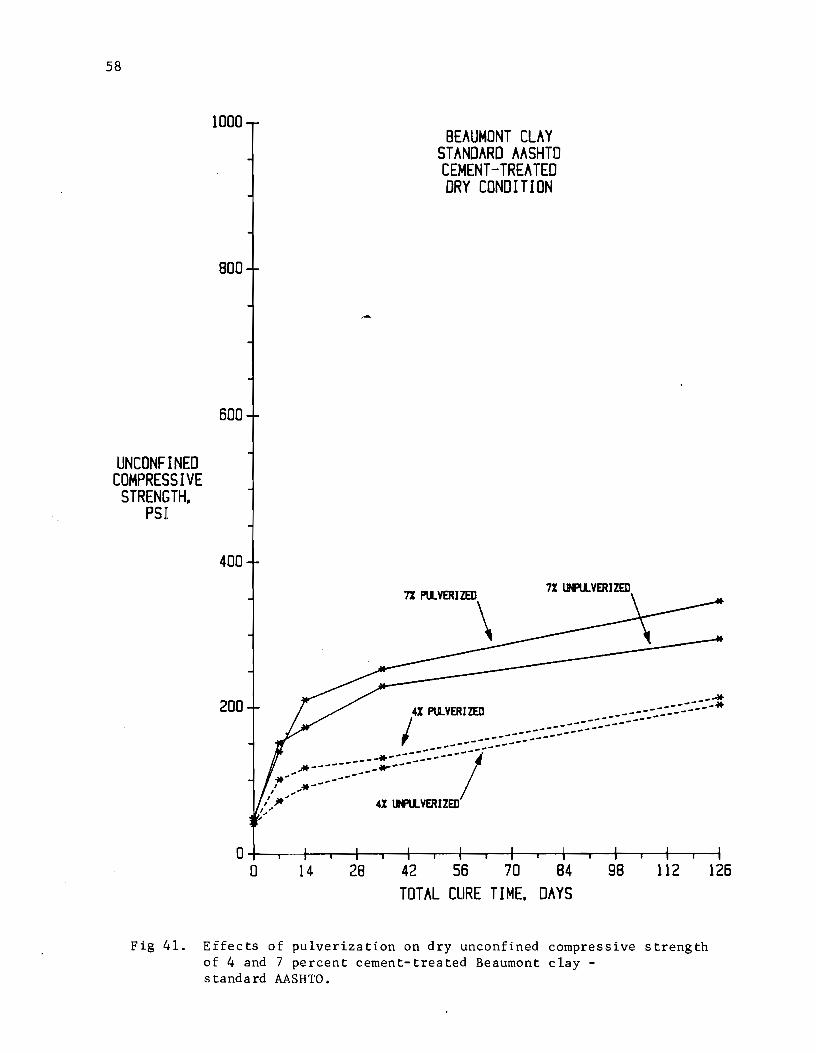
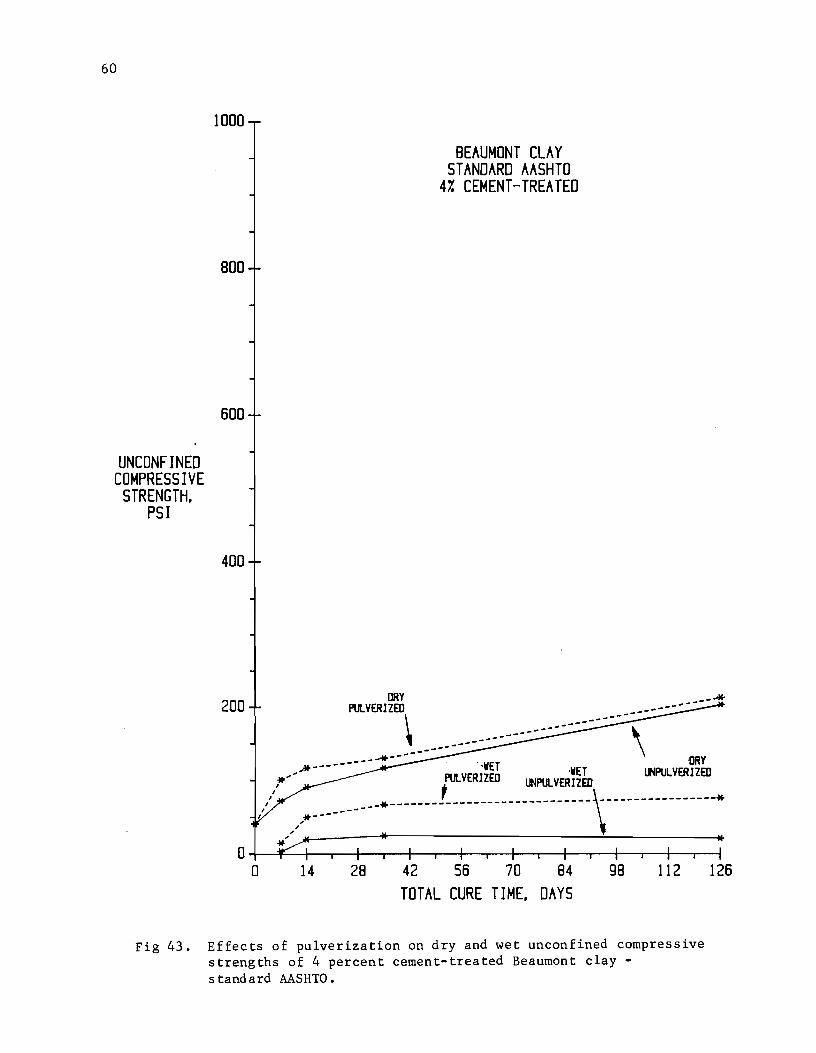
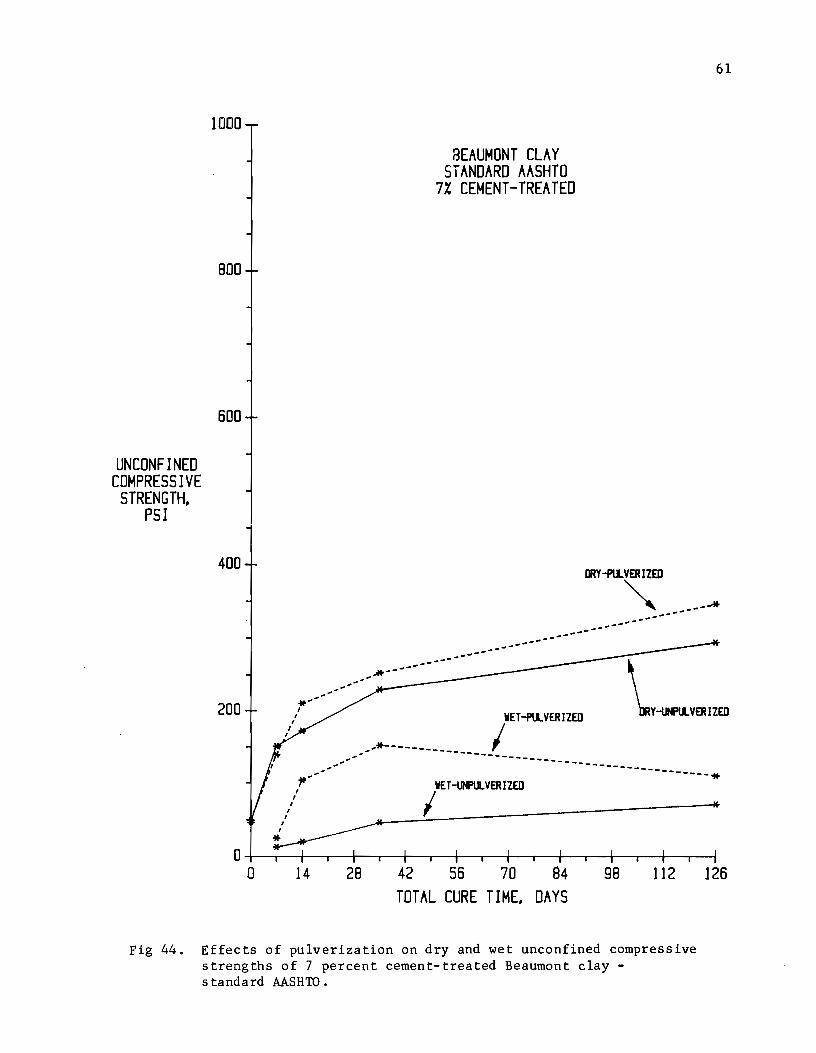
Beaumont Clay. For the Beaumont clay, the effects of degree of
pulverization were only evaluated for specimens compacted by standard AASHTO
procedures. As shown in Figures 41 through 44, the effects of pulverization
were similar to those exhibited by the Daleo clay specimens. The losses in
the dry condition, however, were not as great and the losses in the wet
condition were much larger than for Daleo clay.
16
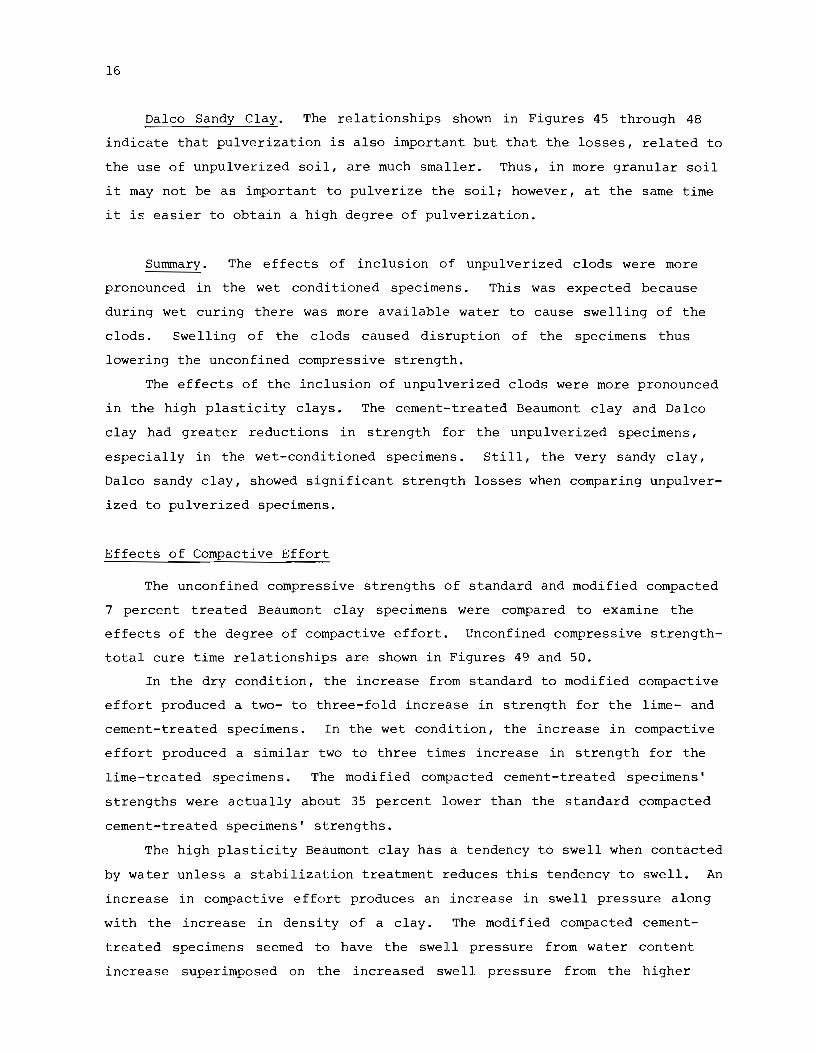
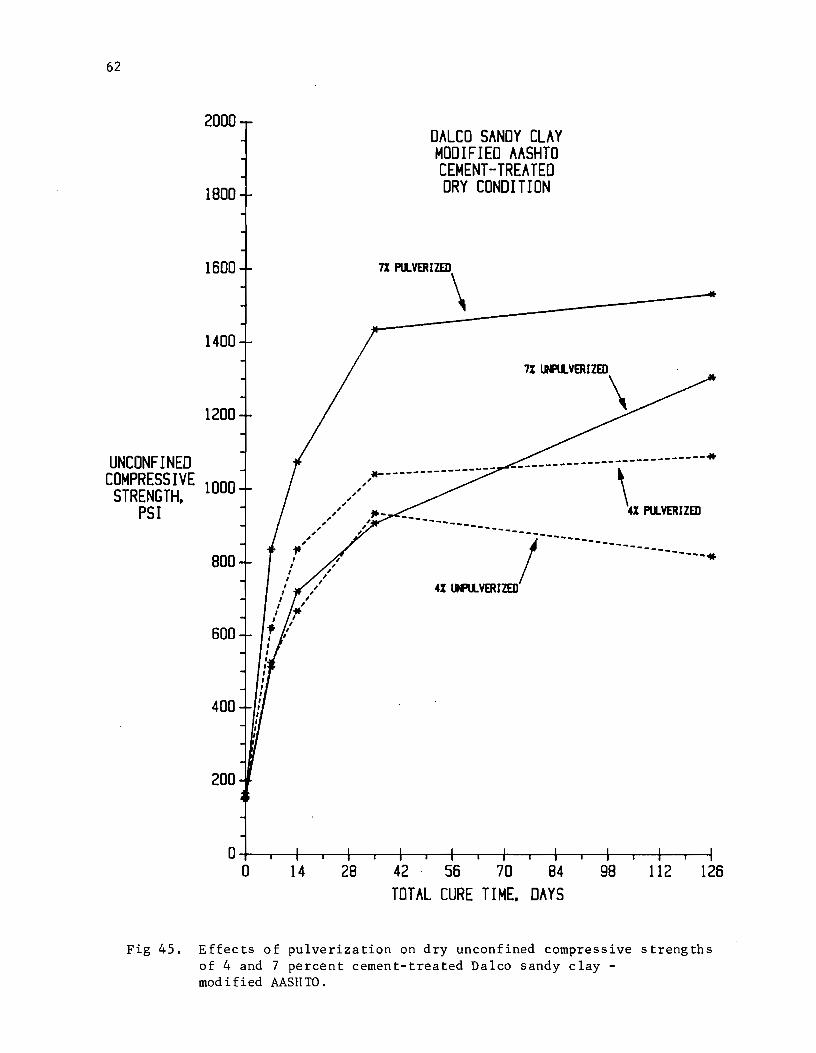
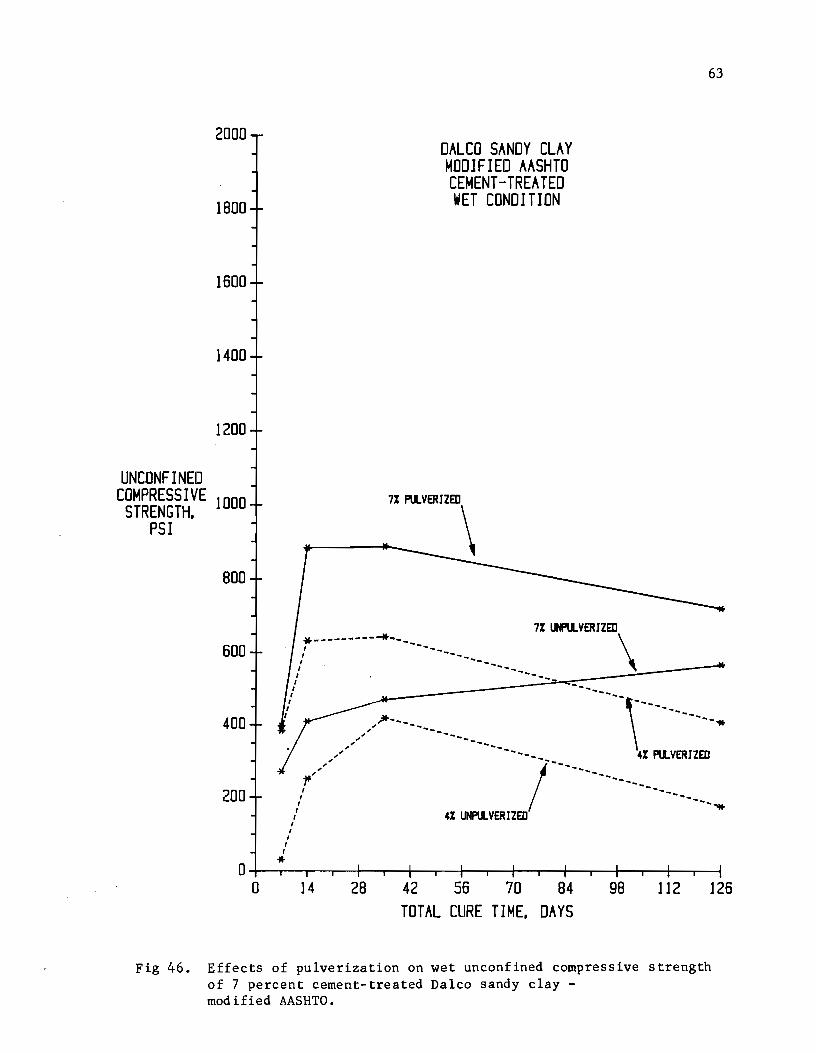
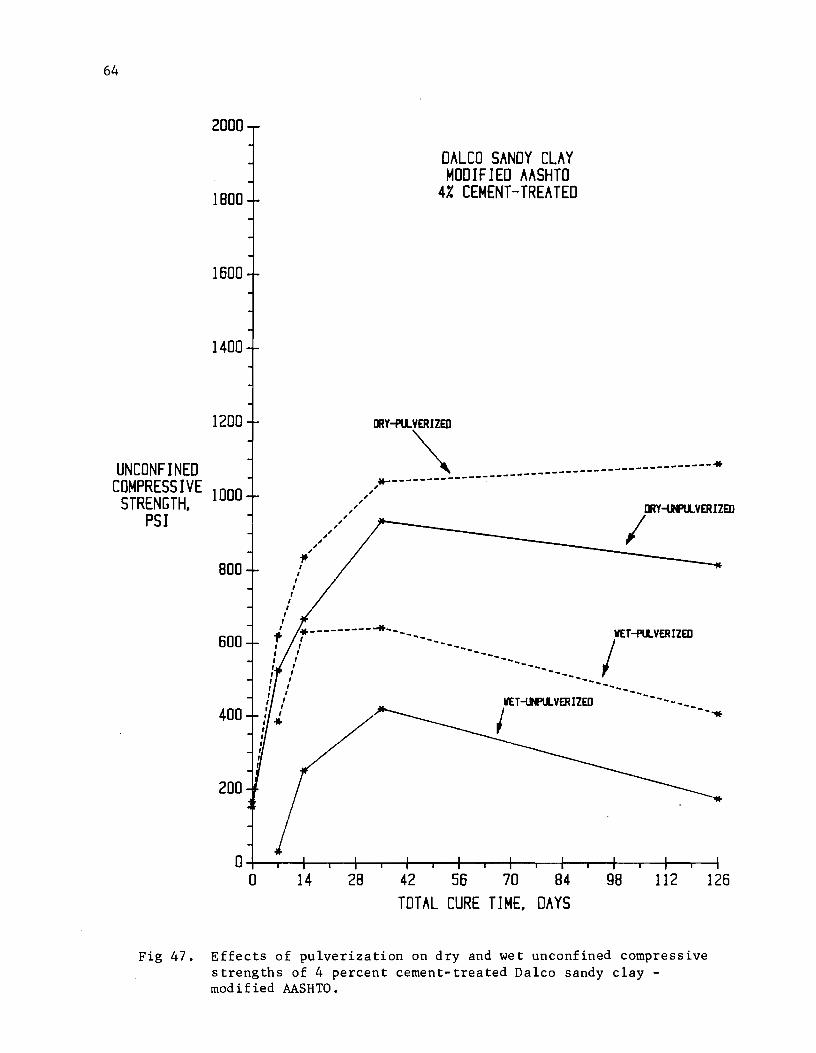
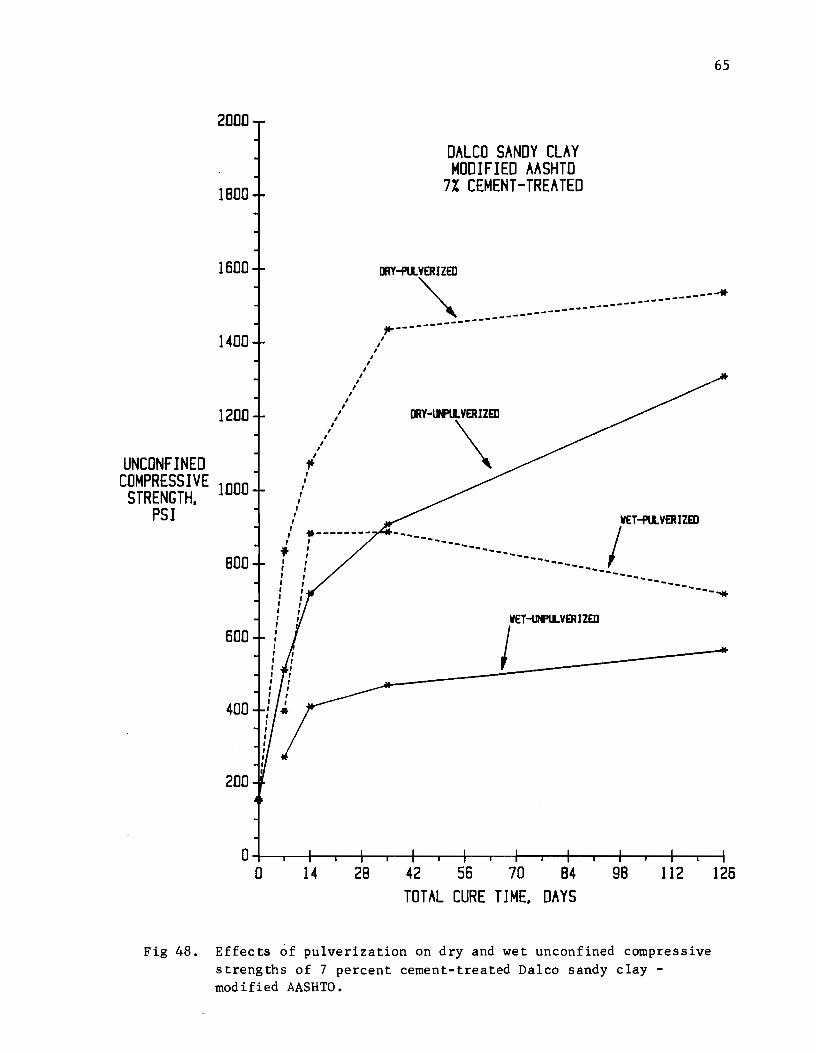
Daleo Sandy Clay. The relationships shown in Figures 45 through 48
indicate that pulverization is also important but that the losses, related to
the use of unpulverized soil, are much smaller. Thus, in more granular soil
it may not be as important to pulverize the soil~ however, at the same time
it is easier to obtain a high degree of pulverization.
Summary. The effects of inclusion of unpulverized clods were more
pronounced in the wet conditioned specimens. This was expected because
during wet curing there was more available water to cause swelling of the
clods. Swelling of the clods caused disruption of the specimens thus
lowering the unconfined compressive strength.
The effects of the inclusion of unpulverized clods were more pronounced
in the high plasticity clays. The cement-treated Beaumont clay and Daleo
clay had greater reductions in strength for the unpulverized specimens,
especially in the wet-conditioned specimens. Still, the very sandy clay,
Daleo sandy clay, showed significant strength losses when comparing unpulver
ized to pulverized specimens.
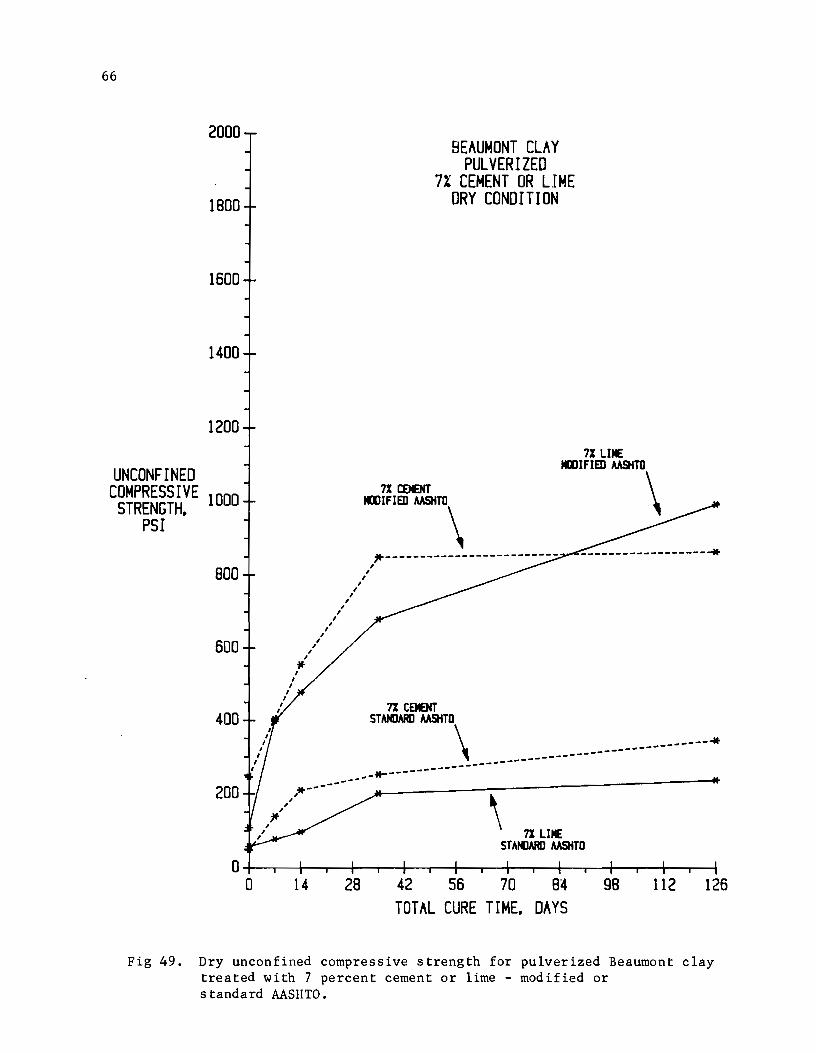
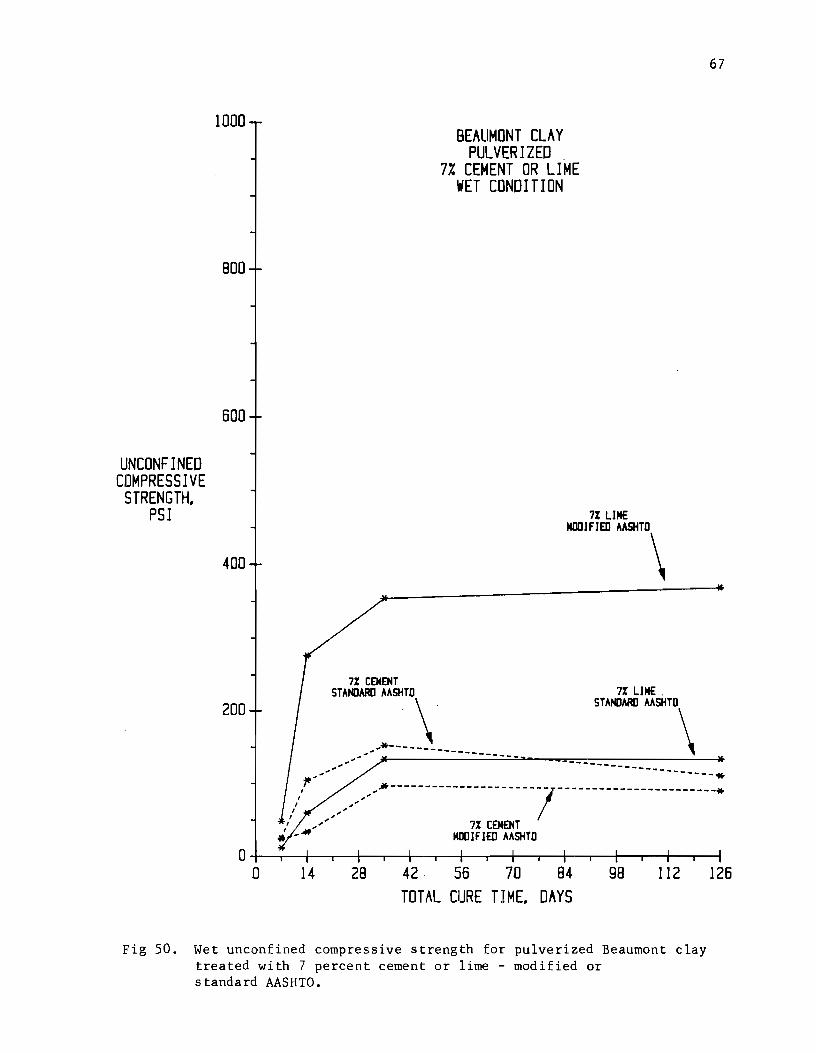
Effects of Compactive Effort
The unconfined compressive strengths of standard and modified compacted
7 percent treated Beaumont clay specimens were compared to examine the
effects of the degree of compactive effort. Unconfined compressive strength
total cure time relationships are shown in Figures 49 and 50.
In the dry condition, the increase from standard to modified compactive
effort produced a two- to three-fold increase in strength for the lime- and
cement-treated specimens. In the wet condition, the increase in compactive
effort produced a similar two to three times increase in strength for the
lime-treated specimens. The modified compacted cement-treated specimens'
strengths were actually about 35 percent lower than the standard compacted
cement-treated specimens' strengths.
The high plasticity Beaumont clay has a tendency to swell when contacted
by water unless a stabilization treatment reduces this tendency to swell. An
increase in compactive effort produces an increase in swell pressure along
with the increase in density of a clay. The modified compacted cement
treated specimens seemed to have the swell pressure from water content
increase superimposed on the increased swell pressure from the higher
17
compactive effort. This increased swell pressure caused disruption of the
modified compacted cement-treated specimens, leading to low strengths. The
lime-treated modified compacted specimens did not show a decrease in strength
from the standard compacted specimens when both were tested in the wet
condition. It has to be assumed that the lime treatment reduced the tendency
of this soil to swell when contacted by water.

CHAPTER 4. CONCLUSIONS
The following conclusions are based on the findings of this study and
the conditions evaluated.
ATTERBERG LIMITS
1. Neither lime nor cement treatment produced any significant change in
liquid limits.
2. Both lime and cement treatment produced a large increase in plastic
limit, thereby decreasing the plasticity indices.
3. The reduction of the plastic index was greater for the Daleo clay than
for the Beaumont clay or Daleo sandy clay.
MOISTURE CONTENT AFTER CURING
1. For the highly plastic Daleo clay and Beaumont clay which were modified
AASHTO compacted, cement treatment led to higher moisture gain during
wet curing than lime.
2. There is a possibility that cement treatment causes plastic clays to
develop shrinkage cracks during dry curing, therefore causing higher
moisture gain tendencies during wet curing periods.
3. For the less plastic Daleo sandy clay, no apparent difference was
detected between cement- and lime-treated specimens.
4. Generally, cement-treated soils exhibited high moisture gains when
subjected to wetting after short periods of curing.
UNCONFINED COMPRESSIVE STRENGTH
1. Lime treatment produced higher strengths than cement treatment for ~he
modified compacted high plasticity Daleo and Beaumont clays. Signifi
cantly higher strengths were obtained from wet condition tests.
19
20
2. Cement treatment produced significantly higher strengths than lime
treatment for the modified compacted low plasticity Daleo sandy clay.
Higher strengths were obtained in both dry and wet condition tests.
3. Cement treatment of standard compacted Beaumont clay produced slightly
higher strengths than lime treatment for both dry and wet conditions.
4. Wet-conditioned, modified compacted, cement-treated Daleo or Beaumont
clay had low strengths. Extremely low strengths were recorded at total
cure times of 7 and 14 days.
MOISTURE SUSCEPTIBILITY
1. Lime treatment of the modified compacted high plasticity clays provided
a greater retention of their dry-conditioned strength when they were
exposed to moisture. Lime treatment provided 2 to 4 times greater
retention of strength as compared to cement treatment.
2. Lime-treated standard compacted Beaumont clay had slightly higher
strength retention from the dry to wet condition. Although cement
treatment gives higher strengths for both dry and wet conditions than
lime, the amount of strength loss (difference between dry and wet
strengths) is less for lime.
EFFECTS OF DEGREE OF PULVERIZATION
1. A small amount (15 percent) of unpulverized (3/4 inch to 1 1/2 inches)
soil in a cement-treated soil mixture was found to cause a considerable
decrease in strength compared to a cement-treated completely pulverized
(100 percent minus 1/4 inch) soil mixture. This trend was evident for
all three soils tested.
2. Lower strengths were obtained for the wet- and dry-conditioned
unpulverized cement-treated soil specimens but a larger decrease in
strength was observed in the wet-conditioned specimens.
3. Swelling of the dry unpulverized soil clods during curing was thought to
be the major cause of distress in the specimens, thus leading to lower
strengths.
21
EFFECTS OF COMPACTIVE EFFORT
1. Dry-conditioned compressive strengths increased greatly for the lime- or
cement-treated Beaumont clay when the compactive effort was increased
from the standard to modified compactive effort.
2. Wet-conditioned strengths decreased greatly for the cement-treated
Beaumont clay when the compactive effort was increased from the standard
to modified. Lime-treated Beaumont clay's wet-conditioned compressive
strengths increased about the same percentage as the dry-conditioned
strengths with increased compactive effort.
3. Increa.sed swelling pressure induced by the increased compactive effort
was thought to be the cause of the loss of strength in the wet
conditioned cement-treated clay specimen.
4. Lime treatment seemed to reduce the swelling tendencies of the expansive
Beaumont clay while the cement treatment did not.
SUMMARY
Based on the results and conditions of this test program, lime treatment
of the expansive high plasticity soils produced higher compressive strengths
than cement treatment of these soils. Generally, lime treatment produced
higher dry-conditioned strengths but the major advantage occurred for the
wet-conditioned strengths. Lime treatment provided significantly better
resistance to moisture damage when the soils were compacted by the modified
AASHTO compactive effort.
Cement treatment of the low plasticity sandy clay produced significantly
higher compressive strengths than lime treatment of this soil.
22
Fig 1 . Lancaste r Mixe r us ed f or mixing soil a nd additive .
23
-------- --- ---· - - ---.- ··--- ····-----------···---· ----
Fig 2 . Curing of lime - treared soil prior to compaction .
24
Fig 3 . Compaction o f trea t e d a nd untre ated s oil s .
25
Fig 4. Specimen wrapped prior to curing.
Fig 5. Wetting of specimens a fter initi al curing .
26
Total Lime-Compactive Moisture Cure Untreated Cement-Treated Treated
Soil Effort Condition Time, PUlv. Pulv. Un~ulv. PUlv. Days ~ 4% 7\ 4\ 7\ 4% 7\
Daleo Modified Dry 0 2 2 2 2 2 Clay AASHTO 7 2 2 2 2 2 2 2
14 2 2 2 2 2 2 2 35 2 2 2 2 2 2 2
126 2 2 2 2 2 2 2
Wet 7 2 2 2 2 2 2 2 14 2 2 2 2 2 2 2 35 2 2 2 2 2 2 2
126 2 2 2 2 2 2 2
Beaumont Modified Dry 0 2 2 2 Clay AASHTO 7 2 2 2
14 2 2 2 35 2 2 2
126 2 2 2
Wet 7 2 2 2 14 2 2 2 35 2 2 2
126 2 2 2
Beaumont Standard Dry 0 2 2 2 2 2 2 2 Clay AASHTO 7 2 2 2 2 2 2 2
14 2 2 2 2 2 2 2 35 2 2 2 2 2 2 2
126 2 2 2 2 2 2 2
Wet 7 2 2 2 2 2 2 2 14 2 2 2 2 2 2 2 35 2 2 2 2 2 2 2
126 2 2 2 2 2 2 2
Daleo Modified Dry 0 2 2 2 2 2 2 2 Sandy AASHTO 7 2 2 2 2 2 2 2 Clay 14 2 2 2 2 2 2 2
35 2 2 2 2 2 2 2 126 2 2 2 2 2 2 2
Wet 7 2 2 2 2 2 2 2 14 2 2 2 2 2 2 2 35 2 2 2 2 2 2 2
126 2 2 2 2 2 2 2
428 Specimens Total
* Additive expressed as percent by dry weight of soil.
Fig 6. Experimental design for unconfined compression tests.
27
100 DALCO ll.AY LIME-TREATED
90 ATTERBERG LIMITS LIIIJID LIMIT
80 I 70
60
VATER CONTENT, 511
% 40
3D PLASTICITY ItiJEX
2ll I 10
0 0 2 ] 4 5 6 7
LIME CONTENT. %
Fig 8. Atterberg limits of lime-treated Daleo clay.

28
100 BEAUMONT CLAY CEMENT-TREATED
9D ATTERBERG LIMITS
so LI&IJID LIMIT
7D I 60
VATER CONTENT, 50 PlASTIC LIMIT
% I 4ll
~
2D
\.miCITY INJEX 10
D D 2 3 4 5 6 7
CEMENT CONTENT, %
Fig 9. Atterberg limits of cement-treated Beaumont clay.
100 BEAUMONT CLAY
9D LIME-TREATED
ATTERBERG LIMITS
Ill LIIIJID LIMIT
7D I
60 PlASTIC LIMIT VATER I CONTENT. 50
.% 4ll
PLASTICITY INJEX ~ I 2D
10
Q Q 2 3 4 5 6 7
LIME CONTENT, %
Fig 10. Atterberg limits of lime-treated Beaumont clay.
VATER CONTENT,
%
VATER CONTENT,
%
100
!II
80
70
60
so ..
40 r
~
~
20
10
0 0
Fig
100
90·
80
70
60
50
40
~
20
10 I
0 0
rusTICITY I~ . . 1 2
OALCO SANDY CLAY CEMENT-TREATED
ATTERBERG LIMITS
LUIIID LIMIT
/v "
.... .....
3 4 CEMENT CONTENT. %
29
/rusTIC LIMIT
f
5 6
11. Atterberg limits of cement-treated Daleo sandy clay.
LIIIIID LIMIT
I
2
DALCO SANOY CLAY LIME-TREATED
ATTERBERG LIMITS
v .
PLASTICITY ItfJEX
I ..... '"t
a 4 LIME CONTENT. %
~STIC LIMIT
I . 5 6
Fig 12. Atterberg limits of lime-treated Daleo sandy clay.
" r.
.... lJ
7
v "'
£'\ ... I
7
30
50
40
DALCO CLAY PULVERIZED
MODIFIED AASHTO 47. LIME
IIET CURED
MOISTURE 30r~~~~~~~~~~~~~~~~~~~~ CONTENT AT TIME \ OF TEST. MOISTURE CONTENT AT COMPACTION RY CURED
i. 20
10
0+-~~~~-+--~-r~--~~--~~~--~-+--~~~~
50
40
MOISTURE 30 CONTENT AT TIME
OF TEST. X 20
10
0 14 28 42 56 70 84 TOTAL CURE TIME. DAYS
DALCO CLAY PULVERIZED
MOD I FI ED AASHTO 47. CEMENT
98 112 126
DRY ~
0+-~~~~-+--~~~~~~--+-~~--~-+--~~~~ 0 14 28 42 56 70 84 98 112 126
TOTAL CURE TIME. DAYS
Fig 13. Relationships between moisture content and total curing time for pulverized Daleo clay treated with 4 percent lime and cement -modified AASHTO.
50
40
MOISTURE 30 CONTENT AT TIME
OF TEST. % 20
10
DALCO CLAY PULVERIZED
MODIFIED AASHTO 7% LIME
31
MOISTLRE ~TENT AT COMPACTION VET CLRm
--- ----------------------------~-----------------------------,/-------·
0+-~-4--~~~~4-~--~~-+--~~~--+-~-;--~~
50
40
MOISTURE 30 CONTENT AT TIME
OF TEST. % 20
10
0 14 28 42 56 70 84 TOTAL CURE TIME. DAYS
DALCO CLAY PULVERIZED
MODIFIED AASHTO 7% CEMENT
98 112 126
~ MOISTLRE ~TENT AT COMPACTIOO VET ct.Rm
~--~"------~\~~~~----------------------------------------------~-----------------------~
0+-~--~~-4--~~~~4-~--+-~~~~-+--~~~~ 0 14 28 42 56 70 84 99 112 126
TOTAL CURE TIME. DAYS
Fig 14. Relationships between changes in moisture content and total curing time for pulverized Daleo clay treated with 7 percent lime and cement-treated - modified AASHTO.

32
50
40
MOISTURE 30 CONTENT AT TIME
DALCO CLAY UNPULVERIZED
MODIFIED AASHTO 77. CEMENT
~ VET CURED
~~M----------------"'------------------_.* OF TEST.
% 20 ---~---------------------ji-----------------------------------------
MOJSTU<E DJOTENT AT :.CTJ ... T ~ lliiED •
10
50
40
MOISTURE 30 CONTENT AT TIME
OF TEST. k 20
10
14 28 42 56 70 84 TOTAL CURE TIME. DAYS
DALCO CLAY UNPULVERIZED
MODIFIED AASHTO 47. CEMENT
98 112 126
~ ij£lllJIED
~ ~ "' ~ ----- ~-------:::::----------~-----------------------------------------
MOISTURE CONTENT AT COMPACTION/ ~y CURED
0+--r-4--~-r~~+--r~~,--+--~~~----~~-4----~~ 0 14 28 42 56 70 84 98 112 126
TOTAL CURE TIME. DAYS
Fig 15. Relationships between changes in moisture content and total curing time for unpulverized Daleo clay treated with 7 percent and 4 percent cement - modified AASHTO.
so
40
MOISTURE 30
BEAUMONT CLAY PULVERIZED
MODIFIED AASHTO 77. LIME
AT T1 ME WET MED
33
CONTENT ~
OF TEST, *-----~·~--------------------~~~-------.• 7. 20
10 MOJS'M£ l:lltT£NT AT IJIIPACTlll4
0+-~~--~~~~~~~~~-+--~~~--r-~~--~~ 0 14 28
so
40
CONTENT
42 56 70 84 TOTAL CURE TIME, DAYS
BEAUMONT CLAY PULVERIZED
MODIFIED AASHTO 77. CEMENT
98 112
AT T1 ME weT Men
126
MOISTURE 30 ~
OF TEST, ----.... .. ....__ _______ ~/::_ __ ""'* % 20 *
10 ~y MED
MOJS'M£ l:lltT£NT AT IJIIPACTlll4
0+--r~--~-r~~+--r~~,--+--r-~~--r-~~--~~ 0 14 28 42 56 70 84 98 112 126
TOTAL CURE TIME, DAYS
Fig 16. Relationships between changes in moisture content and total curing time for pulverized Beaumont clay treated with 7 percent lime and cement - modified AASHTO.
34
so
40
MOISTURE 30 CONTENT
BEAUMONT CLAY PULVERIZED
STANDARD AASHTO 4% LIME
\ VET a.RED
~·M----------------------~~~----~~ AT TIME
OF TEST. /MOISME lmTENT AT lliiPACTIIl4
% 201-~-~~--~--.-----------~----------------~
~a.RED 10
0+-~~--~~~~~~--~~-+--~~~--~~~--~4
so
40
MOISTURE 30 CONTENT AT TIME
OF TEST. % 20
10
0 14 28 42 56 70 84 TOTAL CURE TIME. DAYS
BEAUMONT CLAY PULVERIZED
STANDARD AASHTO 4% CEMENT
MDISME lmTENT AT COMPACTI~
~M \
\
98 112 126
VET a.RED
~ *
0+-~~--~~~~~~----~~-+--~~~--~~~--~~ 0 14 28 42 56 70 84 98 112 126
TOTAL CURE TIME. DAYS
Fig 17. Relationships between changes in moisture content and total curing time for pulverized Beaumont clay treated with 4 percent lime -standard AASHTO.
50
40
BEAUMONT CLAY PULVERIZED
STANDARD AASHTO 7% LIME
35
MOISTURE30 ~~M~~~~~~~~~~~~~~* CONTENT \._------ ) AT TIME MOISME CONTENT AT COMPACTION ET ClRED
OF TEST. X % 2or-~-~~----~--=--~--=--~--~--=--=--=--=--=---~--=--=--=--=--~--=--=--=--=--=--=--=--~--
\YCURED 10
D+-~~~~-+--~~~--4-~--~~~--~-+--~~~~
50
40
MOISTURE 30 CONTENT AT TIME
OF TEST. % 20
10
0 14 28 42 56 70 84 TOTAL CURE TIME. DAYS
BEAUMONT CLAY PULVERIZED
STANDARD AASHTO 7% CEMENT
98 112 126
'\. MOJS11.&: or.TENT AT COMPACTION VET MED
~-----~M----~----~~-------~----~M --- ---------------------------------------------------------------------
0+--r~r-~-+--~~~~4-~--~~~--~-+--~~~~ 0 14 28 42 56 70 84 98 112 126
TOTAL CURE TIME. DAYS
Fig 18. Relationships between changes in moisture content and total curing time for pulverized Beaumont clay treated with 4 percent lime -standard AASHTO.
36
50
40
MOISTURE 30 CONTENT AT TIME
OF TEST. ;. 20
10
50
40
MOISTURE 30 CONTENT AT TIME
OF TEST, ;. 20
10
BEAUMONT CLAY LINPULVERIZED
STANDARD AASHTO 7% CEMENT
" ~TMm ~~~~~~/~~--~ II
----------------------------------------------------·· ---. MOlS11.RE CDNTENT AT CDMPACTlDN
14 28 42 56 70 84 TOTAL CURE TIME, DAYS
BEAUMONT CLAY UNPULVERIZED
STANDARD AASHTO 4% CEMENT
98 112 126
~ m~ ....... ,. -------------------~-----------------------------------------------------
MDlSM£ CQNTENT AT ClJIPACTUIN
0+--r~r-,--+--~~-,--+-~--r-~~----~-r~~~~~ 0 14 28 42 56 70 84 98 112 126
TOTAL CURE TIME. DAYS
Fig 19. Relationships between changes in moisture content and total curing time for unpulverized Beaumont clay treated with 7 and 4 percent cement - standard AASHTO.
50
40
MOISTURE 30 CONTENT AT TIME
OF TEST. % 20
10
DALCO SANDY CLAY PULVERIZED
MODIFIED AASHTO 4% LIME
MOISME ~TENT AT I:OMPACTIIII
37
~ r~J:::::::=::::::::::--=-=-~--~-=--=-~--~-;:--=-=--=-=--=-=--=-=--=-=-=--=-~--~-~--~-~--~-~--l-~--~-~--~-~-~--~-~--~-~--
0+-~~r-~-+----~-r~----~~----r-~-1----~-+----r--r-,__,
50
4·0
MOISTURE 30 CONTENT AT TIME
OF TEST. i. 20
10
0 14 28 42 56 70 84 TOTAL CURE TIME. DAYS
OALCO SANDY CLAY PULVERIZED
MODIFIED AASHTO 4% CEMENT
98 112 126
MOJSTLRE ~TENT AT COMPACTION VET ll.RED
... .. " "' / If ------------------------------------------------------------------------
11ft ll.RED
0+-~~r-~-+----r--r-,----+-~----~~-4----~-+----r-~~~ 0 14 28 42 56 70 84 98 112 126
TOTAL CURE TIME. DAYS
Fig 20. Relationships between changes in moisture content and total curing time for pulverized Daleo sandy clay treated with 4 percent lime and cement - modified AASHTO.
38
50
40
MOISTURE 30 CONTENT AT TIME
OF TEST, % 20
10
50
40
MOISTURE 30 CONTENT AT TIME
OF TEST, % 20
14 28
OALCO SANOY CLAY PULVERIZED
MODIFIED AASHTO 7% LIME
MOISTJ.m: ClltTENT AT CllMPACTlr..
""' -------------------------------------------------------~
42 56 70 84 TOTAL CURE TIME, DAYS
OALCO SANDY CLAY PULVERIZED
MODIFIED AASHTO 7% CEMENT
MOISM£ ClltTENT AT COMPAtTlr..
"'
ramo
98 112 126
VET D.fiED
0+-~-+----~~~----r-~-+~~~~~----~-r~----+-~~ 0 14 28 42 56 70 84 98 112 126
TOTAL CURE TIME, DAYS
Fig 21. Relationships between changes in moisture content and total curing time for pulverized Daleo sandy clay treated with 7 percent lime and cement - modified AASHTO.

50
40
MOISTURE 30 CONTENT AT TIME
OF TEST.
DALCO SANDY CLAY UNPULVERIZED
MODIFIED AASHTO 7% CEMENT
i. 20 VET r:tR£0 MOISTURE CONTENT AT llllf'ACTIOH
10 ---~-----~----------------------~-------------------------------• *
y CURED
0+--r~~~-+~~4-~--~~-+--~~~--+-~-4--~~
39
0 14 28 42 56 70 84 98 112 126
50
40
MOISTURE 30 CONTENT AT TIME
OF TEST. i. 20
14 28
TOTAL CURE TIME. DAYS
DALCO SANDY CLAY LINPULVERIZED
MODIFIED AASHTO 4% CEMENT
42 56 70 84 TOTAL CURE TIME. DAYS
98 112 126
Fig 22. Relationships between changes in moisture content and total curing time for unpulverized Daleo sandy clay treated with 7 and 4 percent cement - modified AASHTO.
40
2000
1800
1600
1400
1200
UNCONFINED COMPRESSIVE 1000 STRENGTH,
PSI
800
600
400
200
DALCO CLAY PULVERIZED
MODIFIED AASHTO DRY CONDITICIN
--- --- ---
4% LIME
/ ---------· ---------
_::':~:::::::~~~~:::~::£~~~~~~~~~~ ---:: ~=7 -----;::~:ED ....._·-·-·-·..-·-·-·-·-·-·-·-·-·-·-·-·-·-*
0+--.-+-.-~-.~--,_,__,_,-,-~--~~--~~~ 0 14 28 42 56 70 84
TOTAL CURE TIME. DAYS 98 112
Fig 23. Dry unconfined compressive strength for pulverized Daleo clay, treated with cement or lime.
126

UNCONFINED COMPRESSIVE
STRENGTH, PSI
1000
BOD
600
400
200
0
DALCO CLAY PULVERIZED
MODIFIED AASHTO WET CONDITION
7% LIME
I
4% CEMENT 7% CEMENT
\
UNTREATED ~
~*-- ---------/=-==========~--------·=============# ~~ *------------
./~---4fr--:;
-- .,~~ ·-·t=·=t=·t=·-·T=·-·=t=·-·=t=·-·=t·-·=t·-·=t I I I I I I I
41
0 14 28 42 56 70 84 98 112 126
TOTAL CURE TIME, DAYS
Fig 24. Wet unconfined compressive strength for pulverized Daleo clay, treated with cement or lime.

42
UNCONFINED COMPRESSIVE
STRENGTH. PSI
1000
800
600
400
200
DALCO CLAY PULVERIZED
MOOIF JED AASHTO 4% CEMENT OR LIME
~4% LIME DRY
~-------.....:~~4% LIME VET
UNTREATED
4% CEMENT DRY
.\ ---------* -----------.... -------... ---__ ....... ----___ ... *"'---
~~~~ 4% CEMENT VET
--.,.·-.,.--/" UNTREATED DRY \
"· / ~L ·-·-·-·-· ·-·--* ~~~/ -·+---·-·-· ·-·-·-~ ~~~--------) ----------------------------;-------*
0+-~~=r=F~=4~==F=r=~T=9==r=F=r~~~ 0
Fig 25.
14 28 42 56 70 84 TOTAL CURE TIME. DAYS
98
Dry and wet unconfined compressive strengths for 4 percent cement and lime treated, pulverized Daleo clay - modified AASHTO.
112 126
1000
BOO
600
DALCO CLAY PULVERIZED
MODIFIED AASHTO 7% CEMENT OR LIME
43
7% LIME DRY
I UNCONFINED
\%LIME WET
COMPRESSIVE STRENGTH,
PSI
400
200
0+-~~==r=~~~==r=~=r~==r=~=r~==r=~=T~
0 14 28 42 56 70 84 TOTAL CURE TIME. DAYS
98
Fig 26. Dry and wet unconfined compressive strengths for 7 percent cement and lime treated, pulverized Daleo clay - modified AASHTO.
112 126
44
Fig 27. Wet cement-treated specimens after curing.
1000
BOO
600
UNCONFINED COMPRESSIVE
STRENGTH. PSI
400 I I I I I I
I I I I I I I
200
BEAUMONT CLAY PULVERIZED
MODIFIED AASHTO 7% CEMENT OR LIME
~-------------------------1
I I
I I
I I
I I
I I
I I
I I
I I
I \% LIIE IJ!Y I
I t
I I
I I
I I
I I
I I
t I I I
I I
I I I I I
' I I I 1
1% LIME VET
/7% CEMENT •er
45
0+-~~--~~~--~~-+----~+-~-4--~~~--+-~-4
0 14 28 42 56 70 84 TOTAL CURE TIME, DAYS
98
Fig 28. Dry and wet unconfined compressive strengths for 7 percent cement and lime treated, pulverized Beaumont clay - mpdified AASHTO.
112 126
46
UNCONFINED COMPRESSIVE
STRENGTH. PSI
1000
800
600
400
200
......... ot!l
BEAUMONT CLAY PULVERIZED
ST M·mARD AASHTO DRY CONDITION
7% CEMENT
\ ............ --"""'*
--------------------_______ .......... - 7% LIME
..... -------- \ -- .... -----------------------------------=~--== --*-- ---""*
I ...... -------
1/ ----------------- I l ---------------- 4% CEMEN
/ _ ..... - -------__ -*.----------r--------,.,.,. I I I
,'I 4% LIM -·-·-·-* ~·~·-·-·+--·-·-·-·-·-·-·-·-·-· ~TREATED
0+-~-+-.,-+-,--r-.--~.-~-.~r-.-1--r~--~
0 14 28 42 56 70 84' 98 112 126 TOTAL CURE TIME. DAYS
Fig 29. Dry unconfined compressive strengths for pulverized Beaumont clay, treated with cement or lime.

UNCONFINED COMPRESSIVE
STRENGTH, PSI
1000
800
600
400
200
BEAUMONT CLAY PULVERIZED
STANDARD AASHTO WET CONDITION
--- ... ___ _ 4% CEMENT
47
7% CEMENT
I ----------------·
~ ------*-----------------------------------------------*
0~~~~+=~~~~~~~~~~~~~ 0 14 28 42 56 70 84
TOTAL CURE TIME. DAYS 98 112 126
Fig 30. Wet unconfined compressive strength for pulverized Beaumont clay, treated with cement or lime.
48
UNCONFINED COMPRESSIVE
STRENGTH, PSI
1000
BOD
600
400
200
0
Fig 31.
0
BEAUMONT CLAY PULVERIZED
STANDARD AASHTO 4% CEMENT OR LIME
4% CEMENT DRY _______ ...,..
\ -------------..... -· _ ...... ----*-- 4% LIME CRY * ------------ 4% CEMENT VET I
~~*---------- _------~---* *- __.... I
I
,' ~--.:.;.d_-_-~. -~=~--~--.--:~~~~~:~----:;.::.::.::.=.y:.:.:.:f ~ ·---~~~-T_ED,_DR_Y ·-,--·-·-·-· '-· 4%._L_I~_v_ET __ _
14 28 42 56 70 84 TOTAL CURE TIME. DAYS
98
Dry and wet unconfined compressive strengths for 4 percent cement and lime treated, pulverized Beaumont clay - standard AASHTO.
112 126

UNCONFINED COMPRESSIVE
STRENGTH, PSI
1000
800
600
400
200
Fig 32.
14 28
BEAUMONT CLAY PULVERIZED
STANDARD AASHTO 77. CEMENT OR LIME
42 56 70 84 TOTAL CURE TIME, DAYS
98
Dry and wet unconfined compressive strengths for 7 percent cement and lime treated, pulverized Beaumont clay- standard AASHTO.
49
112 126
so
2000
1800
1600
1400
1200
UNCONFINED COMPRESSIVE 1000 STRENGTH.
PSI
BOO
600
400
200
I
I I
I
I
I I
I
DALCO SANDY CLAY PULVERIZED
MODIFIED AASHTO DRY CONDITICIN
----------------.,..-----------1
I
------
11 4% CEMENT
------------*
// \ ,: *-----------------------------------------------*
I ~ I ~
I / I ~
I / I ~
I ~
I / I ~
I ~ ... .,.~ I I I I I I I I I I I I I I I I f I I I ,.,. If f I
' ' II
'' lr lr ,, II II II lr If
If J II
i 4% LI
0~-,_,--~~----r-.--+--,-,_-r_,r-.--r-.--+--r~
0 14 28 42 56 70 84 TOTAL CURE TIME. DAYS
98 112
Fig 33. Dry unconfined compressive strength for pulverized Daleo sandy clay, treated with cement or lime.
126

UNCONFINED COMPRESSIVE
STRENGTH. PSI
1000
800
600
400
200
DALCO SANDY CLAY PULVERIZED
MODIFIED AASHTO WET CONDITION
IOOP.f.}. TED
51
....-·.-·-·-·+--·-·-·-·-·-·-·-·-·-·-·-·-· 0+--r~----~~--r-.--r-,--+--.~--.-~~--r---~
0 14 28 42 56 70 8( TOTAL CURE TIME. DAYS
98 112
Fig 34. Wet unconfined compressive strength for pulverized Daleo sandy clay, treated with cement or lime.
126

52
2000
1800
1600
1400
1200
UNCONFINED COMPRESSIVE IOOO
STRENGTH. PSI
800
600
400
200
DALCO SANDY CLAY PULVERIZED
MODIFIED AASHTO 4% CEMENT OR LIME
4% C£MENT DRY\ ------------* ~----------------------------------
;
tl-/
; ;
" /
.I ;
.I
; .I
.I
I I
i' r---------~~-='-~\ LI<TR£ATED lilY.>_,/.--" : / ~-~~~~- /'
I -~ /'
f / % Ll E DRY ~--~-~~-- .. ~· : / 4 M / ----: / \ ./· -~~-----: / ' ././ --------... I* ./ I ~------~~--------------------~ I /' : /' : ./· :7
4% LIME WET
I UNTREATED VET
I 0+-~~~~=F-·~M--·~~=,·~~·+=~~==~~~==~~~~~
0 14 28 42 56 70 84 TOTAL CURE TIME. DAYS
98 112
Fig 35. Unconfined compressive strength for pulverized Daleo sandy clay treated with 4 percent cement and lime.
126
2000
1800
1600
1400
1200
UNCONFINED COMPRESSIVE 1000 STRENGTH.
PSI
800
600
400
200
I I
I I
1'" I
I I
I I
I I
I I
I I
I
DALCO SANDY CLAY PULVERIZED
MODIFIED AASHTO 7% CEMENT OR LIME
-------......... ---
// .. ----------\.-~ .... , IJIY
1/ •---------""*·---n CEJ4£JiT "'\
--------
.;. ! -----------: : ------------------
53
----------*
1 t -: : _____________ ..,. I I /""' : : /' t t UNTREATED DRY /' : : \ /' : : ./· : : ..,.../ t t / ! ! 1% LIME DRY\ ./././.
: * t I
UNTREATED WET
I
7% LIME WET
I
O+-~~~~~~~~~~~~~=+~=+~~ 0 14 28 42 56 70 84
TOTAL CURE TIME. DAYS 98 112
Fig 36. Unconfined compressive strength for pulverized Daleo sandy clay treated with 7 percent cement and lime.
126

54
2000
1800
1600
1400
1200
UNCONFINED COMPRESSIVE 1000 STRENGTH.
PSI
800
600
400
200
DALCO CLAY MODIFIED AASHTO CEMENT-TREATED DRY CONDIT ION
4% Pll.VERIZED · 7% Pll.VERIZED \...
7% I.H'\LVERIZED I -------------------- \------- -*
,;1------*----------------- --------------* --~~, -------------------------__ ,..________ *
----..,.. ------ --
11 4% ~rzm
0+-~-4--~4-~-4--~4-~~--~~~~~~~~~
0 14 28 42 56 70 84 TOTAL CURE TIME. DAYS
98 112 126
Fig 37. Effects of pulverization on dry unconfined compressive strengths of 4 and 7 percent cement-treated Daleo clay - modified AASHTO.
UNCONFINED COMPRESSIVE
STRENGTH. PSI
1000
800
600
400
200
DALCO CLAY MODIFIED AASHTO CEMENT-TREATED WET CONDITION
55
14 28 42 56 70 84 TOTAL CURE TIME. DAYS
98 112 126
Fig 38. Effects of·pulverization on wet unconfined compressive strengths of 4 and 7 percent cement-treated Daleo clay - modified AASHTO.
56
UNCONFINED COMPRESSIVE
STRENGTH. PSI
1000
BOO
600
400
DALCO CLAY MODIFIED AASHTO
4% CEMENT-TREATED
200
- ·DRY ·DRY
Pll.VERIZED~ UNPIJLVERIZED\ --------* ""' -----------.. ~---------------------------
.... ........... ~~ ---.,..,"'
14
.... ....
28 42 56 70 84 TOTAL CURE TIME. DAYS
98 112
Fig 39. Effects of pulverization on dry and wet unconfined compressive strengths of 4 percent cement-treated Daleo clay -modified AASHTO.
126
UNCONFINED COMPRESSIVE
STRENGTH. PSI
1000
800
600
400
200 /
.. * ....
DALCO CLAY MODIFIED AASHTO
7% CEMENT-TREATED
---------,""':................ --1 ........ ~~-----
1 .......... ---/ ... .,.., .... -ORr-uNPULVERIZID~
0+-~~~-4--.-+-.-~-r-4-..-~.-4--.-+-.~
57
0 14 28 42 ' 56 70 84 TOTAL CURE TIME. DAYS
98 112 126
Fig 40. Effects of pulverization on dry and wet unconfined compressive strengths of 7 percent cement-treated Daleo clay -modified AASHTO.
58
UNCONFINED COMPRESSIVE
STRENGTH. PSI
1000
800
600
400
200
BEAUMONT CLAY STANDARD AASHTD CEMENT-TREATED DRY CONDITION
7% IHU.VERIZED
--·"'* 4% PULVERIZED -----::--------*
I ------~-::.----_., ____ ------*;;;*----:::::~-::::::::::!-:::::::-------I *----
/ Jf/~ 4% l.Jtllll.VERIZED 1,/ "
0+-~-4--.-4--.~--.-4--.~--r-,_~~r-.-4--.-1
0 14 28 42 56 70 84 TOTAL CURE TIME. DAYS
98 112 126
Fig 41. Effects of pulverization on dry unconfined compressive strength of 4 and 7 percent cement-treated Beaumont clay -standard AASHTO.

UNCONFINED COMPRESSIVE
STRENGTH. PSI
1000
800
600
400
200
BEAUMONT CLAY STANDARD AASHTO CEMENT-TREATED WET CONDITION
4% llf'UI..VERJZED
0+-~-+-,--~~-r~~~~~--~--r-~-.-+~r-4
59
0 14 28 42 56 70 84 TOTAL CURE TIME. DAYS
98 112 126
Fig 42. Effects of pulverization on wet unconfined compressive strength of 4 and 7 percent cement-treated Beaumont clay -standard AASHTO.
60
UNCONFINED COMPRESSIVE
STRENGTH. PSI
1000
BOO
600
400
200
14
DRY PULVERlZED
\
BEAUMONT CLAY STANDARD AASHTO
4% CEMENT-TREATED
28 42 56 70 84 TOTAL CURE TIME. DAYS
98 112
Fig 43. Effects of pulverization on dry and wet unconfined compressive strengths of 4 percent cement-treated Beaumont clay -standard AASHTO.
126
UNCONFINED COMPRESSIVE
STRENGTH, PSI
1000
BOO
600
400
200 ... -----'"" I
I I
I I
BEAUMONT CLAY STANDARD AASHTO
7% CEMENT-TREATED
61
rRY-PtLVERIZED
""' --'* -------· _ ....... ------
__ ...... ----·-~------------------
------ .. ---- ~-IN'tLVERIZED IIET -PI.L VERI ZED
--*-------- ,r ----- --------------------------.,..... -----.,.-- IIET-utf3ULVERJZED --------..,..
I 0+--.-+-.r-+-.--r-.--r-.-~-.-4--.-~-.-+~~
0 14 28 42 56 70 94 TOTAL CURE TIME. DAYS
98 112 126
Fig 44. Effects of pulverization on dry and wet unconfined compressive strengths of 7 percent cement-treated Beaumont clay -standard AASHTO.
62
2000
1800
1600
1400
1200
UNCONFINED COMPRESSIVE 1000 STRENGTH.
PSI
800
600
400
200
, , , , , , .,.
, , ,
, , , ,
DALCO SANOY CLAY MODIFIED AASHTO CEMENT-TREATED DRY CONDITION
*----------------- ----------------------------*
\ PILVERlZEil
,
-------~---------------------------·
4% IJFU..VERIZED
o~-.-;--,_,__,_,--.-~--~~---r-.--r-.--r-.-4
0 14 28 42 56 70 84 TOTAL CURE TIME. DAYS
98 112 126
Fig 45. Effects of pulverization on dry unconfined compressive strengths of 4 and 7 percent cement-treated Daleo sandy clay -modified AASHTO.
2000
1800
1600
1400
1200
UNCONFINED COMPRESSIVE lOOO
STRENGTH. PSI
800
600
400
200
DALCO SANDY CLAY MODIFIED AASHTO CEMENT-TREATED WET CONDITION
-----·- :% III'ILYfRIZED \
-- --
63
...............
'-----,' ~-- --------------------- --r:::z~-. r/ /------
/ <% III'ILYfRIZED ----------------.,.
I I
I I
I
* 0+-.--r-.-1--.-+-.-~-r-+-.,-~~4--.-+~~ 0 14 28 42 56 70 84
TOTAL CURE TIME. DAYS 98 112 126
Fig 46. Effects of pulverization on wet unconfined compressive strength of 7 percent cement-treated Daleo sandy clay -modified AASHTO.
64
2000
1800
1600
1400
1200
DALCO SANDY CLAY MODIFIED AASHTD
4% CEMENT-TREATED
UNCONFINED COMPRESSIVE 1000 STRENGTH. , , , ,
, , -----------------------------------· *""-----------,
DRY-llf'll. VERI ZED PSI , , , ,
," I , BOO
.,
600 ----------------------.1. WEHIJ.VfJU7Ji1J
VET-uNPULYERlZED 400 I
..... __ ....................
---- ....
200
o~-r~~~~~--+-~~--~4-~--~~~~--+-~~
0 14 28 42 56 70 84 TOTAL CURE TIME. DAYS
98 112
Fig 47. Effects of pulverization on dry and wet unconfined compressive strengths of 4 percent cement-treated Daleo sandy clay -modified AASHTO.
126
2000
1800
1600
1400
1200
UNCONFINED COMPRESSIVE IOOO
STRENGTH. PSI
BOO
600
400
200
I I
I
t I
I I
I I
I I
I I
I I ...
I I
I I
I I
I I
DALCO SANDY CLAY MODIFIED AASHTO
7% CEMENT-TREATED
65
llfl-1'11.~ ----------------*
~-------------------------------1
I I
I I
I I
I I
----------------~-- /VET-Ptl.Y£RJZED
---- ...... ----------------·----......
VET -t.ltfiiJ. Y£Rl2£D
I
o~~~--r-~-r~--~~~~r-~~~--~~-r~~
0 14 28 42 56 70 84 TOTAL CURE TIME. DAYS
98 112 126
Fig 48. Effects of pulverization on dry and wet unconfined compressive strengths of 7 percent cement-treated Daleo sandy clay -modified AASHTO.
66
2000
1800
1500
1400
1200
BEAUMONT CLAY PULVERIZED
1X CEMENT DR LIME DRY CONDITION
7% LIME
UNCONFINED COMPRESSIVE 1000 STRENGTH.
lllllFlED M91T1l\
PSI
800
500
400
200
I ... I
I I
I I
I I
I
I I
I I
I
I I
I I
I I
I I
I
~-------------------------1
7% CEMENT
STANIIARII M9IT1l \ ••••• ------••• -----•• -----·.-•• "* ~---------------
... -.... - ---------;------------,.----- ..M
/1/ ' 7Z LIME
STMflARD M91TO
0+--.~--r-;--r~--~,_~~~~~~---r-~~~_,
0 14 28 42 56 70 84 TOTAL CURE TIME. DAYS
98 112 125
Fig 49. Dry unconfined compressive strength for pulverized Beaumont clay treated with 7 percent cement or lime - modified or standard AASHTO.
UNCONFINED COMPRESSIVE
STRENGTH. PSI
1000
BOO
600
400
200
BEAUMONT CLAY PULVERIZED
7% CEMENT OR LIME WET CONDITION
7% LIME MIIJJFJED AASHTD\
7% LIME .
STANDARD AASHTO~
-------
67
--------------· .....................
~~----------------------~-----------------------*
I ......... 7% CEMENT ~ MODIFIED AASHTO
0+--r~--~-r-.--r-~-+--r-~-r~~~-r~--+-~~
0 14 28 42 . 56 70 84 TOTAL CURE TIME. DAYS
98 112
Fig 50. Wet unconfined compressive strength for pulverized Beaumont clay treated with 7 percent cement or lime - modified or standard AASHTO.
126

APPENDIX A
INDIVIDUAL TEST RESULTS

71
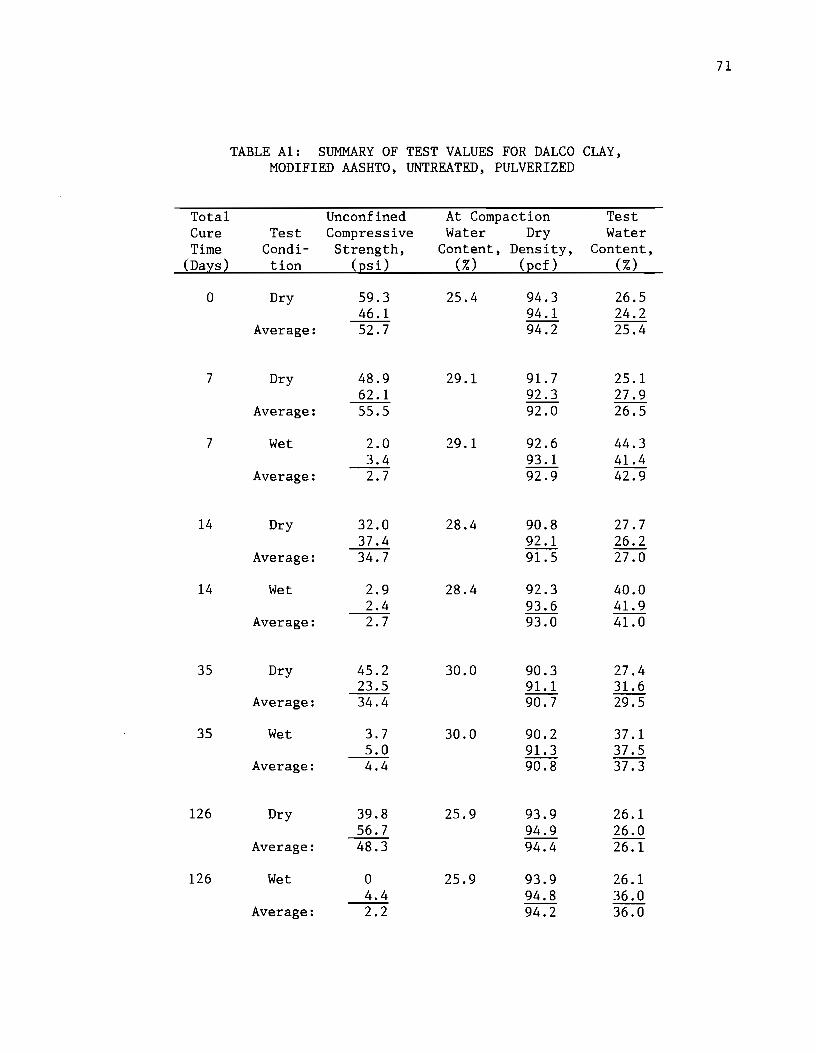
TABLE A1: SUMMARY OF TEST VALUES FOR DALCO CLAY, MODIFIED AASHTO, UNTREATED, PULVERIZED
Total Unconfined At Compaction Test Cure Test Compressive Water Dry Water Time Condi- Strength, Content, Density, Content,
(Days) tion (psi) (%) (pcf) (%)
0 Dry 59.3 25.4 94.3 26.5 46.1 94.1 24.2
Average: 52.7 94.2 25.4
7 Dry 48.9 29.1 91.7 25.1 62.1 92.3 27.9
Average: 55.5 92.0 26.5
7 Wet 2.0 29.1 92.6 44.3 3.4 93.1 41.4 --Average: 2.7 92.9 42.9
14 Dry 32.0 28.4 90.8 27.7 37.4 92.1 26.2
Average: 34.7 91.5 27.0
14 Wet 2.9 28.4 92.3 40.0 2.4 93.6 41.9
Average: 2.7 93.0 41.0
35 Dry 45.2 30.0 90.3 27.4 23.5 91.1 31.6
Average: 34.4 90.7 29.5
35 Wet 3.7 30.0 90.2 37.1 5.0 91.3 37.5 --Average: 4.4 90.8 37.3
126 Dry 39.8 25.9 93.9 26.1 56.7 94.9 26.0 --
Average: 48.3 94.4 26.1
126 Wet 0 25.9 93.9 26.1 4.4 94.8 36.0 --Average: 2.2 94.2 36.0
72
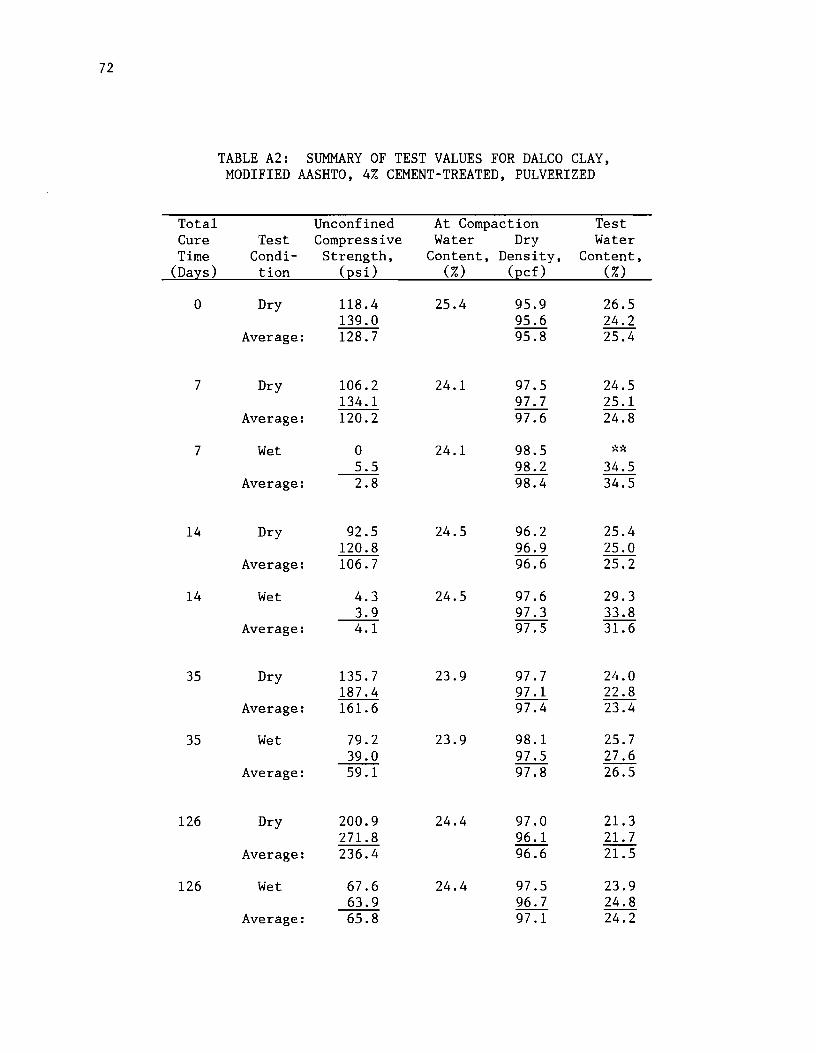
TABLE A2: SUMMARY OF TEST VALUES FOR DALCO CLAY, MODIFIED AASHTO, 4% CEMENT-TREATED, PULVERIZED
Total Unconfined At Compaction Test Cure Test Compressive Water Dry Water Time Condi- Strength, Content, Density, Content,
(Days) tion (psi) (%) (pcf) (%)
0 Dry 118.4 25.4 95.9 26.5 139.0 95.6 24.2
Average: 128.7 95.8 25.4
7 Dry 106.2 24.1 97.5 24.5 134.1 97.7 25.1
Average: 120.2 97.6 24.8
7 Wet 0 24.1 98.5 '}':*
5.5 98.2 34.5 Average: 2.8 98.4 34.5
14 Dry 92.5 24.5 96.2 25.4 120.8 96.9 25.0
Average: 106.7 96.6 25.2
14 Wet 4.3 24.5 97.6 29.3 3.9 97.3 33.8
Average: 4.1 97.5 31.6
35 Dry 135.7 23.9 97.7 24.0 187.4 97.1 22.8
Average: 161.6 97.4 23.4
35 Wet 79.2 23.9 98.1 25.7 39.0 97.5 27.6
Average: 59.1 97.8 26.5
126 Dry 200.9 24.4 97.0 21.3 271.8 96.1 21.7
Average: 236.4 96.6 21.5
126 Wet 67.6 24.4 97.5 23.9 63.9 96.7 24.8
Average: 65.8 97.1 24.2

73
TABLE A3: SUMMARY OF TEST VALUES FOR DALCO CLAY, MODIFIED AASHTO, 7% CEMENT-TREATED, PULVERIZED
Total Unconfined At Compaction Test Cure Test Compressive Water Dry Water Time Condi- Strength, Content, Density, Content,
(Days) tion (psi) (%) (pcf) (%)
0 Dry 165.1 21.3 99.8 20.1 180.2 21.3 98.4 20.3 --Average: 172.7 21.3 99.1 20.2
7 Dry 162.7 21.3 99.9 20.1 221.2 98.5 20.3 --Average: 192.0 99.2 20.2
7 Wet 12.2 21.3 100.2 28.9 10.0 97.7 36.1
Average: 11.1 99.0 32.5
14 Dry 239.5 21.7 99.6 19.6 268.6 96.9 20.0 --Average: 254.1 98.3 19.8
14 Wet 15.5 21.7 98.8 27.5 21.9 96.8 28.4
Average: 18.7 97.8 28.0
35 Dry 200.9 20.5 101.3 19.4 232.3 97.8 19.3 -- --Average: 216.6 99.6 19.3
35 Wet 56.1 20.5 100.9 18.1 31.6 97.6 28.5 --Average: 43.9 99.0 26.7
126 Dry 324.3 20.7 100.9 18.1 370.0 95.7 16.8 --Average: 347.2 98.3 17.4
126 Wet 103.5 98.2 24.2 46.8 20.7 95.5 26.2 --Average: 75.2 96.9 25.2
74
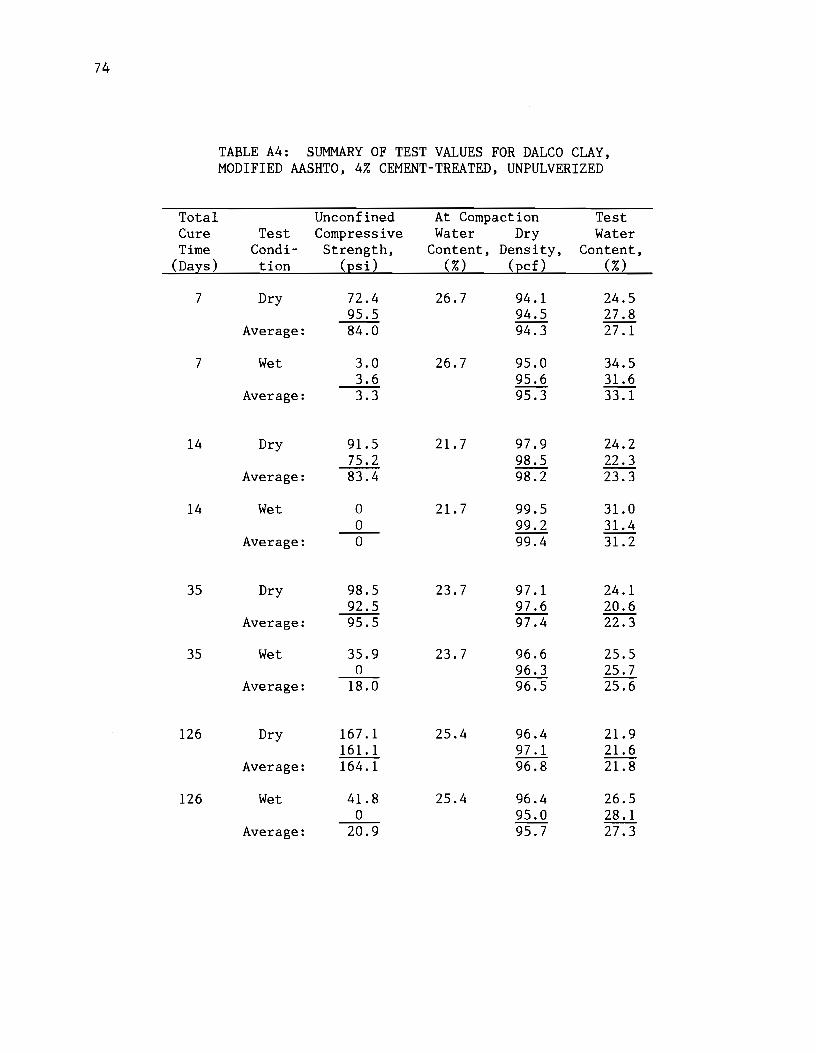
TABLE A4: SUMMARY OF TEST VALUES FOR DALCO CLAY, MODIFIED AASHTO, 47. CEMENT-TREATED, UNPULVERIZED
Total Unconfined At Compaction Test Cure Test Compressive Water Dry Water Time Condi- Strength, Content, Density, Content,
(Days) tion (psi) (7.) (pcf) (7.)
7 Dry 72.4 26.7 94.1 24.5 95.5 94.5 27.8 --Average: 84.0 94.3 27.1
7 Wet 3.0 26.7 95.0 34.5 3.6 95.6 31.6 --Average: 3.3 95.3 33.1
14 Dry 91.5 21.7 97.9 24.2 75.2 98.5 22.3 --Average: 83.4 98.2 23.3
14 Wet 0 21.7 99.5 31.0 0 99.2 31.4
Average: 0 99.4 31.2
35 Dry 98.5 23.7 97.1 24.1 92.5 97.6 20.6 --Average: 95.5 97.4 22.3
35 Wet 35.9 23.7 96.6 25.5 0 96.3 25.7 --Average: 18.0 96.5 25.6
126 Dry 167.1 25.4 96.4 21.9 161.1 97.1 21.6 --
Average: 164.1 96.8 21.8
126 Wet 41.8 25.4 96.4 26.5 0 95.0 28.1
Average: 20.9 95.7 27.3

75
TABLE AS: SUMMARY OF TEST VALUES FOR DALCO CLAY, MODIFIED AASHTO, 7% CEMENT-TREATED, UNPULVERIZED
Total Unconfined At Compaction Test Cure Test Compressive Water Dry Water Time Condi- Strength, Content, Density, Content,
(Days) tion (psi) (%) (pcf) (%)
7 Dry 155.0 22.1 97.5 19.2 189.0 95.3 19.4 --Average: 172.0 96.4 34.1
7 Wet 8.2 22.1 96.7 34.0 8.0 96.0 34.2 --Average: 8.1 96.4 34.1
14 Dry 71.6 22.9 98.9 23.1 115.4 95.0 17.0
Average: 94.0 97.0 20.1
14 Wet 3.1 22.9 97.1 28.5 0 94.6 33.4
Average: 1.6 95.9 31.0
35 Dry 122.5 21.4 100.7 20.0 77.2 96.7 17.4 --Average: 99.9 98.7 18.7
35 Wet 9.6 21.4 99.7 25.4 36.8 97.3 23.9
Average: 23.2 98.5 24.7
126 Dry 206.9 21.8 99.8 18.4 127.3 97.8 17.1 --Average: 167.1 98.8 17.8
126 Wet 21.5 21.8 99.9 27.1 19.9 97.4 24.2
Average: 20.7 98.7 25.7
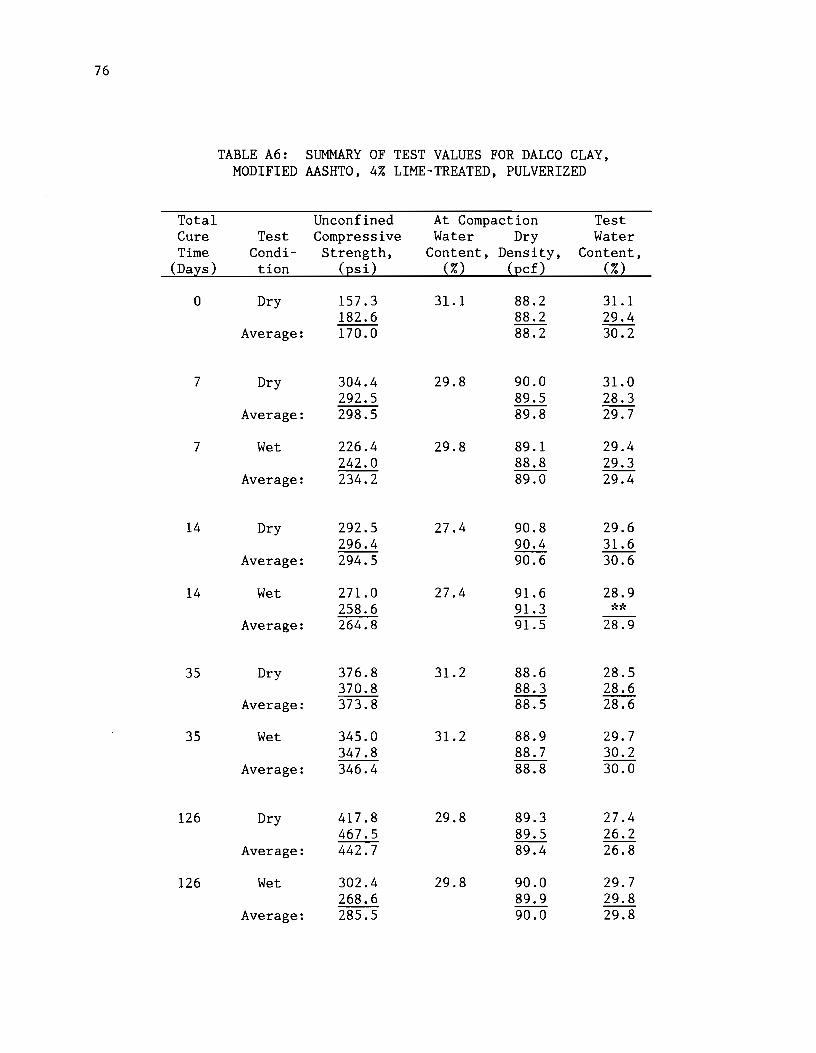
76
TABLE A6: SUMMARY OF TEST VALUES FOR DALCO CLAY, MODIFIED AASHTO, 4% LIME-TREATED, PULVERIZED
Total Unconfined At Compaction Test Cure Test Compressive Water Dry Water Time Condi- Strength, Content, Density, Content,
(Days) tion (psi) (i.) (pcf) (i.)
0 Dry 157.3 31.1 88.2 31.1 182.6 88.2 29.4
Average: 170.0 88.2 30.2
7 Dry 304.4 29.8 90.0 31.0 292.5 89.5 28.3 --
Average: 298.5 89.8 29.7
7 Wet 226.4 29.8 89.1 29.4 242.0 88.8 29.3 --Average: 234.2 89.0 29.4
14 Dry 292.5 27.4 90.8 29.6 296.4 90.4 31.6
Average: 294.5 90.6 30.6
14 Wet 271.0 27.4 91.6 28.9 258.6 91.3 *,'<
Average: 264.8 91.5 28.9
35 Dry 376.8 31.2 88.6 28.5 370.8 88.3 28.6
Average: 373.8 88.5 28.6
35 Wet 345.0 31.2 88.9 29.7 347.8 88.7 30.2
Average: 346.4 88.8 30.0
126 Dry 417.8 29.8 89.3 27.4 467.5 89.5 26.2
Average: 442.7 89.4 26.8
126 Wet 302.4 29.8 90.0 29.7 268.6 89.9 29.8
Average: 285.5 90.0 29.8

77
TABLE A7: SUMMARY OF TEST VALUES FOR DALCO CLAY, MODIFIED AASHTO, 7i. LIME-TREATED, PULVERIZED
Total Unconfined At Compaction Test Cure Test Compressive Water Dry Water Time Condi- Strength, Content, Density, Content,
(Days) tion (psi) (i.) (pcf) (i.)
0 Dry 142.0 28.1 90.8 29.6 136.5 28.1 90.0 29.7 --Average: 139.3 28.1 90.4 29.7
7 Dry 273.7 28.1 90.9 29.6 277.7 91.1 29.7
Average: 275.7 91.0 29.7
7 Wet 223.6 28.1 90.3 29.2 218.4 90.6 29.8
Average: 221.0 90.5 29.5
14 Dry 290.1 29.8 88.3 28.9 315.9 88.4 28.4
Average: 303.0 88.4 28.7
14 Wet 282.5 29.8 89.3 30.3 278.1 89.2 27.8
Average: 280.7 89.3 29.1
35 Dry 432.9 29.5 89.0 29.1 440.1 89.0 28.5 --Average: 436.5 89.0 28.8
35 Wet 407.4 29.5 89.5 29.5 380.4 89.2 27.1
Average: 393.9 89.4 28.3
126 Dry 716.2 29.4 88.7 26.6 775.9 89.3 27.2 --Average: 746.1 89.0 26.9
126 Wet 626.7 29.4 89.8 28.7 596.8 89.9 27.2 --
Average: 611.8 89.9 27.9
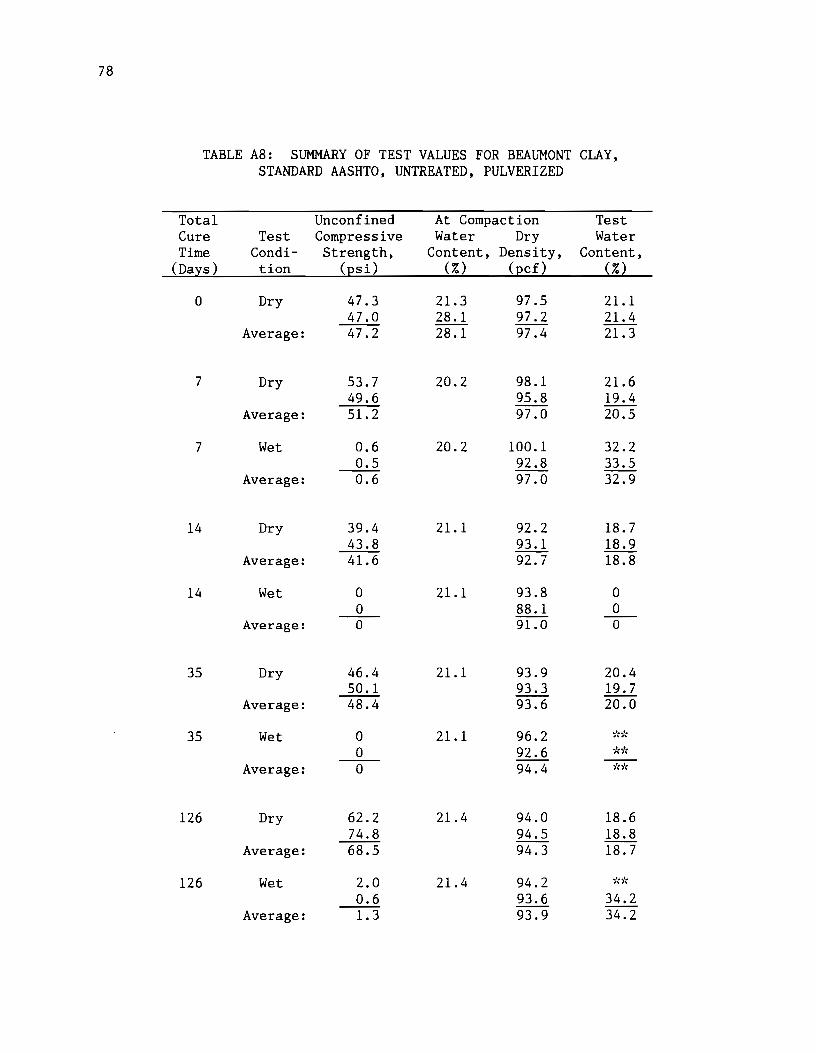
78
TABLE AS: SUMMARY OF TEST VALUES FOR BEAUMONT CLAY, STANDARD AASHTO, UNTREATED, PULVERIZED
Total Unconfined At Compaction Test Cure Test Compressive Water Dry Water Time Condi- Strength, Content, Density, Content,
(Days) tion (psi) (%) (pcf) (%)
0 Dry 47.3 21.3 97.5 21.1 47.0 28.1 97.2 21.4 --
Average: 47.2 28.1 97.4 21.3
7 Dry 53.7 20.2 98.1 21.6 49.6 95.8 19.4 --Average: 51.2 97.0 20.5
7 Wet 0.6 20.2 100.1 32.2 0.5 92.8 33.5
Average: 0.6 97.0 32.9
14 Dry 39.4 21.1 92.2 18.7 43.8 93.1 18.9
Average: 41.6 92.7 18.8
14 Wet 0 21.1 93.8 0 0 88.1 0
Average: 0 91.0 0
35 Dry 46.4 21.1 93.9 20.4 50.1 93.3 19.7
Average: 48.4 93.6 20.0
35 Wet 0 21.1 96.2 'i'C'i~
0 92.6 *,., Average: 0 94.4 ·:lt-;':
126 Dry 62.2 21.4 94.0 18.6 74.8 94.5 18.8
Average: 68.5 94.3 18.7
126 Wet 2.0 21.4 94.2 -;.•,-;'c
0.6 93.6 34.2 --Average: 1.3 93.9 34.2

79
TABLE A9: SUMMARY OF TEST VALUES FOR BEAUMONT CLAY, STANDARD AASHTO, 4% CEMENT-TREATED, PULVERIZED
Total Unconfined At Compaction Test Cure Test Compressive Water Dry Water Time Condi- Strength, Content, Density, Content,
(Days) tion (psi) (%) (pcf) (%)
0 Dry 40.6 25.4 92.9 25.5 41.8 28.1 90.7 25.3 --Average: 41.2 28.1 91.8 25.4
7 Dry 103.6 23.5 93.4 25.1 97.5 93.1 24.7
Average: 100.6 93.3 24.9
7 Wet 15.9 23.5 90.4 31.5 13.5 90.0 33.2
Average: 14.7 90.2 32.3
14 Dry 107.4 23.3 92.1 24.0 126.1 90.1 24.6
Average: 116.8 91.1 24.3
14 Wet 44.8 23.3 92.1 24.0 56.1 90.1 27.4
Average: 50.5 90.6 27.2
35 Dry 138.5 25.1 93.8 24.5 121.4 88.1 23.0
Average: 130.0 92.0 23.7
35 Wet 61.3 25.1 90.7 28.4 72.0 88.8 30.0
Average: 66.7 89.8 29.2
126 Dry 198.9 24.8 92.5 22.5 226.0 90.1 22.7
Average: 212.5 91.3 22.6
126 Wet 71.6 24.8 92.5 28.3 79.3 89.8 27.5
Average: 75.5 91.2 27.9

80
TABLE A10: SUMMARY OF TEST VALUES FOR BEAUMONT CLAY, STANDARD AASHTO, 7% CEMENT-TREATED, PULVERIZED
Total Unconfined At Compaction Test Cure Test Compressive Water Dry Water Time Condi- Strength, Content, Density, Content,
(Days) tion (psi) (%) (pcf) (%)
0 Dry 47.0 23.9 96.3 24.1 51.3 28.1 95.7 23.8 --
Average: 49.2 28.1 96.0 23.9
7 Dry 158.4 24.3 90.5 23.8 119.4 88.8 23.5
Average: 138.9 89.7 23.6
7 Wet 25.1 24.3 89.6 34.8 24.7 88.8 31.7
Average: 24.9 89.2 33.3
14 Dry 200.9 23.9 90.0 22.4 219.6 87.7 22.8 --
Average: 210.3 88.9 22.6
14 Wet 97.5 23.9 92.6 26.4 109.8 85.9 27.4 --Average: 103.7 89.2 26.9
35 Dry 283.7 24.8 91.7 22.0 222.0 89.7 21.6
Average: 252.9 90.7 21.8
35 Wet 186.2 24.8 96.7 25.3 117 .o 87.6 26.0
Average: 151.6 92.2 25.7
126 Dry 326.3 24.8 94.2 21.0 366.1 90.7 19.3 --
Average: 346.2 92.5 20.2
126 Wet 130.5 24.8 92.6 25.1 88.5 87.0 26.1 --
Average: 109.5 89.8 26.1
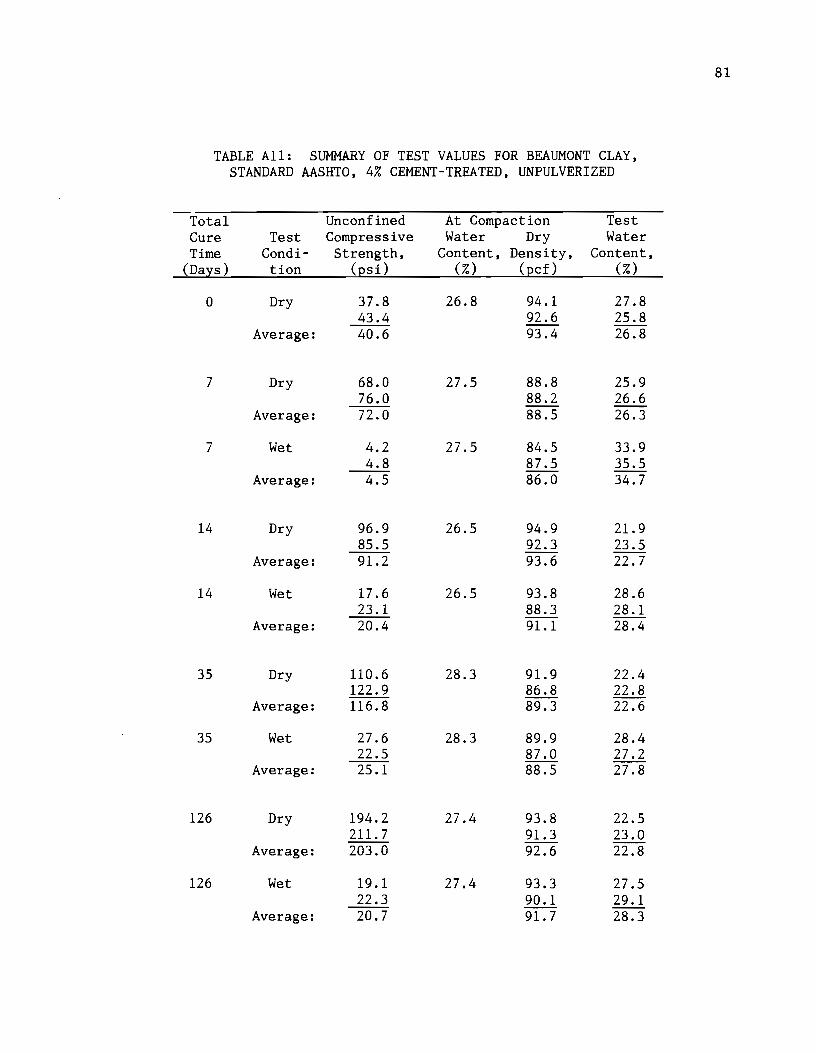
81
TABLE All: SUMMARY OF TEST VALUES FOR BEAUMONT CLAY, STANDARD AASHTO, 4% CEMENT-TREATED, UNPULVERIZED
Total Unconfined At Compaction Test Cure Test Compressive Water Dry Water Time Condi- Strength, Content, Density, Content,
(Days) tion (psi) (%) (pcf) (%)
0 Dry 37.8 26.8 94.1 27.8 43.4 92.6 25.8
Average: 40.6 93.4 26.8
7 Dry 68.0 27.5 88.8 25.9 76.0 88.2 26.6
Average: 72.0 88.5 26.3
7 Wet 4.2 27.5 84.5 33.9 4.8 87.5 35.5 --
Average: 4.5 86.0 34.7
14 Dry 96.9 26.5 94.9 21.9 85.5 92.3 23.5 --Average: 91.2 93.6 22.7
14 Wet 17.6 26.5 93.8 28.6 23.1 88.3 28.1 --Average: 20.4 91.1 28.4
35 Dry 110.6 28.3 91.9 22.4 122.9 86.8 22.8
Average: 116.8 89.3 22.6
35 Wet 27.6 28.3 89.9 28.4 22.5 87.0 27.2 --Average: 25.1 88.5 27.8
126 Dry 194.2 27.4 93.8 22.5 211.7 91.3 23.0 --Average: 203.0 92.6 22.8
126 Wet 19.1 27.4 93.3 27.5 22.3 90.1 29.1 --Average: 20.7 91.7 28.3
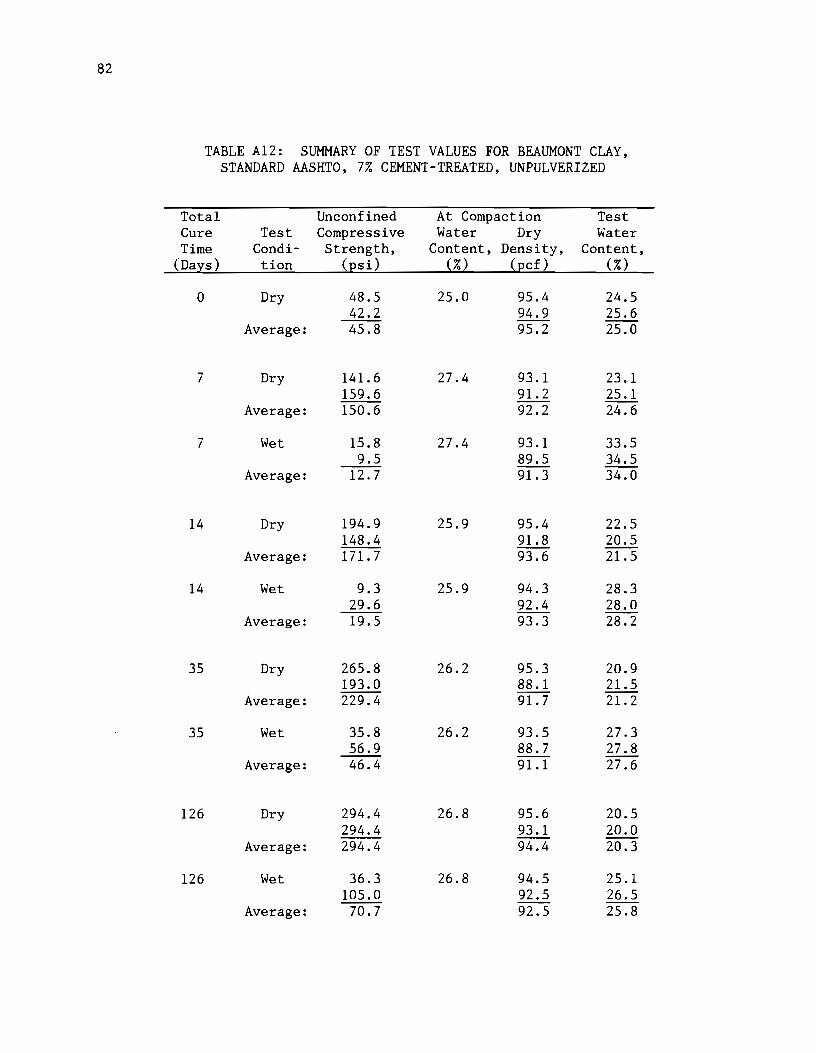
82
TABLE A12: SUMMARY OF TEST VALUES FOR BEAUMONT CLAY, STANDARD AASHTO, 7% CEMENT-TREATED, UNPULVERIZED
Total Unconfined At Compaction Test Cure Test Compressive Water Dry Water Time Condi- Strength, Content, Density, Content,
(Days) tion (psi) (%) (pcf) (%)
0 Dry 48.5 25.0 95.4 24.5 42.2 94.9 25.6 --Average: 45.8 95.2 25.0
7 Dry 141.6 27.4 93.1 23.1 159.6 91.2 25.1 --
Average: 150.6 92.2 24.6
7 Wet 15.8 27.4 93.1 33.5 9.5 89.5 34.5 --Average: 12.7 91.3 34.0
14 Dry 194.9 25.9 95.4 22.5 148.4 91.8 20.5
Average: 171.7 93.6 21.5
14 Wet 9.3 25.9 94.3 28.3 29.6 92.4 28.0
Average: 19.5 93.3 28.2
35 Dry 265.8 26.2 95.3 20.9 193.0 88.1 21.5 --Average: 229.4 91.7 21.2
35 Wet 35.8 26.2 93.5 27.3 56.9 88.7 27.8 --Average: 46.4 91.1 27.6
126 Dry 294.4 26.8 95.6 20.5 294.4 93.1 20.0 --Average: 294.4 94.4 20.3
126 Wet 36.3 26.8 94.5 25.1 105.0 92.5 26.5
Average: 70.7 92.5 25.8
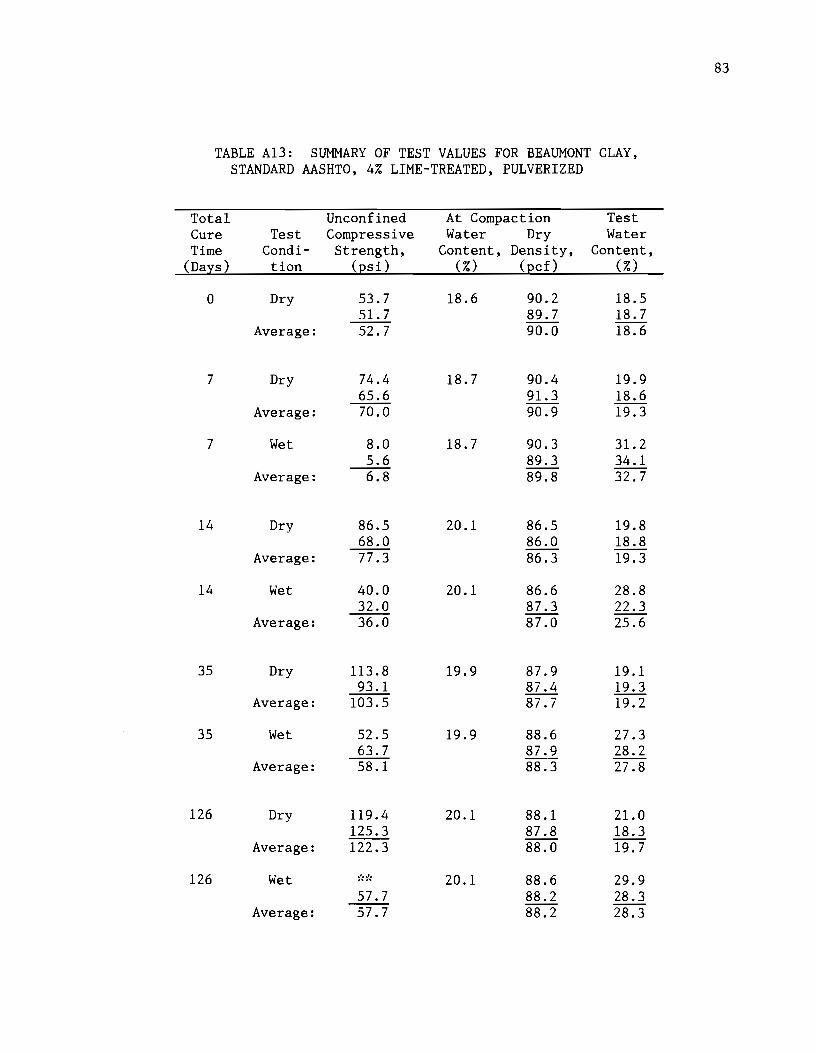
83
TABLE A13: SUMMARY OF TEST VALUES FOR BEAUMONT CLAY, STANDARD AASHTO, 4% LIME-TREATED, PULVERIZED
Total Unconfined At Compaction Test Cure Test Compressive Water Dry Water Time Condi- Strength, Content, Density, Content,
(Days) tion (psi) (%) (pcf) (%)
0 Dry 53.7 18.6 90.2 18.5 51.7 89.7 18.7 --
Average: 52.7 90.0 18.6
7 Dry 74.4 18.7 90.4 19.9 65.6 91.3 18.6
Average: 70.0 90.9 19.3
7 Wet 8.0 18.7 90.3 31.2 5.6 89.3 34.1 --Average: 6.8 89.8 32.7
14 Dry 86.5 20.1 86.5 19.8 68.0 86.0 18.8 --Average: 77.3 86.3 19.3
14 Wet 40.0 20.1 86.6 28.8 32.0 87.3 22.3
Average: 36.0 87.0 25.6
35 Dry 113.8 19.9 87.9 19.1 93.1 87.4 19.3
Average: 103.5 87.7 19.2
35 Wet 52.5 19.9 88.6 27.3 63.7 87.9 28.2
Average: 58.1 88.3 27.8
126 Dry 119.4 20.1 88.1 21.0 125.3 87.8 18.3
Average: 122.3 88.0 19.7
126 Wet -;':o;': 20.1 88.6 29.9 57.7 88.2 28.3 --Average: 57.7 88.2 28.3
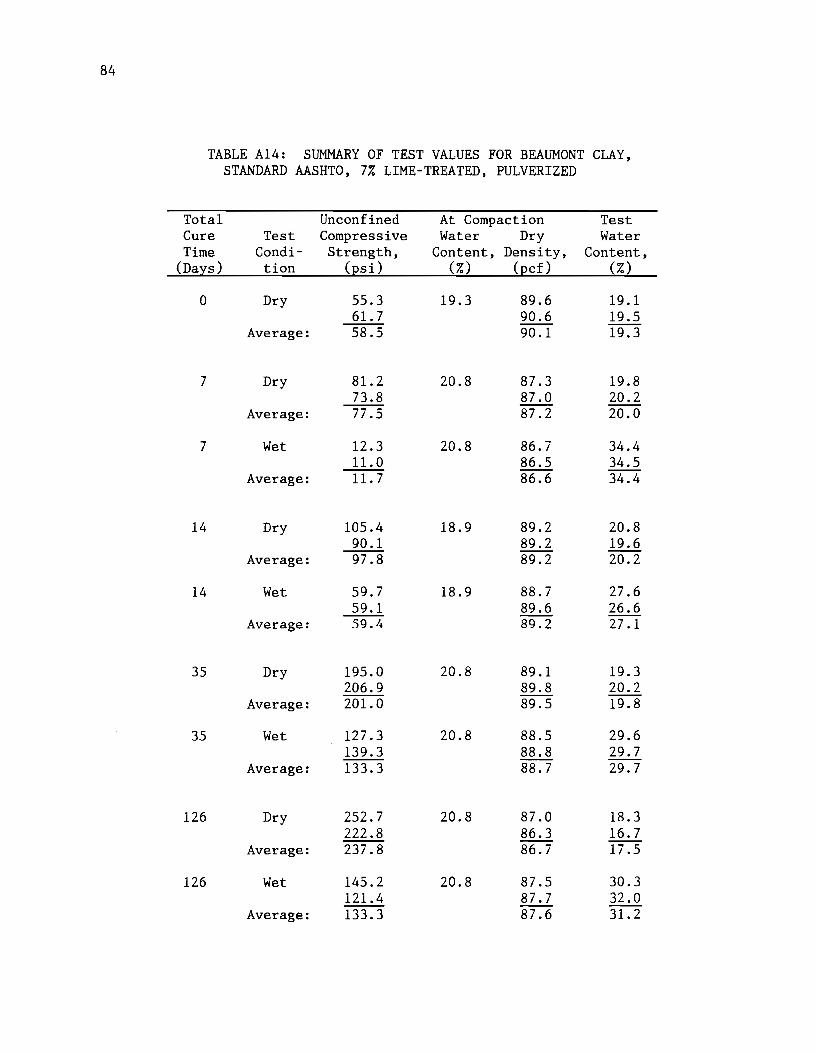
84
TABLE A14: SUMMARY OF TEST VALUES FOR BEAUMONT CLAY, STANDARD AASHTO, 7% LIME-TREATED, PULVERIZED
Total Unconfined At Compaction Test Cure Test Compressive Water Dry Water Time Condi- Strength, Content, Density, Content,
(Days) tion (psi) (%) (pcf) (%)
0 Dry 55.3 19.3 89.6 19.1 61.7 90.6 19.5 --Average: 58.5 90.1 19.3
7 Dry 81.2 20.8 87.3 19.8 73.8 87.0 20.2
Average: 77.5 87.2 20.0
7 Wet 12.3 20.8 86.7 34.4 11.0 86.5 34.5
Average: 11.7 86.6 34.4
14 Dry 105.4 18.9 89.2 20.8 90.1 89.2 19.6 --Average: 97.8 89.2 20.2
14 Wet 59.7 18.9 88.7 27.6 59.1 89.6 26.6
Average: 59.4 89.2 27.1
35 Dry 195.0 20.8 89.1 19.3 206.9 89.8 20.2 --Average: 201.0 89.5 19.8
35 Wet 127.3 20.8 88.5 29.6 139.3 88.8 29.7
Average: 133.3 88.7 29.7
126 Dry 252.7 20.8 87.0 18.3 222.8 86.3 16.7
Average: 237.8 86.7 17.5
126 Wet 145.2 20.8 87.5 30.3 121.4 87.7 32.0 --Average: 133.3 87.6 31.2
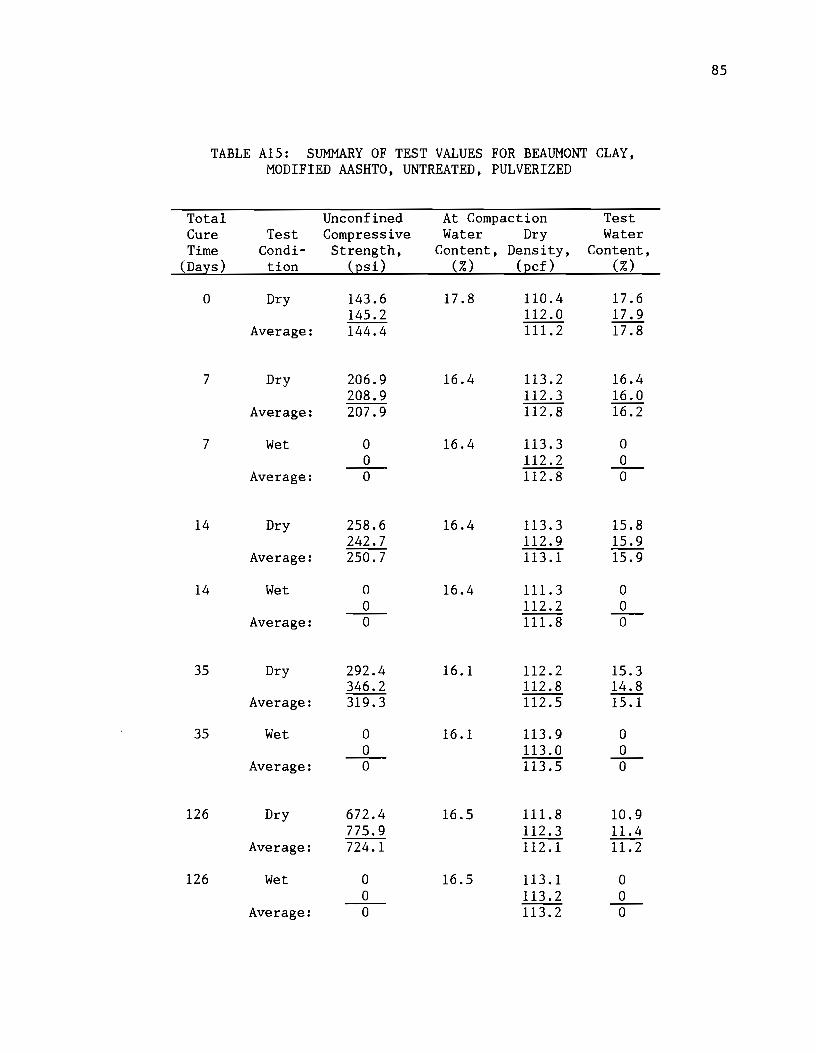
85
TABLE A15: SUMMARY OF TEST VALUES FOR BEAUMONT CLAY, MODIFIED AASHTO, UNTREATED, PULVERIZED
Total Unconfined At Compaction Test Cure Test Compressive Water Dry Water Time Condi- Strength, Content, Density, Content,
(Days) tion (psi) (%) (pcf) (%)
0 Dry 143.6 17.8 110.4 17.6 145.2 112.0 17.9
Average: 144.4 111.2 17.8
7 Dry 206.9 16.4 113.2 16.4 208.9 112.3 16.0 --
Average: 207.9 112.8 16.2
7 Wet 0 16.4 113.3 0 0 112.2 0 --Average: 0 112.8 0
14 Dry 258.6 16.4 113.3 15.8 242.7 112.9 15.9
Average: 250.7 113.1 15.9
14 Wet 0 16.4 111.3 0 0 112.2 0 -- --Average: 0 111.8 0
35 Dry 292.4 16.1 112.2 15.3 346.2 112.8 14.8 -- --Average: 319.3 112.5 15.1
35 Wet 0 16.1 113.9 0 0 113.0 0 -- --Average: 0 113.5 0
126 Dry 672.4 16.5 111.8 10.9 775.9 112.3 11.4 --Average: 724.1 112.1 11.2
126 Wet 0 16.5 113.1 0 0 113.2 0 --Average: 0 113.2 0
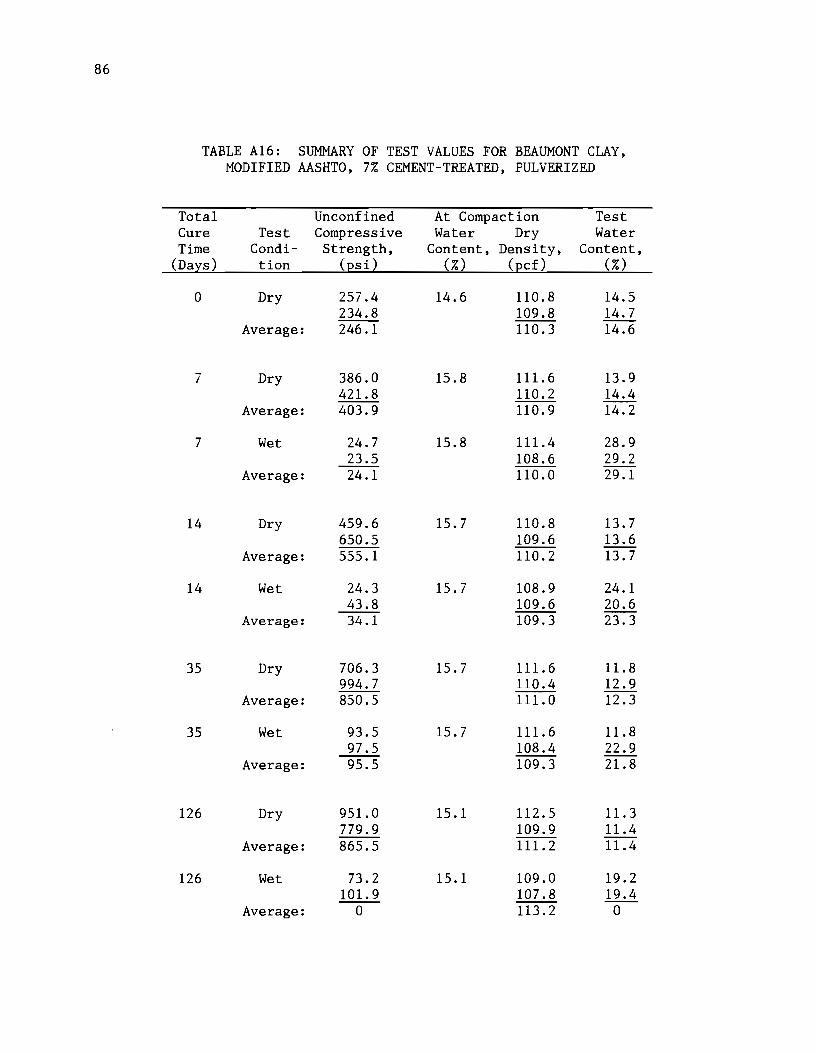
86
TABLE A16: SUMMARY OF TEST VALUES FOR BEAUMONT CLAY, MODIFIED AASHTO, 7% CEMENT-TREATED, PULVERIZED
Total Unconfined At Compaction Test Cure Test Compressive Water Dry Water Time Condi- Strength, Content, Density, Content,
(Days) tion (psi) (%) (pcf) (%)
0 Dry 257.4 14.6 110.8 14.5 234.8 109.8 14.7 --Average: 246.1 110.3 14.6
7 Dry 386.0 15.8 111.6 13.9 421.8 110.2 14.4
Average: 403.9 110.9 14.2
7 Wet 24.7 15.8 111.4 28.9 23.5 108.6 29.2 -- --
Average: 24.1 110.0 29.1
14 Dry 459.6 15.7 110.8 13.7 650.5 109.6 13.6 --Average: 555.1 110.2 13.7
14 Wet 24.3 15.7 108.9 24.1 43.8 109.6 20.6 --Average: 34.1 109.3 23.3
35 Dry 706.3 15.7 111.6 11.8 994.7 110.4 12.9 --Average: 850.5 111.0 12.3
35 Wet 93.5 15.7 111.6 11.8 97.5 108.4 22.9 --Average: 95.5 109.3 21.8
126 Dry 951.0 15.1 112.5 11.3 779.9 109.9 11.4 -- --
Average: 865.5 111.2 11.4
126 Wet 73.2 15.1 109.0 19.2 101.9 107.8 19.4
Average: 0 113.2 0
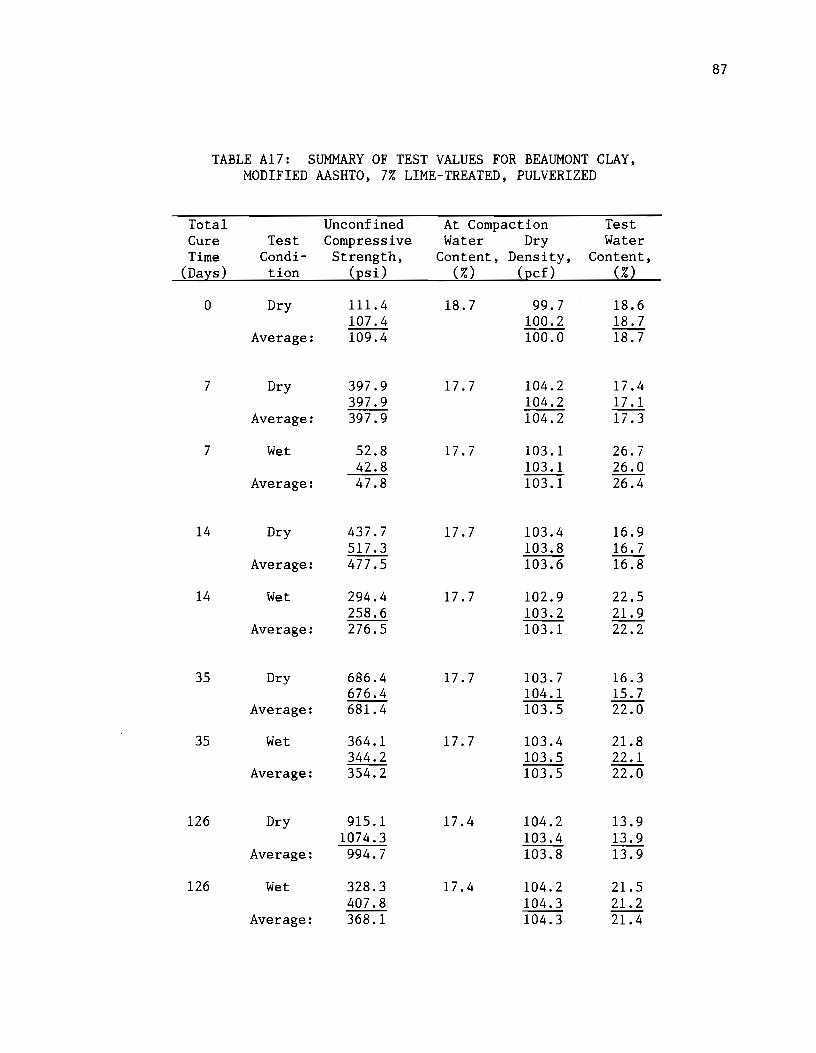
87
TABLE A17: SUMMARY OF TEST VALUES FOR BEAUMONT CLAY, MODIFIED AASHTO, 7% LIME-TREATED, PULVERIZED
Total Unconfined At Compaction Test Cure Test Compressive Water Dry Water Time Condi- Strength, Content, Density, Content,
(Days) tion (psi) (%) (pcf) (%)
0 Dry 111.4 18.7 99.7 18.6 107.4 100.2 18.7 ---Average: 109.4 100.0 18.7
7 Dry 397.9 17.7 104.2 17.4 397.9 104.2 17.1 --Average: 397.9 104.2 17.3
7 Wet 52.8 17.7 103.1 26.7 42.8 103.1 26.0 -- --Average: 47.8 103.1 26.4
14 Dry 437.7 17.7 103.4 16.9 517.3 103.8 16.7 --Average: 477.5 103.6 16.8
14 Wet 294.4 17.7 102.9 22.5 258.6 103.2 21.9 --
Average: 276.5 103.1 22.2
35 Dry 686.4 17.7 103.7 16.3 676.4 104.1 15.7
Average: 681.4 103.5 22.0
35 Wet 364.1 17.7 103.4 21.8 344.2 103.5 22.1
Average: 354.2 103.5 22.0
126 Dry 915.1 17.4 104.2 13.9 1074.3 103.4 13.9
Average: 994.7 103.8 13.9
126 Wet 328.3 17.4 104.2 21.5 407.8 104.3 21.2 --Average: 368.1 104.3 21.4

88
TABLE A18: SUMMARY OF TEST VALUES FOR DALCO SANDY CLAY, MODIFIED AASHTO, UNTREATED, PULVERIZED
Total Unconfined At Compaction Test Cure Test Compressive Water Dry Water Time Condi- Strength, Content, Density, Content,
(Days) tion (psi) (%) (pcf) (%)
0 Dry 71.6 10.9 121.2 10.5 58.1 120.8 11.2
Average: 64.8 121.0 10.9
7 Dry 200.5 10.1 121.7 8.9 209.3 123.0 9.1 --Average: 204.9 122.4 9.0
7 Wet 4.9 10.1 121.7 18.6 7.0 122.7 17.6 --Average: 6.0 122.2 18.1
14 Dry 179.0 10.4 123.9 9.2 198.1 124.5 9.3
Average: 188.6 124.2 9.3
14 Wet 14.2 10.4 123.2 13.8 18.5 123.4 13.9 --Average: 16.4 123.3 13.9
35 Dry 230.8 10.4 123.6 8.5 255.0 124.7 8.3 --Average: 242.9 124.2 8.4
35 Wet 23.9 10.4 123.4 13.9 21.9 124.2 13.3
Average: 22.9 123.8 13.6
126 Dry 706.3 9.7 124.1 5.1 756.0 124.4 4.8 --Average: 731.2 124.3 5.0
126 Wet 8.5 9.7 125.7 14.2 15.9 125.1 14.5 --Average: 12.2 125.4 14.4

89
TABLE A19: SUMMARY OF TEST VALUES FOR DALCO SANDY CLAY, MODIFIED AASHTO, 4% CEMENT-TREATED, PULVERIZED
Total Unconfined At Compaction Test Cure Test Compressive Water Dry Water Time Condi- Strength, Content, Density, Content,
(Days) tion (psi) (%) (pcf) (%)
0 Dry 171.5 9.8 123.2 9.3 161.5 123.3 10.3 -- --Average: 166.5 123.3 9.8
7 Dry 732.1 10.1 121.6 8.8 509.3 119.7 8.9 --Average: 620.7 120.7 8.9
7 Wet 393.9 10.1 121.3 11.5 374.0 118.8 12.4 -- --Average: 384.0 120.1 12.0
14 Dry 851.5 10.4 122.6 8.9 819.6 120.2 9.2 --Average: 835.6 121.4 9.1
14 Wet 690.7 10.4 121.0 10.3 573.0 119.4 12.9
Average: 631.9 120.2 11.6
35 Dry 1155.9 10.4 122.2 8.2 923.1 120.4 8.4
Average: 1039.5 121.3 8.3
35 Wet 698.3 10.4 122.0 13.6 586.9 120.1 11.2 --
Average: 642.6 121.1 12.4
126 Dry 1209.6 10.5 121.3 5.8 970.8 119.3 5.2
Average: 1090.2 120.3 5.5
126 Wet 445.6 10.5 120.9 11.0 366.1 119.1 12.8
Average: 405.8 120.0 11.7
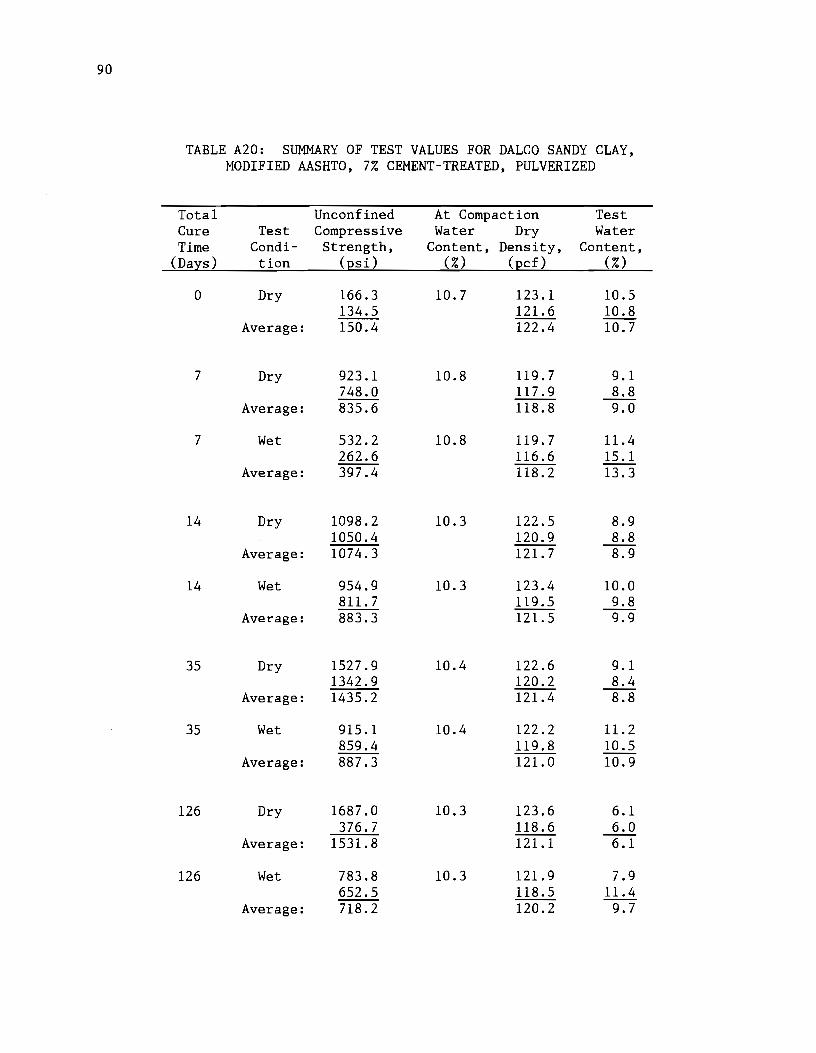
90
TABLE A20: SUMMARY OF TEST VALUES FOR DALCO SANDY CLAY, MODIFIED AASHTO, 7% CEMENT-TREATED, PULVERIZED
Total Unconfined At Compaction Test Cure Test Compressive Water Dry Water Time Condi- Strength, Content, Density, Content,
(Days) tion (psi) (%) (pcf) (%)
0 Dry 166.3 10.7 123.1 10.5 134.5 121.6 10.8
Average: 150.4 122.4 10.7
7 Dry 923.1 10.8 119.7 9.1 748.0 117.9 8.8 --Average: 835.6 118.8 9.0
7 Wet 532.2 10.8 119.7 11.4 262.6 116.6 15.1
Average: 397.4 118.2 13.3
14 Dry 1098.2 10.3 122.5 8.9 1050.4 120.9 8.8
Average: 1074.3 121.7 8.9
14 Wet 954.9 10.3 123.4 10.0 811.7 119.5 9.8 --
Average: 883.3 121.5 9.9
35 Dry 1527.9 10.4 122.6 9.1 1342.9 120.2 8.4
Average: 1435.2 121.4 8.8
35 Wet 915.1 10.4 122.2 11.2 859.4 119.8 10.5 --Average: 887.3 121.0 10.9
126 Dry 1687.0 10.3 123.6 6.1 376.7 118.6 6.0 --
Average: 1531.8 121.1 6.1
126 Wet 783.8 10.3 121.9 7.9 652.5 118.5 11.4 --Average: 718.2 120.2 9.7
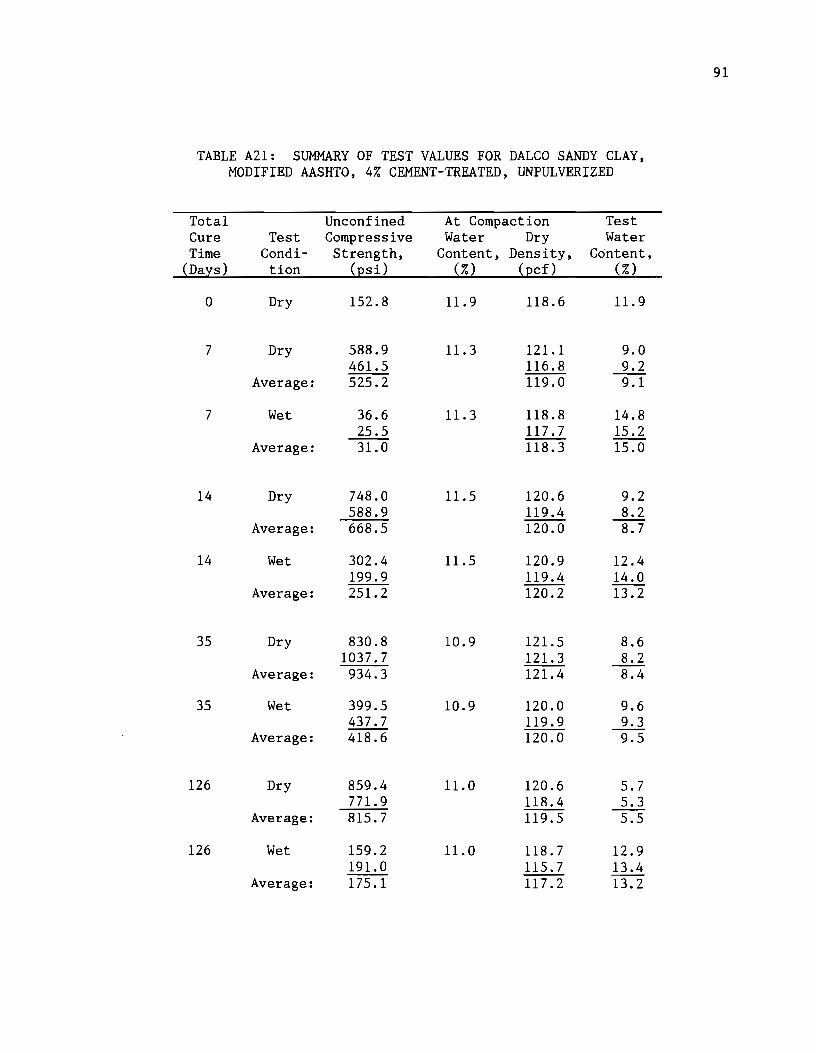
91
TABLE A21: SUMMARY OF TEST VALUES FOR DALCO SANDY CLAY, MODIFIED AASHTO, 4% CEMENT-TREATED, UNPULVERIZED
Total Unconfined At Compaction Test Cure Test Compressive Water Dry Water Time Condi- Strength, Content, Density, Content,
(Days) tion (psi) (%) (pcf) (%)
0 Dry 152.8 11.9 118.6 11.9
7 Dry 588.9 11.3 121.1 9.0 461.5 116.8 9.2 -- --Average: 525.2 119.0 9.1
7 Wet 36.6 11.3 118.8 14.8 25.5 117.7 15.2
Average: 31.0 118.3 15.0
14 Dry 748.0 11.5 120.6 9.2 588.9 119.4 8.2
Average: 668.5 120.0 8.7
14 Wet 302.4 11.5 120.9 12.4 199.9 119.4 14.0 --Average: 251.2 120.2 13.2
35 Dry 830.8 10.9 121.5 8.6 1037.7 121.3 8.2
Average: 934.3 121.4 8.4
35 Wet 399.5 10.9 120.0 9.6 437.7 119.9 9.3 -- --Average: 418.6 120.0 9.5
126 Dry 859.4 11.0 120.6 5.7 771.9 118.4 5.3 --Average: 815.7 119.5 5.5
126 Wet 159.2 11.0 118.7 12.9 191.0 115.7 13.4 --Average: 175.1 117.2 13.2

92
TABLE A22: SUMMARY OF TEST VALUES FOR DALCO SANDY CLAY, MODIFIED AASHTO, 7% CEMENT-TREATED, UNPULVERIZED
Total Unconfined At Compaction Test Cure Test Compressive Water Dry Water Time Condi- Strength, Content, Density, Content,
(Days) tion (psi) (%) (pcf) (%)
0 Dry 155.2 11.1 122.1 11.1
7 Dry 660.5 11.2 120.5 9.3 366.1 118.9 9.0 --Average: 513.3 119.7 9.2
7 Wet 366.1 11.2 121.6 11.9 175.1 117.5 12.7 --Average: 270.6 119.6 12.3
14 Dry 671.6 11.3 122.3 8.7 770.3 119.9 8.2
Average: 721.0 121.1 8.5
14 Wet 429.7 11.3 119.8 10.1 390.0 117.7 11.3
Average: 409.9 118.8 10.7
35 Dry 883.3 11.9 119.7 7.8 931.0 119.0 8.8
Average: 907.2 119.4 8.3
35 Wet 541.1 11.9 120.9 9.9 397.9 119.0 10.5
Average: 469.5 120.0 10.2
126 Dry 1273.2 11.9 120.7 6.6 1336.9 120.1 6.9
Average: 1305.1 120.4 6.8
126 Wet 573.0 11.9 119.4 9.3 557.0 118.8 9.1
Average: 565.0 119.1 9.2

93
TABLE A23: SUMMARY OF TEST VALUES FOR DALCO SANDY CLAY, MODIFIED AASHTO, 4% LIME-TREATED, PULVERIZED
Total Unconfined At Compaction Test Cure Test Compressive Water Dry Water Time Condi- Strength, Content, Density, Content,
(Days) tion (psi) (%) (pcf) (%)
0 Dry 97.1 13.3 113.7 13.1 91.5 114.8 13.4 --Average: 94.3 114.3 13.3
7 Dry 177.1 12.3 116.7 12.9 191.0 116.6 11.3
Average: 184.0 116.7 12.1
7 Wet 108.2 12.3 117.6 13.0 117.4 117.5 13.3 --Average: 112.8 117.6 13.2
14 Dry 196.7 12.5 116.0 11.6 224.1 116.9 11.3 --Average: 210.4 116.5 11.5
14 Wet 140.1 12.5 116.9 12.9 140.1 115.8 12.8 --Average: 140.1 116.4 12.9
35 Dry 417.8 12.6 117.6 10.6 318.3 118.4 10.3 -- --Average: 368.1 118.0 10.5
35 Wet 202.9 12.6 117.0 11.7 222.8 117.5 11.5
Average: 212.9 117.3 11.6
126 Dry 346.2 12.5 116.6 9.2 397.9 117.3 7.3
Average: 372.1 117 .o 8.3
126 Wet 202.9 12.5 116.5 11.1 228.8 117.4 12.1
Average: 215.8 117.0 11.6

94
TABLE A24: SUMMARY OF TEST VALUES FOR DALCO SANDY CLAY, MODIFIED AASHTO, 7% LIME-TREATED, PULVERIZED
Total Unconfined At Compaction Test Cure Test Compressive Water Dry Water Time Condi- Strength, Content, Density, Content,
(Days) tion (psi) (%) (pcf) (%)
0 Dry 97.9 12.5 111.4 12.5 95.4 112.4 12.4
Average: 96.7 111.9 12.5
7 Dry 185.4 12.1 114.1 11.3 198.9 114.5 11.2
Average: 192.2 114.3 11.3
7 Wet 94.5 12.1 115.0 13.5 102.3 115.5 13.6
Average: 98.4 115.3 13.6
14 Dry 222.8 12.4 114.3 11.5 232.2 115.3 11.4
Average: 227.5 114.8 11.5
14 Wet 133.1 12.4 115.2 13.0 135.0 114.2 13.1
Average: 134.1 114.7 13.1
35 Dry 330.2 12.6 115.5 10.2 358.1 115.4 10.1 --Average: 344.1 115.5 10.2
35 Wet 189.0 12.6 116.5 11.8 202.9 115.9 11.8 --Average: 196.0 116.2 11.8
126 Dry 485.4 13.0 114.3 8.0 489.4 114.6 8.2
Average: 487.4 114.5 8.1
126 Wet 262.6 13.0 115.4 11.9 262.6 115.4 11.7
Average: 262.6 115.4 11.8