FORM 20-F - umc.com · For the fiscal year ended ... If “Other” has been checked in response to...
220
UNITED STATES SECURITIES AND EXCHANGE COMMISSION WASHINGTON, D.C. 20549 FORM 20-F (Mark One) ☐ REGISTRATION STATEMENT PURSUANT TO SECTION 12(b) OR (g) OF THE SECURITIES EXCHANGE ACT OF 1934 OR ☒ ANNUAL REPORT PURSUANT TO SECTION 13 OR 15(d) OF THE SECURITIES EXCHANGE ACT OF 1934 For the fiscal year ended December 31, 2017 OR ☐ TRANSITION REPORT PURSUANT TO SECTION 13 OR 15(d) OF THE SECURITIES EXCHANGE ACT OF 1934 OR ☐ SHELL COMPANY REPORT PURSUANT TO SECTION 13 OR 15(d) OF THE SECURITIES EXCHANGE ACT OF 1934 Date of event requiring this shell company report For the transition period from to Commission file number 001-15128 United Microelectronics Corporation (Exact name of Registrant as specified in its charter) N/A (Translation of Registrant’s name into English) Taiwan, Republic of China (Jurisdiction of incorporation or organization) No. 3 Li-Hsin Road II, Hsinchu Science Park, Hsinchu City, Taiwan, Republic of China (Address of principal executive offices)
-
Upload
doankhuong -
Category
Documents
-
view
215 -
download
0
Transcript of FORM 20-F - umc.com · For the fiscal year ended ... If “Other” has been checked in response to...

UNITED STATES
SECURITIES AND EXCHANGE COMMISSION
WASHINGTON, D.C. 20549
FORM 20-F
(Mark One)
☐ REGISTRATION STATEMENT PURSUANT TO SECTION 12(b) OR (g) OF THE SECURITIES
EXCHANGE ACT OF 1934
OR
☒ ANNUAL REPORT PURSUANT TO SECTION 13 OR 15(d) OF THE SECURITIES EXCHANGE
ACT OF 1934
For the fiscal year ended December 31, 2017
OR
☐ TRANSITION REPORT PURSUANT TO SECTION 13 OR 15(d) OF THE SECURITIES
EXCHANGE ACT OF 1934
OR
☐ SHELL COMPANY REPORT PURSUANT TO SECTION 13 OR 15(d) OF THE SECURITIES
EXCHANGE ACT OF 1934
Date of event requiring this shell company report
For the transition period from to
Commission file number 001-15128
United Microelectronics Corporation (Exact name of Registrant as specified in its charter)
N/A
(Translation of Registrant’s name into English)
Taiwan, Republic of China
(Jurisdiction of incorporation or organization)
No. 3 Li-Hsin Road II, Hsinchu Science Park,
Hsinchu City, Taiwan, Republic of China
(Address of principal executive offices)

Chitung Liu, +886-2-2658-9168, [email protected],
8F, No. 68, Section 1, Neihu Road., Taipei 11493, Taiwan R.O.C.
(Name, Telephone, E-mail and/or Facsimile number and Address of Company Contact Person)
Securities registered or to be registered pursuant to Section 12(b) of the Act.
Title of each class Name of each exchange on which registered
American Depositary Shares, as evidenced by American
Depositary Receipts, each representing 5 Common Shares
New York Stock Exchange
Securities registered or to be registered pursuant to Section 12(g) of the Act.
None
(Title of Class)
Securities for which there is a reporting obligation pursuant to Section 15(d) of the Act.
None
(Title of Class)
Indicate the number of outstanding shares of each of the issuer’s classes of capital or common stock as of the close of the period
covered by the annual report.
12,624,318,715 Common Shares of Registrant issued as of December 31, 2017 (including 400,000,000 treasury shares)
Indicate by check mark if the registrant is a well-known seasoned issuer, as defined in Rule 405 of the Securities Act.
Yes ☒ No ☐
If this report is an annual or transition report, indicate by check mark if the registrant is not required to file reports pursuant to
Section 13 or 15(d) of the Securities Exchange Act of 1934.
Yes ☐ No ☒
Indicate by check mark whether the registrant (1) has filed all reports required to be filed by Section 13 or 15(d) of the Securities
Exchange Act of 1934 during the preceding 12 months (or for such shorter period that the registrant was required to file such reports),
and (2) has been subject to such filing requirements for the past 90 days.
Yes ☒ No ☐
Indicate by check mark whether the registrant has submitted electronically and posted on its corporate Web site, if any, every
Interactive Data File required to be submitted and posted pursuant to Rule 405 of Regulation S-T (§232.405 of this chapter) during the
preceding 12 months (or for such shorter period that the registrant was required to submit and post such files).
Yes ☐ No ☐
Indicate by check mark whether the registrant is a large accelerated filer, an accelerated filer, a non-accelerated filer, or an
emerging growth company. See definition of “large accelerated filer,” “accelerated filer,” and “emerging growth company” in Rule
12b-2 of the Exchange Act.
Large accelerated filer ☒ Accelerated filer ☐ Non-accelerated filer ☐ Emerging growth company ☐
If an emerging growth company that prepares its financial statements in accordance with U.S. GAAP, indicate by check mark if
the registrant has elected not to use the extended transition period for complying with any new or revised financial accounting
standards† provided pursuant to Section 13(a) of the Exchange Act. ☐
† The term “new or revised financial accounting standard” refers to any update issued by the Financial Accounting Standards
Board to its Accounting Standards Codification after April 5, 2012.
Indicate by check mark which basis of accounting the registrant has used to prepare the financial statements included in this filing:
U.S. GAAP ☐ International Financial Reporting Standards as issued
by the International Accounting Standards Board ☒Other ☐

If “Other” has been checked in response to the previous question, indicate by check mark which financial statement item the
registrant has elected to follow.
Item 17 ☐ Item 18 ☐
If this is an annual report, indicate by check mark whether the registrant is a shell company (as defined in Rule 12b-2 of the
Securities Exchange Act of 1934).
Yes ☐ No ☒
(APPLICABLE ONLY TO ISSUERS INVOLVED IN BANKRUPTCY PROCEEDINGS DURING THE PAST FIVE YEARS)
Indicate by check mark whether the registrant has filed all documents and reports required to be filed by Sections 12, 13 or 15(d)
of the Securities Exchange Act of 1934 subsequent to the distribution of securities under a plan confirmed by a court.
Yes ☐ No ☐

UNITED MICROELECTRONICS CORPORATION
FORM 20-F ANNUAL REPORT
FISCAL YEAR ENDED DECEMBER 31, 2017
Table of Contents
Page
SUPPLEMENTAL INFORMATION 1
PART I. 4
ITEM 1. IDENTITY OF DIRECTORS, SENIOR MANAGEMENT AND ADVISERS 4
ITEM 2. OFFER STATISTICS AND EXPECTED TIMETABLE 4
ITEM 3. KEY INFORMATION 4
ITEM 4. INFORMATION ON THE COMPANY 22
ITEM 4A. UNRESOLVED STAFF COMMENTS 41
ITEM 5. OPERATING AND FINANCIAL REVIEW AND PROSPECTS 41
ITEM 6. DIRECTORS, SENIOR MANAGEMENT AND EMPLOYEES 57
ITEM 7. MAJOR STOCKHOLDERS AND RELATED PARTY TRANSACTIONS 61
ITEM 8. FINANCIAL INFORMATION 62
ITEM 9. THE OFFER AND LISTING 64
ITEM 10. ADDITIONAL INFORMATION 65
ITEM 11. QUANTITATIVE AND QUALITATIVE DISCLOSURES ABOUT MARKET RISK 85
ITEM 12. DESCRIPTION OF SECURITIES OTHER THAN EQUITY SECURITIES 87
PART II. 89
ITEM 13. DEFAULTS, DIVIDEND ARREARAGES AND DELINQUENCIES 89
ITEM 14. MATERIAL MODIFICATIONS TO THE RIGHTS OF SECURITY HOLDERS AND USE OF
PROCEEDS 89
ITEM 15. CONTROLS AND PROCEDURES 89
ITEM 16. 91
PART III. 94
ITEM 17. FINANCIAL STATEMENTS 94
ITEM 18. FINANCIAL STATEMENTS 94
ITEM 19. EXHIBITS 94
i

SUPPLEMENTAL INFORMATION
The references to “United Microelectronics”, “we”, “us”, “our”, “our company” and “the Company” in this annual report refer to
United Microelectronics Corporation and its consolidated subsidiaries, unless the context suggests otherwise. The references to
“Taiwan” and “R.O.C.” refer to Taiwan, Republic of China. The references to “China” and “PRC” refer to People’s Republic of China.
The references to “shares” and “common shares” refer to our common shares, par value NT$10 per share, and “ADSs” refers to our
American depositary shares, each representing five common shares. The ADSs are issued under the Deposit Agreement, dated as of
October 21, 2009, as amended, supplemented or modified from time to time, among United Microelectronics, JPMorgan Chase Bank,
N.A. and the holders and beneficial owners from time to time of American Depositary Receipts issued thereunder. The references to
“TIFRSs” refers to the Taiwan International Financial Reporting Standards as issued by the Financial Supervisory Commission in the
Republic of China, “IFRSs” refers to International Financial Reporting Standards as issued by the International Accounting Standards
Board, or IASB, and “U.S. GAAP” refers to the generally accepted accounting principles in the United States. Any discrepancies in any
table between totals and sums of the amounts listed are due to rounding.
We publish our financial statements in New Taiwan dollars, the lawful currency of the R.O.C. In this annual report, “NT$” and
“NT dollars” mean New Taiwan dollars, “$”, “US$” and “U.S. dollars” mean United States dollars, “¥” means Japanese Yen, “RMB¥”
means Renminbi and “€” means EURO.
FORWARD-LOOKING STATEMENTS IN THIS ANNUAL REPORT MAY NOT BE REALIZED
Our disclosure and analysis in this annual report contain or incorporate by reference some forward-looking statements. Our
forward-looking statements contain information regarding, among other things, our financial condition, future expansion plans and
business strategy. We have based these forward-looking statements on our current expectations and projections about future events.
You can identify these statements by the fact that they do not relate strictly to historical or current facts. Although we believe that these
expectations and projections are reasonable, such forward-looking statements are inherently subject to risks, uncertainties and
assumptions about us, including, among other things:
• our dependence on frequent introduction of new product services and technologies based on the latest developments;
• the intensely competitive semiconductor, communications, consumer electronics and computer industries and markets;
• risks associated with our international business activities;
• our dependence on key personnel;
• general economic and political conditions, including those related to the semiconductor, communications, consumer
electronics and computer industries;
• natural disasters, such as earthquakes and droughts, which are beyond our control;
• possible disruptions in commercial activities caused by natural and human-induced disasters, and outbreaks of contagious
diseases;
• fluctuations in foreign currency exchange rates;
• additional disclosures we make in our previous and future Form 20-F annual reports and Form 6-K periodic reports to the
U.S. Securities and Exchange Commission, or the U.S. SEC; and
• those other risks identified in the “Item 3. Key Information-D. Risk Factors” section of this annual report.
1

The words “may”, “will”, “is/are likely to”, “anticipate”, “believe”, “estimate”, “expect”, “intend”, “plan” and similar expressions
are intended to identify a number of these forward-looking statements. We do not and will not undertake the obligation to update or
revise any forward-looking statements contained in this annual report whether as a result of new information, future events or
otherwise. In light of these risks, uncertainties and assumptions, the forward-looking events discussed in this annual report might not
occur and our actual results could differ materially from those anticipated in these forward-looking statements.
GLOSSARY
ASIC Application Specific Integrated Circuit. A custom-designed integrated circuit that performs specific
functions which would otherwise require a number of off-the-shelf integrated circuits to perform.
BCD Bipolar- Complementary Metal Oxide Semiconductor (“CMOS”)- Double Diffused Metal Oxide
Semiconductor (“DMOS”). An integrated circuit and is one of the most important components for
power management integration circuits.
BSI-CSI Back-Side Illuminated CMOS Image Sensor, which is recently used for mobile product image sensor
with better performance and thinner chip.
Cell Semiconductor structure in an electrical state which can store a bit of information, mainly used as the
building block of memory array.
Die A piece of a semiconductor wafer containing the circuitry of an unpackaged single chip.
DRAM Dynamic Random Access Memory. A type of volatile memory product that is used in electronic
systems to store data and program instructions. It is the most common type of RAM and must be
refreshed with electricity hundreds of times per second or else it will fade away.
eFlash Embedded Flash Nonvolatile Memory. Used for most SoC (“System-on-Chip”) applications and has
faster speed and enhanced security.
eHV Embedded High Voltage Device. Used for Liquid Crystal Display (“LCD”) driver circuit to drive
LCD devices.
EUV Lithography Extreme Ultraviolet Lithography.
FinFET Fin Field-Effect Transistor.
FPGA Field Programmable Gate Array. A programmable integrated circuit.
Integrated Circuit Entire electronic circuit built on a single piece of solid substrate and enclosed in a small package. The
package is equipped with leads needed to electrically integrate the integrated circuit with a larger
electronic system. Monolithic and hybrid integrated circuits are distinguished by the type of substrate
used.
Interconnect The conductive path made from copper or aluminum that is required to achieve connection from one
circuit element to the other circuit elements within a circuit.
Mask or Photomask A piece of glass on which an integrated circuit circuitry design is laid out.
MCU Microcontroller unit, a small computer on a single integrated circuit, containing one or more central
processing units along with memory and programmable input/output peripherals.
2

Memory A group of integrated circuits that a computer uses to store data and programs, such as ROM, RAM,
DRAM and SRAM.
Micron A unit of spatial measurement that is one-millionth of a meter.
Nanometer A unit of spatial measurement that is one-billionth of a meter.
PC Personal computer.
RAM Random Access Memory. A type of volatile memory forming the main memory of a computer where
applications and files are run.
ROM Read-Only Memory. Memory that is programmed by the manufacturer and cannot be changed.
Typically, ROM is used to provide start-up data when a computer is first turned on.
Scanner A photolithography tool used in the production of semiconductor devices. This camera-like
step-and-scan tool projects the image of a circuit from a master image onto a photosensitized silicon
wafer.
Semiconductor A material with electrical conducting properties in between those of metals and insulators.
Essentially, semiconductors transmit electricity only under certain circumstances, such as when given
a positive or negative electric charge. Therefore, a semiconductor’s ability to conduct can be turned
on or off by manipulating those charges and this allows the semiconductor to act as an electric switch.
The most common semiconductor material is silicon, used as the base of most semiconductor chips
today because it is relatively inexpensive and easy to create.
SoC System-on-Chip. A chip that incorporates functions currently performed by several chips on a cost
effective basis.
SOI Silicon-On-Insulator. Silicon wafer consisting of a thin layer of oxide, on top of which semiconductor
devices are built.
SRAM Static Random Access Memory. A type of volatile memory product that is used in electronic systems
to store data and program instructions. Unlike the more common DRAM, it does not need to be
refreshed.
Transistor Tri-terminal semiconductor device in which input signal (voltage or current depending on the type of
transistor) controls output current. An individual circuit that can amplify or switch electric current.
This is the building block of all integrated circuits.
Volatile memory Memory products which lose their data content when the power supply is switched off.
Wafer Thin, round, flat piece of silicon that is the base of most integrated circuits.
8-inch wafer equivalents Standard unit describing the equivalent amount of 8-inch wafers produced after conversion, used to
quantify levels of wafer production for purposes of comparison. Figures of 8-inch wafer equivalents
are derived by converting the number of wafers of all dimensions (e.g., 6-inch, 8-inch and 12-inch)
into their equivalent figures for 8-inch wafers. 100 6-inch wafers are equivalent to 56.25 8-inch
wafers. 100 12-inch wafers are equivalent to 225 8-inch wafers.
3

PART I.
ITEM 1. IDENTITY OF DIRECTORS, SENIOR MANAGEMENT AND ADVISERS
Not applicable.
ITEM 2. OFFER STATISTICS AND EXPECTED TIMETABLE
Not applicable.
ITEM 3. KEY INFORMATION
A. Selected Financial Data
The selected consolidated balance sheets data as of December 31, 2016 and 2017 and the selected consolidated statements of
comprehensive income data for the years ended December 31, 2015, 2016 and 2017 are derived from our audited consolidated financial
statements included elsewhere in this annual report. In accordance with the requirements of the Taiwan Financial Supervisory
Commission, or FSC, beginning on January 1, 2013, we have adopted Taiwan-IFRSs, which is translated and published by Accounting
Research and Development Foundation, or ARDF, referred to as “TIFRSs” for reporting our annual and interim consolidated financial
statements in the R.O.C. At the same time, we have adopted IFRSs as issued by the IASB for our annual reports on Form 20-F with the
U.S. SEC beginning with the year ended December 31, 2013. However, since January 1, 2013, we only prepare our interim unaudited
quarterly financial statements under TIFRSs, which are furnished to the SEC on Form 6-K. The selected consolidated balance sheet data
as of December 31, 2013, 2014 and 2015 and the selected consolidated statements of comprehensive income data for the years ended
December 31, 2013 and 2014 are derived from our audited consolidated financial statements not included in this annual report.
In accordance with rule amendments adopted by the U.S. SEC for foreign private issuers reporting under IFRSs, we are not
required to provide reconciliations to U.S. GAAP in this annual report following our adoption of IFRSs.
The selected financial data set forth below should be read in conjunction with “Item 5. Operating and Financial Review and
Prospects” and our consolidated financial statements and the notes to those statements included in this annual report.
Years Ended December 31,
2013 2014 2015 2016 2017
NT$ NT$ NT$ NT$ NT$ US$
(in millions, except per share and per ADS data)
Consolidated Statements of Comprehensive Income Data
Net operating revenues 123,812 140,012 144,830 147,870 149,285 5,037
Operating costs (100,249) (108,159) (113,061) (117,491) (122,227) (4,124)
Gross profit 23,563 31,853 31,769 30,379 27,058 913
Operating expenses (19,406) (21,238) (19,969) (23,922) (22,143) (747)
Net other operating income and expenses (125) (539) (964) (263) 1,653 56
Operating income 4,032 10,076 10,836 6,194 6,568 222
Non-operating income and expenses 10,309 3,496 2,833 (1,473) 1,104 37
Income from continuing operations before income tax 14,341 13,572 13,669 4,721 7,672 259
Income tax expense (2,257) (3,125) (1,028) (553) (993) (34)
Net income 12,084 10,447 12,641 4,168 6,679 225
Total other comprehensive income (loss), net of tax 198 6,069 (1,065) (4,024) (4,815) (162)
Total comprehensive income 12,282 16,516 11,576 144 1,864 63
4

Years Ended December 31,
2013 2014 2015 2016 2017
NT$ NT$ NT$ NT$ NT$ US$
(in millions, except per share and per ADS data)
Net income attributable to:
Stockholders of the parent 12,609 11,109 13,254 8,621 9,676 326
Non-controlling interests (525) (662) (613) (4,453) (2,997) (101)
Total comprehensive income attributable to:
Stockholders of the parent 12,796 17,035 12,251 4,629 4,973 168
Non-controlling interests (514) (519) (675) (4,485) (3,109) (105)
Earnings per share: (1)
Basic 1.02 0.90 1.07 0.71 0.81 0.03
Diluted (2) 0.96 0.89 1.02 0.67 0.75 0.03
Common shares used in earnings per share calculation:
Basic 12,346 12,334 12,336 12,099 11,995 11,995
Diluted (2) 13,150 12,719 13,171 13,350 13,273 13,273
Earnings per ADS equivalent:
Basic 5.11 4.50 5.37 3.56 4.03 0.14
Diluted (2) 4.82 4.44 5.10 3.33 3.75 0.13
As of December 31,
2013 2014 2015 2016 2017
NT$ NT$ NT$ NT$ NT$ US$
Consolidated Balance Sheets Data
Total assets 293,914 310,648 335,354 384,227 391,132 13,196
Total liabilities 84,270 90,309 110,502 169,281 181,511 6,124
Stockholders’ equity 209,644 220,339 224,852 214,946 209,621 7,072
Capital stock (3) 126,946 127,303 127,581 126,243 126,243 4,259
Dividends declared per share (4) 0.40 0.50 0.55 0.55 0.50 0.02
Years Ended December 31,
2013 2014 2015 2016 2017
NT$ NT$ NT$ NT$ NT$ US$
Segment Data (5)
Net operating revenues
Wafer fabrication 116,914 129,954 141,705 147,444 148,940 5,025
New business 6,898 10,058 3,125 426 345 12
Net income (loss) (6)
Wafer fabrication 12,675 12,311 13,570 4,219 6,729 227
New business (2,244) (2,354) (1,731) (1,662) (666) (22)
(1) Earnings per share is calculated by dividing net income by the weighted-average number of common shares outstanding during the
year.
(2) Diluted securities include convertible bonds, employee stock options and employees’ compensation, if any.
(3) Changes to the number of the capital common shares are primarily caused by the share-based payment transactions and the
cancellation of treasury stocks, if any.
(4) Dividends declared per share are in connection with earnings and accumulated additional paid-in capital and would be adjusted for
the outstanding common shares changed due to employee stock options exercised, treasury stock repurchased, cancelled and
transferred to employees, if any.
(5) Since 2016, certain of our previous new business operation was reclassified as part of wafer fabrication operation resulting in
retrospective reclassification of segmentation data.
(6) There are adjustments for intragroup elimination and GAAP differences between segment data and consolidated data.
5

Currency Translations and Exchange Rates
In portions of this annual report, we have translated New Taiwan dollar amounts into U.S. dollars for the convenience of readers.
The rate we used for the translations was NT$29.64 to US$1.00, which was the foreign exchange rate on December 29, 2017 as released
by the Board of Governors of the Federal Reserve System. The translation does not mean that New Taiwan dollars could actually be
converted into U.S. dollars at that rate. The following table shows the noon buying rates for New Taiwan dollars expressed in New
Taiwan dollar per US$1.00. On April 20, 2017, the noon buying rate was NT$29.48 to US$1.00.
Average (1) High Low
At Period-
End
2013 29.73 30.20 29.93 29.83
2014 30.38 31.80 29.85 31.60
2015 31.80 33.17 30.37 32.79
2016 32.22 33.74 31.05 32.40
2017 30.27 32.37 29.64 29.64
October 30.25 30.44 30.12 30.12
November 30.08 30.21 29.97 29.98
December 29.95 30.05 29.64 29.64
2017 (through April 20) 29.27 29.61 29.03 29.48
January 29.40 29.61 29.05 29.16
February 29.25 29.42 29.03 29.32
March 29.20 29.35 29.10 29.10
April (through April 20) 29.28 29.48 29.14 29.48
Source: Federal Reserve Statistical Release, the Board of Governors of the Federal Reserve System.
(1) Determined by averaging the rates on the last business day of each month during the relevant period for annual periods, and by
averaging the rates on each business day for monthly periods.
B. Capitalization and Indebtedness
Not applicable.
C. Reasons for the Offer and Use of Proceeds
Not applicable.
D. Risk Factors
Our business and operations are subject to various risks, many of which are beyond our control. If any of the risks described below
actually occurs, our business, financial condition or results of operations could be seriously harmed.
Risks Related to Our Business and Financial Condition
Any global systemic political, economic and financial crisis or catastrophic natural disasters (as well as the indirect effects flowing
therefrom) could negatively affect our business, results of operations, and financial condition.
6

In recent times, several major systemic economic and financial crises and natural disasters negatively affected global business,
banking and financial sectors, including the semiconductor industry and markets. These types of crises cause turmoil in global markets
that often result in declines in electronic products sales from which we generate our income through our goods and services. In addition,
these crises may cause a number of indirect effects such as undermining the ability of our customers to remain competitive when faced
with the financial and economic challenges created by insolvent countries and companies still struggling to survive in the wake of these
crises. For example, there could be in the future knock-on effects from these types of crises on our business, including significant
decreases in orders from our customers; insolvency of key suppliers resulting in product delays; inability of customers to obtain credit
to finance purchases of our products; customer insolvencies; and counterparty failures negatively impacting our treasury operations.
Any future systemic political, economic or financial crises or catastrophic natural disasters (as well as the indirect effects flowing from
these crises or disasters) could cause revenues for the semiconductor industry as a whole to decline dramatically, and if the economic
conditions or financial condition of our customers were to deteriorate, additional accounting related allowances may be required in the
future and such additional allowances could increase our operating expenses and therefore reduce our operating income and net income.
Thus, any future global economic crisis or catastrophic natural disaster (and their indirect effects) could materially and adversely affect
our results of operations.
Historically, we recognized impairment for our investments in solar energy and LED industries made through our subsidiary,
namely UMC New Business Investment Corporation, or NBI. If the solar energy and LED industries continue to encounter significant
downturns or significant reductions of government subsidies, our investments made through NBI will be adversely affected which could
adversely affect our results of operations.
The seasonality and cyclical nature of the semiconductor industry and periodic overcapacity make us particularly vulnerable to
significant and sometimes prolonged economic downturns.
The semiconductor industry has historically been highly cyclical and, at various times, has experienced significant downturns.
Since most of our customers operate in semiconductor-related industries, variations in order levels from our customers can result in
volatility in our revenues and earnings. Because our business is, and will continue to be, largely dependent on the requirements of
semiconductor companies for our services, downturns in the semiconductor industry will lead to reduced demand for our services.
Our net operating revenues are also typically affected by seasonal variations in market conditions that contribute to the
fluctuations of the average selling price of semiconductor services and products. The seasonal sales trends for semiconductor services
and products closely mirror those for consumer electronics, communication and computer sales. We generally experience seasonal lows
in the demand for semiconductor services and products during the first half of the year, primarily as a result of inventory correction by
our customers. Any change in the general seasonal variations, which we cannot anticipate, may result in materially adverse effects on
our revenues, operations and businesses.
Our operating results fluctuate from quarter to quarter, which makes it difficult to predict our future performance.
Our revenues, expenses and results of operations have varied significantly in the past and may fluctuate significantly from quarter
to quarter in the future due to a number of factors, many of which are beyond our control. Our business and operations have at times in
the past been negatively affected by, and are expected to continue to be subject to the risk of the following factors:
• the seasonality and cyclical nature of both the semiconductor industry and the markets served by our customers;
• our customers’ adjustments in their inventory;
• the loss of a key customer or the postponement of orders from a key customer;
• the rescheduling and cancellation of large orders;
• our ability to obtain equipment, raw materials, electricity, water and other required utilities on a timely and economic basis;
7

• outbreaks of contagious diseases, including but not limited to severe acute respiratory syndrome, avian flu, swine flu and
Zika virus;
• environmental events, such as fires and earthquakes, or industrial accidents; and
• technological changes.
Due to the factors noted above and other risks discussed in this section, many of which are beyond our control, you should not rely
on quarter-to-quarter comparisons to predict our future performance. Unfavorable changes in any of the above factors may seriously
harm our business, financial condition and results of operations. In addition, our operating results may be below the expectations of
public market analysts and investors in some future periods. In this event, the price of the common shares or ADSs may underperform
or fall.
A decrease in demand for or selling prices of communication devices, consumer electronics and computer goods may decrease the
demand for our services and reduce our margins.
Our customers generally use the semiconductors produced in our fabs in a wide variety of applications. We derive a significant
percentage of our operating revenues from customers who use our manufacturing services to make semiconductors for communication
devices, consumer electronics, PCs and other computers. The semiconductor industry experienced several downturns due to recent
major financial crises and natural disasters. These downturns resulted in a reduced demand for our services and hence decreased our
revenues and earnings. Any significant decrease in the demand for communication devices, consumer electronics, PCs or other
computers may further decrease the demand for our services. In addition, if the average selling price of communication devices,
consumer electronics, PCs or other computers decline significantly, we will be pressured to further reduce our selling prices, which may
reduce our revenues and, therefore, reduce our margins significantly. As demonstrated by downturns in demand for high technology
products in the past, market conditions can change rapidly, without apparent warning or advance notice. In such instances, our
customers will experience inventory buildup and/or difficulties in selling their products and, in turn, will reduce or cancel orders for
wafers from us. The timing, severity and recovery of these downturns cannot be predicted accurately or at all. When they occur, our
business, profitability and price of the common shares and ADSs are likely to suffer.
Overcapacity in the semiconductor industry may reduce our revenues, earnings and margins.
The prices that we can charge our customers for our services are significantly related to the overall worldwide supply of integrated
circuits and semiconductor products. The overall supply of semiconductor products is based in part on the capacity of other companies,
which is outside of our control. For example, in light of the current market conditions, some companies, including our largest
competitors, have announced plans to increase capacity expenditures significantly. We believe such plans, if carried out as planned, will
increase the industry-wide capacity and are likely to result in overcapacity in the future. In periods of overcapacity, if we are unable to
offset the adverse effects of overcapacity through, among other things, our technology and product mix, we may have to lower the
prices we charge our customers for our services and/or we may have to operate at significantly less than full capacity. Such actions
could reduce our margin and weaken our financial condition and results of operations. We cannot give any assurance that an increase in
the demand for foundry services in the future will not lead to overcapacity in the near future, which could materially adversely affect
our revenues, earnings and margins.
Any problem in the semiconductor outsourcing infrastructure can adversely affect our net operating revenues and profitability.
Many of our customers depend on third parties to provide mask tooling, assembly and test services. If these customers cannot
timely obtain these services on reasonable terms, they may not order any foundry services from us. This may significantly reduce our
net operating revenues and negatively affect our profitability.
8
We may be unable to implement new technologies as they become available, which may result in the decrease of our profitability
and the loss of customers and market share.
The semiconductor industry is developing rapidly and the related technology is constantly evolving. If we do not anticipate the
technology evolution and rapidly adopt new and innovative technology, we may not be able to produce sufficiently advanced services at
competitive prices. There is a risk that our competitors may adopt new technology before we do, resulting in our loss of market share. If
we are unable to begin offering advanced services and processes on a competitive and timely basis, we may lose customers to our
competitors providing similar technologies, which may cause our net operating revenues to decline unless we can replace lost customers
with new customers. In addition, the market prices for advanced technology and services tend to fall over time. As a result, if we are
unable to offer new advanced services and processes on a competitive and timely basis, we need to decrease the prices that we set for
our existing services and processes, which would have a negative effect on our profitability. We also depend upon the introduction of
new technologies on a timely basis in order to benefit from the relatively higher prices such new technologies offer in the earlier stages
of their life cycles. If we are unable to introduce new technologies on a timely and competitive basis, we may not be able to benefit
from the relatively higher prices for new technologies, and our average selling price and profits would decrease accordingly.
We may be unable to provide leading technology to our customers if we lose the support of our technology partners.
Enhancing our manufacturing process technologies is critical to our ability to provide services for our customers. We intend to
continue to advance our process technologies through internal research and development and alliances with other companies. Although
we have an internal research and development team focused on developing new and improved semiconductor manufacturing process
technologies, we are also dependent on some of our technology partners to advance certain process technology portfolios. In addition,
we currently have patent cross-licensing agreements with several companies, including International Business Machines Corporation, or
IBM. Some mask and equipment vendors also supply our technology development teams with masks and equipment needed to develop
more advanced processing technologies. If we are unable to continue any of our joint development arrangements, patent cross-licensing
agreements and other agreements, on mutually beneficial economic terms, if we re-evaluate the technological and economic benefits of
such relationships, if we are unable to enter into new technology alliances and arrangements with other leading and specialty
semiconductor companies, or if we fail to secure masks and equipment from our vendors in a timely manner sufficient to support our
ongoing technology development, we may be unable to continue providing our customers with leading edge mass-producible process
technologies and may, as a result, lose important customers, which would have a materially adverse effect on our businesses, results of
operations and financial condition.
In addition, some of our customers rely upon third-party vendors, or intellectual property vendors, for the intellectual property
they embed into their designs. Although we work and collaborate with intellectual property vendors with respect to such matters, there
can be no guarantee that we will be successful or that the vendors will deliver according to our requirements or the needs of our
customers. Failures to meet the targets or to deliver on a timely basis could cause customers to cancel orders and/or shift capacity to
other suppliers.
Our business may suffer if we cannot compete successfully in our industry.
The worldwide semiconductor foundry industry is highly competitive. We compete with dedicated foundry service providers such
as Taiwan Semiconductor Manufacturing Company Limited, Semiconductor Manufacturing International (Shanghai) Corporation and
Globalfoundries Inc., as well as the foundry operation services of some integrated device manufacturers, such as IBM, Intel, Samsung
Electronics, or Samsung, and Toshiba Corporation, or Toshiba. Integrated device manufacturers principally manufacture and sell their
own proprietary semiconductor products, but may also offer foundry services. Other competitors such as DongbuAnam Semiconductor,
Grace Semiconductor Manufacturing Corp., X-FAB Semiconductors Foundries AG and Silterra Malaysia Sdn. Bhd. have initiated
efforts to expand and develop substantial additional foundry capacity. New entrants and consolidations in the foundry business are
likely to initiate a trend of competitive pricing and create potential overcapacity in legacy technology. Some of our competitors have
greater access to capital and substantially greater production, research and development, marketing and other resources than we do. As a
result, these companies may be able to compete more aggressively over a longer period of time than we can.
9

The principal elements of competition in the wafer foundry market include:
• technical competence;
• time-to-volume production and cycle time;
• time-to-market;
• research and development quality;
• available capacity;
• manufacturing yields;
• customer service and design support;
• price;
• management expertise; and
• strategic alliances.
Our ability to compete successfully also depends on factors partially outside of our control, including product availability,
intellectual property, including cell libraries that our customers embed in their product designs, and industry and general economic
trends.
We may not be able to implement our planned growth if we are unable to obtain the financing necessary to fund the substantial
capital expenditures we expect to incur.
Our business and the nature of our industry require us to make substantial capital expenditures leading to a high level of fixed
costs. The costs of facilities, tools and equipment to make semiconductors with advanced technology continue to rise, with each
generation typically significantly more expensive than the larger-in-size more mature technologies which preceded. We expect to incur
significant capital expenditures in connection with our growth plans. These capital expenditures will be made in advance of any
additional sales to be generated by new or upgraded fabs as a result of these expenditures. Given the fixed-cost nature of our business,
we have in the past incurred, and may in the future incur, operating losses if our revenues do not adequately offset our capital
expenditures. Additionally, our actual expenditures may exceed our planned expenditures for a variety of reasons, including changes in:
• our growth plan;
• our process technology;
• our research and development efforts and patent license arrangements;
• market conditions;
• interest rates;
• exchange rate fluctuations; and
• prices of equipment.
10

We cannot assure you that additional financing will be available on satisfactory terms, if at all. If adequate funds are not available
on satisfactory terms, we may be forced to curtail our expansion plans or delay the deployment of our services, which could result in a
loss of customers and limit the growth of our business.
We depend on a small number of customers for a significant portion of our net operating revenues and any loss of these customers
would result in significant declines in our net operating revenues.
We have been largely dependent on a small number of customers for a substantial portion of our business. In 2017, our top ten
customers accounted for 54.8% of our net operating revenues. We expect that we will continue to depend upon a relatively limited
number of customers for a significant portion of our net operating revenues. We cannot assure you that our net operating revenues
generated from these customers, individually or in the aggregate, will reach or exceed historical levels in any future period. Loss or
cancellation of business from significant changes in scheduled deliveries to, or decreases in the prices of services sold to any of these
customers could significantly reduce our net operating revenues.
Our customers generally do not place purchase orders far in advance, which makes it difficult for us to predict our future revenues,
adjust production costs and allocate capacity efficiently on a timely basis. In addition, due to the cyclical nature of the semiconductor
industry, our customers’ purchase orders have varied significantly from period to period. As a result, we do not typically operate with
any significant backlog, except in periods of extreme capacity shortage. The lack of significant backlog and the unpredictable length
and timing of semiconductor cycles make it difficult for us to forecast our revenues in future periods. Moreover, our expense levels are
based in part on our expectations of future revenues, and we may be unable to adjust costs in a timely manner to compensate for
revenue shortfalls. We expect that in the future our net operating revenues in any quarter will continue to be substantially dependent
upon purchase orders received in that quarter.
Moreover, the increasing trend in mergers and acquisitions activities in the semiconductor industry could decrease total available
customer base, which could potentially result in a loss of customers.
Our inability to obtain, preserve and defend intellectual property rights could harm our competitive position.
Our ability to compete successfully and achieve future growth will depend, in part, on our ability to protect our proprietary
technology and to secure critical processing technology that we do not own at commercially reasonable terms. We cannot assure you
that in the future we will be able to independently develop, or secure from any third party, the technology required for upgrading our
production facilities or for meeting our customer needs. Our failure to successfully obtain such technology may seriously harm our
competitive position.
Our ability to compete successfully also depends on our ability to operate without infringing on the proprietary rights of others.
We have no means of knowing what patent applications have been filed in the United States or in certain other countries until months
after they are filed. The semiconductor industry, because of the complexity of the technology used and the multitude of patents,
copyrights and other overlapping intellectual property rights, is characterized by frequent litigation regarding patent, trade secret and
other intellectual property rights. It is common for patent owners to assert their patents against semiconductor manufacturers. We have
received from time to time communications from third parties asserting patents that cover certain of our technologies and alleging
infringement of intellectual property rights of others, and we expect to continue to receive such communications in the future. In the
event any third party was to make a valid claim against us or against our customers, we could be required to:
• seek to acquire licenses to the infringed technology which may not be available on commercially reasonable terms, if at all;
• discontinue using certain process technologies, which could cause us to stop manufacturing certain semiconductors;
• pay substantial monetary damages; and/or
11

• seek to develop non-infringing technologies, which may not be feasible.
Any one of these developments could place substantial financial and administrative burdens on us and hinder our business.
Litigation, which could result in substantial expenses for us and diversion of our resources, may also be necessary to enforce our patents
or other intellectual property rights or to defend us or our customers against claimed infringement of the rights of others. If we fail to
obtain necessary licenses or if litigation relating to patent infringement or other intellectual property matters occurs, it could hurt our
reputation as a technology leader in our industry and prevent us from manufacturing particular products or applying particular
technologies, which could reduce opportunities to generate revenues.
Our operations and business will suffer if we lose one or more of our key personnel without adequate replacements.
Our future success to a large extent depends on the continued services of our Chairman and key executive officers. We do not
carry key person insurance on any of our personnel. If we lose the services of any of our Chairman or key executive officers, it could be
difficult to find and integrate replacement personnel in a short period of time, which could harm our operations and the growth of our
business.
We may have difficulty attracting and retaining skilled employees, who are critical to our future success.
The success of our business depends upon attracting and retaining experienced executives, engineers and other employees to
implement our strategy. The competition for skilled employees is intense. We expect demand for personnel in Taiwan to increase in the
future as new wafer fabrication facilities and other businesses are established in Taiwan. We also expect demand for experienced
personnel in other locations to increase significantly as our competitors establish and expand their operations. Some of our competitors
are willing to offer better compensation than that we do to our executives, engineers and other employees. We do not have long-term
employment contracts with any of our employees. If we were unable to retain our existing personnel or attract, assimilate and recruit
new experienced personnel in the future, it could seriously disrupt our operations and delay or restrict the growth of our business.
Our transactions with affiliates and stockholders may hurt our profitability and competitive position.
We have provided foundry services to several of our affiliates and stockholders. We currently do not provide any preferential
treatment to any of these affiliates and stockholders. However, we may in the future reserve or allocate our production capacity to these
companies if there is a shortage of foundry services in the market to enable these companies to maintain their operations and/or to
protect our investments in them. This reservation or allocation may reduce our capacity available for our other customers, which may
damage our relationships with other customers and discourage them from using our services. This may hurt our profitability and
competitive position.
If we fail to maintain an effective system of internal control over financial reporting, we may be unable to accurately report our
financial results or prevent fraud, and investor confidence in our company may be adversely affected.
We are required to comply with the R.O.C and the U.S. securities laws and regulations in connection with internal controls. As a
public company in the United States, our management is required to assess the effectiveness of our internal control over financial
reporting using the criteria established in Internal Control-Integrated Framework issued by the Committee of Sponsoring Organizations
of the Treadway Commission (2013 framework), or the COSO criteria, as required by Section 404 of the Sarbanes-Oxley Act of 2002.
However, although effective internal controls can provide reasonable assurance with respect to the preparation and fair
presentation of financial statements, they may not prevent or detect misstatements because of their inherent limitations, including the
possibility of human error, the circumvention or overriding of controls, fraud or corruption. If we fail to maintain the adequacy of our
internal controls, our business and operating results could be harmed, we could fail to meet our reporting obligations, and there could be
a material adverse effect on the market price of our common shares and ADSs.
12

The trend of adopting protectionist measures in certain countries, including the United States, could have a material adverse impact
on our results of operations and financial condition.
Governments in the United States, PRC and certain other countries have implemented fiscal and monetary programs to stimulate
economic growth as a result of the recent economic downturn, and many of these programs include protectionist measures that
encourage the use of domestic products and labor. Recent policy developments by the governments in China and elsewhere also suggest
an increased unwillingness to allow international companies to invest in or acquire local businesses. Since many of our direct customers
and other downstream customers in the supply chain are located in or have operations in the countries where protectionist measures
were adopted, such protectionist measures may have a material adverse effect on demand for our manufacturing services.
Any future outbreak of contagious diseases may materially and adversely affect our business and operations, as well as our
financial condition and results of operations.
Any future outbreak of contagious diseases, including but not limited to Zika virus, Ebola virus, avian or swine influenza or severe
acute respiratory syndrome, may disrupt our ability to adequately staff our business and may generally disrupt our operations. If any of
our employees is suspected of having contracted any contagious disease, we may under certain circumstances be required to quarantine
such employees and the affected areas of our premises. Therefore, we may have to temporarily suspend part of or all of our operations.
Furthermore, any future outbreak may restrict the level of economic activities in affected regions, including Taiwan, and affect the
willingness and ability of our employees and customers to travel, which may also adversely affect our business and prospects. As a
result, we cannot assure you that any future outbreak of contagious diseases would not have a material adverse effect on our financial
condition and results of operations.
Currency fluctuations could increase our costs relative to our revenues, which could adversely affect our profitability.
More than half of our net operating revenues are denominated in currencies other than New Taiwan dollars, primarily in U.S.
dollars. On the other hand, more than half of our costs of direct labor, raw materials and overhead are incurred in New Taiwan dollars.
Although historically we hedged a portion of the resulting net foreign exchange position through the use of foreign exchange spot
transactions, or currency forward contracts, we are still affected by fluctuations in foreign exchange rates among the U.S. dollar, the
New Taiwan dollar and other currencies. Any significant fluctuation in exchange rates may impact on our financial condition and the
U.S. dollar value of the ADSs and the U.S. dollar value of any cash dividends we distributed, which could have a corresponding effect
on the market price of the ADSs.
Risks Relating to Manufacturing
Our manufacturing processes are highly complex, costly and potentially vulnerable to impurities and other disruptions that can
significantly increase our costs and delay product shipments to our customers.
Our manufacturing processes are highly complex, require advanced and costly equipment and are continuously being modified to
improve manufacturing yields and product performance. Impurities or other difficulties in the manufacturing process or defects with
respect to equipment or supporting facilities can lower manufacturing yields, interrupt production or result in losses of products in
process. As system complexity has increased and process technology has become more advanced, manufacturing tolerances have been
reduced and requirements for precision have become even more demanding. Although we have been enhancing our manufacturing
capabilities and efficiency, from time to time we have experienced production difficulties that have caused delivery delays and quality
control problems, as is common in the semiconductor industry. In the past we have encountered the following problems:
13

• capacity constraints due to changes in product mix or the delayed delivery of equipment critical to our production, including
scanners, steppers and chemical stations;
• construction delays during expansions of our clean rooms and other facilities;
• difficulties in upgrading or expanding existing facilities;
• manufacturing execution system or automatic transportation system failure;
• unexpected breakdowns in our manufacturing equipment and/or related facilities;
• changing or upgrading our process technologies;
• raw materials shortages and impurities; and
• delays in delivery and shortages of spare parts and in maintenance for our equipment and tools.
Should these problems repeat, we may suffer delays in delivery and/or loss of business and revenues. In addition, we cannot
guarantee that we will be able to increase our manufacturing capacity and efficiency in the future to the same extent as in the past.
Our profit margin may substantially decline if we are unable to continuously improve our manufacturing yields, maintain high
capacity utilization and optimize the technology mix of our silicon wafer production.
Our ability to maintain our profitability depends, in part, on our ability to:
• maintain high capacity utilization, which is defined as the ratio of the wafer-out quantity of 8-inch wafer equivalents divided
by our estimated total 8-inch equivalent capacity in a specified period. The estimated capacity figures may vary depending
upon equipment delivery schedules, pace of migration to more advanced processing technologies and other factors affecting
production ramp-ups;
• maintain or improve our manufacturing yields, which is defined as the percentage of usable devices manufactured on a
wafer; and
• optimize the technology mix of our production by increasing the number of wafers manufactured by utilizing different
processing technologies.
Our manufacturing yields directly affect our ability to attract and retain customers, as well as the price of our services. Our
capacity utilization affects our operating results because a large percentage of our operating costs are fixed. Our technology mix affects
utilization of our equipment and process technologies, as well as the prices we can charge, either of which can affect our margins. If we
are unable to continuously improve our manufacturing yields, maintain high capacity utilization or optimize the technology mix of our
wafer production, our profit margin may substantially decline.
We may have difficulty in ramping up production in accordance with our schedule, which could cause delays in product deliveries
and decreases in manufacturing yields.
As is common in the semiconductor industry, we have from time to time experienced difficulties in ramping up production at new
or existing facilities or effecting transitions to new manufacturing processes. As a result, we have suffered delays in product deliveries
or reduced manufacturing yields. We may encounter similar difficulties in connection with:
• the migration to more advanced process technologies, such as 45/40 and 28-nanometer and more advanced process
technology;
14

• the joint development with vendors for more powerful tools (both in production and inspection) needed in the future to meet
advanced process technology requirements; and
• the adoption of new materials in our manufacturing processes.
We may face construction delays, interruptions, infrastructure failure and delays in upgrading or expanding existing facilities, or
changing our process technologies, any of which might adversely affect our production schedule. Our failure to achieve our production
schedule could delay the time required to recover our investments and seriously affect our profitability.
Our production schedules could be delayed and we may lose customers if we are unable to obtain raw materials and equipment in a
timely manner.
We depend on our suppliers for raw materials. To maintain competitive manufacturing operations, we must obtain from our
suppliers, in a timely manner, sufficient quantities of quality materials at acceptable prices. Although we source our raw materials from
several suppliers, a small number of these suppliers account for a substantial amount of our supply of raw materials because of the
consistent quality of their products. For example, in 2015, 2016 and 2017, we purchased a majority of our silicon wafers from four
makers, Shin-Etsu Handotai Corporation, or Shin-Etsu, GlobalWafers, Siltronic and Sumco Group (including Sumco Corporation and
Formosa Sumco Technology Corporation). We may have long-term contracts with most of our suppliers if necessary. From time to
time, our suppliers have extended lead time or limited the supply of required materials to us because of capacity constraints.
Consequently, from time to time, we have experienced difficulty in obtaining the quantities of raw materials we need on a timely basis.
In addition, from time to time we may reject materials that do not meet our specifications, resulting in declines in output or
manufacturing yields. We cannot assure you that we will be able to obtain sufficient quantities of raw materials and other supplies in a
timely manner. If the supply of materials is substantially diminished or if there are significant increases in the costs of raw materials, we
may be forced to incur additional costs to acquire sufficient quantities of raw materials to sustain our operations, which may increase
our marginal costs and reduce profitability.
We also depend on a limited number of manufacturers and vendors that make and maintain the complex equipment we use in our
manufacturing processes. We also rely on these manufacturers and vendors to improve our technology to meet our customers’ demands
as technology improves. In periods of unpredictable and highly diversified market demand, the lead time from order to delivery of this
equipment can be as long as six to twelve months. If there are delays in the delivery of equipment or in the availability or performance
of necessary maintenance, or if there are increases in the cost of equipment, it could cause us to delay our introduction of new
manufacturing capacity or technologies and delay product deliveries, which may result in the loss of customers and revenues.
We may be subject to the risk of loss due to fire because the materials we use in our manufacturing processes are highly flammable.
We use highly flammable materials such as silane and hydrogen in our manufacturing processes and may therefore be subject to
the risk of loss arising from fires. The risk of fire associated with these materials cannot be completely eliminated. We maintain
insurance policies to reduce losses caused by fire, including business interruption insurance. While we believe that our insurance
coverage for damage to our property and business interruption due to fire is consistent with semiconductor industry practice, our
insurance coverage is subject to deductibles and self-insured retention and may not be sufficient to cover all of our potential losses. If
any of our fabs were to be damaged or cease operations as a result of a fire, it would temporarily reduce manufacturing capacity and
reduce revenues.
15

We and many of our customers and suppliers are vulnerable to natural disasters and other events outside of our control, which may
seriously disrupt our operations.
Most of our assets and many of our customers and suppliers are located in certain parts of Taiwan. Our operations and the
operations of our customers and suppliers are vulnerable to earthquakes, floods, droughts, power losses and similar events that affect the
locations of our operations. The occurrence of any of these events could interrupt our services and cause severe damages to wafers in
process, or cause significant business disruptions. For example, in early 2016, we experienced a severe earthquake which adversely
affected our wafer manufacturing operations at our 300mm Fab 12A in Taiwan. Although we had adopted practices in compliance with
ISO 22301 business continuity standards which ensured the safety of our employees and minimized supply disruptions resulting from
the earthquake and we had settled our insurance policies which partially recovered the losses resulting for this earthquake, there is no
guarantee that our business continuity practices will always be effective and any future damages or business loss from severe natural
disasters will be covered by such insurance, that we will be able to collect from our insurance carriers, should we choose to claim under
our insurance policies, or that such coverage will be sufficient. In addition, our manufacturing facilities have occasionally experienced
insufficient power supplies, and our operations have been disrupted.
Our operations may be delayed or interrupted and our business could suffer if we violate environmental, safety and health, or ESH,
regulations.
The semiconductor manufacturing process requires the use of various gases, chemicals, hazardous materials and other substances
such as solvents and sulfuric acid which may have an impact on the environment. We are always subject to ESH regulations, and a
failure to manage the use, storage, transportation, emission, discharge, recycling or disposal of raw materials or to comply with these
ESH regulations could result in (i) regulatory penalties, fines and other legal liabilities, (ii) suspension of production or delays in
operation and capacity expansion, (iii) a decrease in our sales, (iv) an increase in pollution cleaning fees and other operation costs, or
(v) damage to our public image, any of which could harm our business. In addition, as ESH regulations are becoming more
comprehensive and stringent, we may incur a greater amount of capital expenditures in technology innovation and materials substitution
in order to comply with such regulations, which may adversely affect our results of operations.
Climate change may negatively affect our business.
There is increasing concern that climate change is occurring and may have dramatic effects on human activity without aggressive
remediation steps. A modest change in temperature would result in increased coastal flooding, changing precipitation patterns and
increasing risk of extinction for the world’s species. Public expectations for reductions in greenhouse gas emissions could result in
increased energy, transportation and raw material costs.
Scientific examination of, political attention to and rules and regulations on issues surrounding the existence and extent of climate
change may result in an increase in the cost of production due to increase in the prices of energy and introduction of energy or carbon
tax. Various regulatory developments have been introduced that focus on restricting or managing emissions of carbon dioxide, methane
and other greenhouse gases. Enterprises may need to purchase at higher costs emission credits, new equipment or raw materials with
lower carbon footprints. These developments and further legislation that is likely to be enacted could affect our operations negatively.
Changes in environmental regulations, such those on the use of perfluorinated compounds, could increase our production costs, which
could adversely affect our results of operation and financial condition.
In addition, more frequent droughts and floods, extreme weather conditions and rising sea levels could occur due to climate
change. The impact of such changes could be significant as most of our factories are located in islands including Taiwan, Singapore and
Xiamen in Fujian Province in China. For example, transportation suspension caused by extreme weather conditions could harm the
distribution of our products. Similarly, our operations depend upon adequate supplies of water, and extended or serious droughts may
affect our ability to obtain adequate supplies of water and threaten our production. We cannot predict the economic impact, if any, of
disasters or climate change.
16

Disruptions in the international trading environment may seriously decrease our international sales.
A substantial portion of our net operating revenues is derived from sales to customers located in countries other than the countries
where our fabs are located. In 2015, 2016 and 2017, we operated fabs in Taiwan, Singapore and China. For the years ended
December 31, 2015, 2016 and 2017, we generated approximately 47.5%, 41.2% and 33.9% of our net operating revenues, respectively,
from countries other than those where our fabs are located. We expect sales to customers from countries outside of Taiwan, Singapore
and China will continue to represent a significant portion of our net operating revenues. The success and profitability of our
international activities depend on certain factors beyond our control, such as general economic conditions, labor conditions, political
stability, tax laws, import duties and foreign exchange controls of the countries in which we sell our products, and the political and
economic relationships between these countries. As a result, our manufacturing services will continue to be vulnerable to disruptions in
the international trading environment, including adverse changes in foreign government regulations, political unrest and international
economic downturns.
These disruptions in the international trading environment affect the demand for our manufacturing services and change the terms
upon which we provide our manufacturing services overseas, which could seriously decrease our international sales.
Political, Economic and Regulatory Risks
We face substantial political risks associated with doing business in Taiwan, particularly due to the tense relationship between the
R.O.C. and the People’s Republic of China, or the PRC, that could negatively affect the value of your investment.
Our principal executive offices and most of our assets and operations are located in Taiwan. Accordingly, our business, financial
condition and results of operations and the market price of our common shares and the ADSs may be affected by changes in R.O.C.
governmental policies, taxation, inflation or interest rates and by social instability and diplomatic and social developments in or
affecting Taiwan which are outside of our control. Taiwan has a unique international political status. Since 1949, Taiwan and the
Chinese mainland have been separately governed. The PRC claims that it is the sole government in China and that Taiwan is part of
China. Although significant economic and cultural relations have been established between the R.O.C. and the PRC in the past few
years, such as the adoption of the Economic Cooperation Framework Agreement and memorandum regarding cross-strait financial
supervision, we cannot assure you that relations between the R.O.C. and PRC will not become strained again. For example, the PRC
government has refused to renounce the use of military force to gain control over Taiwan and, in March 2005, passed an Anti-Secession
Law that authorized non-peaceful means and other necessary measures should Taiwan move to gain independence from the PRC. Past
developments in relations between the R.O.C. and the PRC have on occasions depressed the market prices of the securities of
companies in the R.O.C. Such initiatives and actions are commonly viewed as having a detrimental effect to reunification efforts
between the R.O.C. and the PRC. Relations between the R.O.C. and the PRC and other factors affecting military, political or economic
conditions in Taiwan could materially and adversely affect our financial condition and results of operations, as well as the market price
and the liquidity of our securities.
Our business depends on the support of the R.O.C. government, and a decrease in this support may decrease our net income.
We, like many R.O.C. technology companies, have benefited from substantial tax incentives provided by the R.O.C. government.
Among the incentives broadly enjoyed by R.O.C. technology companies, various tax benefits granted under Chapter 2 and Article 70-1
of the Statute for Upgrading Industries expired on December 31, 2009. Despite the fact that we can still enjoy the tax holidays for the
relevant investment plans approved by the R.O.C. tax authority until 2020 under the grandfather clause of the Statute for Upgrading
Industries, if more incentives are curtailed or eliminated, our net income may decrease significantly.
17

Our future tax obligations may adversely affect our net income.
We operate in various jurisdictions, which involve different tax regimes and application of tax regulations. Applicable taxes for
which we make provisions could increase significantly as a result of changes in applicable tax laws in the countries where we operate.
On February 7, 2018, the amendments to the Income Tax Act of the R.O.C. were promulgated with retrospective effect from January 1,
2018. According to the amendments, the corporate income tax rate is raised from 17% to 20%, and 10% undistributed earnings tax is
lowered to 5%. The change of corporate income tax rate could increase our future tax obligation and have an adverse effect on our net
income.
Compliance with laws such as the U.S. Conflict Minerals Law may affect our ability or the ability of our suppliers to purchase raw
materials at an effective cost.
Many industries rely on materials which are subject to regulations concerning certain minerals sourced from the Democratic
Republic of Congo, or the DRC, or adjoining countries, including: Sudan; Uganda; Rwanda; Burundi; United Republic of Tanzania;
Zambia; Angola; Congo; and Central African Republic. These minerals are commonly referred to as conflict minerals. Conflict
minerals which may be used in our industry or by our suppliers include Columbite-tantalite (derivative of tantalum [Ta]), Cassiterite
(derivative of tin [Sn]), gold [Au], Wolframite (derivative of tungsten [W]), and Cobalt [Co]. Under present U.S. regulations, we and
our customers are required to survey and disclose whether our processes or products use or rely on conflict materials. On August 22,
2012, the U.S. SEC adopted the final rule for disclosing the use of conflict minerals that require companies similar to us to make a
report in a type and format similar to Form SD to disclose the use of conflict materials on an annual basis on or prior to May 31 each
year. We have filed the conflict mineral disclosure report every year since 2014. In order to comply with the aforementioned rules and
regulations promulgated by the U.S. SEC, we will continue to verify the relevant information with our vendors and file the required
report. Although we expect that we and our vendors will be able to comply with the requirements of the U.S. Conflict Minerals law and
any new related regulations promulgated by the U.S. SEC, we cannot assure you that we will be able to gather all the information
required to comply with such regulations. While we believe our suppliers do not rely on such conflict materials, we cannot assure you
that we will continue to be able to obtain adequate supplies of materials needed in our production from supply chains outside the DRC
and adjoining countries. The failure to obtain necessary information or to maintain adequate supplies of materials from supply chains
outside the DRC and adjoining countries may delay our production, increasing the risk of losing customers and business.
Similarly, many jurisdictions have promulgated regulations with the intention to deter disregard and contempt for human rights
within supply chains. Although our own operations comply with the relevant requirements under the laws of the jurisdictions where we
have operations, possible violation by our suppliers may not be known to us and beyond our control. While we believe our suppliers
comply with applicable human rights requirements, there can be no guarantee that they will continue to do so, or that we will be able to
obtain the necessary information on their activities to comply with whatever future requirements may be enacted.
Data security and data privacy considerations and regulations may adversely affect our operations.
Our operations depend upon reliable and uninterrupted information technology services, including the integrity of our web-based
and electronic customer service systems. Although we have put in place what we believe are reasonable precautions to prevent
accidental and/or malicious disruption of these services, there can be no assurance that our preventive measures will preclude failure of
the information technology, web-based and electronic customer service systems upon which our business depends. Disruption of these
systems could adversely affect our ability to manufacture and to serve our customers.
In addition, in the course of our operations, we receive confidential information from and about our customers, vendors, partners
and employees. Although we take what we believe are reasonable precautions to protect such information from disclosure to or
interruption, there are no guarantees our precautions will prevent accidental or malicious access to such information. In the event of
such access, our reputation could be adversely affected, customers and others may hesitate to entrust us with their confidential
information, which would negatively affect our operations, and we would incur costs to remedy the breach.
18

Moreover, many jurisdictions have proposed regulations concerning data privacy. Although we have taken measures to comply
with existing law and regulations in this regard, future laws may impose requirements that make our operations more expensive and/or
less efficient. In addition, should we experience a breakdown in our systems or failure in our precautions that results in a violation of
such regulations, we may suffer adverse customer reaction and face governmental penalties.
Risks Related to the Common Shares and ADSs and Our Trading Markets
Restrictions on the ability to deposit common shares into our ADS program may adversely affect the liquidity and price of the ADSs.
The ability to deposit common shares into our ADS program is restricted by R.O.C. law. Under current R.O.C. law, no person or
entity, including you and us, may deposit common shares into our ADS program without specific approval of the R.O.C. FSC except
for the deposit of the common shares into our ADS program and for the issuance of additional ADSs in connection with:
(A) distribution of share dividends or free distribution of our common shares;
(B) exercise of the preemptive rights of ADS holders applicable to the common shares evidenced by ADSs in the event of capital
increases for cash; or
(C) delivery of our common shares which are purchased in the domestic market in Taiwan directly by the investor or through the
depositary or are already in the possession of the investor to the custodian for deposit into our ADS program, subject to the
following conditions: (a) the re-issuance is permitted under the deposit agreement and custody agreement, (b) the depositary
may accept deposit of those common shares and issue the corresponding number of ADSs with regard to such deposit only if
the total number of ADSs outstanding after the issuance does not exceed the number of ADSs previously approved by the
R.O.C. FSC, plus any ADSs issued pursuant to the events described in (A) and (B) above and (c) this deposit may only be
made to the extent previously issued ADSs have been withdrawn.
As a result of the limited ability to deposit common shares into our ADS program, the prevailing market price of our ADSs on the
NYSE may differ from the prevailing market price of the equivalent number of our common shares on the Taiwan Stock Exchange.
Holders of our ADSs will not have the same proposal or voting rights as the holders of our common shares, which may affect the
value of your investment.
Except for treasury common shares and common shares held by our subsidiaries which meet certain criteria provided under the
R.O.C. Company Act, each common share is generally entitled to one vote and no voting discount will be applied. However, except as
described in this annual report and in the deposit agreement, holders of our ADSs will not be able to exercise voting rights attached to
the common shares evidenced by our ADSs on an individual basis. Holders of our ADSs will appoint the depositary or its nominee as
their representative to exercise the voting rights attached to the common shares represented by the ADSs. The voting rights attached to
the common shares evidenced by our ADSs must be exercised as to all matters brought to a vote of stockholders collectively in the
same manner.
Moreover, holders of the ADSs do not have individual rights to propose any matter for stockholders’ votes at our stockholders’
meetings. However, holders of at least 51% of the ADS outstanding at the relevant record date may request the depositary to submit to
us one proposal per year for consideration at our annual ordinary stockholders’ meeting, provided that such proposal meets certain
submission criteria and limitations, including the language and the length of the proposal, the time of submission, the required
certification or undertakings, and the attendance at the annual ordinary stockholders’ meeting. A qualified proposal so submitted by the
depositary will still be subject to review by our board of directors and there is no assurance that the proposal will be accepted by our
board of directors for inclusion in the agenda of our annual ordinary stockholders’ meeting. Furthermore, if we determine, at our
discretion, that the proposal submitted by the depositary does not qualify, we have no obligation to notify the depositary or to allow the
depositary to modify such proposal.
19

Furthermore, if holders of at least 51% of the ADSs outstanding at the relevant record date instruct the depositary to vote in the
same manner regarding a resolution, including election of directors, the depositary will appoint our Chairman, or his designee, to
represent the ADS holders at the stockholders’ meetings and to vote the common shares represented by the ADSs outstanding in the
manner so instructed. If by the relevant record date the depositary has not received instructions from holders of ADSs holding at least
51% of the ADSs to vote in the same manner for any resolution, then the holders will be deemed to have instructed the depositary to
authorize and appoint our Chairman, or his designee, to vote all the common shares represented by ADSs at his sole discretion, which
may not be in your interest.
The rights of holders of our ADSs to participate in our rights offerings may be limited, which may cause dilution to their holdings.
We may from time to time distribute rights to our stockholders, including rights to acquire our securities. Under the deposit
agreement, the depositary will not offer those rights to ADS holders unless both the rights and the underlying securities to be distributed
to ADS holders are either registered under the Securities Act or exempt from registration under the Securities Act. We are under no
obligation to file a registration statement with respect to any such rights or underlying securities or to endeavor to cause such a
registration statement to be declared effective. Accordingly, holders of our ADSs may be unable to participate in our rights offerings
and may experience dilution in their holdings.
Changes in exchange controls that restrict your ability to convert proceeds received from your ownership of ADSs may have an
adverse effect on the value of your investment.
Your ability to convert proceeds received from your ownership of ADSs depends on existing and future exchange control
regulations of the Republic of China. Under the current laws of the Republic of China, an ADS holder or the depositary, without
obtaining further approvals from the R.O.C. Central Bank of China, or the CBC, or any other governmental authority or agency of the
Republic of China, may convert NT dollars into other currencies, including U.S. dollars, in respect of:
• the proceeds of the sale of common shares represented by ADSs or received as share dividends with respect to the common
shares and deposited into the depositary receipt facility; and
• any cash dividends or distributions received from the common shares represented by ADSs.
In addition, the depositary may also convert into NT dollars incoming payments for purchases of common shares for deposit in the
depositary receipt facility against the creation of additional ADSs. If you withdraw the common shares underlying your ADSs and
become a holder of our common shares, you may convert into NT dollars subscription payments for rights offerings. The depositary
may be required to obtain foreign exchange approval from the CBC on a payment-by-payment basis for conversion from NT dollars
into foreign currencies of the proceeds from the sale of subscription rights of new common shares. Although it is expected that the CBC
will grant approval as a routine matter, required approvals may not be obtained in a timely manner, or at all.
Under the Republic of China Foreign Exchange Control Law, the Executive Yuan of the Republic of China may, without prior
notice but subject to subsequent legislative approval, impose foreign exchange controls or other restrictions in the event of, among other
things, a material change in international economic conditions.
Our public stockholders may have more difficulty protecting their interests than they would as stockholders of a U.S. corporation.
Our corporate affairs are governed by our articles of incorporation and bylaws governing R.O.C. corporations. The rights of our
stockholders to bring stockholders’ suits against us or our board of directors under R.O.C. law are much more limited than those of the
stockholders of U.S. corporations. Therefore, our public stockholders may have more difficulty protecting their interests in connection
with actions taken by our management, members of our board of directors or controlling stockholders than they would as stockholders
of a U.S. corporation. Please refer to “Item 10. Additional Information—B. Memorandum and Articles of Association—Rights to Bring
Stockholders’ Suits” included elsewhere in this annual report for a detailed discussion of the rights of our stockholders to bring legal
actions against us or our directors under R.O.C. law.
20

Holders of our ADSs will be required to appoint several local agents in Taiwan if they withdraw common shares from our ADS
program and become our stockholders, which may make ownership burdensome.
Non-R.O.C. persons wishing to withdraw common shares represented by their ADSs from our ADS program and hold our
common shares represented by those ADSs are required to, among other things, appoint a local agent or representative with
qualifications set forth by the applicable R.O.C. laws and regulations to open a securities trading account with a local brokerage firm,
pay R.O.C. taxes, remit funds and exercise stockholders’ rights. In addition, the withdrawing holders are also required to appoint a
custodian bank or a securities firm with qualifications set forth by the R.O.C. FSC to hold the securities in safekeeping, make
confirmations, settle trades and report all relevant information, in which the securities firm is appointed as the custodian, the payments
shall be held in safekeeping in a special account opened in a bank approved by the R.O.C. FSC. Without making this appointment and
opening of the accounts, the withdrawing holders would not be able to subsequently sell our common shares withdrawn from a
depositary receipt facility on the Taiwan Stock Exchange. Under R.O.C. law and regulations, except under limited circumstances, PRC
persons are not permitted to withdraw the common shares underlying the ADSs or to register as a stockholder of our company. Under
the Regulations Governing Securities Investment and Futures Trading in Taiwan by Mainland Area Investors promulgated by the
R.O.C. Executive Yuan on April 30, 2009, as amended, only qualified domestic institutional investors, or QDIIs and limited entities or
individuals, are permitted to withdraw the common shares underlying the ADSs, subject to compliance with the withdrawal relevant
requirements, and only QDIIs, and limited entities or individuals who meet the qualification requirements set forth therein are permitted
to own common shares of an R.O.C. company listed for trading on the Taiwan Stock Exchange or the Taipei Exchange, provided that
among other restrictions generally applicable to investments made by PRC persons, their shareholdings are subject to certain restrictions
as set forth in the abovementioned regulations and that such mainland area investors shall apply for a separate approval if their
investment, individually or in aggregate, amounts to or exceeds 10 percent of the common shares of any R.O.C. listed company.
You may not be able to enforce a judgment of a foreign court in the R.O.C.
We are a company limited by shares incorporated under the R.O.C. Company Act. Most of our assets and most of our directors,
executive officers and experts named in the registration statement are located in Taiwan. As a result, it may be difficult for you to
enforce judgments obtained outside Taiwan upon us or such persons in Taiwan. We have been advised by our R.O.C. counsel that any
judgment obtained against us in any court outside the R.O.C. arising out of or relating to the ADSs will not be enforced by R.O.C.
courts if any of the following situations shall apply to such final judgment:
• the court rendering the judgment does not have jurisdiction over the subject matter according to R.O.C. law;
• the judgment or the court procedure resulting in the judgment is contrary to the public order or good morals of the R.O.C.;
• the judgment was rendered by default, except where the summons or order necessary for the commencement of the action
was legally served on us within the jurisdiction of the court rendering the judgment within a reasonable period of time or
with judicial assistance of the R.O.C.; or
• judgments of the R.O.C. courts are not recognized in the jurisdiction of the court rendering the judgment on a reciprocal
basis.
21

We may be considered a passive foreign investment company, which could result in adverse U.S. federal income tax consequences
for U.S. investors.
We do not believe that we were a passive foreign investment company, or PFIC, for 2017 and we do not expect to become one in
the future, although there can be no assurance in this regard. Characterization as a PFIC could result in adverse U.S. federal income tax
consequences to you if you are a U.S. investor.
For example, if we are a PFIC, our U.S. investors may become subject to increased tax liabilities under U.S. federal income tax
laws and regulations and will become subject to burdensome reporting requirements. The determination of whether or not we are a
PFIC is made on an annual basis and will depend on the composition of our income and assets from time to time. Specifically, for any
taxable year we will be classified as a PFIC for U.S. federal income tax purposes if either (i) 75% or more of our gross income in a
taxable year is passive income or (ii) the average percentage of our assets (which includes cash) by value in a taxable year which
produce or are held for the production of passive income is at least 50%. The calculation of the value of our assets will be based, in part,
on the quarterly market value of common shares and ADSs, which is subject to change. See “Taxation— U.S. Federal Income Tax
Considerations For U.S. Persons—Passive Foreign Investment Company.”
The trading price of the common shares and ADSs may be adversely affected by the general activities of the Taiwan Stock Exchange
and U.S. stock exchanges, the trading price of our common shares, increases in interest rates and the economic performance of
Taiwan.
Our common shares are listed on the Taiwan Stock Exchange. The trading price of our ADSs may be affected by the trading price
of our common shares on the Taiwan Stock Exchange and the economic performance of Taiwan. The Taiwan Stock Exchange is
smaller and, as a market, more volatile than the securities markets in the United States and some European countries. The Taiwan Stock
Exchange has experienced substantial fluctuations in the prices and volumes of sales of listed securities, and there are currently limits
on the range of daily price movements on the Taiwan Stock Exchange. The Taiwan Stock Exchange is particularly volatile during times
of political instability, such as when the relationship between Taiwan and the PRC becomes tense. Moreover, the Taiwan Stock
Exchange has experienced disturbance caused by market manipulation, insider trading and payment defaults, and the government of
Taiwan has from time to time intervened in the stock market by purchasing stocks listed on the Taiwan Stock Exchange. The recurrence
of these or similar events could deteriorate the price and liquidity of our common shares and ADSs.
The market price of the ADSs may also be affected by general trading activities on the U.S. stock exchanges, which recently have
experienced significant volatility with respect to trading prices of technology companies. Fluctuation in interest rates and other general
economic conditions may also influence the market price of the ADSs.
ITEM 4. INFORMATION ON THE COMPANY
A. History and Development of the Company
Our legal and commercial name is United Microelectronics Corporation, commonly known as “UMC”. We were incorporated
under the R.O.C. Company Law as a company limited by shares in May 1980 and our common shares were listed on the Taiwan Stock
Exchange in 1985. Our principal executive office is located at No. 3 Li-Hsin Road II, Hsinchu Science Park, Hsinchu, Taiwan, Republic
of China, and our telephone number is 886-3-578-2258. Our Internet website address is www.umc.com. The information on our website
does not form part of this annual report. Our ADSs have been listed on the NYSE under the symbol “UMC” since September 19, 2000.
We are one of the world’s largest independent semiconductor foundries and a leader in semiconductor manufacturing process
technologies. Our primary business is the manufacture, or “fabrication”, of semiconductors, sometimes called “chips” or “integrated
circuits”, for others. Using our own proprietary processes and techniques, we make chips to the design specifications of our many
customers. Our company maintains a diversified customer base across industries, including communication devices, consumer
electronics, computer, and others, while continuing to focus on manufacturing for high growth, large volume applications, including
networking, telecommunications, internet, multimedia, PCs and graphics. We sell and market mainly wafers which in turn are used in a
number of different applications by our customers. Percentages of our gross wafer sales derived from our products used in
communication devices, consumer electronics, computer and other applications were 48.6%, 29.4%, 13.1% and 8.9%, respectively, in
2017.
22

We focus on the development of leading mass-producible manufacturing process technologies. We were among the first in the
foundry industry to go into commercial operation with such advanced capabilities as producing integrated circuits with line widths of
0.25, 0.18, 0.15, 0.13 micron and 90, 65/55, 45/40, 28, 14 nanometer and beyond. Advanced technologies have enabled electronic
products, especially in relation to communication, consumer and computer products, to integrate their functions in new and innovative
methods. Networking capabilities have allowed electronic products such as computers, tablets, cell phones, televisions, set-top boxes
and wearable devices to communicate with each other to exchange information. More powerful semiconductors are required to drive
multimedia functions (e.g., processing visual data) and to resolve network bandwidth issues. At the same time, the trend towards
portable personal electronic devices has resulted in products that are becoming physically smaller and consume less power. Process
technology must also shrink the volumes of products aggressively to cater to this trend of integrating multiple functions, reducing the
size of components needed for operation and lowering IC power consumption. Dedicated semiconductor foundries need to achieve this
process improvement and at the same time develop multiple process technologies to satisfy the varying needs of communication,
consumer and computer products. We believe our superior process technologies will enable us to continue to offer our customers
significant performance benefits for their products, faster time-to-market production, cost savings and other competitive advantages.
We provide high quality service based on our performance. In today’s marketplace, we believe it is important to make available
not only the most manufacturable processes, but also the best solutions to enable customers to design integrated circuits that include
entire systems on a chip. Through these efforts, we intend to be the foundry solution for SoC customer needs. To achieve this goal, we
believe it is necessary to timely develop and offer the intellectual property and design support that customers need to ensure their
specific design blocks work with the other design blocks of the integrated circuit system in the manner intended. Accordingly, we have
a dedicated intellectual property and design support team which focuses on timely development of the intellectual property and process
specific design blocks our customers need in order to develop products that operate and perform as intended. Our design service team
actively cooperates with our customers and vendors of cell libraries and intellectual property offerings to identify, early in the
product/market cycle, the offerings needed to ensure that these coordinated offerings are available to our customers in silicon verified
form in a streamlined and easy-to-use manner. As a result, we are able to ensure the timely delivery of service offerings from the
earliest time in the customer design cycle, resulting in a shorter time-to-volume production. We also provide our customers with real-
time online access to their confidential production data, resulting in superior communication and efficiency. We further address our
customers’ needs using our advanced technology and proven methodology to achieve fast cycle time, high yield, production flexibility
and close customer communication. For example, we select and configure our clean rooms and equipment and develop our processes to
maximize the flexibility in meeting and adapting to rapidly changing customer and industry needs. As a result, our cycle time, or the
period from customer order to wafer delivery, and our responsiveness to customer request changes are among the fastest in the
dedicated foundry industry. We also provide high quality service and engineering infrastructure.
Our production capacity is comparable to that of certain largest companies in the semiconductor industry, and we believe our
leading edge and high volume capability is a major competitive advantage.
Our technology and service have attracted two principal types of foundry industry customers: fabless design companies and
integrated device manufacturers. Fabless design companies design, develop and distribute proprietary semiconductor products but do
not maintain internal manufacturing capacity. Instead, these companies depend on outside manufacturing sources. Integrated device
manufacturers, in contrast, traditionally have integrated internally all functions—manufacturing as well as design, development, sales
and distribution.
Our primary customers, in terms of our sales revenues, include premier integrated device manufacturers, such as Texas
Instruments and Intel Mobile, plus leading fabless design companies, such as Broadcom, MediaTek, Realtek, Qualcomm and Novatek.
In 2017, our company’s top ten customers accounted for 54.8% of our net operating revenues. We believe our success in attracting these
customers is a direct result of our commitment to high quality service and our intense focus on customer needs and performance.
23

In addition to our semiconductor foundry business, we also established UMC New Business Investment Corporation to focus on
investments in the solar energy and LED industries.
On August 29, 2014, we and Fujitsu Semiconductor Limited, or Fujitsu, announced an agreement where we invested ¥5 billion as
an initial investment and received approximately 9.3% of the issued and outstanding share capital to became a minority shareholder of a
newly formed subsidiary of Fujitsu named Mie Fujitsu Semiconductor Limited, or MIFS, which will operate a 300mm wafer
manufacturing facility located in Kuwana, Mie, Japan. On December 16, 2015, our board has further approved the acquisition of
additional newly issued shares of MIFS with an aggregate investment amount of NT$1.36 billion, which increased our ownership
interest in MIFS to approximately 15.9%. Through this relationship with us, MIFS plans to expand its business globally as a pure-play
foundry company by strengthening its production and development capacity in a cost competitive manner.
On October 9, 2014, our board of directors approved an agreement with the Xiamen Municipal People’s Government and Fujian
Electronics & Information Group to found a new company named United Semiconductor (Xiamen) Co., Ltd., or USC, based in Xiamen,
Fujian Province, China that will focus on 12-inch wafer foundry services. We anticipate that we may invest up to US$1.35 billion in
USC over the next five years, with our investment starting in 2015 that will be deployed in installments based on the progress of this
company. USC will manufacture 12-inch wafers and initially offer 40 nanometer and 55 nanometer process technologies. Our
participation in USC has complied and will continue to comply with R.O.C. rules and regulations and will continue to be subject to the
review and approval by the relevant R.O.C. authorities. We have obtained the initial investment approval from the R.O.C. government
on December 31, 2014 with US$300 million invested by Hejian and US$450 million by UMC. The initial groundbreaking event of
USC took place in March 2015 and the grand opening ceremony took place in November 2016. We have further obtained investment
approval from the R.O.C. government in November 2017 in connection with NT$600 million for capital injection into USC. USC had
successfully realized commercial mass production by the end of 2016 and it has carried out production on both 40nm and 28nm
technology nodes in 2017. USC has continued to increase its capacity to fulfill requirements from worldwide customers, including those
from domestic fabless companies in China. We expect to continue to expand our worldwide foundry presence by tapping into the high
growth semiconductor market in China, and to increase our exposure to the semiconductor supply chain in China while mitigating
geographical risks, which allows us to be closer to our customers in China, which, in turn, enables us to provide better services,
increases our manufacturing scale and stimulates revenue growth.
On December 24, 2014, we transferred our 6-inch fabrication plant, or Fab 6A, including machinery equipment and building
facilities to our subsidiary, Wavetek Microelectronics Corporation, or Wavetek, in order to further satisfy customer needs in the fast
growing GaAs market and to improve the 6-inch fabrication operational efficiency among our group by fully utilizing the existing
assets and resources. In April 2015, Wavetek had successfully entered into the silicon-based CMOS foundry business after it had fully
acquired our 6-inch Fab 6A fixed assets and production lines. As of March 31, 2018, our shareholdings in Wavetek was approximately
78.47%, making us its largest shareholder.
On December 26, 2014, our subsidiary, Topcell Solar International Co., Ltd., or Topcell, announced its plans to merge with
Motech Industries, Inc., or Motech, through a share exchange transaction. The share exchange conversion was six ordinary shares of
Topcell into one newly-issued ordinary share of Motech. The merger was completed in June 2015 and Motech became the surviving
company while Topcell Solar was absorbed.
Subsequent to December 31, 2017, we acquired the remaining equity interest in Best Elite International Limited, a British Virgin
Islands corporation, or Best Elite. As of March 31, 2018, our cumulative ownership in Best Elite was 100%.
Please refer to “Item 5. Operating and Financial Review and Prospects-B. Liquidity and Capital Resources” for a discussion of our
capital expenditures in the past three years and the plan for the current year.
In addition, on April 25, 2018, to further integrate the resources pursuant to our groupwise investment strategy, the board of us and
our subsidiaries, Fortune Venture Capital Corp. or FORTUNE, and UMC New Business Investment Corp., or NBI, resolved an
organizational restructure plan, under which NBI will be merged into FORTUNE. FORTUNE will be the surviving company and
assume all the assets and liabilities from NBI when the merger became effective.
24

Our Strategy
To maintain and enhance our position as a market leader, we have adopted a business strategy with a focus on a partnership
business model designed to accommodate our customers’ business needs and objectives and to promote their interests as our partners.
We believe that our success and profitability are inseparable from the success of our customers. The goal in this business model is to
create a network of partnerships or alliances among integrated device manufacturers, intellectual property and design houses, as well as
foundry companies. We believe that we and our partners will benefit from the synergy generated through such long-term partnerships or
alliances and the added value to be shared among the partners. The key elements of our strategy are:
Operate as a Customer-Driven Foundry. We plan to operate as a customer-driven foundry. The increasing complexity of 40
nanometer, 28 nanometer, and more advanced technologies has impacted the entire chip industry, as ICs can now be designed with
greater gate density and higher performance while incorporating the functions of an entire system. These advanced designs have created
a new proliferating market of advanced digital devices such as smart phones, which have decreased in size but greatly increased in
functionality. We collaborate closely with our customers as well as partners throughout the entire supply chain, including equipment,
electronic design automation tool and intellectual property vendors to work synergistically toward each customer’s SoC solution. We
also possess experience and know-how in system design and architecture to integrate customer designs with advanced process
technologies and intellectual property. We believe the result is a higher rate of first-pass silicon success for our SoC solutions. Our
customer-driven foundry solutions begin with a common logic-based platform, where designers can choose the process technologies
and transistor options that best fit their specific application. From there, technologies such as radio frequency complementary metal-
oxide-semiconductor, or RF CMOS, and embedded Flash memories can be used to further fine-tune the process for customers’
individual needs. Furthermore, as intellectual property has become critical resources for SoCs, our portfolio includes basic design
building blocks as well as more complex intellectual property of optimized portability and cost, developed both internally and by third-
party partners. With advanced technology, a broad intellectual property portfolio, system knowledge and advanced 300-millimeter
manufacturing, we offer comprehensive solutions that help customers deliver successful results in a timely fashion.
Build up Customer-focused Partnership Business Model. We have focused on building partnership relationships with our
customers, and we strive to help our customers achieve their objectives through close cooperation. Unlike the traditional buy-and-sell
relationship between a foundry and its customers, we believe our partnership business model will help us understand our customers’
requirements and, accordingly, better accommodate our customers’ needs in a number of ways, such as customized processes and
services that optimize the entire value chain (not just the foundry portion) and intellectual property-related support. We believe that this
business model will enable us to deliver our products to our customers at the earliest time our customers require for their design cycle,
resulting in shorter time-to-market and time-to-volume production. Furthermore, we believe we will render more cost-effective services
by focusing our research and development expenditures on the specific requirements of our customers. We believe our partnership
business model will help us not only survive a market downturn, but also achieve a better competitive position.
Continue to Focus on High Growth Applications and Customers and Actively Explore New Market Opportunities. We believe
one measure of a successful foundry company is the quality of its customers. We focus our sales and marketing on customers who are
established or emerging leaders in industries with high growth potential. Our customers include industry leaders such as Broadcom,
MediaTek, Realtek, Texas Instruments and Qualcomm. We seek to maintain and expand our relationships with these companies. We
strive to demonstrate to these customers the superiority and flexibility of our manufacturing, technology and service capabilities and to
provide them with production and design assistance. We are also making efforts to further diversify our customer portfolio in order to
maintain a balanced exposure to different applications and different customers. We believe these efforts strengthen our relationships
with our customers and enhance our reputation in the semiconductor industry as a leading foundry service provider.
In addition to customer diversification, we have also been actively exploring new market opportunities in consumer electronics
such as Internet of Things.
25

Maintain Our Leading Position in Mass-Producible Semiconductor Technology and Selectively Pursue Strategic Investments
in New Technologies. We believe that maintaining and enhancing our leadership in mass-producible semiconductor manufacturing
technology is critical to attract and retain customers. Our reputation for technological excellence has attracted both established and
emerging leaders in the semiconductor industries who work closely with us on technology development. In addition, we believe our
superior processing expertise has enabled us to provide flexible production schedules to meet our customers’ particular needs. We plan
to continue enhancing capital expenditures in research and development and building internal research and development expertise, to
focus on process development and to establish alliances with leading and specialty semiconductor companies to accelerate access to
next-generation and specialized technologies. For example, with our continuous technology development efforts and capital investment,
in 2016, revenue derived from 28-nanometer technology had significantly increased from 2015. We believe our progress in developing
more advanced process technologies has benefited our customers in the fields of computers, communications, consumer electronics and
others with special preferences in certain aspects of the products, such as the ultimate performance, density and power consumption.
Moreover, we expect to strengthen our leading position and increase our market share by licensing our technologies to several
corporate partners. For example, in 2014, we licensed to MIFS, which is a pure-play foundry company, our advanced 40 nanometer
technology under a technology transfer and license agreement. We will continue to explore licensing opportunities based on our
comprehensive technology offerings to further drive our revenue. In addition, we also entered into an agreement with the Xiamen
Municipal People’s Government and Fujian Electronics & Information Group in 2014 in connection with the newly established USC
located in Xiamen, Fujian Province, China, which is focusing on the manufacturing of 12-inch wafers with initial offering of 40
nanometer and 55 nanometer process technologies. In April 2017, we entered into a license agreement with USC to provide 28
nanometer process technologies aimed to further strengthen the wafer manufacturing capabilities of our subsidiary company. In
addition, we also recently enhanced our technology platform by collaborating with additional technology parties for the research and
development of specialty technologies. For example, in May 2016, we entered an agreement with Fujian Jin Hua Integrated Circuit Co.,
or Fujian Jinhua, in connection with the development of DRAM related technologies. Such developed technologies are expected to be
jointly owned by both parties and will not be accessible for local chip design companies. We expect the collaboration to thrive on the
strength of Taiwan’s semiconductor manufacturing technologies to fulfill the potential domestic demands for specialty DRAM in
China. We will be in charge of technology development and currently do not intend to enter the DRAM industry or invest in Fujian
Jinhua. We believe that such strategies enable us to take advantage of our established research and development capabilities while
expanding our footprint globally in a cost-effective manner.
We also recognize that every company has limited resources and that the foundry industry is ever-evolving. Accordingly, we
believe we should invest in new research and development technology intelligently and in a cost-effective manner to achieve the
ultimate output of the resulting technology. In doing so, we balance the rate of return of our research and development with the
importance of developing a technology at the right time to enhance our competitive edge without unduly diluting our profitability. We
intend to avoid investments in technologies that do not present a commercial potential for volume production. We believe that to
develop the earliest and most advanced semiconductor technology without regard to its potential for near term volume production may
prove costly to our operations and would not strengthen our competitive position. We perceive a benefit to defer investment in the
premature equipment needed to claim the earliest advanced technology and instead to purchase a more advanced and less expensive
version of equipment from vendors who design such equipment based on pre-production lessons learned from the earliest technology.
Maintain Scale and Capacity Capabilities to Meet Customer Requirements, with a Focus on 12-inch Wafer Facilities for
Future Expansion. We believe that maintaining our foundry capacity with advanced technology and facilities is critical to the
maintenance of our industry leadership. Our production capacity is currently among the largest of all semiconductor foundries in the
world. We intend to increase our 12-inch wafer production capacity to meet the needs of our customers and to fully capitalize on the
expected growth of our industry. We expect our future capacity expansion plans will focus on 12-inch wafer facilities in order to
maintain our technology leadership. 12-inch wafers offer manufacturing advantages over 8-inch wafers due to, among other reasons, the
greater number of chips on each wafer and the advantages only offered on newer 12-inch capable equipment. In addition, 12-inch wafer
facilities present a more cost-effective solution in achieving an economic scale of production. We intend to carefully monitor current
market conditions in order to optimize the timing of our capital spending. We also plan to continue to expand our capacity and
capabilities to meet customer requirements in different markets and expand our global presence by making strategic investments in
other companies. For example, in 2014, we invested in MIFS in Japan with Fujitsu Semiconductor Limited and in USC in China with
the Xiamen Municipal People’s Government and Fujian Electronics & Information Group that will focus on manufacturing
semiconductors using 12-inch wafers. These investments enable us to achieve a greater economy of scale with respect to 300mm wafer
operations for advanced node process technologies. We also licensed our advanced technologies to these invested companies in order to
provide feasible technology solutions to fulfill their needs.
26

B. Business Overview
Manufacturing Facilities
To maintain a leading position in the foundry business, we have placed great emphasis on achieving and maintaining a high
standard of manufacturing quality. As a result, we seek to design and implement manufacturing processes that produce consistent, high
manufacturing yields to enable our customers to estimate, with reasonable certainty, how many wafers they need to order from us. In
addition, we continuously seek to enhance our production capacity and process technology, two important factors that characterize a
foundry’s manufacturing capability. Our large production capacity and advanced process technologies enable us to provide our
customers with volume production and flexible and quick-to-market manufacturing services. All of our fabs operate 24 hours per day,
seven days per week. Substantially all maintenance at each of the fabs is performed concurrently with production.
As a step in our continuing expansion of our manufacturing complex in the Tainan Science Park in southern Taiwan, we
completed the construction of our second 300mm fab in Taiwan in May 2009, and moved the equipment into this fab in July 2010.
The following table sets forth operational data of each of our manufacturing facilities as of December 31, 2017.
Wavetek Fab 8A Fab 8C Fab 8D Fab 8E Fab 8F Fab 8S Fab 8N Fab 12A Fab 12i Fab 12X
Commencement of volume
production 1989 1995 1998 2000 1998 2000 2000 2003 2002 2004 2016
Estimated full capacity (1)(2) 35,300 69,000 30,750 28,700 35,000 36,100 31,100 64,500 83,348 44,507 11,500
wafers
per
month
wafers
per
month
wafers
per
month
wafers
per
month
wafers
per
month
wafers
per
month
wafers
per
month
wafers
per
month
wafers
per
month
wafers
per
month
wafers
per
month
Wafer size 6-inch 8-inch 8-inch 8-inch 8-inch 8-inch 8-inch 8-inch 12-inch 12-inch 12-inch
(150mm) (200mm) (200mm) (200mm) (200mm) (200mm) (200mm) (200mm) (300mm) (300mm) (300mm)
(1) Measured in stated wafer size.
(2) The capacity of a fab is determined based on the capacity ratings given by manufacturers of the equipment used in the fab,
adjusted for, among other factors, actual output during uninterrupted trial runs, expected down time due to set up for production
runs and maintenance and expected product mix.
Our fabs are located in the R.O.C., Singapore, and the PRC. The following table sets forth the size and primary use of our facilities
and whether such facilities, including land and buildings, are owned or leased. The land in the Hsinchu and Tainan Science Parks is
leased from the R.O.C. government. The land in the Pasir Ris is leased from statutory boards of the Singapore government. The land in
the Suzhou Industrial Park and Xiang’an District is leased from the PRC government.
Location
Size
(Land/Building) Primary Use
Land
(Owned or Leased)
Building
(Owned or Leased)
(in square meters)
Fab 8A, 3, 5 Li-Hsin 2nd Rd.,
Hsinchu Science Park,
Hsinchu, Taiwan 30078, R.O.C.
43,130 / 83,699 8-inch wafer
production
Leased (expires in
December 2033)
Owned
Fab 8C, 6 Li-Hsin 3rd Rd.,
Hsinchu Science Park,
Hsinchu, Taiwan 30078, R.O.C.
24,565 / 71,427 8-inch wafer
production
Leased (expires in
December 2033)
Owned
27

Location
Size
(Land/Building) Primary Use
Land
(Owned or Leased)
Building
(Owned or Leased)
(in square meters)
Fab 8D, 8 Li-Hsin 3rd Rd.,
Hsinchu Science Park,
Hsinchu, Taiwan 30078, R.O.C.
9,219 / 29,181 8-inch wafer
production
Leased (expires in
December 2033)
Owned
Fab 8E, 17 Li-Hsin Rd.,
Hsinchu Science Park,
Hsinchu, Taiwan 30078, R.O.C.
35,779 / 76,315 8-inch wafer
production
Leased (expires in
February 2036)
Owned
Fab 8F, 3 Li-Hsin 6th Rd.,
Hsinchu Science Park,
Hsinchu, Taiwan 30078, R.O.C.
23,774 / 65,736 8-inch wafer
production
Leased (expires in
February 2038)
Owned
Fab 8S, 16 Creation 1st Rd.,
Hsinchu Science Park,
Hsinchu, Taiwan 30077, R.O.C.
20,365 / 65,614 8-inch wafer
production
Leased (expires in
December 2023)
Owned
Fab 8N, 333, Xinghua St.,
Suzhou Industrial Park, Suzhou,
Jiangsu Province 215025, PRC
215,621 / 100,908 8-inch wafer
production
Leased (expires in
December 2052)
Owned
Fab 12A, 18, 20 Nan-Ke 2nd Rd.,
Tainan Science Park, Sinshih,
Tainan, Taiwan 74147, R.O.C.
243,250 / 633,710 12-inch wafer
production
Leased (expires in
November 2034)
Owned
Fab 12i, 3 Pasir Ris Drive 12
Singapore 519528
84,836 / 144,980 12-inch wafer
production
Leased (expires in
March 2031)
Owned
Fab 12X, No. 899 Wan Jia Chun Road,
Xiang’an District, Xiamen, PRC
254,698 / 347,447 12-inch wafer
production
Leased (expires in
January 2065)
Owned
United Tower, 3 Li-Hsin 2nd Rd.,
Hsinchu Science Park,
Hsinchu, Taiwan 30078, R.O.C.
8,985 / 85,224 Administration
office
Leased (expires in
December 2033)
Owned
Neihu Rd. office, 8F, 68. Sec. 1,
Neihu Rd., Taipei,
Taiwan 11493, R.O.C.
626 / 4,817 Administration
office
Owned Owned
Testing Building, 1, Chin-Shan, 7th St.,
Hsinchu, Taiwan 30080, R.O.C.
10,762 /41,318 Leased to
several
companies
Owned Owned
R&D Building, 18 Nan-Ke 2nd Rd.,
Tainan Science Park, Sinshih,
Tainan, Taiwan 74147, R.O.C.
42,000 / 47,396 Research and
development
Leased (expires in
December 2023)
Owned
Nexpower, 2, Houke S. Rd.,
Houli District, Taichung,
Taiwan 42152, R.O.C.
57,556 / 82,699 Solar PV
modules
production
Leased (expires in
December 2026)
Owned
Unistars, 1F, 669, Sec. 4,
Zhongxing Rd., Zhudong Township,
Hsinchu, Taiwan 31061, R.O.C.
- / 1,955 High-power
LED package
and Led
lighting
N/A Leased (expires in
October 2018)
Wavetek, 10, Chuangxin 1st Rd.,
Baoshan Township,
Hsinchu, Taiwan 30076, R.O.C.
27,898 / 34,609 6-inch wafer
production
Leased (expires in
August 2035)
Owned
28

Process Technology
Process technology is a set of specifications and parameters that we implement for manufacturing the critical dimensions of the
patterned features of the circuitry of semiconductors. Our process technologies are currently among the most advanced in the foundry
industry. These advanced technologies have enabled us to provide flexible production schedules to meet our customers’ particular
needs.
We pioneered the production of numerous semiconductor products. Our continued enhancement of our process technologies has
enabled us to manufacture semiconductor devices with smaller geometries. In 2013, we successfully developed and released into
production 28nm Poly-SiON and High-k/metal gate technologies. In 2015, we provided a High-k/ metal gate with high performance
compact, or HPC, solution and improved to a high performance compact plus, or HPC+, solution by the end of 2017 for speed-intensive
and optimized power consumption products. We also joined International Business Machines Corporation, or IBM chip alliance, for
advanced process development. With IBM’s know-how and support, we aim to continue to improve our internally developed 14nm
FinFET technology, so as to offer a 14nm competitive low-power enhanced technology for mobile computing and communication
products. In March 2017, we commenced the shipment of 14nm wafers to customers and have achieved production quality yields for
the advanced process that is being utilized for consumer electronic applications. UMC’s 14nm FinFET technology features 55% higher
speed and twice the gate density over 28nm process technology. The 14nm process also consumes approximately 50% less power than
for 28nm.
We have also successfully developed specialty technologies such as 55/40/28nm embedded memory used for MCU and
automotive products, 55/40/28nm embedded high voltage device used for display drivers, 55nm BSI-CSI for image sensors and
110/55nm BCD for power management circuits. All of these specialty technologies can provide system on chip solutions.
The table below sets forth our actual process technology range, categorized by line widths, or the minimum physical dimensions
of the transistor gate of integrated circuits in production by each fab, in 2017, and the estimated annual full capacity of each fab, actual
total annual output and capacity utilization rates in 2015, 2016 and 2017:
Year Ended
December 31,
2017 Range of Years Ended December 31,
Years of Process 2015 2016 2017
Commencement
of Operation
Technologies
(in microns)
(in thousands of 8-inch wafer
equivalents, except percentages)
Wavetek 1989 0.5 237 238 237
Fab 8A 1995 0.5 to 0.25 813 827 825
Fab 8C 1998 0.35 to 0.11 347 348 357
Fab 8D 2000 0.13 to 0.09 341 342 341
Fab 8E 1998 0.5 to 0.18 418 419 418
Fab 8F 2000 0.18 to 0.11 388 401 417
Fab 8S 2000 0.18 to 0.11 335 336 347
Fab 8N 2003 0.5 to 0.11 667 750 753
Fab 12A 2002 0.13 to 0.014 1,784 1,990 2,182
Fab 12i 2004 0.13 to 0.040 1,287 1,313 1,209
Fab 12X 2016 0.040 to 0.028 — 19 218
Total estimated capacity — — 6,617 6,983 7,304
Total output (actual) — — 5,940 6,190 6,896
Average capacity utilization — — 89.8% 88.6% 94.4%
The table below sets forth a breakdown of number and percentage of wafer output by process technologies in 2015, 2016 and
2017.
29

Years Ended December 31,
2015 2016 2017
(in thousands of 8-inch wafer equivalents, except percentages)
% % %
14 nanometers and under — — 0 0.0 12 0.2
28 nanometers 269 4.5 554 9.0 600 8.7
40 nanometers 968 16.3 1,197 19.3 1,394 20.2
65 nanometers 1,037 17.5 826 13.4 672 9.7
90 nanometers 245 4.1 199 3.2 383 5.5
0.11/0.13 micron 909 15.3 816 13.2 904 13.1
0.15/0.18 micron 888 14.9 1,007 16.2 1,190 17.3
0.25/0.35 micron 1,252 21.1 1,175 19.0 1,300 18.9
0.50 micron or higher 372 6.3 416 6.7 441 6.4
Total 5,940 100.0 6,190 100.0 6,896 100.0
Capacity and Utilization
The fabs in Taiwan that we own directly are named Wavetek, Fab 8A, Fab 8C, Fab 8D, Fab 8E, Fab 8F, Fab 8S and Fab 12A. All
of them are located in the Hsinchu Science Park except for Fab 12A located in the Tainan Science Park. The fab in Singapore is named
Fab 12i. The fabs in China are named Fab 8N and Fab 12X, located in Suzhou and Xiamen, respectively.
Our average capacity utilization rate was 89.8% in 2015, 88.6% in 2016 and 94.4% in 2017.
Equipment
Considering the performance and productivity of our manufacturing capability highly relies on the quality of our capital
equipment, we generally purchase equipment that not only meet the demand of our existing process technology, but also have the
capability to be upgraded to match our future needs. The principal equipment we use to manufacture semiconductor devices are
scanners/steppers, cleaners and track equipment, inspection equipment, etchers, furnaces, wet stations, strippers, implanters, sputters,
CVD equipment, probers, testers and so on. We own all of the production equipment except for a few demonstration tools.
Our policy is to purchase high-quality equipment that demonstrates stable performance from vendors with dominant market share
to ensure our continued competitiveness in the semiconductor field.
Some of the equipment is available from a limited number of qualified vendors and/or is manufactured in relatively limited
quantities, and some equipment has only recently been developed. We believe that our relationships with equipment suppliers are strong
enough that we can leverage our position as a major purchaser to purchase equipment on competitive terms, including shorter lead time,
compared with the terms received by several other foundries.
Although we face the challenge of procuring the right equipment in sufficient quantity necessary for ramp-up or expansion of our
fabrication facilities under constraint of short lead times, we have not in the past experienced any material problems in procuring the
latest generation equipment on a timely basis even in periods of unpredictably high market demand. We manage the risks in the
procurement process through timely internal communications among different divisions, efficient market information collection, early
reservation of appropriate delivery slots and constant communications with our suppliers as well as by utilizing our good relationships
with the vendors.
Raw Materials
Our manufacturing processes use many raw materials, primarily silicon wafers, chemicals, gases and various types of precious
sputtering targets. These raw materials are generally available from several suppliers. Our policy with respect to raw material purchases,
similar to that for equipment purchases, is to select only a small number of qualified vendors who have demonstrated quality and
reliability on delivery time of the raw materials. We may have any long-term supply contracts with our vendors if necessary.
30

Our general inventory policy is to maintain sufficient stock of each principal raw material for production and rolling forecasts of
near-term requirements received from customers. In addition, we have agreements with several key material suppliers under which they
hold similar levels of inventory in their warehouses for our use. However, we are not under any obligation to purchase raw material
inventory that is held by our vendors for our benefit until we actually order it. We typically work with our vendors to plan our raw
material requirements on a monthly basis, with indicative pricing generally set on a quarterly basis. The actual purchase price is
generally determined based on the prevailing market conditions. In the past, prices of our principal raw materials have not been volatile
to a significant degree. Although we have not experienced any shortage of raw materials that had a material effect on our operations,
and supplies of raw materials we use currently are adequate, shortages could occur in various critical materials due to interruption of
supply or an increase in industry demand.
The most important raw material used in our production processes is silicon wafer, which is the basic raw material from which
integrated circuits are made. The principal makers for our wafers are Shin-Etsu, GlobalWafers, Siltronic and Sumco Group. We have in
the past obtained and believe that we will continue to be able to obtain a sufficient supply of silicon wafers. We believe that we have
close working relationships with our wafer suppliers. Based on such long-term relationships, we believe that these major suppliers will
use their best efforts to accommodate our demand.
We use a large amount of water in our manufacturing process. We obtain water supplies from government-owned entities. We also
use substantial amounts of dual loop electricity supplied by Taiwan Power Company in the manufacturing process. We maintain
back-up generators that are capable of providing adequate amounts of electricity to maintain the required air pressure in our clean rooms
in case of power interruptions. We believe our back-up devices are reasonably adequate in preventing business interruptions caused by
power outages and emergency situations.
Quality Management
We believe that our advanced process technologies and reputation for high quality and reliable services and products have been
important factors in attracting and retaining leading international and domestic semiconductor companies as customers.
We structure our quality management system in accordance with the latest international quality standards and our customers’ strict
quality and reliability requirements. Our quality management system incorporates comprehensive quality control programs into the
entire business flow of foundry operation including, among others, new process development management, production release control,
incoming raw material inspection, statistical process control and methodology development, process change management, technical
documentation control, product final inspection, metrology tool calibration and measurement system analysis, quality audit program,
nonconformity management, customer complaint disposition, eight-discipline problem solving and customer satisfaction monitoring.
We set a high quality goal to ensure consistent high yielding and reliable product performance. Our quality program is continually
enhanced through top-down annual Business Policy Management and bottom-up Total Quality Management activities. In addition, our
efforts to observe best practices among fabs in the foundry industry have also contributed to the improvement of our overall quality
management system.
Many of our customers perform physical production site qualification process in the early development phase and routine quality
conformance audits in the volume production phase. These audits include both quality system review and physical fabrication area
inspection for verification of conformity with the international quality standard and customers’ quality requirement. Our quality
management system and quality control programs have been qualified and routinely audited by numerous customers who are
recognized as world-class semiconductor companies with best-in-class quality standards.
Our Quality Assurance Division and Reliability Technology and Assurance Division collaborate to provide quality and reliability
performance to customers. With our wafer processing quality and reliability conformance monitor program, we monitor the product
quality and reliability at various stages of the entire manufacturing process before shipment to customers.
31

All our fabs are certified in compliance with ISO/TS 16949 and QC080000 IECQ HSPM standards. ISO/TS 16949 sets the criteria
for developing a fundamental quality management system emphasizing on customer satisfaction in quality management, continual
improvement, defect prevention and variation and waste reduction. QC080000 IECQ HSPM sets the criteria for developing a process
management system for hazardous substances and focuses on developing environmentally friendly manufacturing processes. We are
committed to continuously improve our quality management system and to deliver high quality product to our customers.
Services and Products
We primarily engage in wafer fabrication for foundry customers. To optimize fabrication services for our customers, we work
closely with them as they finalize circuit design and contract for the preparation of masks to be used in the manufacturing process. We
also offer our customers turnkey services by providing subcontracted assembly and test services. We believe that this ability to deliver a
variety of foundry services in addition to wafer fabrication enables us to accommodate the needs of a full array of integrated device
manufacturers, system companies and fabless design customers with different in-house capabilities.
Wafer manufacturing requires many distinct and intricate steps. Each step in the manufacturing process must be completed with
precision in order for finished semiconductor devices to work as intended. The processes require taking raw wafers and turning them
into finished semiconductor devices generally through five steps: circuit design, mask tooling, wafer fabrication, assembly and test. The
services we offer to our customers in each of these five steps are described below.
Circuit Design. At this initial design stage, our engineers generally work with our customers to ensure that their designs can be
successfully and cost-effectively manufactured in our facilities. We have assisted an increasing number of our customers in the design
process by providing them with access to our partners’ electronic design analysis tools, intellectual property and design services as well
as by providing them with custom embedded memory macro-cells. In our Silicon Shuttle program, we offer customers and intellectual
property providers early access to actual silicon samples with their desired intellectual property and content in order to enable early and
rapid use of our advanced technologies. The Silicon Shuttle program is a multi-chip test wafer program that allows silicon verification
of intellectual property and design elements. In the Silicon Shuttle program, several different vendors can test their intellectual property
using a single mask set, greatly reducing the cost of silicon verification for us and the participating vendors. The high cost of masks for
advanced processes makes this program attractive to intellectual property vendors. In our alliances with them, we coordinate with
leading suppliers of intellectual property, design and ASIC services to ensure their offerings are available to our customers in an
integrated, easy to use manner which matches customers’ need to our technologies. With a view to lowering customer design barriers,
we expanded our design support functions from conventional design support to adding intellectual property development to
complement third-party intellectual properties and to provide customers with the widest range of silicon-verified choices. Our offerings
range from design libraries to basic analog mixed-mode intellectual properties which, together, have helped shorten our customer’s
design cycle time.
Mask Tooling. Our engineers generally assist our customers to design and/or obtain masks that are optimized for our advanced
process technologies and equipment. Actual mask production is usually provided by independent third parties specializing in mask
tooling.
Wafer Fabrication. As described above, our manufacturing service provides all aspects of the wafer fabrication process by
utilizing a full range of advanced process technologies. During the wafer fabrication process, we perform procedures in which a
photosensitive material is deposited on the wafer and exposed to light through the mask to form transistors and other circuit elements
comprising of a semiconductor. The unwanted material is then etched away, leaving only the desired circuit pattern on the wafer. As
part of our wafer fabrication services, we also offer wafer probing services, which test, or probe, individual die on the processed wafers
and identify dice that fail to meet required standards. We prefer to conduct wafer probing internally to obtain speedier and more
accurate data on manufacturing yield rates.
Assembly and Testing. We offer our customers turnkey services by providing the option to purchase finished semiconductor
products that have been assembled and tested. We outsource assembly and test services to leading assembly and test service providers,
including Siliconware Precision Industries Co., Ltd., or Siliconware, and Advanced Semiconductor Engineering Inc. in Taiwan. After
final testing, the semiconductors are shipped to our customers’ designated locations.
32

In addition to our foundry business, we also engage in the research, development and manufacture of products in the solar energy
and LED industries.
Customers and Markets
Our primary customers, in terms of our sales revenues, include premier integrated device manufacturers, such as Texas
Instruments and Intel Mobile, plus leading fabless design companies, such as Broadcom, MediaTek, Realtek, Qualcomm and Novatek.
Although we are not dependent on any single customer, a significant portion of our net operating revenues has been generated from
sales to a few customers. Our top ten customers accounted for approximately 54.8% of our net operating revenues in 2017. Set forth
below is a geographic breakdown of our operating revenues in 2015, 2016 and 2017 by the location of our customers.
Years Ended December 31,
Region 2015 2016 2017
% % %
Taiwan 31.8 31.4 32.8
Singapore 12.6 18.1 20.6
China (including Hong Kong) 8.1 9.3 12.7
Japan 7.0 3.0 3.2
USA 8.8 9.3 12.2
Europe 23.4 19.8 9.6
Others 8.3 9.1 8.9
Total 100.0 100.0 100.0
We believe our success in attracting these end customers is a direct result of our commitment to high quality service and our
intense focus on customer needs and performance. As an independent semiconductor foundry, most of our operating revenue is
generated by our sales of wafers. For 2017, gross wafer sales represented 96.6% of our net operating revenue. The following table
presented the percentages of our gross wafer sales by types of customers for the years ended December 31, 2015, 2016 and 2017.
Years Ended December 31,
Customer Type 2015 2016 2017
% % %
Fabless design companies 87.8 92.4 91.0
Integrated device manufacturers 12.2 7.6 9.0
Total 100.0 100.0 100.0
We focus on providing a high level of customer service in order to attract customers and maintain their ongoing loyalty. Our
culture emphasizes responsiveness to customer needs with a focus on flexibility, speed and accuracy throughout our manufacturing and
delivery processes. Our customer-oriented approach is especially evident in two types of services: customer design development
services and manufacturing services. For example, in 2013, we expand our regional business by opening our UMC Korea office, in
order to provide local support to our customers in Korea, and shorten time-to-market for our Korea-based customers designing and
manufacturing on UMC process technologies. We believe that our large production capacity and advanced process technology enable us
to provide better customer service than many other foundries through shorter turn-around time, greater manufacturing flexibility and
higher manufacturing yields.
We work closely with our customers throughout the design development and prototyping processes. Our design support team
closely interacts with customers and intellectual property vendors to facilitate the design process and to identify their specific
requirements for intellectual property offerings. We are responsive to our customers’ requirements in terms of overall turn-around time
and production time-to-market by, for example, helping our customers streamline their intellectual property offering processes and
delivering prototypes in a timely and easy-to-use fashion. We also maintain flexibility and efficiency in our technical capability and
respond quickly to our customers’ design changes.
33

For intellectual property offerings, we work with several leading intellectual property vendors from digital, memory and analog
fields in the semiconductor industry to deliver quality intellectual property blocks that have been silicon validated using our advanced
processes. Our alliances with major electronic design automation vendors provide our customers with digital/analog reference design
procedures and easy-to-use design solutions. By continuously enhancing our intellectual property offerings, reference design procedures
and design services through collaboration with major vendors, we aim to provide complete, accurate and user-friendly design solutions
to our customers.
As a design moves into manufacturing production, we continue to provide ongoing customer support through all phases of the
manufacturing process. The local account manager works with our customer service representative to ensure the quality of our services,
drawing upon our marketing and customer engineering support teams as required.
We offer an online service, “MyUMC”, which gives our customers easy access to our foundry services by providing a total online
supply chain solution. MyUMC offers 24-hour access to detailed account information such as manufacturing, engineering and design
support documents through each customer’s own customized start page. The features that are available to customers through MyUMC
include (i) viewing the status of orders from the start of production to the final shipping stages; (ii) designing layouts to shorten
customers’ tape out time; (iii) collecting customer engineering requests; (iv) gathering and downloading documents for design purposes;
and (v) and accessing online in real-time the same manufacturing data used by our fab engineers.
We also have a system-to-system connecting services to provide direct data exchange between our system and our customers’
systems. These services, which include our “UMC Design View Room Cloud Service”, facilitate our design collaborations with our
customers to help reduce the cost of chip designs and reduce the time to market. In order to continue to improve our information
security management, our Information Technology Division received the certification of ISO/IEC 27001:2005 in March 2008 and
renewed ISO/IEC 27001:2013 certification in February 2015.
In addition, we have established our big data research and development center. By using advanced data analysis techniques
including big data technology, mathematics and statistics, while integrating product information, research and development, production,
process and engineering related data, we are able to construct a complete engineering data analysis system, which facilitates advanced
process development and enables us to address production line issues and rectify manufacturing issues quickly.
We price our products on a per die or per wafer basis, taking into account the complexity of the technology, the prevailing market
conditions, the order size, the cycle time, the strength and history of our relationship with the customer and our capacity utilization. Our
main sales office is located in Taiwan, which is in charge of our sales activities in Asia. United Microelectronics (Europe) BV, our
wholly-owned subsidiary based in Amsterdam, assists our sales to customers in Europe. Our sales in North America are made through
UMC Group (USA), our subsidiary located in Sunnyvale, California. We also have sales offices in China, Japan and Korea to support
our customers in those regions.
We typically designate a portion of our wafer manufacturing capacity to some of our customers primarily under two types of
agreements: reciprocal commitment agreements and deposit agreements. Under a reciprocal commitment agreement, the customer
agrees to pay for, and we agree to supply, a specified capacity at a specified time in the future. Under a deposit agreement, the customer
makes in advance a cash deposit for an option on a specified capacity at our fabs for a stated period of time. Option deposits are credited
to wafer purchase prices as shipments are made. If this customer does not use the specified capacity, it will forfeit the deposit but, in
certain circumstances and with our permission, the customer may arrange for a substitute customer to utilize such capacity. In some
cases, we also make available capacity to customers under other types of agreements, such as capacity commitment arrangements with
technology partners.
34

We advertise in trade journals, organize technology seminars, hold a variety of regional and international sales conferences and
attend a number of industry trade fairs to promote our products and services. We also publish a corporate newsletter for our customers.
Competition
The worldwide semiconductor foundry industry is highly competitive, particularly during periods of overcapacity and inventory
correction. We compete internationally and domestically with dedicated foundry service providers as well as with integrated device
manufacturers and final product manufacturers which have in-house manufacturing capacity or foundry operations. Some of our
competitors have substantially greater production, financial, research and development and marketing resources than we have. As a
result, these companies may be able to compete more aggressively over a longer period of time than we can. In addition, several new
dedicated foundries have commenced operations and compete directly with us. Any significant increase in competition may erode our
profit margins and weaken our earnings.
We believe that our primary competitors in the foundry services market are Taiwan Semiconductor Manufacturing Company
Limited, Semiconductor Manufacturing International (Shanghai) Corporation and Globalfoundries Inc., as well as the foundry operation
services of some integrated device manufacturers such as IBM, Samsung, Intel and Toshiba. Other competitors such as DongbuAnam
Semiconductor, Grace Semiconductor Manufacturing Corp., X-FAB Semiconductors Foundries AG and Silterra Malaysia Sdn. Bhd.
have initiated efforts to develop substantial new foundry capacity, although much of such capacity involves less cost-effective
production than the 12-inch fabs for which we possess technical know-how. New entrants in the foundry business are likely to initiate a
trend of competitive pricing and create potential overcapacity in legacy technology. The principal elements of competition in the
semiconductor foundry industry include technical competence, production speed and cycle time, time-to-market, research and
development quality, available capacity, manufacturing yields, customer service and price. We believe that we compete favorably with
the new competitors on each of these elements, particularly our technical competence and research and development capabilities.
Intellectual Property
Our success depends in part on our ability to obtain patents, licenses and other intellectual property rights covering our production
processes and activities. To that end, we have acquired certain patents and patent licenses and intend to continue to seek patents on our
production processes. As of December 31, 2017, we held 5,341 U.S. patents and 7,277 patents issued outside of the United States.
Our ability to compete also depends on our ability to operate without infringing on the proprietary rights of others. The
semiconductor industry is generally characterized by frequent claims and litigation regarding patent and other intellectual property
rights. As is the case with many companies in the semiconductor industry, we have from time to time received communications from
third parties asserting patents that allegedly cover certain of our technologies and alleging infringement of certain intellectual property
rights of others. We expect that we will receive similar communications in the future. Irrespective of the validity or the successful
assertion of such claims, we could incur significant costs and devote significant management resources to the defense of these claims,
which could seriously harm our company. See “Item 3. Key Information—D. Risk Factors—Our inability to obtain, preserve and
defend intellectual property rights could harm our competitive position.”
In order to minimize our risks from claims based on our manufacture of semiconductor devices or end-use products whose designs
infringe on others’ intellectual property rights, we in general accept orders only from companies that we believe enjoy satisfactory
reputation and for products that are not identified as risky for potential infringement claims. Furthermore, we obtain indemnification
rights from customers. We also generally obtain indemnification rights from equipment vendors to hold us harmless from any losses
resulting from any suit or proceedings brought against our company involving allegation of infringement of intellectual property rights
on account of our use of the equipment supplied by them.
We have entered into various patent cross-licenses with major technology companies, including a number of leading international
semiconductor companies, such as IBM and LSI. Our cross licenses may have different terms and expiry dates. Depending upon our
competitive position and strategy, we may or may not renew our cross licenses and further, we may enter into different and/or
additional technology and/or intellectual property licenses in the future.
35

Research and Development
In 2015, 2016 and 2017, we spent NT$12,175 million, NT$13,532 million and NT$13,669 million (US$461 million), respectively,
on research and development, which represented 8.4%, 9.2% and 9.2%, respectively, of our net operating revenues of such years. Our
research and development efforts mainly focus on delivering SoC foundry solutions that consist of the world’s leading process
technologies, customer support services and manufacturing techniques. These resources provide our foundry customers with improved
opportunities to develop SoC products that supply the global market. Our commitment to research and development can be illustrated
by our 2017 research and development expenditures, which reached approximately 9.2% of net operating revenues. In June 2007, we
completed the construction of a research and development center for nanometer technologies in the Tainan Science Park. The research
and development center allows for seamless application of advanced process technology in the research and development phase to the
manufacturing phase.
As of December 31, 2017, we employed 1,909 professionals in our research and development activities. In addition, other
management and operational personnel are also involved in research and development activities but are not separately identified as
research and development professionals.
Our Investments
Depending on the market conditions, we intend to gradually reduce our investments through open market trading and other
measures available to our company.
The following table sets forth the sales of our investments in 2015:
Investees
Number of shares sold
(in millions)
Proceeds from disposal
(in NT$ millions)
Superalloy Industrial Co., Ltd. 5 614
Translink Capital Partners III, L.P. — 307
Taiwan High Speed Rail Corp. 30 300
Mercuries Life Insurance Co., Ltd. 15 274
The following table sets forth the sales of our investments in 2016:
Investees
Number of shares sold
(in millions)
Proceeds from disposal
(in NT$ millions)
Nien Made Enterprise Co., Ltd. 5 1,593
Superalloy Industrial Co., Ltd. 6 870
Motech Industries, Inc. 17 599
Easou Holdings Company Limited (formerly Yeti Group Ltd.) 14 295
The following table sets forth the sales of our investments in 2017:
Number of shares sold Proceeds from disposal
Investees (in millions) (in NT$ millions) (in US$ millions)
Superalloy Industrial Co., Ltd. 5 534 18
Nien Made Enterprise Co., Ltd. 1 414 14
GlobalWafers Co., Ltd. 2 343 12
Chunghwa Telecom Co., Ltd. 0 208 7
36

Environmental, Safety and Health Matters
UMC implemented extensive ESH management systems since 1996. These systems enable our operations to identify applicable
ESH regulations, assist in evaluating compliance status and timely establish loss preventive and control measures. The systems we
implemented in all our fabs have been certified as meeting the ISO 14001 and OHSAS 18001 standards. ISO 14001 consists of a set of
standards that provide guidance to the management of organizations to achieve an effective environmental management system.
Procedures are established at manufacturing locations to ensure that all accidental spills and discharges are properly addressed. OHSAS
18001 is a recognizable occupational health and safety management system standard, which may be applied to assess and certify our
management systems. Our goal in implementing ISO 14001 and OHSAS 18001 systems is to continually improve our ESH
management, comply with ESH regulations and to be a sustainable green foundry. UMC’s major ESH policies include:
Environmental Protection Aspects:
• To be an environmentally friendly enterprise characterized by continual improvement with a goal of pollution-free
production;
• To incorporate our environmental management system into the general organizational management system;
• To take initiatives to reduce waste production and prevent pollution by introducing and developing environmentally friendly
technology for design, production and operation;
• To conserve energy and recycle resources in order to be a model of environmental protection for the international
community;
• To fulfill corporate social responsibilities by playing an active role in public and community affairs to improve and protect
the environment; and
• To educate employees about environmentally sound ethics and practices.
Safety and Health Aspects:
• To achieve a goal of zero accidents and comply with all applicable safety and regulatory requirements to ensure safety is the
top priority for UMC’s sustainable development;
• To reinforce best safety and health management practice to reach international ESH and risk management standards;
• To adopt risk control advanced ESH management and rescue technologies to enhance company’s standards;
• To provide safe work environment and operation through preventive management and audit;
• To eliminate hazard factors and prevent incidents through each and every ownership of responsibilities in safety and health;
and
• To encourage all employees to actively participate in safety and health training and promotional activities.
37

As a member of the global community and a semiconductor industry leader, we have implemented measures to deal with
environmental problems and mitigate climate change. We have introduced green concepts in our operations, including green
commitment, management, procurement, production, products, recycling, office, education and marketing.
In order to conquer the green barrier formed by the RoHS (the Restriction of the Use of Certain Hazardous Substances in
Electrical and Electronic Equipment) Directive, we established a cross-division HSPM (Hazardous Substances Process Management)
committee to manage all development and implementation of related work. We completed the final system audit for QC 080000 ICEQ
HSPM qualification, a certification for having a hazardous substance process management system that meets the RoHS Directive, on
June 9, 2006 and became the first semiconductor manufacturer worldwide to achieve HSPM certification for all fabs. In 2009, we
completed the report on the carbon footprint verification for integrated circuit wafers produced at our facilities, the first such report in
the foundry industry. In 2010, we completed water footprint verification for our 200 mm and 300 mm wafers. These verifications
provide scientific and reliable statistics on the carbon and water information of products manufactured in our fabs as well as self-
reviews of environmental impact.
With respect to safety and health management, we realized that lowering the risks in equipment and processes can reduce
accidents, but cannot guarantee the safety of all employees. In order to achieve the goal of “zero-accident”, we intend to promote the
concept of “safety is my responsibility”. We have educated the employees with the concepts of “be aware of your own safety well as the
safety of others” and “safety is everyone’s responsibility, and my personal accountability.”
Furthermore, we have implemented the FMEA method to foster employees’ capabilities in risk analysis. Therefore, we established
a channel for communication to encourage and ensure the employees to fully express their opinions for professional response and
assistance. By doing so, we hope to establish a working attitude of “Safety and health first” to further improve the quality of our
working environment, and eventually to become a good example of global safety and health management.
The following list sets forth some of the important awards that we received in environmental protection, safety and health:
• Selected as a member of Dow Jones Sustainability Indexes for the tenth straight year since 2008;
• Awarded “National Sustainable Development Award” by National Council for Sustainable Development, Executive Yuan
(2017);
• Achieved Leadership Status (score level: A-) on CDP’s Climate Change Assessment Program and Water Assessment
Program (2017);
• Awarded “Corporate Sustainability Report Award” by Taiwan Institute for Sustainable Energy (2008-2017);
• Awarded “Enterprises Environmental Award of the Republic of China” by the Environmental Protection Administration of
Executive Yuan, R.O.C. (2003-2017);
• Awarded “The Best Participation of Green Procurement for Enterprises” by the Environmental Protection Administration of
Executive Yuan, R.O.C. (2011-2017); and
• Awarded “Excellent Occupational Safety and Health Executive Organization of Hsinchu Science Park” by the Science Park
Administration (1998-2017).
38

Climate Change
Our climate change policies announced on April 22, 2010 include: (i) achieving carbon neutral status via carbon management,
(ii) becoming a comprehensive low-carbon emissions solution provider, and (iii) leveraging corporate resources to cultivate a
low-carbon emissions economy. In order to implement these policies, we set greenhouse gas reduction goals as to various phases. By
2015, we completed resource and energy productivity improvement plan named “369+-project” which consisted of reducing the usage
of electricity by 3%, the usage of pipe water by 6% and the waste generation by 9% compared with the base year 2012. Currently, we
announced our latest “Green 2020” goals to demonstrate our long-term commitment to sustainable environment and achieved our
annual targeted goal in 2017. We will be more proactive with self-motivated action and more stringent standards. The goal is to further
reduce water, energy and waste by 10% over current levels by 2020. Meanwhile, we also endeavor to reduce carbon emissions through
the following two measures: (1) we continue to implement a greenhouse gas emission reduction plan to assist customers in establishing
a low-carbon emissions supply chain, and (2) we continue to enhance our research and development in advanced processes to provide
low-power products and reduce carbon emissions at the consumer level.
Since 1999, we have been a pioneer in the foundry industry to implement measures to reduce per-fluorinated compounds, and we
completed the replacement of C3F8 with C4F8 in 2011. We have made a significant achievement by reducing normalized per-fluorinated
compounds, which is one of the major greenhouse gas reduction objectives of the World Semiconductor Council. From 2013 to 2014,
UMC participated in the Environmental Protection Administration, or the EPA, early reduction project and acquired a carbon reduction
allowance of 3.02 million tons. We subsequently executed a contract with Dragon Steel Corporation to trade 2 million tons of carbon
emission credits. It was the first trade of carbon emissions credits that was reviewed and recorded by the EPA, indicating a significant
milestone in Taiwan’s carbon emission credits trading market. Proceeds derived from this carbon trading transaction was wholly used
by us to enforce environmental protection and promote environmental protection measures and to continue contributing towards
environmental sustainability.
We also support timely disclosure of carbon information and ensuring data quality. Since 2006, we have participated in the Carbon
Disclosure Project formed by global institutional investors and disclosed our annual greenhouse gas emission volume, reduction goals
and results. In 2017, we achieved a leadership level score of A- in the CDP’s Climate Change Assessment Program. We recorded the
highest score among all participating Taiwanese companies. Moreover, we engage third-party verifiers to ensure the quality of the data.
We completed the verification on greenhouse gas emission and reduction records for all of our fabs in both Taiwan and Singapore on an
annual basis.
Risk Management
Risk and safety matters are administered by our Risk Management and Environmental Safety Health Division, or the GRM &
ESH, established in 1998. We are pursuing the goal of a highly protected risk status in the semiconductor industry through the
implementation of strict engineering safety procedures, regular enforcement of safety codes and standards, and compliance of detailed
industry safety guidelines.
We have adopted the Triple Star Ranking System of AIG Insurance, a global leader in risk management and insurance, since 1999.
All fabs have been ranked as top-class following AIG’s risk evaluation and risk improvement recommendations. The ranking system
focuses on 20 items, including ten Physical Protection Elements and ten Human Elements. All of our 12-inch fabs had obtained triple-
stars in all 20 elements in every Triple Star Audit. Furthermore, we were awarded the “Outstanding Performance Award in Risk
Management” by AIG Insurance again in 2013. For our new expansion 12-inch line, Fab12A P5/6, is built with international loss
control standards, and had received the top-class ranking by AIG within six months after tool move-in in November 2015.
We have also implemented proactive efforts in earthquake risk prevention. We believe our efforts contributed to our quick and
exemplary recovery from two major earthquakes in Taiwan on September 21, 1999 and March 4, 2010, respectively. Our fabs in
Hsinchu and Tainan sustained only minor damage to their operations from the earthquake without interruption to the power system or
water service. Normal operations resumed shortly after the incidents. In addition, an earthquake took place on February 6, 2016 in
southern Taiwan but did not have any material impact on our operations. In order to reduce potential damages that will be caused to our
production facilities from earthquakes and similar incidents in the future, we continue to import the latest anti-seismic technologies,
such as a seismic isolation platform for reticle stocker and furnace and have further installed an earthquake warning system in Fab 12A
that will provide us with enhanced response time in the event of an earthquake.
39

Nowadays, extreme weather has become a risk to various business operations. In order to understand the potential impact to us, a
flood risk simulation project has been implemented in 2014. Since Hsinchu Science-Based Industrial Park is located in higher terrain,
we believe there is no potential flood risk. However, for Fab12A in Tainan, we had conducted a physical improvement plan by
installing floodgates in specific entrances to upgrade the protection level to a 500-year flood.
In addition, we are fully aware of the impact presented by business interruption. We are also devoted in the pursuit of corporate
resilience and continuity by committing non-interrupted services to satisfy our valued customers and important stakeholders. In 2013,
we were the first foundry in the world to receive ISO 22301 certification for its business continuity management system from the
Societe Generale de Surveillance, which demonstrates our commitment to developing our disaster response abilities and our
mechanisms for quick recovery. We will keep improving this system and extend the scope to our suppliers.
Insurance
We maintain industrial all risk insurance for our buildings, facilities, equipment and inventories as well as third-party properties.
The insurance for fabs and their equipment covers losses from physical damage and business interruption up to their respective policy
limits except for policy exclusions. For example, in early 2016, we experienced a severe earthquake which adversely affected our
300mm Fab 12A wafer manufacturing operations in Taiwan and we had settled our insurance policies which partially recovered the
losses resulting from this earthquake. In addition, we purchase directors and officers liability insurance for our board directors and
executive officers, covering the liabilities incurred in relation to his/her/its operation of business and legally responsible for. We also
maintain public liability insurance for losses to third parties arising from our business operations. We believe that our insurance
arrangement is adequate to cover all major types of losses relevant to the semiconductor industry practice. However, significant damage
to any of our production facilities, whether as a result of fire or other causes, could seriously harm our business.
C. Organizational Structure
The following list shows our corporate structure as of December 31, 2017:
Company
Jurisdiction of
Incorporation
Percentage of
Ownership as of
December 31, 2017
UMC Group (USA) U.S.A. 100.00%
United Microelectronics (Europe) B.V. The Netherlands 100.00%
UMC Capital Corp. Cayman Islands 100.00%
TLC Capital Co., Ltd. Taiwan, R.O.C. 100.00%
UMC New Business Investment Corp. Taiwan, R.O.C. 100.00%
Green Earth Limited Samoa 100.00%
Fortune Venture Capital Corp. Taiwan, R.O.C. 100.00%
UMC Investment (Samoa) Limited Samoa 100.00%
UMC Capital (USA) U.S.A. 100.00%
ECP Vita Pte. Ltd. Singapore 100.00%
Soaring Capital Corp. Samoa 100.00%
Unitruth Advisor (Shanghai) Co., Ltd. China 100.00%
Tera Energy Development Co., Ltd. Taiwan, R.O.C. 100.00%
United Microchip Corporation Cayman Islands 100.00%
Nexpower Technology Corp. Taiwan, R.O.C. 87.06%
Wavetek Microelectronics Corporation Taiwan, R.O.C. 78.47%
Everrich Energy Investment (HK) Limited China 100.00%
40

Company
Jurisdiction of
Incorporation
Percentage of
Ownership as of
December 31, 2017
Everrich (Shandong) Energy Co., Ltd. China 100.00%
Unistars Corp. Taiwan, R.O.C. 83.69%
SocialNex Italia 1 S.R.L. Italy 87.06%
UMC (Beijing) Limited China 100.00%
Wavetek Microelectronics Investment (Samoa) Limited Samoa 78.47%
Wavetek Microelectronics Corporation (USA) U.S.A. 78.47%
Best Elite International Limited British Virgin Islands 96.66%
Infoshine Technology Limited British Virgin Islands 96.66%
Oakwood Associates Limited British Virgin Islands 96.66%
Hejian Technology (Suzhou) Co., Ltd. China 96.66%
UnitedDS Semiconductor (Shandong) Co., Ltd. China 96.66%
United Semiconductor (Xiamen) Co., Ltd. China 50.34%
UMC Group Japan Japan 100.00%
UMC Korea Co., Ltd. Korea 100.00%
Omni Global Limited Samoa 100.00%
United Microtechnology Corporation (California) U.S.A. 100.00%
United Microtechnology Corporation (New York) U.S.A. 100.00%
Sino Paragon Limited Samoa 100.00%
UMC Technology Japan Co., Ltd. Japan 100.00%
D. Property, Plants and Equipment
Please refer to “—B. Business Overview—Manufacturing Facilities” for a discussion of our property, plants and equipment.
ITEM 4A. UNRESOLVED STAFF COMMENTS
Not applicable.
ITEM 5. OPERATING AND FINANCIAL REVIEW AND PROSPECTS
Unless stated otherwise, the discussion and analysis of our financial condition and results of operations in this section apply to
our financial information as prepared in accordance with IFRSs. You should read the following discussion of our financial condition
and results of operations together with the consolidated financial statements and the notes to such statements included in this annual
report. This discussion may contain forward-looking statements based upon current expectations that involve risks and uncertainties.
Our actual results may differ materially from those anticipated in these forward-looking statements as a result of various factors,
including those set forth under “Item 3. Key Information—D. Risk Factors” or in other parts of this annual report on Form 20-F.
For the convenience of readers, NT dollar amounts used in this section for, and as of, the year ended December 31, 2017 have
been translated into U.S. dollar amounts using US$1.00 = NT$29.64, the foreign exchange rate on December 29, 2017 as released by
the Board of Governors of the Federal Reserve System. The U.S. dollar translation appears in parentheses next to the relevant NT
dollar amount.
Overview
We are one of the world’s leading independent semiconductor foundries, providing comprehensive wafer fabrication services and
technologies to our customers based on their designs.
41

Cyclicality of the Semiconductor Industry
As the semiconductor industry is highly cyclical, revenues varied significantly over this period. It can take several years to plan
and construct a fab and bring it to operations. Therefore, during periods of favorable market conditions, semiconductor manufacturers
often begin building new fabs or acquiring existing fabs in response to anticipated demand growth for semiconductors. In addition, after
commencement of commercial operations, fabs can increase production volumes rapidly. As a result, large amounts of semiconductor
manufacturing capacity typically become available during the same time period. Absent a proportional growth in demand, this increase
in supply often results in semiconductor manufacturing overcapacity, which has led to a sharp decline in semiconductor prices and
significant capacity under-utilization. Our average capacity utilization rate was 89.8%, 88.6% and 94.4% for the years ended
December 31, 2015, 2016 and 2017, respectively. We believe that our operating results in 2015, 2016 and 2017 continue to reflect the
ongoing uncertainty in the global economy.
Pricing
We price our products on either a per die or a per wafer basis, taking into account the complexity of the technology, the prevailing
market conditions, the order size, the cycle time, the strength and history of our relationship with the customer and our capacity
utilization. Because semiconductor wafer prices tend to fluctuate frequently, we in general review our pricing on a quarterly basis. As a
majority of our costs and expenses are fixed or semi-fixed, fluctuations in our products’ average selling price historically have had a
substantial impact on our margins. Our average selling price decreased by approximately 1.8% from 2015 to 2016, and further
decreased by 4.9% to 2017, reflecting the continuing nominal price erosion in 2016 and 2017.
We believe that our current level of pricing is comparable to that of other leading foundries in each respective geometry. We
believe that our ability to provide a wide range of advanced foundry services and process technologies as well as large manufacturing
capacity will enable us to compete effectively with other leading foundries at a comparable price level.
Capacity Utilization Rates
Our operating results are characterized by relatively high fixed costs. In 2015, 2016 and 2017, approximately 67.1%, 67.8% and
69.0%, respectively, of our manufacturing costs consisted of depreciation, a portion of indirect material costs, amortization of license
fees and indirect labor costs.
If our utilization rates increase, our costs would be allocated over a larger number of units, which generally leads to lower unit
costs. As a result, our capacity utilization rates can significantly affect our margins. Our utilization rates have varied from period to
period to reflect our production capacity and market demand. Our average capacity utilization rate was 89.8%, 88.6% and 94.4% for the
years ended December 31, 2015, 2016 and 2017, respectively. Utilization rates were primarily affected by global macroeconomic
factors. Other factors affecting utilization rates are efficiency in production facilities, product flow management, the complexity and
mix of the wafers produced, overall industry conditions, the level of customer orders, mechanical failure, disruption of operations due to
expansion of operations, relocation of equipment or disruption of power supply and fire or natural disaster.
Our production capacity is determined based on the capacity ratings of the equipment in the fab, provided by the engineers,
adjusted for, among other factors, actual output during uninterrupted trial runs, expected down time due to set up for production runs
and maintenance, expected product mix and research and development. Because these factors include subjective elements, our
measurement of capacity utilization rates may not be comparable to those of our competitors.
Change in Product Mix and Technology Migration
Because the price of wafers processed with different technologies varies significantly, the mix of wafers that we produce is among
the primary factors that affect our revenues and profitability. The value of a wafer is determined principally by the complexity and
performance of the processing technology used to produce the wafer, as well as by the yield and defect density. Production of devices
with higher levels of functionality and performance, with better yields and lower defect density as well as with greater system-level
integration requires better manufacturing expertise and generally commands higher wafer prices. The increase in price generally has
more than offset associated increases in production cost once an appropriate economy of scale is reached.
42

Prices for wafers of a given level of technology generally decline over the processing technology life cycle. As a result, we have
continuously been migrating to increasingly sophisticated technologies to maintain the same level of profitability. We began our volume
production with 65-nanometer and 40-nanometer technologies in 2006 and 2009, respectively. We introduced our 28-nanometer
technology to customers in 2011 and started large-scale commercial production in 2014. Our 28nm technology contributed
approximately 10%, 17% and 16% of our foundry revenue in 2015, 2016 and 2017, respectively.
Manufacturing Yields
Manufacturing yield per wafer is measured by the number of functional dice on that wafer over the maximum number of dice that
can be produced on that wafer. A small portion of our products is priced on a per die basis, and our high manufacturing yields have
assisted us in achieving higher margins. In addition, with respect to products that are priced on a per wafer basis, we believe that our
ability to deliver high manufacturing yields generally has allowed us to either charge higher prices per wafer or attract higher order
volumes, resulting in higher margins.
We continually upgrade our process technologies. At the beginning of each technological upgrade, the manufacturing yield
utilizing the new technology is generally lower, sometimes substantially lower, than the yield under the current technology. The yield is
generally improved through the expertise and cooperation of our research and development personnel and process engineers, as well as
equipment and at times raw material suppliers. Our policy is to offer customers new process technologies as soon as the new
technologies have passed our internal reliability tests.
Investments
Most of our investments were made to improve our market position and for strategy considerations, a significant portion of which
are in foundry-related companies including fabless design customers, raw material suppliers and intellectual property vendors.
Historically, we also made investments in companies in the solar manufacturing industry and LED industry.
We have, from time to time, disposed of investments for financial, strategic or other purposes in recent years. See “Item 4.
Information on the Company—B. Business Overview—Our Investments” for a description of our investments.
Treasury Share Programs
We have from time to time announced plans, none of which were binding on us, to buy back up to a fixed amount of our common
shares on the Taiwan Stock Exchange at the price range set forth in the plans. On July 29, 2015, our board of directors resolved to
purchase up to 200 million common shares on the Taiwan Stock Exchange at a price between NT$7.55 and NT$18.80 per share during
the period from July 30, 2015 to September 29, 2015 to transfer to our employees as employee compensation. On May 11, 2016, our
board of directors resolved to purchase up to 200 million common shares on the Taiwan Stock Exchange at a price between NT$7.90
and NT$18.70 per share during the period from May 12, 2016 to July 11, 2016 to transfer to our employees as employee compensation.
During 2015, 2016 and 2017, we purchased an aggregate of 200 million, 200 million and nil common shares, respectively, and
transferred 60.7 million, nil and nil of such common shares that we repurchased under these plans to our employees as employee
compensation in 2015, 2016 and 2017, respectively.
43

Critical Accounting Policies
The preparation of our consolidated financial statements requires management to make judgments, estimates and assumptions that
affect the reported amounts of revenues, expenses, assets, liabilities, the accompanying disclosures and the disclosure of contingent
liabilities. However, uncertainty about these assumptions and estimates could result in outcomes that require a material adjustment to
the carrying amount of assets or liabilities affected in future periods.
The key assumptions concerning the future and other key sources of estimating uncertainty at the reporting date that would have a
significant risk for a material adjustment to the carrying amounts of assets or liabilities within the next fiscal year are discussed below.
We based our assumptions and estimates on information available when the consolidated financial statements were prepared. Existing
circumstances and assumptions about future developments, however, may change due to market changes or circumstances arising
beyond our control. Such changes are reflected in the assumptions when they occur.
Classification and Measurement of Financial Instruments
Financial assets and financial liabilities are recognized when we become a party to the contractual provisions of the instrument.
We determine the classification of our financial assets at initial recognition. In accordance with “IAS 39 - Financial Instruments:
Recognition and Measurement” (IAS 39), our financial assets are classified as financial assets at fair value through profit or loss,
available-for-sale financial assets, held-to-maturity financial assets and notes, accounts and other receivables. Our financial liabilities
are classified as financial liabilities at fair value through profit or loss and financial liabilities carried at amortized cost. Purchase or sale
of financial assets and liabilities are recognized using trade date accounting. All financial instruments are recognized initially at fair
value plus, in the case of investments not at fair value through profit or loss, directly attributable costs, and are subsequently measured
at fair value or amortized cost using the effective interest method, less impairment, based on the classification. We assess whether
objective evidence of impairment exists for a financial asset or a group of financial assets at each reporting date.
Where the fair values of financial assets and financial liabilities recorded in the balance sheet cannot be derived from active
markets, they are determined using valuation techniques including income approach (for example, the discounted cash flows model) or
the market approach. Changes in assumptions about these factors could affect the reported fair value of the financial instruments. Please
refer to Note 11 to our audited consolidated financial statements included elsewhere in this annual report for more details.
Inventories
Inventories are accounted for on a perpetual basis. Raw materials are stated at actual purchase costs, while the work in process and
finished goods are stated at standard costs and subsequently adjusted to weighted-average costs at the end of each month. The cost of
work in progress and finished goods comprises raw materials, direct labor, other direct costs and related production overheads.
Allocation of fixed production overheads to the costs of conversion is based on the normal capacity of the production facilities. Cost
associated with underutilized capacity is expensed as incurred.
Inventories are valued at the lower of cost and net realizable value item by item. Net realizable value is the estimated selling price
in the ordinary course of business less the estimated costs of completion and the estimated costs necessary to make the sale. Please refer
to Note 6(4) to our audited consolidated financial statements included elsewhere in this annual report. Costs of completion include
direct labor and overhead, including depreciation and maintenance of production equipment, indirect labor costs, indirect material costs,
supplies, utilities and royalties that is expected to be incurred at normal production level. We estimate normal production level taking
into account loss of capacity resulting from planned maintenance, based on historical experience and current production capacity.
44

Bonds
Convertible bonds
We evaluate the terms of the convertible bonds issued to determine whether it contains both a liability and an equity component.
Furthermore, we assess if the economic characteristics and risks of the put and call options embedded in the convertible bonds are
closely related to the economic characteristics and risk of the host contract before separating the equity element.
For the liability component excluding the derivatives, its fair value is determined based on the effective interest rate applied at that
time by the market to instruments of comparable credit status. The liability component is classified as a financial liability measured at
amortized cost using the effective interest rate method before the instrument is converted or settled. For the embedded derivative that is
not closely related to the host contract, it is classified as a liability component and subsequently measured at fair value through profit or
loss unless it qualifies as an equity component. The equity component is recognized initially at the difference between the fair value of
the compound financial instrument as a whole and the fair value of the liability component. Its carrying amount is not remeasured in the
subsequent accounting periods. If the convertible bond issued does not have an equity component, it is accounted for as a hybrid
instrument in accordance with the requirements under IAS 39.
If the convertible bondholders exercise their conversion right before maturity, we shall adjust the carrying amount of the liability
component. The adjusted carrying amount of the liability component at conversion and the carrying amount of equity component are
credited to common stock and additional paid-in capital—premiums. No gain or loss is recognized upon bond conversion.
In addition, the liability component of convertible bonds is classified as a current liability if within 12 months the bondholders
may exercise the put right. After the put right expires, the liability component of the convertible bonds should be reclassified as a
non-current liability if it meets the definition of a non-current liability in all other respects.
Post-Employment Benefits
Under defined contribution pension plans, the contribution payable to the plan in exchange for the service rendered by an
employee during a period shall be recognized as an expense. The contribution payable, after deducting any amount already paid, is
recognized as a liability. Under defined benefit pension plans, the net defined benefit liability (asset) shall be recognized as the amount
of the present value of the defined benefit obligation, deducting the fair value of any plan assets and adjusting for any effect of the asset
ceiling. Service cost and net interest on the net defined benefit liability (asset) are recognized as expenses in the period of service.
Remeasurement of the net defined benefit liability (asset), which comprises actuarial gains and losses, the return on plan assets and any
change in the effect of the asset ceiling, excluding any amounts included in net interest, is recognized in other comprehensive income in
the period in which they occur. Remeasurement recognized in other comprehensive income is reflected immediately in retained
earnings and shall not be reclassified to profit or loss in a subsequent period.
Defined benefit costs and the present value of the defined benefit obligation for a pension plan are determined using the projected
unit credit method. An actuarial valuation involves making various assumptions, which include the determination of the discount rate,
future salary increase rate, mortality rate, etc., and may differ from actual developments in the future. In determining the appropriate
discount rate, management considers the interest rates of the government bonds extrapolated from maturity corresponding to the
expected duration of the defined benefit obligation. As for the rate of future salary increase, management takes account of past
experiences, comparisons within the industry and the geographical region, inflation and the discount rate. Due to the complexity of the
actuarial valuation and its long-term nature, a defined benefit obligation is highly sensitive to changes in these assumptions. The
assumptions used are disclosed in Note 6(14) to our audited consolidated financial statements included elsewhere in this annual report.
Revenue Recognition
Revenue is recognized to the extent that it is probable that the economic benefits will flow to us and the revenue can be reliably
measured. Revenue is measured at the fair value of the consideration received or receivable. The specific criteria described below must
also be met before revenue is recognized.
45

Sales revenue
We manufacture semiconductors for creditworthy customers based on their design specifications, pursuant to manufacturing
agreements and/or purchase orders at contractual prices. We ship wafers mainly under the trade term, Free Carrier (“FCA”), through
which the title and risk of loss for the wafers are transferred to the customers upon delivery to carriers approved by the customers. Sales
revenue is recognized at this point, having also fulfilled all of the following criteria pursuant to IAS 18, paragraph 14:
a. the significant risks and rewards of ownership of the goods have been transferred to the customer;
b. neither continuing managerial involvement to the degree usually associated with ownership nor effective control over the
goods sold have been retained;
c. the amount of revenue can be measured reliably;
d. it is probable that the economic benefits associated with the transaction will flow to the entity; and
e. the costs incurred or to be incurred in respect of the transaction can be measured reliably.
Sales revenue is measured at the fair value of the consideration received or receivable, net of sales returns and discounts, which
are estimated based on customer complaints, historical experience and other known factors. Sales returns and discounts are recorded in
the same period in which sales are made.
Impairment of Property, Plant and Equipment
At each reporting date or whenever events indicate that the asset’s value has declined or significant changes in the market with an
adverse effect have taken place, we assess whether there is an indication that an asset in the scope of “IAS 36 - Impairment of Assets”
may be impaired. If any indication exists, we complete impairment testing for the cash-generating unit (“CGU”) to which the individual
assets belong. Where the carrying amount of an asset or CGU exceeds its recoverable amount, the asset is considered impaired and is
written down to its recoverable amount. The recoverable amount of an individual asset or CGU is the higher of fair value less costs of
disposal and its value in use. The fair value less costs of disposal is based on best information available to reflect the amount that an
entity could obtain from the disposal of the asset in an orderly transaction between market participants after deducting the costs of
disposal. The value in use is measured at the net present value of the future cash flows the entity expects to derive from the asset or
CGU. Cash flow projection involves subjective judgments and estimates which include the estimated useful lives of property, plant and
equipment, capacity that generates future cash flows, capacity of physical output, potential fluctuations of economic cycle in the
industry and our operating situation.
Income Tax
Income tax expense (benefit) is the aggregate amount of current income tax and deferred income tax included in the determination
of profit or loss for the period. Current income tax assets and liabilities for the current period and prior periods are measured using the
tax rates and tax laws that have been enacted or substantively enacted by the end of the reporting period. Current income tax relating to
items recognized directly in other comprehensive income or equity is recognized in other comprehensive income or equity rather than
profit or loss.
Deferred income tax is determined using the liability method on temporary differences between the tax bases of assets and
liabilities and their carrying amounts in financial statements at the reporting date. Deferred tax assets and liabilities are measured at the
tax rates that are expected to apply in the year when the asset is realized or the liability is settled, based on tax rates and tax laws that
have been enacted or substantively enacted at the reporting date. The measurement of deferred tax assets and liabilities reflects the tax
consequences that would follow the manner in which we expect, at the end of the reporting period, to recover or settle the carrying
amount of our assets and liabilities. Deferred tax relating to items recognized outside profit or loss is not recognized in profit or loss but
rather in other comprehensive income or directly in equity. Deferred tax assets are reassessed and recognized at each reporting date.
Unrecognized deferred tax assets are reassessed at each reporting date and are recognized to the extent that it has become probable that
future taxable profits will allow the deferred tax assets to be recovered. Deferred tax assets and liabilities offset each other, if a legally
enforceable right exists to set off current income tax assets against current income tax liabilities, and the deferred taxes relate to the
same taxable entity and the same taxation authority.
46

Uncertainties exist with respect to the interpretation of complex tax regulations, changes in tax laws, and the amount and timing of
future taxable income. We establish provisions, based on reasonable estimates, for possible consequences of audits by the tax
authorities of the respective countries in which we operate. The amount of such provisions is based on various factors, such as
experience of previous tax audits and different interpretations of tax regulations made by the taxable entity and the responsible tax
authority. Such differences of interpretation may arise on a wide variety of issues depending on the conditions prevailing in our
respective domicile.
Deferred tax assets are recognized for all carryforward of unused tax losses, tax credits and deductible temporary differences to
the extent that it is probable that future taxable profit will be available or there are sufficient taxable temporary differences against
which the unused tax losses, unused tax credits or deductible temporary differences can be utilized. The amount of deferred tax assets
determined to be recognized is based upon the likely timing and the level of future taxable profits and taxable temporary differences.
Please refer to Note 6(23) to our audited consolidated financial statements included elsewhere in this annual report for more details on
unrecognized deferred tax assets.
A. Operating Results
Net Operating Revenues
We generate our net operating revenues primarily from the manufacture and sales of wafer fabricating semiconductor devices,
solar energy and new generation LED. We also derive a small portion of our net operating revenues from wafer probe services that we
perform internally as well as mask tooling services and assembly and test services that we subcontract to other companies.
Operating Costs
Our operating costs consist principally of:
• overhead, including depreciation and maintenance of production equipment, indirect labor costs, indirect material costs,
supplies, utilities and royalties;
• wafer costs;
• direct labor costs; and
• service charges paid to subcontractors for mask tooling, assembly and test services.
Our total depreciation expenses were NT$43,473 million, NT$49,691 million and NT$50,965 million (US$1,719 million) in 2015,
2016 and 2017, respectively.
Operating Expenses
Our operating expenses consist of the following:
• Sales and marketing expenses. Sales and marketing expenses consist primarily of intellectual property development
expenses, salaries and related personnel expenses, wafer sample expenses and mask expenses. Wafer samples are actual
silicon samples of our customers’ early design ideas made with our most advanced processes and provided to those
customers;
47

• General and administrative expenses. General and administrative expenses consist primarily of salaries for our
administrative, finance and human resource personnel, fees for professional services, and cost of computer and
communication systems to support our operations; and
• Research and development expenses. Research and development expenses consist primarily of salaries and related personnel
expenses, research testing related expenses and depreciation on the equipment used for our research and development.
Net Other Operating Income and Expenses
Net other operating income and expenses consist primarily of:
• gains or losses arising from disposal of property, plant and equipment;
• net rental income or loss from property; and
• amortization of deferred government grants related to machinery and equipment.
Non-operating Income and Expenses
Our non-operating income and expenses primarily consist of the following:
1. Other income, which consists of:
• interest income, which is primarily derived from time deposits; and
• dividend income, which is primarily derived from financial assets at fair value through profit or loss,
available-for-sale financial assets and financial assets measured at cost.
2. Other gains and losses, which principally consist of:
• gains or losses on valuation of financial assets and liabilities, which are primarily derived from disposal of and
changes in the values of financial assets and liabilities classified as fair value through profit or loss, according to
IAS 39;
• impairment loss, which is primarily derived from the loss recognized in available-for-sale financial assets and
financial assets measured at cost; and
• gains or losses on disposal of investments, which are primarily derived from our disposal of available-for-sale
financial assets, financial assets measured at cost and investments accounted for under the equity method.
3. Finance costs, which principally consist of:
• interest expenses, which are primarily derived from bonds payable and bank loans; and
• financial expenses, which are primarily derived from stockholder services proxy fee.
4. Share of profit or loss of associates and joint ventures, which is primarily derived from the recognition of investee
companies’ net profit based on the ownership percentage we hold.
48

Taxation
The corporate income tax rate in the R.O.C. was previously 17% and is currently 20% as of January 1, 2018 according to the
newly passed amendments to the Income Tax Act. Based on our status as a company engaged in the semiconductor business in Taiwan,
we have been granted exemptions from income taxes in Taiwan with respect to income attributable to capital increases for the purpose
of purchasing equipment related to the semiconductor business for a period of five years following each such capital increase. In
addition, our branch in Singapore enjoys tax exemption for income derived from tax-exempted activities under Singapore’s Income Tax
Act and Economic Expansion Incentive (Relief from Income Tax) Act. These tax exemptions resulted in tax savings of approximately
NT$1,642 million, NT$1,708 million and NT$1,542 million (US$52 million) in 2015, 2016 and 2017, respectively. We also benefit
from other tax incentives generally available to technology companies in Taiwan, such as tax credits applicable against corporate
income tax that range from 5% to 20% of the amount of investment in certain qualified equipment and 10% to 15% of qualified
research and development expenditures. These tax incentives resulted in tax savings of approximately NT$589 million, NT$400 million
and NT$306 million (US$10 million) in 2015, 2016 and 2017, respectively.
The R.O.C. government enacted the R.O.C. Income Basic Tax Act, also known as the “Alternative Minimum Tax Act”, or the
AMT Act, to impose an alternative minimum tax. AMT is a supplemental tax which is payable if the income tax payable pursuant to the
R.O.C. Income Tax Act is below the minimum amount prescribed under the AMT Act. Most tax-exempt income under the R.O.C.
Income Tax Act is considered to be taxable under the AMT Act, such as eligible income generated during tax holidays and capital gain
from selling domestic securities, and tax credits are not allowed to deduct AMT. The tax rate for business entities is 12%.
In 1997, the R.O.C. Income Tax Act was amended to introduce the integrated income tax system and impose 10% tax on
undistributed earnings generated from 1998. However, in early 2018, the newly passed amendments to the Income Tax Act abolished
the integrated income tax system and reduced the tax rate of undistributed earnings by half.
After taking into account the tax exemptions and tax incentives discussed above, we recorded NT$1,028 million, NT$553 million
and NT$993 million (US$34 million) of income tax expenses in 2015, 2016 and 2017, respectively. Our effective income tax rate in
2017 was 12.94%.
Comparisons of Results of Operations
The following table sets forth some of our results of operations data as a percentage of our net operating revenues for the periods
indicated.
Years Ended December 31,
2015 2016 2017
% % %
Net operating revenues 100.0 100.0 100.0
Operating costs (78.1) (79.5) (81.9)
Gross profit 21.9 20.5 18.1
Operating expenses
Sales and marketing (2.8) (3.1) (2.8)
General and administrative (2.6) (3.9) (2.8)
Research and development (8.4) (9.2) (9.2)
Subtotal (13.8) (16.2) (14.8)
Net other operating income and expenses (0.6) (0.1) 1.1
Operating income 7.5 4.2 4.4
Non-operating income and expenses 1.9 (1.0) 0.7
Income from continuing operations before income tax 9.4 3.2 5.1
Income tax expense (0.7) (0.4) (0.6)
Net income 8.7 2.8 4.5
49

Years Ended December 31,
2015 2016 2017
Total other comprehensive income (loss), net of tax (0.7) (2.7) (3.2)
Total comprehensive income 8.0 0.1 1.3
Net income attributable to:
Stockholders of the parent 9.2 5.8 6.5
Non-controlling interests (0.5) (3.0) (2.0)
Total comprehensive income attributable to:
Stockholders of the parent 8.5 3.1 3.3
Non-controlling interests (0.5) (3.0) (2.0)
Year Ended December 31, 2017 Compared to Year Ended December 31, 2016
Net operating revenues. Net operating revenues increased by 1.0% from NT$147,870 million in 2016 to NT$149,285 million
(US$5,037 million) in 2017, primarily due to increased demand in leading edge technologies, which resulted in a 10.8% increase in
foundry wafer shipments from 6,172 thousand 8-inch equivalent wafers in 2016 to 6,837 thousand 8-inch equivalent wafers in 2017,
which was partially offset by appreciation of the NTD in 2017, appreciating by approximately 5.8% from 2016, and a lower average
selling price in 2017, decreasing by approximately 4.9% from 2016.
Operating costs. Operating costs increased by 4.0% from NT$117,491 million in 2016 to NT$122,227 million (US$4,124 million)
in 2017, primarily due to the increased direct material cost, indirect labor cost, and depreciation expense and an increase in shipments in
response to capacity expansion and increased customer demands.
Gross profit and gross margin. Gross profit decreased from NT$30,379 million in 2016 to NT$27,058 million (US$913 million)
in 2017. Our gross margin decreased from 20.5% in 2016 to 18.1% in 2017, primarily due to the increased operating cost.
Operating income and operating margin. Operating income increased from NT$6,194 million in 2016 to NT$6,568 million
(US$222 million) in 2017. Our operating margin increased from 4.2% in 2016 to 4.4% in 2017. The increase in operating margin was
largely due to the decrease in sales and marketing expenses and general and administrative expenses and increase in amortization of
deferred government grants. Operating expenses decreased by 7.4% from NT$23,922 million in 2016 to NT$22,143 million (US$747
million) in 2017.
Sales and marketing expenses. Our sales and marketing expenses decreased by 7.7% from NT$4,589 million in 2016 to
NT$4,234 million (US$143 million) in 2017. The decrease in sales and marketing expenses was mainly due to a decrease of
NT$262 million (US$9 million) in intellectual property royalty expenses as a result of the decreased number of intellectual properties
under which we were granted licenses, NT$71 million (US$2 million) in sample expenses and NT$41 million (US$1 million) in mask
expenses. Our sales and marketing expenses as a percentage of our net operating revenues decreased from 3.1% in 2016 to 2.8% in
2017.
General and administrative expenses. Our general and administrative expenses decreased by 26.9% from NT$5,801 million in
2016 to NT$4,240 million (US$143 million) in 2017, mainly as a result of the setup costs of Fab 12X in 2016. Our general and
administrative expenses as a percentage of our net operating revenues decreased from 3.9% in 2016 to 2.8% in 2017.
Research and development expenses. Our research and development expenses increased by 1.0% from NT$13,532 million in
2016 to NT$13,669 million (US$461 million) in 2017. The increase in research and development expenses was mainly due to an
increase of NT$469 million (US$16 million) in personnel expenses, NT$206 million (US$7 million) in depreciation expenses and
NT$68 million (US$2 million) in intellectual property royalty expenses. The decrease in research and development expenses was
mainly due to a decrease of NT$322 million (US$11 million) in wafers for research and development usage, NT$211 million (US$7
million) in mask expenses and NT$108 million (US$4 million) in indirect material expenses. Our research and development expenses
as a percentage of our net operating revenues were both 9.2% in 2016 and 2017.
50

Net other operating income and expenses. Net other operating income increased by 728.9% from expenses of NT$263 million in
2016 to income of NT$1,653 million (US$56 million) in 2017, mainly due to a decrease in impairment loss of property, plant, and
equipment from NT$455 million in 2016 to nil in 2017 and an increase in government grants income from NT$243 million to
NT$1,710 million (US$58 million). Net other operating income and expenses as a percentage of our net operating revenues were (0.1%)
and 1.1% in 2016 and 2017, respectively.
Non-operating income and expenses. Non-operating income and expenses increased by 174.9% from a loss of NT$1,473 million
in 2016 to an income of NT$1,104 million (US$37 million) in 2017, mainly due to the increase in exchange gain from a loss of
NT$1,502 million in 2016 to a gain of NT$1,566 million (US$53 million) in 2017, and an increase in share of profit or loss of
associates and joint ventures from a loss of NT$316 million in 2016 to an income of NT$158 million (US$5 million) in 2017, partially
offset by an increase in the finance cost from NT$1,414 million in 2016 to NT$2,495 million (US$84 million) in 2017.
Other comprehensive income (loss), net of tax. Our other comprehensive loss, net of tax, increased from a loss of
NT$4,024 million in 2016 to a loss of NT$4,815 million (US$162 million) in 2017. We attributed this change primarily to the increase
in the loss of exchange differences on translation of foreign operations from a loss of NT$1,817 million in 2016 to a loss of
NT$5,915 million (US$200 million) in 2017, partially offset by the increase in unrealized gain (loss) on available-for-sale financial
assets from a loss of NT$1,874 million in 2016 to a gain of NT$681 million (US$23 million) in 2017, and the increase in share of other
comprehensive income (loss) of associate and joint ventures from a loss of NT$273 million in 2016 to an income of NT$571 million
(US$19 million) in 2017.
Net income attributable to the stockholders of the parent. Due to the factors described above, our net income increased by 12.2%
from NT$8,621 million in 2016 to NT$9,676 million (US$326 million) in 2017.
Total comprehensive income attributable to the stockholders of the parent. Due to the factors described above, our
comprehensive income increased by 7.4% from NT$4,629 million in 2016 to NT$4,973 million (US$168 million) in 2017.
Year Ended December 31, 2016 Compared to Year Ended December 31, 2015
Net operating revenues. Net operating revenues increased by 2.1% from NT$144,830 million in 2015 to NT$147,870 million in
2016, primarily due to increased demand in leading edge technologies, which resulted in a 5.2% increase in foundry wafer shipments
from 5,868 thousand 8-inch equivalent wafers in 2015 to 6,172 thousand 8-inch equivalent wafers in 2016, which was partially offset
by a lower average selling price in 2016, decreasing by approximately 1.8% from 2015.
Operating costs. Operating costs increased by 3.9% from NT$113,061 million in 2015 to NT$117,491 million in 2016, primarily
due to the increased depreciation expense and an increase in shipments in response to capacity expansion and increased customer
demands. These increases were partially offset by a compensation from insurance claims.
Gross profit and gross margin. Gross profit decreased from NT$31,769 million in 2015 to NT$30,379 million in 2016. Our gross
margin decreased from 21.9% in 2015 to 20.5% in 2016, primarily due to the increased depreciation expense.
Operating income and operating margin. Operating income decreased from NT$10,836 million in 2015 to NT$6,194 million in
2016. Our operating margin decreased from 7.5% in 2015 to 4.2% in 2016. The decrease in operating margin was largely due to the
increase in general and administrative expenses and research and development expenses. Operating expenses increased by 19.8% from
NT$19,969 million in 2015 to NT$23,922 million (US$738 million) in 2016.
51

Sales and marketing expenses. Our sales and marketing expenses increased by 12.9% from NT$4,064 million in 2015 to
NT$4,589 million in 2016. The increase in sales and marketing expenses was mainly due to an increase of NT$232 million in
intellectual property royalty expenses as a result of the increased number of intellectual properties under which we were granted
licenses, NT$214 million in sample expenses and NT$124 million in mask expenses. Our sales and marketing expenses as a percentage
of our net operating revenues increased from 2.8% in 2015 to 3.1% in 2016.
General and administrative expenses. Our general and administrative expenses increased by 55.5% from NT$3,730 million in
2015 to NT$5,801 million in 2016, mainly as a result of the setup costs of Fab 12X in 2016. Our general and administrative expenses as
a percentage of our net operating revenues increased from 2.6% in 2015 to 3.9% in 2016.
Research and development expenses. Our research and development expenses increased by 11.1% from NT$12,175 million in
2015 to NT$13,532 million in 2016. The increase in research and development expenses was mainly due to an increase of
NT$380 million in depreciation expenses, NT$225 million in wafers for research and development usage, NT$211 million in personnel
expenses and NT$190 million in maintenance expenses. Our research and development expenses as a percentage of our net operating
revenues increased from 8.4% in 2015 to 9.2% in 2016.
Net other operating income and expenses. Net other operating expenses decreased by 72.7% from NT$964 million in 2015 to
NT$263 million in 2016, mainly due to a decrease in impairment loss of property, plant, and equipment from NT$1,021 million in 2015
to NT$455 million in 2016 and an increase of NT$243 million in government grants income. Net other operating expenses as a
percentage of our net operating revenues were 0.6% and 0.1% in 2015 and 2016, respectively.
Non-operating income and expenses. Non-operating income and expenses decreased by 152.0% from an income of
NT$2,833 million in 2015 to a loss of NT$1,473 million in 2016, mainly due to the increase in exchange loss from a gain of
NT$369 million in 2015 to a loss of NT$1,502 million in 2016, an increase in the finance cost from NT$524 million in 2015 to
NT$1,414 million in 2016, and an increase in the impairment loss of investments accounted for under the equity method from nil in
2015 to NT$837 million in 2016.
Other comprehensive income (loss), net of tax. Our other comprehensive loss, net of tax, increased from a loss of
NT$1,065 million in 2015 to a loss of NT$4,024 million in 2016. We attributed this change primarily to the increase in the loss of
exchange differences on translation of foreign operations from a gain of NT$2,764 million in 2015 to a loss of NT$1,817 million in
2016.
Net income attributable to the stockholders of the parent. Due to the factors described above, our net income decreased by 35.0%
from NT$13,254 million in 2015 to NT$8,621 million in 2016.
Total comprehensive income attributable to the stockholders of the parent. Due to the factors described above, our
comprehensive income decreased by 62.2% from NT$12,251 million in 2015 to NT$4,629 million in 2016.
B. Liquidity and Capital Resources
The foundry business is highly capital intensive. Our development over the past three years has required significant investments.
Additional expansion for the future generally will continue to require significant cash for acquisition of plant and equipment to support
increased capacities, particularly for the production of 12-inch wafers, although our expansion program will be adjusted from time to
time to reflect market conditions. In addition, the semiconductor industry has historically experienced rapid changes in technology. To
maintain competitiveness at the same capacity, we are required to make adequate investments in plant and equipment. In addition to our
need for liquidity to support the large fixed costs of capacity expansion and the upgrading of our existing plants and equipment for new
technologies, as we ramp up production of new plant capacity, we require significant working capital to support purchases of raw
materials for our production and to cover variable operating costs such as salaries until production yields provide sufficiently positive
margins for a fabrication facility to produce operating cash flows.
52

Resource for Liquidity
We have financed our capital expenditure requirements in recent years from operating cash inflows, bank borrowings, as well as
the issuance of bonds and equity-linked securities denominated in NT dollars and U.S. dollars. Operating cash inflows significantly
exceed operating income, reflecting the significant non-cash depreciation expense.
As of December 31, 2017, we had NT$81,675 million (US$2,756 million) of cash and cash equivalents and NT$717 million
(US$24 million) of financial assets at fair value through current profit or loss. Cash equivalents included time deposits and commercial
paper with original maturities of three months or less and repurchase agreements collateralized by government bonds and corporate
bonds. These agreements bore interest rates ranging from 0.34% to 0.44%, 0.23% to 0.32%, and 0.24% to 0.32% in 2015, 2016 and
2017, respectively. The terms of these agreements were typically less than one month. As of December 31, 2015, 2016 and 2017, we
held repurchase agreements in the amount of NT$4,860 million, NT$6,188 million and NT$9,259 million (US$312 million),
respectively.
In early June 2012, we issued five-year and seven-year domestic unsecured corporate bonds totaling NT$10,000 million, with a
face value of NT$1 million per unit. The five-year domestic unsecured corporate bond was issued in the amount of NT$7,500 million.
Interest will be paid annually at 1.43%. The principal has been fully repaid. The seven-year domestic unsecured corporate bond was
issued in the amount of NT$2,500 million. Interest will be paid annually at 1.63%, and the principal will be repayable in June 2019
upon maturity. The proceeds of this offering are used for purchasing machinery and equipment. As of December 31, 2017,
NT$2,500 million aggregate principal amount of these bonds were outstanding.
In mid-March 2013, we issued another five-year and seven-year domestic unsecured corporate bonds totaling NT$10,000 million,
with a face value of NT$1 million per unit. The five-year domestic unsecured corporate bond was issued in the amount of NT$7,500
million. Interest will be paid annually at 1.35%, and the principal will be repayable in March 2018 upon maturity. The seven-year
domestic unsecured corporate bond was issued in the amount of NT$2,500 million. Interest will be paid annually at 1.50%, and the
principal will be repayable in March 2020 upon maturity. The proceeds of this offering are used for purchasing machinery and
equipment. As of December 31, 2017, NT$10,000 million aggregate principal amount of these bonds were outstanding.
In mid-June 2014, we issued an aggregate principal amount of NT$5,000 million of seven-year and ten-year domestic unsecured
corporate bonds, with a denomination of NT$1 million per bond. The seven-year domestic unsecured corporate bond was issued with an
aggregate principal amount of NT$2,000 million with an annual coupon bearing an interest rate of 1.7%. The ten-year domestic
unsecured corporate bond was issued with an aggregate principal amount of NT$3,000 million with an annual coupon bearing an
interest rate of 1.95%. The proceeds of this offering were used for repay debts. As of December 31, 2017, NT$5,000 million aggregate
principal amount of these bonds were outstanding.
In mid-May 2015, we issued five-year US$600 million aggregate principal amount of currency linked zero coupon convertible
bonds due 2020. Each bond, at the option of the holder, were convertible into our common shares at NT$15.4320 per share on
December 31, 2017. The proceeds of this offering were used for purchasing machinery and equipment. As of December 31, 2017, no
bonds had been converted or redeemed.
At our 2017 annual general meeting, our stockholders authorized our board of directors to raise capital from private placement,
through issuing instruments such as common shares, depositary receipts (including but not limited to ADS), or Euro/Domestic
convertible bonds (including secured or unsecured corporate bonds), based on market conditions and our needs. The amount of common
shares issued or convertible is proposed to be no more than 10% of our issued and outstanding share capital (i.e., no more than
1,262,431,871 common shares). According to Item 6, Article 43-6 of the R.O.C. Security and Exchange Act, any private placement of
our common shares must be conducted separately within one year after approval at the annual general meeting of stockholders. The
approval to conduct a private placement of our common shares will expire on June 12, 2018.
53

In late March 2017, we issued another five-year and seven-year domestic unsecured corporate bonds totaling NT$8,300 million,
with a face value of NT$1 million per unit. The five-year domestic unsecured corporate bond was issued in the amount of
NT$6,200 million. Interest will be paid annually at 1.15%, and the principal will be repayable in March 2022 upon maturity. The seven-
year domestic unsecured corporate bond was issued in the amount of NT$2,100 million. Interest will be paid annually at 1.43%, and the
principal will be repayable in March 2024 upon maturity. The proceeds of this offering are used for repay debt. As of December 31,
2017, NT$8,300 million aggregate principal amount of these bonds were outstanding.
In early October 2017, we issued another five-year and seven-year domestic unsecured corporate bonds totaling
NT$5,400 million, with a face value of NT$1 million per unit. The five-year domestic unsecured corporate bond was issued in the
amount of NT$2,000 million. Interest will be paid annually at 0.94%, and the principal will be repayable in October 2022 upon
maturity. The seven-year domestic unsecured corporate bond was issued in the amount of NT$3,400 million. Interest will be paid
annually at 1.13%, and the principal will be repayable in October 2024 upon maturity. The proceeds of this offering are used for repay
debt. As of December 31, 2017, NT$5,400 million aggregate principal amount of these bonds were outstanding.
Operating Activities
In 2017, net cash provided by operating activities was NT$52,474 million (US$1,770 million), primarily due to net income before
income tax of NT$7,672 million (US$259 million) and the add-back of non-cash items, such as depreciation and amortization in the
amount of NT$53,099 million (US$1,791 million), partially offset by the change in other current assets of NT$4,398 million
(US$148 million).
In 2016, net cash provided by operating activities was NT$46,450 million, primarily due to net income before income tax of
NT$4,721 million and the add-back of non-cash items, such as depreciation and amortization in the amount of NT$51,984 million,
partially offset by the change in other current assets of NT$8,640 million.
In 2015, net cash provided by operating activities was NT$59,788 million, primarily due to the net income before income tax of
NT$13,669 million and the add-back of non-cash items, such as depreciation and amortization in the amount of NT$45,472 million.
Investing Activities
In 2017, net cash used in investing activities was NT$35,416 million (US$1,195 million), primarily due to cash used to purchase
equipment at our fabs amounting to NT$44,236 million (US$1,492 million), partially offset by proceeds of NT$6,756 million (US$228
million) from government grants related to assets acquisition and proceeds of NT$2,179 million (US$74 million) from disposal of
financial assets.
In 2016, net cash used in investing activities was NT$80,086 million, primarily due to cash used to purchase equipment at our fabs
amounting to NT$91,561 million, partially offset by proceeds of NT$9,566 million from government grants related to assets acquisition
and proceeds of NT$4,370 million from disposal of financial assets.
In 2015, net cash used in investing activities was NT$68,481 million, primarily due to cash used to purchase equipment at our fabs
amounting to NT$60,504 million and acquire financial assets of NT$5,032 million.
Financing Activities
In 2017, net cash provided by financing activities was NT$9,162 million (US$309 million), primarily due to the increase in bank
loans of NT$10,277 million (US$347 million) and the net increase from bonds issue and redemption of NT$6,200 million (US$209
million), partially offset by NT$6,103 million (US$206 million) for cash dividend payment.
54

In 2016, net cash provided by financing activities was NT$38,795 million, primarily due to the increase in bank loans of
NT$32,134 million and other financial liabilities of NT$15,979 million, partially offset by NT$6,907 million for cash dividend
payment.
In 2015, net cash provided by financing activities was NT$15,049 million, primarily due to proceeds from bonds issued of
NT$18,425 million and increase in other financial liabilities of NT$6,108 million, partially offset by NT$6,939 million for cash
dividend payment.
We had NT$25,446 million (US$858 million) in outstanding short-term loans as of December 31, 2017. We had total availability
under existing short-term lines of credit of NT$62,057 million (US$2,094 million) as of December 31, 2017.
We had bonds payable of NT$48,518 million (US$1,637 million) in the aggregate as of December 31, 2017.
As of December 31, 2017, our outstanding long-term debts primarily consisted of NT$973 million (US$33 million) unsecured and
NT$1,549 million (US$52 million) secured long-term bank loans due in 2018, NT$599 million (US$20 million) unsecured and
NT$1,529 million (US$52 million) secured long-term bank loans due in 2019, NT$349 million (US$12 million) unsecured and
NT$3,772 million (US$127 million) secured long-term bank loans due in 2020, NT$100 million (US$3 million) unsecured and
NT$3,765 million (US$127 million) secured long-term bank loans due in 2021, NT$7,515 million (US$253 million) secured long-term
bank loans due in 2022, and NT$12,018 million (US$405 million) secured long-term bank loans due in 2023 and thereafter. The interest
rates of our long-term bank loans range from 0.99% to 4.66%.
As of December 31, 2017, the current portion of bonds due within one year was NT$24,842 million (US$838 million), and the
current portion of long-term bank loans due within one year was NT$2,522 million (US$85 million).
Capital Expenditures
We continue to maintain high levels of capital expenditures as we believe there are promising opportunities for 28-nanometer and
40-nanometer technologies. We continue to devote most of our capital expenditure to improvement of advanced technology within
12-inch fabs. As a result, we have entered into several construction contracts for the expansion of our factory space in Taiwan and
China. As of December 31, 2017, these construction contracts amounted to NT$3,732 million (US$126 million) and the portion of the
contracts not yet recognized was approximately NT$601 million (US$20 million). In 2015, 2016 and 2017, we incurred capital
expenditures of approximately NT$60,504 million, NT$91,561 million and NT$44,236 million (US$1,492 million), respectively,
primarily to purchase equipment for research and development and production purposes. We will focus on our addressable markets (i.e.,
40 and 28-nanometer) and continue to build up our production capacity. We believe our 28-nanometer technology progress will propel
our advanced process growth, strengthen our future competitiveness, and enhance our portfolio of comprehensive foundry solutions
available to our customers.
We believe that our existing cash and cash equivalents and short-term investments will be sufficient to meet our working capital
and capital expenditure requirements at least through the end of 2018. Due to rapid changes in technology in the semiconductor
industry, however, we have frequent demand for investment in new manufacturing technologies. We cannot assure you that we will be
able to raise additional capital, should that become necessary, on terms acceptable to us, or at all. If financing is not available on terms
acceptable to us, management intends to reduce expenditures so as to delay the need for additional financing. To the extent that we do
not generate sufficient cash flows from our operations to meet our cash requirements, we may rely on external borrowings and
securities offerings to finance our working capital needs or our future expansion plans. The sale of additional equity or equity-linked
securities may result in additional dilution to our stockholders. Our ability to meet our working capital needs from cash flow from
operations will be affected by the demand for our products and change in our product mix, which in turn may be adversely affected by
several factors. Many of these factors are beyond our control, such as economic downturns and declines in the average selling price of
our products. The average selling price of our products have been subjected to downward pressure in the past and are reasonably likely
to be subject to further downward pressure in the future. We have not historically relied on, and we do not plan to rely on in the
foreseeable future, off-balance sheet financing arrangements to finance our operations or expansion.
55

Transactions with Related Parties
See “Item 7. Major Stockholders and Related Party Transactions—B. Related Party Transactions” and Note 7 to our audited
consolidated financial statements included in this annual report.
Inflation/Deflation
We do not believe that inflation in the R.O.C. has had a material impact on our results of operations.
C. Research, Development, Patents and Licenses, Etc.
The semiconductor industry is characterized by rapid changes in technology, frequently resulting in obsolescence of process
technologies and products. As a result, effective research and development is essential to our success. We invested approximately
NT$12,175 million, NT$13,532 million and NT$13,669 million (US$461 million) in 2015, 2016 and 2017, respectively, in research and
development, which represented 8.4%, 9.2% and 9.2%, respectively, of net operating revenues for such years. We believe that our
continuous spending on research and development will help us maintain our position as a technological leader in the foundry industry.
As of December 31, 2017, we employed 1,909 professionals in our research and development division.
Our current research and development activities seek to upgrade and integrate manufacturing technologies and processes, as well
as to drive 14 nanometer technology in mass production with EUV (Extreme Ultraviolet) lithography, and FinFET (Fin Field-Effect
Transistor). Although we emphasize firm-wide participation in the research and development process, we maintain central research and
development teams primarily responsible for developing cost-effective technologies that can serve the manufacturing needs of our
customers. Monetary incentives are provided to our employees if projects result in successful patents. We believe we have a strong
foundation in research and development and intend to continue our efforts on technology developments. Our top management believes
in the value of continued support of research and development efforts and intends to continue our foundry leadership position by
providing customers with comprehensive technology and SoC solutions in the industry.
D. Trend Information
Please refer to “Item 5. Operating and Financial Review and Prospects—Overview” for a discussion of the most significant recent
trends in our production, sales, costs and selling prices. In addition, please refer to discussions included in this Item for a discussion of
known trends, uncertainties, demands, commitments and events that we believe are reasonably likely to have a material effect on our
net operating revenues, income from continuing operations, profitability, liquidity or capital resources, or that would cause reported
financial information not necessarily to be indicative of future operating results or financial condition.
E. Off-balance Sheet Arrangements
We do not generally provide letters of credit to, or guarantees for, or engage in any repurchase financing transactions with any
entity other than our consolidated subsidiaries. We have in the past, from time to time, entered into foreign currency forward contracts
to hedge our existing assets and liabilities denominated in foreign currencies and identifiable foreign currency purchase commitments.
We do not engage in any speculative activities using derivative instruments. See “Item 11. Quantitative and Qualitative Disclosure
About Market Risk.”
F. Tabular Disclosure of Contractual Obligations
The following table sets forth our contractual obligations and commitments with definitive payment terms on a consolidated basis
which will require significant cash outlays in the future as of December 31, 2017.
56

Payments Due by Period
Total
Less than
1 Year 1-3 Years 4-5 Years
After
5 Years
(in NT$ millions)
Long-term debt (1)
Unsecured bonds 49,396 7,500 23,196 10,200 8,500
Long-term loans 32,169 2,522 6,249 11,380 12,018
Operating lease obligations (2) 4,738 363 680 632 3,063
Purchase obligations (3) 5,442 1,114 1,013 663 2,652
Other long-term obligations (4) 23,287 579 340 21 22,347
Total contractual cash obligations 115,032 12,078 31,478 22,896 48,580
(1) Assuming the domestic bonds are paid off upon maturity.
(2) Represents our obligations to make lease payments to use machineries, equipment and land on which our fabs are located,
primarily in the Hsinchu Science Park and the Tainan Science Park in Taiwan, Pasir Ris Wafer Fab Park in Singapore.
(3) Represents commitments for purchase of raw materials and construction contracts. These commitments are not recorded on our
balance sheet as of December 31, 2017.
(4) Represents intellectual properties and royalties payable under our technology license agreements and the financial liability for the
repurchase of other investors’ investment. The amounts of payments due under these agreements are determined based on fixed
contract amounts.
G. Safe Harbor
See “Forward-Looking Statements in This Annual Report May Not Be Realized.”
ITEM 6. DIRECTORS, SENIOR MANAGEMENT AND EMPLOYEES
A. Directors and Senior Management
The following table sets forth the name, age, position, tenure and biography of each of our directors and executives as of
March 31, 2018. There is no family relationship among any of these persons.
The business address of our directors and executive officers is the same as our registered address.
Name Age Position
Year(s)
with Us
Stan Hung 57 Chairman, Director and Chief Strategy Officer 26
Jason Wang 55 Co-president and Director (Representative of Silicon Integrated Systems Corp.) 10
Shan-Chieh Chien 60 Co-president and Director (Representative of UMC Science and Culture Foundation) 29
Ting-Yu Lin 56 Director 12
Chung-Laung Liu (1) 84 Independent Director 12
Cheng-Li Huang (1) 69 Independent Director 9
Wenyi Chu (1) 51 Independent Director 3
Chitung Liu 52 Director, Chief Financial Officer and Vice President 17
(1) Member of the Audit Committee.
Stan Hung is a director, chief strategy officer and the chairman of our company. Mr. Hung was our chief financial officer and
senior vice president from 2000 to 2007. He was also the Chairman of Epitech Technology Corporation in 2007 and ITE Technology
Corporation for a portion of 2008, respectively. Prior to re-joining United Microelectronics Corporation in 1991, Mr. Hung was a
financial manager at Optoelectronics Corporation. He is also the Chairman of Fortune Venture Capital Corporation, TLC Capital Co.
Ltd., UMC New Business Investment Corporation, Faraday Technology Corporation, and a Director of Triknight Capital Corporation
and Altek Corporation. Mr. Hung received a bachelor’s degree in accounting from Tam Kang University in 1982.
57

Jason Wang is a director of our company and has been our co-president since June 2017. Mr. Wang is a representative of Silicon
Integrated Systems Corp. and also serves on the board of directors of UMC GROUP (USA) since 2004. Mr. Wang joined UMC as Vice
President of Corporate Marketing in 2008, and from 2009 to 2014, served as President of UMC GROUP (USA) responsible for
business operation efficiency enhancement and UMC North America strategic business development. Mr. Wang is also a director of
Fortune Venture Capital Corporation, TLC Capital Co., Ltd., UMC New Business Investment Corporation, Wavetek Microelectronics
Corporation, United Microelectronics (Europe) B.V., UMC Capital Corp., UMC Capital (USA), United Microtechnology Corporation
(New York), United Microtechnology (California) and Sino Paragon Limited. Mr. Wang did his undergraduate study in Business
Administration at San Jose State University.
Shan-Chieh Chien is a director of our company and has been our co-president since June 2017. Mr. Chien is a representative of
UMC Science and Culture Foundation and he is also a director of Fortune Venture Capital Corporation, TLC Capital Co., UMC New
Business Investment Corp., United Semiconductor (XIAMEN) Co., Ltd., Wavetek Microelectronics Corporation, Epistar Corp. and
UMC Capital Corp. Mr. Chien received a bachelor’s degree in chemical engineering from National Taiwan University.
Ting-Yu Lin is a director of our company. Mr. Lin is also the chairman of Sunrox International Inc. Mr. Lin received a master’s
degree in international finance from Meiji University in 1993.
Chung-Laung Liu is an independent director of our company. Professor Liu is the William M.W. Mong Honorary Chair
Professor of National Tsing Hua University, Taiwan. Professor Liu is also the Chairman of TrendForce Corp., a supervisor of Andes
Technology Corporation, an independent director of Microelectronics Technology Inc., Powerchip Semiconductor Corp., Far EasTone
Telecommunications., and United BioPharma Inc., as well as a director of Macronix International Co., Ltd. Professor Liu received a
doctorate degree in science from Massachusetts Institute of Technology in 1962.
Cheng-Li Huang is an independent director of our company. Dr. Huang was a professor of Tamkang University and served as its
Comptroller. He was also the chief executive of Tamkang Accounting Education Foundation and the publisher of Journal of
Contemporary Accounting. Professor Huang received a Ph.D. degree in accounting from University of Warwick in 1999.
Wenyi Chu is an independent director of our company. Professor Chu is a professor of business administration at National
Taiwan University. Professor Chu was the chairwoman of Graduate Institute of Business Administration and Department of Business
Administration in National Taiwan University from 2012 to 2014. Professor Chu received a Ph.D. degree in Strategy and International
Management from London Business School, United Kingdom in 1997.
Chitung Liu is a director, the chief financial officer and vice president of our company. Prior to joining our company in 2001,
Mr. Liu was a managing director of UBS. Mr. Liu is a representative of Hsun Chieh Investment Co. and he is also a director of UMC
New Business Investment Corporation, Unimicron Corporation, Novatek Microelectronic Corp., UMC Group (USA), Green Earth
Limited, ECP Vita Pte. Ltd., Omni Global Limited, UMC Capital Corp., United Microchip Corporation, UMC Technology Japan Co.,
Ltd., Sino Paragon Limited and Mie Fujitsu Semiconductor Limited. Mr. Liu received an executive MBA degree from National Taiwan
University in 2009.
B. Compensation
The aggregate compensation paid and benefits in kind granted to our directors in 2017 were approximately NT$32.4 million
(US$1.1 million). The remuneration was out of our 2017 earnings distribution plan, and the distribution percentage for directors is
0.3%. See “Item 10. Additional Information—B. Memorandum and Articles of Association—Dividends and Distributions”. Some of
the remuneration was paid to the legal entities that certain directors represent. The aggregate compensation paid and benefits in kind
granted to our executive officers in 2017 were approximately NT$194.4 million (US$6.6 million), which include NT$36.4 million
(US$1.2 million) as bonus. Certain of our directors who also served as executive officers held stock options, however, all stock options
expired on June 18, 2015.
58

C. Board Practices
All of our directors were elected in June 2015 for a term of three years except for Mr. Shan-Chieh Chien and Mr. Chitung Liu.
Mr. Shan-Chieh Chien was reassigned as a juristic-person director by the UMC Science and Culture Foundation in March 2016 and will
serve for a term of three years. Mr. Chitung Liu was reassigned as a juristic-person director by Hsun Chieh Investment Co., in
September 2017 and will serve for a term of three years. Neither we nor any of our subsidiaries has entered into a contract with any of
our directors by which our directors are expected to receive benefits upon termination of their employment.
Audit Committee
Our board of directors established an audit committee in March 2005. In the annual general meeting held on June 13, 2008, we
amended our articles of incorporation to introduce the mechanism of an Audit Committee. See “Item 10. Additional Information—B.
Memorandum and Articles of Association—Directors”. After the re-election of directors in the stockholders’ meeting on June 9, 2015,
our board of directors appointed Chung-Laung Liu, Chun-Yen Chang, Cheng-Li Huang and Wenyi Chu to be the members of the audit
committee. Professor Chun-Yen Chang resigned as a director on January 1, 2017. Each audit committee member is an independent
director who is financially literate with accounting or related financial management expertise. The audit committee meets as often as it
deems necessary to carry out its responsibilities. Pursuant to an audit committee charter, the audit committee has responsibility for,
among other things, overseeing the qualifications, independence and performance of our internal audit function and independent
auditors, and overseeing the accounting policies and financial reporting and disclosure practices of our company. The audit committee
also has the authority to engage special legal, accounting or other consultants it deems necessary in the performance of its duties.
Remuneration Committee
The R.O.C. Securities and Exchange Act, as amended on November 24, 2010, further introduced the mechanism of a
“Remuneration Committee”, which requires all the publicly listed companies in the R.O.C., including our company, to adopt a
remuneration committee. On March 18, 2011, R.O.C. FSC promulgated the Regulations Governing the Establishment and Exercise of
Powers by Compensation Committees of Public Companies, according to which, public listed companies of our size shall set up the
remuneration committee no later than September 30, 2011 and the remuneration committee shall be composed of no less than three
members commissioned by the board of directors. In addition, for a company with independent directors, such as us, at least one of the
remuneration committee members shall be the independent director of such company. We established a remuneration committee in
accordance with Article 14-6 of the R.O.C. Securities and Exchange Act on April 27, 2011. We amended our articles of incorporation to
implement the mechanism of our remuneration committee during the annual general meeting held on June 15, 2011. After the
re-election of directors in the annual general meeting on June 9, 2015, our board of directors appointed Chung-Laung Liu, Chun-Yen
Chang, Cheng-Li Huang and Wenyi Chu to be the members of the remuneration committee. Professor Chun-Yen Chang resigned as a
director on January 1, 2017.
In November 2003, the Securities and Exchange Commission approved changes to the NYSE’s listing standards related to the
corporate governance practices of listed companies. Under these rules, listed foreign private issuers, like us, must disclose any
significant ways in which their corporate governance practices differ from those followed by NYSE-listed U.S. domestic companies
under the NYSE’s listing standards. A copy of the significant differences between our corporate governance practices and NYSE
corporate governance rules applicable to U.S. companies is available on our website
http://www.umc.com/English/investors/Corp gov difference.asp.
59

Nominating Committee
Our board of directors established a nominating committee in December 2017. Our nominating committee initially consists of
Chung-Laung Liu, Cheng-Li Huang and Wenyi Chu, each of whom is an independent director. The nominating committee is to assist
the board to enhance the management mechanism and to improve corporate governance for our sustainable development. The objectives
of our nominating committee include: (i) to constitute the nomination policy and succession plans of the directors and the executives,
and to review and propose the candidate list of the directors and the executives accordingly; (ii) to construct and to develop the
operation of our board and the board committees, as well as to plan and to execute the performance assessment of the board, the board
committees and the executives, and (iii) to enhance the corporate governance system and practices in order to protect the interests of our
stakeholders.
D. Employees
As of December 31, 2017, we had 20,076 employees, which included 11,846 engineers, 7,432 technicians and 798 administrative
staff performing administrative functions on a consolidated basis. We have in the past implemented, and may in the future evaluate the
need to implement, labor redundancy plans based on the work performance of our employees.
As of December 31,
2015 2016 2017
Employees
Engineers 10,750 11,596 11,846
Technicians 6,796 7,123 7,432
Administrative Staff 843 820 798
Total 18,389 19,539 20,076
Employee salaries are reviewed annually. Salaries are adjusted based on industry standards, inflation and individual performance.
As an incentive, additional bonuses in cash may be paid at the discretion of management based on the performance of individuals. In
addition, except under certain circumstances, R.O.C. law requires us to reserve from 10% to 15% of any offerings of our new common
shares for employees’ subscription.
Our employees participate in our profit distribution pursuant to our articles of incorporation. Employees are entitled to receive
additional bonuses based on a certain percentage of our allocable surplus income. On March 7, 2018, our board of directors proposed an
employee bonus in cash in the amount of NT$1,032.3 million (US$34.8 million) in relation to retained earnings in 2017.
Our employees are not covered by any collective bargaining agreements. We believe we have a good relationship with our
employees.
E. Share Ownership
As of March 31, 2018, each of our directors and executive officers held common shares and/or ADSs of United Microelectronics,
either directly for their own account or indirectly as the representative of another legal entity on our board of directors, except for
Chung-Laung Liu, Cheng-Li Huang and Wenyi Chu, our independent directors. As of April 25, 2018, our most recent record date, Hsun
Chieh Investment Co. held approximately 441 million of our common shares, representing approximately 3.5% of our issued and
outstanding share capital. Silicon Integrated Systems Corp. held approximately 315 million of our common shares, representing
approximately 2.5% of our issued and outstanding share capital. Chairman Mr. Hung held approximately 16 million of our common
shares, representing approximately 0.13% of our issued and outstanding share capital. Ting-Yu Lin held approximately 13 million of
our common shares, representing approximately 0.1% of our issued and outstanding share capital.
60

We have adopted employee stock option plans in the past, pursuant to which options may be granted to our full-time regular
employees, including those of our domestic and overseas subsidiaries. The exercise price for the options would be the closing price of
our common shares on the Taiwan Stock Exchange on the day the options are granted, while the expiration date for such options is six
years from the date of its issuance. The 300 million stock options with an exercise price of NT$10.4 that we granted in June 2009
expired on June 18, 2015. All stock options we previously granted had expired.
According to our Employee Stock Options Plan, an option holder may exercise an increasing portion of his or her options starting
two years after the grant of the options. According to the vesting schedule, 50%, 75% and 100% of such option holder’s options shall
vest two, three and four years after the grant of the options, respectively. Upon a voluntary termination or termination in accordance
with the R.O.C. Labor Law, the option holder shall exercise his or her vested options within 30 days, subject to exceptions provided
therein, and after the termination otherwise such options shall terminate. If termination was due to death, the heirs of such option holder
have one year starting from the date of the death to exercise his or her vested options. If termination was due to retirement or
occupational casualty, the option holder or his or her heirs may exercise all his or her options within a certain period as provided. The
options are generally not transferable or pledgeable by the option holders. The common shares issuable upon exercise of option held by
our directors and executive officers expired on June 18, 2015.
ITEM 7. MAJOR STOCKHOLDERS AND RELATED PARTY TRANSACTIONS
A. Major Stockholders
The following table sets forth information known to us with respect to the beneficial ownership of our common shares as of
(i) April 25, 2018, our most recent record date, and (ii) as of certain record dates in each of the preceding three years, for (1) the
stockholders known by us to beneficially own more than 2% of our common shares and (2) all directors and executive officers as a
group. Beneficial ownership is determined in accordance with Securities and Exchange Commission rules.
As of April 9,
2016
As of April 10,
2017 As of April 25, 2018
Number of
common shares
beneficially owned
Number of
common shares
beneficially owned
Number of
common shares
beneficially owned
Number of
common shares
beneficially owned
Name of Beneficial Owner
Hsun Chieh Investment Co.,
Ltd. (1)
3.46% 3.50% 441,371,000 3.50%
Silicon Integrated Systems Corp. 2.47% 2.50% 315,380,424 2.50%
Directors and executive officers
as a group
6.28% 6.33% 797,980,721 6.32%
(1) 36.49% owned by United Microelectronics Corporation as of March 31, 2018.
None of our major stockholders have different voting rights from those of our other stockholders. To the best of our knowledge,
we are not directly or indirectly controlled by another corporation, by any foreign government or by any other natural or legal person
severally or jointly.
For information regarding our common shares held or beneficially owned by persons in the United States, see “Item 9. The Offer
and Listing—A. Offer and Listing Details—Market Price Information for Our American Depositary Shares” in this annual report.
B. Related Party Transactions
From time to time we have engaged in a variety of transactions with our affiliates. The sales and purchase prices with related
parties are determined through mutual agreement in reference to market conditions.
61

The following table shows our aggregate ownership interest, on a consolidated basis, in major related fabless design companies
that we enter into transactions from time to time as of December 31, 2017.
Name Ownership %
Silicon Integrated Systems Corp. 19.70
Faraday Technology Corp. 13.78
We provide foundry services to this fabless design company and the sales price was determined through mutual agreement in
reference to market conditions. We derived NT$1,140 million, NT$1,963 million and NT$1,388 million (US$47 million) of our net
operating revenues in 2015, 2016 and 2017, respectively, from the provision of our foundry services. For more information, please refer
to Note 7 to our audited consolidated financial statements included in this annual report.
C. Interests of Experts and Counsel
Not applicable.
ITEM 8. FINANCIAL INFORMATION
A. Consolidated Statements and Other Financial Information
Please refer to Item 18 for a list of all financial statements filed as part of this annual report on Form 20-F.
Legal and Administrative Proceedings
We may, from time to time, become a party to various legal or administrative proceedings arising in the ordinary course of our
business.
On August 31, 2017, the Taichung District Prosecutors Office indicated that we had violated the Trade Secret Act of the R.O.C.,
alleging that our employees misappropriated the trade secrets of Micron Technology Inc., or Micron. The case is currently in progress.
We intend to defend vigorously against this allegation and have engaged attorneys to defend the case.
On December 5, 2017, Micron filed a civil action with similar cause against us with the United States District Court, Northern
District of California. Micron claimed entitlement to the actual damages, treble damages and relevant fees and requested the court to
issue an order that enjoins us from using its trade secrets in question. The case is currently in progress.
On January 12, 2018, we filed three patent infringement actions with the Fuzhou Intermediate People’s Court against, among
others, Micron (Xi’an) Co., Ltd. and Micron (Shanghai) Trading Co., Ltd., requesting the court to order the defendants to stop
manufacturing, processing, importing, selling, and committing to sell the products deploying the infringing patents in question, and also
to destroy all inventories and related molds and tools. The case is currently pending the defendants’ response.
Other than the abovementioned legal proceedings, we are not currently involved in any material litigation or other proceedings
that may have, or have had in the recent past, significant effects on our financial position or profitability.
62

Dividend Policy
As for our policy on dividend distributions, see “Item 10. Additional Information—B. Memorandum and Articles of
Association—Dividends and Distributions”. On June 9, 2015, our stockholders approved a cash distribution of NT$0.55 per common
share for an aggregate of NT$6,939,321,835. On June 24, 2015, our board of directors resolved to adjust the cash dividend ratio to
NT$0.54969673 per common share because the number of outstanding common shares had changed as a result of the exercise of
employee stock options and our repurchase of treasury common shares. On June 8, 2016, our stockholders approved a cash distribution
of NT$0.55 per common share for an aggregate of NT$6,906,973,103. On June 15, 2016, our board of directors resolved to adjust the
cash dividend ratio to NT$0.56501906 per common share because the number of outstanding common shares had changed as a result of
our repurchase and cancellation of treasury common shares. On June 8, 2017, our stockholders approved a cash distribution of NT$0.50
per common share for an aggregate of NT$6,112,159,358. On March 7, 2018, our board of directors proposed dividends of
NT$8,557,023,101 (approximately NT$0.70 per common share) which are expected to be approved at our annual general meeting on
June 12, 2018.
The following table sets forth the cash dividends per share and stock dividends per share as a percentage of common shares
outstanding paid during each of the years indicated in respect of common shares outstanding at the end of each such year, except as
otherwise noted.
Cash Dividend
per Share
Stock Dividend
per Share
Total Number of
Common Shares
Issued as Stock
Dividend
Number of
Outstanding
Common Shares
at Year End
NT$ NT$
1997 — 3.0 868,629,276 4,117,758,265
1998 — 2.9 1,199,052,940 5,480,221,725
1999 — 1.5 834,140,790 6,638,054,462
2000 — 2.0 1,809,853,716 11,439,016,900
2001 — 1.5 1,715,104,035 13,169,235,416
2002 — 1.5 1,968,018,212 15,238,578,646
2003 — 0.4 607,925,145 15,941,901,463
2004 — 0.8 1,288,558,185 17,550,800,859
2005 0.1029 1.029 1,758,736,435 18,856,632,324
2006 0.409141420 0.10228530 179,031,672 19,131,192,690
2007 0.7 — — 13,214,494,883
2008 0.75 0.45 562,958,816 12,987,771,315
2009 — — — 12,987,771,315
2010 0.5 — — 12,987,912,315
2011 1.11164840 — — 13,084,341,565
2012 0.49980232 — — 12,951,805,540
2013 0.40639654 — — 12,692,081,665
2014 0.50 — — 12,725,207,790
2015 0.54969673 — — 12,758,132,915
2016 0.56501906 — — 12,624,318,715
2017 0.50 — — 12,624,318,715
(1) We declare stock dividends in an NT dollar amount per share, but we pay the stock dividends to our stockholders in the form of
common shares. The amount of common shares distributed to each stockholder is calculated by multiplying the dividend declared
by the number of common shares held by the given stockholder, divided by the par value of NT$10 per share. Fractional common
shares are not issued but are paid in cash.
B. Significant Changes
For the significant subsequent events following the close of the last financial year up to the date of this annual report on
Form 20-F, please refer to Note 10 to our audited consolidated financial statements included elsewhere in this annual report.
63

ITEM 9. THE OFFER AND LISTING
A. Offer and Listing Details
Market Price Information for Our Common Shares Our common shares have been listed on the Taiwan Stock Exchange since July
1985. There is no public market outside Taiwan for our common shares. The table below shows, for the periods indicated, the high and
low closing prices and the average daily volume of trading activity on the Taiwan Stock Exchange for our common shares. The closing
price for our common shares on the Taiwan Stock Exchange on April 25, 2018 was NT$15.50 per share.
High Low
Average Daily
Trading Volume
NT$ NT$ (in thousands of shares)
2013 12.40 10.90 41,684.47
2014 16.50 12.00 55,017.35
2015 16.05 10.05 49,605.91
2016 13.45 11.05 29,448.00
First Quarter 13.45 11.05 35,802.67
Second Quarter 13.15 11.25 33,939.22
Third Quarter 12.95 11.40 30,259.64
Fourth Quarter 11.75 11.20 18,721.40
2017 16.50 11.30 52,740.00
First Quarter 12.75 11.30 35,239.54
Second Quarter 14.75 11.85 47,578.88
Third Quarter 16.50 13.40 84,644.13
Fourth Quarter 16.15 14.05 39,944.53
October 15.95 15.15 47,770.55
November 16.15 15.25 42,644.94
December 15.70 14.05 30,034.85
2018 (through April 25) 15.85 13.85 50,203.92
First Quarter 15.55 13.85 54,024.97
January 14.75 14.00 56,235.16
February 14.55 13.85 64,791.35
March 15.55 13.90 45,825.53
Second Quarter (through April 25) 15.85 15.25 35,429.18
April (through April 25) 15.85 15.25 35,429.18
Source: Taiwan Stock Exchange.
Market Price Information for Our American Depositary Shares
Our ADSs have been listed on the NYSE under the symbol “UMC” since September 19, 2000. The outstanding ADSs are
identified by the CUSIP number 910873 40 5. The table below shows, for the periods indicated, the high and low closing prices and the
average daily volume of trading activity on the NYSE for our ADSs. The closing price for our ADSs on the New York Stock Exchange
on April 25, 2018 was US$2.61 per ADS. Each of our ADSs represents the right to receive five common shares.
High Low
Average Daily
Trading Volume
US$ US$ (in ADSs)
2013 2.43 1.77 1,862,883
2014 2.58 1.95 1,043,726
2015 2.54 1.61 1,054,206
2016 2.14 1.66 916,311
First Quarter 2.14 1.66 1,011,631
Second Quarter 2.13 1.75 840,578
Third Quarter 2.09 1.82 925,959
Fourth Quarter 1.92 1.75 840,578
2017 2.71 1.76 1,736,511
First Quarter 2.04 1.76 1,657,901
Second Quarter 2.44 1.89 2,156,303
64

High Low
Average Daily
Trading Volume
US$ US$ (in ADSs)
Third Quarter 2.71 2.21 2,013,218
Fourth Quarter 2.69 2.36 1,117,375
October 2.65 2.51 1,300,575
November 2.69 2.53 800,919
December 2.62 2.36 1,248,133
2018 (through April 25) 2.73 2.33 1,050205
First Quarter 2.73 2.33 1,111,572
January 2.52 2.38 1,061,114
February 2.49 2.33 1,040,163
March 2.73 2.39 1,271,638
Second Quarter (through April 25) 2.64 2.53 842,237
April (through April 25) 2.64 2.53 842,237
Sources: Thomson One
As of March 31, 2018, there were a total of 144,260,108 ADSs listed on the NYSE. With certain limited exceptions, holders of
common shares that are not R.O.C. persons are required to hold these common shares through a brokerage or custodial account in the
R.O.C. As of March 31, 2018, 721,300,540 common shares were registered in the name of a nominee of JPMorgan Chase & Co., the
depositary under the deposit agreement. JPMorgan Chase & Co. has advised us that, as of March 31, 2018, 144,244,257 ADSs
representing these 721,221,285 common shares were held of record by Cede & Co., and 15,851 ADSs were held by U.S. registered
stockholders. We have no further information as to common shares held or beneficially owned by U.S. persons.
B. Plan of Distribution
Not applicable.
C. Markets
The principal trading markets for our common shares are the Taiwan Stock Exchange and the New York Stock Exchange, on
which our common shares trade in the form of ADSs.
D. Selling Stockholders
Not applicable.
E. Dilution
Not applicable.
F. Expenses of the Issue
Not applicable.
ITEM 10. ADDITIONAL INFORMATION
A. Share Capital
Not applicable.
B. Memorandum and Articles of Association
65

The following statements summarize the material elements of our capital structure and the more important rights and privileges of
stockholders conferred by the R.O.C. law and our articles of incorporation.
Objects and Purpose
The scope of business of United Microelectronics as set forth in Article 2 of our articles of incorporation, includes (i) integrated
circuits; (ii) semiconductor parts and components; (iii) parts and components of microcomputers, microprocessors, peripheral support
and system products; (iv) parts and components of semiconductor memory systems products; (v) semiconductor parts and components
for digital transceiver product and system products; (vi) semiconductor parts and components for telecom system and system products;
(vii) testing and packaging of integrated circuits; (viii) mask production; (ix) metals, derived fuels and chemical products generated
simultaneously from our manufacturing process; (x) management consulting service in regard to sustainable development,
energy/resources conservation technologies and semiconductor fab related affairs; (xi) clearance, recycle and disposal of waste and
manufacturing outputs; research and development, design, production, sales, promotion and after-sale services related to our business;
and (xii) export/import trade related to our business.
Directors
The R.O.C. Company Act and our articles of incorporation provide that our board of directors is elected by stockholders and is
responsible for the management of our business. As of March 31, 2018, our board of directors consisted of eight directors, out of which
three are independent directors. In the annual general meeting held on June 11, 2007, we amended our articles of incorporation to
abolish the managing director mechanism. In the annual general meeting held on June 13, 2008, we amended our articles of
incorporation to introduce the mechanism of an Audit Committee. The Chairman presides at all meetings of our board of directors, and
also has the authority to represent our company. The term of office for our directors is three years, and our directors are elected by our
stockholders by means of cumulative voting. The amendment to our articles of incorporation on June 11, 2007 also adopts a nomination
system which provides that holders of one percent or more of the issued and outstanding shares of our company would be entitled to
submit a roster of candidates to be considered for nomination to our company’s board of directors at an annual general meeting
involving the election of directors. Pursuant to the R.O.C. Company Act, entity that owns our common shares may be elected as a
director, in which case a natural person must be designated to act as the legal entity’s representative. A legal entity that is our
stockholder may designate its representative to be elected as our director on its behalf. In the event several representatives are
designated by the same legal entity, any or all of them may be elected. A director who serves as the representative of a legal entity may
be removed or replaced at any time at the discretion of such legal entity, and the replacement director may serve the remainder of the
term of office of the replaced director. As of March 31, 2018, three of our eight directors are representatives of other legal entities, as
shown in “Item 6. Directors, Senior Management and Employees—A. Directors and Senior Management.”
According to the R.O.C. Company Act and the rules promulgated under the R.O.C. Securities and Exchange Act, a director who
has a personal interest in a matter to be discussed at the meeting of the board of directors, shall explain the essential contents of such
personal interest in the meeting of the board of directors. In case that such personal interest may impair the interests of us, such director
shall abstain from joining the discussion and voting on such matter. In case that such director is the representative designated by a legal
entity stockholder to be elected as our director and such legal entity stockholder has personal interest in the matter to be discussed at the
meeting of the board of directors, the rules provided in the preceding two sentences shall also apply. Our articles of incorporation, as
amended on June 13, 2008, provide that our board of directors is authorized, by taking into account of the extent of his/her/its
involvement of our operation activities and the value of his/her/its contribution, to determine the compensation for each director at a
comparable rate adopted by other companies of the same industry regardless of the profit received by our company. In addition,
according to our articles of incorporation, we may distribute 0.1% of the balance of our earnings after deduction of payment of all taxes
and dues, deduction of any past losses, allocation of 10% of our net income as a legal reserve, and allocation of special reserve
according to applicable laws and regulations or the order of the competent authority, if any, as remuneration to directors. However, the
R.O.C. Company Act has been amended in May 2015, which changed the distribution mechanism of director remuneration. Please refer
to “—Dividends and Distributions” in this item below for more details. Our articles of incorporation do not impose a mandatory
retirement age limit for our directors. Furthermore, our articles of incorporation do not impose a shareholding qualification for each
director, while the laws and regulations require the aggregate shareholding of all directors, excluding independent directors, to meet
certain thresholds considering the paid-in capital and the numbers of the independent directors. According to our current internal Loan
Procedures, we shall not extend any loan to our directors.
66

In order to strengthen corporate governance of companies in Taiwan, effective from January 1, 2007, the amended R.O.C.
Securities and Exchange Act authorizes the R.O.C. FSC, after considering certain factors, including the scale, shareholding structure
and business nature of a public company, to require that a public company, such as our company, meet certain criteria, including having
at least two independent directors but not less than one fifth of the total number of directors.
In addition, pursuant to the amended R.O.C. Securities and Exchange Act, a public company is required to either establish an audit
committee, or R.O.C. Audit Committee, or retain supervisors, provided that the R.O.C. FSC may, after considering the scale and
business nature of a public company and other necessary situation, require the company to establish an audit committee in place of its
supervisors. We have amended our articles of incorporation in the annual general meeting held on June 13, 2008, introducing the
mechanism of an R.O.C. Audit Committee. On February 20, 2013, the R.O.C. FSC has ruled that a public company with certain scale or
of certain business nature, including us, shall establish an R.O.C. Audit Committee instead of the supervisors. According to our latest
amended articles of incorporation and audit committee charter, our R.O.C. Audit Committee is composed of all independent directors
and performs the power and duties provided by applicable laws and regulations, including without limitation the powers and the duties
of supervisors provided under the R.O.C. Company Act. A company is not allowed to maintain both supervisors and a R.O.C. Audit
Committee, so we chose to eliminate our supervisors when we established our R.O.C. Audit Committee in 2009.
According to our current articles of incorporation, we may purchase directors and officers liability insurance for our directors,
covering the liabilities incurred in relation to his/her/its operation of business and legally responsible for.
Common Shares
As of December 31, 2017, our authorized share capital was NT$260 billion, divided into 26 billion common shares, of which
12,624,318,715 common shares were issued and outstanding. All common shares presently issued are fully paid and in registered form,
and existing stockholders are not subject to any capital calls. We do not have any outstanding warrants or option to purchase our
common shares.
Employee Stock Option
According to our Employee Stock Options Plan, options may be granted to our full-time regular employees, including those of our
domestic and overseas subsidiaries. Since 2004 to 2009, we obtained approvals by relevant R.O.C. authorities to grant up to an
aggregate of 1,500 million stock options to acquire our common shares under our Employee Stock Option Plan. According to the plan,
an option holder may exercise an increasing portion of his or her options in time starting two years after the grant of the options.
According to the vesting schedule, 50%, 75% and 100% of such option holder’s options shall vest two, three and four years after the
grant of the options, respectively. All employee stock options expired on June 18, 2015.
New Common Shares and Preemptive Rights
New common shares may only be issued with the prior approval of our board of directors. If our issuance of any new common
shares will result in any change in our authorized share capital, we are required under R.O.C. law to amend our articles of incorporation
and obtain approval of our stockholders in a stockholders’ meeting. We must also obtain the approval of, or submit a registration with,
the R.O.C. FSC and the Science Park Administration. According to the R.O.C. Company Act, when a company issues capital stock for
cash, 10% to 15% of the issue must be offered to its employees. In addition, if a listed company intends to offer new common shares for
cash, at least 10% of the issue must also be offered to the public. This percentage can be increased by a resolution passed at a
stockholders’ meeting, which will reduce the number of new common shares in which existing stockholders may have preemptive
rights. Unless the percentage of the common shares offered to the public is increased by a resolution, existing stockholders of the
company have a preemptive right to acquire the remaining 75% to 80% of the issue in proportion to their existing shareholdings.
According to the Corporate Merger and Acquisition Act of the R.O.C., as effective on February 8, 2002 and amended on May 5, 2004
and July 8, 2015 which took effect on January 8, 2016, if new common shares issued by our company are solely for the purpose of
merger, acquisition, share swap or spin-off, the above-mentioned restrictions, including the employee stock ownership plan, the
preemptive rights of the existing stockholders and the publicity requirement of a listed company, to such issuance of new common
shares may not be applied.
67

Stockholders
We only recognize persons registered in our register as our stockholders. We may set a record date and close our register of
stockholders for specified periods to determine which stockholders are entitled to various rights pertaining to our common shares.
Transfer of Common Shares
Under the R.O.C. Company Act, a public company, such as our company, may issue individual share certificates, one master
certificate or no certificate at all, to evidence common shares. Our articles of incorporation, as amended on June 13, 2008, provide that
we may deliver common shares in book-entry form instead of by means of issuing physical share certificates. We have issued our
common shares in uncertificated/scripless form since 2007. Therefore, the transfer of our common shares is carried out on the book-
entry system. The settlement of trading of our common shares is normally carried out on the book-entry system maintained by the
Taiwan Depository and Clearing Corporation. Transferees must have their names and addresses registered on our register in order to
assert stockholder’s rights against us. Our stockholders are required to file their respective specimen seals with our share registrar,
Horizon Securities Co., Ltd.
Stockholders’ Meetings
We are required to hold an annual ordinary stockholders’ meeting once every calendar year within six months from the end of
each fiscal year. Our board of directors may convene an extraordinary meeting whenever the directors deem necessary, and they must
do so if requested in writing by stockholders holding no less than 3% of our issued common shares who have held these common shares
for more than a year. At least 15 days’ advance written notice must be given of every extraordinary stockholders’ meeting and at least
30 days’ advance written notice must be given of every annual ordinary stockholders’ meeting. Unless otherwise required by law or by
our articles of incorporation, voting for an ordinary resolution requires an affirmative vote of a simple majority of those present. A
distribution of cash dividends would be an example of an ordinary resolution. The R.O.C. Company Act and, in the case of certain
merger and acquisition deals, the Corporate Merger and Acquisition Act, also provides that in order to approve certain major corporate
actions, including any amendment of our articles of incorporation, dissolution, merger or spin-off, share swap, entering into,
amendment, or termination of any contract for lease of the company’s business in whole, or for entrusted business, or for joint operation
with others, on regular basis, the transfer of all or an essential part of the business or assets, accept all of the business or assets of any
other company which would have a significant impact on our operations, removing directors or the distribution of dividend in stock
form, a special resolution shall be adopted by the holders of the majority of our common shares represented at a stockholders’ meeting
at which holders of at least two-thirds of our issued and outstanding common shares are present; provided that, in the case of a public
company, such as our company, such resolution may be adopted by the holders of at least two-thirds of the common shares represented
at a stockholders’ meeting at which holders of at least a majority of our issued and outstanding common shares are present; provided,
further, that in the case of merger, spin-off, transfer of all or essential part of business or asset, or share swap which meets the specific
criteria provided under the Corporate Merger and Acquisition Act, such as short-form merger/spin-off/share swap or whale-minnow
merger/spin-off/share-swap (as defined therein), such corporate action can be approved by a board resolution adopted by majority
consent at a meeting with at least two-thirds of our directors present without stockholders’ approval. Notwithstanding the foregoing, in
the event such transaction will result in our delisting, the approval from holders of at least two-thirds of our issued and outstanding
common shares is required.
68

Voting Rights
Each common share is generally entitled to one vote and no voting discount will be applied. However, treasury common shares
and our common shares held by (i) an entity in which we own more than 50% of the voting shares or paid-in capital, or (ii) a third party
in which we and an entity controlled by us jointly own, directly or indirectly, more than 50% of the voting shares or paid-in capital are
not entitled to any vote. Except as otherwise provided by law or our articles of incorporation, a resolution can be adopted by the holders
of a simple majority of the issued and outstanding common shares represented at a stockholders’ meeting. The quorum for a
stockholders’ meeting to discuss the ordinary resolutions is a majority of the issued and outstanding common shares. Pursuant to the
R.O.C Company Act amended on December 28, 2011, the election of directors by our stockholders shall be conducted by means of
cumulative voting rather than other voting mechanisms adopted in our articles of incorporation. Except as otherwise provided under
applicable laws and regulations, in all other matters, a stockholder must cast all his or her votes in the same manner when voting on any
of these matters.
Our stockholders may be represented at an ordinary or extraordinary stockholders’ meeting by proxy if a valid proxy form is
delivered to us five days before the commencement of the ordinary or extraordinary stockholders’ meeting, unless such proxy has been
revoked no later than two days before the date of the stockholders’ meeting. Voting rights attached to our common shares exercised by
our stockholders’ proxy are subject to the proxy regulation promulgated by the R.O.C. FSC.
Authorized by latest amendment of the R.O.C Company Act, the R.O.C. FSC has issued an administrative order on February 20,
2012 to require Taiwan Stock Exchange-listed companies, such as our company, and Taipei Exchange (previously known as “GreTai
Securities Market”)-listed companies in the R.O.C. with NT$10 billion or more of paid-in share capital and with 10,000 or more
stockholders as of the first date of the close period applicable to the stockholders’ meeting to adopt an e-voting system for the
stockholders’ meeting. According to the administrative order by the R.O.C. FSC, commencing from January 1, 2018, all listed
companies shall adopt the e-voting system for the stockholders’ meeting. The e-voting system provides a new platform for stockholders
to exercise their voting rights online. As a company that meets the foregoing criteria, we have successfully adopted the e-voting system
in the 2012 stockholders’ meeting and voted by poll on each agenda item for discussion.
Any stockholder who has a personal interest in a matter to be discussed at our stockholders’ meeting, the outcome of which may
impair our interests, shall not vote or exercise voting rights on behalf of another stockholder on such matter.
According to the R.O.C. Company Act amended on January 4, 2012, a stockholder of a public company who holds common
shares for others, such as a depositary, may choose to exercise his/her/its voting power separately. On April 13, 2012, R.O.C. FSC
promulgated the Regulations Governing the Split Voting of the Stockholders and Compliance Matters for Public Companies, the
implementation rules of such split voting method, which stipulates that the depository of the overseas depositary receipts may exercise
its voting power separately in accordance with the instructions of the respective holders of the ADS. Notwithstanding the foregoing,
before any amendment to the currently effective Deposit Agreement is made, holders of our ADSs generally will not be able to exercise
voting rights on the common shares underlying their ADSs on an individual basis.
Dividends and Distributions
We are not allowed under R.O.C. law to pay dividends on our treasury common shares. We may distribute dividends on our issued
and outstanding common shares if we have earnings. Before distributing a dividend to stockholders, among other things, we must
recover any past losses, pay all outstanding taxes and set aside a legal reserve equivalent to 10% of our net income until our legal
reserve equals our paid-in capital, and a special reserve, if any.
At an annual ordinary stockholders’ meeting, our board of directors submits to the stockholders for their approval proposals for
the distribution of dividends or the making of any other distribution to stockholders from our net income or reserves for the preceding
fiscal year. Dividends are paid to stockholders proportionately. Dividends may be distributed either in cash or in common shares or a
combination of cash and common shares, as determined by the stockholders at such meeting.
69

Previously, the employee bonus and directors’ remuneration were categorized as “profit sharing” items and were calculated and
distributed based on earnings after tax basis. However, according to Articles 235 and 235-1 of the Company Act, both amended and
added on May 20, 2015, employee bonus and directors’ remuneration shall no longer be a profit sharing item but shall be calculated
based on earnings before tax and distributed as “expenses.” Our articles of incorporation currently in effect, as amended and approved
by the shareholders in the 2016 annual general meeting provide that where we make profits before tax for the annual financial year,
subject to a board resolution adopted by majority consent at a meeting with at least two-thirds of our directors present, we shall
appropriate (i) no less than 5% of such annual profits before tax as employee bonus, and (ii) a maximum of 0.1% as directors’
remunerations. The employees eligible for the distribution include our employees and employees of our subsidiaries and the form of
employee bonus may be made in stock or cash. The qualification of such employees is to be determined by our board of directors.
Notwithstanding the foregoing, if we have accumulated losses of the previous years, we shall set aside the amount of such accumulated
losses prior to the allocation of the employee bonus and the above directors’ remuneration. For the purpose of calculation of the above
employee bonus and the directors’ remunerations, such “annual profits before tax” shall be without giving effect of the deduction and
distribution of such employee bonus and the directors’ remunerations.
The remaining amount may be distributed according to the distribution plan proposed by our board of directors based on our
dividend policy, and submitted to the stockholders’ meeting for approval. Our articles of incorporation also specify that the amount
distributable as dividend shall be the sum of (x) the balance of our earnings deducted by (i) payment of all taxes and dues, (ii) deduction
of any past losses, (iii) allocation of 10% of our net income as a statutory reserve (which may be exempted if the accumulated amount
of legal reserve has amounted to our paid-in capital); and (iv) special reserve, if any, plus (y) the retained earnings of previous years. In
the annual general meeting held in June 2005, our stockholders approved a change of the percentage of stock dividend issued to our
stockholders, if any, to no more than 80% and cash dividend, if any, to no less than 20%.
In addition to permitting dividends to be paid out of net income, we are permitted under the R.O.C. Company Act to make
distributions to our stockholders of additional common shares by capitalizing reserves, including the legal reserve and capital surplus of
premiums from issuing stock and earnings from gifts received, or make such distributions by cash, if we do not have losses. However,
where legal reserve is distributed by capitalization or in cash, only the portion of legal reserve which exceeds 25 percent of the paid-in
capital may be distributed.
For information as to R.O.C. taxes on dividends and distributions, see “—R.O.C. Tax Considerations” in this Item.
Acquisition of Our Common Shares by Us
An R.O.C. company may not acquire its own common shares, except under certain exceptions provided in the R.O.C. Company
Act or the R.O.C. Securities and Exchange Act. Under the amendments to the R.O.C. Company Act, which took effect on
November 14, 2001, a company may purchase up to 5% of its issued common shares for transfer to employees as employee
compensation in accordance with a resolution of its board of directors, passed by a majority vote, at a meeting with at least two-thirds of
the directors present.
Under Article 28-2, an amendment to the R.O.C. Securities and Exchange Act, which took effect on July 21, 2000, we may, by a
board resolution adopted by majority consent at a meeting with two-thirds or more of our directors present, purchase up to 10% of our
issued common shares on the Taiwan Stock Exchange or by a tender offer, in accordance with the procedures prescribed by the R.O.C.
FSC, for any of the following purposes:
• to transfer our common shares to our employees as employee compensation;
• to transfer upon conversion of bonds with warrants, preferred shares with warrants, convertible bonds, convertible preferred
shares or certificates of warrants issued by us; or
• if necessary, to maintain our credit and our stockholders’ equity; provided that the common shares so purchased shall be
canceled thereafter.
70

We have from time to time announced plans, none of which was binding on us, to buy back up to a fixed amount of our common
shares on the Taiwan Stock Exchange at the price range set forth in the plans disclosed in “Item 16E—Purchase Of Equity Securities By
The Issuer And Affiliated Purchasers.” We may not spend more than the aggregate amount of the retained earnings, the premium from
issuing stock and the realized portion of the capital reserve to purchase our common shares. Historically, we have cancelled some of the
repurchased common shares and transferred some of the repurchased common shares to our employees as employee compensation. In
2010, 2013 and 2015, we purchased an aggregate of 300 million, 200 million and 200 million, respectively, of our common shares
under these plans. From February 3, 2010 to April 2, 2010, we purchased 300 million of our common shares on the Taiwan Stock
Exchange at an average price of NT$16.15 per share to transfer to our employees as employee compensation. From March 14, 2013 to
May 13, 2013, we purchased 200 million of our common shares on the Taiwan Stock Exchange at an average price of NT$11.23 per
share to transfer to our employees as employee compensation. From July 30, 2015 to September 29, 2015, we purchased 200 million of
our common shares on the Taiwan Stock Exchange at an average price of NT$11.02 per share to transfer to our employees as employee
compensation.
On March 14, 2012, our board of directors approved the cancellation of 157,934,400 treasury common shares, which were
purchased from December 17, 2008 to February 16, 2009. On April 24, 2013, our board of directors approved the cancellation of
300,000,000 treasury common shares, which were purchased from February 3, 2010 to April 2, 2010.
We may not pledge or hypothecate any purchased common shares. In addition, we may not exercise any stockholders’ rights
attached to such common shares. In the event that we purchase our common shares on the Taiwan Stock Exchange, our affiliates,
directors, managers and their respective spouses and minor children and/or nominees are prohibited from selling any of our common
shares during the period in which we purchase our common shares.
In addition to the share purchase restriction, the Company Act provides that our subsidiaries may not acquire our common shares
or the equity securities of our majority-owned subsidiaries if the majority of the outstanding voting equity securities or paid-in capital of
such subsidiary is directly or indirectly held by us.
Liquidation Rights
In a liquidation, you will be entitled to participate in any surplus assets after payment of all debts, liquidation expenses and taxes
proportionately.
Rights to Bring Stockholders’ Suits
Under the R.O.C. Company Act, a stockholder may bring suit against us in the following events:
• within 30 days from the date on which a stockholders’ resolution is adopted, a stockholder may file a lawsuit to annul a
stockholders’ resolution if the procedure for convening a stockholders’ meeting or the method of resolution violates any law
or regulation or our articles of incorporation. However, if the court is of the opinion that such violation is not material and
does not affect the result of the resolution, the court may reject the stockholder’s claim.
• if the substance of a resolution adopted at a stockholders’ meeting contradicts any applicable law or regulation or our articles
of incorporation, a stockholder may bring a suit to determine the validity of such resolution.
Stockholders may bring suit against our directors under the following circumstances:
• Stockholders who have continuously held 3% or more of our issued common shares for a period of one year or longer may
request in writing that the audit committee institutes an action against a director on our behalf. In case the audit committee
fails to institute an action within 30 days after receiving such request, the stockholders may institute an action on our behalf.
In the event stockholders institute an action, a court may, upon the defendant’s motion, order such stockholders to furnish
appropriate security.
71

• Stockholders who hold more than 3% or more of our total issued common shares may institute an action with a court to
remove a director of ours who has materially violated the applicable laws or our articles of incorporation or has materially
damaged the interests of our company if a resolution for removal on such grounds has first been voted on and rejected by our
stockholders and such suit is filed within 30 days of such stockholders’ vote.
• In the event that any director, manager or stockholder holding more than 10% of our common shares or any respective
spouses or minor children and/or nominees of any of them sells common shares within six months after acquisition of such
common shares, or repurchases the common shares within six months after the sale, we may claim for recovery of any profits
realized from the sale and purchase. If our board of directors or audit committee fail to claim for recovery, any stockholder
may set forth a 30-day period for our board of directors or audit committee to exercise the right. In the event our directors or
audit committee fail to exercise the right during such 30-day period, such requesting stockholder shall have the right to claim
such recovery on our behalf. Our directors shall be jointly and severally liable for damages suffered by us as a result of their
failure to exercise the right of claim.
Other Rights of Stockholders
Under the R.O.C. Company Act and the Corporate Merger and Acquisition Act, dissenting stockholders are entitled to appraisal
rights in the event of a spin-off or a merger and various other major corporate actions. Dissenting stockholders may request us to
redeem all their common shares at a then fair market price to be determined by mutual agreement. If no agreement can be reached, the
valuation will be determined by a court. Subject to applicable law, dissenting stockholders may, among other things, exercise their
appraisal rights by notifying us in writing before the related stockholders’ meeting and/or by raising and registering their dissent at the
stockholders’ meeting and also waive their voting rights.
One or more stockholders who have held 3% or more of the issued and outstanding common shares one year or longer may
require our board of directors to call an extraordinary stockholders’ meeting by sending a written request to our board of directors.
Effective from June 24, 2005, the R.O.C. Company Law allows stockholder(s) holding 1% or more of the total issued common
shares of a company to, during the period of ten days or more prescribed by the company, submit one proposal in writing containing no
more than three hundred words (in terms of Chinese characters) for discussion at the annual ordinary stockholders’ meeting.
Financial Statements
For a period of at least 10 days before our annual ordinary stockholders’ meeting, we must make available our annual financial
statements at our principal offices in Hsinchu, Taiwan, and our share registrar in Taipei for our stockholders’ inspection.
Transfer Restrictions
Our directors, managers and stockholders holding more than 10% of our common shares are required to report any changes in
their shareholding to us on a monthly basis. In addition, the number of common shares that they can sell or transfer on the Taiwan Stock
Exchange on a daily basis is limited by R.O.C. law. Further, they may sell or transfer our common shares on the Taiwan Stock
Exchange only after reporting to the R.O.C. FSC at least three days before the transfer, provided that such reporting is not required if
the number of common shares transferred does not exceed 10,000 in one business day.
C. Material Contracts
72

Cross License Agreement, dated as of January 1, 2006, between United Microelectronics Corporation and International
Business Machines Corporation.
We entered into a five-year cross license agreement with IBM effective as of January 1, 2006, which provides for the cross license
of certain semiconductor patents including process, topography and design. Under this agreement, IBM had granted to us and our
subsidiaries, nonexclusive and non-transferable licenses, without the right to grant sublicenses, for making our and our subsidiaries’
licensed products in R.O.C., Japan and Singapore and selling, leasing, licensing, using and/or transferring our and our subsidiaries’
licensed products worldwide under IBM’s patents filed prior to January 1, 2011; we granted IBM, royalty-free, worldwide and
non-transferable licenses, without the right to grant sublicenses, for the term of the cross license for making, selling, leasing, licensing,
using and/or transferring IBM’s licensed products under our patents filed prior to January 1, 2011. We also agreed to pay IBM certain
royalty fees under this agreement. This five-year cross license agreement with IBM terminated on December 31, 2010. We entered into
a new “life-of-the-patents” cross license agreement with IBM that will be effective until June 30, 2029, the expiration date of the
last-to-expire of the licensed patents thereunder. Under this agreement, IBM has granted to us and our subsidiaries, nonexclusive and
non-transferable licenses, without the right to grant sublicenses, for making our and our subsidiaries’ licensed products in R.O.C.,
Japan, Singapore and PRC and selling, leasing, licensing, using and/or transferring our and our subsidiaries’ licensed products
worldwide under IBM’s patents filed effectively prior to July 1, 2009; we granted IBM, royalty-free, worldwide and non-transferable
licenses, without the right to grant sublicenses, for the term of the cross license for making, selling, leasing, licensing, using and/or
transferring IBM’s licensed products under our patents filed effectively prior to July 1, 2009. We also agreed to pay IBM certain royalty
fees under this agreement. In addition, we have renewed the aforesaid patent cross license agreement with IBM on June 13, 2013, under
which IBM grants us a license under all its patents with an effective filing date prior to December 31, 2015.
Technology Agreement, dated as of June 29, 2012, between United Microelectronics Corporation and International Business
Machines Corporation.
We entered into a technology license agreement with International Business Machines Corporation (“IBM”) on June 29, 2012.
Under this agreement, IBM granted us a perpetual license under its 20nm bulk industry standard CMOS technology and developmental
processes associated with manufacturing integrated circuits using a three dimensional FinFet device technology for using, offering for
sale, selling, importing or otherwise transferring our licensed products.
Patent Portfolio License Agreement, dated as of February 8, 2013, between United Microelectronics Corporation and Mosaid
Technologies Incorporated.
We entered into a Patent Portfolio License Agreement with Mosaid Technologies Incorporated, or Mosaid, effective from
February 8, 2013, which provides for the license under its semiconductor manufacturing process patents during the period from
February 8, 2013 to February 8, 2018. Under this agreement, Mosaid grants to us and our subsidiaries, a nonexclusive and
nontransferable license for making, selling, importing or otherwise disposing of our and our subsidiaries’ licensed products. The parties
further agree not to assert patent claims against each other prior to February 8, 2018. We also agree to pay Mosaid certain royalty fees
under this agreement.
Other Patent License Agreements in 2015
We signed a Patent Cross License Agreement with Avago Technologies General IP Pte. Ltd., or Avago, effective from January 1,
2014 to December 31, 2018, which provides for the license of semiconductive device under certain licensed patents. Under this
agreement, Avago grants to us and our subsidiaries a non-exclusive and non-transferable license for making, selling, importing or
otherwise disposing of our and our subsidiaries’ licensed products. In exchange, we agree to pay Avago certain royalty fees under this
agreement.
In addition, we signed a Patent License Agreement with NXP B.V., effective from September 30, 2015 to September 29, 2020,
under which, both NXP B.V. and we agree to grant to the other party a license under its patents and patent applications. We also agree
to pay NXP B.V. certain royalty under this agreement.
73

12-inch Fab Semiconductor Manufacture Technology License Agreements, dated as of December 1, 2015 and April 5, 2017,
between Us and USC
In order to facilitate USC to build up its semiconductor manufacture technology and capability, we licensed 28 nm and 40/55 nm
semiconductor manufacture technology approved by the relevant R.O.C. authorities to USC. The 40/55 nm license is effective from
December 1, 2015 to December 31, 2019, while the 28 nm license is effective from April 1, 2017 to March 31, 2022. USC will pay us
certain royalty under these agreements.
DRAM Technology Cooperation Agreement, dated May 13, 2016, between Us and Fujian Jinhua
We entered into a technology cooperation agreement with Fujian Jinhua on May 13, 2016 to jointly develop DRAM related
technologies. Under the agreement, Fujian Jinhua will provide us with related equipment for our research and development, as well as
service fees subject to the progress of the technology development. We will develop DRAM related technologies for Fujian Jinhua and
deliver such development results to Fujian Jinhua before May 12, 2021. These developed technologies will be jointly owned by both
parties.
Major Long-term Supply and Marketing Agreements
We have entered into long-term distribution, sales, service and marketing agreements with the following companies: UMC Group
(USA), an agreement effective from January 1, 2013 through December 3, 2018; UMC Group Japan Co., Ltd., an agreement effective
from January 1, 2018 through December 31, 2022; and Hejian, an agreement effective from January 1, 2017 through December 31,
2017.
Major Construction Agreements
We entered into construction agreements in connection with the USC facility with several companies, such as L&K Engineering
(Suzhou) Co.,Ltd., Wholetech Group (Shanghai) Trading Co. Ltd., and Tan Hou (Shanghai) Semiconductor Exhaust Industry Co., Ltd.,
for the construction of the Fab 12X in Xiamen, Fujian Province, China. These agreements are effective from January 1, 2017 to
December 31, 2017, and the total contractual amount exceeds US$15.7 million.
We also entered into various major facility construction agreements in connection with our Fab 12A fab facility, piping, and
various material supply systems, with companies such as Wholetech System Hitech Limited, Zillion Tek Co., Ltd., HER LI
MACHINERY INDUSTRIAL CO., LTD., and O’RIGHT ENGINEERING CORP., for our Fab 12A phase 5 facilities in the Tainan
Science Park. These agreements are effective from January 2017 to December 2018, and the total contractual amount exceeds
NT$0.2 billion.
D. Exchange Controls
Foreign Investment and Exchange Controls in Taiwan
We have extracted from publicly available documents the information presented in this section. Please note that citizens of the
People’s Republic of China and entities organized in the People’s Republic of China are subject to special R.O.C. laws, rules and
regulations, which are not discussed in this section.
74

General
Historically, foreign investments in the securities market of Taiwan were restricted. However, commencing in 1983, the Taiwan
government has from time to time enacted legislation and adopted regulations to make foreign investment in the Taiwan securities
market possible. Initially, only overseas investment trust funds of authorized securities investment trust enterprises established in
Taiwan were permitted to invest in the Taiwan securities market. Since January 1, 1991, qualified foreign institutional investors are
allowed to make investments in the Taiwan public securities market. Since March 1, 1996, non-resident foreign institutional and
individual investors, called “general foreign investors”, are permitted to make direct investments in the Taiwan public securities market.
On September 30, 2003, the Executive Yuan amended the Regulations Governing Investment in Securities by Overseas Chinese and
Foreign Nationals, or the Investment Regulations, under which the “Qualified Foreign Institutional Investors”, or QFII, designations
have been abolished and the restrictions on foreign portfolio investors have been revised. According to the Investment Regulations,
“Foreign Institutional Investor”, or FINI, means an entity which is incorporated under the laws of countries other than the R.O.C. or the
branch of a foreign entity that is established within the territory of the R.O.C., and “Foreign Individual Investor”, or FIDI, means an
overseas Chinese or a foreign natural person. In addition, the Investment Regulations also lifted some restrictions and simplified
procedures of investment application.
On April 30, 2009, the R.O.C. FSC promulgated regulations allowing QDIIs under PRC regulations and certain other PRC persons
to invest in the securities of R.O.C. companies. However, prior approval from the Investment Commission of the R.O.C. Ministry of
Economic Affairs is required for QDIIs or certain other PRC persons to own 10% or more of the issued and outstanding share capital of
a listed R.O.C. company.
Foreign Ownership Limitations
Foreign ownership of the issued share capital in a Taiwan Stock Exchange-listed company or a Taipei Exchange-listed company
has been limited to 50% in the past. Since December 30, 2000, the 50% limit has been lifted. Foreign investors can now hold such
investments without any foreign ownership percentage limitations, unless the law has imposed restrictions otherwise.
Foreign Investors
Each FINI who wishes to invest directly in the R.O.C. securities market is required to register with the Taiwan Stock Exchange
and obtain an investment identification number if the FINI is a non-resident and has no sub-investment accounts in the R.O.C. Each
FIDI who wishes to invest directly in the R.O.C. securities market is also required to register with the Taiwan Stock Exchange and
obtain an investment identification number. The R.O.C. FSC has lifted the limitation on the amount of investment in the R.O.C.
securities market for a non-resident FIDI Except for some restrictions imposed by specific laws and regulations, the individual and
aggregate foreign ownership of the issued share capital in a Taiwan Stock Exchange-listed company or a Taipei Exchange-listed
company is not restricted. An R.O.C. custodian for a non-resident FINI or FIDI is required to submit to the CBC, and the Taiwan Stock
Exchange a report of trading activities, inward and outward remittance of capital and status of assets under custody and other matters
every month. Foreign institutional investors are not subject to any ceiling for investment in the R.O.C. securities market.
Foreign Investment Approval
Foreign investors (both institutional and individual) who wish to make direct investments in the common shares of R.O.C.
companies are required to submit a “foreign investment approval” application to the Investment Commission of the R.O.C. MOEA, or
other government authority and enjoy benefits granted under the Statute for Foreigner’s Investment and the Statute for Overseas
Chinese’s Investment. The Investment Commission of the R.O.C. MOEA or other government authority reviews each foreign
investment approval application and approves or disapproves the application after consultation with other governmental agencies, if
necessary. Any non-R.O.C. person possessing a foreign investment approval may repatriate annual net profits and interests attributable
to an approved investment. Investment capital and capital gains attributable to the investment may be repatriated with approval of the
Investment Commission of the R.O.C. MOEA or other government authority.
In addition to the general restrictions against direct investments by foreign investors in R.O.C. companies, foreign investors are
currently prohibited from investing in certain prohibited industries in Taiwan under the “Negative List”. The prohibition on direct
foreign investment in the prohibited industries in the Negative List is absolute in the absence of a specific exemption from the
application of the Negative List. Under the Negative List, some other industries are restricted so that foreign investors may directly
invest only up to a specified level and with the specific approval of the relevant authority responsible for enforcing the legislation that
the Negative List is intended to implement. Our business does not operate in a restricted industry under the Negative List.
75

In June 2009, the R.O.C. MOEA further allowed PRC persons to make direct investments in Taiwan. However, such direct
investment is still subject to various restrictions, such as that that only the industries listed in the Positive List, as promulgated by the
Executive Yuan, are legally permitted targets and that all the PRC persons who wish to make direct investments in R.O.C. are required
to submit an “investment approval” application to the Investment Commission of the R.O.C. MOEA.
Exchange Controls
Taiwan’s Foreign Exchange Control Statute and regulations provide that all foreign exchange transactions must be executed by
banks designated to handle foreign exchange transactions by the Ministry of Finance and the CBC. Current regulations favor trade-
related foreign exchange transactions. Consequently, foreign currency earned from exports of merchandise and services may now be
retained and used freely by exporters. All foreign currency needed for the importation of merchandise and services may be purchased
from the designated foreign exchange banks.
Aside from trade-related foreign exchange transactions, R.O.C. companies and residents may remit to and from Taiwan foreign
currencies of up to US$50 million (or its equivalent) and US$5 million, (or its equivalent) respectively in each calendar year. These
limits apply to remittances involving a conversion between NT dollars and U.S. dollars or other foreign currencies. A requirement is
also imposed on all private enterprises to register all medium- and long-term foreign debt with the CBC.
In addition, foreign currency earned from or needed to be paid for direct investment or portfolio investments, which are approved
by the competent authorities, may be retained or sold by the investors or purchased freely from the designated bank.
Aside from the transactions discussed above, a foreign person without an alien resident card (or who has relevant resident card
with a validity of less than one year) or an unrecognized foreign entity may remit to and from Taiwan foreign currencies of up to
US$100,000 per remittance without obtaining prior approval or permit if required documentation is provided to Taiwan authorities.
This limit applies to remittances involving a conversion between NT dollars and U.S. dollars or other foreign currencies.
Depositary Receipts
In April 1992, the R.O.C. SFB (the predecessor of the R.O.C. FSC) began allowing R.O.C. companies listed on the Taiwan Stock
Exchange to sponsor the issuance and sale of depositary receipts evidencing depositary shares. Notifications for these issuances are still
required. In December 1994, the Ministry of Finance began allowing companies whose shares are traded on the Taipei Exchange to
sponsor the issuance and sale of depositary receipts evidencing depositary shares. On October 24, 2002, the R.O.C. SFB began allowing
public companies that are not listed on the Taiwan Stock Exchange or the Taipei Exchange to sponsor the issuance and sale of
depositary receipts by way of private placements outside the R.O.C.
A holder of depositary shares wishing to withdraw common shares underlying depositary shares is required to appoint a local
agent or representative with qualifications set forth by the R.O.C. FSC to, among other things, open a securities trading account with a
local brokerage firm, pay R.O.C. taxes, remit funds, and exercise stockholders’ right. In addition, the withdrawing holder is also
required to appoint a custodian bank or a securities firm with qualifications set forth by the R.O.C. FSC to hold payments and the
securities in safekeeping, make confirmations, settle trades and report all relevant information in which the securities firm is appointed
as the custodian, and the payments be held in safekeeping in a special account opened in a bank approved by the R.O.C. FSC. Without
making this appointment and the opening of accounts, the withdrawing holder would be unable to subsequently sell the common shares
withdrawn from a depositary receipt facility on either the Taiwan Stock Exchange or the Taipei Exchange.
76

After the issuance of a depositary share, a holder of the depositary share may immediately, comparing to a three-month waiting
period restriction which was lifted in 2003, request the depositary issuing the depositary share to cause the underlying common shares
to be sold in the R.O.C. or to withdraw the common shares represented by the depositary receipt and deliver the common shares to the
holder. On April 30, 2009 and July 3, 2009, the R.O.C. Executive Yuan approved the Regulations Governing Securities Investment and
Futures Trading in Taiwan by Mainland Area Investors and the Regulations Governing Investment in Taiwan by Mainland Area
Persons, respectively, under which qualified PRC persons are permitted to invest in Taiwan companies under limited circumstances,
including purchase of the depositary receipts issued by a Taiwan company. However, prior approval from the Investment Commission
of the R.O.C. Ministry of Economic Affairs is required for a qualified PRC person’s ownership of 10% or more of the issued and
outstanding share capital of a listed R.O.C. company or certain other manners of investment by a qualified PRC person.
No deposits of common shares may be made in a depositary receipt facility and no depositary receipts may be issued against
deposits without specific R.O.C. FSC approval, unless they are:
(A) stock dividends;
(B) free distributions of common shares;
(C) due to the exercise by a holder of his or her preemptive rights in the event of capital increases for cash; or
(D) permitted under the deposit agreement and the custody agreement, due to the direct purchase of common shares or purchase
through the depositary in the domestic market or the surrender of common shares under the possession of investors and then
delivery of such common shares to the custodian for deposit in the depositary receipt facility, provided that the total number
of depositary receipts outstanding after an issuance cannot exceed the number of issued depositary shares previously
approved by the R.O.C. FSC in connection with the offering plus any depositary shares issued pursuant to the events
described in (A), (B) and (C) above. These issuances may only be made to the extent previously issued depositary shares
have been withdrawn.
A depositary may convert New Taiwan dollars from the proceeds of the sale of common shares or cash distributions received into
other currencies, including U.S. dollars. A depositary may be required to obtain foreign exchange approval from the CBC on a
payment-by-payment basis for conversion into New Taiwan dollars of subscription payments for rights offerings or conversion into
foreign currencies from the proceeds from the sale of subscription rights for new common shares. It is expected that the CBC will grant
this approval as a routine matter.
A holder of depositary shares may convert NT dollars into other currencies from proceeds from the sale of any underlying
common shares. Proceeds from the sale of the underlying common shares withdrawn from the depositary receipt facility may be used
for reinvestment in securities listed on both the Taiwan Stock Exchange and the Taipei Exchange, provided that the investor designates
a local securities firm or financial institution as agent to open an NT dollar bank account in advance.
E. Taxation
R.O.C. Tax Considerations
The following summarizes the principal R.O.C. tax consequences of owning and disposing of the ADSs or common shares to a
holder of ADSs or common shares that is not a resident of the R.O.C. A foreign individual holder will be considered as not a resident of
the R.O.C., or a non-R.O.C. resident, for the purposes of this section if he or she is not physically present in Taiwan for 183 days or
more during any calendar year. An entity holder will be considered as not a resident of the R.O.C., or a non-R.O.C. resident, if it is
organized under the laws of a jurisdiction other than Taiwan for profit making purpose and has no fixed place of business or other
permanent establishment or business agent in the R.O.C. Prospective purchasers of ADSs or common shares should consult their own
tax advisors concerning the tax consequences of owning ADSs or common shares in the R.O.C. and any other relevant taxing
jurisdiction to which they are subject.
77

Dividends
Dividends, whether in cash or common shares, declared by us out of retained earnings and paid out to a holder that is not an
R.O.C. resident in respect of common shares represented by ADSs are subject to R.O.C. withholding tax at the time of distribution. The
rate of withholding is currently 21% of the amount of the distribution in the case of cash dividends or of the par value of the common
shares distributed in the case of stock dividends. Under current practice adopted by tax authorities, a 21% withholding rate is applied to
a non-R.O.C. resident ADS holder without requiring the holder to apply for or obtain foreign investment approval. As discussed in the
section “—Tax Reform” below, certain of our retained earnings will be subject to a certain percentage of undistributed retained earnings
tax. To the extent dividends are paid out of retained earnings that have been subject to the retained earnings tax, up to a maximum
amount of half of the amount of such tax will be used by us to offset a non-R.O.C. resident’s withholding tax liability on such dividend.
Consequently, the effective rate of withholding on dividends paid out of retained earnings previously subject to the retained earnings tax
may be less than 20%; provided, however, according to the latest amendment of the R.O.C. Income Tax Act, such benefit will no longer
exist from January 1, 2019 and thus no offset will be effected thereafter. There is no withholding tax with respect to stock dividends
declared out of our capital surplus of premiums from issuing stock resulting from the capital paid by the shareholders.
Capital Gains
The R.O.C. Income Tax Act was amended and promulgated on December 2, 2015 and took effect from January 1, 2016.
According to the newly amended R.O.C. Income Tax Act, the provisions regarding the capital gain from securities transaction were
deleted. Accordingly, under the R.O.C. law, gains realized on R.O.C. securities transactions are primarily exempt from income tax.
Subject to the AMT Act, gains realized from various securities transactions by an R.O.C.-resident entity shall be calculated as
taxable income for the purpose of the AMT Act and may further be subject to income tax. If the above entity has held common shares
for more than three (3) years, 50% of capital gain may be exempted from AMT. In addition, gains realized from transfers of ADSs by
non-R.O.C. resident holders are not regarded as income from sources in the R.O.C. and, as a result, any gains derived therefrom are
currently not subject to R.O.C. income tax.
Securities Transaction Tax
The R.O.C. government imposes a securities transaction tax that will apply to sales of common shares, but not to sales of ADSs.
The securities transaction tax, which is payable by the seller, is generally levied on sales of common shares at the rate of 0.3% of the
sales proceeds. Withdrawals of our common shares from our depositary facility are not subject to the R.O.C. securities transaction tax.
Preemptive Rights
Distribution of statutory preemptive rights for common shares by us in compliance with the R.O.C. Company Act is not subject to
R.O.C. tax. Proceeds derived from sales of statutory preemptive rights evidenced by securities are subject to the R.O.C. securities
transaction tax, currently at the rate of 0.3% of the gross amount received, as well as the R.O.C. securities income tax. Proceeds derived
from sales of statutory preemptive rights that are not evidenced by securities are subject to capital gains tax at the rate of 20% of the
gains realized for non-R.O.C. resident entities and non-R.O.C. resident individuals. Subject to compliance with the R.O.C. law, we have
sole discretion to determine whether statutory preemptive rights are evidenced by securities or not.
Estate Taxation and Gift Tax
R.O.C. estate tax is payable on any property within the R.O.C. of a deceased individual who is a non-resident individual or a
non-R.O.C. citizen and R.O.C. gift tax is payable on any property located within the R.O.C. donated by any such person. Under the
newly amended Articles 13 and 19 of the R.O.C. Estate and Gift Tax Act, which became effective on May 12, 2017, tax brackets and
rates of estate tax are as follows: (1) if the net taxable
78

estate is no more than NT$50,000,000, the tax rate shall be 10%; (2) if the net taxable estate is more than NT$50,000,000 but no more
than NT$100,000,000, the estate tax payable shall be NT$5,000,000 plus 15% for the amount in excess of NT$50,000,000; and (3) if
the net taxable estate is more than NT$100,000,000, the estate tax payable shall be NT$12,500,000 plus 20% for the amount in excess
of NT$100,000,000; tax brackets and rates of gift tax are as follows: (1) if the net taxable gifts are no more than NT$25,000,000, the tax
rate shall be 10%; (2) if the net taxable gifts are more than NT$25,000,000 but no more than NT$50,000,000, the gift tax payable shall
be NT$2,500,000 plus 15% for the amount in excess of NT$25,000,000; and (3) if the net taxable gifts are more than NT$50,000,000,
the gift tax payable shall be NT$6,250,000 plus 20% for the amount in excess of NT$50,000,000. Under R.O.C. estate and gift tax laws,
the common shares will be deemed located in the R.O.C. irrespective of the location of the owner. It is unclear whether a holder of
ADSs will be considered to own common shares for this purpose.
Tax Treaties
The Republic of China does not have an income tax treaty with the United States. On the other hand, the Republic of China has
income tax treaties with Indonesia, Singapore, South Africa, Australia, Vietnam, New Zealand, Malaysia, Macedonia, Swaziland, the
Netherlands, the United Kingdom, Gambia, Senegal, Sweden, Belgium, Denmark, Israel, Paraguay, Hungary, France, India, Slovakia,
Switzerland, Germany, Thailand, Kiribati, Luxembourg, Italy, Japan, Canada, Poland and Austria which may limit the rate of Republic
of China withholding tax on dividends paid with respect to common shares in Taiwan companies. It is unclear whether a non-R.O.C.
holder of ADSs will be considered to own common shares for the purposes of such treaties. Accordingly, a holder of ADSs who is
otherwise entitled to the benefit of a treaty should consult its own tax advisors concerning eligibility for benefits under the treaty with
respect to the ADSs.
Tax Reform
An amendment to the R.O.C. Income Tax law was enacted on January 1, 1998, to integrate the corporate income tax and the
stockholder dividend tax with the aim of eliminating the double taxation effect for resident stockholders of Taiwanese corporations. In
order to improve Taiwan’s tax system and to keep up with the trend of international tax reform, the R.O.C. Income Tax law was further
amended in 2018 to replace the old tax system which integrated the corporate income tax and the stockholder dividend tax. Except for
limited exceptions, the amendment shall take effect retroactively from January 1, 2018.
Under this amendment, a 10% retained earnings tax will be imposed on a company for its after-tax earnings generated after
January 1, 1998 that are not distributed in the following year; while a 5% retained earning tax will be imposed for after-tax earnings
generated from January 2018. The retained earnings tax so paid will further reduce the retained earnings available for future
distribution. Under the old tax system, when we declare dividends out of those retained earnings, up to a maximum amount of half of
the amount of such tax of the declared dividends will be credited against the withholding tax imposed on the non-R.O.C. resident
holders of our ADSs or common shares; from January 1, 2019, the benefit will no longer exist and no retained earnings tax will be
credited.
U.S. Federal Income Tax Considerations for U.S. Persons
The following is a summary of certain U.S. federal income tax consequences for beneficial owners of our common shares or
ADSs that hold the common shares or ADSs as capital assets and that are U.S. holders that are not citizens of the R.O.C., do not have a
permanent establishment in the R.O.C. and are not physically present in the R.O.C. for 183 days or more within a calendar year. You
are a U.S. holder if you are, for U.S. federal income tax purposes, any of the following:
• an individual citizen or resident of the United States;
• a corporation (or other entity or arrangement treated as a corporation for U.S. federal income tax purposes) created or
organized in or under the laws of the United States, any state thereof or the District of Columbia;
79

• an estate the income of which is subject to U.S. federal income taxation regardless of its source;
• a trust that is subject to the primary supervision of a court within the United States and that has one or more U.S. persons
with the authority to control all substantial decisions of the trust; or
• a trust that has a valid election in effect under applicable U.S. Treasury regulations to be treated as a U.S. person.
This summary is based on the provisions of the Internal Revenue Code of 1986, as amended, or the Code, and regulations, rulings
and judicial decisions thereunder as of the date hereof, and such authorities may be replaced, revoked or modified so as to result in U.S.
federal income tax consequences different from those discussed below. It is for general purposes only and you should not consider it to
be tax advice. In addition, it is based in part on representations by the depositary and assumes that each obligation under the deposit
agreement and any related agreement will be performed in accordance with its terms. This summary does not represent a detailed
description of all the U.S. federal income tax consequences to you in light of your particular circumstances and does not address the
Medicare tax on net investment income or the effects of any state, local or non-U.S. tax laws (or other U.S. federal tax consequences,
such as U.S. federal estate or gift tax consequences). In addition, it does not represent a detailed description of the U.S. federal income
tax consequences applicable to you if you are subject to special treatment under the U.S. federal income tax laws, including if you are:
• a dealer in securities or currencies;
• a trader in securities if you elect to use a mark-to-market method of accounting for your securities holdings;
• a financial institution or an insurance company;
• a tax-exempt organization;
• a regulated investment company;
• a real estate investment trust;
• a person liable for alternative minimum tax;
• a person holding common shares or ADSs as part of a hedging, integrated or conversion transaction, constructive sale or
straddle;
• a partnership or other pass-through entity for U.S. federal income tax purposes;
• a person owning, actually or constructively, 10% or more of our stock (by vote or value);
• a person required to accelerate the recognition of any item of gross income with respect to our common shares or ADSs as a
result of such income being recognized on an applicable financial statement; or
• a U.S. holder whose “functional currency” is not the U.S. dollar.
We cannot assure you that a later change in law will not alter significantly the tax considerations that we describe in this summary.
If a partnership (or other entity or arrangement treated as a partnership for U.S. federal income tax purposes) holds our common
shares or ADSs, the tax treatment of a partner will generally depend upon the status of the partner and the activities of the partnership. If
you are a partner of a partnership holding our common shares or ADSs, you should consult your tax advisor.
80

You should consult your own tax advisor concerning the particular U.S. federal income tax consequences to you of the
ownership and disposition of the common shares or ADSs, as well as the consequences to you arising under the laws of any
other taxing jurisdiction.
In general, for U.S. federal income tax purposes, a U.S. person who is the beneficial owner of an ADS will be treated as the owner
of the common shares underlying its ADS. Accordingly, deposits or withdrawals of common shares by U.S. holders for ADSs generally
will not be subject to U.S. federal income tax.
Taxation of Dividends
Except as discussed below with respect to the passive foreign investment company rules, the amount of distributions (including
net amounts withheld in respect of R.O.C. withholding taxes) you receive on your common shares or ADSs (other than certain pro rata
distributions of common shares to all stockholders) will generally be treated as dividend income to you if the distributions are made
from our current and accumulated earnings and profits as calculated according to U.S. federal income tax principles. In determining the
net amounts withheld in respect of R.O.C. taxes, any reduction in the amount withheld on account of an R.O.C. credit in respect of the
retained earnings tax imposed on us is not considered a withholding tax and will not be treated as distributed to you or creditable by you
against your U.S. federal income tax. Such income (including withheld taxes) will be includible in your gross income as ordinary
income on the day you actually or constructively receive it, which in the case of an ADS will be the date actually or constructively
received by the depositary. The amount of any distribution of property other than cash will be the fair market value of such property on
the date it is distributed. You will not be entitled to claim a dividend received deduction with respect to distributions you receive from
us.
With respect to non-corporate U.S. holders (including individuals), certain dividends received from a qualified foreign corporation
may be subject to reduced rates of taxation. A foreign corporation is treated as a qualified foreign corporation with respect to dividends
paid by that corporation on common shares (or ADSs backed by such common shares) that are readily tradable on an established
securities market in the United States. U.S. Treasury Department guidance indicates that our ADSs (which are listed on the NYSE), but
not our common shares, are readily tradable on an established securities market in the United States. Thus, subject to the discussion
below with respect to the passive foreign investment company rules, we believe that dividends we pay on our ADSs will meet the
conditions required for these reduced tax rates. Since we do not expect that our common shares will be listed on an established
securities market in the United States, we do not believe that dividends we pay on our common shares that are not represented by ADSs
currently meet the conditions required for these reduced tax rates. Moreover, there can be no assurance that our ADSs will continue to
be readily tradable on an established securities market in later years. Non-corporate U.S. holders that do not meet a minimum holding
period requirement during which they are not protected from the risk of loss or that elect to treat the dividend income as “investment
income” pursuant to Section 163(d) (4) of the Code will not be eligible for the reduced rates of taxation regardless of our status as a
qualified foreign corporation. In addition, the rate reduction will not apply to dividends if the recipient of a dividend is obligated to
make related payments with respect to positions in substantially similar or related property. This disallowance applies even if the
minimum holding period has been met. Non-corporate U.S. holders will also not be eligible for the reduced rates of taxation on
dividends if we are a passive foreign investment company in the taxable year in which such dividends are paid or in the preceding
taxable year. U.S. holders should consult their own tax advisors regarding the application of these rules given their particular
circumstances.
The amount of any dividend paid in NT dollars will equal the U.S. dollar value of the NT dollars you receive (calculated by
reference to the exchange rate in effect on the date you actually or constructively receive the dividend, which in the case of an ADS will
be the date actually or constructively received by the depositary), regardless of whether the NT dollars are actually converted into U.S.
dollars. If the NT dollars received as a dividend are converted into U.S. dollars on the date they are actually or constructively received,
you generally will not be required to recognize foreign currency gain or loss in respect of the dividend income. If the NT dollars
received as a dividend are not converted into U.S. dollars on the date of receipt, you will have a basis in the NT dollars equal to their
U.S. dollar value on the date of receipt. Any gain or loss you realize if you subsequently sell or otherwise dispose of the NT dollars will
be ordinary income or loss from sources within the United States for foreign tax credit limitation purposes.
81

Subject to certain limitations under the Code, you may be entitled to a credit or deduction against your U.S. federal income taxes
for the net amount of any R.O.C. taxes that are withheld from dividend distributions made to you. The election to receive a credit or
deduction must be made annually, and applies to all foreign taxes for the applicable tax year. The limitation on foreign taxes eligible for
credit is calculated separately with respect to specific classes of income. For this purpose, dividends we pay with respect to common
shares or ADS will generally be considered passive category income from sources outside the United States. Furthermore, you will not
be allowed a foreign tax credit for foreign taxes imposed on dividends paid on common shares or ADSs if you (1) have held the
common shares or ADSs for less than a specified minimum period during which you are not protected from risk of loss, or (2) are
obligated to make payments related to the dividends. The rules governing the foreign tax credit are complex. We therefore urge you to
consult your tax advisors regarding the availability of the foreign tax credit under your particular circumstances.
To the extent that the amount of any distribution you receive exceeds our current and accumulated earnings and profits for a
taxable year, as determined under U.S. federal income tax principles, the distribution will first be treated as a tax-free return of capital,
causing a reduction in your adjusted basis in the common shares or ADSs and thereby increasing the amount of gain, or decreasing the
amount of loss, you will recognize on a subsequent disposition of the common shares or ADSs. The balance in excess of adjusted basis,
if any, will be taxable to you as capital gain recognized on a sale or exchange. However, we do not expect to keep earnings and profits
in accordance with U.S. federal income tax principles. Therefore, you should expect that a distribution will generally be treated as a
dividend (as discussed above).
It is possible that pro rata distributions of common shares or ADSs to all stockholders may be made in a manner that is not subject
to U.S. federal income tax. In the event that such distributions are tax-free, the basis of any new common shares or ADSs so received
will generally be determined by allocating the U.S. holder’s basis in the old common shares or ADSs between the old common shares or
ADSs and the new common shares or ADSs, based on their relative fair market values on the date of distribution. For U.S. federal
income tax purposes, any such tax-free share or ADS distribution generally would not result in foreign source income to you.
Consequently, you may not be able to use the foreign tax credit associated with any R.O.C. withholding tax imposed on such
distributions unless you can use the credit against U.S. federal income tax due on other foreign source income in the appropriate
category for foreign tax credit purposes. You should consult your own tax advisors regarding all aspects of the foreign tax credit.
Taxation of Capital Gains
Except as discussed below with respect to the passive foreign investment company rules, when you sell or otherwise dispose of
your common shares or ADSs, you will generally recognize capital gain or loss in an amount equal to the difference between the U.S.
dollar value of the amount realized for the common shares or ADSs and your basis in the common shares or ADSs, determined in U.S.
dollars. If you are an individual or other non-corporate holder, and the common shares or ADSs being sold or otherwise disposed of are
capital assets that you have held for more than one year, your gain recognized will be eligible for reduced rates of taxation. Your ability
to deduct capital losses is subject to limitations. Any gain or loss you recognize will generally be treated as U.S. source gain or loss for
foreign tax credit limitation purposes. Consequently, you may not be able to use the foreign tax credit arising from any R.O.C. tax
imposed on the disposition of common shares or ADSs unless such credit can be applied (subject to applicable limitations) against tax
due on other income treated as derived from foreign sources.
If you pay any R.O.C. securities transaction tax, such tax is not treated as an income tax for U.S. federal income tax purposes, and
therefore will not be a creditable foreign tax for U.S. federal income tax purposes. However, subject to limitations under the Code, such
tax may be deductible. You are urged to consult your tax advisors regarding the U.S. federal income tax consequences of these taxes.
82

Passive Foreign Investment Company
Based on the composition of our income and assets, and the valuation of our assets, we do not believe that we are currently (or that
we were in 2017) a passive foreign investment company, or PFIC, and we do not expect to become one in the future, although there can
be no assurance in this regard.
In general, a company is considered a PFIC for any taxable year if either:
• at least 75% of its gross income is passive income, which generally includes income derived from certain dividends, interest,
royalties and rents (other than royalties and rents derived in the active conduct of a trade or business and not derived from a
related person), annuities or property transactions; or
• at least 50% of the value of its assets is attributable to assets that produce or are held for the production of passive income.
The 50% of value test is based on the average of the value of our assets for each quarter during the taxable year. If we own at least
25% by value of another company’s stock, we will be treated, for purposes of the PFIC rules, as owning our proportionate share of the
assets and receiving our proportionate share of the income of that company.
In addition, the determination of whether we are a PFIC is made annually. Accordingly, it is possible that we may become a PFIC
in the current or any future taxable year due to changes in our asset or income composition. A decrease in the price of our common
shares and ADSs may also result in our becoming a PFIC. If we are a PFIC for any taxable year during which you hold common shares
or ADSs, you will be subject to special tax rules discussed below.
If we are a PFIC for any taxable year during which you hold common shares or ADSs and you do not make a timely mark-to
market election as described below, you will be subject to special tax rules with respect to any “excess distribution” that you receive
and any gain you realize from a sale or other disposition (including a pledge) of common shares or ADSs. Distributions you receive in a
taxable year that are greater than 125% of the average annual distributions you received during the shorter of the three preceding
taxable years or your holding period for the common shares or ADSs will be treated as excess distributions. Under these special tax
rules:
• the excess distribution or gain will be allocated ratably over your holding period for the common shares or ADSs;
• the amount allocated to the current taxable year, and any taxable year prior to the first taxable year in which we were a PFIC,
will be treated as ordinary income; and
• the amount allocated to each other year will be subject to tax at the highest tax rate in effect for that year and the interest
charge generally applicable to underpayments of tax will be imposed on the resulting tax attributable to each such year.
If you hold common shares or ADSs in any year in which we are a PFIC, you are generally required to file Internal Revenue
Service Form 8621.
If we are a PFIC for any taxable year and any of our non-U.S. subsidiaries is also a PFIC, you would be treated as owning a
proportionate amount (by value) of the common shares of the lower-tier PFIC for purposes of the application of these rules. You are
urged to consult your tax advisors about the application of the PFIC rules to any of our subsidiaries.
83

Under certain circumstances, a U.S. holder, in lieu of being subject to the rules discussed above with respect to excess
distributions and recognized gains, may make an election to include gain on the stock of a PFIC as ordinary income under a
mark-to-market method provided that such stock is regularly traded on a qualified exchange (within the meaning of the applicable
Treasury regulations). Under this method, any difference between the stock’s fair market value and its adjusted basis at the end of the
year is accounted for by either an inclusion in income or, subject to limitations, a deduction from income, as described below. Under
current U.S. Treasury Department guidance, the mark-to-market election may be available to holders of ADSs because the ADSs are
listed on the NYSE, which constitutes a qualified exchange, although there can be no assurance that the ADSs will be “regularly traded”
for purposes of the mark-to-market election. You should also note that only the ADSs and not the common shares are listed on the
NYSE. Our common shares are listed on the Taiwan Stock Exchange, which must meet certain trading, listing, financial disclosure and
other requirements to be treated as a qualified exchange under applicable U.S. Treasury regulations for purposes of the mark-to-market
election, and no assurance can be given that the common shares will be “regularly traded” for purposes of the mark-to-market election.
If you make an effective mark-to-market election, you will include in income each year that we are a PFIC as ordinary income the
excess of the fair market value of your common shares or ADSs at the end of the year over your adjusted tax basis in the common
shares or ADSs. You will be entitled to deduct as an ordinary loss in each such year the excess of your adjusted tax basis in the common
shares or ADSs over their fair market value at the end of the year, but only to the extent of the net amount previously included in
income as a result of the mark-to-market election. If you make an effective mark-to-market election, in each year that we are a PFIC
any gain you recognize upon the sale or other disposition of your common shares or ADSs will be treated as ordinary income and any
loss will be treated as ordinary loss, but only to the extent of the net amount of previously included income as a result of the
mark-to-market election.
Your adjusted tax basis in common shares or ADSs will be increased by the amount of any income inclusion and decreased by the
amount of any deductions under the mark-to-market rules. If you make a mark-to-market election it will be effective for the taxable year
for which the election is made and all subsequent taxable years unless the common shares or ADSs are no longer regularly traded on a
qualified exchange or the Internal Revenue Service consents to the revocation of the election. You should consult your tax advisors
about the availability of the mark-to-market election, and whether making the election would be advisable under your particular
circumstances.
Alternatively, a U.S. holder of common shares or ADSs in a PFIC can sometimes avoid the rules described above by electing to
treat the PFIC as a “qualified electing fund” under Section 1295 of the Code. This option is not available to you because we do not
intend to comply with the requirements necessary to permit you to make this election.
Non-corporate U.S. holders will not be eligible for reduced rates of taxation on any dividends received from us if we are a PFIC in
the taxable year in which such dividends are paid or in the preceding taxable year. You should consult your own tax advisors
concerning the U.S. federal income tax consequences of holding common shares or ADSs if we are considered a PFIC in any taxable
year.
Information Reporting and Backup Withholding
In general, unless you are an exempt recipient such as a corporation, information reporting will apply to dividends in respect of the
common shares or ADSs and to the proceeds from the sale, exchange or other disposition of your common shares or ADSs that are paid
to you within the United States (and in some cases, outside of the United States). Additionally, if you fail to provide your taxpayer
identification number, or fail either to report in full dividend and interest income or to make the necessary certifications of your exempt
status, you may be subject to backup withholding.
Backup withholding is not an additional tax and any amounts withheld under the backup withholding rules will be allowed as a
refund or a credit against your U.S. federal income tax liability, provided you furnish the required information to the Internal Revenue
Service.
F. Dividends and Paying Agents
Not applicable.
84

G. Statement by Experts
Not applicable.
H. Documents on Display
We have filed this annual report on Form 20-F, including exhibits, with the Securities and Exchange Commission. As allowed by
the Securities and Exchange Commission, in Item 19 of this annual report, we incorporate by reference certain information we filed
with the Securities and Exchange Commission. This means that we can disclose important information to you by referring you to
another document filed separately with the Securities and Exchange Commission. The information incorporated by reference is
considered to be part of this annual report.
You may read and copy this annual report, including the exhibits incorporated by reference in this annual report, at the Securities
and Exchange Commission’s Public Reference Room at 100 F Street, N.E., Washington, D.C. 20549 and at the Securities and Exchange
Commission’s regional offices in New York, New York and Chicago, Illinois. You can also request copies of this annual report,
including the exhibits incorporated by reference in this annual report, upon payment of a duplicating fee, by writing information on the
operation of the Securities and Exchange Commission’s Public Reference Room.
The Securities and Exchange Commission also maintains a website at www.sec.gov that contains reports, proxy statements and
other information regarding registrants that file electronically with the Securities and Exchange Commission. Our annual report and
some of the other information submitted by us to the Securities and Exchange Commission may be accessed through this web site.
I. Subsidiary Information
Not applicable.
ITEM 11. QUANTITATIVE AND QUALITATIVE DISCLOSURES ABOUT MARKET RISK
Market risk is the risk of loss related to adverse changes in market prices, including interest rates and foreign exchange rates, of
financial instruments. We are exposed to various types of market risks, including changes in interest rates and foreign currency
exchange rates, in the normal course of business.
We use financial instruments, including variable rate debt and swaps and foreign exchange spot transactions, to manage risks
associated with our interest rate and foreign currency exposures through a controlled program of risk management in accordance with
established policies. These policies are reviewed and approved by our board of directors and stockholders’ meeting. Our treasury
operations are subject to internal audit on a regular basis. We do not hold or issue derivative financial instruments for speculatively
purposes.
Since export sales are primarily conducted in U.S. dollars, we had U.S. dollar-denominated accounts receivable of US$644 million
as of December 31, 2017. As of the same date, we also had Japanese Yen-denominated accounts receivable of ¥2,051 million
attributable to our Japanese operations and Renminbi-denominated accounts receivable of RMB¥428 million attributable to our China
operations. We had U.S. dollar-, Japanese Yen- and Renminbi-denominated accounts payables of US$120 million, ¥1,196 million and
RMB¥132 million, respectively, as of December 31, 2017.
Our primary market risk exposures relate to interest rate movements on borrowings and exchange rate movements on foreign
currency-denominated accounts receivable, capital expenditures relating to equipment used in manufacturing processes (including photo
etching and chemical vapor deposition) and purchased primarily from Europe, Japan and the United States.
85

The following table provides information as of December 31, 2017 on our market risk sensitive financial instruments.
As of December 31, 2017
Carrying Amount Fair Amount
(in NT$ millions)
Time Deposits: Non-Trading Purpose 53,357 53,357
Short-term Loans: Non-Trading Purpose 25,446 25,446
Bonds: Non-Trading Purpose 48,518 49,343
Long-term Loans: Non-Trading Purpose 32,165 32,165
Interest Rate Risk
Our major market risk exposure is changing interest rates. Our exposure to market risk for changes in interest rates relates
primarily to our long-term debt obligations. We primarily enter into debt obligations to support general corporate purposes including
capital expenditures and working capital needs.
The tables below provide information of UMC as of December 31, 2017 about our financial instruments that are sensitive to
changes in interest rates, including debt obligations and certain assets. For debt obligations, the table presents principal cash flows and
related weighted average interest rates by expected maturity dates. The information is presented in the currencies in which the
instruments are denominated.
Expected Maturity Dates As of December 31, 2017
2018 2019 2020 2021
2022 and
thereunder Total Fair Value
(in millions, except percentages)
Time Deposits:
Fixed Rate (US$) 737.1 737.1 737.1
Average Interest Rate 1.48% 1.48% 1.48%
Fixed Rate (¥ JPY)
Average Interest Rate
Fixed Rate (RMB¥) 114.92 114.92 114.92
Average Interest Rate 1.96% 1.96% 1.96%
Fixed Rate (NT$) 1,892.77 1,892.77 1,892.77
Average Interest Rate 3.30% 3.30% 3.30%
Short-term Loans:
Variable Rate (US$) 559.96 559.96 559.96
Average Interest Rate 2.22% 2.22% 2.22%
Variable Rate ((NT$) 24.28% 24.28% 24.28%
Average Interest Rate 3.91% 3.91% 3.91%
Variable Rate (€) 49.11 49.11 49.11
Average Interest Rate 1.05% 1.05% 1.05%
Variable Rate (¥ JPY) 5,503.51 5,503.51 5,503.51
Average Interest Rate 0.99% 0.99% 0.99%
Unsecured Long-term Loans:
Variable Rate (NT$) 973 599 349 100 2,021 2,021
Average Interest Rate 1.61% 1.87% 1.78% 1.22% 1.70% 1.70%
Fixed Rate (NT$)
Average Interest Rate
Secured Long-term Loans:
Variable Rate (NT$) 12 12 6 29 29
Average Interest Rate 2.67% 2.67% 2.67% 2.67% 2.67%
Variable Rate (RMB¥)
Average Interest Rate
Variable Rate (US$) 40 40 100 100 520 800 800
Average Interest Rate 4.32% 4.32% 4.32% 4.32% 4.32% 4.32% 4.32%
Bonds:
Unsecured (NT$) 7,500 7,500 7,512
Fixed Rate 1.35% 1.35% 1.35%
86

Expected Maturity Dates As of December 31, 2017
2018 2019 2020 2021
2022 and
thereunder Total
Fair
Value
(in millions, except percentages)
Unsecured (NT$) 2,500 2,500 2,531
Fixed Rate 1.63% 1.63% 1.63%
Unsecured (NT$) 2,500 2,500 2,496
Fixed Rate 1.50% 1.50% 1.50%
Unsecured (NT$) 2,000 2,000 1,999
Fixed Rate 1.70% 1.70% 1.70%
Unsecured (NT$) 3,000 3,000 3,088
Fixed Rate 1.95% 1.95% 1.95%
Unsecured (NT$) 6,200 6,200 6,259
Fixed Rate 1.15% 1.15% 1.15%
Unsecured (NT$) 2,100 2,100 2,138
Fixed Rate 1.43% 1.43% 1.43%
Unsecured (NT$) 2,000 2,000 2,000
Fixed Rate 0.94% 0.94% 0.94%
Unsecured (NT$) 3,400 3,400 3,400
Fixed Rate 1.13% 1.13% 1.13%
Foreign Currency Risk
Although the majority of our transactions are in NT dollars, some transactions are based in other currencies. The primary foreign
currency to which we are exposed is the U.S. dollar. We have in the past, and may in the future, enter into short-term, foreign currency
forward contracts to hedge the impact of foreign currency fluctuations on certain underlying assets, liabilities, and firm commitments
for operating expenses and capital expenditures denominated in U.S. dollars and other foreign currencies. The purpose of entering into
these hedges is to minimize the impact of foreign currency fluctuations on the results of operations. We use the policy of natural
hedging to reduce our foreign exchange exposure arising out of changes in the rates of exchange among the U.S. dollar and other
foreign currencies. As a general matter, our natural hedging strategy relies on matching revenues and costs for the same currency or
offsetting losses in one currency with gains in another.
As of December 31, 2016, we had US$285 million outstanding in foreign currency forward contracts to sell U.S. dollars against
NT dollars. All such foreign currency forward contracts expired in 2017 and no outstanding amount was recorded as of December 31,
2017.
We believe that we did not have material market risks as of December 31, 2017.
ITEM 12. DESCRIPTION OF SECURITIES OTHER THAN EQUITY SECURITIES
A. Debt Securities
Not applicable.
B. Warrants and Rights
Not applicable.
C. Other Securities
Not applicable.
87

D. American Depositary Shares
Depositary Fees and Charges
Under the terms of the deposit agreement for our ADSs, an ADS holder may have to pay the following service fees to the
depositary:
Service Fees
Issuance of ADSs Up to US$0.05 per ADS issued
Cancellation of ADSs Up to US$0.05 per ADS canceled
Distribution of cash dividends or other cash
distributions
Up to US$0.05 per ADS held
Distribution of ADSs pursuant to stock dividends, free
stock distributions or exercises of rights
Up to US$0.05 per ADS held
Distribution of securities other than ADSs or rights to
purchase additional ADSs
Up to US$0.05 per ADS held
In addition, an ADS holder shall be responsible for the following charges:
• taxes (including applicable interest and penalties) and other governmental charges;
• such registration fees as may from time to time be in effect for the registration of common shares or other deposited
securities on the share register and applicable to transfers of common shares or other deposited securities to or from the name
of the custodian, the depositary or any nominees upon the making of deposits and withdrawals, respectively;
• such cable, telex and facsimile transmission and delivery expenses as are expressly provided in the deposit agreement to be
at the expense of ADS holders and beneficial owners of ADSs;
• the expenses and charges incurred by the depositary in the conversion of foreign currency;
• such fees and expenses as are incurred by the depositary in connection with compliance with exchange control regulations
and other regulatory requirements applicable to common shares, deposited securities, ADSs and ADRs;
• the fees and expenses incurred by the depositary, the custodian or any nominee in connection with the servicing or delivery
of deposited securities; and
• Depositary fees payable upon the issuance and cancellation of ADSs are typically paid to the depositary by the brokers (on
behalf of their clients) receiving the newly-issued ADSs from the depositary and by the brokers (on behalf of their clients)
delivering the ADSs to the depositary for cancellation. The brokers in turn charge these transaction fees to their clients.
Depositary fees payable in connection with distributions of cash or securities to ADS holders and the depositary services fee are
charged by the depositary to the holders of record of ADSs as of the applicable ADS record date. The depositary fees payable for cash
distributions are generally deducted from the cash being distributed. In the case of distributions other than cash (i.e., stock dividends,
rights offerings), the depositary charges the applicable fee to the ADS record date holders concurrent with the distribution. In the case
of ADSs registered in the name of the investor (whether certificated or un-certificated in direct registration), the depositary sends
invoices to the applicable record date ADS holders. In the case of ADSs held in brokerage and custodian accounts via the central
clearing and settlement system, The Depository Trust Company, or DTC, the depositary generally collects its fees through the systems
provided by DTC (whose nominee is the registered holder of the ADSs held in DTC) from the brokers and custodians holding ADSs in
their DTC accounts. The brokers and custodians who hold their clients’ ADSs in DTC accounts in turn charge their clients’ accounts the
amount of the fees paid to the depositary.
In the event of refusal to pay the depositary fees, the depositary may, under the terms of the deposit agreement, refuse the
requested service until payment is received or may set off the amount of the depositary fees from any distribution to be made to the
ADS holder.
The fees and charges ADS holders may be required to pay may vary over time and may be changed by us and by the depositary.
ADS holders will receive prior notice of such changes.
88

Depositary Payments
In 2017, we received the following payments from JPMorgan Chase & Co., the depositary for our ADR program through
December 31, 2017.
Service Fees (US$)
Reimbursement of listing fees 106,664.60
Reimbursement of U.S. SEC filing fees 125,176.80
Reimbursement of accounting supporting fees for FASB and Public
Company Accounting Oversight Board
1,820.00
Reimbursement of annual ordinary stockholders’ meeting expenses 0.00
Reimbursement of fees in connection with annual financial and Sarbanes-
Oxley Act of 2002 audit
1,370,521.73
Contribution to our company’s investor relations efforts 57,539.66
Others 284,578.35
Total 1,946,301.14
PART II.
ITEM 13. DEFAULTS, DIVIDEND ARREARAGES AND DELINQUENCIES
None of these events occurred in any of 2015, 2016 and 2017.
ITEM 14. MATERIAL MODIFICATIONS TO THE RIGHTS OF SECURITY HOLDERS AND USE OF PROCEEDS
None.
ITEM 15. CONTROLS AND PROCEDURES
Disclosure Controls and Procedures
As of December 31, 2017, an evaluation has been carried out under the supervision and with the participation of our management,
including our Co-presidents and our Chief Financial Officer, of the effectiveness of our disclosure controls and procedures, as such term
is defined under Rules 13a-15(e) and 15d-15(e) promulgated under the Securities Exchange Act of 1934, as amended. Based on that
evaluation, our Co-presidents and Chief Financial Officer have concluded that our disclosure controls and procedures were effective as
of December 31, 2017.
Management’s Annual Report on Internal Control over Financial Reporting
Our management is responsible for establishing and maintaining adequate internal control over financial reporting, as such term is
defined in Rule 13a-15(f) and 15d-15(f) under the Securities Exchange Act of 1934, as amended, for our company. A company’s
internal control over financial reporting is a process designed to provide reasonable assurance regarding the reliability of financial
reporting and the preparation of financial statements in accordance with International Financial Reporting Standards as issued by
International Accounting Standards Board.
Because of its inherent limitations, internal control over financial reporting may not prevent or detect misstatements. Also,
projections of any evaluation of effectiveness to future periods are subject to the risk that controls may become inadequate because of
changes in conditions, or that the degree of compliance with the policies or procedures may deteriorate.
89

As required by Section 404 of the Sarbanes-Oxley Act of 2002 and related rules as promulgated by the Securities and Exchange
Commission, our management assessed the effectiveness of our internal control over financial reporting as of December 31, 2017 using
the criteria established in Internal Control-Integrated Framework issued by the Committee of Sponsoring Organizations of the
Treadway Commission (2013 framework), or the COSO criteria. Based on this assessment, our management concluded that our internal
control over financial reporting was effective as of December 31, 2017 based on the COSO criteria. Our independent registered public
accounting firm, Ernst & Young has issued an attestation report with unqualified opinion on the effectiveness of our internal control
over financial reporting as of December 31, 2017, which is included immediately following this report.
Attestation Report of the Independent Registered Public Accounting Firm
REPORT OF INDEPENDENT REGISTERED PUBLIC ACCOUNTING FIRM
To the Stockholders and the Board of Directors of United Microelectronics Corporation:
Opinion on Internal Control over Financial Reporting
We have audited United Microelectronics Corporation and subsidiaries’ internal control over financial reporting as of December 31,
2017, based on criteria established in Internal Control—Integrated Framework issued by the Committee of Sponsoring Organizations of
the Treadway Commission (2013 framework) (the COSO criteria). In our opinion, United Microelectronics Corporation and
subsidiaries (the Company) maintained, in all material respects, effective internal control over financial reporting as of December 31,
2017, based on the COSO criteria.
We also have audited, in accordance with the standards of the Public Company Accounting Oversight Board (United States) (PCAOB),
the consolidated balance sheets of the Company as of December 31, 2016 and 2017, the related consolidated statements of
comprehensive income, changes in equity and cash flows for each of the three years in the period ended December 31, 2017, and the
related notes (collectively referred to as the “consolidated financial statements”) and our report dated April 26, 2018 expressed an
unqualified opinion thereon.
Basis for Opinion
The Company’s management is responsible for maintaining effective internal control over financial reporting and for its assessment of
the effectiveness of internal control over financial reporting included in the accompanying Management’s Annual Report on Internal
Control over Financial Reporting. Our responsibility is to express an opinion on the Company’s internal control over financial reporting
based on our audit. We are a public accounting firm registered with the PCAOB and are required to be independent with respect to the
Company in accordance with the U.S. federal securities laws and the applicable rules and regulations of the Securities and Exchange
Commission and the PCAOB.
We conducted our audit in accordance with the standards of the PCAOB. Those standards require that we plan and perform the audit to
obtain reasonable assurance about whether effective internal control over financial reporting was maintained in all material respects.
Our audit included obtaining an understanding of internal control over financial reporting, assessing the risk that a material weakness
exists, testing and evaluating the design and operating effectiveness of internal control based on the assessed risk, and performing such
other procedures as we considered necessary in the circumstances. We believe that our audit provides a reasonable basis for our
opinion.
Definition and Limitations of Internal Control Over Financial Reporting
A company’s internal control over financial reporting is a process designed to provide reasonable assurance regarding the reliability of
financial reporting and the preparation of financial statements for external purposes in accordance with generally accepted accounting
principles. A company’s internal control over financial reporting includes those policies and procedures that (1) pertain to the
maintenance of records that, in reasonable detail, accurately and fairly reflect the transactions and dispositions of the assets of the
company; (2) provide reasonable assurance that transactions are recorded as necessary to permit preparation of financial statements in
accordance with generally accepted accounting principles, and that receipts and expenditures of the company are being made only in
accordance with authorizations of management and directors of the company; and (3) provide reasonable assurance regarding
prevention or timely detection of unauthorized acquisition, use, or disposition of the company’s assets that could have a material effect
on the financial statements.
90

Because of its inherent limitations, internal control over financial reporting may not prevent or detect misstatements. Also, projections
of any evaluation of effectiveness to future periods are subject to the risk that controls may become inadequate because of changes in
conditions, or that the degree of compliance with the policies or procedures may deteriorate.
/s/ Ernst & Young
Taipei, Taiwan
Republic of China
April 26, 2018
ITEM 16.
ITEM 16A. AUDIT COMMITTEE FINANCIAL EXPERT
Our board of directors has determined that Cheng-Li Huang and Wenyi Chu, two of our independent directors, qualify as audit
committee financial experts as defined in Item 16A of Form 20-F and are independent in accordance with the applicable requirements
of Rule 10A-3 of the Securities Exchange Act of 1934 requirement.
The U.S. Securities and Exchange Commission has indicated that the designation of Dr. Huang and Dr. Chu as the audit
committee financial experts does not: (i) make Dr. Huang or Dr. Chu an “expert” for any purpose, including without limitation for
purposes of Section 11 of the Securities Act of 1933, as amended, as a result of this designation; (ii) impose any duties, obligations or
liability on Dr. Huang or Dr. Chu that are greater than those imposed on them as a member of the audit committee and our board of
directors in the absence of such designation; or (iii) affect the duties, obligations or liability of any other member of the audit committee
or our board of directors.
ITEM 16B. CODE OF ETHICS
We amended the Code of Ethics for Directors and Officers in June 2009, and the Employee Code of Conduct in October 2011.
The Employee Code of Conduct, which is applicable to all employees, replaced the code of ethics filed with the Securities and
Exchange Commission in our 2003 annual report on Form 20-F. We have also created a separate code of ethics applicable to our
directors and officers. A copy of each of the Code of Ethics for Directors and Officers and the Employee Code of Conduct are displayed
on our website at http://www.umc.com/english/pdf/Code of Ethics.pdf and http://www.umc.com/english/pdf/Code of Conduct.pdf,
respectively. Stockholders may request a hard copy of the Code of Ethics for Directors and Officers and the Employee Code of Conduct
free of charge. Please contact the investor relations department of our company at [email protected].
ITEM 16C. PRINCIPAL ACCOUNTANT FEES AND SERVICES
The following table sets forth the aggregate fees by categories specified below in connection with certain professional services
rendered by Ernst & Young, our principal external auditors, for the years indicated.
Years ended December 31,
2016 2017
NT$ NT$ US$
(in thousands)
Audit Fees (1) 56,336 57,242 1,931
Audit-related Fees (2) 1,024 1,153 39
Tax Fees (3) 4,467 10,055 339
Total 61,827 68,450 2,309
91

(1) Audit fees consist of fees associated with the annual audit, review of our quarterly financial statements, statutory audits and
internal control review. They also include fees billed for those services that are normally provided by the independent accountants
in connection with statutory and regulatory filings.
(2) Audit-related fees consist of fees billed for assurance and services related to the performance of the audit or review of our
financial statements but not described in footnote (1) above. These services include certification of our Singapore Branch to
Singapore authorities and application for corporation registration.
(3) Tax fees include fees billed for professional services rendered by Ernst & Young, primarily in connection with our tax compliance
activities.
All audit and non-audit services performed by Ernst & Young were pre-approved by our audit committee. In certain
circumstances, the audit committee delegates to one designated member to pre-approve such audit and non-audit services. Pre-approval
by a designated member should be reported to the audit committee at its upcoming meeting.
ITEM 16D. EXEMPTIONS FROM THE LISTING STANDARDS FOR AUDIT COMMITTEES
None.
ITEM 16E. PURCHASE OF EQUITY SECURITIES BY THE ISSUER AND AFFILIATED PURCHASERS
Since March 2004, we have from time to time announced plans, which were not binding on us, to buy back our common shares up
to a certain amount on the Taiwan Stock Exchange. On July 29, 2015, we announced our 16th share buy-back plan since our board of
directors resolved to purchase up to 200 million shares on the Taiwan Stock Exchange at a price between NT$7.55 and NT$18.80 per
share during the period from July 30, 2015 to September 29, 2015. On May 11, 2016, we announced our 17th share buy-back plan since
our board of directors resolved to purchase up to 200 million shares on the Taiwan Stock Exchange at a price between NT$7.90 and
NT$18.70 per share during the period from May 12, 2016 to July 11, 2016. On March 7, 2018, we announced our 18th share buy-back
plan after our board of directors resolved to purchase up to 200 million shares on the Taiwan Stock Exchange at a price between
NT$9.85 and NT$21.30 per share during the period from March 8, 2018 to May 7, 2018. The table below sets forth the repurchases we
made in the periods indicated.
Month
Total Number of
Common Shares
Purchased
Average Price
Paid per Common
Share (NT$)
Total Number of
Common Shares
Purchased as Part
of Publicly
Announced Plans
or Program
Maximum
Number of Shares
that May Yet be
Purchased Under
the Plans or
Program
July 2015 (from July 30, 2015) 6,000,000 11.20 6,000,000 194,000,000
August 2015 127,000,000 10.92 133,000,000 67,000,000
September 2015 (till September 15, 2015) 67,000,000 11.17 200,000,000 —
May 2016 (from May 12, 2016) 119,000,000 11.73 119,000,000 81,000,000
June 2016 (till June 13, 2016) 81,000,000 12.33 200,000,000 —
March 2018 (till March 8, 2018) 39,607,000 15.19 39,607,000 160,393,000
April 2018 (till April 25, 2018) 81,556,000 15.47 121,163,000 78,837,000
ITEM 16F. CHANGE IN REGISTRANT’S CERTIFYING ACCOUNTANT
Not applicable.
ITEM 16G.CORPORATE GOVERNANCE
As a R.O.C. company listed on the New York Stock Exchange, or NYSE, we are subject to the U.S. corporate governance rules to
the extent that these rules are applicable to foreign private issuers. The following summary details the significant differences between
our corporate governance practices and corporate governance standards for U.S. companies (i.e. non-foreign private issuers) under the
NYSE listing standards.
92

The Legal Framework. In general, corporate governance principles for Taiwanese companies are set forth in the Company Act of
the Republic of China, or the R.O.C. Company Act, the R.O.C. Securities Exchange Act and, to the extent they are listed on the Taiwan
Stock Exchange, under listing rules of the Taiwan Stock Exchange. Corporate governance principles under provisions of R.O.C. law
may differ in significant ways to corporate governance standards for U.S. companies listed on the NYSE. Committed to high standards
of corporate governance, we have generally brought our corporate governance in line with U.S. regulations, including the formation of
an audit committee. However, we have not adopted certain recommended NYSE corporate governance standards where such standards
are contrary to R.O.C. laws or regulations or generally prevailing business practices in Taiwan.
Independent Board Members. Under the NYSE listing standards applicable to U.S. companies, independent directors must
comprise a majority of the board of directors. We currently have three independent directors out of a total of eight directors on our
board of directors. Our standards for determining director independence substantially comply with the NYSE listing standards, which
include detailed tests for determining director independence. In addition, even though our independent directors meet in committee
meetings of which they are committee members, we will not hold executive sessions of non-management directors. Such requirement is
contrary to the R.O.C. Company Act.
Board Committees. Under the NYSE listing standards, companies are required to have a nominating/corporate governance
committee, composed entirely of independent directors. In addition to identifying individuals qualified to become board members, the
nominating/corporate committee must develop and recommend to the board a set of corporate governance principles. We recently
established a nominating committee in December 2017, which consists of three of our independent directors. The nominating
committee is expected to assist our board to constitute a nomination policy and succession plans of the directors and the executives. We
currently do not have a corporate governance committee, as such committee is not required under R.O.C. requirements. Our board of
directors is responsible for regularly reviewing our corporate governance standards and practices.
Under the NYSE listing standards, companies are required to have a compensation committee, composed entirely of independent
directors. Under the R.O.C. Company Act, however, companies incorporated in the R.O.C. are not required to have a compensation
committee with the same standards as the NYSE listing standards, but publicly listed companies in the R.O.C. must have a
remuneration committee in accordance with the applicable laws and rules in the R.O.C. Since 2011, we have established a remuneration
committee composed of all the independent directors and convened meetings accordance with the applicable laws and rules in the
R.O.C. The remuneration committee is responsible for determining the form and amount of compensation for each of our directors and
executive officers under our articles of incorporation and the remuneration committee charter. In addition to the compensation approved
at the annual general meeting, in the event we have net income in any fiscal year, we will distribute 0.1% of our earnings after payment
of all income taxes, deduction of any past losses and allocation of 10% of our net income for legal reserves, as remuneration to our
directors pursuant to our articles of incorporation.
Equity Compensation Plans. The NYSE listing standards also require that a company’s stockholders must approve equity
compensation plans. Under the corresponding requirements in the R.O.C. Company Act and the R.O.C. Securities Exchange Act,
stockholders’ approval is required for the distribution of employee bonuses in the form of stock, while the board of directors has
authority, subject to the approval of the R.O.C. Securities and Futures Bureau, to approve employee stock option plans and to grant
options to employees pursuant to such plans and also has authority to approve share buy-back programs for the purpose of selling
common shares so purchased to employees and the sale of such common shares to employees pursuant to such programs. We intend to
follow only the R.O.C. requirements.
ITEM 16H. MINE SAFETY DISCLOSURE
Not applicable.
93

PART III.
ITEM 17. FINANCIAL STATEMENTS
Not applicable.
ITEM 18. FINANCIAL STATEMENTS
The following is a list of the audited consolidated financial statements and report of independent registered public accounting
firm included in this annual report beginning on page F-1.
Page
Consolidated Financial Statements of United Microelectronics Corporation and Subsidiaries F-1
Report of Independent Registered Public Accounting Firm F-2
Consolidated Balance Sheets as of December 31, 2016 and 2017 F-3
Consolidated Statements of Comprehensive Income for the years ended December 31, 2015, 2016 and 2017 F-4
Consolidated Statements of Changes in Equity for the years ended December 31, 2015, 2016 and 2017 F-5
Consolidated Statements of Cash Flows for the years ended December 31, 2015, 2016 and 2017 F-8
Notes to the Consolidated Financial Statements F-10
ITEM 19. EXHIBITS
Exhibit
Number Description of Exhibits
1.1 Articles of Incorporation of the Company as last amended on June 15, 2011 (1)
2.1 Amended and Restated Deposit Agreement by and among the Company, JPMorgan Chase Bank, N.A., as depositary, and
the Holders and Beneficial Owners of American Depositary Shares evidenced by American Depositary Receipts issued
thereunder dated as of October 21, 2009 (2)
2.2 Form of Amendment No. 1 to the Amended and Restated Deposit Agreement among the Company, JPMorgan Chase
Bank, N.A., as depositary, and the Holders and Beneficial Owners of American Depositary Shares evidenced by
American Depositary Receipts issued thereunder (3)
4.1 Lease Agreement with Hsinchu Science Park Administration in relation to government-owned land located at Hsinchu
Science Park, Ko-Kuan Section, No. 20-22, Hsinchu, Taiwan, R.O.C., the site of Fab 6A (in Chinese with English
summary translation) (4)
4.2 Lease Agreement with Hsinchu Science Park Administration in relation to government-owned land located at Hsinchu
Science Park, third section of first phase, Hsinchu, Taiwan, R.O.C., the site of Fab 8A and United Tower (in Chinese with
English summary translation) (5) (P)
4.3 Lease Agreement with Hsinchu Science Park Administration in relation to government-owned land located at Hsinchu
Science Park, third section of first phase, Hsinchu, Taiwan, R.O.C., the site of Fab 8C (in Chinese with English summary
translation) (6) (P)
4.4 Lease Agreement with Hsinchu Science Park Administration in relation to government-owned land located at Hsinchu
Science Park, third section of first phase, Hsinchu, Taiwan, R.O.C., the site of Fab 8D (in Chinese with English summary
translation) (7) (P)
4.5 Lease Agreement with Hsinchu Science Park Administration in relation to government-owned land located at Hsinchu
Science Park, third section of second phase, Hsinchu, Taiwan, R.O.C., the site of Fab 8E (in Chinese with English
summary translation) (8) (P)
94

Exhibit
Number Description of Exhibits
4.6 Lease Agreement with Hsinchu Science Park Administration in relation to government-owned land located at Hsinchu
Science Park, Gin-Shan section, Hsinchu, Taiwan, R.O.C., the site of Fab 8F (in Chinese with English summary
translation) (9) (P)
4.7 Lease Agreement with Southern Taiwan Science Park Administration in relation to government-owned land located at
Tainan Science Park, Tainan, Taiwan, R.O.C., the site of Fab 12A (in Chinese with English summary translation) (10)
(P)
4.8 Merger Agreement, entered into as of February 26, 2004, between United Microelectronics Corporation and SiS
Microelectronics Corporation (English Translation) (11)
4.9 Lease Agreement with Hsinchu Science Park Administration in relation to government-owned land located at Hsinchu
Science Park, Ko-Kuan section, Hsinchu, Taiwan, R.O.C., the site of Fab 8S (in Chinese with English summary
translation) (12)
4.10 Lease Agreement with JTC Corporation in relation to land located at Pasir Ris Wafer Fab Park, Singapore, the site of
Fab12i (summary) (13)
4.11 Merger Agreement, entered into as of April 29, 2009, among United Microelectronics Corporation, Infoshine
Technology Limited and Best Elite International Limited (14)
*8.1 List of Significant Subsidiaries of United Microelectronics Corporation
11.1 Code of Ethics for Directors and Officers (15)
11.2 Employee Code of Conduct (16)
*12.1 Certification of our Co-president pursuant to Section 302 of the Sarbanes-Oxley Act of 2002
*12.2 Certification of our Co-president pursuant to Section 302 of the Sarbanes-Oxley Act of 2002
*12.3 Certification of our Chief Financial Officer pursuant to Section 302 of the Sarbanes-Oxley Act of 2002
*13.1 Certification of our Co-president pursuant to 18 U.S.C.§ 1350, as adopted pursuant to Section 906 of the Sarbanes-
Oxley Act of 2002
*13.2 Certification of our Co-president pursuant to 18 U.S.C.§ 1350, as adopted pursuant to Section 906 of the Sarbanes-
Oxley Act of 2002
*13.3 Certification of our Chief Financial Officer pursuant to 18 U.S.C.§ 1350, as adopted pursuant to Section 906 of the
Sarbanes-Oxley Act of 2002
*15.1 Consent of Independent Registered Public Accounting Firm
*101.INS XBRL Instance Document
*101.SCH XBRL Taxonomy Extension Schema Document
*101.CAL XBRL Taxonomy Extension Calculation Linkbase Document
*101.DEF XBRL Taxonomy Extension Definition Linkbase Document
*101.LAB XBRL Taxonomy Extension Label Linkbase Document
*101.PRE XBRL Taxonomy Extension Presentation Linkbase Document
* Filed herewith.
(1) Incorporated by reference to Exhibit 1.1 to Registrant’s Annual Report on Form 20-F for the fiscal year ended December 31, 2013
(File No. 001-15128) filed with the Commission on April 18, 2014.
(2) Incorporated by reference to Exhibit (a) to the Registrant’s Registration Statement on Form F-6 (File No. 333- 162437) filed with
the Commission on October 13, 2009.
(3) Incorporated by reference to Exhibit (a)(2) to the Registrant’s Registration Statement on Form F-6 (File No. 333- 172990) filed
with the Commission on April 12, 2017.
95

(4) Incorporated by reference to Exhibit 4.1 to Registrant’s Annual Report on Form 20-F for the fiscal year ended December 31, 2006
(File No. 001-15128) filed with the Commission on May 9, 2007.
(5) Incorporated by reference to Exhibit 10.7 to the Registrant’s Registration Statement on Form F-1 (File No. 333-12444) filed with
the Commission on August 28, 2000, as amended.
(6) Incorporated by reference to Exhibit 10.8 to the Registrant’s Registration Statement on Form F-1 (File No. 333-12444) filed with
the Commission on August 28, 2000, as amended.
(7) Incorporated by reference to Exhibit 10.9 to the Registrant’s Registration Statement on Form F-1 (File No. 333-12444) filed with
the Commission on August 28, 2000, as amended.
(8) Incorporated by reference to Exhibit 10.10 to the Registrant’s Registration Statement on Form F-1 (File No. 333-12444) filed with
the Commission on August 28, 2000, as amended.
(9) Incorporated by reference to Exhibit 10.11 to the Registrant’s Registration Statement on F-1 (File No. 333-12444) filed with the
Commission on August 28, 2000, as amended.
(10) Incorporated by reference to Exhibit 10.12 to the Registrant’s Registration Statement on F-1 (File No. 333-12444) filed with the
Commission on August 28, 2000, as amended.
(11) Incorporated by reference to Exhibit 4.8 to the Registrant’s Annual Report on Form 20-F for the fiscal year ended December 31,
2003 (File No. 1-15128) filed with the Commission on June 17, 2004.
(12) Incorporated by reference to Exhibit 4.9 to Registrant’s Annual Report on Form 20-F for the fiscal year ended December 31, 2006
(File No. 001-15128) filed with the Commission on May 9, 2007.
(13) Incorporated by reference to Exhibit 4.10 to Registrant’s Annual Report on Form 20-F for the fiscal year ended December 31,
2006 (File No. 001-15128) filed with the Commission on May 9, 2007.
(14) Incorporated by reference to Exhibit 99.1 to the Form 6-K furnished to the Commission on May 8, 2009.
(15) Incorporated by reference to Exhibit 99.1 to the Form 6-K furnished to the Commission on March 25, 2005.
(16) Incorporated by reference to Exhibit 99.2 to the Form 6-K furnished to the Commission on May 26, 2006.
(P) Paper exhibits
96

SIGNATURES
The registrant hereby certifies that it meets all of the requirements for filing on Form 20-F and that it has duly caused and
authorized the undersigned to sign this annual report on its behalf.
UNITED MICROELECTRONICS CORPORATION
By: /s/ CHITUNG LIU
Name: Chitung Liu
Title: Director, Chief Financial Officer and Vice President
Date: April 26, 2018

United Microelectronics Corporation and Subsidiaries
Consolidated Financial Statements for years ended December 31, 2015, 2016 and 2017
Together with Report of Independent Registered Public Accounting Firm
F-1

REPORT OF INDEPENDENT REGISTERED PUBLIC ACCOUNTING FIRM
To the Stockholders and the Board of Directors of United Microelectronics Corporation
Opinion on the Financial Statements
We have audited the accompanying consolidated balance sheets of United Microelectronics Corporation and subsidiaries (the
Company) as of December 31, 2016 and 2017, the related consolidated statements of comprehensive income, changes in equity and
cash flows for each of the three years in the period ended December 31, 2017, and the related notes (collectively referred to as the
“consolidated financial statements”). In our opinion, the consolidated financial statements present fairly, in all material respects, the
financial position of the Company at December 31, 2016 and 2017, and the results of its operations and its cash flows for each of the
three years in the period ended December 31, 2017, in conformity with International Financial Reporting Standards as issued by the
International Accounting Standards Board.
We also have audited, in accordance with the standards of the Public Company Accounting Oversight Board (United States) (PCAOB),
the Company’s internal control over financial reporting as of December 31, 2017, based on criteria established in Internal Control-
Integrated Framework issued by the Committee of Sponsoring Organizations of the Treadway Commission (2013 framework) and our
report dated April 26, 2018 expressed an unqualified opinion thereon.
Basis for Opinion
These financial statements are the responsibility of the Company’s management. Our responsibility is to express an opinion on the
Company’s financial statements based on our audits. We are a public accounting firm registered with the PCAOB and are required to be
independent with respect to the Company in accordance with the U.S. federal securities laws and the applicable rules and regulations of
the Securities and Exchange Commission and the PCAOB.
We conducted our audits in accordance with the standards of the PCAOB. Those standards require that we plan and perform the audit to
obtain reasonable assurance about whether the financial statements are free of material misstatement, whether due to error or fraud. Our
audits included performing procedures to assess the risks of material misstatement of the financial statements, whether due to error or
fraud, and performing procedures that respond to those risks. Such procedures included examining, on a test basis, evidence regarding
the amounts and disclosures in the financial statements. Our audits also included evaluating the accounting principles used and
significant estimates made by management, as well as evaluating the overall presentation of the financial statements. We believe that
our audits provide a reasonable basis for our opinion.
/s/ Ernst & Young
We have served as the Company’s auditor since 2000.
Taipei, Taiwan
Republic of China
April 26, 2018
F-2

UNITED MICROELECTRONICS CORPORATION AND SUBSIDIARIES
CONSOLIDATED BALANCE SHEETS
As of December 31, 2016 and 2017
(Expressed in Thousands, Except for Par Value)
As of December 31,
Notes 2016 2017
NT$ NT$ US$
Assets
Current assets
Cash and cash equivalents 4, 6(1) 57,578,981 81,674,572 2,755,552
Financial assets at fair value through profit or loss, current 4, 5, 6(2), 11(7) 714,169 716,918 24,188
Notes receivable 4 8,029 6,283 212
Accounts receivable, net 4, 6(3) 22,901,461 20,876,417 704,333
Accounts receivable-related parties, net 4, 7 136,910 91,065 3,072
Other receivables 4 918,652 1,175,307 39,653
Current tax assets 4 38,022 625,343 21,098
Inventories, net 4, 5, 6(4) 16,997,815 18,257,500 615,975
Other current assets 11,175,555 15,854,553 534,904
Total current assets 110,469,594 139,277,958 4,698,987
Non-current assets
Financial assets at fair value through profit or loss, noncurrent 4, 5, 6(2), 11(7) 214,735 191,005 6,444
Available-for-sale financial assets, noncurrent 4, 5, 6(5), 7, 11(7) 20,415,541 20,636,332 696,233
Financial assets measured at cost, noncurrent 4, 6(6) 2,760,615 2,218,472 74,847
Investments accounted for under the equity method 4, 6(7) 8,905,915 7,847,979 264,777
Property, plant and equipment 4, 5, 6(8), 8 224,983,404 205,741,681 6,941,352
Intangible assets 4, 6(9), 7 4,088,303 3,787,509 127,784
Deferred tax assets 4, 5, 6(23) 5,022,395 6,116,129 206,347
Prepayment for equipment 1,178,736 286,090 9,652
Refundable deposits 8 2,203,658 1,903,041 64,205
Other noncurrent assets 8 3,983,819 3,126,024 105,466
Total non-current assets 273,757,121 251,854,262 8,497,107
Total assets 384,226,715 391,132,220 13,196,094
Liabilities and Equity
Current liabilities
Short-term loans 6(10), 6(26) 20,550,801 25,445,540 858,487
Financial liabilities at fair value through profit or loss, current 4, 5, 6(11), 11(7) 60,855 — —
Notes and accounts payable 6,854,849 6,535,570 220,498
Other payables 7 12,400,450 12,962,286 437,324
Payables on equipment 15,036,892 4,671,802 157,618
Current tax liabilities 4 3,995,145 4,851,694 163,687
Current portion of long-term liabilities 4, 6(12), 6(13), 6(26), 8, 11(7) 10,500,929 27,363,822 923,206
Other current liabilities 6(15), 6(26) 3,389,800 6,984,482 235,644
Total current liabilities 72,789,721 88,815,196 2,996,464
Non-current liabilities
Bonds payable 4, 6(12), 6(26), 11(7) 34,481,505 23,675,861 798,781
Long-term loans 6(13), 6(26), 8, 11(7) 26,247,187 29,643,284 1,000,111
Deferred tax liabilities 4, 5, 6(23) 2,397,796 2,327,223 78,516
Net defined benefit liabilities, noncurrent 4, 5, 6(14) 3,968,894 4,138,519 139,626
Guarantee deposits 6(26) 491,089 469,491 15,840
Other noncurrent liabilities 4, 6(15), 6(26), 9(5) 28,904,149 32,441,648 1,094,523
Total non-current liabilities 96,490,620 92,696,026 3,127,397
Total liabilities 169,280,341 181,511,222 6,123,861
Commitments and contingencies 9
Equity attributable to the parent company
Capital 4, 6(16)
Common stock - NT$10 par value 126,243,187 126,243,187 4,259,217
Authorized: 26,000,000 thousand shares
Issued: 12,624,319 thousand shares as of December 31, 2016
Issued: 12,624,319 thousand shares as of December 31, 2017
Additional paid-in capital 4, 6(12), 6(16)
Premiums 36,862,383 36,862,383 1,243,670
Treasury stock transactions 2,491,626 2,612,966 88,157
Transactions with noncontrolling interests 699,976 561,948 18,959
Stock options - conversion right 1,572,121 1,572,121 53,041
Retained earnings 6(16)
Legal reserve 9,070,841 9,902,407 334,089
Unappropriated earnings 43,528,660 43,155,781 1,455,998
Other components of equity 4
Exchange differences on translation of foreign operations 81,553 (5,689,210) (191,944)
Unrealized gain or loss on available-for-sale financial assets 5,127,682 6,347,167 214,142
Treasury stock 4, 6(16) (12,893,384) (12,904,560) (435,377)
Total equity attributable to the parent company 212,784,645 208,664,190 7,039,952
Non-controlling interests 6(16) 2,161,729 956,808 32,281
Total equity 214,946,374 209,620,998 7,072,233
Total liabilities and equity 384,226,715 391,132,220 13,196,094
The accompanying notes are an integral part of the consolidated financial statements.
F-3

UNITED MICROELECTRONICS CORPORATION AND SUBSIDIARIES
CONSOLIDATED STATEMENTS OF COMPREHENSIVE INCOME
For the years ended December 31, 2015, 2016 and 2017
(Expressed in Thousands, Except for Earnings per Share)
For the years ended December 31,
Notes 2015 2016 2017
NT$ NT$ NT$ US$
Net operating revenues 4, 6(18), 7, 12 144,830,421 147,870,124 149,284,706 5,036,596
Operating costs 4, 6(4), 6(14),
6(17), 6(19), 7, 12
(113,061,894) (117,490,694) (122,226,948) (4,123,716)
Gross profit 31,768,527 30,379,430 27,057,758 912,880
Operating expenses 4, 6(14), 6(17),
6(19), 7, 12
Sales and marketing expenses (4,064,053) (4,589,563) (4,233,830) (142,842)
General and administrative expenses (3,730,259) (5,800,810) (4,239,713) (143,040)
Research and development expenses (12,174,824) (13,532,356) (13,669,589) (461,187)
Subtotal (19,969,136) (23,922,729) (22,143,132) (747,069)
Net other operating income and expenses 4, 6(8), 6(15),
6(20), 12
(963,734) (263,125) 1,653,695 55,792
Operating income 10,835,657 6,193,576 6,568,321 221,603
Non-operating income and expenses
Other income 4, 6(21) 1,048,942 899,983 875,587 29,541
Other gains and losses 4, 6(21), 7, 12 1,933,859 859,400 994,092 33,539
Finance costs 6(8), 6(21) (523,865) (1,414,303) (2,495,162) (84,182)
Share of profit or loss of associates and joint ventures 4, 6(7), 12 4,694 (315,666) 157,837 5,325
Bargain purchase gain in acquisition of additional shares of equity investees — — 5,130 173
Exchange gain, net 4, 11 369,311 — 1,565,905 52,831
Exchange loss, net 4, 11 — (1,501,904) — —
Subtotal 2,832,941 (1,472,490) 1,103,389 37,227
Income from continuing operations before income tax 13,668,598 4,721,086 7,671,710 258,830
Income tax expense 4, 5, 6(23), 12 (1,027,500) (552,524) (992,481) (33,485)
Net income 12,641,098 4,168,562 6,679,229 225,345
Other comprehensive income (loss) 6(22)
Items that will not be reclassified subsequently to profit or loss
Remeasurements of defined benefit pension plans 4, 5, 6(14) (40,200) (75,893) (184,186) (6,214)
Share of remeasurements of defined benefit plans of associates and joint
ventures
(1,831) 2,459 1,221 41
Income tax effect 4, 5, 6(23) 6,809 12,899 31,311 1,056
Subtotal (35,222) (60,535) (151,654) (5,117)
Items that may be reclassified subsequently to profit or loss
Exchange differences on translation of foreign operations 2,784,800 (1,815,947) (5,975,203) (201,593)
Unrealized gain (loss) on available-for-sale financial assets (3,760,207) (1,969,636) 581,439 19,617
Share of other comprehensive income (loss) of associates and joint ventures 4, 6(7) (276,317) (331,615) 706,977 23,852
Income tax effect 4, 5, 6(23) 222,327 153,662 23,908 807
Subtotal (1,029,397) (3,963,536) (4,662,879) (157,317)
Total other comprehensive loss, net of tax (1,064,619) (4,024,071) (4,814,533) (162,434)
Total comprehensive income 11,576,479 144,491 1,864,696 62,911
Net income attributable to:
Stockholders of the parent 13,254,071 8,621,147 9,676,698 326,474
Non-controlling interests (612,973) (4,452,585) (2,997,469) (101,129)
12,641,098 4,168,562 6,679,229 225,345
Total comprehensive income attributable to:
Stockholders of the parent 12,251,566 4,629,394 4,973,766 167,806
Non-controlling interests (675,087) (4,484,903) (3,109,070) (104,895)
11,576,479 144,491 1,864,696 62,911
Earnings per share (NTD) 4, 6(24)
Earnings per share-basic 1.07 0.71 0.81 0.03
Earnings per share-diluted 1.02 0.67 0.75 0.03
The accompanying notes are an integral part of the consolidated financial statements.
F-4

UN
IT
ED
MIC
RO
EL
EC
TR
ON
IC
S C
OR
PO
RA
TIO
N A
ND
SU
BS
ID
IA
RIE
S
CO
NS
OL
ID
AT
ED
ST
AT
EM
EN
TS
OF
CH
AN
GE
S I
N E
QU
IT
Y
For t
he y
ear e
nded D
ecem
ber 3
1, 2
015
(E
xp
ressed i
n T
ho
usand
s)
Eq
uity
Attrib
utab
le t
o t
he P
aren
t C
om
pan
y
Cap
ital
Retained
Earn
in
gs
Other C
om
po
nents o
f E
qu
ity
Co
mm
on
Sto
ck
Collected
in
Adv
an
ce
Add
itio
nal
Paid
-in
Cap
ital
Leg
al
Reserv
e
Un
app
ro
priated
Earn
ing
s
Ex
ch
an
ge
Differences
on
Tran
slatio
n
of F
oreig
n
Operations
Unrealized
Gain
or
Lo
ss o
n
Available-
fo
r-S
ale
Financial
Assets
Treasury
Sto
ck
To
tal
No
n-
co
ntro
llin
g
Interests
To
tal
Eq
uity
NT
$N
T$
NT
$N
T$
NT
$N
T$
NT
$N
T$
NT
$N
T$
NT
$
Balance a
s o
f J
an
uary 1
, 201
512
7,2
52
,078
50
,970
39
,923
,32
56,5
11
,844
42
,660
,57
0(87
9,0
26
)
10
,98
6,7
62
(1
0,0
17
,28
8)
216
,48
9,2
35
3,8
49,7
98
220
,33
9,0
33
Ap
pro
priatio
n a
nd d
istribu
tio
n o
f 2
01
4
retain
ed
earn
in
gs
Leg
al r
eserve
—
—
—
1,2
14
,134
(1
,214
,13
4)
—
—
—
—
—
—
Cash d
iv
id
en
ds
—
—
—
—
(6
,939
,32
2)
—
—
—
(6
,93
9,3
22)
—
(6
,93
9,3
22
)
Net i
nco
me f
or t
he y
ear e
nd
ed
Decem
ber 3
1, 2
01
5
—
—
—
—
13
,254
,07
1—
—
—
13
,25
4,0
71
(6
12,9
73
)
12
,64
1,0
98
Oth
er c
om
prehensiv
e i
nco
me (
lo
ss), n
et
of t
ax
fo
r t
he y
ear e
nd
ed
Decem
ber 3
1,
20
15
—
—
—
—
(35
,22
2)
2,8
68
,328
(3
,83
5,6
11
)
—
(1
,00
2,5
05)
(6
2,1
14
)
(1
,06
4,6
19
)
Total c
om
prehen
siv
e i
nco
me (
lo
ss)
—
—
—
—
13
,218
,84
92,8
68
,328
(3
,83
5,6
11
)
—
12
,25
1,5
66
(6
75,0
87
)
11
,57
6,4
79
Sh
are-b
ased
paym
en
t t
ran
sactio
n32
9,2
51
(5
0,9
70
)
254
,97
4—
—
—
—
6
81
,44
51
,21
4,7
00
—
1,2
14,7
00
Em
bed
ded c
on
versio
n o
ptio
ns d
eriv
ed
fro
m c
onv
ertible b
on
ds
—
—
1,5
72
,12
1—
—
—
—
—
1
,57
2,1
21
—
1,5
72,1
21
Treasu
ry
sto
ck
acq
uired
—
—
—
—
—
—
—
(2
,203
,44
2)
(2
,20
3,4
42)
—
(2
,20
3,4
42
)
Sh
are o
f c
han
ges i
n n
et a
ssets o
f
asso
ciates a
nd
jo
in
t v
en
tu
res a
cco
un
ted
fo
r u
sin
g e
qu
ity
meth
od
—
—
(2
,94
6)
—
—
—
—
—
(2,9
46
)
—
(2,9
46
)
Ch
ang
es i
n s
ub
sidiaries’ o
wnership
—
—
357
,39
3—
(1
05
,46
1)
—
—
—
25
1,9
32
(1
,04
7,2
46
)
(7
95,3
14
)
Ad
ju
stm
ents d
ue t
o r
ecip
ro
cal
sto
ck
ho
ld
in
gs h
eld
by
sub
sid
iaries a
nd
asso
ciates
—
—
78
,52
8—
—
—
—
1
20
,97
21
99,5
00
—
19
9,5
00
Effect o
f d
eco
nsolid
atio
n o
f s
ubsid
iaries
—
—
—
—
—
—
—
—
—
(1
00,4
00
)
(1
00,4
00
)
Oth
ers
—
—
(7
,76
2)
—
—
—
—
—
(7,7
62
)
—
(7,7
62
)
Balance a
s o
f D
ecem
ber 3
1, 2
01
512
7,5
81
,329
—
42
,175
,63
37,7
25
,978
47
,620
,50
21,9
89
,302
7,1
51,1
51
(1
1,4
18
,31
3)
222
,82
5,5
82
2,0
27,0
65
224
,85
2,6
47
The a
ccom
panying n
otes a
re a
n i
ntegral p
art o
f t
he c
onsolidated f
inancial s
tatem
ents.
F-5

UN
IT
ED
MIC
RO
EL
EC
TR
ON
IC
S C
OR
PO
RA
TIO
N A
ND
SU
BS
ID
IA
RIE
S
CO
NS
OL
ID
AT
ED
ST
AT
EM
EN
TS
OF
CH
AN
GE
S I
N E
QU
IT
Y
For t
he y
ear e
nded D
ecem
ber 3
1, 2
016
(E
xp
ressed i
n T
ho
usand
s)
Equ
ity
Attrib
utab
le t
o t
he P
arent C
om
pany
Cap
ital
Retain
ed
Earn
in
gs
Oth
er C
om
po
nen
ts o
f E
qu
ity
Co
mm
on
Sto
ck
Ad
ditio
nal
Paid-in
Cap
ital
Leg
al
Reserv
e
Un
app
ro
priated
Earn
ing
s
Exch
an
ge
Differen
ces
on
Tran
slatio
n
of F
oreig
n
Operatio
ns
Un
realized
Gain
or
Loss o
n
Av
ailab
le-
fo
r-S
ale
Fin
an
cial
Assets
Treasury
Sto
ck
To
tal
Non-
co
ntro
llin
g
In
terests
To
tal
Eq
uity
NT
$N
T$
NT
$N
T$
NT
$N
T$
NT
$N
T$
NT
$N
T$
Balance a
s o
f J
an
uary 1
, 201
61
27
,58
1,3
29
42
,175
,63
37
,72
5,9
78
47
,620
,50
21
,989
,30
27
,151
,15
1(11
,41
8,3
13)
22
2,8
25
,582
2,0
27
,06
52
24
,85
2,6
47
Ap
pro
priatio
n a
nd d
istribu
tio
n o
f 2
01
5 r
etained
earn
in
gs
Leg
al r
eserve
—
—
1,3
44,8
63
(1
,344
,86
3)
—
—
—
—
—
—
Cash d
iv
id
en
ds
—
—
—
(6
,906
,97
3)
—
—
—
(6,9
06
,973
)
—
(6
,90
6,9
73
)
Net i
ncom
e f
or t
he y
ear e
nd
ed
Decem
ber 3
1, 2
01
6—
—
—
8
,621
,14
7—
—
—
8,6
21
,147
(4
,452
,58
5)
4,1
68,5
62
Oth
er c
om
prehensiv
e l
oss, n
et o
f t
ax
fo
r t
he y
ear
end
ed
Decem
ber 3
1, 2
01
6
—
—
—
(60
,53
5)
(1
,907
,74
9)
(2
,023
,46
9)
—
(3,9
91
,753
)
(32
,31
8)
(4
,02
4,0
71
)
Total c
om
prehen
siv
e i
nco
me (
lo
ss)
—
—
—
8,5
60
,61
2(1
,907
,74
9)
(2
,023
,46
9)
—
4,6
29
,394
(4
,484
,90
3)
14
4,4
91
Treasu
ry
sto
ck
acq
uired
—
—
—
—
—
—
(2
,39
5,7
93)
(2,3
95
,793
)
—
(2
,39
5,7
93
)
Treasu
ry
sto
ck
can
celled
(1
,33
8,1
42
)
(1
64
,22
0)
—
—
—
—
1,5
02,3
62
—
—
—
Sh
are o
f c
han
ges i
n n
et a
ssets o
f a
sso
ciates a
nd
jo
in
t v
en
tu
res a
cco
un
ted
fo
r u
sin
g e
qu
ity
meth
od
—
1,0
50
—
—
—
—
—
1,0
50
—
1,0
50
Ch
ang
es i
n s
ub
sidiaries’ o
wnership
—
1,5
67
—
(5
72
,45
4)
—
—
—
(57
0,8
87
)
567
,07
3(3,8
14
)
Ad
ju
stm
ents d
ue t
o r
ecip
ro
cal s
to
ck
hold
in
gs h
eld
by
su
bsid
iaries a
nd
asso
ciates
—
113
,83
3—
—
—
—
(5
81,6
40)
(46
7,8
07
)
—
(4
67,8
07
)
Oth
ers
—
(5
01
,75
7)
—
(3
,828
,16
4)
—
—
—
(4,3
29
,921
)
4,0
52
,49
4(2
77,4
27
)
Balance a
s o
f D
ecem
ber 3
1, 2
01
61
26
,24
3,1
87
41
,626
,10
69
,07
0,8
41
43
,528
,66
081
,55
35
,127
,68
2(12
,89
3,3
84)
21
2,7
84
,645
2,1
61
,72
92
14
,94
6,3
74
The a
ccom
panying n
otes a
re a
n i
ntegral p
art o
f t
he c
onsolidated f
inancial s
tatem
ents.
F-6

UN
IT
ED
MIC
RO
EL
EC
TR
ON
IC
S C
OR
PO
RA
TIO
N A
ND
SU
BS
ID
IA
RIE
S
CO
NS
OL
ID
AT
ED
ST
AT
EM
EN
TS
OF
CH
AN
GE
S I
N E
QU
IT
Y
For t
he y
ear e
nded D
ecem
ber 3
1, 2
017
(E
xp
ressed i
n T
ho
usand
s)
Equ
ity
Attrib
utab
le t
o t
he P
aren
t C
om
pan
y
Cap
ital
Retained
Earn
in
gs
Oth
er C
om
po
nen
ts o
f E
quity
Com
mon
Sto
ck
Ad
ditio
nal
Paid-in
Cap
ital
Leg
al
Reserv
e
Un
ap
prop
riated
Earn
in
gs
Ex
ch
an
ge
Differences
on
Tran
slatio
n
of F
oreign
Op
eratio
ns
Unrealized
Gain
or
Loss o
n
Av
ailab
le-
fo
r-S
ale
Finan
cial
Assets
Treasu
ry
Stock
To
tal
Non-
co
ntro
llin
g
In
terests
To
tal
Eq
uity
NT
$N
T$
NT
$N
T$
NT
$N
T$
NT
$N
T$
NT
$N
T$
Balance a
s o
f J
an
uary 1
, 201
71
26,2
43
,187
41
,626
,10
69
,07
0,8
41
43
,52
8,6
60
81
,55
35
,127
,68
2(1
2,8
93
,384
)
212
,78
4,6
45
2,1
61
,72
92
14
,94
6,3
74
Ap
pro
priatio
n a
nd d
istribu
tio
n o
f 2
01
6
retain
ed
earn
in
gs
Leg
al r
eserve
—
—
83
1,5
66
(8
31,5
66)
—
—
—
—
—
—
Cash d
iv
id
en
ds
—
—
—
(6
,11
2,1
59)
—
—
—
(6
,11
2,1
59
)
—
(6
,11
2,1
59
)
Net i
nco
me f
or t
he y
ear e
nd
ed
Decem
ber 3
1,
20
17
—
—
—
9,6
76,6
98
—
—
—
9,6
76,6
98
(2
,997
,46
9)
6,6
79,2
29
Oth
er c
om
prehensiv
e i
nco
me (
lo
ss), n
et o
f
tax f
or t
he y
ear e
nd
ed
Decem
ber 3
1, 2
01
7
—
—
—
(1
51,6
54)
(5,7
70
,76
3)
1,2
19
,48
5—
(4
,70
2,9
32
)
(1
11
,60
1)
(4
,81
4,5
33
)
Total c
om
prehen
siv
e i
nco
me (
lo
ss)
—
—
—
9,5
25,0
44
(5,7
70
,76
3)
1,2
19
,48
5—
4
,97
3,7
66
(3
,109
,07
0)
1,8
64,6
96
Sh
are o
f c
han
ges i
n n
et a
ssets o
f a
sso
ciates
and
jo
in
t v
entures a
cco
unted f
or u
sin
g
equ
ity
meth
od
—
(3
,97
8)
—
—
—
—
—
(3,9
78
)
—
(3,9
78
)
Ch
ang
es i
n s
ub
sidiaries’ o
wnership
—
(1
34
,05
0)
—
(9
09,2
41)
—
—
—
(1
,04
3,2
91
)
(9
99
,15
1)
(2
,04
2,4
42
)
Ad
ju
stm
ents d
ue t
o r
ecip
ro
cal s
to
ck
hold
in
gs
held
by
sub
sid
iaries a
nd
asso
ciates
—
121
,34
0—
—
—
—
(1
1,1
76
)
11
0,1
64
—
11
0,1
64
Oth
ers
—
—
—
(2
,04
4,9
57)
—
—
—
(2
,04
4,9
57
)
2,9
03
,30
08
58,3
43
Balance a
s o
f D
ecem
ber 3
1, 2
01
71
26,2
43
,187
41
,609
,41
89
,90
2,4
07
43
,15
5,7
81
(5,6
89
,21
0)
6,3
47
,16
7(1
2,9
04
,560
)
208
,66
4,1
90
956
,80
82
09
,62
0,9
98
The a
ccom
panying n
otes a
re a
n i
ntegral p
art o
f t
he c
onsolidated f
inancial s
tatem
ents.
F-7

UNITED MICROELECTRONICS CORPORATION AND SUBSIDIARIES
CONSOLIDATED STATEMENTS OF CASH FLOWS
For the years ended December 31, 2015, 2016 and 2017
(Expressed in Thousands)
For the years ended December 31,
2015 2016 2017
NT$ NT$ NT$ US$
Cash flows from operating activities:
Net income before tax 13,668,598 4,721,086 7,671,710 258,830
Adjustments to reconcile net income before tax to net cash provided by operating activities:
Depreciation 43,473,008 49,691,035 50,965,120 1,719,471
Amortization 1,999,101 2,292,566 2,133,726 71,988
Bad debt (reversal) expense (183,957) 125 (1,752) (59)
Net loss (gain) of financial assets and liabilities at fair value through profit or loss 94,453 (150,770) (598,270) (20,185)
Interest expense 470,310 1,249,583 2,406,872 81,204
Interest income (356,084) (293,790) (353,159) (11,915)
Dividend income (692,858) (606,193) (522,428) (17,626)
Share-based payment 838 — — —
Share of (profit) loss of associates and joint ventures (4,694) 315,666 (157,837) (5,325)
Gain on disposal of property, plant and equipment (97,366) (73,014) (82,397) (2,780)
Gain on disposal of non-current assets held for sale (41,203) — — —
Gain on disposal of other assets — — (6,601) (223)
Gain on disposal of investments (2,517,137) (2,097,818) (1,269,369) (42,826)
Impairment loss on financial assets 1,245,491 785,345 950,335 32,063
Impairment loss on non-financial assets 1,021,010 1,292,229 — —
Exchange (gain) loss on financial assets and liabilities (125,836) 1,308,669 (2,432,098) (82,055)
Bargain purchase gain in acquisition of additional shares of equity investees — — (5,130) (173)
Amortization of deferred government grants (34,405) (118,757) (1,469,616) (49,582)
Income and expense adjustments 44,250,671 53,594,876 49,557,396 1,671,977
Changes in operating assets and liabilities:
Financial assets and liabilities at fair value through profit or loss (36,262) (100) 520,335 17,555
Notes receivable and accounts receivable 3,429,797 (3,690,072) 1,587,562 53,562
Other receivables (22,615) (366,675) (261,834) (8,834)
Inventories (1,917,966) 517,760 (1,565,132) (52,805)
Other current assets 1,420,221 (8,640,111) (4,397,764) (148,373)
Notes and accounts payable (498,776) 933,164 (185,907) (6,272)
Other payables 1,079,596 370,635 727,300 24,538
Other current liabilities (181,193) 1,397,687 1,803,309 60,840
Net defined benefit liabilities 25,112 2,200 (14,562) (491)
Other noncurrent liabilities 277,722 (149,637) (209,250) (7,060)
Cash generated from operations 61,494,905 48,690,813 55,233,163 1,863,467
Interest received 368,617 303,631 329,194 11,106
Dividend received 917,040 794,484 584,612 19,724
Interest paid (648,938) (1,016,329) (1,905,718) (64,295)
Income tax paid (2,343,390) (2,322,102) (1,766,856) (59,611)
Net cash provided by operating activities 59,788,234 46,450,497 52,474,395 1,770,391
Cash flows from investing activities:
Acquisition of financial assets at fair value through profit or loss (136,264) (246,624) (138,022) (4,657)
Proceeds from disposal of financial assets at fair value through profit or loss — 167,580 18,789 634
Acquisition of available-for-sale financial assets (4,800,576) (322,177) (998,216) (33,678)
Proceeds from disposal of available-for-sale financial assets 1,964,457 3,626,315 2,159,636 72,862
Acquisition of financial assets measured at cost (95,310) (81,517) (14,419) (486)
Proceeds from disposal of financial assets measured at cost 57,584 575,860 361 12
Acquisition of investments accounted for under the equity method (2,474,851) (840,000) (204,280) (6,892)
Increase in prepayment for investments — — (17,200) (580)
Proceeds from capital reduction and liquidation of investments 559,830 221,646 2,101,791 70,911
Acquisition of subsidiaries (net of cash acquired) 414,958 — — —
Disposal of subsidiaries (834,955) — — —
Acquisition of property, plant and equipment (60,504,149) (91,560,639) (44,236,276) (1,492,452)
Proceeds from disposal of property, plant and equipment 148,316 77,607 119,613 4,036
Proceeds from disposal of non-current assets held for sale 641,866 — — —
Increase in refundable deposits (1,818,998) (826,845) (109,627) (3,699)
Decrease in refundable deposits 316,180 1,138,869 424,706 14,329
Acquisition of intangible assets (1,088,313) (1,554,251) (1,283,938) (43,318)
Cash inflow from combination 1,583 — — —
Government grants related to assets acquisition 254,645 9,566,327 6,755,920 227,932
Increase in other noncurrent assets (1,116,501) (572,209) (30,294) (1,022)
Decrease in other noncurrent assets 29,349 544,186 35,864 1,210
Net cash used in investing activities (68,481,149) (80,085,872) (35,415,592) (1,194,858)
The accompanying notes are an integral part of the consolidated financial statements.
F-8

UNITED MICROELECTRONICS CORPORATION AND SUBSIDIARIES
CONSOLIDATED STATEMENTS OF CASH FLOWS
For the years ended December 31, 2015, 2016 and 2017
(Expressed in Thousands)
For the years ended December 31,
2015 2016 2017
NT$ NT$ NT$ US$
Cash flows from financing activities:
Increase in short-term loans 14,965,506 48,085,068 48,804,321 1,646,570
Decrease in short-term loans (14,900,862) (32,955,646) (42,925,604) (1,448,232)
Proceeds from bonds issued 18,424,800 — 13,700,000 462,213
Bonds issuance costs (83,880) — (15,785) (533)
Redemption of bonds — — (7,500,000) (253,036)
Proceeds from long-term loans 4,952,870 24,628,607 12,000,708 404,882
Repayments of long-term loans (5,337,929) (7,624,030) (7,602,596) (256,498)
Increase in guarantee deposits 50,061 9,290 194,555 6,564
Decrease in guarantee deposits (10,064) (19,524) (84,192) (2,840)
Increase in other financial liabilities 6,107,635 15,979,088 — —
Cash dividends (6,939,016) (6,906,726) (6,103,195) (205,911)
Exercise of employee stock options 289,413 — — —
Treasury stock acquired (2,203,442) (2,395,793) — —
Treasury stock sold to employees 681,614 — — —
Acquisition of non-controlling interests (932,367) (5,028) (1,308,614) (44,150)
Changes in non-controlling interests (15,102) 183 1,994 67
Net cash provided by financing activities 15,049,237 38,795,489 9,161,592 309,096
Effect of exchange rate changes on cash and cash equivalents 721,688 (871,566) (2,124,804) (71,687)
Net increase in cash and cash equivalents 7,078,010 4,288,548 24,095,591 812,942
Cash and cash equivalents at beginning of year 46,212,423 53,290,433 57,578,981 1,942,610
Cash and cash equivalents at end of year 53,290,433 57,578,981 81,674,572 2,755,552
The accompanying notes are an integral part of the consolidated financial statements.
F-9

UNITED MICROELECTRONICS CORPORATION AND SUBSIDIARIES
NOTES TO CONSOLIDATED FINANCIAL STATEMENTS
(Expressed in Thousands of New Taiwan Dollars unless Otherwise Specified)
1. HISTORY AND ORGANIZATION
United Microelectronics Corporation (UMC) was incorporated in Republic of China (R.O.C.) in May 1980 and commenced
operations in April 1982. UMC is a full service semiconductor wafer foundry, and provides a variety of services to satisfy
customer needs. UMC’s ordinary shares were publicly listed on the Taiwan Stock Exchange (TWSE) in July 1985 and its
American Depositary Shares (ADSs) were listed on the New York Stock Exchange (NYSE) in September 2000.
The address of its registered office and principal place of business is No. 3, Li-Hsin Road II, Hsinchu Science Park, Hsinchu City,
Taiwan. The principal operating activities of UMC and its subsidiaries (collectively as“the Company”) are described in Notes 4(3)
and 12.
2. DATE AND PROCEDURES OF AUTHORIZATION OF FINANCIAL STATEMENTS FOR ISSUE
The consolidated financial statements of the Company were approved and authorized for issue by the audit committee of the
Board of Directors on April 25, 2018.
3. NEW ACCOUNTING PRONOUNCEMENT UNDER INTERNATIONAL FINANCIAL REPORTING STANDARDS (IFRSs)
a. The Company has not adopted the following new, revised or amended IFRSs that have been issued by the International
Accounting Standards Board (IASB) but not yet effective:
No. The projects of Standards or Interpretations
Effective for annual
periods beginning
on or after
IFRS 10 and
IAS 28
Sale or Contribution of Assets between an Investor and its Associate or Joint Venture -
Amendments to IFRS 10 and IAS 28
Subject to IASB’s
announcement
IFRS 15 Revenue from Contracts with Customers with its Amendment - Clarifications to IFRS 15 January 1, 2018
IFRS 9 Financial Instruments January 1, 2018
IFRS 16 Leases January 1, 2019
F-10

No. The projects of Standards or Interpretations
Effective for annual
periods beginning
on or after
IFRS 2 Classification and Measurement of Share-based Payment Transactions - Amendments to IFRS 2 January 1, 2018
IFRS 4 Applying IFRS 9 Financial Instruments with IFRS 4 Insurance Contracts - Amendments to
IFRS 4
January 1, 2018
IAS 40 Transfers of Investment Property - Amendments to IAS 40 January 1, 2018
Improvements to International Financial Reporting Standards (2014-2016 cycle)
IFRS 1 First-time Adoption of International Financial Reporting Standards - Amendments to IFRS 1 January 1, 2018
IAS 28 Investments in Associates and Joint Ventures - Amendments to IAS 28 January 1, 2018
IFRIC 22 Foreign Currency Transactions and Advance Consideration January 1, 2018
IFRIC 23 Uncertainty over Income Tax Treatments January 1, 2019
IFRS 17 Insurance Contracts January 1, 2021
IAS 28 Long-term Interests in Associates and Joint Ventures - Amendments to IAS 28 January 1, 2019
IFRS 9 Prepayment Features with Negative Compensation - Amendments to IFRS 9 January 1, 2019
Improvements to International Financial Reporting Standards (2015-2017 cycle)
IFRS 3 Business Combinations - Amendments to IFRS 3 January 1, 2019
IFRS 11 Joint Arrangements - Amendments to IFRS 11 January 1, 2019
IAS 12 Income Taxes - Amendments to IAS 12 January 1, 2019
IAS 23 Borrowing Costs - Amendments to IAS 23 January 1, 2019
IAS 19 Plan Amendment, Curtailment or Settlement - Amendments to IAS 19 January 1, 2019
F-11

b. The potential effects of adopting the standards or interpretations issued by IASB on the Company’s financial statements in
future periods are summarized as below:
(1) IFRS 10 “Consolidated Financial Statements” (IFRS 10) and IAS 28 “Investments in Associates and Joint Ventures” (IAS
28) - Sale or Contribution of Assets between an Investor and its Associate or Joint Venture (Amendment)
The amendments address the inconsistency between the requirements in IFRS 10 and IAS 28, in dealing with the loss of
control of a subsidiary that is contributed to an associate or a joint venture. IAS 28 restricts gains and losses arising from
contributions of non-monetary assets to an associate or a joint venture to the extent of the interest attributable to the other
equity holders in the associate or joint venture. IFRS 10 requires full profit or loss recognition on the loss of control of a
subsidiary. IAS 28 was amended so that the gain or loss resulting from the sale or contribution of assets that constitute a
business as defined in IFRS 3 “Business Combinations” (IFRS 3) between an investor and its associate or joint venture is
recognized in full. IFRS 10 was also amended so that the gain or loss resulting from the sale or contribution of a subsidiary
that does not constitute a business as defined in IFRS 3 between an investor and its associate or joint venture is recognized
only to the extent of the unrelated investors’ interests in the associate or joint venture. The effective date of this amendment
has been deferred indefinitely, but early adoption is allowed.
(2) IFRS 15 “Revenue from Contracts with Customers” with its Amendment “Clarifications to IFRS 15 Revenue from Contracts
with Customers” (IFRS 15)
The core principle of IFRS 15 is that revenue is recognized to depict the transfer of promised goods or services to customers
in an amount that reflects the consideration to which the entity expects to be entitled in exchange for those goods or services.
IFRS 15 establishes a five-step model that will apply to revenue earned from a contract with a customer (with limited
exceptions), regardless of the type of revenue transaction or the industry. Extensive disclosures will be required, including
disaggregation of total revenue, information related to performance obligations, changes in contract asset and liability
account balances between periods and key judgments and estimates. The amendment in 2016 clarifies how to identify a
performance obligation in a contract, determine whether an entity is a principal or an agent, and determine whether the
revenue from granting a license should be recognized at a point in time or over time. The new standard and amendments are
effective for annual periods beginning on or after January 1, 2018.
F-12

(3) IFRS 9 “Financial Instruments” (IFRS 9)
The IASB has issued IFRS 9, which combines classification and measurement, the expected credit loss impairment model
and hedge accounting. The standard will replace IAS 39 “Financial Instruments: Recognition and Measurement” (IAS 39)
and all previous versions of IFRS 9. IFRS 9 requires the following: (1) Classification and measurement: Financial assets are
measured at amortized cost, fair value through profit or loss, or fair value through other comprehensive income, based on
both the entity’s business model for managing the financial assets and the financial asset’s contractual cash flow
characteristics. Financial liabilities are measured at amortized cost or fair value through profit or loss. Furthermore, there is
requirement that “own credit risk” adjustments are not recognized in profit or loss, (2) Impairment: Expected credit loss
model is used to evaluate impairment. Entities are required to recognize either 12-month or lifetime expected credit losses,
depending on whether there has been a significant increase in credit risk since initial recognition, and (3) Hedge accounting:
Hedge accounting is more closely aligned with risk management activities and hedge effectiveness is measured based on the
hedge ratio. The new standard and amendments to relevant guidance for disclosures are effective for annual periods
beginning on or after January 1, 2018.
(4) IFRS 16 “Leases”
The new standard requires lessees to account for all leases under a single on-balance sheet model (subject to certain
exemptions). Lessor accounting still uses the dual classification approach: operating lease and finance lease. The standard is
effective for annual periods beginning on or after January 1, 2019.
(5) IFRS 2 “Share-based Payment”- Classification and Measurement of Share-based Payment Transactions (Amendment)
The amendment clarifies that (1) vesting conditions (service and non-market performance conditions), upon which
satisfaction of a cash-settled share-based payment transaction is conditional, are not taken into account when estimating the
fair value of the cash-settled share-based payment at the measurement date. Instead, these are taken into account by adjusting
the number of awards included in the measurement of the liability arising from the transaction, (2) if tax laws or regulations
require the employer to withhold a certain amount in order to meet the employee’s tax obligation associated with the share-
based payment, such transactions will be classified in their entirety as equity-settled share-based payment transactions if they
would have been so classified in the absence of the net share settlement feature, and (3) if the terms and conditions of a cash-
settled share-based payment transaction are modified, with the result that it becomes an equity-settled share-based payment
transaction, the transaction is accounted for as an equity-settled transaction from the date of the modification. The equity-
settled share-based payment transaction is measured by reference to the fair value of the equity instruments granted at the
modification date and is recognized in equity, on the modification date, to the extent to which goods or services have been
received. The liability for the cash-settled share-based payment transaction as at the modification date is derecognized on
that date. Any difference between the carrying amount of the liability derecognized and the amount recognized in equity on
the modification date is recognized immediately in profit or loss. The amendment is effective for annual periods beginning
on or after January 1, 2018.
F-13

(6) IAS 28 “Investments in Associates and Joint Ventures” (Amendment)
The amendment clarifies that when an investment in an associate or a joint venture is held by, or is held indirectly through,
an entity that is a venture capital organisation, or a mutual fund, unit trust and other qualifying entities including investment-
linked insurance funds, the entity may elect to measure that investment at fair value through profit or loss in accordance with
IFRS 9 on an investment-by-investment basis. Besides, if an entity that is not itself an investment entity has an interest in an
associate or joint venture that is an investment entity, the entity may, when applying the equity method, elect to retain the fair
value measurement applied by that investment entity associate or joint venture to the investment entity associate’s or joint
venture’s interests in subsidiaries on an investment-by-investment basis. The amendment is effective for annual periods
beginning on or after January 1, 2018.
(7) IFRIC 22 “Foreign Currency Transactions and Advance Consideration”
The interpretation clarifies that when applying paragraphs 21 and 22 of IAS 21 “The Effects of Changes in Foreign
Exchange Rates”, in determining the spot exchange rate to use on initial recognition of the related asset, expense or income
(or part of it) on the derecognition of a non-monetary asset or non-monetary liability relating to advance consideration, the
date of the transaction is the date on which an entity initially recognizes the non-monetary asset or non-monetary liability
arising from the advance consideration. If there are multiple payments or receipts in advance, then the entity must determine
a date of the transactions for each payment or receipt of advance consideration. The interpretation is effective for annual
periods beginning on or after January 1, 2018.
(8) IFRIC 23 “Uncertainty Over Income Tax Treatments”
The Interpretation clarifies application of recognition and measurement requirements in IAS 12 “Income Taxes” when there
is uncertainty over income tax treatments. The Interpretation is effective for annual periods beginning on or after January 1,
2019.
F-14

(9) IAS 28 “Investments in Associates and Joint Ventures” - Long-term Interests in Associates and Joint Ventures (Amendment)
The amendment clarifies that an entity applies IFRS 9 to long-term interests in an associate or joint venture that form part of
the net investment in the associate or joint venture before it applies IAS 28, and in applying IFRS 9, does not take account of
any adjustments that arise from applying IAS 28. The amendment is effective for annual reporting periods beginning on or
after January 1, 2019.
(10) IFRS 9 “Financial Instruments” - Prepayment Features with Negative Compensation (Amendment)
The amendment allows financial assets with prepayment features that permit or require a party to a contract either to pay or
receive reasonable compensation for the early termination of the contract, to be measured at amortised cost or at fair value
through other comprehensive income. The amendment is effective for annual reporting periods beginning on or after
January 1, 2019.
(11) IAS 12 “Income Taxes” (Amendment)
The amendments clarify that an entity shall recognize the income tax consequences of dividends in profit or loss, other
comprehensive income or equity according to where the entity originally recognized those past transactions or events. The
amendments are effective for annual periods beginning on or after January 1, 2019.
(12) IAS 19 “Employee Benefits” - Plan Amendment, Curtailment or Settlement (Amendment)
The amendments clarify that when a change in a defined benefit plan is made (such as amendment, curtailment or settlement,
etc.), the entity should use the updated assumptions to remeasure its net defined benefit liability or asset as at the date of such
event. The amendments are effective for annual periods beginning on or after January 1, 2019.
The Company is currently evaluating the potential impact of the aforementioned standards and interpretations listed (4) and (8) ~ (12) to
the Company’s financial position and performance, and the related impact will be disclosed when the evaluation is completed. The rest
of the standards and interpretations listed are not expected to have material impact on the Company’s financial position and
performance, except for the following:
F-15

IFRS 15 with its Amendment
The Company elected to adopt the standard using the modified retrospective method recognizing the cumulative effect of
initially applying IFRS 15 at the date of initial application (January 1, 2018). Under this method, the Company applies the
standard retrospectively only to contracts that are not completed contracts at the date of initial application. The impacts
arising from the adoption of IFRS 15 on the Company’ consolidated financial statements are summarized as follows:
The majority of the Company’s contracts with customers are for the sale of wafers for which revenue is currently
recognized when criteria pursuant to IAS 18 “Revenue” are fulfilled upon the delivery of the wafers to carriers
approved by the customers, at which point in time, the title and risk of loss for the wafers are transferred to the
customers. Starting from the date of initial application, in accordance with the requirements of IFRS 15, the Company
shall recognize revenue as the Company satisfies its performance obligations to customers. For certain contracts that
do not provide the Company unconditional rights to the consideration, the Company shall recognize revenue and
contract asset as it satisfies its performance obligation over time. Consideration received from customers prior to the
Company having satisfied its performance obligation are accounted for as contract liabilities and the associated costs
incurred to fulfill the contracts are recognized on the consolidated balance sheets as contract fulfillment costs within
other current assets. In accordance with the requirement of IFRS 15, allowance for sales returns and discounts will be
presented as refund liabilities, different from its current presentation as a contra-accounts to accounts receivable.
IFRS 9
The Company elected to adopt the standard on the required effective date, recognizing the cumulative effect of initially
applying IFRS 9 at the date of initial application (January 1, 2018). The Company is currently evaluating the impacts arising
from the adoption of IFRS 9 summarized as follows:
a. Financial assets measured at cost
The Company elected to designate certain financial assets as financial assets measured at fair value through other
comprehensive income (FVOCI) and the others as financial assets measured at fair value through profit or loss
(FVTPL) at the date of initial application. In accordance with the requirement of IFRS 9, these financial assets
must be measured at fair value. Therefore, the Company adjusted the differences either in other component of
equity or retained earnings at the date of initial application.
b. Available-for-sale financial assets
In accordance with the requirement of IFRS 9, the Company elected to designate equity instruments that are not
held for trading as financial assets measured at FVOCI and classified the remaining financial assets as financial
assets measured at FVTPL. Differences arising from the adoption have been recognized in other component of
equity and retained earnings at the date of initial application.
F-16

Under IFRS 9, subsequent fair value changes of financial assets designated at FVOCI are recognized in other
comprehensive income and shall not be subsequently transferred to profit or loss. Upon de-recognition, the
accumulated amounts in other component of equity is reclassified to retained earnings.
c. Impairment of financial assets
Under IFRS 9, impairment assessment is not required for equity instruments. Therefore, as the Company elects
to classify certain equity investments as financial assets measured at FVOCI, the Company will reclassify the
related accumulated impairment loss from retained earnings to other component of equity at the date of initial
application. The expected credit losses for accounts receivable or contract assets that result from transactions
within the scope of IFRS 15 are evaluated by applying the simplified approach. The aforementioned impairment
evaluation requirement differs from the current incurred loss model, but did not have a material effect on the
Company upon adoption.
The Company anticipates the impact on assets, liabilities and equity, including tax effect, at the date of initial application of
IFRS 15 and IFRS 9 as below:
Items
Carrying
Amounts as of
December 31,
2017
Adjustments
Arising from
Initial Application
Adjusted
Carrying
Amounts as of
January 1,
2018IFRS 9 IFRS 15
Contract assets, current $ — $ — $ 129,042 $ 129,042
Accounts receivable, net 20,876,417 — 983,438 21,859,855
Accounts receivable-related parties, net 91,065 — 2,733 93,798
Inventories, net 18,257,500 — (102,800) 18,154,700
Other current assets 15,854,553 — 120,799 15,975,352
Financial assets at fair value through profit or
loss, noncurrent
191,005 12,449,226 — 12,640,231
Financial assets at fair value through other
comprehensive income, noncurrent
— 10,131,459 — 10,131,459
Available-for-sale financial assets, noncurrent 20,636,332 (20,636,332) — —
Financial assets measured at cost, noncurrent 2,218,472 (2,218,472) — —
Investments accounted for under the equity
method
7,847,979 (51,820) — 7,796,159
Deferred tax assets 6,116,129 914,292 (1,489) 7,028,932
Total effect on assets $ 588,353 $1,131,723
F-17

Items
Carrying
Amounts as of
December 31,
2017
Adjustments
Arising from
Initial Application
Adjusted
Carrying
Amounts as of
January 1,
2018IFRS 9 IFRS 15
Contract liabilities, current $ — $ — $ 3,951,414 $ 3,951,414
Current tax liabilities 4,851,694 280,241 5,553 5,137,488
Other current liabilities 6,984,482 — (2,861,466) 4,123,016
Deferred tax liabilities 2,327,223 (596,247) (45) 1,730,931
Total effect on liabilities $ (316,006) $ 1,095,456
Retained earnings $53,058,188 $ 16,424,826 $ 35,430 $ 69,518,444
Other components of equity 657,957 (15,520,467) (760) (14,863,270)
Non-controlling interests 956,808 — 1,597 958,405
Total effect on equity $ 904,359 $ 36,267
4. SUMMARY OF SIGNIFICANT ACCOUNTING POLICIES
(1) Statement of Compliance
The Company’s consolidated financial statements were prepared in accordance with IFRSs, including International Financial
Reporting Standards, International Accounting Standards, IFRIC Interpretations and SIC Interpretations, as issued by IASB.
(2) Basis of Preparation
The consolidated financial statements have been prepared on a historical cost basis, except for financial instruments
measured at fair value.
(3) General Description of Reporting Entity
a. Principles of consolidation
Subsidiaries are fully consolidated from the date of acquisition (the date on which the Company obtains control), and
continue to be consolidated until the date that such control ceases. The Company controls an entity when the
Company is exposed to, or has rights to, variable returns from its involvement with the entity and has the ability to
affect those returns through its power over the entity. The financial statements of the subsidiaries are prepared for the
same reporting period as the parent company, using consistent accounting policies. All intra-group balances,
transactions, unrealized gains and losses and dividends resulting from intra-group transactions are eliminated in full.
F-18

A change in the ownership interest of a subsidiary, without a change of control, is accounted for as an equity
transaction. Total comprehensive income of subsidiaries is attributed to the stockholders of the parent and to the
non-controlling interests even if this results in the non-controlling interests having a deficit balance.
If the Company loses control over a subsidiary, the Company derecognizes the assets and liabilities of the subsidiary,
as well as any non-controlling interests previously recorded by the Company. A gain or loss is recognized in profit or
loss and is calculated as the difference between: (a) the aggregate of the fair value of consideration received and the
fair value of any retained interest at the date when control is lost; and (b) the previous carrying amount of the assets
(including goodwill), and liabilities of the subsidiary and any non-controlling interests. Any gain or loss previously
recognized in the other comprehensive income would be reclassified to profit or loss or transferred directly to retained
earnings if required by other IFRSs. The fair value of any investment retained in the former subsidiary at the date
when control is lost is regarded as the cost on initial recognition of an investment.
b. The consolidated entities as of December 31, 2016 and 2017 were as follows:
Percentage of ownership (%)
as of December 31,
Investor Subsidiary Business nature 2016 2017
UMC UMC GROUP (USA) IC Sales 100.00 100.00
UMC UNITED MICROELECTRONICS (EUROPE)
B.V.
Marketing support activities 100.00 100.00
UMC UMC CAPITAL CORP. Investment holding 100.00 100.00
UMC GREEN EARTH LIMITED (GE) Investment holding 100.00 100.00
UMC TLC CAPITAL CO., LTD. (TLC) Venture capital 100.00 100.00
UMC UMC NEW BUSINESS INVESTMENT
CORP. (NBI)
Investment holding 100.00 100.00
F-19

Percentage of ownership (%)
as of December 31,
Investor Subsidiary Business nature 2016 2017
UMC UMC INVESTMENT (SAMOA)
LIMITED
Investment holding 100.00 100.00
UMC FORTUNE VENTURE CAPITAL
CORP. (FORTUNE)
Consulting and planning for venture
capital
100.00 100.00
UMC UMC GROUP JAPAN IC Sales 100.00 100.00
UMC UMC KOREA CO., LTD. Marketing support activities 100.00 100.00
UMC OMNI GLOBAL LIMITED (OMNI) Investment holding 100.00 100.00
UMC SINO PARAGON LIMITED Investment holding 100.00 100.00
UMC BEST ELITE INTERNATIONAL
LIMITED (BE)
Investment holding 91.08 96.66
UMC, FORTUNE and
TLC
NEXPOWER TECHNOLOGY CORP.
(NEXPOWER)
Sales and manufacturing of solar power
batteries
— 87.06
UMC, FORTUNE,
UNITRUTH
INVESTMENT
CORP.
(UNITRUTH) and
TLC
NEXPOWER Sales and manufacturing of solar power
batteries
67.54 —
UMC and FORTUNE WAVETEK MICROELECTRONICS
CORPORATION (WAVETEK)
Sales and manufacturing of integrated
circuits
— 78.47
UMC, FORTUNE and
UNITRUTH
WAVETEK Sales and manufacturing of integrated
circuits
78.47 —
FORTUNE UNITRUTH Investment holding 100.00 —
UMC CAPITAL
CORP.
UMC CAPITAL (USA) Investment holding 100.00 100.00
TLC SOARING CAPITAL CORP. Investment holding 100.00 100.00
SOARING CAPITAL
CORP.
UNITRUTH ADVISOR (SHANGHAI)
CO., LTD.
Investment holding and advisory 100.00 100.00
GE UNITED MICROCHIP
CORPORATION
Investment holding 100.00 100.00
UMC INVESTMENT
(SAMOA)
LIMITED
UMC (BEIJING) LIMITED Marketing support activities 100.00 100.00
F-20

Percentage of ownership (%)
as of December 31,
Investor Subsidiary Business nature 2016 2017
NBI TERA ENERGY DEVELOPMENT
CO., LTD. (TERA ENERGY)
Energy technical services 100.00 100.00
NBI UNISTARS CORP. High brightness LED packages 82.76 83.69
TERA ENERGY EVERRICH ENERGY INVESTMENT
(HK) LIMITED (EVERRICH-HK)
Investment holding 100.00 100.00
EVERRICH-HK EVERRICH (SHANDONG) ENERGY
CO., LTD.
Solar engineering integrated design
services
100.00 100.00
OMNI UNITED MICROTECHNOLOGY
CORPORATION (NEW YORK)
Research and development 100.00 100.00
OMNI UNITED MICROTECHNOLOGY
CORPORATION (CALIFORNIA)
Research and development 100.00 100.00
OMNI ECP VITA PTE. LTD. Insurance 100.00 100.00
OMNI UMC TECHNOLOGY JAPAN CO.,
LTD.
Semiconductor manufacturing
technology development and
consulting services
100.00 100.00
WAVETEK WAVETEK MICROELECTRONICS
INVESTMENT (SAMOA)
LIMITED (WAVETEK-SAMOA)
Investment holding 100.00 100.00
WAVETEK-
SAMOA
WAVETEK MICROELECTRONICS
CORPORATION (USA)
Sales and marketing service 100.00 100.00
NEXPOWER NPT HOLDING LIMITED Investment holding 100.00 —
NEXPOWER SOCIALNEX ITALIA 1 S.R.L. Photovoltaic power plant 100.00 100.00
NPT HOLDING
LIMITED
NLL HOLDING LIMITED Investment holding 100.00 —
BE INFOSHINE TECHNOLOGY
LIMITED (INFOSHINE)
Investment holding 100.00 100.00
INFOSHINE OAKWOOD ASSOCIATES LIMITED
(OAKWOOD)
Investment holding 100.00 100.00
OAKWOOD HEJIAN TECHNOLOGY (SUZHOU)
CO., LTD. (HEJIAN)
Sales and manufacturing of integrated
circuits
100.00 100.00
HEJIAN UNITEDDS SEMICONDUCTOR
(SHANDONG) CO., LTD.
Integrated circuits design services 100.00 100.00
UNITED
MICROCHIP
CORPORATION
and HEJIAN
UNITED SEMICONDUCTOR
(XIAMEN) CO., LTD. (USC) (Note
A)
Sales and manufacturing of integrated
circuits
29.41 51.02
Note A: As described in Note 9(5), the Company acquired control of USC’s Board of Directors in 2015.
F-21

(4) Business Combinations and Goodwill
Business combinations are accounted for using the acquisition method. The consideration transferred, the identifiable assets
acquired and liabilities assumed are measured at the acquisition date fair value. For the components of non-controlling
interests in the acquiree that are present ownership interests and entitle their holders to a proportionate share of the entity’s
net assets in the event of liquidation, the acquirer measures at either fair value or at the non-controlling interest’s
proportionate share of the acquiree’s identifiable net assets. Acquisition-related costs are expensed as incurred and are
classified under administrative expenses.
When the Company acquires a business, it assesses the assets acquired and liabilities assumed for appropriate classification
and designation in accordance with the contractual terms, economic circumstances and pertinent conditions as at the
acquisition date. This includes the separation of embedded derivatives in host contracts held by the acquiree.
If the business combination is achieved in stages, the acquisition date fair value of the acquirer’s previously held equity
interest in the acquiree is remeasured at fair value as at the acquisition date through profit or loss.
Any contingent consideration to be transferred by the acquirer will be recognized at fair value at the acquisition date.
Subsequent changes to the fair value of the contingent consideration, which is deemed to be an asset or liability, will be
recognized in accordance with IAS 39, either in profit or loss or other comprehensive income. If the contingent consideration
is classified as equity, it should not be remeasured until it is finally settled within equity.
F-22

Goodwill is initially measured at cost, being the excess of the aggregate of the consideration transferred, the acquisition date
fair value of the acquirer’s previously held equity interest in the acquiree and the amount recognized for non-controlling
interest over the net identifiable assets acquired and liabilities assumed. If the fair value of the net assets acquired is in excess
of the aggregate consideration transferred and non-controlling interests, the difference is recognized as a gain on bargain
purchase.
After initial recognition, goodwill is measured at cost less any accumulated impairment losses. For the purpose of
impairment testing, goodwill acquired in a business combination is, from the acquisition date, allocated to each cash-
generating unit (CGU) that is expected to benefit from the combination, irrespective of whether other assets or liabilities of
the acquiree are assigned to those units. Each unit or groups of units to which the goodwill is so allocated represents the
lowest level within the Company at which the goodwill is monitored for internal management purposes and cannot be larger
than an operating segment before aggregation.
Where goodwill forms part of a CGU and part of the operation within that unit is disposed, the goodwill associated with the
operation disposed is included in the carrying amount of the operation. Goodwill disposed in this circumstance is measured
based on the relative values of the operation disposed and the portion of the CGU retained.
(5) Foreign Currency Transactions
The Company’s consolidated financial statements are presented in New Taiwan Dollars (NTD), which is also the parent
company’s functional currency. Each entity in the Company determines its own functional currency and items included in
the financial statements of each entity are measured using that functional currency.
Transactions in foreign currencies are initially recorded by the Company’s entities at their respective functional currency
rates prevailing at the transaction date. Monetary assets and liabilities denominated in foreign currencies are translated into
functional currency at the closing rates of exchange at the reporting date. Non-monetary items measured at fair value in
foreign currencies are translated using the exchange rates at the date when the fair value is determined. Non-monetary items
that are measured at historical cost in foreign currencies are translated using the exchange rates as at the dates of the initial
transactions.
F-23

All exchange differences arising on the settlement of monetary items or on translating monetary items are taken to profit or
loss in the period in which they arise except for the following:
a. Exchange differences arising from foreign currency borrowings for an acquisition of a qualifying asset to the extent
that they are regarded as an adjustment to interest costs are included in the borrowing costs that are eligible for
capitalization.
b. Foreign currency derivatives within the scope of IAS 39 are accounted for based on the accounting policy for financial
instruments.
c. Exchange differences arising on a monetary item that is part of a reporting entity’s net investment in a foreign
operation are recognized initially in other comprehensive income and reclassified from equity to profit or loss upon
disposal of such investment.
When a gain or loss on a non-monetary item is recognized in other comprehensive income, any exchange component of that
gain or loss is recognized in other comprehensive income. When a gain or loss on a non-monetary item is recognized in
profit or loss, any exchange component of that gain or loss is recognized in profit or loss.
(6) Translation of Foreign Currency Financial Statements
The assets and liabilities of foreign operations are translated into NTD at the closing rate of exchange prevailing at the
reporting date and their income and expenses are translated at an average exchange rate for the period. The exchange
differences arising on the translation are recognized in other comprehensive income. On disposal of a foreign operation, the
cumulative amount of the exchange differences relating to that foreign operation, recognized in other comprehensive income
and accumulated in the separate component of equity, is reclassified from equity to profit or loss when the gain or loss on
disposal is recognized.
On partial disposal of a subsidiary that includes a foreign operation that does not result in a loss of control, the proportionate
share of the cumulative amount of the exchange differences recognized in other comprehensive income is re-attributed to the
non-controlling interests in that foreign operation. On partial disposal of an associate or a joint venture that includes a foreign
operation that does not result in a loss of significant influence or joint control, only the proportionate share of the cumulative
amount of the exchange differences recognized in other comprehensive income is reclassified to profit or loss.
F-24

Any goodwill and any fair value adjustments to the carrying amounts of assets and liabilities arising from the acquisition of a
foreign operation are treated as assets and liabilities of the foreign operation and expressed in its functional currency.
(7) Convenience Translation into U.S. Dollars
Translations of amount from NTD into U.S. dollars (USD) for the reader’s convenience were calculated at the rate of
USD1.00 to NTD29.64 on December 29, 2017 released by Board of Governors of the Federal Reserve System. No
representation is made that the NTD amounts could have been, or could be, converted into USD at this rate.
(8) Current and Non-Current Distinction
An asset is classified as current when:
a. the Company expects to realize the asset, or intends to sell or consume it, in its normal operating cycle;
b. the Company holds the asset primarily for the purpose of trading;
c. the Company expects to realize the asset within twelve months after the reporting period; or
d. the asset is cash or a cash equivalent unless the asset is restricted from being exchanged or used to settle a liability for
at least twelve months after the reporting period.
All other assets are classified as non-current.
A liability is classified as current when:
a. the Company expects to settle the liability in normal operating cycle;
b. the Company holds the liability primarily for the purpose of trading;
c. the liability is due to be settled within twelve months after the reporting period; or
d. the Company does not have an unconditional right to defer settlement of the liability for at least twelve months after
the reporting date. Terms of a liability that could, at the option of the counterparty, result in its settlement by the issue
of equity instruments do not affect its classification.
All other liabilities are classified as non-current.
F-25

(9) Cash Equivalents
Cash equivalents are short-term, highly liquid investments that are readily convertible to known amounts of cash and with
maturity dates that do not present significant risks of changes in value resulting from changes in interest rates, including time
deposits with original maturities of three months or less and repurchase agreements collateralized by government bonds and
corporate bonds.
(10) Financial Instruments
Financial assets and financial liabilities are recognized when the Company becomes a party to the contractual provisions of
the instrument.
The Company determines the classification of its financial assets at initial recognition. In accordance with IAS 39, financial
assets of the Company are classified as financial assets at fair value through profit or loss, available-for-sale financial assets,
held-to-maturity financial assets and notes, accounts and other receivables.
Purchase or sale of financial assets and liabilities are recognized using trade date accounting. All financial assets are
recognized initially at fair value plus, in the case of investments not at fair value through profit or loss, directly attributable
costs. Financial assets carried at fair value through profit or loss are initially recognized at fair value, and transaction costs
are expensed in the income statement.
Financial Assets
a. Classification and subsequent measurement
i. Financial assets at fair value through profit or loss
Financial assets at fair value through profit or loss are comprised of financial assets held for trading and financial
assets designated upon initial recognition at fair value through profit or loss.
Financial assets acquired for the purpose of selling or repurchasing in the near term, and derivative financial
instruments that are not designated as hedging instruments in hedge accounting are classified as financial assets
at fair value through profit or loss. Financial assets at fair value through profit or loss are measured at fair value
with changes in fair value recognized in profit or loss.
F-26

ii. Available-for-sale financial assets
Available-for-sale investments are those non-derivative financial assets that are designated as available-for-sale
or are not classified as financial assets at fair value through profit or loss, held-to-maturity financial assets, or
loans and receivables.
Available-for-sale financial investments are subsequently measured at fair value. Other than impairment losses
which are recognized in profit or loss, subsequent measurement of available-for-sale equity instrument financial
assets are recognized in other comprehensive income until the investment is derecognized, at which time the
cumulative gain or loss is recognized in profit or loss. If equity instrument investments do not have quoted prices
in an active market and their fair value cannot be reliably measured, then they are classified as financial assets
measured at cost on the balance sheet.
iii. Held-to-maturity financial assets
Non-derivative financial assets with fixed or determinable payments and fixed maturities are classified as
held-to-maturity when the Company has the positive intention and ability to hold them to maturity.
After initial measurement, held-to-maturity financial assets are measured at amortized cost using the effective
interest rate (EIR) method, less impairment. Amortized cost is calculated by taking into account any discount or
premium on acquisition and fees or transaction costs. The EIR method amortization and impairment, if any, is
recognized in profit or loss.
iv. Notes, accounts and other receivables
Notes and accounts receivable are creditors’ rights as a result of sales of goods or services. Other receivables are
any receivable not classified as notes and accounts receivable. Notes, accounts and other receivables are initially
measured and recognized at their fair values and subsequently measured at amortized cost using the EIR method,
less impairment. If the effect of discounting is immaterial, the short term notes, accounts and other receivables
are measured at their nominal amount.
F-27

b. Derecognition of financial assets
A financial asset is derecognized when:
i. the contractual rights to receive cash flows from the asset have expired;
ii. the Company has transferred assets and substantially all the risks and rewards of the asset have been transferred;
or
iii. the Company has neither transferred nor retained substantially all the risks and rewards of the asset, but has
transferred control of the asset.
On derecognition of a financial asset in its entirety, the difference between the carrying amount and the consideration
received or to be received including any cumulative gain or loss that had been recognized in other comprehensive
income is recognized in profit or loss.
If the transferred asset is part of a larger financial asset and the part transferred qualifies for derecognition in its
entirety, the Company allocates the previous carrying amount of the larger financial asset between the part that
continues to be recognized and the part that is derecognized, based on the relative fair values of those parts on the date
of the transfer. The difference between the carrying amount allocated to the part derecognized and the sum of the
consideration received for the part derecognized and any cumulative gain or loss allocated that had been recognized in
other comprehensive income, is recognized in profit or loss. A cumulative gain or loss that had been recognized in
other comprehensive income is allocated between the part that continues to be recognized and the part that is
derecognized, based on the relative fair values of those parts.
c. Impairment policy
The carrying amount of a financial asset is reduced as a result of impairment, except for accounts receivable for which
the carrying amount is reduced through use of an allowance account. When an account receivable is deemed to be
uncollectible, it is written off from the allowance account.
i. Notes, accounts and other receivables
The Company first assesses at each reporting date whether objective evidence of impairment exists for notes,
accounts and other receivables that are individually significant. If there is objective evidence that an impairment
loss has occurred, the amount of impairment loss is assessed individually. For notes, accounts and other
receivables other than those mentioned above, the Company groups those assets with similar credit risk
characteristics and collectively assesses them for impairment. If, in a subsequent period, the amount of the
impairment loss decreases, and the decrease can be related objectively to an event occurring after the impairment
was recognized, the previously recognized impairment loss is reversed and recognized through profit or loss.
The reversal shall not result in a carrying amount of notes, accounts and other receivables that exceeds what the
amortized cost would have been had the impairment not been recognized at the date the impairment is reversed.
F-28

ii. Other financial assets
The Company assesses, at each reporting date, whether there is objective evidence that a financial asset or a
group of financial assets is impaired. A financial asset or a group of financial assets is deemed to be impaired if,
and only if, there is objective evidence of impairment as a result of one or more loss events that has occurred
since the initial recognition of the asset (an incurred “loss event”) and that loss event has an impact on the
estimated future cash flows of the individual financial asset or a group of financial assets.
For the financial assets carried at amortized cost, the amount of the impairment loss is measured as the
difference between the carrying amount and the present value of estimated future cash flows, discounted at the
original effective interest rate. For equity investments classified as available-for-sale, objective evidence of an
impairment would include a significant or prolonged decline in the fair value of the investment below its cost.
When there is objective evidence of an impairment for available-for-sale equity securities, the full amount of the
losses previously recognized in other comprehensive income is reclassified to profit or loss. Impairment losses
recognized on equity investments cannot be reversed through profit or loss. Any subsequent increases in their
fair value after impairment are recognized in other comprehensive income.
Financial Liabilities
a. Classification and subsequent measurement
The Company classifies the instrument issued as a financial liability or an equity instrument in accordance with the
substance of the contractual arrangement and the definitions of a financial liability and an equity instrument.
F-29

i. Financial liabilities at fair value through profit or loss
Financial liabilities at fair value through profit or loss include financial liabilities held for trading and financial
liabilities designated upon initial recognition as at fair value through profit or loss. Gains or losses on the
subsequent measurement, including interest paid, are recognized in profit or loss.
ii. Financial liabilities carried at amortized cost
Financial liabilities measured at amortized cost include interest bearing loans and borrowings that are
subsequently measured using the EIR method after initial recognition. Gains and losses are recognized in profit
or loss when the liabilities are derecognized as well as through the EIR method amortization process.
Amortized cost is calculated by taking into account any discount or premium on acquisition and fees or
transaction costs.
b. Derecognition of financial liabilities
A financial liability is derecognized when the obligation under the liability is discharged, cancelled or expires.
When an existing financial liability is replaced by another from the same lender on substantially different terms, or the
terms of an existing liability are substantially modified (whether or not attributable to the financial difficulty of the
debtor), such an exchange or modification is treated as a derecognition of the original liability and the recognition of a
new liability, and the difference in the respective carrying amounts and the consideration paid, including any non-cash
assets transferred or liabilities assumed, is recognized in profit or loss.
(11) Inventories
Inventories are accounted for on a perpetual basis. Raw materials are stated at actual purchase costs, while the work in
process and finished goods are stated at standard costs and subsequently adjusted to weighted-average costs at the end of
each month. The cost of work in progress and finished goods comprises raw materials, direct labor, other direct costs and
related production overheads. Allocation of fixed production overheads to the costs of conversion is based on the normal
capacity of the production facilities. Cost associated with underutilized capacity is expensed as incurred. Inventories are
valued at the lower of cost and net realizable value item by item. Net realizable value is the estimated selling price in the
ordinary course of business less the estimated costs of completion and the estimated costs necessary to make the sale.
F-30

(12) Investments Accounted For Under the Equity Method
The Company’s investments in associates and joint ventures are accounted for using the equity method other than those that
meet the criteria to be classified as non-current assets held for sale.
An associate is an entity over which the Company has significant influence and that is neither a subsidiary nor a joint
venture. Significant influence is the power to participate in the financial and operating policy decisions of an entity, but is not
control or joint control over those policies.
A joint venture is a type of joint arrangement whereby the Company that has joint control of the arrangement has rights to
the net assets of the joint venture. Joint control is the contractually agreed sharing of control of an arrangement where no
single party controls the arrangement on its own, which exists only when decisions about the relevant activities require
unanimous consent of the parties sharing control.
Any difference between the acquisition cost and the Company’s share of the net fair value of the identifiable assets and
liabilities of associates and joint ventures is accounted for as follows:
a. Any excess of the acquisition cost over the Company’s share of the net fair value of the identifiable assets and
liabilities of an associate or a joint venture at the date of acquisition is recognized as goodwill and is included in the
carrying amount of the investment. Amortization of goodwill is not permitted.
b. Any excess of the Company’s share of the net fair value of the identifiable assets and liabilities of an associate or a
joint venture over the acquisition cost, after reassessing the fair value, is recognized as a gain in profit or loss on the
acquisition date.
F-31

Under the equity method, the investments in associates and joint ventures are carried on the balance sheet at cost plus post
acquisition changes in the Company’s share of profit or loss and other comprehensive income of associates and joint
ventures. The Company’s share of changes in associates’ and joint ventures’ profit or loss and other comprehensive income
are recognized directly in profit or loss and other comprehensive income, respectively. Distributions received from an
associate or a joint venture reduce the carrying amount of the investment. Any unrealized gains and losses resulting from
transactions between the Company and the associate or the joint venture are eliminated to the extent of the Company’s
interest in the associate or the joint venture.
Financial statements of associates and joint ventures are prepared for the same reporting period as the Company. Where
necessary, adjustments are made to bring the accounting policies in line with those of the Company.
Upon an associate’s issuance of new shares, if the Company takes up more shares than its original proportionate holding
while maintaining its significant influence over that associate, such increase would be accounted for as an acquisition of an
additional equity interest in the associate. Upon an associate’s issuance of new shares, if the Company does not take up
proportionate shares and reduces its stockholding percentage while maintaining its significant influence over that associate,
the Company will treat the transaction as deemed disposal and reclassify to profit or loss the proportion of the gain or loss
previously recognized in other comprehensive income relating to that reduction in ownership interest where appropriate.
The Company ceases to use the equity method upon loss of significant influence over an associate. Any difference between
the carrying amount of the investment in an associate upon loss of significant influence and the fair value of the retained
investment plus proceeds from disposal will be recognized in profit or loss. If an investment in an associate becomes an
investment in a joint venture or an investment in a joint venture becomes an investment in an associate, the Company
continues to apply the equity method and does not remeasure the retained interest.
The Company determines at each reporting date whether there is any objective evidence that the investments in associates
and joint ventures are impaired. An impairment loss, being the difference between the recoverable amount of the associate
and joint venture and its carrying amount, is recognized in profit or loss in the statement of comprehensive income and forms
part of the carrying amount of the investments.
F-32

(13) Property, Plant and Equipment
Property, plant and equipment are stated at cost, net of accumulated depreciation and accumulated impairment losses, if any,
and any borrowing costs incurred for long-term construction projects are capitalized if the recognition criteria are met.
Significant renewals, improvements and major inspections meeting the recognition criteria are treated as capital
expenditures, and the carrying amounts of those replaced parts are derecognized. Maintenance and repairs are recognized in
profit or loss as incurred. Any gain or loss arising from derecognition of the assets is recognized in other operating income
and expenses.
Depreciation is calculated on a straight-line basis over the estimated useful lives. A significant part of an item of property,
plant and equipment which has a different useful life from the remainder of the item is depreciated separately.
The depreciation methods, useful lives and residual values for the assets are reviewed at each fiscal year end, and the
changes from the previous estimation are recorded as changes in accounting estimates.
Except for land, which is not depreciated, the estimated useful lives of the assets are as follows:
Buildings 20~56 years
Machinery and equipment 3~11 years
Transportation equipment 5~7 years
Furniture and fixtures 1~9 years
Leasehold improvement The shorter of lease terms or useful lives
(14) Intangible Assets
Intangible assets acquired separately are measured on initial recognition at cost. The cost of intangible assets acquired in a
business combination is its fair value as at the date of acquisition. Following initial recognition, intangible assets are carried
at cost less any accumulated amortization and accumulated impairment losses, if any. Internally generated intangible assets
which fail to meet the recognition criteria are not capitalized and the expenditures are reflected in profit or loss in the period
incurred.
The useful lives of intangible assets are assessed as either finite or indefinite.
F-33

Intangible assets with finite useful lives are amortized over the useful lives and assessed for impairment whenever there is an
indication that the intangible assets may be impaired. The amortization period and the amortization method for an intangible
asset with a finite useful life are reviewed at least at the end of each fiscal year. Changes in the expected useful life or the
expected pattern of consumption of future economic benefits embodied in the asset is accounted for by changing the
amortization period or method, as appropriate, and is treated as changes in accounting estimates.
Intangible assets with indefinite useful lives are not amortized, but are tested for impairment annually, either individually or
at the CGU level. The assessment of indefinite useful life is reviewed annually to determine whether the indefinite useful life
continues to be supportable. If not, the change in useful life from indefinite to finite is made on a prospective basis.
Gains or losses arising from derecognition of an intangible asset are recognized in other operating income and expenses.
Accounting policies of the Company’s intangible assets are summarized as follows:
a. Goodwill arising from business combinations is not amortized, and is tested for impairment annually or more
frequently if events or changes in circumstances suggest that the carrying amount may not be recoverable. If an event
occurs or circumstances change which indicates that the goodwill is impaired, an impairment loss is recognized.
Goodwill impairment losses cannot be reversed once recognized.
b. Software is amortized over the contract term or estimated useful life (3~6 years) on a straight-line basis.
c. Patent and technology license fee: Upon signing of contract and obtaining the right to intellectual property, any
portion attributable to non-cancellable and mutually agreed future fixed license fees for patent and technology is
discounted and recognized as an intangible asset and related liability. The cost of the intangible asset is not revalued
once determined on initial recognition, and is amortized over the useful life (5~10 years) on a straight-line basis.
Interest expenses from the related liability are recognized and calculated based on the EIR method. Based on the
timing of payments, the liability is classified as current and non-current.
d. Others are mainly the intellectual property license fees, amortized over the shorter of the contract term or estimated
useful life (3 years) of the related technology on a straight-line basis.
F-34

(15) Impairment of Non-Financial Assets
The Company assesses at each reporting date whether there is an indication that an asset in the scope of IAS 36 “Impairment
of Assets” (IAS 36) may be impaired. If any indication exists, the Company completes impairment testing for the CGU to
which the individual assets belong. Where the carrying amount of an asset or CGU exceeds its recoverable amount, the asset
is considered impaired and is written down to its recoverable amount. The recoverable amount of an individual asset or a
CGU is the higher of its fair value less costs of disposal and its value in use. If circumstances indicate that previously
recognized impairment losses may no longer exist or may have decreased at each reporting date, the Company re-assesses
the asset’s or CGU’s recoverable amount. A previously recognized impairment loss is reversed only if there has been an
increase in the estimated service potential of an asset which in turn increases the recoverable amount since the last
impairment loss was recognized. The reversal is limited so that the carrying amount of the asset does not exceed its
recoverable amount, nor exceed the carrying amount that would have been determined, net of depreciation or amortization,
had no impairment loss been recognized for the asset in prior years.
A CGU, or group of CGUs, to which goodwill has been allocated is tested for impairment annually at the same time every
year, irrespective of whether there is any indication of impairment. Where the carrying amount of a CGU (including the
carrying amount of goodwill) exceeds its recoverable amount, the CGU is considered impaired. If an impairment loss is to be
recognized, it is first allocated to reduce the carrying amount of any goodwill allocated to the CGU (group of units), then to
the other assets of the unit (group of units) pro rata on the basis of the carrying amount of each asset in the unit (group of
units). Impairment losses relating to goodwill cannot be reversed in future periods.
The recognition or reversal of impairment losses is classified as other operating income and expenses.
(16) Bonds
Convertible bonds
UMC evaluates the terms of the convertible bonds issued to determine whether it contains both a liability and an equity
component. Furthermore, UMC assesses if the economic characteristics and risks of the put and call options embedded in the
convertible bonds are closely related to the economic characteristics and risk of the host contract before separating the equity
element.
F-35

For the liability component excluding the derivatives, its fair value is determined based on the effective interest rate applied
at that time by the market to instruments of comparable credit status. The liability component is classified as a financial
liability measured at amortized cost using the EIR method before the instrument is converted or settled. For the embedded
derivative that is not closely related to the host contract, it is classified as a liability component and subsequently measured at
fair value through profit or loss unless it qualifies as an equity component. The equity component is recognized initially at
the difference between the fair value of the compound financial instrument as a whole and the fair value of the liability
component. Its carrying amount is not remeasured in the subsequent accounting periods. If the convertible bond issued does
not have an equity component, it is accounted for as a hybrid instrument in accordance with the requirements under IAS 39.
If the convertible bondholders exercise their conversion right before maturity, UMC shall adjust the carrying amount of the
liability component. The adjusted carrying amount of the liability component at conversion and the carrying amount of
equity component are credited to common stock and additional paid-in capital - premiums. No gain or loss is recognized
upon bond conversion.
In addition, the liability component of convertible bonds is classified as a current liability if within 12 months the
bondholders may exercise the put right. After the put right expires, the liability component of the convertible bonds should
be reclassified as a non-current liability if it meets the definition of a non-current liability in all other respects.
(17) Post-Employment Benefits
Under defined contribution pension plans, the contribution payable to the plan in exchange for the service rendered by an
employee during a period shall be recognized as an expense. The contribution payable, after deducting any amount already
paid, is recognized as a liability.
Under defined benefit pension plans, the net defined benefit liability (asset) shall be recognized as the amount of the present
value of the defined benefit obligation, deducting the fair value of any plan assets and adjusting for any effect of the asset
ceiling. Service cost and net interest on the net defined benefit liability (asset) are recognized as expenses in the period of
service. Remeasurement of the net defined benefit liability (asset), which comprises actuarial gains and losses, the return on
plan assets and any change in the effect of the asset ceiling, excluding any amounts included in net interest, is recognized in
other comprehensive income in the period in which they occur. Remeasurement recognized in other comprehensive income
is reflected immediately in retained earnings and shall not be reclassified to profit or loss in a subsequent period.
F-36

(18) Government Grants
In accordance with IAS 20 “Accounting for Government Grants and Disclosure of Government Assistance”, the Company
recognizes the government grants when there is reasonable assurance that such grants will be received and the conditions
attaching to them will be complied with.
An asset related government grant is recorded as deferred income and recognized in profit or loss on a straight-line basis
over the useful lives of the assets. An expense related government grant is recognized in profit or loss on a systematic basis
over the periods in which the Company recognizes as expenses the related costs for which the grant is intended to
compensate. A government grant that compensates for expenses or losses already incurred or for the purpose of giving
immediate financial support to the Company with no future related costs is recognized in profit or loss when it becomes
receivable.
(19) Treasury Stock
UMC’s own equity instruments repurchased (treasury shares) are recognized at repurchase cost and deducted from equity.
Any difference between the carrying amount and the consideration is recognized in equity.
(20) Share-Based Payment Transactions
The cost of equity-settled transactions between the Company and its employees is measured based on the fair value at the
date on which they are granted. The fair value of the equity instruments is determined using an appropriate pricing model.
The cost of equity-settled transactions is recognized, together with a corresponding increase in other capital reserves in
equity, over the periods in which the performance and/or service conditions are being fulfilled. The cumulative expense
recognized for equity-settled transactions at each reporting date reflects the extent to which the vesting period has passed and
the Company’s best estimate of the quantity of equity instruments that will ultimately vest. The charge to profit or loss for a
period represents the movement in cumulative expense recognized between the beginning and the end of that period.
F-37

No expense will be recognized for awards that do not ultimately vest, except for equity-settled transactions for which vesting
is conditional upon a market or non-vesting condition. These are treated as vested irrespective of whether the market or
non-vesting condition is satisfied, provided that all other performance and/or service conditions are satisfied.
Where the terms of an equity-settled transaction award are modified, the minimum expense recognized is the expense as if
the terms had not been modified, if the original terms of the award are met. An additional expense is recognized for any
modification that increases the total fair value of the share-based payment transaction, or is otherwise beneficial to the
employee as measured at the date of modification.
Where an equity-settled award is cancelled, it is treated as if it fully vests on the date of cancellation, and any expense not yet
recognized for the award is recognized immediately. This includes any award where non-vesting conditions within the
control of either the entity or the employee are not met. However, if a new award substitutes for the cancelled award and is
designated as a replacement award on the date that it is granted, the cancelled and new awards are treated as if they were a
modification of the original award.
The dilutive effect of outstanding options is reflected as additional share dilution in the computation of diluted earnings per
share.
(21) Revenue Recognition
Revenue is recognized to the extent that it is probable that the economic benefits will flow to the Company and the revenue
can be reliably measured. Revenue is measured at the fair value of the consideration received or receivable. The specific
criteria described below must also be met before revenue is recognized.
F-38

Sales revenue
The Company manufactures semiconductors for creditworthy customers based on their design specifications, pursuant to
manufacturing agreements and/or purchase orders at contractual prices. The Company ships wafers mainly under the trade
term, Free Carrier (FCA), through which the title and risk of loss for the wafers are transferred to the customers upon
delivery to carriers approved by the customers. Sales revenue is recognized at this point, having also fulfilled all of the
following criteria pursuant to IAS 18, paragraph 14:
a. the significant risks and rewards of ownership of the goods have been transferred to the customer;
b. neither continuing managerial involvement to the degree usually associated with ownership nor effective control over
the goods sold have been retained;
c. the amount of revenue can be measured reliably;
d. it is probable that the economic benefits associated with the transaction will flow to the entity; and
e. the costs incurred or to be incurred in respect of the transaction can be measured reliably.
Sales revenue is measured at the fair value of the consideration received or receivable, net of sales returns and discounts,
which are estimated based on customer complaints, historical experience and other known factors. Sales returns and
discounts are recorded in the same period in which sales are made.
Interest income
For financial assets measured at amortized cost (including held-to-maturity financial assets) and financial assets at fair value
through profit or loss, interest income is recorded using the effective interest rate and recognized in profit or loss.
Dividends
Revenue is recognized when the Company’s right to receive the dividends is established, which is generally when
stockholders approve the dividend.
(22) Income Tax
Income tax expense (benefit) is the aggregate amount of current income tax and deferred income tax included in the
determination of profit or loss for the period.
Current income tax
Current income tax assets and liabilities for the current period and prior periods are measured using the tax rates and tax laws
that have been enacted or substantively enacted by the end of the reporting period. Current income tax relating to items
recognized directly in other comprehensive income or equity is recognized in other comprehensive income or equity rather
than profit or loss.
F-39

Undistributed earnings, calculated based on Business Entity Accounting Act are subject to a 10% tax in accordance with the
Income Tax Law of the R.O.C. Accordingly, the undistributed tax impact of 10% is provided in the period the income is
earned, assuming that no earnings are distributed. Any reduction in the liability will be recognized when the income is
distributed upon the stockholders’ approval in the subsequent year. Tax on undistributed earnings may be offset by the
Company’s available tax credits carried forward, where applicable. As such, the incremental tax accrued on undistributed
earnings may be offset by a corresponding reduction in deferred income tax assets, where applicable.
Deferred income tax
Deferred income tax is determined using the liability method on temporary differences between the tax bases of assets and
liabilities and their carrying amounts in financial statements at the reporting date.
Deferred tax liabilities are recognized for all taxable temporary differences, except:
a. When the deferred tax liability arises from the initial recognition of goodwill or of an asset or liability in a transaction
that is not a business combination and, at the time of the transaction, affects neither the accounting profit nor taxable
profit or loss;
b. In respect of taxable temporary differences associated with investments in subsidiaries, associates and joint ventures,
when the timing of the reversal of the temporary differences can be controlled and it is probable that the temporary
differences will not be reversed in the foreseeable future.
Deferred tax assets are recognized for all deductible temporary differences, the carryforward of unused tax losses and unused
tax credits, to the extent that it is probable that future taxable profit will be available against which the deductible temporary
differences and the carryforward of unused tax losses and unused tax credits can be utilized, except:
a. Where the deferred tax asset relating to the deductible temporary difference arises from the initial recognition of an
asset or liability in a transaction that is not a business combination and, at the time of the transaction, affects neither
the accounting profit nor taxable profit or loss;
F-40

b. In respect of deductible temporary differences associated with investments in subsidiaries, associates and joint
ventures, deferred tax assets are recognized only to the extent that it is probable that the temporary differences will
reverse in the foreseeable future and taxable profit will be available against which the temporary differences can be
utilized.
Deferred tax assets and liabilities are measured at the tax rates that are expected to apply in the year when the asset is
realized or the liability is settled, based on tax rates and tax laws that have been enacted or substantively enacted at the
reporting date. The measurement of deferred tax assets and liabilities reflects the tax consequences that would follow the
manner in which the Company expects, at the end of the reporting period, to recover or settle the carrying amount of its
assets and liabilities. Deferred tax relating to items recognized outside profit or loss is not recognized in profit or loss but
rather in other comprehensive income or directly in equity. Deferred tax assets are reassessed and recognized at each
reporting date. Unrecognized deferred tax assets are reassessed at each reporting date and are recognized to the extent that it
has become probable that future taxable profits will allow the deferred tax assets to be recovered.
Deferred tax assets and liabilities offset each other, if a legally enforceable right exists to set off current income tax assets
against current income tax liabilities, and the deferred taxes relate to the same taxable entity and the same taxation authority.
Tax benefits acquired as part of a business combination, but not satisfying the criteria for separate recognition at the
acquisition date, might be realized and recognized subsequently as follows:
a. Acquired deferred tax benefits recognized within the measurement period that result from new information about facts
and circumstances that existed at the acquisition date shall be applied to reduce the carrying amount of any goodwill
related to that acquisition. If the carrying amount of that goodwill is nil, any remaining deferred tax benefits shall be
recognized in profit or loss;
b. All other acquired deferred tax benefits realized shall be recognized in profit or loss, other comprehensive income or
equity.
F-41

(23) Earnings per Share
Earnings per share is computed according to IAS 33 “Earnings per Share”. Basic earnings per share is computed by dividing
net income by the weighted-average number of ordinary shares outstanding during the current reporting period. Diluted
earnings per share is computed by taking basic earnings per share into consideration plus additional ordinary shares that
would have been outstanding if the dilutive share equivalents had been issued. Net income is also adjusted for interest and
other income or expenses derived from any underlying dilutive share equivalents. The weighted-average of outstanding
shares is adjusted retroactively for stock dividends and employee stock compensation issues.
5. SIGNIFICANT ACCOUNTING JUDGMENTS, ESTIMATES AND ASSUMPTIONS
The preparation of the Company’s consolidated financial statements requires management to make judgments, estimates and
assumptions that affect the reported amounts of revenues, expenses, assets, liabilities, the accompanying disclosures and the
disclosure of contingent liabilities. However, uncertainty about these assumptions and estimates could result in outcomes that
require a material adjustment to the carrying amount of assets or liabilities affected in future periods.
The key assumptions concerning the future and other key sources of estimating uncertainty at the reporting date that would have a
significant risk for a material adjustment to the carrying amounts of assets or liabilities within the next fiscal year are discussed
below.
The Company bases its assumptions and estimates on information available when the consolidated financial statements were
prepared. Existing circumstances and assumptions about future developments, however, may change due to market changes or
circumstances arising beyond the control of the Company. Such changes are reflected in the assumptions when they occur.
(1) The Fair Value of Financial Instruments
Where the fair values of financial assets and financial liabilities recorded in the balance sheet cannot be derived from active
markets, they are determined using valuation techniques including income approach (for example, the discounted cash flows
model) or the market approach. Changes in assumptions about these factors could affect the reported fair value of the
financial instruments. Please refer to Note 11 for more details.
F-42

(2) Inventories
Inventories are valued at the lower of cost and net realizable value item by item. Net realizable value is the estimated selling
price in the ordinary course of business less the estimated costs of completion and the estimated costs necessary to make the
sale. Please refer to Note 6(4). Costs of completion include direct labor and overhead, including depreciation and
maintenance of production equipment, indirect labor costs, indirect material costs, supplies, utilities and royalties that is
expected to be incurred at normal production level. The Company estimates normal production level taking into account loss
of capacity resulting from planned maintenance, based on historical experience and current production capacity.
(3) Post-Employment Benefits
Defined benefit costs and the present value of the defined benefit obligation for a pension plan are determined using the
projected unit credit method. An actuarial valuation involves making various assumptions, which include the determination
of the discount rate, future salary increase rate, mortality rate, etc., and may differ from actual developments in the future. In
determining the appropriate discount rate, management considers the interest rates of the government bonds extrapolated
from maturity corresponding to the expected duration of the defined benefit obligation. As for the rate of future salary
increase, management takes account of past experiences, comparisons within the industry and the geographical region,
inflation and the discount rate. Due to the complexity of the actuarial valuation and its long-term nature, a defined benefit
obligation is highly sensitive to changes in these assumptions. The assumptions used are disclosed in Note 6(14).
(4) Impairment of Property, Plant and Equipment
At each reporting date or whenever events indicate that the asset’s value has declined or significant changes in the market
with an adverse effect have taken place, the Company assesses whether there is an indication that an asset in the scope of
IAS 36 may be impaired. If any indication exists, the Company completes impairment testing for the CGU to which the
individual assets belong. Where the carrying amount of an asset or CGU exceeds its recoverable amount, the asset is
considered impaired and is written down to its recoverable amount. The recoverable amount of an individual asset or CGU is
the higher of fair value less costs of disposal and its value in use. The fair value less costs of disposal is based on best
information available to reflect the amount that an entity could obtain from the disposal of the asset in an orderly transaction
between market participants, after deducting the costs of disposal. The value in use is measured at the net present value of
the future cash flows the entity expects to derive from the asset or CGU. Cash flow projection involves subjective judgments
and estimates which include the estimated useful lives of property, plant and equipment, capacity that generates future cash
flows, capacity of physical output, potential fluctuations of economic cycle in the industry and the Company’s operating
situation.
F-43

(5) Income Tax
Uncertainties exist with respect to the interpretation of complex tax regulations, changes in tax laws, and the amount and
timing of future taxable income. The Company establishes provisions, based on reasonable estimates, for possible
consequences of audits by the tax authorities of the respective countries in which it operates. The amount of such provisions
is based on various factors, such as experience of previous tax audits and different interpretations of tax regulations made by
the taxable entity and the responsible tax authority. Such differences of interpretation may arise on a wide variety of issues
depending on the conditions prevailing in the respective domicile of the Company.
Deferred tax assets are recognized for all carryforward of unused tax losses, tax credits and deductible temporary differences
to the extent that it is probable that future taxable profit will be available or there are sufficient taxable temporary differences
against which the unused tax losses, unused tax credits or deductible temporary differences can be utilized. The amount of
deferred tax assets determined to be recognized is based upon the likely timing and the level of future taxable profits and
taxable temporary differences. Please refer to Note 6(23) for more details on unrecognized deferred tax assets.
6. CONTENTS OF SIGNIFICANT ACCOUNTS
(1) Cash and Cash Equivalents
As of December 31,
2016 2017
NT$ NT$
(In Thousands) (In Thousands)
Cash on hand $ 3,717 $ 4,360
Checking and savings accounts 17,840,926 21,699,357
Time deposits 33,546,190 50,711,803
Repurchase agreements collateralized by government and corporate
bonds
6,188,148 9,259,052
Total $57,578,981 $81,674,572
F-44

(2) Financial Assets at Fair Value through Profit or Loss
As of December 31,
2016 2017
NT$ NT$
(In Thousands) (In Thousands)
Designated financial assets at fair value through profit or loss
Convertible bonds $ 263,201 $ 213,180
Financial assets held for trading
Common stocks 425,197 434,630
Preferred stocks 189,960 228,508
Funds 50,003 —
Forward exchange contracts 543 —
Option — 31,605
Subtotal 665,703 694,743
Total $ 928,904 $ 907,923
Current $ 714,169 $ 716,918
Noncurrent 214,735 191,005
Total $ 928,904 $ 907,923
The Company has a call option, exercisable before September 2019, to acquire remaining equity interest in an existing
investee from the other shareholder in the amount of approximately NT$15 billion. The change of the fair value for the call
option is recorded in profit and loss.
F-45

(3) Accounts Receivable, Net
As of December 31,
2016 2017
NT$ NT$
(In Thousands) (In Thousands)
Accounts receivable $ 24,732,207 $ 21,910,146
Less: allowance for sales returns and discounts (1,744,151) (994,151)
Less: allowance for doubtful accounts (86,595) (39,578)
Net $ 22,901,461 $ 20,876,417
Aging analysis of accounts receivable, net:
As of December 31,
2016 2017
NT$ NT$
(In Thousands) (In Thousands)
Neither past due nor impaired $ 18,516,739 $ 15,496,207
Past due but not impaired:
30 days 3,018,482 4,268,772
31 to 60 days 630,762 444,401
61 to 90 days 513,702 138,178
91 to 120 days 183,572 124,332
121 days 38,204 404,527
Subtotal 4,384,722 5,380,210
Total $ 22,901,461 $ 20,876,417
Movement on allowance for individually evaluated doubtful accounts:
For the years ended December 31,
2016 2017
NT$ NT$
(In Thousands) (In Thousands)
Beginning balance $ 90,568 $ 86,595
Net charge for the period (3,973) (47,017)
Ending balance $ 86,595 $ 39,578
F-46

The collection periods for third party domestic sales and third party overseas sales were month-end 30~60 days and net
30~60 days, respectively.
The impairment losses assessed individually as of December 31, 2016 and 2017 primarily resulted from the financial
difficulties of the counter trading parties and the amounts recognized were the difference between the carrying amount of the
accounts receivable and the present value of expected collectable amounts. The Company has no collateral with respect to
those accounts receivables.
(4) Inventories, Net
As of December 31,
2016 2017
NT$ NT$
(In Thousands) (In Thousands)
Raw materials $ 2,248,589 $ 2,354,410
Supplies and spare parts 2,795,371 3,007,669
Work in process 10,712,396 11,492,450
Finished goods 1,241,459 1,402,971
Total $16,997,815 $18,257,500
a. For the years ended December 31, 2015, 2016 and 2017, the Company recognized NT$109,782 million,
NT$114,527 million and NT$118,252 million, respectively, in operating costs, of which NT$826 million,
NT$2,130 million and NT$2,256 million in 2015, 2016 and 2017, respectively, were related to write-down of
inventories.
b. On February 6, 2016, an earthquake with a magnitude of 6.4 Richter struck southern Taiwan and caused financial
related losses to UMC. UMC insured for losses endured due to the earthquake. As of December 31, 2016, UMC
recognized losses including loss from scrapped inventory of NT$1,143 million and production line recovery expenses
of NT$669 million. Furthermore, UMC received compensation from insurance claims of NT$2,646 million. The case
was closed as of December 31, 2016.
c. None of the aforementioned inventories were pledged.
F-47

(5) Available-For-Sale Financial Assets, Non-Current
As of December 31,
2016 2017
NT$ NT$
(In Thousands) (In Thousands)
Common stocks $18,059,586 $17,653,513
Preferred stocks 1,203,589 1,865,410
Depositary receipts 202,979 —
Funds 949,387 1,117,409
Total $20,415,541 $20,636,332
(6) Financial Assets Measured at Cost, Non-Current
As of December 31,
2016 2017
NT$ NT$
(In Thousands) (In Thousands)
Common stocks $ 514,426 $ 473,134
Preferred stocks 2,152,297 1,657,388
Funds 93,892 87,950
Total $ 2,760,615 $ 2,218,472
Since these financial assets mostly consist of non-publicly traded stocks and private venture funds, for which the fair values
cannot be reliably measured due to lack of sufficient financial information available, the Company measures these financial
assets at cost.
F-48

(7) Investments Accounted For Under the Equity Method
a. Details of investments accounted for under the equity method are as follows:
As of December 31,
2016 2017
Investee companies Amount
Percentage of
ownership or
voting rights Amount
Percentage of
ownership or
voting rights
NT$ NT$
(In Thousands) (In Thousands)
Listed companies
FARADAY TECHNOLOGY CORP. (FARADAY)
(Note A)
$ 1,671,902 13.94 $ 1,659,807 13.78
CLIENTRON CORP. — — 264,545 22.39
Unlisted companies
SHANDONG HUAHONG ENERGY INVEST CO.,
INC. (SHANDONG HUAHONG) (Note B)
— 50.00 — 50.00
WINAICO SOLAR PROJEKT 1 GMBH (Note B) — 50.00 — 50.00
MTIC HOLDINGS PTE. LTD. 75,502 45.44 50,743 45.44
YUNG LI INVESTMENTS, INC. 174,153 45.16 42,144 45.16
WINAICO IMMOBILIEN GMBH (Note B) — 44.78 — 44.78
UNITECH CAPITAL INC. 531,373 42.00 732,267 42.00
TRIKNIGHT CAPITAL CORPORATION 836,752 40.00 889,876 40.00
HSUN CHIEH INVESTMENT CO., LTD. 1,249,738 36.49 1,600,524 36.49
CTC CAPITAL PARTNERS I, L.P. 61,780 31.40 32 31.40
YANN YUAN INVESTMENT CO., LTD. 1,679,552 31.94 2,027,204 30.87
HSUN CHIEN CAPITAL CORPORATION — — 176,911 30.00
VSENSE CO., LTD. 85,719 28.63 78,294 28.63
UNITED LED CORPORATION HONG KONG
LIMITED
252,853 25.14 216,707 25.14
TRANSLINK CAPITAL PARTNERS I, L.P. (Note C) 111,416 10.38 108,925 10.38
CLIENTRON CORP. 235,799 20.28 — —
MEGA MISSION LIMITED PARTNERSHIP (MEGA)
(Note D)
1,823,877 45.00 — —
ACHIEVE MADE INTERNATIONAL LTD. 105,777 23.32 — —
LIST EARN ENTERPRISE INC. 9,722 49.00 — —
Total $ 8,905,915 $ 7,847,979
F-49

Note A: Beginning from June 2015, the Company accounts for its investment in FARADAY as an associate given
the fact that the Company obtained the ability to exercise significant influence over FARADAY through
representation on its Board of Directors. As a result, the investment was reclassified out of the
available-for-sale category as an investment in associate accounted for under the equity method. Fair
value remeasurement that was previously recognized in other comprehensive income was reclassified to
profit or loss in 2015.
Note B: SHANDONG HUAHONG, WINAICO SOLAR PROJEKT 1 GMBH and WINAICO IMMOBILIEN
GMBH are joint ventures to the Company.
Note C: The Company follows international accounting practices in equity accounting for limited partnerships
and uses the equity method to account for these investees.
Note D: The liquidation of MEGA was completed in March, 2017, and UMC has acquired cash proceeds from
liquidation of investments amounted to NT$1,980 million.
The carrying amount of investments accounted for using the equity method for which there are published price
quotations amounted to NT$1,672 million and NT$1,924 million, as of December 31, 2016 and 2017, respectively.
The fair value of these investments were NT$1,039 million and NT$2,142 million, as of December 31, 2016 and
2017, respectively.
None of the aforementioned associates and joint ventures were pledged.
b. Financial information of associates and joint ventures:
There is no individually significant associate or joint venture for the Company. For individually immaterial associates
and joint ventures, the following tables summarize the amount recognized by the Company at its share of those
associates and joint ventures separately. When an associate or a joint venture is a foreign operation, and the functional
currency of the foreign entity is different from the Company, an exchange difference arising from translation of the
foreign entity will be recognized in other comprehensive income (loss). Such exchange differences recognized in
other comprehensive income (loss) in the financial statements for the years ended December 31, 2015, 2016 and 2017
were NT$46 million, NT$(83) million and NT$45 million, respectively, which were not included in the following
table.
F-50

(i) The aggregate amount of the Company’s share of its all individually immaterial associates that are accounted for
using the equity method was as follows:
For the years ended December 31,
2015 2016 2017
NT$ NT$ NT$
(In Thousands) (In Thousands) (In Thousands)
Profit (Loss) from continuing operations $ 44,834 $ (270,060) $ 77,589
Post-tax profit from discontinued operations — — 80,248
Other comprehensive income (loss) (360,618) (187,891) 526,773
Total comprehensive income (loss) $ (315,784) $ (457,951) $ 684,610
(ii) The aggregate amount of the Company’s share of its all individually immaterial joint ventures that are accounted
for using the equity method was as follows:
For the years ended December 31,
2015 2016 2017
NT$ NT$ NT$
(In Thousands) (In Thousands) (In Thousands)
Loss from continuing operations $ (40,140) $ (45,606) $ —
Other comprehensive income (loss) — — —
Total comprehensive loss $ (40,140) $ (45,606) $ —
(8) Property, Plant and Equipment
As of December 31,
2016 2017
NT$ NT$
(In Thousands) (In Thousands)
Land $ 1,314,402 $ 1,314,402
Buildings 21,429,861 21,112,807
Machinery and equipment 155,539,235 160,497,062
Transportation equipment 21,958 18,751
Furniture and fixtures 1,627,959 2,038,816
Leasehold improvement 7,307 4,353
Construction in progress and equipment awaiting inspection 45,042,682 20,755,490
Net $224,983,404 $205,741,681
F-51

Cost:
Land Buildings
Machinery
and equipment
Transportation
equipment
Furniture
and fixtures
Leasehold
improvement
Construction
in progress
and equipment
awaiting
inspection Total
NT$ NT$ NT$ NT$ NT$ NT$ NT$ NT$
(In Thousands) (In Thousands) (In Thousands) (In Thousands) (In Thousands) (In Thousands) (In Thousands) (In Thousands)
As of January 1, 2016 $ 1,314,402 $ 31,396,873 $712,551,068 $ 74,251 $ 6,064,146 $ 70,431 $ 41,904,111 $793,375,282
Additions — — — — — — 83,703,970 83,703,970
Disposals — — (3,976,177) (5,237) (51,354) — — (4,032,768)
Transfers and
reclassifications
— 6,020,884 81,101,146 9,981 831,465 268 (79,048,373) 8,915,371
Exchange effect — (375,434) (4,233,062) (681) (17,300) (1,454) (1,511,077) (6,139,008)
As of December 31, 2016 $ 1,314,402 $ 37,042,323 $785,442,975 $ 78,314 $ 6,826,957 $ 69,245 $ 45,048,631 $875,822,847
Land Buildings
Machinery
and equipment
Transportation
equipment
Furniture
and fixtures
Leasehold
improvement
Construction
in progress
and equipment
awaiting
inspection Total
NT$ NT$ NT$ NT$ NT$ NT$ NT$ NT$
(In Thousands) (In Thousands) (In Thousands) (In Thousands) (In Thousands) (In Thousands) (In Thousands) (In Thousands)
As of January 1, 2017 $ 1,314,402 $ 37,042,323 $785,442,975 $ 78,314 $ 6,826,957 $ 69,245 $ 45,048,631 $875,822,847
Additions — — — — — — 31,140,639 31,140,639
Disposals — — (3,200,814) (5,774) (40,115) (14,785) — (3,261,488)
Transfers and
reclassifications
— 1,479,439 55,836,583 4,268 924,252 1,534 (54,921,519) 3,324,557
Exchange effect — (448,102) (11,809,825) (1,026) (35,296) (3,437) (506,312) (12,803,998)
As of December 31, 2017 $ 1,314,402 $ 38,073,660 $826,268,919 $ 75,782 $ 7,675,798 $ 52,557 $ 20,761,439 $894,222,557
F-52
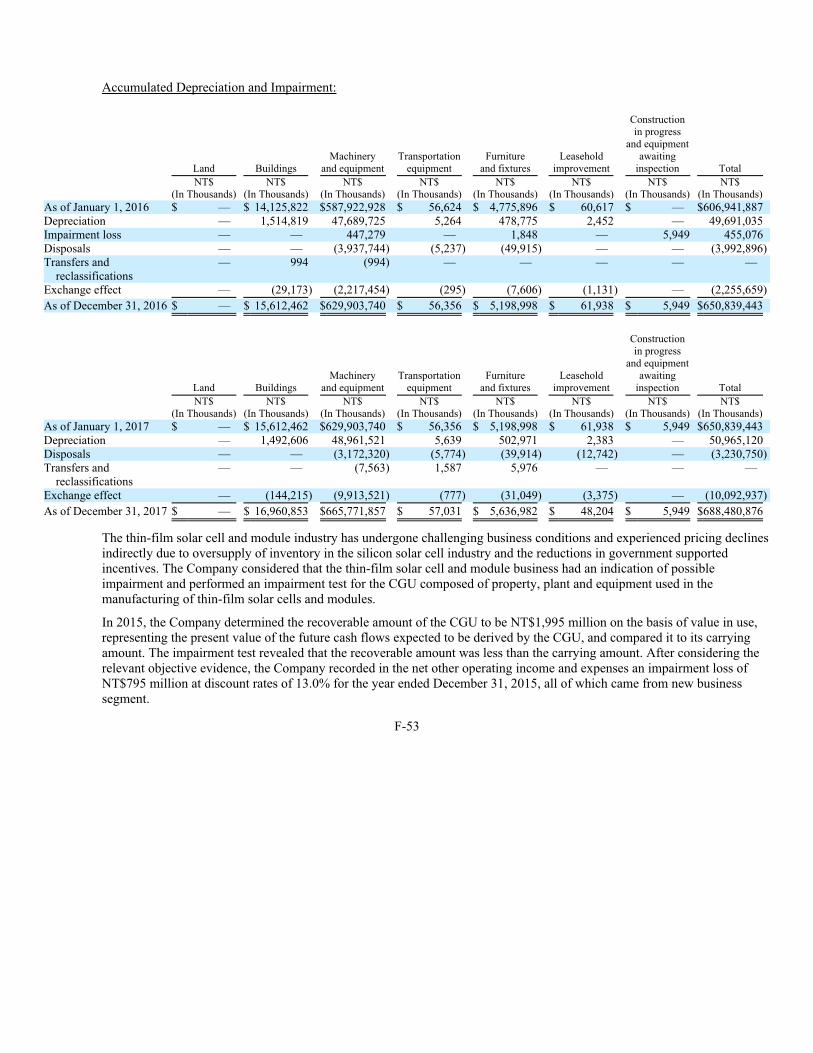
Accumulated Depreciation and Impairment:
Land Buildings
Machinery
and equipment
Transportation
equipment
Furniture
and fixtures
Leasehold
improvement
Construction
in progress
and equipment
awaiting
inspection Total
NT$ NT$ NT$ NT$ NT$ NT$ NT$ NT$
(In Thousands) (In Thousands) (In Thousands) (In Thousands) (In Thousands) (In Thousands) (In Thousands) (In Thousands)
As of January 1, 2016 $ — $ 14,125,822 $587,922,928 $ 56,624 $ 4,775,896 $ 60,617 $ — $606,941,887
Depreciation — 1,514,819 47,689,725 5,264 478,775 2,452 — 49,691,035
Impairment loss — — 447,279 — 1,848 — 5,949 455,076
Disposals — — (3,937,744) (5,237) (49,915) — — (3,992,896)
Transfers and
reclassifications
— 994 (994) — — — — —
Exchange effect — (29,173) (2,217,454) (295) (7,606) (1,131) — (2,255,659)
As of December 31, 2016 $ — $ 15,612,462 $629,903,740 $ 56,356 $ 5,198,998 $ 61,938 $ 5,949 $650,839,443
Land Buildings
Machinery
and equipment
Transportation
equipment
Furniture
and fixtures
Leasehold
improvement
Construction
in progress
and equipment
awaiting
inspection Total
NT$ NT$ NT$ NT$ NT$ NT$ NT$ NT$
(In Thousands) (In Thousands) (In Thousands) (In Thousands) (In Thousands) (In Thousands) (In Thousands) (In Thousands)
As of January 1, 2017 $ — $ 15,612,462 $629,903,740 $ 56,356 $ 5,198,998 $ 61,938 $ 5,949 $650,839,443
Depreciation — 1,492,606 48,961,521 5,639 502,971 2,383 — 50,965,120
Disposals — — (3,172,320) (5,774) (39,914) (12,742) — (3,230,750)
Transfers and
reclassifications
— — (7,563) 1,587 5,976 — — —
Exchange effect — (144,215) (9,913,521) (777) (31,049) (3,375) — (10,092,937)
As of December 31, 2017 $ — $ 16,960,853 $665,771,857 $ 57,031 $ 5,636,982 $ 48,204 $ 5,949 $688,480,876
The thin-film solar cell and module industry has undergone challenging business conditions and experienced pricing declines
indirectly due to oversupply of inventory in the silicon solar cell industry and the reductions in government supported
incentives. The Company considered that the thin-film solar cell and module business had an indication of possible
impairment and performed an impairment test for the CGU composed of property, plant and equipment used in the
manufacturing of thin-film solar cells and modules.
In 2015, the Company determined the recoverable amount of the CGU to be NT$1,995 million on the basis of value in use,
representing the present value of the future cash flows expected to be derived by the CGU, and compared it to its carrying
amount. The impairment test revealed that the recoverable amount was less than the carrying amount. After considering the
relevant objective evidence, the Company recorded in the net other operating income and expenses an impairment loss of
NT$795 million at discount rates of 13.0% for the year ended December 31, 2015, all of which came from new business
segment.
F-53

In 2016, the Company determined the recoverable amount of the CGU to be NT$1,169 million based on the fair value less
costs of disposal. Its fair value measurement was classified as Level 3 of the fair value hierarchy. External independent
appraisers are involved in fair value measurement using a cost method. After considering the relevant objective evidence, the
key assumptions used included replacement costs, residual value and remaining useful life of the existing assets. The
impairment test revealed that the recoverable amount was less than the carrying amount. The Company recorded in the net
other operating income and expenses an impairment loss of NT$455 million for the year ended December 31, 2016, all of
which came from new business segment.
In 2017, the Company determined that the recoverable amount based on the fair value less costs of disposal was higher than
the carrying amount of the CGU and therefore there was no impairment recognized.
Please refer to Note 8 for property, plant and equipment pledged as collateral.
The amounts of total interest expense before capitalization of borrowing costs were NT$867 million, NT$1,407 million and
NT$2,407 million for the years ended December 31, 2015, 2016 and 2017, respectively. Details of capitalized borrowing
costs are as follows:
For the years ended December 31,
2015 2016 2017
NT$ NT$ NT$
(In Thousands) (In Thousands) (In Thousands)
Total interest capitalized $ 395,569 $ 157,210 $ —
Interest rates applied 1.35%~2.10% 1.52%~2.01% —
(9) Intangible Assets
As of December 31,
2016 2017
NT$ NT$
(In Thousands) (In Thousands)
Goodwill $ 15,188 $ 15,188
Software 470,456 410,712
Patents and technology license fees 2,390,968 2,102,561
Others 1,211,691 1,259,048
Net $ 4,088,303 $ 3,787,509
F-54

Cost:
Goodwill Software
Patents and
technology
license fees Others Total
NT$ NT$ NT$ NT$ NT$
(In Thousands) (In Thousands) (In Thousands) (In Thousands) (In Thousands)
As of January 1, 2016 $ 15,188 $ 652,898 $ 4,546,748 $ 3,421,557 $ 8,636,391
Additions — 1,365 283,439 1,287,844 1,572,648
Disposals — (85,437) — (1,279,755) (1,365,192)
Reclassifications — 345,810 — — 345,810
Exchange effect — (10,643) (295,847) (6) (306,496)
As of December 31, 2016 $ 15,188 $ 903,993 $ 4,534,340 $ 3,429,640 $ 8,883,161
Goodwill Software
Patents and
technology
license fees Others Total
NT$ NT$ NT$ NT$ NT$
(In Thousands) (In Thousands) (In Thousands) (In Thousands) (In Thousands)
As of January 1, 2017 $ 15,188 $ 903,993 $ 4,534,340 $ 3,429,640 $ 8,883,161
Additions — 3,566 38,928 1,145,110 1,187,604
Disposals — (95,505) — (1,009,051) (1,104,556)
Reclassifications — 278,650 — — 278,650
Exchange effect — (9,978) 114,483 6 104,511
As of December 31, 2017 $ 15,188 $ 1,080,726 $ 4,687,751 $ 3,565,705 $ 9,349,370
F-55

Accumulated Amortization and Impairment:
Goodwill Software
Patents and
technology
license fees Others Total
NT$ NT$ NT$ NT$ NT$
(In Thousands) (In Thousands) (In Thousands) (In Thousands) (In Thousands)
As of January 1, 2016 $ — $ 275,255 $ 1,675,440 $ 2,181,608 $ 4,132,303
Amortization — 245,345 480,913 1,316,102 2,042,360
Disposals — (85,437) — (1,279,755) (1,365,192)
Exchange effect — (1,626) (12,981) (6) (14,613)
As of December 31, 2016 $ — $ 433,537 $ 2,143,372 $ 2,217,949 $ 4,794,858
Goodwill Software
Patents and
technology
license fees Others Total
NT$ NT$ NT$ NT$ NT$
(In Thousands) (In Thousands) (In Thousands) (In Thousands) (In Thousands)
As of January 1, 2017 $ — $ 433,537 $ 2,143,372 $ 2,217,949 $ 4,794,858
Amortization — 337,376 483,940 1,097,754 1,919,070
Disposals — (95,505) — (1,009,051) (1,104,556)
Exchange effect — (5,394) (42,122) 5 (47,511)
As of December 31, 2017 $ — $ 670,014 $ 2,585,190 $ 2,306,657 $ 5,561,861
The amortization amounts of intangible assets are as follows:
For the years ended December 31,
2016 2017
NT$ NT$
(In Thousands) (In Thousands)
Operating costs $ 675,257 $ 799,215
Operating expenses $ 1,367,103 $ 1,119,855
(10) Short-Term Loans
As of December 31,
2016 2017
NT$ NT$
(In Thousands) (In Thousands)
Unsecured bank loans $ 20,550,801 $ 19,159,298
Unsecured other loans — 6,286,242
Total $ 20,550,801 $ 25,445,540
For the years ended December 31,
2015 2016 2017
Interest rates applied 0.61%~4.85% 0.51%~4.60% 0.00%~4.35%
The Company’s unused short-term lines of credit amounted to NT$47,145 million and NT$62,057 million as of
December 31, 2016 and 2017, respectively.
F-56

(11) Financial Liabilities at Fair Value through Profit or Loss, Current
As of December 31,
2016 2017
NT$ NT$
(In Thousands) (In Thousands)
Forward exchange contracts $ 60,855 $ —
(12) Bonds Payable
As of December 31,
2016 2017
NT$ NT$
(In Thousands) (In Thousands)
Unsecured domestic bonds payable $25,000,000 $ 31,200,000
Unsecured convertible bonds payable 18,196,332 18,196,332
Less: Discounts on bonds payable (1,215,401) (878,701)
Total 41,980,931 48,517,631
Less: Current portion (7,499,426) (24,841,770)
Net $34,481,505 $ 23,675,861
A. UMC issued domestic unsecured corporate bonds. The terms and conditions of the bonds were as follows:
Term Issuance date Issued amount Coupon rate Repayment
Five-year In early June 2012 NT$7,500 million 1.43% Interest will be paid annually and in
early June 2017. The principal has
been fully repaid.
Seven-year In early June 2012 NT$2,500 million 1.63% Interest will be paid annually and the
principal will be repayable in June
2019 upon maturity.
Five-year In mid-March 2013 NT$7,500 million 1.35% Interest will be paid annually and the
principal will be repayable in March
2018 upon maturity.
F-57

Seven-year In mid-March 2013 NT$2,500 million 1.50% Interest will be paid annually and the
principal will be repayable in March
2020 upon maturity.
Seven-year In mid-June 2014 NT$2,000 million 1.70% Interest will be paid annually and the
principal will be repayable in June
2021 upon maturity.
Ten-year In mid-June 2014 NT$3,000 million 1.95% Interest will be paid annually and the
principal will be repayable in June
2024 upon maturity.
Five-year In late March 2017 NT$6,200 million 1.15% Interest will be paid annually and the
principal will be repayable in March
2022 upon maturity.
Seven-year In late March 2017 NT$2,100 million 1.43% Interest will be paid annually and the
principal will be repayable in March
2024 upon maturity.
Five-year In early October 2017 NT$2,000 million 0.94% Interest will be paid annually and the
principal will be repayable in October
2022 upon maturity.
Seven-year In early October 2017 NT$3,400 million 1.13% Interest will be paid annually and the
principal will be repayable in October
2024 upon maturity.
B. On May 18, 2015, UMC issued SGX-ST listed currency linked zero coupon convertible bonds. The terms and
conditions of the bonds were as follows:
a. Issue Amount: US$600 million
b. Period: May 18, 2015 ~ May 18, 2020 (Maturity date)
c. Redemption:
i. UMC may redeem the bonds, in whole or in part, after 3 years of the issuance and prior to the maturity
date, at the principal amount of the bonds with an interest calculated at the rate of -0.25% per annum (the
Early Redemption Amount) if the closing price of the ordinary shares of UMC on the TWSE, for a period
of 20 out of 30 consecutive trading days, the last of which occurs not more than 5 days prior to the date
upon which notice of such redemption is published, is at least 125% of the conversion price. The Early
Redemption Price will be converted into NTD based on the Fixed Exchange Rate (NTD 30.708=USD
1.00), and this fixed NTD amount will be converted using the prevailing rate at the time of redemption for
payment in USD.
F-58

ii. UMC may redeem the bonds, in whole, but not in part, at the Early Redemption Amount if at least 90% in
principal amount of the bonds has already been converted, redeemed or repurchased and cancelled.
iii. UMC may redeem all, but not part, of the bonds, at the Early Redemption Amount at any time, in the event
of certain changes in the R.O.C.’s tax rules which would require UMC to gross up for payments of
principal, or to gross up for payments of interest or premium.
iv. All or any portion of the bonds will be redeemable at Early Redemption Amount at the option of
bondholders on May 18, 2018 at 99.25% of the principal amount.
v. Bondholders have the right to require UMC to redeem all of the bonds at the Early Redemption Amount if
UMC’s ordinary shares cease to be listed on the Taiwan Stock Exchange.
vi. In the event that a change of control as defined in the indenture of the bonds occurs to UMC, the
bondholders shall have the right to require UMC to redeem the bonds, in whole but not in part, at the Early
Redemption Amount.
d. Terms of Conversion:
i. Underlying Securities: Ordinary shares of UMC
ii. Conversion Period: The bonds are convertible at any time on or after June 28, 2015 and prior to May 8,
2020, into UMC ordinary shares; provided, however, that if the exercise date falls within 5 business days
from the beginning of, and during, any closed period, the right of the converting holder of the bonds to vote
with respect to the shares it receives will be subject to certain restrictions.
iii. Conversion Price and Adjustment: The conversion price was originally NT$17.50 per share. The
conversion price will be subject to adjustments upon the occurrence of certain events set out in the
indenture. The conversion price was NT$15.4320 per share on December 31, 2017.
e. Redemption on the Maturity Date: On the maturity date, UMC will redeem the bonds at 98.76% of the principal
amount unless, prior to such date:
i. UMC shall have redeemed the bonds at the option of UMC, or the bonds shall have been redeemed at
option of the bondholder;
ii. The bondholders shall have exercised the conversion right before maturity; or
iii. The bonds shall have been redeemed or repurchased by UMC and cancelled.
In accordance with IAS 32, the value of the conversion right of the convertible bonds was determined at issuance and
recognized in additional paid-in capital – stock options amounting to NT$1,894 million, after reduction of issuance
costs amounting to NT$9 million. The effective interest rate on the liability component of the convertible bonds was
determined to be 2.03%.
F-59

(13) Long-Term Loans
a. Details of long-term loans as of December 31, 2016 and 2017 are as follows:
As of December 31,
Lenders 2016 2017 Redemption
NT$ NT$
(In Thousands) (In Thousands)
Secured Long-Term Loan from Mega
International Commercial Bank (1)
$ 21,916 $ — Effective August 1, 2012 to August 1, 2017. Interest-
only payment for the first year. Principal is repaid in
17 quarterly payments with monthly interest
payments.
Secured Long-Term Loan from Mega
International Commercial Bank (2)
8,000 4,000 Effective November 21, 2013 to November 21, 2018.
Interest-only payment for the first year. Principal is
repaid in 17 quarterly payments with monthly interest
payments.
Secured Long-Term Loan from Mega
International Commercial Bank (3)
— 8,200 Effective July 3, 2017 to July 5, 2021. Interest-only
payment for the first year. Principal is repaid in 17
quarterly payments with monthly interest payments.
Secured Long-Term Loan from
Taiwan Cooperative Bank (1)
17,530 — Effective May 25, 2012 to May 25, 2017. Interest-only
payment for the first year. Principal is repaid in 17
quarterly payments with monthly interest payments.
Secured Long-Term Loan from
Taiwan Cooperative Bank (2)
39,324 16,853 Effective July 10, 2013 to July 10, 2018. Interest-only
payment for the first year. Principal is repaid in 17
quarterly payments with monthly interest payments.
Secured Long-Term Loan from
Taiwan Cooperative Bank (3)
14,843 10,276 Effective February 13, 2015 to February 13, 2020.
Interest-only payment for the first year. Principal is
repaid in 17 quarterly payments with monthly interest
payments.
F-60

As of December 31,
Lenders 2016 2017 Redemption
NT$ NT$
(In Thousands) (In Thousands)
Secured Long-Term Loan from Taiwan
Cooperative Bank (4)
18,735 13,382 Effective April 28, 2015 to April 28, 2020. Interest-only
payment for the first year. Principal is repaid in 17
quarterly payments with monthly interest payments.
Secured Long-Term Loan from Taiwan
Cooperative Bank (5)
6,441 4,724 Effective August 10, 2015 to August 10, 2020. Interest-
only payment for the first year. Principal is repaid in 17
quarterly payments with monthly interest payments.
Secured Long-Term Loan from Taiwan
Cooperative Bank (6)
107,027 95,135 Effective October 19, 2015 to October 19, 2025. Interest-
only payment for the first year. Principal is repaid in 37
quarterly payments with monthly interest payments.
Secured Long-Term Loan from Taiwan
Cooperative Bank (7)
2,067 1,476 Effective October 28, 2015 to April 28, 2020. Interest-only
payment for the first half year. Principal is repaid in 17
quarterly payments with monthly interest payments.
Secured Long-Term Loan from Taiwan
Cooperative Bank (8)
5,553 4,165 Effective November 20, 2015 to November 20, 2020.
Interest-only payment for the first year. Principal is
repaid in 17 quarterly payments with monthly interest
payments.
Unsecured Long-Term Loan from Bank
of Taiwan (1)
1,125,000 — Repayable quarterly from October 31, 2015 to July 31,
2017 with monthly interest payments.
Unsecured Long-Term Loan from Bank
of Taiwan (2)
— 300,000 Repayable quarterly from March 23, 2019 to
December 23, 2021 with monthly interest payments.
Unsecured Syndicated Loans from Bank
of Taiwan and 7 others
1,385,000 1,246,500 Repayable semi-annually from February 6, 2017 to
February 6, 2020 with monthly interest payments.
Unsecured Long-Term Loan from Mega
International Commercial Bank
948,712 474,356 Repayable quarterly from October 4, 2015 to October 4,
2018 with monthly interest payments.
Unsecured Long-Term Loan from E. Sun
Bank
222,222 — Repayable quarterly from December 24, 2015 to
December 24, 2017 with monthly interest payments.
Unsecured Long-Term Loan from Taiwan
Cooperative Bank
950,000 — Repayable quarterly from March 24, 2016 to
December 24, 2017 with monthly interest payments.
F-61

As of December 31,Lenders 2016 2017 Redemption
NT$ NT$(In Thousands) (In Thousands)
Unsecured Revolving Loan from CTBC Bank (Note A)
1,000,000 — Settlement due on January 25, 2021 with monthly interest payments.
Unsecured Revolving Loan from KGI Bank (Note B)
1,000,000 — Settlement due on December 25, 2019 with monthly interest payments.
Secured Syndicated Loans from China Development Bank and 6 others
22,381,561 29,989,811 Effective October 20, 2016 to October 20, 2024. Interest-only payment for the first and the second year. Principal is repaid in 13 semi-annual payments with semi-annual interest payments.
Subtotal 29,253,931 32,168,878Less: Administrative expenses from
syndicated loans(5,241) (3,542)
Less: Current portion (3,001,503) (2,522,052) Total $26,247,187 $29,643,284
For the years ended December 31,2015 2016 2017
Interest Rates 1.10%~2.95% 0.98%~4.66% 0.99%~4.66%
Note A: UMC entered into a 5-year loan agreement with CTBC Bank, effective from January 25, 2016. The agreement offered UMC a revolving line of credit of NT$2.5 billion starting from the first use of the loan to the expiration date of the agreement, January 25, 2021. As of December 31, 2016 and 2017, the unused line of credit were NT$1.5 billion and NT$2.5 billion, respectively.
Note B: UMC entered into a 5-year loan agreement with KGI Bank, effective from September 25, 2014. The agreement offered UMC a revolving line of credit of NT$2 billion. This line of credit will be reduced starting from the end of the second year after the first use and every twelve months thereafter, with a total of four adjustments. The expiration date of the agreement is December 25, 2019. As of December 31, 2016 and 2017, the unused line of credit were NT$0.5 billion and NT$1 billion, respectively.
b. Please refer to Note 8 for property, plant and equipment pledged as collateral for long- term loans.
F-62

c. In 2014, UMC resolved to provide endorsement for NEXPOWER’s syndicated loan from banks including Bank of
Taiwan for the amount up to NT$1,700 million. As of December 31, 2016 and 2017, the actual amount provided were
NT$1,385 million and NT$1,247 million, respectively.
d. In 2016, HEJIAN resolved to provide endorsement for USC’s syndicated loan from banks including China
Development Bank. The maximum balance for the years ended December 31, 2016 and 2017 were NT$9,471 million
and NT$8,744 million. As of December 31, 2016 and 2017, the actual amount provided were NT$6,629 million and
NT$6,063 million, respectively.
e. In 2017, UMC resolved to provide endorsement for USC’s syndicated loan from banks including China Development
Bank for the amount up to US$310 million. As of December 31, 2017, the actual amount provided was
NT$9,093 million.
(14) Post-Employment Benefits
a. Defined contribution plan
The employee pension plan under the Labor Pension Act of the R.O.C. (the Act) is a defined contribution plan.
Pursuant to the plan, UMC and its domestic subsidiaries make monthly contributions of 6% based on each individual
employee’s salary or wage to employees’ pension accounts. Pension benefits for employees of the Singapore branch
and subsidiaries overseas were provided in accordance with the local regulations. A total of NT$1,151 million,
NT$1,220 million and NT$1,256 million were contributed by the Company for the years ended December 31, 2015,
2016 and 2017, respectively.
b. Defined benefit plan
The employee pension plan mandated by the Labor Standards Act of the R.O.C. is a defined benefit plan. The pension
benefits are disbursed based on the units of service years and average monthly salary prior to retirement according to
the Labor Standards Act. Two units per year are awarded for the first 15 years of services while one unit per year is
awarded after the completion of the 15th year and the total units will not exceed 45 units. The Company contributes
an amount equivalent to 2% of the employees’ total salaries and wages on a monthly basis to the pension fund
deposited with the Bank of Taiwan under the name of a pension fund supervisory committee. The pension fund is
managed by the government’s designated authorities and therefore is not included in the Company’s consolidated
financial statements. For the years ended December 31, 2015, 2016 and 2017, total pension expenses of
NT$111 million, NT$94 million and NT$80 million, respectively, were recognized by the Company.
F-63

i. Movements in present value of defined benefit obligation during the year:
For the years ended December 31,
2016 2017
NT$ NT$
(In Thousands) (In Thousands)
Defined benefit obligation at beginning of year $(5,386,355) $(5,482,265)
Items recognized as profit or loss:
Service cost (27,368) (24,130)
Interest cost (91,568) (76,761)
Subtotal (118,936) (100,891)
Remeasurements recognized in other comprehensive income (loss):
Arising from changes in demographic assumptions (105,542) —
Arising from changes in financial assumptions (42,256) (183,433)
Experience adjustments 85,962 13,233
Subtotal (61,836) (170,200)
Benefits paid 84,862 81,204
Other — 1,094
Defined benefit obligation at end of year $(5,482,265) $(5,671,058)
ii. Movements in fair value of plan assets during the year:
For the years ended December 31,
2016 2017
NT$ NT$
(In Thousands) (In Thousands)
Beginning balance of fair value of plan assets $ 1,495,554 $ 1,513,371
Items recognized as profit or loss:
Interest income on plan assets 25,424 21,187
Contribution by employer 91,312 93,466
Payment of benefit obligation (84,862) (81,204)
Remeasurements recognized in other comprehensive income (loss):
Return on plan assets, excluding amounts included in interest
income
(14,057) (13,986)
Other — (295)
Fair value of plan assets at end of year $ 1,513,371 $ 1,532,539
The actual returns on plan assets of the Company for the years ended December 31, 2016 and 2017 were
NT$11 million and NT$7 million, respectively.
F-64

iii. The defined benefit plan recognized on the consolidated balance sheets are as follows:
As of December 31,
2016 2017
NT$ NT$
(In Thousands) (In Thousands)
Present value of the defined benefit obligation $ (5,482,265) $ (5,671,058)
Fair value of plan assets 1,513,371 1,532,539
Funded status (3,968,894) (4,138,519)
Net defined benefit liabilities, noncurrent recognized on the
consolidated balance sheets $ (3,968,894) $ (4,138,519)
iv. The major categories of plan assets as a percentage of the fair value of the total plan assets are as follows:
As of December 31,
2016 2017
Cash 21% 25%
Equity instruments 45% 43%
Debt instruments 27% 26%
Others 7% 6%
Employee pension fund is deposited under a trust administered by the Bank of Taiwan. The overall expected rate of
return on assets is determined based on historical trend and actuaries’ expectations on the assets’ returns in the market
over the obligation period. Furthermore, the utilization of the fund is determined by the labor pension fund
supervisory committee, which also guarantees the minimum earnings to be no less than the earnings attainable from
interest rates offered by local banks for two-year time deposits.
F-65

v. The principal underlying actuarial assumptions are as follows:
As of December 31,
2016 2017
Discount rate 1.40% 1.08%
Rate of future salary increase 3.50% 3.50%
vi. Expected future benefit payments are as follows:
Year As of December 31, 2017
NT$
(In Thousands)
2018 $ 173,640
2019 173,346
2020 207,262
2021 253,376
2022 308,549
2023 and thereafter 5,238,631
Total $ 6,354,804
The Company expects to make pension fund contribution of NT$94 million in 2018. The weighted-average durations
of the defined benefit obligation are 12 years and 11 years as of December 31, 2016 and 2017, respectively.
F-66

vii. Sensitivity analysis:
As of December 31, 2016
Discount rate Rate of future salary increase
0.5% increase 0.5% decrease 0.5% increase 0.5% decrease
NT$ NT$ NT$ NT$
(In Thousands) (In Thousands) (In Thousands) (In Thousands)
Decrease (increase) in defined benefit obligation $ 290,068 $ (311,920) $ (276,029) $ 260,500
As of December 31, 2017
Discount rate Rate of future salary increase
0.5% increase 0.5% decrease 0.5% increase 0.5% decrease
NT$ NT$ NT$ NT$
(In Thousands) (In Thousands) (In Thousands) (In Thousands)
Decrease (increase) in defined benefit obligation $ 283,095 $ (303,570) $ (266,069) $ 251,815
The sensitivity analyses above have been determined based on a method that extrapolates the impact on the net
defined benefit obligation as a result of reasonable changes in key assumptions occurring at the end of the reporting
period.
(15) Deferred Government Grants
As of December 31,
2016 2017
NT$ NT$
(In Thousands) (In Thousands)
Beginning balance $ 295,133 $ 9,297,371
Arising during the period 9,566,327 6,755,920
Recorded in profit or loss:
Other operating income (118,757) (1,469,616)
Exchange effect (445,332) 11,871
Ending balance $ 9,297,371 $14,595,546
Current $ 888,921 $ 2,821,467
Noncurrent 8,408,450 11,774,079
Total $ 9,297,371 $14,595,546
The significant government grants related to equipment acquisitions received by the Company are amortized as income over
the useful lives of related equipment, and recorded in the net other operating income and expenses.
F-67

(16) Equity
a. Capital stock:
i. UMC had 26,000 million common shares authorized to be issued as of December 31, 2016 and 2017, of which
12,624 million shares were issued as of December 31, 2016 and 2017, each at a par value of NT$10.
ii. UMC had 151 million and 144 million ADSs, which were traded on the NYSE as of December 31, 2016 and
2017, respectively. The total number of common shares of UMC represented by all issued ADSs were
754 million shares and 721 million shares as of December 31, 2016 and 2017, respectively. One ADS represents
five common shares.
iii. On June 15, 2016, UMC cancelled 134 million shares of treasury stock, which were repurchased during the
periods from March 15 to May 6, 2013, for the purpose of transferring to employees.
b. Treasury stock:
i. UMC carried out treasury stock program and repurchased its shares from the centralized securities exchange
market. The purpose for repurchase, and changes in treasury stock during the years ended December 31, 2016
and 2017 are as follows:
For the year ended December 31, 2016
(In thousands of shares)
Purpose
As of
January 1, 2016 Increase Decrease
As of
December 31, 2016
For transfer to employees 333,814 200,000 133,814 400,000
F-68
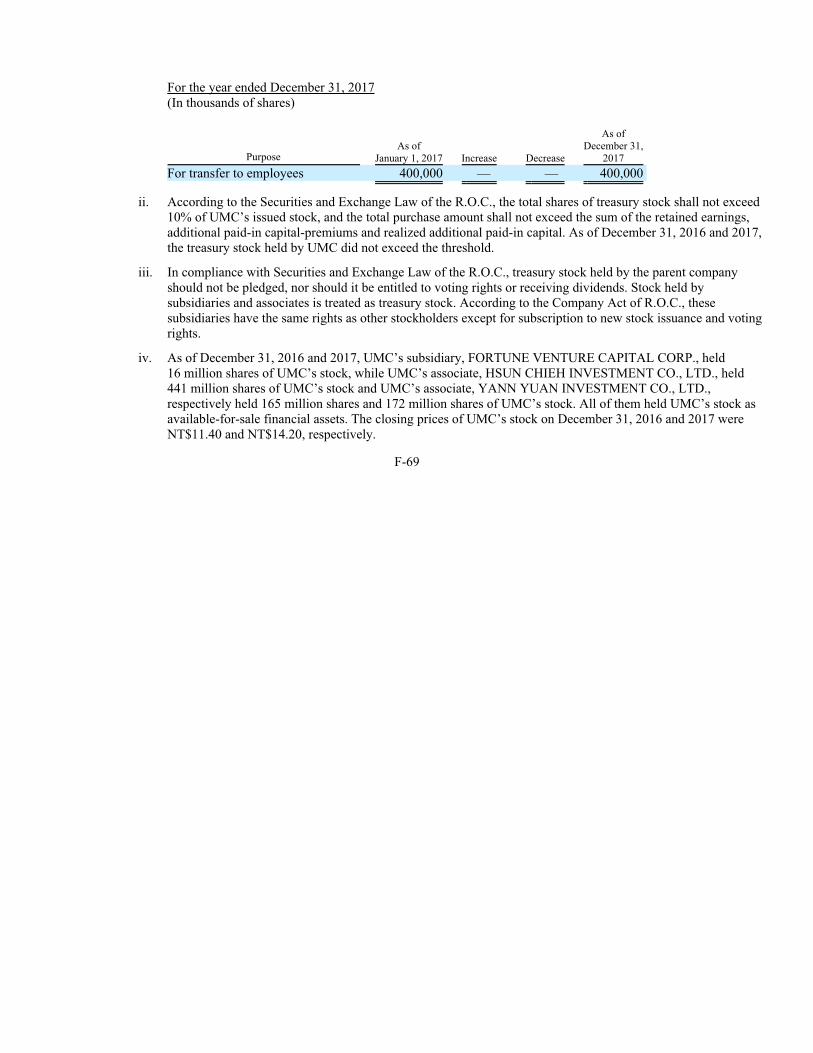
For the year ended December 31, 2017
(In thousands of shares)
Purpose
As of
January 1, 2017 Increase Decrease
As of
December 31,
2017
For transfer to employees 400,000 — — 400,000
ii. According to the Securities and Exchange Law of the R.O.C., the total shares of treasury stock shall not exceed
10% of UMC’s issued stock, and the total purchase amount shall not exceed the sum of the retained earnings,
additional paid-in capital-premiums and realized additional paid-in capital. As of December 31, 2016 and 2017,
the treasury stock held by UMC did not exceed the threshold.
iii. In compliance with Securities and Exchange Law of the R.O.C., treasury stock held by the parent company
should not be pledged, nor should it be entitled to voting rights or receiving dividends. Stock held by
subsidiaries and associates is treated as treasury stock. According to the Company Act of R.O.C., these
subsidiaries have the same rights as other stockholders except for subscription to new stock issuance and voting
rights.
iv. As of December 31, 2016 and 2017, UMC’s subsidiary, FORTUNE VENTURE CAPITAL CORP., held
16 million shares of UMC’s stock, while UMC’s associate, HSUN CHIEH INVESTMENT CO., LTD., held
441 million shares of UMC’s stock and UMC’s associate, YANN YUAN INVESTMENT CO., LTD.,
respectively held 165 million shares and 172 million shares of UMC’s stock. All of them held UMC’s stock as
available-for-sale financial assets. The closing prices of UMC’s stock on December 31, 2016 and 2017 were
NT$11.40 and NT$14.20, respectively.
F-69

c. Retained earnings and dividend policies:
According to UMC’s amended Articles of Incorporation, current year’s earnings, if any, shall be distributed in the
following order:
i. Payment of taxes.
ii. Making up loss for preceding years.
iii. Setting aside 10% for legal reserve, except for when accumulated legal reserve has reached UMC’s paid-in
capital.
iv. Appropriating or reversing special reserve by government officials or other regulations.
v. The remaining, plus the previous year’s unappropriated earnings, shall be distributed according to the
distribution plan proposed by the Board of Directors according to the dividend policy and submitted to the
stockholders’ meeting for approval.
Because UMC conducts business in a capital intensive industry and continues to operate in its growth phase, the
dividend policy of UMC shall be determined pursuant to factors such as the investment environment, its funding
requirements, domestic and overseas competitive landscape and its capital expenditure forecast, as well as
stockholders’ interest, balancing dividends and UMC’s long-term financial planning. The Board of Directors shall
propose the distribution plan and submit it to the stockholders’ meeting every year. The distribution of stockholders’
dividend shall be allocated as cash dividend in the range of 20% to 100%, and stock dividend in the range of 0% to
80%.
According to the regulations of Taiwan Financial Supervisory Commission (FSC), UMC is required to appropriate a
special reserve in the amount equal to the sum of debit elements under equity, such as unrealized loss on financial
instruments and debit balance of exchange differences on translation of foreign operations, at every year-end. Such
special reserve is prohibited from distribution. However, if any of the debit elements is reversed, the special reserve in
the amount equal to the reversal may be released for earnings distribution or offsetting accumulated deficits.
The distribution of earnings for 2016 was approved by the stockholders’ meeting held on June 8, 2017, while the
distribution of earnings for 2017 was approved by the Board of Directors’ meeting on March 7, 2018. The details of
distribution are as follows:
Appropriation of earnings
(in thousand NT dollars)
Cash dividend per share
(NT dollars)
2016 2017 2016 2017
Legal reserve $ 831,566 $ 962,873
Cash dividends 6,112,159 8,557,023 $ 0.50 $ 0.70
F-70

The aforementioned 2016 distribution approved by stockholders’ meeting was consistent with the resolutions of
meeting of Board of Directors held on February 22, 2017.
The appropriation of 2017 unappropriated retained earnings has not yet been approved by the stockholder’s meeting
as of the reporting date. Information relevant to the Board of Directors’ recommendations and stockholders’ approval
can be obtained from the “Market Observation Post System” on the website of the TWSE.
Please refer to Note 6(19) for information on the employees’ compensation and remuneration to directors.
d. Non-controlling interests:
For the years ended December 31,
2015 2016 2017
NT$ NT$ NT$
(In Thousands) (In Thousands) (In Thousands)
Beginning balance $ 3,849,798 $ 2,027,065 $ 2,161,729
Attributable to non-controlling interests:
Net loss (612,973) (4,452,585) (2,997,469)
Other comprehensive income (loss) (62,114) (32,318) (111,601)
Changes in subsidiaries’ ownership (1,047,246) 567,073 (999,151)
Effect of deconsolidation of subsidiaries (100,400) — —
Derecognition of the non-controlling interests — 4,052,494 2,903,300
Ending balance $ 2,027,065 $ 2,161,729 $ 956,808
(17) Employee Stock Options
On May 12, 2009, the Company was authorized by the Securities and Futures Bureau of FSC, to issue employee stock
options with a total number of 500 million units each. Each unit entitled an optionee to subscribe to 1 share of the
Company’s common stock. Settlement upon the exercise of the options would be made through the issuance of new shares
by the Company. The exercise prices of the options were set at the closing prices of the Company’s common stock on the
dates of grant. The contractual lives were 6 years and an optionee might exercise the options in accordance with certain
schedules as prescribed by the plans after 2 years from the dates of grant. All employee stock options expired on June 18,
2015.
F-71

A summary of the Company’s stock option plan and related information for the year ended December 31, 2015 is as follows:
For the year ended December 31, 2015
Options
(in thousands)
Shares available to
option holders
(in thousands)
Weighted - average
exercise price per share
(NTD)
Outstanding at beginning of period 48,729 48,729 $ 10.40
Exercised (27,828) (27,828) $ 10.40
Forfeited (469) (469) $ 10.40
Expired (20,432) (20,432) $ 10.40
Outstanding at end of period — — $ 10.40
Exercisable at end of period — — $ 10.40
The weighted-average share price at the date of exercise of employee stock options for the year ended December 31, 2015
was NT$14.95. The compensation expenses for the year ended December 31, 2015 was NT$1 million.
(18) Operating Revenues
For the years ended
December 31,
2015 2016 2017
NT$ NT$ NT$
(In Thousands) (In Thousands) (In Thousands)
Net sales
Sale of goods $140,640,738 $142,816,919 $142,957,544
Other operating revenues
Royalty 18,616 11,757 6,817
Mask tooling 3,424,335 3,676,365 3,334,844
Others 746,732 1,365,083 2,985,501
Net operating revenues $144,830,421 $147,870,124 $149,284,706
F-72

(1
9)
Op
erating C
osts a
nd
Ex
penses
The C
om
pany
’s e
mp
loy
ee b
enefit, d
epreciatio
n a
nd
am
ortization e
xpenses a
re s
um
marized a
s f
ollow
s:
For t
he y
ears e
nded D
ecem
ber 3
1,
201
520
16
20
17
Operatin
g
co
sts
Op
erating
ex
pen
ses
To
tal
Operating
co
sts
Operatin
g
ex
pen
ses
To
tal
Op
eratin
g
co
sts
Operating
ex
penses
Total
NT
$N
T$
NT
$
(In T
hou
san
ds)
(In
Tho
usand
s)
(In
Th
ousan
ds)
Em
ployee b
en
efit e
xpenses
Salaries
$14,7
56,4
93
$6,1
41
,982
$2
0,8
98
,475
$1
4,8
39
,388
$6
,781,8
77
$21
,621,2
65
$16
,676,5
60
$7,0
45,4
87
$23,7
22,0
47
Labor a
nd h
ealth i
nsurance
82
0,0
37
340
,102
1,1
60
,139
802
,913
351,8
73
1,1
54,7
86
878,5
76
37
6,5
23
1,2
55,0
99
Pen
sion
94
3,2
97
319
,414
1,2
62
,711
965
,494
347,8
71
1,3
13,3
65
1,0
08,1
21
32
7,4
54
1,3
35,5
75
Oth
er e
mploy
ee b
enefit
ex
penses
22
9,4
91
101
,950
331
,441
231
,270
90,4
02
321,6
72
259,7
01
11
8,4
22
37
8,1
23
Depreciatio
n41,0
22,0
28
2,3
81
,481
43
,403
,509
46,8
05
,589
2,7
90,1
38
49
,595,7
27
47
,820,8
12
3,0
03,8
55
50,8
24,6
67
Am
ortizatio
n65
4,7
11
1,3
44
,390
1,9
99
,101
790
,206
1,5
02,3
60
2,2
92,5
66
911,5
63
1,2
22,1
63
2,1
33,7
26
In
co
nsid
eration o
f t
he r
ev
ision
of t
he C
om
pany A
ct i
n M
ay 2
015, t
he s
tock
holders’ m
eeting r
eso
lved
the a
men
dm
ent o
f U
MC
’s A
rticles o
f
In
corporatio
n o
n J
un
e 7
, 20
16. A
ccording t
o t
he a
mend
men
t o
f U
MC
’s A
rticles o
f I
nco
rp
oration
, th
e e
mployees’ c
om
pensatio
n a
nd d
irectors’
rem
un
eration s
hall b
e d
istribu
ted i
n t
he f
ollow
ing
ord
er:
UM
C s
hall a
llocate n
o l
ess t
han 5
% o
f p
ro
fit a
s e
mp
loy
ees’ c
om
pensation a
nd
no m
ore t
han 0
.1%
of p
rofit a
s d
irectors’ c
om
pensation f
or e
ach
profitab
le f
iscal y
ear a
fter o
ffsettin
g a
ny
cu
mu
lativ
e l
osses. T
he a
forem
entio
ned e
mplo
yees’ c
om
pen
sation
will b
e d
istribu
ted i
n s
hares o
r c
ash. T
he
em
plo
yees o
f U
MC
’s s
ubsidiaries w
ho f
ulfill s
pecific r
eq
uirem
en
ts s
tipu
lated b
y t
he B
oard o
f D
irectors m
ay b
e g
ranted s
uch
co
mpensatio
n. D
irectors
may o
nly r
eceiv
e c
om
pensatio
n i
n c
ash. U
MC
may
, by
a r
eso
lution
ad
opted b
y a
majority v
ote a
t a
meetin
g o
f t
he B
oard o
f D
irectors a
tten
ded b
y
tw
o-thirds o
f t
he t
otal n
um
ber o
f d
irecto
rs, d
istribute t
he a
fo
rem
entioned
em
ployees’ a
nd
director’s c
om
pensation a
nd
repo
rt t
o t
he s
tock
holders’
meeting
for s
uch d
istrib
utio
n.
F-73
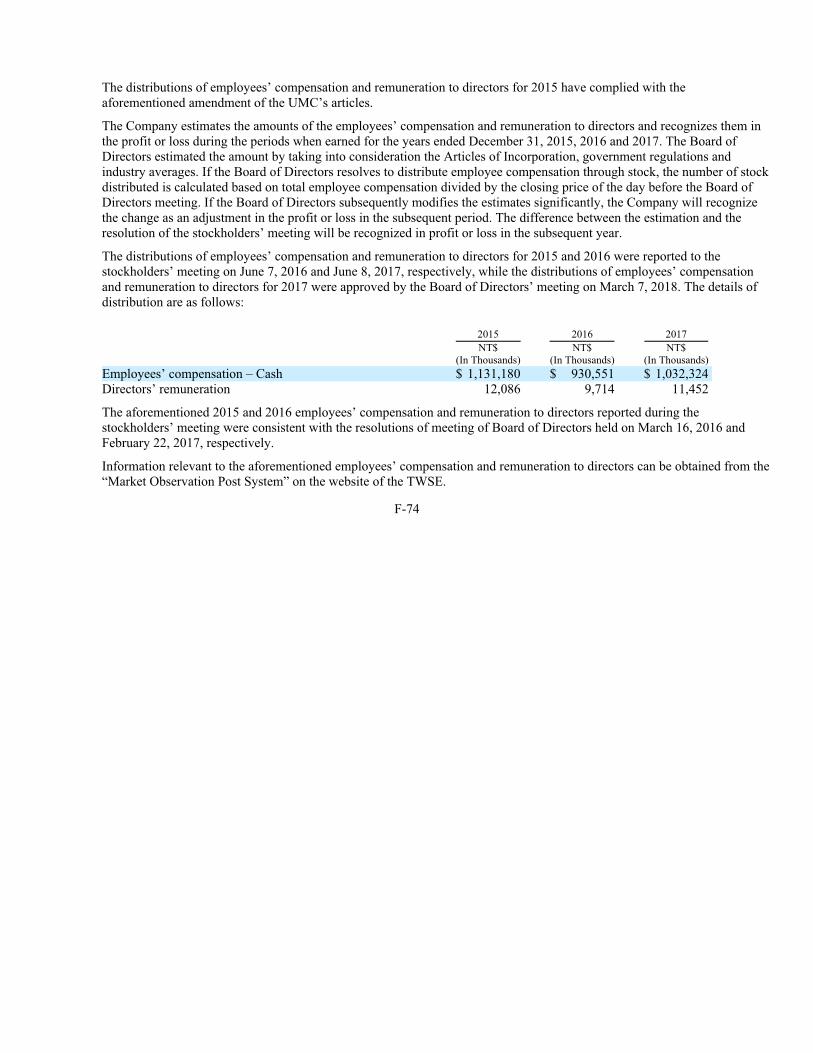
The distributions of employees’ compensation and remuneration to directors for 2015 have complied with the
aforementioned amendment of the UMC’s articles.
The Company estimates the amounts of the employees’ compensation and remuneration to directors and recognizes them in
the profit or loss during the periods when earned for the years ended December 31, 2015, 2016 and 2017. The Board of
Directors estimated the amount by taking into consideration the Articles of Incorporation, government regulations and
industry averages. If the Board of Directors resolves to distribute employee compensation through stock, the number of stock
distributed is calculated based on total employee compensation divided by the closing price of the day before the Board of
Directors meeting. If the Board of Directors subsequently modifies the estimates significantly, the Company will recognize
the change as an adjustment in the profit or loss in the subsequent period. The difference between the estimation and the
resolution of the stockholders’ meeting will be recognized in profit or loss in the subsequent year.
The distributions of employees’ compensation and remuneration to directors for 2015 and 2016 were reported to the
stockholders’ meeting on June 7, 2016 and June 8, 2017, respectively, while the distributions of employees’ compensation
and remuneration to directors for 2017 were approved by the Board of Directors’ meeting on March 7, 2018. The details of
distribution are as follows:
2015 2016 2017
NT$ NT$ NT$
(In Thousands) (In Thousands) (In Thousands)
Employees’ compensation – Cash $ 1,131,180 $ 930,551 $ 1,032,324
Directors’ remuneration 12,086 9,714 11,452
The aforementioned 2015 and 2016 employees’ compensation and remuneration to directors reported during the
stockholders’ meeting were consistent with the resolutions of meeting of Board of Directors held on March 16, 2016 and
February 22, 2017, respectively.
Information relevant to the aforementioned employees’ compensation and remuneration to directors can be obtained from the
“Market Observation Post System” on the website of the TWSE.
F-74
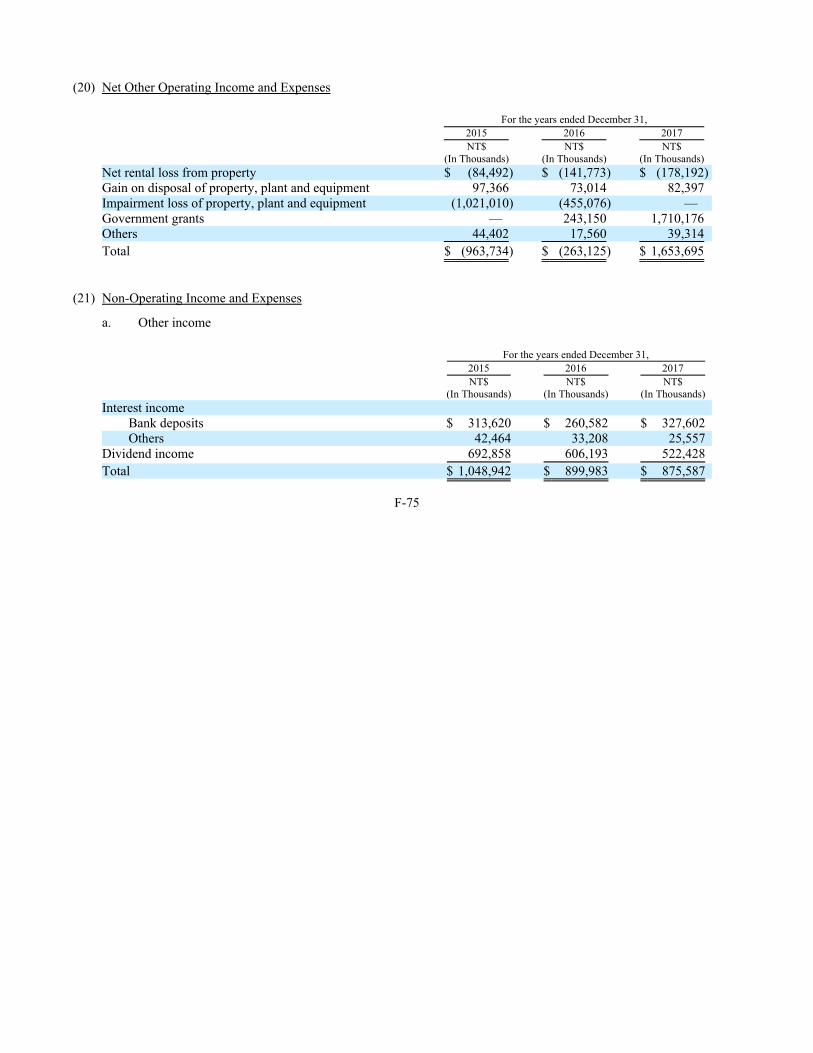
(20) Net Other Operating Income and Expenses
For the years ended December 31,
2015 2016 2017
NT$ NT$ NT$
(In Thousands) (In Thousands) (In Thousands)
Net rental loss from property $ (84,492) $ (141,773) $ (178,192)
Gain on disposal of property, plant and equipment 97,366 73,014 82,397
Impairment loss of property, plant and equipment (1,021,010) (455,076) —
Government grants — 243,150 1,710,176
Others 44,402 17,560 39,314
Total $ (963,734) $ (263,125) $ 1,653,695
(21) Non-Operating Income and Expenses
a. Other income
For the years ended December 31,
2015 2016 2017
NT$ NT$ NT$
(In Thousands) (In Thousands) (In Thousands)
Interest income
Bank deposits $ 313,620 $ 260,582 $ 327,602
Others 42,464 33,208 25,557
Dividend income 692,858 606,193 522,428
Total $ 1,048,942 $ 899,983 $ 875,587
F-75

b. Other gains and losses
For the years ended December 31,
2015 2016 2017
NT$ NT$ NT$
(In Thousands) (In Thousands) (In Thousands)
Gain on valuation of financial assets and liabilities at fair
value through profit or loss:
Designated financial assets at fair value through profit
or loss
$ 8,462 $ — $ —
Financial assets held for trading — 60,821 198,974
Forward exchange contract — 93,781 379,650
Option — — 31,605
Loss on valuation of financial assets and liabilities at fair
value through profit or loss:
Designated financial assets at fair value through profit
or loss
— (3,832) (11,959)
Financial assets held for trading (21,020) — —
Forward exchange contract (81,895) — —
Impairment loss:
Investments accounted for under the equity method — (837,153) —
Available-for-sale financial assets, noncurrent (1,238,932) (492,140) (664,948)
Financial assets measured at cost, noncurrent (6,559) (293,205) (285,387)
Gain on disposal of investments 2,517,137 2,097,818 1,269,369
Others 756,666 233,310 76,788
Total $ 1,933,859 $ 859,400 $ 994,092
F-76

c. Finance costs
For the years ended December 31,
2015 2016 2017
NT$ NT$ NT$
(In Thousands) (In Thousands) (In Thousands)
Interest expenses
Bonds payable $ 290,132 $ 595,311 $ 763,124
Bank loans 180,068 654,181 1,563,590
Others 110 91 80,158
Financial expenses 53,555 164,720 88,290
Total $ 523,865 $ 1,414,303 $ 2,495,162
(22) Components of Other Comprehensive Income (Loss)
For the year ended December 31, 2015
Arising during
the period
Reclassification
adjustments
during the
period
Other
comprehensive
income (loss),
before tax
Income tax
effect
Other
comprehensive
income (loss),
net of tax
NT$ NT$ NT$ NT$ NT$
(In Thousands) (In Thousands) (In Thousands) (In Thousands) (In Thousands)
Items that will not be reclassified subsequently to profit or loss:
Remeasurements of defined benefit pension plans $ (40,200) $ — $ (40,200) $ 6,809 $ (33,391)
Share of remeasurements of defined benefit plans of
associates and joint ventures
(1,831) — (1,831) — (1,831)
Items that may be reclassified subsequently to profit or loss:
Exchange differences on translation of foreign
operations
2,784,800 — 2,784,800 (21,026) 2,763,774
Unrealized gain (loss) on available-for-sale financial
assets
(2,843,916) (916,291) (3,760,207) 281,203 (3,479,004)
Share of other comprehensive income (loss) of
associates and joint ventures which may be
reclassified subsequently to profit or loss
(276,994) 677 (276,317) (37,850) (314,167)
Total other comprehensive income (loss) $ (378,141) $ (915,614) $(1,293,755) $ 229,136 $(1,064,619)
F-77

For the year ended December 31, 2016
Arising during
the period
Reclassification
adjustments
during the
period
Other
comprehensive
income (loss),
before tax
Income tax
effect
Other
comprehensive
income (loss),
net of tax
NT$ NT$ NT$ NT$ NT$
(In Thousands) (In Thousands) (In Thousands) (In Thousands) (In Thousands)
Items that will not be reclassified subsequently to profit or loss:
Remeasurements of defined benefit pension plans $ (75,893) $ — $ (75,893) $ 12,899 $ (62,994)
Share of remeasurements of defined benefit plans of
associates and joint ventures
2,459 — 2,459 — 2,459
Items that may be reclassified subsequently to profit or loss:
Exchange differences on translation of foreign
operations
(1,815,947) — (1,815,947) (620) (1,816,567)
Unrealized gain (loss) on available-for-sale financial
assets
(287,866) (1,681,770) (1,969,636) 95,705 (1,873,931)
Share of other comprehensive income (loss) of
associates and joint ventures which may be
reclassified subsequently to profit or loss
(331,615) — (331,615) 58,577 (273,038)
Total other comprehensive income (loss) $(2,508,862) $ (1,681,770) $(4,190,632) $ 166,561 $(4,024,071)
For the year ended December 31, 2017
Arising during
the period
Reclassification
adjustments
during the
period
Other
comprehensive
income (loss),
before tax
Income tax
effect
Other
comprehensive
income (loss),
net of tax
NT$ NT$ NT$ NT$ NT$
(In Thousands) (In Thousands) (In Thousands) (In Thousands) (In Thousands)
Items that will not be reclassified subsequently to profit or loss:
Remeasurements of defined benefit pension plans $ (184,186) $ — $ (184,186) $ 31,311 $ (152,875)
Share of remeasurements of defined benefit plans of
associates and joint ventures
1,221 — 1,221 — 1,221
Items that may be reclassified subsequently to profit or loss:
Exchange differences on translation of foreign
operations
(5,975,203) — (5,975,203) 59,838 (5,915,365)
Unrealized gain (loss) on available-for-sale financial
assets
1,224,344 (642,905) 581,439 100,059 681,498
Share of other comprehensive income (loss) of
associates and joint ventures which may be
reclassified subsequently to profit or loss
604,675 102,302 706,977 (135,989) 570,988
Total other comprehensive income (loss) $(4,329,149) $ (540,603) $(4,869,752) $ 55,219 $(4,814,533)
F-78

(23) Income Tax
a. The major components of income tax expense for the years ended December 31, 2015, 2016 and 2017 were as
follows:
i. Income tax expense recorded in profit or loss
For the years ended December 31,
2015 2016 2017
NT$ NT$ NT$
(In Thousands) (In Thousands) (In Thousands)
Current income tax expense (benefit):
Current income tax charge $ 2,081,552 $ 3,502,195 $ 2,467,004
Adjustments in respect of current income tax of prior
periods
(154,769) (424,939) (364,951)
Deferred income tax expense (benefit):
Deferred income tax related to origination and reversal
of temporary differences
(1,431,680) (2,770,767) (1,033,142)
Deferred income tax related to recognition and
derecognition of tax losses and unused tax credits
654,065 (54,519) (2,016,726)
Deferred income tax related to changes in tax rates — — 12,477
Adjustment of prior year’s deferred income tax (1,690) 53,322 9,233
Deferred income tax arising from write-down or
reversal of write-down of deferred tax assets
(119,978) 247,232 1,918,586
Income tax expense recorded in profit or loss $ 1,027,500 $ 552,524 $ 992,481
ii. Income tax related to components of other comprehensive income (loss)
Items that will not be reclassified:
For the years ended December 31,
2015 2016 2017
NT$
(In Thousands)
NT$
(In Thousands)
NT$
(In Thousands)
Remeasurements of defined benefit pension plans $ 6,809 $ 12,899 $ 31,311
F-79

Items that may be reclassified subsequently to profit or loss:
For the years ended December 31,
2015 2016 2017
NT$ NT$ NT$
(In Thousands) (In Thousands) (In Thousands)
Exchange differences on translation of foreign
operations
$ (21,026) $ (620) $ 59,838
Unrealized loss (gain) on available-for-sale financial
assets
281,203 95,705 100,059
Share of other comprehensive income (loss) of
associates and joint ventures which may be
reclassified subsequently to profit or loss
(37,850) 58,577 (135,989)
Income tax related to items that may be reclassified
subsequently to profit or loss $ 222,327 $ 153,662 $ 23,908
iii. Deferred income tax recognized directly to equity
For the years ended December 31,
2015 2016 2017
NT$ NT$ NT$
(In Thousands) (In Thousands) (In Thousands)
Temporary differences arising from the initial
recognition of the equity component separately from
the liability component
$ (322,001) $ — $ —
Adjustments of changes in net assets of associates and
joint ventures accounted for using equity method
1,040 1,608 227
Income tax recognized directly to equity $ (320,961) $ 1,608 $ 227
F-80

b. A reconciliation between income tax expense and income before tax at UMC’s applicable tax rate was as follows:
For the years ended December 31,
2015 2016 2017
NT$ NT$ NT$
(In Thousands) (In Thousands) (In Thousands)
Income before tax $13,668,598 $ 4,721,086 $ 7,671,710
At UMC’s statutory income tax rate of 17% 2,323,662 802,584 1,304,191
Adjustments in respect of current income tax of prior periods (154,769) (424,939) (364,951)
Net change in loss carry-forward and investment tax credits 705,857 1,327,716 564,742
Adjustment of deferred tax assets/liabilities for write-
downs/reversals and different jurisdictional tax rates
11,421 253,100 330,228
Tax effect of non-taxable income and non-deductible
expenses:
Tax exempt income (1,649,709) (1,707,646) (1,549,018)
Investment gain (1,196,376) (658,375) (639,979)
Dividend income (90,201) (88,518) (83,154)
Others 354,485 254,903 259,590
Basic tax — 70,316 33,207
Estimated 10% income tax on unappropriated earnings 344,932 (299,338) 38,069
Deferred income tax related to changes in tax rates — — 12,477
Effect of different tax rates applicable to UMC and its
subsidiaries
(6,225) (13,103) (21,615)
Taxes withheld in other jurisdictions 16,629 753,752 868,106
Others 367,794 282,072 240,588
Income tax expense recorded in profit or loss $ 1,027,500 $ 552,524 $ 992,481
F-81

c. Significant components of deferred income tax assets and liabilities were as follows:
As of December 31,
2016 2017
NT$ NT$
(In Thousands) (In Thousands)
Deferred income tax assets
Depreciation $ 2,147,042 $ 2,064,726
Loss carry-forward 842 425,247
Pension 668,950 697,478
Allowance for sales returns and discounts 294,510 171,213
Allowance for inventory valuation losses 333,472 365,658
Investment loss 231,299 262,346
Unrealized profit on intercompany sales 856,304 1,626,072
Deferred revenue 401,790 452,907
Others 88,186 50,482
Total deferred income tax assets 5,022,395 6,116,129
Deferred income tax liabilities
Unrealized exchange gain (395,723) (348,198)
Depreciation (277,365) (306,472)
Investment gain (1,095,682) (1,139,940)
Convertible bond option (232,831) (176,361)
Amortizable assets (393,578) (353,477)
Others (2,617) (2,775)
Total deferred income tax liabilities (2,397,796) (2,327,223)
Net deferred income tax assets $ 2,624,599 $ 3,788,906
d. Movement of deferred tax
For the years ended
December 31,
2016 2017
NT$ NT$
(In Thousands) (In Thousands)
Balance at January 1 $ (62,858) $ 2,624,599
Amounts recognized in profit or loss during the period 2,524,732 1,109,572
Amounts recognized in other comprehensive income 166,561 55,219
Amounts recognized in equity 1,608 227
Exchange adjustments (5,444) (711)
Balance at December 31 $ 2,624,599 $ 3,788,906
F-82

e. The Company is subject to taxation in Taiwan and other foreign jurisdictions. As of December 31, 2017, income tax
returns of UMC and its subsidiaries in Taiwan have been examined by the tax authorities through 2014, while in other
foreign jurisdictions, relevant tax authorities have completed the examination through 2009.
f. UMC was granted income tax exemption for several periods with respect to income derived from the expansion of
operations. The income tax exemption will expire on December 31, 2020.
g. The information of the unused tax loss carry-forward for which no deferred income tax assets have been recognized
was as follows:
As of December 31,
2016 2017
NT$ NT$
Expiry period (In Thousands) (In Thousands)
1-5 years $ 8,073,715 $14,881,800
6-10 years 15,772,910 15,055,903
more than 10 years 4,856 5,105
Total $23,851,481 $29,942,808
h. As of December 31, 2016 and 2017, deductible temporary differences for which no deferred income tax assets have
been recognized amounted to NT$4,965 million and NT$7,141 million, respectively.
i. Imputation credit information
As of December 31,
2016 2017
NT$ NT$
(In Thousands) (In Thousands)
Balances of imputation credit amounts $ 3,850,306 $ 3,409,988
F-83

The actual creditable ratio for 2016 was 10.61%. According to the Article 66-6 of Income Tax Act, the imputation
credit ratio for the earnings of 2016 distributed to individual stockholders residing in R.O.C. is half of the original
ratio. On January 18, 2018, the Legislative Yuan passed the amendments to the Income Tax Act that abolished the
imputation tax scheme under the integrated income tax system. The balance of the imputation credit account as of
December 31, 2017 is only for reference.
j. UMC’s earnings generated in and prior to the year ended December 31, 1997 have been fully appropriated.
k. As of December 31, 2016 and 2017, the taxable temporary differences of unrecognized deferred tax liabilities
associated with investments in subsidiaries amounted to NT$9,869 million and NT$9,289 million, respectively.
(24) Earnings Per Share
a. Earnings per share-basic
Basic earnings per share amounts are calculated by dividing the net income for the year attributable to ordinary equity
holders of the parent company by the weighted-average number of ordinary shares outstanding during the year. The
reciprocal stockholdings held by subsidiaries and associates are deducted from the computation of weighted-average
number of shares outstanding.
For the years ended December 31,
2015 2016 2017
NT$ NT$ NT$
(In Thousands) (In Thousands) (In Thousands)
Net income attributable to the parent company $13,254,071 $ 8,621,147 $ 9,676,698
Weighted-average number of ordinary shares for basic
earnings per share (thousand shares) 12,336,388 12,098,826 11,994,760
Earnings per share-basic (NTD) $ 1.07 $ 0.71 $ 0.81
F-84

b. Earnings per share-diluted
Diluted earnings per share is calculated by taking basic earnings per share plus the effect of additional common shares
that would have been outstanding if the dilutive share equivalents had been issued. The net income attributable to
ordinary equity holders of the parent company would be also adjusted for the interest and other income or expenses
derived from any underlying dilutive share equivalents, such as convertible bonds. For employees’ compensation that
may be distributed in shares, the number of shares to be distributed is taken into consideration assuming the
distribution will be made entirely in shares when calculating diluted earnings per share.
For the years ended December 31,
2015 2016 2017
NT$ NT$ NT$
(In Thousands) (In Thousands) (In Thousands)
Net income attributable to the parent company $13,254,071 $ 8,621,147 $ 9,676,698
Effect of dilution
Unsecured convertible bonds 172,592 282,325 288,091
Income attributable to stockholders of the parent $13,426,663 $ 8,903,472 $ 9,964,789
Weighted-average number of common stocks for basic
earnings per share (thousand shares)
12,336,388 12,098,826 11,994,760
Effect of dilution
Employees’ compensation 143,726 99,122 83,981
Employee stock options 3,199 — —
Unsecured convertible bonds 687,493 1,152,306 1,193,935
Weighted-average number of common stocks after dilution
(thousand shares) 13,170,806 13,350,254 13,272,676
Diluted earnings per share (NTD) $ 1.02 $ 0.67 $ 0.75
(25) Deconsolidation of Subsidiary
TOPCELL SOLAR INTERNATIONAL CO., LTD. (TOPCELL)
In order to integrate resources and reduce operating cost by improving operating performance and expanding economies of
scale, TOPCELL’s Board of Directors (TOPCELL, one of the Company’s subsidiaries) resolved to offer a merger with
MOTECH INDUSTRIES, INC. (MOTECH) on December 26, 2014. Six shares of TOPCELL were exchanged for one share
of MOTECH. MOTECH was the surviving company. On June 1, 2015, the Company derecognized the related assets and
liabilities.
F-85

a. TOPCELL’s derecognized assets and liabilities mainly consisted of:
NT$
(In Thousands)
Assets
Cash and cash equivalents $ 834,955
Notes and accounts receivable 855,927
Other receivables 60,638
Inventories 495,726
Prepayments 231,288
Property, plant and equipment 3,862,129
Others 106,714
6,447,377
Liabilities
Short-term loans (3,488,700)
Notes and accounts payable (409,244)
Other payables (197,259)
Payables on equipment (127,297)
Current portion of long-term liabilities (810,878)
Other current liabilities (10,107)
Long-term loans (176,470)
(5,219,955)
Net carrying amount of the disposal group $ 1,227,422
b. Consideration received and gain recognized from the transaction:
NT$
(In Thousands)
Stock received — MOTECH $ 1,495,023
Less: Net assets of the subsidiary deconsolidated (1,227,422)
Add: Non-controlling interests 100,400
Less: Goodwill (43,072)
Gain on disposal of the shares of subsidiary $ 324,929
Gain on disposal of the shares of subsidiary for the year ended December 31, 2015 was recognized as other gains and
losses in the consolidated statement of comprehensive income.
F-86

c. Analysis of net cash outflow arising from deconsolidation of the subsidiary:
NT$
(In Thousands)
Cash received $ —
Net cash of subsidiary derecognized (834,955)
Net cash outflow from deconsolidation $ (834,955)
(26) Reconciliation of Liabilities Arising from Financing Activities
As of December 31,
2016 Cash Flows
Non-cash changes
As of December 31,
2017
Foreign
exchange Other (Note)
NT$ NT$ NT$ NT$ NT$
(In Thousands) (In Thousands) (In Thousands) (In Thousands) (In Thousands)
Short-term loans $ 20,550,801 $ 5,878,717 $(1,064,017) $ 80,039 $ 25,445,540
Long-term loans (current portion included) 29,248,690 4,398,112 (1,483,165) 1,699 32,165,336
Bonds payable (current portion included) 41,980,931 6,184,215 — 352,485 48,517,631
Guarantee deposits (current portion
included)
491,089 110,363 (36,876) — 564,576
Other financial liabilities-noncurrent 20,311,688 — (195,611) 370,042 20,486,119
Note: Other non-cash changes mainly consisted of amortization of short-term loans, bonds payable and other financial
liabilities-noncurrent using the effective interest method.
F-87

7. SIGNIFICANT RELATED PARTY TRANSACTIONS
a. Significant intercompany transactions between consolidated entities were as follows:
For the year ended December 31, 2015
Counterparty
Transactions (Note 1)
Entity Account Amount
Terms
(Note 3)
NT$
(In Thousands)
UMC UMC-USA Sales $62,952,979 Net 60 days
UMC UMC-USA Accounts receivable 7,615,622 —
UMC UMC GROUP JAPAN Sales 9,716,823 Net 60 days
UMC UMC GROUP JAPAN Accounts receivable 2,299,403 —
WAVETEK UMC Sales 928,335 Net 30 days
WAVETEK UMC Accounts receivable 128,809 —
HEJIAN UMC-USA Sales 657,149 Net 60 days
HEJIAN UMC-USA Accounts receivable 108,932 —
HEJIAN UMC GROUP JAPAN Sales 151,935 Net 60 days
HEJIAN UMC GROUP JAPAN Accounts receivable 16,480 —
For the year ended December 31, 2016
Counterparty
Transactions (Note 2)
Entity Account Amount
Terms
(Note 3)
NT$
(In Thousands)
UMC UMC-USA Sales $69,676,143 Net 60 days
UMC UMC-USA Accounts receivable 9,122,728 —
UMC UMC GROUP JAPAN Sales 4,056,027 Net 60 days
UMC UMC GROUP JAPAN Accounts receivable 681,621 —
UMC USC Sales 379,332
(Note 4)
Net 30 days
F-88

Counterparty
Transactions (Note 2)
Entity Account Amount
Terms
(Note 3)
NT$
(In Thousands)
UMC USC Accounts receivable 3,091,249 —
UMC WAVETEK Sales 148,266 Month-end 30 days
UMC WAVETEK Accounts receivable 337 —
HEJIAN UMC-USA Sales 429,216 Net 60 days
HEJIAN UMC-USA Accounts receivable 99,626 —
HEJIAN UMC GROUP JAPAN Sales 161,809 Net 60 days
HEJIAN UMC GROUP JAPAN Accounts receivable 30,294 —
For the year ended December 31, 2017
Counterparty
Transactions (Note 2)
Entity Account Amount
Terms
(Note 3)
NT$
(In Thousands)
UMC UMC-USA Sales $59,968,172 Net 60 days
UMC UMC-USA Accounts receivable 6,737,723 —
UMC UMC GROUP JAPAN Sales 4,212,523 Net 60 days
UMC UMC GROUP JAPAN Accounts receivable 659,488 —
UMC USC Sales 998,899
(Note 5)
Net 30 days
UMC USC Accounts receivable 4,790,930 —
UMC USC Loan receivable 3,924,360 —
HEJIAN UMC-USA Sales 214,147 Net 60 days
F-89

Counterparty
Transactions (Note 2)
Entity Account Amount
Terms
(Note 3)
NT$
(In Thousands)
HEJIAN UMC-USA Accounts receivable 35,498 —
HEJIAN UMC GROUP JAPAN Sales 223,740 Net 60 days
HEJIAN UMC GROUP JAPAN Accounts receivable 43,332 —
USC UMC-USA Sales 241,220 Net 60 days
USC UMC-USA Accounts receivable 141,272 —
Note 1: The significant intercompany transactions listed above include downstream and upstream transactions.
Note 2: The significant intercompany transactions listed above include downstream transactions.
Note 3: The sales price to the above related parties was determined through mutual agreement in reference to market conditions.
Note 4: UMC authorized technology licenses to its subsidiary, USC, in the amount of US$0.15 billion, which was recognized as
deferred revenue and would be realized over time.
Note 5: UMC authorized technology licenses to its subsidiary, USC, in the amount of US$0.35 billion, which was recognized as
deferred revenue and would be realized over time.
b. Significant transactions between the Company and other related parties were as follows:
(i) Name and Relationship of Related Parties
Name of related parties Relationship with the Company
FARADAY TECHNOLOGY CORP. and its subsidiaries Associate
JINING SUNRICH SOLARENERGY CORPORATION Joint venture’s subsidiary
SILICON INTEGRATED SYSTEMS CORP. The Company’s director
SUBTRON TECHNOLOGY CO., LTD. Subsidiary’s supervisor
PHOTRONICS DNP MASK CORPORATION Other related parties
F-90

(ii) Operating revenues
For the years ended December 31,2015 2016 2017NT$
(In Thousands)NT$
(In Thousands)NT$
(In Thousands)Associates $ 1,132,831 $ 1,961,451 $ 1,357,720Joint ventures 14,224 13,122 12,465Others 7,228 2,305 30,417Total $ 1,154,283 $ 1,976,878 $ 1,400,602
(iii) Accounts receivable, net
As of December 31,2016 2017NT$
(In Thousands)NT$
(In Thousands)Associates $ 138,869 $ 84,839Joint ventures 1,012 1,051Others 86 7,908Total 139,967 93,798Less: Allowance for sales returns and discounts (3,057) (2,733) Net $ 136,910 $ 91,065
The sales price to the above related parties was determined through mutual agreement in reference to market conditions. The collection period for domestic sales to related parties was month-end 30~60 days, while the collection period for overseas sales was net 30~60 days.
(iv) Significant asset transactions
Acquisition of intangible assets
For the years ended December 31,Purchase price
2015 2016 2017NT$
(In Thousands)NT$
(In Thousands)NT$
(In Thousands) Associates $ 129,327 $ 254,611 $ 322,808
F-91

Disposal of available-for-sale financial assets, noncurrent
Trading
Volume
(In thousands Transaction For the year ended December 31, 2015
of shares) underlying Disposal amount Disposal gain
NT$ NT$
(In Thousands) (In Thousands)
Associates 336 DRAMEXCHANGE TECH. INC. $ 5,400 $ 2,346
For the year ended December 31, 2016: None.
Trading
Volume
(In thousands Transaction For the year ended December 31, 2017
of shares) underlying Disposal amount Disposal loss
NT$ NT$
(In Thousands) (In Thousands)
Others 6,489 ASIA PACIFIC MICROSYSTEMS, INC. $ 50,745 $ (13,753)
(v) Others
Mask expenditure
For the years ended December 31,
2015 2016 2017
NT$ NT$ NT$
(In Thousands) (In Thousands) (In Thousands)
Others $ — $ — $ 994,710
Other payables of mask expenditure
As of December 31,
2015 2016 2017
NT$ NT$ NT$
(In Thousands) (In Thousands) (In Thousands)
Others $ — $ — $ 580,789
F-92

c. Key management personnel compensation
For the years ended December 31,
2015 2016 2017
NT$ NT$ NT$
(In Thousands) (In Thousands) (In Thousands)
Short-term employee benefits $ 292,282 $ 267,501 $ 271,554
Post-employment benefits 2,953 2,773 3,478
Termination benefits 1,582 939 6,957
Share-based payment 5,772 10 68
Others 1,039 422 294
Total $ 303,628 $ 271,645 $ 282,351
8. ASSETS PLEDGED AS COLLATERAL
As of December 31,
2016 2017 Party to which asset(s) was pledged Purpose of pledge
NT$ NT$
(In Thousands) (In Thousands)
Refundable Deposits (Time deposit) $ 815,195 $ 818,195 Customs Customs duty guarantee
Refundable Deposits (Time deposit) 251,231 246,008 Science Park Administration Collateral for land lease
Refundable Deposits (Time deposit) — 20,991 Science Park Administration Collateral for dormitory
lease
Refundable Deposits (Time deposit) — 800 Science Park Administration Industry-university
cooperative research
project performance
guarantees
Refundable Deposits (Time deposit) 37,084 37,084 Liquefied Natural Gas
Business Division, CPC
Corporation, Taiwan
Energy resources
guarantee
Refundable Deposits (Time deposit) 870 — National Pingtung
University of Science and
Technology
Guarantee for
engineering project
Refundable Deposits (Time deposit) 286 — Bureau of Energy, Ministry
of Economic Affairs
Energy resources
guarantee
F-93

As of December 31,
2016 2017 Party to which asset(s) was pledged Purpose of pledge
NT$ NT$
(In Thousands) (In Thousands)
Buildings 138,063 6,083,976 Taiwan Cooperative Bank and
Secured Syndicated
Loans from China Development
Bank and 6 others
Collateral for long-term
loans
Machinery and equipment 234,499 32,428,768 Taiwan Cooperative Bank, Mega
International Commercial Bank
and Secured Syndicated Loans
from China Development Bank
and 6 others
Collateral for long-term
loans
Other noncurrent assets — 323,001 Secured Syndicated Loans from
China Development Bank and 6
others
Collateral for long-term
loans
Total $ 1,477,228 $39,958,823
9. SIGNIFICANT CONTINGENCIES AND UNRECOGNIZED CONTRACT COMMITMENTS
(1) As of December 31, 2017, amounts available under unused letters of credit for importing machinery and equipment was
NT$0.7 billion.
(2) The Company entered into several patent license agreements and development contracts of intellectual property for a total
contract amount of approximately NT$12 billion. As of December 31, 2017, the portion of royalties and development fees
not yet recognized was NT$0.9 billion.
(3) The Company entered into several construction contracts for the expansion of its operations. As of December 31, 2017, these
construction contracts amounted to approximately NT$3.7 billion and the portion of the contracts not yet recognized was
approximately NT$0.6 billion.
F-94

(4) The Company entered into several operating lease contracts for land and office. These renewable operating leases will expire
in various years through 2038. Future minimum lease payments under those leases are as follows:
Year
As of
December 31, 2017
NT$
(In Thousands)
2018 $ 362,929
2019 352,100
2020 327,725
2021 314,224
2022 317,854
2023 and thereafter 3,063,106
Total $ 4,737,938
(5) The Board of Directors of UMC resolved in October 2014 to participate in a 3-way agreement with Xiamen Municipal
People’s Government and FUJIAN ELECTRONIC & INFORMATION GROUP to form a company which will focus on
12’’ wafer foundry services. Based on the agreement, UMC submitted an investment application with R.O.C. government
authorities for approval to invest in the company established by Xiamen Municipal People’s Government and FUJIAN
ELECTRONIC & INFORMATION GROUP. The Company anticipates that its investment could reach approximately
US$1.4 billion by 2020, with instalment funding starting in 2015. As of December 31, 2017, UMC obtained R.O.C.
government authority’s approval of the investment application for US$1.3 billion (including indirect investment). In January
2015, the Company obtained control over the investee, USC, by acquiring more than half of the seats of the Board of
Directors. As of December 31, 2017, the Company’s investment of RMB¥4.6 billion in USC represented ownership interest
of 51.02%. Furthermore, based on the agreement, UMC is committed to repurchase from the other investors’ investments in
USC at their original investment cost plus interest, beginning from the seventh year following the last instalment payment
made by the other investors. Accordingly, the Company recognizes non-controlling interests as required by IFRS 10 during
the reporting period. At the end of each reporting period, the Company recognizes a financial liability for its commitment to
the other investors in accordance with IAS 39, at the same time derecognizing the non-controlling interests. Any difference
between the financial liability and the non-controlling interests balance is recognized in equity.
F-95

(6) On July 1, 2016, INTERNATIONAL BUSINESS MACHINES CORPORATION (IBM) filed a complaint in the United
States District Court for the Southern District of New York accusing that UMC did not pay the technology license fees in
accordance with the technology license agreement and claimed US$10 million with interest of 12% per annum. UMC is
appealing an unfavorable judgment issued on September 15, 2017 by the United States District Court of Southern District of
New York for the subject matter. The Company does not expect material adverse financial impact resulting from this claim.
(7) In 2017, the Taichung District Prosecutors Office requested the local court to impose a fine to the Company based on the
allegation of misappropriation of trade secret of Micron Technology Inc. (“Micron”). In addition, Micron Technology Inc.
filed a civil lawsuit against the Company with the District Court of Northern District of California for the similar cause. On
January 12, 2018, the Company filed counterclaims against Micron with the Fuzhou Intermediate People’s Court against,
among others, Micron (Xi’an) Co., Ltd. and Micron (Shanghai) Trading Co., Ltd. for patent infringement. These cases are
currently in progress and the Company cannot make a reliable estimate of the contingent liability at this time.
10. SIGNIFICANT SUBSEQUENT EVENTS
(1) The amendments to the Income Tax Act with retrospective effect from January 1, 2018 were passed by the Legislative Yuan
on January 18, 2018, and announced by the President on February 7, 2018, respectively. According to the amendments, the
imputation tax scheme under the integrated income tax system is repealed and consequently the imputation credit account is
closed. In addition, the corporate income tax rate is raised from 17% to 20 %, and the 10% undistributed earnings tax is
lowered to 5%. After the change of the tax rates, the deferred tax assets and deferred tax liabilities as of December 31, 2017
will be increased by NT$917 million and decreased by NT$156 million, respectively.
(2) On April 25, 2018, to integrate the resources pursuant to the groupwise investment strategy, the Board of Directors of UMC
and its subsidiaries, Fortune Venture Capital Corp. (FORTUNE) and UMC New Business Investment Corp. (NBI), resolved
an organizational restructure plan, under which NBI will be merged into FORTUNE. FORTUNE will be the surviving
company and assume all the assets and liabilities from NBI when the merger became effective.
F-96

11. FINANCIAL RISK AND FAIR VALUE DISCLOSURES
(1) Categories of financial instruments
As of December 31,
Financial Assets 2016 2017
NT$ NT$
(In Thousands) (In Thousands)
Non-derivative financial instruments
Financial assets at fair value through profit or loss
Designated financial assets at fair value through profit or
loss
$ 263,201 $ 213,180
Financial assets held for trading 665,160 663,138
Subtotal 928,361 876,318
Available-for-sale financial assets 20,415,541 20,636,332
Financial assets measured at cost 2,760,615 2,218,472
Loans and receivables
Cash and cash equivalents (excludes cash on hand) 57,575,264 81,670,212
Receivables 23,965,052 22,149,072
Refundable deposits 2,203,658 1,903,041
Other financial assets, current 323,769 2,645,003
Subtotal 84,067,743 108,367,328
Derivative financial instruments
Financial assets at fair value through profit or loss
Forward exchange contracts 543 —
Option — 31,605
Total $108,172,803 $132,130,055
As of December 31,
Financial Liabilities 2016 2017
NT$ NT$
(In Thousands) (In Thousands)
Non-derivative financial instruments
Financial liabilities measured at amortized cost
Short-term loans $ 20,550,801 $ 25,445,540
Payables 34,401,266 24,274,413
Guarantee deposit (current portion included) 491,089 564,576
Bonds payable (current portion included) 41,980,931 48,517,631
Long-term loans (current portion included) 29,248,690 32,165,336
Other financial liabilities-noncurrent 20,311,688 20,486,119
Subtotal 146,984,465 151,453,615
Derivative financial instruments
Financial liabilities at fair value through profit or loss
Forward exchange contracts 60,855 —
Total $147,045,320 $151,453,615
F-97

(2) Financial risk management objectives and policies
The Company’s risk management objectives are to manage the market risk, credit risk and liquidity risk related to its
operating activities. The Company identifies, measures and manages the aforementioned risks based on policy and risk
preference.
The Company has established appropriate policies, procedures and internal controls for financial risk management. Before
entering into significant financial activities, approval process by the Board of Directors and Audit Committee must be carried
out based on related protocols and internal control procedures. The Company complies with its financial risk management
policies at all times.
(3) Market risk
Market risk is the risk that the fair value or future cash flows of a financial instrument will fluctuate because of changes in
market prices. Market risks comprise currency risk, interest rate risk and other price risk (such as equity price risk).
Foreign currency risk
The Company’s exposure to the risk of changes in foreign exchange rates relates primarily to the Company’s operating
activities (when revenue or expense is denominated in a different currency from the Company’s functional currency) and the
Company’s net investments in foreign subsidiaries.
The Company applies natural hedges on the foreign currency risk arising from purchases or sales, and utilizes spot or
forward exchange contracts to manage foreign currency risk and the net effect of the risks related to monetary financial
assets and liabilities is minor. The notional amounts of the foreign currency contracts are the same as the amount of the
hedged items. In principle, the Company does not carry out any forward exchange contracts for uncertain commitments.
Furthermore, as net investments in foreign subsidiaries are for strategic purposes, they are not hedged by the Company.
The foreign currency sensitivity analysis of the possible change in foreign exchange rates on the Company’s profit is
performed on significant monetary items denominated in foreign currencies as of the end of the reporting period. When NTD
strengthens/weakens against USD by 10%, the profit for the year ended December 31, 2015 increases/decreases by
NT$186 million while the profit for the years ended December 31, 2016 and 2017 decreases/increases by NT$33 million and
NT$1,330 million, respectively. When RMB strengthens/weakens against USD by 10%, the profit for the years ended
December 31, 2015, 2016 and 2017 increases/decreases by nil, NT$3,781 million and NT$4,011 million, respectively.
F-98

Interest rate risk
The Company is exposed to interest rate risk arising from borrowing at floating interest rates. All of the Company’s bonds
have fixed interest rates and are measured at amortized cost. As such, changes in interest rates would not affect the future
cash flows. On the other hand, as the interest rates of the Company’s short-term and long-term bank loans are floating,
changes in interest rates would affect the future cash flows but not the fair value. Please refer to Note 6(10), 6(12) and 6(13)
for the range of interest rates of the Company’s bonds and bank loans.
At the reporting dates, a change of 10 basis points of interest rate in a reporting period could cause the profit for the years
ended December 31, 2015, 2016 and 2017 to decrease/increase by NT$18 million, NT$50 million and NT$58 million,
respectively.
Equity price risk
The Company’s listed and unlisted equity securities are susceptible to market price risk arising from uncertainties about
future performance of equity markets. The Company’s listed equity investments are classified as financial assets at fair value
through profit or loss and available-for-sale financial assets, while unlisted equity securities are classified as
available-for-sale financial assets which are subsequently measured using a valuation model and financial assets measured at
cost.
The sensitivity analysis for the equity instruments is based on the change in fair value as of the reporting date. A change of
5% in the price of the aforementioned financial assets at fair value through profit or loss could increase/decrease the
Company’s profit for the years ended December 31, 2015, 2016 and 2017 by NT$13 million, NT$31 million and
NT$33 million, respectively. A change of 5% in the price of the aforementioned available-for-sale financial instruments
could increase/decrease the Company’s other comprehensive income for the years ended December 31, 2015, 2016 and 2017
by NT$1,150 million, NT$976 million and NT$979 million, respectively.
(4) Credit risk management
The Company only trades with approved and creditworthy third parties. Where the Company trades with third parties which
have less favorable financial positions, it will request collateral from them. It is the Company’s policy that all customers who
wish to trade on credit terms are subject to credit verification procedures. In addition, notes and accounts receivable balances
are monitored on an ongoing basis, which consequently minimizes the Company’s exposure to bad debts.
F-99

The Company mitigates the credit risks from financial institutions by limiting its counter parties to only reputable domestic
or international financial institutions with good credit standing and spreading its holdings among various financial
institutions. The Company’s exposure to credit risk arising from the default of counter-parties is limited to the carrying
amount of these instruments.
As of December 31, 2016 and 2017, accounts receivable from the top ten customers represent 63% and 54% of the total
accounts receivables of the Company, respectively. The credit concentration risk of other accounts receivables is
insignificant.
(5) Liquidity risk management
The Company’s objectives are to maintain a balance between continuity of funding and flexibility through the use of cash
and cash equivalents, bank loans and bonds.
The table below summarizes the maturity profile of the Company’s financial liabilities based on the contractual undiscounted
payments and contractual maturity:
As of December 31, 2016
Less than
1 year
2 to 3
years
4 to 5
years > 5 years Total
NT$ NT$ NT$ NT$ NT$
(In Thousands) (In Thousands) (In Thousands) (In Thousands) (In Thousands)
Non-derivative financial liabilities
Short-term loans $20,916,531 $ — $ — $ — $ 20,916,531
Payables 33,996,623 — — 109,075 34,105,698
Guarantee deposits — 13,140 32,347 445,602 491,089
Bonds payable 8,062,161 10,339,221 22,870,813 3,144,137 44,416,332
Long-term loans 4,000,076 7,507,908 9,899,242 12,575,318 33,982,544
Other financial liabilities-noncurrent — — — 22,561,882 22,561,882
Total $66,975,391 $17,860,269 $32,802,402 $38,836,014 $156,474,076
Derivative financial liabilities
Forward exchange contracts
Net settlement $ (60,855) $ — $ — $ — $ (60,855)
F-100

As of December 31, 2017
Less than
1 year
2 to 3
years
4 to 5
years > 5 years Total
NT$ NT$ NT$ NT$ NT$
(In Thousands) (In Thousands) (In Thousands) (In Thousands) (In Thousands)
Non-derivative financial liabilities
Short-term loans $25,622,430 $ — $ — $ — $ 25,622,430
Payables 23,807,378 — — 104,755 23,912,133
Guarantee deposits 95,085 14,071 29,876 425,544 564,576
Bonds payable 26,321,530 5,564,967 10,590,265 8,689,971 51,166,733
Long-term loans 3,855,962 8,728,249 13,397,515 13,450,444 39,432,170
Other financial liabilities-noncurrent — — 13,402,849 8,935,552 22,338,401
Total $79,702,385 $14,307,287 $37,420,505 $31,606,266 $163,036,443
(6) Foreign currency risk management
UMC entered into forward exchange contracts for hedging the exchange rate risk arising from the net monetary assets or
liabilities denominated in foreign currency. The details of forward exchange contracts entered into by UMC are summarized
as follows:
As of December 31, 2016
Type Notional Amount Contract Period
Forward exchange contracts Sell US$285 million December 1, 2016~February 16, 2017
As of December 31, 2017: None.
F-101

(7) Fair value measurement
Fair value is the price that would be received to sell an asset or paid to transfer a liability in an orderly transaction between
market participants at the measurement date. The fair value measurement is based on the presumption that the transaction to
sell the asset or transfer the liability takes place either in the principal market for the asset or liability, or in the absence of a
principal market, in the most advantageous market for the asset or liability.
The principal or the most advantageous market must be accessible by the Company.
The fair value of an asset or a liability is measured using the assumptions that market participants would use when pricing
the asset or liability, assuming that market participants act in their economic best interest.
A fair value measurement of a non-financial asset takes into account a market participant’s ability to generate economic
benefits by using the asset in its highest and best use or by selling it to another market participant that would use the asset in
its highest and best use.
The Company uses valuation techniques that are appropriate in the circumstances and for which sufficient data are available
to measure fair value, maximizing the use of relevant observable inputs and minimizing the use of unobservable inputs.
All assets and liabilities for which fair value is measured or disclosed in the financial statements are categorized within the
fair value hierarchy, described as follows, based on the lowest level input that is significant to the fair value measurement as
a whole:
• Level 1 — Quoted (unadjusted) market prices in active markets for identical assets or liabilities;
• Level 2 — Valuation techniques for which the lowest level input that is significant to the fair value measurement is
directly or indirectly observable;
• Level 3 — Valuation techniques for which the lowest level input that is significant to the fair value measurement is
unobservable.
For assets and liabilities that are recognized in the financial statements on a recurring basis, the Company determines
whether transfers have occurred between levels in the hierarchy by re-assessing categorization (based on the lowest level
input that is significant to the fair value measurement as a whole) at the end of each reporting period.
F-102

a. Assets and liabilities measured and recorded at fair value on a recurring basis:
As of December 31, 2016
Level 1 Level 2 Level 3 Total
NT$ NT$ NT$ NT$
(In Thousands) (In Thousands) (In Thousands) (In Thousands)
Financial assets:
Financial assets at fair value through profit or
loss, current
$ 665,160 $ 49,009 $ — $ 714,169
Financial assets at fair value through profit or
loss, noncurrent
171,700 43,035 — 214,735
Available-for-sale financial assets,
noncurrent
10,517,662 64,242 9,833,637 20,415,541
Financial liabilities:
Financial liabilities at fair value through
profit or loss, current
— 60,855 — 60,855
As of December 31, 2017
Level 1 Level 2 Level 3 Total
NT$ NT$ NT$ NT$
(In Thousands) (In Thousands) (In Thousands) (In Thousands)
Financial assets:
Financial assets at fair value through profit or
loss, current
$ 663,138 $ 22,175 $ 31,605 $ 716,918
Financial assets at fair value through profit or
loss, noncurrent
174,760 16,245 — 191,005
Available-for-sale financial assets,
noncurrent
10,959,194 — 9,677,138 20,636,332
F-103

Fair values of financial assets at fair value through profit or loss and available-for-sale financial assets that are
categorized into level 1 are based on the quoted market prices in active markets. If there is no active market, the
Company estimates the fair value by using the market method valuation techniques based on parameters such as
recent fund raising activities, valuation of similar companies, individual company’s development, market conditions
and other economic indicators. If there are restrictions on the sale or transfer of an available-for-sale financial asset,
which are a characteristic of the asset, the fair value of the asset will be determined based on similar but unrestricted
financial assets’ quoted market price with appropriate discounts for the restrictions.
During the years ended December 31, 2016 and 2017, there were no significant transfers between Level 1 and Level 2
fair value measurements.
Reconciliations for fair value measurement in Level 3 fair value hierarchy were as follows:
Available-for-sale financial assets
Common stock Funds Preferred stock Total
NT$ NT$ NT$ NT$
(In Thousands) (In Thousands) (In Thousands) (In Thousands)
As of January 1, 2016 $ 7,138,180 $ 782,409 $ 1,166,256 $ 9,086,845
Recognized in profit (loss) (157,547) (13,152) (160,081) (330,780)
Recognized in other comprehensive
income (loss)
517,475 22,651 (5,691) 534,435
Acquisition 20,702 180,022 121,453 322,177
Disposal (34,732) (20,945) — (55,677)
Transfer to Level 3 211,217 — 95,030 306,247
Exchange effect (7,543) (8,689) (13,378) (29,610)
As of December 31, 2016 $ 7,687,752 $ 942,296 $ 1,203,589 $ 9,833,637
Financial
assets at fair
value through
profit or loss Available-for-sale financial assets
Option Common stock Funds Preferred stock Total
NT$ NT$ NT$ NT$ NT$
(In Thousands) (In Thousands) (In Thousands) (In Thousands) (In Thousands)
As of January 1, 2017 $ — $ 7,687,752 $ 942,296 $ 1,203,589 $ 9,833,637
Recognized in profit (loss) 31,605 (240,037) (64,515) (14,364) (318,916)
Recognized in other comprehensive
income (loss)
— (551,004) 26,269 (32,081) (556,816)
Acquisition — 170,457 266,992 429,627 867,076
Disposal — (244,970) — — (244,970)
Return of Capital — — (6,369) — (6,369)
Transfer to Level 3 — 87,830 — 342,832 430,662
Transfer out of Level 3 — (181,637) — — (181,637)
Exchange effect — (34,072) (47,264) (64,193) (145,529)
As of December 31, 2017 $ 31,605 $ 6,694,319 $ 1,117,409 $ 1,865,410 $ 9,677,138
F-104

The Company’s policy to recognize the transfer into and out of fair value hierarchy levels is based on the event or
changes in circumstances that caused the transfer.
The total losses of NT$134 million, NT$331 million and NT$286 million for the years ended December 31, 2015,
2016 and 2017, were included in profit or loss that is attributable to the change in unrealized gains or losses relating to
those financial assets without quoted market prices held at the end of the reporting period.
b. Assets and liabilities not recorded at fair value on a recurring basis but for which fair value is disclosed:
The fair value of bonds payable is estimated by the market price or using a valuation model. The model uses market-
based observable inputs including share price, volatility, credit spread and risk-free interest rates. The fair value of
long-term loans is determined using discounted cash flow model, based on the Company’s current incremental
borrowing rates of similar loans.
The fair values of the Company’s short-term financial instruments including cash and cash equivalents, receivables,
refundable deposits, other financial assets-current, short-term loans, payables and guarantee deposits approximate
their carrying amount due to their maturities within one year.
F-105

As of December 31, 2016
Fair value measurements during
reporting period using
Items Fair value Level 1 Level 2 Level 3 Carrying amount
NT$ NT$ NT$ NT$ NT$
(In Thousands) (In Thousands) (In Thousands) (In Thousands) (In Thousands)
Bonds payables (current portion included) $42,835,431 $25,182,667 $17,652,764 $ — $ 41,980,931
Long-term loans (current portion included) 29,248,690 — 29,248,690 — 29,248,690
As of December 31, 2017
Fair value measurements during
reporting period using
Items Fair value Level 1 Level 2 Level 3 Carrying amount
NT$ NT$ NT$ NT$ NT$
(In Thousands) (In Thousands) (In Thousands) (In Thousands) (In Thousands)
Bonds payables (current portion included) $49,342,714 $31,422,772 $17,919,942 $ — $ 48,517,631
Long-term loans (current portion included) 32,165,336 — 32,165,336 — 32,165,336
12. OPERATING SEGMENT INFORMATION
(1) The Company determined its operating segments based on business activities with discrete financial information regularly
reported through the Company’s internal reporting protocols to the Company’s chief operating decision maker. The
Company is organized into business units based on its products and services. As of December 31, 2017, the Company had
the following segments: wafer fabrication and new business. There were no material differences between the accounting
policies described in Note 4 and those applied by the operating segments. The primary operating activity of the wafer
fabrication segment is the manufacture of chips to the design specifications of our customers by using our own proprietary
processes and techniques. The Company maintains a diversified customer base across industries, including communication,
consumer electronics, computer, memory and others, while continuing to focus on manufacturing for high growth, large
volume applications, including networking, telecommunications, internet, multimedia, PCs and graphics. New business
segment primarily includes researching, developing, manufacturing, and providing solar energy and new generation light-
emitting diode (LED).
F-106

Reportable segment information for the years ended December 31, 2015, 2016 and 2017 were as follows:
For the year ended December 31, 2015
Wafer
Fabrication New Business Subtotal
Adjustment
and
Elimination
(Note) Consolidated
NT$ NT$ NT$ NT$ NT$
(In Thousands) (In Thousands) (In Thousands) (In Thousands) (In Thousands)
Net revenue from external customers $141,705,196 $ 3,125,225 $144,830,421 $ — $144,830,421
Net revenue from sales among intersegments — 15,725 15,725 (15,725) —
Segment net income (loss), net of tax 13,569,672 (1,731,181) 11,838,491 802,607 12,641,098
Capital expenditure 60,386,300 117,849 60,504,149 — 60,504,149
Depreciation 42,833,022 639,986 43,473,008 — 43,473,008
Share of profit or loss of associates and joint
ventures
(869,190) (58,513) (927,703) 932,397 4,694
Income tax expense (benefit) 880,170 (3,676) 876,494 151,006 1,027,500
Impairment loss 1,465,036 801,465 2,266,501 — 2,266,501
For the year ended December 31, 2016
Wafer
Fabrication New Business Subtotal
Adjustment
and
Elimination
(Note) Consolidated
NT$ NT$ NT$ NT$ NT$
(In Thousands) (In Thousands) (In Thousands) (In Thousands) (In Thousands)
Net revenue from external customers $147,444,265 $ 425,859 $147,870,124 $ — $147,870,124
Net revenue from sales among intersegments — 6,547 6,547 (6,547) —
Segment net income (loss), net of tax 4,218,948 (1,661,885) 2,557,063 1,611,499 4,168,562
Capital expenditure 91,542,436 18,203 91,560,639 — 91,560,639
Depreciation 49,288,201 402,834 49,691,035 — 49,691,035
Share of profit or loss of associates and joint
ventures
(1,285,380) (210,746) (1,496,126) 1,180,460 (315,666)
Income tax expense (benefit) 992,580 (9,017) 983,563 (431,039) 552,524
Impairment loss 1,296,529 781,045 2,077,574 — 2,077,574
F-107

For the year ended December 31, 2017
Wafer
Fabrication New Business Subtotal
Adjustment
and
Elimination
(Note) Consolidated
NT$ NT$ NT$ NT$ NT$
(In Thousands) (In Thousands) (In Thousands) (In Thousands) (In Thousands)
Net revenue from external customers $148,939,836 $ 344,870 $149,284,706 $ — $149,284,706
Net revenue from sales among intersegments — 13,600 13,600 (13,600) —
Segment net income (loss), net of tax 6,728,620 (665,895) 6,062,725 616,504 6,679,229
Capital expenditure 44,229,488 6,788 44,236,276 — 44,236,276
Depreciation 50,737,240 227,880 50,965,120 — 50,965,120
Share of profit or loss of associates and joint
ventures
(258,959) (32,619) (291,578) 449,415 157,837
Income tax expense 1,167,154 3 1,167,157 (174,676) 992,481
Impairment loss 632,207 318,128 950,335 — 950,335
F-108

As of December 31, 2016
Wafer
Fabrication New Business Subtotal
Adjustment
and
Elimination
(Note) Consolidated
NT$ NT$ NT$ NT$ NT$
(In Thousands) (In Thousands) (In Thousands) (In Thousands) (In Thousands)
Segment assets $384,870,981 $ 3,213,397 $388,084,378 $(3,857,663) $384,226,715
Segment liabilities $166,110,998 $ 1,857,130 $167,968,128 $ 1,312,213 $169,280,341
As of December 31, 2017
Wafer
Fabrication New Business Subtotal
Adjustment
and
Elimination
(Note) Consolidated
NT$ NT$ NT$ NT$ NT$
(In Thousands) (In Thousands) (In Thousands) (In Thousands) (In Thousands)
Segment assets $392,370,323 $ 3,030,057 $395,400,380 $(4,268,160) $391,132,220
Segment liabilities $178,362,985 $ 1,700,045 $180,063,030 $ 1,448,192 $181,511,222
Note: The adjustments primarily consisted of intragroup elimination entries and GAAP difference adjustments.
(2) Geographic information
a. Revenue from external customers
For the years ended December 31,
2015 2016 2017
NT$ NT$ NT$
(In Thousands) (In Thousands) (In Thousands)
Taiwan $ 46,015,882 $ 46,493,583 $ 48,952,219
Singapore 18,316,785 26,753,960 30,798,270
China (includes Hong Kong) 11,722,585 13,732,391 18,971,866
Japan 10,141,883 4,501,057 4,694,277
USA 12,794,864 13,713,202 18,208,227
Europe 33,882,327 29,253,755 14,329,730
Others 11,956,095 13,422,176 13,330,117
Total $144,830,421 $147,870,124 $149,284,706
The geographic breakdown of the Company’s operating revenues was based on the location of the Company’s customers.
F-109

b. Non-current assets
As of December 31,
2016 2017
NT$ NT$
(In Thousands) (In Thousands)
Taiwan $141,692,141 $114,047,141
Singapore 22,891,986 18,501,088
China (includes Hong Kong) 69,461,494 80,180,759
USA 22,734 29,866
Europe 165,794 165,590
Others 113 60
Total $234,234,262 $212,924,504
Non-current assets include property, plant and equipment, intangible assets, prepayment for equipment and other noncurrent
assets.
(3) Major customers
Individual customers accounting for at least 10% of net sales for the years ended December 31, 2015, 2016 and 2017 were as
follows:
For the years ended December 31,
2015 2016 2017
NT$ NT$ NT$
(In Thousands) (In Thousands) (In Thousands)
Customer A from wafer fabrication segment $ 7,449,485 $13,324,560 $15,632,722
Customer B from wafer fabrication segment 20,761,648 $20,816,001 10,499,880
Total $28,211,133 $34,140,561 $26,132,602
F-110

13. CAPITAL MANAGEMENT
The primary objective of the Company’s capital management is to ensure that it maintains a strong credit rating and healthy
capital ratios to support its business and maximize the stockholders’ value. The Company also ensures its ability to operate
continuously to provide returns to stockholders and the interests of other related parties, while maintaining the optimal capital
structure to reduce costs of capital.
To maintain or adjust the capital structure, the Company may adjust the dividend payment to stockholders, return capital to
stockholders, issue new shares or dispose assets to redeem liabilities.
Similar to its peers, the Company monitors its capital based on debt to capital ratio. The ratio is calculated as the Company’s net
debt divided by its total capital. The net debt is derived by taking the total liabilities on the consolidated balance sheets minus cash
and cash equivalents. The total capital consists of total equity (including capital, additional paid-in capital, retained earnings, other
components of equity and non-controlling interests) plus net debt.
The Company’s strategy, which is unchanged for the reporting periods, is to maintain a reasonable ratio in order to raise capital
with reasonable cost. The debt to capital ratios as of December 31, 2016 and 2017 were as follows:
As of December 31,
2016 2017
NT$ NT$
(In Thousands) (In Thousands)
Total liabilities $169,280,341 $181,511,222
Less: Cash and cash equivalents (57,578,981) (81,674,572)
Net debt 111,701,360 99,836,650
Total equity 214,946,374 209,620,998
Total capital $326,647,734 $309,457,648
Debt to capital ratios 34.20% 32.26%
F-111

Exhibit 8.1
List of Significant Subsidiaries of United Microelectronics Corporation
Company
Jurisdiction of
Incorporation
Percentage of
Ownership as of
December 31, 2017
UMC Group (USA) U.S.A. 100.00%
United Microelectronics (Europe) B.V. The Netherlands 100.00%
UMC Capital Corp. Cayman Islands 100.00%
TLC Capital Co., Ltd. Taiwan, R.O.C. 100.00%
UMC New Business Investment Corp. Taiwan, R.O.C. 100.00%
Green Earth Limited Samoa 100.00%
Fortune Venture Capital Corp. Taiwan, R.O.C. 100.00%
UMC Investment (Samoa) Limited Samoa 100.00%
UMC Capital (USA) U.S.A. 100.00%
ECP Vita Pte. Ltd. Singapore 100.00%
Soaring Capital Corp. Samoa 100.00%
Unitruth Advisor (Shanghai) Co., Ltd. China 100.00%
Tera Energy Development Co., Ltd. Taiwan, R.O.C. 100.00%
United Microchip Corporation Cayman Islands 100.00%
Nexpower Technology Corp. Taiwan, R.O.C. 87.06%
Wavetek Microelectronics Corporation Taiwan, R.O.C. 78.47%
Everrich Energy Investment (HK) Limited China 100.00%
Everrich (Shandong) Energy Co., Ltd. China 100.00%
Unistars Corp. Taiwan, R.O.C. 83.69%
SocialNex Italia 1 S.R.L. Italy 87.06%
UMC (Beijing) Limited China 100.00%
Wavetek Microelectronics Investment (Samoa) Limited Samoa 78.47%
Wavetek Microelectronics Corporation (USA) U.S.A. 78.47%
Best Elite International Limited British Virgin Islands 96.66%
Infoshine Technology Limited British Virgin Islands 96.66%
Oakwood Associates Limited British Virgin Islands 96.66%
Hejian Technology (Suzhou) Co., Ltd. China 96.66%
UnitedDS Semiconductor (Shandong) Co., Ltd. China 96.66%
United Semiconductor (Xiamen) Co., Ltd. China 50.34%
UMC Group Japan Japan 100.00%
UMC Korea Co., Ltd. Korea 100.00%
Omni Global Limited Samoa 100.00%
United Microtechnology Corporation (California) U.S.A. 100.00%
United Microtechnology Corporation (New York) U.S.A. 100.00%
Sino Paragon Limited Samoa 100.00%
UMC Technology Japan Co., Ltd. Japan 100.00%

Exhibit 12.1
CERTIFICATION OF OUR CO-PRESIDENT
I, Jason Wang, certify that:
1. I have reviewed this annual report on Form 20-F of United Microelectronics Corporation;
2. Based on my knowledge, this report does not contain any untrue statement of a material fact or omit to state a material
fact necessary to make the statements made, in light of the circumstances under which such statements were made, not
misleading with respect to the period covered by this report;
3. Based on my knowledge, the financial statements, and other financial information included in this report, fairly present in
all material respects the financial condition, results of operations and cash flows of the company as of, and for, the periods
presented in this report;
4. The company’s other certifying officer and I are responsible for establishing and maintaining disclosure controls and
procedures (as defined in Exchange Act Rules 13a-15(e) and 15d-15(e)) and internal control over financial reporting (as
defined in Exchange Act Rules 13a-15(f) and 15d-15(f)) for the company and have:
(a) Designed such disclosure controls and procedures, or caused such disclosure controls and procedures to be designed under
our supervision, to ensure that material information relating to the company, including its consolidated subsidiaries, is made
known to us by others within those entities, particularly during the period in which this report is being prepared;
(b) Designed such internal control over financial reporting, or caused such internal control over financial reporting to be
designed under our supervision, to provide reasonable assurance regarding the reliability of financial reporting and the
preparation of financial statements for external purposes in accordance with generally accepted accounting principles;
(c) Evaluated the effectiveness of the company’s disclosure controls and procedures and presented in this report our conclusions
about the effectiveness of the disclosure controls and procedures, as of the end of the period covered by this report based on
such evaluation; and
(d) Disclosed in this report any change in the company’s internal control over financial reporting that occurred during the period
covered by this report that has materially affected, or is reasonably likely to materially affect, the company’s internal control
over financial reporting; and
5. The company’s other certifying officer and I have disclosed, based on our most recent evaluation of internal control over
financial reporting, to the company’s auditors and the audit committee of the company’s board of directors (or persons
performing the equivalent functions):
(a) All significant deficiencies and material weaknesses in the design or operation of internal controls over financial reporting
which are reasonably likely to adversely affect the company’s ability to record, process, summarize and report financial
information; and
(b) Any fraud, whether or not material, that involves management or other employees who have a significant role in the
company’s internal controls over financial reporting.
Date: April 26, 2018
By: /s/ Jason Wang
Name: Jason Wang
Title: Co-president and Director

Exhibit 12.2
CERTIFICATION OF OUR CO-PRESIDENT
I, Shan-Chieh Chien, certify that:
1. I have reviewed this annual report on Form 20-F of United Microelectronics Corporation;
2. Based on my knowledge, this report does not contain any untrue statement of a material fact or omit to state a material
fact necessary to make the statements made, in light of the circumstances under which such statements were made, not
misleading with respect to the period covered by this report;
3. Based on my knowledge, the financial statements, and other financial information included in this report, fairly present in
all material respects the financial condition, results of operations and cash flows of the company as of, and for, the periods
presented in this report;
4. The company’s other certifying officer and I are responsible for establishing and maintaining disclosure controls and
procedures (as defined in Exchange Act Rules 13a-15(e) and 15d-15(e)) and internal control over financial reporting (as
defined in Exchange Act Rules 13a-15(f) and 15d-15(f)) for the company and have:
(a) Designed such disclosure controls and procedures, or caused such disclosure controls and procedures to be designed under
our supervision, to ensure that material information relating to the company, including its consolidated subsidiaries, is made
known to us by others within those entities, particularly during the period in which this report is being prepared;
(b) Designed such internal control over financial reporting, or caused such internal control over financial reporting to be
designed under our supervision, to provide reasonable assurance regarding the reliability of financial reporting and the
preparation of financial statements for external purposes in accordance with generally accepted accounting principles;
(c) Evaluated the effectiveness of the company’s disclosure controls and procedures and presented in this report our conclusions
about the effectiveness of the disclosure controls and procedures, as of the end of the period covered by this report based on
such evaluation; and
(d) Disclosed in this report any change in the company’s internal control over financial reporting that occurred during the period
covered by this report that has materially affected, or is reasonably likely to materially affect, the company’s internal control
over financial reporting; and
5. The company’s other certifying officer and I have disclosed, based on our most recent evaluation of internal control over
financial reporting, to the company’s auditors and the audit committee of the company’s board of directors (or persons
performing the equivalent functions):
(a) All significant deficiencies and material weaknesses in the design or operation of internal controls over financial reporting
which are reasonably likely to adversely affect the company’s ability to record, process, summarize and report financial
information; and
(b) Any fraud, whether or not material, that involves management or other employees who have a significant role in the
company’s internal controls over financial reporting.
Date: April 26, 2018
By: /s/ Shan-Chieh Chien
Name: Shan-Chieh Chien
Title: Co-president and Director

Exhibit 12.3
CERTIFICATION OF OUR CHIEF FINANCIAL OFFICER
I, Chitung Liu, certify that:
1. I have reviewed this annual report on Form 20-F of United Microelectronics Corporation;
2. Based on my knowledge, this report does not contain any untrue statement of a material fact or omit to state a material
fact necessary to make the statements made, in light of the circumstances under which such statements were made, not
misleading with respect to the period covered by this report;
3. Based on my knowledge, the financial statements, and other financial information included in this report, fairly present in
all material respects the financial condition, results of operations and cash flows of the company as of, and for, the periods
presented in this report;
4. The company’s other certifying officer and I are responsible for establishing and maintaining disclosure controls and
procedures (as defined in Exchange Act Rules 13a-15(e) and 15d-15(e)) and internal control over financial reporting (as
defined in Exchange Act Rules 13a-15(f) and 15d-15(f)) for the company and have:
(a) Designed such disclosure controls and procedures, or caused such disclosure controls and procedures to be designed under
our supervision, to ensure that material information relating to the company, including its consolidated subsidiaries, is made
known to us by others within those entities, particularly during the period in which this report is being prepared;
(b) Designed such internal control over financial reporting, or caused such internal control over financial reporting to be
designed under our supervision, to provide reasonable assurance regarding the reliability of financial reporting and the
preparation of financial statements for external purposes in accordance with generally accepted accounting principles;
(c) Evaluated the effectiveness of the company’s disclosure controls and procedures and presented in this report our conclusions
about the effectiveness of the disclosure controls and procedures, as of the end of the period covered by this report based on
such evaluation; and
(d) Disclosed in this report any change in the company’s internal control over financial reporting that occurred during the period
covered by this report that has materially affected, or is reasonably likely to materially affect, the company’s internal control
over financial reporting; and
5. The company’s other certifying officer and I have disclosed, based on our most recent evaluation of internal control over
financial reporting, to the company’s auditors and the audit committee of the company’s board of directors (or persons
performing the equivalent functions):
(a) All significant deficiencies and material weaknesses in the design or operation of internal controls over financial reporting
which are reasonably likely to adversely affect the company’s ability to record, process, summarize and report financial
information; and
(b) Any fraud, whether or not material, that involves management or other employees who have a significant role in the
company’s internal controls over financial reporting.
Date: April 26, 2018
By: /s/ Chitung Liu
Name: Chitung Liu
Title: Director, Chief Financial Officer and Vice President

Exhibit 13.1
CERTIFICATION OF PERIODIC FINANCIAL REPORT
Pursuant to 18 U.S.C. Section 1350
In connection with the Annual Report of United Microelectronics Corporation, or the Company, on Form 20-F for the fiscal year
ended December 31, 2017 as filed with the Securities and Exchange Commission on the date hereof, or the Report, I, Jason Wang,
Co-president of the Company, hereby certify, pursuant to 18 U.S.C.§ 1350, as adopted pursuant to Section 906 of the Sarbanes-Oxley
Act of 2002, to the best of my knowledge, that:
1. The Report fully complies with the requirements of Section 13(a) or 15(d) of the Securities Exchange Act of 1934; and
2. The information contained in the Report fairly presents, in all material respects, the financial condition and results of
operations of the Company.
Date: April 26, 2018
By: /s/ Jason Wang
Name: Jason Wang
Title: Co-president and Director
* A signed original of this written statement required by Section 906 of the Sarbanes-Oxley Act of 2002 has been provided to us and
will be retained by us and furnished to the Securities and Exchange Commission or its staff upon request.

Exhibit 13.2
CERTIFICATION OF PERIODIC FINANCIAL REPORT
Pursuant to 18 U.S.C. Section 1350
In connection with the Annual Report of United Microelectronics Corporation, or the Company, on Form 20-F for the fiscal year
ended December 31, 2017 as filed with the Securities and Exchange Commission on the date hereof, or the Report, I, Shan-Chieh
Chien, Co-president of the Company, hereby certify, pursuant to 18 U.S.C.§ 1350, as adopted pursuant to Section 906 of the Sarbanes-
Oxley Act of 2002, to the best of my knowledge, that:
1. The Report fully complies with the requirements of Section 13(a) or 15(d) of the Securities Exchange Act of 1934; and
2. The information contained in the Report fairly presents, in all material respects, the financial condition and results of
operations of the Company.
Date: April 26, 2018
By: /s/ Shan-Chieh Chien
Name: Shan-Chieh Chien
Title: Co-president and Director
* A signed original of this written statement required by Section 906 of the Sarbanes-Oxley Act of 2002 has been provided to us and
will be retained by us and furnished to the Securities and Exchange Commission or its staff upon request.

Exhibit 13.3
CERTIFICATION OF PERIODIC FINANCIAL REPORT
Pursuant to 18 U.S.C. Section 1350
In connection with the Annual Report of United Microelectronics Corporation, or the Company, on Form 20-F for the fiscal year
ended December 31, 2017 as filed with the Securities and Exchange Commission on the date hereof, or the Report, I, Chitung Liu,
Chief Financial Officer of the Company, hereby certify, pursuant to 18 U.S.C.§ 1350, as adopted pursuant to Section 906 of the
Sarbanes-Oxley Act of 2002, to the best of my knowledge, that:
1. The Report fully complies with the requirements of Section 13(a) or 15(d) of the Securities Exchange Act of 1934; and
2. The information contained in the Report fairly presents, in all material respects, the financial condition and results of
operations of the Company.
Date: April 26, 2018
By: /s/ Chitung Liu
Name: Chitung Liu
Title: Director, Chief Financial Officer and Vice President
* A signed original of this written statement required by Section 906 of the Sarbanes-Oxley Act of 2002 has been provided to us and
will be retained by us and furnished to the Securities and Exchange Commission or its staff upon request.

Exhibit 15.1
CONSENT OF INDEPENDENT REGISTERED PUBLIC ACCOUNTING FIRM
We consent to the incorporation by reference in the following Registration Statements pertaining to the employee stock option
plans of United Microelectronics Corporation:
1. Registration Statement (Form S-8 No. 333-102605) pertaining to the Employee Stock Option Plan,
2. Registration Statement (Form S-8 No. 333-126889) pertaining to the Employee Stock Option Plan and the 2004 Employee
Stock Option Plan, and
3. Registration Statement (Form S-8 No. 333-142809) pertaining to the 2004 Employee Stock Option Plan and 2005 Employee
Stock Option Plan
of our reports dated April 26, 2018, with respect to the consolidated financial statements of United Microelectronics Corporation and
the effectiveness of internal control over financial reporting of United Microelectronics Corporation, included in its Annual Report
(Form 20-F) of United Microelectronics Corporation for the year ended December 31, 2017.
/s/ Ernst & Young
Taipei, Taiwan,
Republic of China
April 26, 2018