FORM 10-Q - Glatfelterglatfelter.com/Files/about_us/investor_relations/FORM_10Q_06_30... · FORM...
39
UNITED STATES SECURITIES AND EXCHANGE COMMISSION WASHINGTON, D.C. 20549 FORM 10-Q For the quarterly period ended June 30, 2012 or For the transition period from to 96 South George Street, Suite 520 York, Pennsylvania 17401 (Address of principal executive offices) (717) 225-4711 (Registrant’s telephone number, including area code) N/A (Former name or former address, if changed since last report) Indicate by check mark whether the registrant (1) has filed all reports required to be filed by Section 13 or 15(d) of the Securities Exchange Act of 1934 during the preceding 12 months (or for such shorter period that the registrant was required to file such reports), and (2) has been subject to such filing requirements for at the past 90 days. Yes No . Indicate by check mark whether the registrant has submitted electronically and posted on its corporate Web site, if any, every Interactive Data File required to be submitted and posted pursuant to Rule 405 of Regulation S-T (§232.405 of this chapter) during the preceding 12 months (or for such shorter period that the registrant was required to submit and post such files). Yes No . Indicate by check mark whether the registrant is a large accelerated filer, an accelerated filer, a non-accelerated filer, or a small reporting company. See the definitions of “large accelerated filer”, “accelerated filer” and “smaller reporting company” in Rule 12b-2 of the Exchange Act. Indicate by check mark whether the registrant is a shell company (as defined in Rule 12b-2 of the Exchange Act) Yes No . Common Stock outstanding on July 23, 2012 totaled 42,660,371 shares. Quarterly Report pursuant to Section 13 or 15(d) of the Securities Exchange Act of 1934 Transition Report Pursuant to Section 13 or 15(d) of the Securities Exchange Act of 1934 Commission file number Exact name of registrant as specified in its charter IRS Employer Identification No. State or other jurisdiction of incorporation or organization 1-03560 P. H. Glatfelter Company 23-0628360 Pennsylvania Large accelerated filer Accelerated filer Non-accelerated filer (Do not check if a smaller reporting company). Small reporting company
Transcript of FORM 10-Q - Glatfelterglatfelter.com/Files/about_us/investor_relations/FORM_10Q_06_30... · FORM...

UNITED STATES SECURITIES AND EXCHANGE COMMISSION
WASHINGTON, D.C. 20549
FORM 10-Q
For the quarterly period ended June 30, 2012
or
For the transition period from to
96 South George Street, Suite 520 York, Pennsylvania 17401
(Address of principal executive offices)
(717) 225-4711 (Registrant’s telephone number, including area code)
N/A (Former name or former address, if changed since last report)
Indicate by check mark whether the registrant (1) has filed all reports required to be filed by Section 13 or 15(d) of the Securities Exchange Act of 1934 during the preceding 12 months (or for such shorter period that the registrant was required to file such reports), and (2) has been subject to such filing requirements for at the past 90 days. Yes ⌧ No �.
Indicate by check mark whether the registrant has submitted electronically and posted on its corporate Web site, if any, every Interactive Data File required to be submitted and posted pursuant to Rule 405 of Regulation S-T (§232.405 of this chapter) during the preceding 12 months (or for such shorter period that the registrant was required to submit and post such files). Yes ⌧ No �.
Indicate by check mark whether the registrant is a large accelerated filer, an accelerated filer, a non-accelerated filer, or a small reporting company. See the definitions of “large accelerated filer”, “accelerated filer” and “smaller reporting company” in Rule 12b-2 of the Exchange Act.
Indicate by check mark whether the registrant is a shell company (as defined in Rule 12b-2 of the Exchange Act) Yes � No ⌧.
Common Stock outstanding on July 23, 2012 totaled 42,660,371 shares.
⌧ Quarterly Report pursuant to Section 13 or 15(d) of the Securities Exchange Act of 1934
� Transition Report Pursuant to Section 13 or 15(d) of the Securities Exchange Act of 1934
Commission file number
Exact name of registrant as specified in its charter
IRS EmployerIdentification No.
State or other jurisdiction ofincorporation or organization
1-03560 P. H. Glatfelter Company 23-0628360 Pennsylvania
Large accelerated filer � Accelerated filer ⌧
Non-accelerated filer � (Do not check if a smaller reporting company). Small reporting company �

P. H. GLATFELTER COMPANY AND SUBSIDIARIES
REPORT ON FORM 10-Q For the QUARTERLY PERIOD ENDED
JUNE 30, 2012
Table of Contents Page
PART I – FINANCIAL INFORMATION
Item 1 Financial Statements
Condensed Consolidated Statements of Income for the three months and six months ended June 30, 2012 and 2011 (unaudited) 2
Condensed Consolidated Statements of Comprehensive Income for the three months and six months ended June 30, 2012 and 2011 (unaudited) 3
Condensed Consolidated Balance Sheets as of June 30, 2012 and December 31, 2011 (unaudited) 4
Condensed Consolidated Statements of Cash Flows for the six months ended June 30, 2012 and 2011 (unaudited) 5
Notes to Condensed Consolidated Financial Statements (unaudited) 6
Item 2 Management’s Discussion and Analysis of Financial Condition and Results of Operations 23
Item 3 Quantitative and Qualitative Disclosures About Market Risks 31
Item 4 Controls and Procedures 32
PART II – OTHER INFORMATION
Item 6 Exhibits 32
SIGNATURES 33
PART I Item 1 – Financial Statements
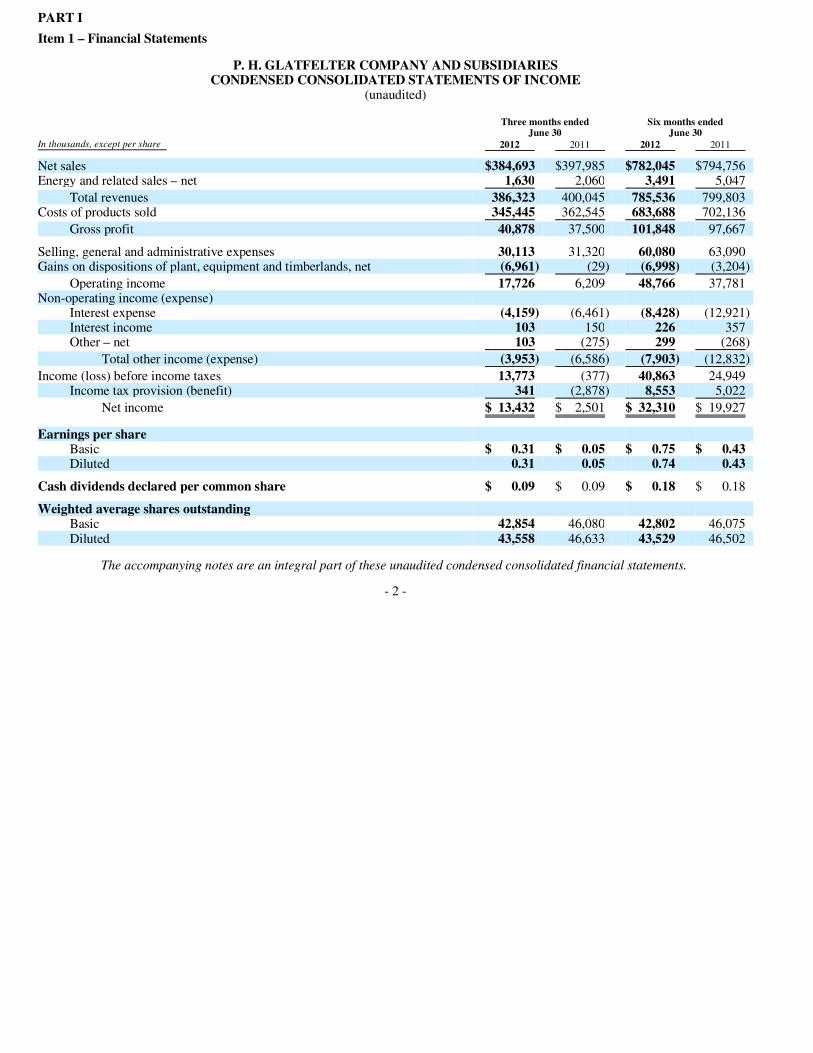
P. H. GLATFELTER COMPANY AND SUBSIDIARIES CONDENSED CONSOLIDATED STATEMENTS OF INCOME
(unaudited)
The accompanying notes are an integral part of these unaudited condensed consolidated financial statements.
- 2 -
Three months ended
June 30 Six months ended
June 30 In thousands, except per share 2012 2011 2012 2011
Net sales $384,693 $397,985 $782,045 $794,756 Energy and related sales – net 1,630 2,060 3,491 5,047
Total revenues 386,323 400,045 785,536 799,803 Costs of products sold 345,445 362,545 683,688 702,136
Gross profit 40,878 37,500 101,848 97,667
Selling, general and administrative expenses 30,113 31,320 60,080 63,090 Gains on dispositions of plant, equipment and timberlands, net (6,961) (29) (6,998) (3,204)
Operating income 17,726 6,209 48,766 37,781 Non-operating income (expense)
Interest expense (4,159) (6,461) (8,428) (12,921) Interest income 103 150 226 357 Other – net 103 (275) 299 (268)
Total other income (expense) (3,953) (6,586) (7,903) (12,832)
Income (loss) before income taxes 13,773 (377) 40,863 24,949 Income tax provision (benefit) 341 (2,878) 8,553 5,022
Net income $ 13,432 $ 2,501 $ 32,310 $ 19,927
Earnings per share
Basic $ 0.31 $ 0.05 $ 0.75 $ 0.43 Diluted 0.31 0.05 0.74 0.43
Cash dividends declared per common share $ 0.09 $ 0.09 $ 0.18 $ 0.18
Weighted average shares outstanding
Basic 42,854 46,080 42,802 46,075 Diluted 43,558 46,633 43,529 46,502
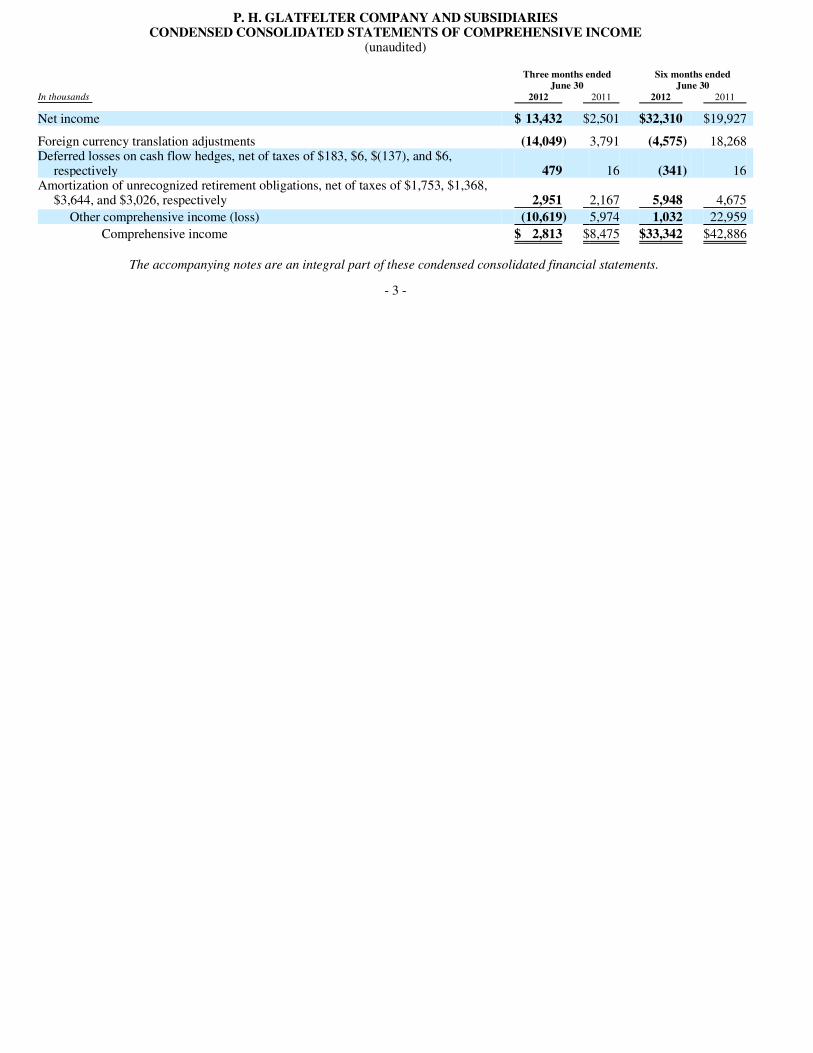
P. H. GLATFELTER COMPANY AND SUBSIDIARIES CONDENSED CONSOLIDATED STATEMENTS OF COMPREHENSIVE INCOME
(unaudited)
The accompanying notes are an integral part of these condensed consolidated financial statements.
- 3 -
Three months ended
June 30 Six months ended
June 30 In thousands 2012 2011 2012 2011
Net income $ 13,432 $2,501 $32,310 $19,927
Foreign currency translation adjustments (14,049) 3,791 (4,575) 18,268 Deferred losses on cash flow hedges, net of taxes of $183, $6, $(137), and $6,
respectively 479 16 (341) 16 Amortization of unrecognized retirement obligations, net of taxes of $1,753, $1,368,
$3,644, and $3,026, respectively 2,951 2,167 5,948 4,675
Other comprehensive income (loss) (10,619) 5,974 1,032 22,959
Comprehensive income $ 2,813 $8,475 $33,342 $42,886

P. H. GLATFELTER COMPANY AND SUBSIDIARIES CONDENSED CONSOLIDATED BALANCE SHEETS
(unaudited)
The accompanying notes are an integral part of these condensed consolidated financial statements.
- 4 -
In thousands June 30
2012 December 31
2011
Assets Current assets
Cash and cash equivalents $ 23,437 $ 38,277 Accounts receivable – net 146,819 135,412 Inventories 227,128 206,707 Prepaid expenses and other current assets 47,735 42,017
Total current assets 445,119 422,413
Plant, equipment and timberlands – net 595,055 601,950
Other assets 114,610 112,562
Total assets $1,154,784 $1,136,925
Liabilities and Shareholders’ Equity
Current liabilities
Accounts payable $ 118,052 $ 109,490 Dividends payable 3,894 3,902 Environmental liabilities 250 250 Other current liabilities 106,443 97,598
Total current liabilities 228,639 211,240
Long-term debt 218,000 227,000
Deferred income taxes 54,328 69,791
Other long-term liabilities 137,776 138,490
Total liabilities 638,743 646,521
Commitments and contingencies — —
Shareholders’ equity Common stock 544 544 Capital in excess of par value 51,826 51,477 Retained earnings 800,349 775,825 Accumulated other comprehensive loss (165,709) (166,741)
687,010 661,105 Less cost of common stock in treasury (170,969) (170,701)
Total shareholders’ equity 516,041 490,404
Total liabilities and shareholders’ equity $1,154,784 $1,136,925

P. H. GLATFELTER COMPANY AND SUBSIDIARIES CONDENSED CONSOLIDATED STATEMENTS OF CASH FLOWS
(unaudited)
The accompanying notes are an integral part of these unaudited condensed consolidated financial statements.
- 5 -
Six months ended
June 30 In thousands 2012 2011
Operating activities Net income $ 32,310 $ 19,927 Adjustments to reconcile to net cash provided by operations:
Depreciation, depletion and amortization 34,053 34,257 Amortization of debt issue costs and original issue discount 608 1,331 Pension expense, net of unfunded benefits paid 5,141 3,733 Deferred income tax provision (benefit) (26,040) 9,916 Gains on dispositions of plant, equipment and timberlands, net (6,998) (3,204) Share-based compensation 3,336 2,860 Cellulosic biofuel and alternative fuel mixture credits — 17,833
Change in operating assets and liabilities
Accounts receivable (12,779) (18,426) Inventories (21,166) (16,647) Prepaid and other current assets 2,458 (8,685) Accounts payable 9,825 18,263 Environmental matters (26) — Accruals and other current liabilities 6,948 (4,928) Other 862 (7,917)
Net cash provided by operating activities 28,532 48,313
Investing activities
Expenditures for purchases of plant, equipment and timberlands (30,587) (27,877) Proceeds from disposals of plant, equipment and timberlands, net 7,189 3,440
Net cash used by investing activities (23,398) (24,437)
Financing activities
Net repayments of revolving credit facility (9,000) — Net repayments of other short term debt — (798) Repurchase of common stock (3,565) (4,369) Payments of dividends (7,800) (8,396) Proceeds from stock options exercised and other 629 117
Net cash used by financing activities (19,736) (13,446)
Effect of exchange rate changes on cash (238) 2,078
Net (decrease) increase in cash and cash equivalents (14,840) 12,508 Cash and cash equivalents at the beginning of period 38,277 95,788
Cash and cash equivalents at the end of period $ 23,437 $108,296
Supplemental cash flow information
Cash paid (received) for
Interest, net of amounts capitalized $ 7,625 $ 11,551 Income taxes 22,214 (10,906)

P. H. GLATFELTER COMPANY AND SUBSIDIARIES NOTES TO CONDENSED CONSOLIDATED FINANCIAL STATEMENTS
(unaudited)
- 6 -
P. H. Glatfelter Company and subsidiaries (“Glatfelter”) is a manufacturer of specialty papers and fiber-based engineered materials. Headquartered in York, Pennsylvania, our manufacturing facilities are located in Spring Grove, Pennsylvania; Chillicothe and Freemont, Ohio; Gatineau, Quebec, Canada; Gloucestershire (Lydney), England; Caerphilly, Wales; Gernsbach and Falkenhagen, Germany; Scaër, France; and the Philippines. Our products are marketed worldwide, either through wholesale merchants, brokers and agents or directly to customers.
Basis of Presentation The unaudited condensed consolidated financial statements (“financial statements”) include the accounts of Glatfelter and its wholly owned subsidiaries. All intercompany balances and transactions have been eliminated.
We prepared these financial statements in accordance with accounting principles generally accepted in the United States of America (“generally accepted accounting principles” or “GAAP”). In our opinion, the financial statements reflect all normal, recurring adjustments needed to present fairly our results for the interim periods. When preparing these financial statements, we have assumed that you have read the audited consolidated financial statements included in our 2011 Annual Report on Form 10-K (“2011 Form 10-K”).
Accounting Estimates The preparation of financial statements in conformity with GAAP requires management to make estimates and assumptions that affect the reported amounts of assets and liabilities and disclosures of contingencies as of the balance sheet date and the reported amounts of revenues and expenses during the reporting period. Management believes the estimates and assumptions used in the preparation of these financial statements are reasonable, based upon currently available facts and known circumstances, but recognizes that actual results may differ from those estimates and assumptions.
1. ORGANIZATION
2. ACCOUNTING POLICIES
Recently Issued Accounting Pronouncements In June 2011, the Financial Accounting Standards Board (“FASB”) issued Accounting Standards Update (“ASU”) No. 2011-05, “Presentation of Comprehensive Income.” This ASU is designed to improve the comparability and transparency of other comprehensive income components. The guidance provides an option to present total comprehensive income, the components of net income and the components of other comprehensive income in a single continuous statement or two separate but consecutive statements. This ASU eliminates the option to present other comprehensive income components as part of the statement of changes in shareholders’ equity. The provisions of this ASU are required to be applied retrospectively. We have adopted this standard by presenting a separate consecutive statement of comprehensive income beginning in the first quarter of 2012.
In September 2011, the FASB updated ASC 350, Intangibles – Goodwill and Other to provide an entity the option, when evaluating goodwill and other assets for possible impairment, to first assess qualitative factors to determine whether the existence of events or circumstances leads to a determination that it is more likely than not that the fair value of a reporting unit is less than its carrying amount. If, after completing this assessment, an entity determines it is not more likely than not that the fair value of a reporting unit is less than its carrying amount, then performing the two-step impairment test is unnecessary. This update became effective for us beginning January 1, 2012.
In May 2011, the FASB issued ASU 2011-04, “Fair Value Measurement (Topic 820): Amendments to Achieve Common Fair Value Measurement and Disclosure Requirements in U.S. GAAP and IFRS,” which provides common requirements for measuring fair value and disclosing information about fair value measurements in accordance with U.S. GAAP and International Financial Reporting Standards. We adopted this standard in the first quarter of 2012 and it did not have a material impact on us.

- 7 -
Sales of timberlands and other assets in the first six months of 2012 and 2011 are summarized in the following table:
The 2012 timberland sales were all completed in the second quarter and the 2011 timberland sales were all completed in the first quarter. We received cash proceeds for all sales summarized above.
The following table sets forth the details of basic and diluted earnings per share (EPS):
3. GAINS (LOSSES) ON DISPOSITIONS OF PLANT, EQUIPMENT AND TIMBERLANDS
Dollars in thousands Acres Proceeds Gain
2012
Timberlands 3,345 $ 6,584 $6,415 Other — 605 583
$ 7,189 $6,998
2011
Timberlands 717 $ 3,373 $3,158 Other — 67 46
$ 3,440 $3,204
4. EARNINGS PER SHARE
Three months ended
June 30 In thousands, except per share 2012 2011
Net income $13,432 $ 2,501
Weighted average common shares outstanding used in basic EPS 42,854 46,080
Common shares issuable upon exercise of dilutive stock options and PSAs / RSUs 704 553
Weighted average common shares outstanding and common share equivalents used in diluted EPS 43,558 46,633
Earnings per share
Basic $ 0.31 $ 0.05 Diluted 0.31 0.05
The following table sets forth potential common shares outstanding for stock options and restricted stock units that were not included in the computation of diluted EPS for the period indicated, because their effect would be anti-dilutive:
Income taxes are recognized for the amount of taxes payable or refundable for the current year and deferred tax liabilities and assets for the future tax consequences of events that have been recognized in our consolidated financial statements or tax returns. The effects of income taxes are measured based on enacted tax laws and rates.
As of June 30, 2012 and December 31, 2011, we had $30.5 million and $29.7 million, respectively, of gross unrecognized tax benefits. As of June 30, 2012, if such benefits were to be recognized, approximately $30.5 million would be recorded as a component of income tax expense, thereby affecting our effective tax rate.
We, or one of our subsidiaries, file income tax returns with the United States Internal Revenue Service, as well as various state and foreign authorities.
Six months ended
June 30 In thousands, except per share 2012 2011
Net income $32,310 $19,927
Weighted average common shares outstanding used in basic EPS 42,802 46,075
Common shares issuable upon exercise of dilutive stock options and PSAs / RSUs 727 427
Weighted average common shares outstanding and common share equivalents used in diluted EPS 43,529 46,502
Earnings per share
Basic $ 0.75 $ 0.43 Diluted 0.74 0.43
2012 2011
Three months ended June 30 558,870 613,900 Six months ended June 30 558,870 1,321,397
5. INCOME TAXES

- 8 -
The following table summarizes, by major jurisdiction, tax years that remain subject to examination:
The amount of income taxes we pay is subject to ongoing audits by federal, state and foreign tax authorities, which often result in proposed assessments. Management performs a comprehensive review of its global tax positions on a quarterly basis and accrues amounts for uncertain tax positions. Based on these reviews and the result of discussions and resolutions of matters with certain tax authorities and the closure of tax years subject to tax audit, reserves are adjusted as necessary. However, future results may include favorable or unfavorable adjustments to our estimated tax liabilities in the period the assessments are determined or resolved or as such statutes are closed. Due to potential for resolution of federal, state and foreign examinations, and the expiration of various statutes of limitation, it is reasonably possible our gross unrecognized tax benefits balance may decrease within the next twelve months by a range of zero to $6.0 million. Substantially all of this range relates to tax positions taken in the U.S. and in the U.K.
We recognize interest and penalties related to uncertain tax positions as income tax expense. During the first half of the year, we recognized interest expense of $0.4 million. For the second quarter of 2012, we recognized interest expense of $0.2 million. For the first half of 2011 and the second quarter of 2011, we recognized a net reduction of interest expense of $2.0 million and $2.3 million, respectively. As of June 30, 2012, accrued interest payable was $2.1 million, and as of December 31, 2011, accrued interest payable was $1.7 million. We did not record any penalties associated with uncertain tax positions during the second quarters of 2012 or 2011.
In March 2010, we were approved by the Internal Revenue Service to be registered as a producer of cellulosic biofuel under the Internal Revenue Code. The cellulosic biofuel credit was equal to $1.01 per gallon of black liquor produced in operations during 2009. In the second quarter of 2012, we made the decision to convert a portion of the previously utilized refundable alternative fuel mixture credit, which was equal to $0.50 per gallon, to the
Open Tax Years
Jurisdiction Examinations not
yet initiated Examination in
progress
United States
Federal 2008 - 2011 N/AState 2005 - 2011 2004, 2006, 2008, 2009
Canada (1) 2007 - 2011 2007 - 2010Germany (1) 2007 - 2011 N/AFrance 2009 - 2011 N/AUnited Kingdom 2008 - 2011 N/APhilippines 2010 - 2011 2009 - 2010
(1) – includes provincial or similar local jurisdictions, as applicable
non-refundable cellulosic biofuel credit and intend to amend our 2009 federal income tax return to claim the credit for a portion of the black liquor gallons produced in 2009. The conversion to the cellulosic biofuel credit resulted in a net benefit for income taxes in the second quarter of 2012 of $4.4 million. The amount of cellulosic biofuel credits recognized is based on numerous assumptions and estimates about future taxable income. Although we believe our assumptions are reasonable, actual results may differ from these assumptions and estimates and such differences may have a significant impact on the amount of credits recognized. In addition, while we do not intend to convert additional credits, if facts and circumstances change, we could further amend our 2009 tax return and claim additional credits.
The P. H. Glatfelter Amended and Restated Long Term Incentive Plan (the “LTIP”) provides for the issuance of up to 5,500,000 shares of Glatfelter common stock to eligible participants in the form of restricted stock units, restricted stock awards, non-qualified stock options, performance shares, incentive stock options and performance units. Since the approval of the LTIP, we have issued to eligible participants restricted stock units, performance share awards and stock only stock appreciation rights (“SOSARs”).
Restricted Stock Units (“RSUs”) and Performance Share Awards (“PSAs”) Awards of RSUs and PSAs are made under our LTIP. The RSUs vest based solely on the passage of time, generally on a graded scale over a three, four, and five-year period. PSAs were first issued in March 2011 and cliff vest three years from the grant date assuming the achievement of predetermined, three-year cumulative performance targets. The performance measures include a minimum, target and maximum performance level providing the grantees an opportunity to receive more or less shares than target depending on actual financial performance. For both RSUs and PSAs, the grant date fair value of the awards is used to determine the amount of expense to be recognized over the applicable service period. Settlement of RSUs and PSAs will be made in shares of our common stock.
The following table summarizes RSU and PSA activity during the first six months of the indicated periods:
6. STOCK-BASED COMPENSATION
Units 2012 2011
Beginning balance 788,088 579,801 Granted 206,278 244,754 Forfeited (22,167) (12,539) Shares delivered (94,830) (14,490)
Ending balance 877,369 797,526

- 9 -
The amount granted in 2012 and 2011 includes PSAs of 161,083 units and 96,410 units, respectively, exclusive of reinvested dividends. The following table sets forth aggregate RSU and PSA compensation expense for the periods indicated:
Stock Only Stock Appreciation Rights (SOSARs) Under terms of the SOSAR, the recipients receive the right to a payment in the form of shares of common stock equal to the difference, if any, in the fair market value of one share of common stock at the time of exercising the SOSAR and the strike price. The SOSARs vest ratably over a three year period and have a term of ten years.
The following table sets forth information related to SOSARS for the first six months of the indicated period:
The following table sets forth SOSAR compensation expense for the periods indicated:
June 30In thousands 2012 2011
Three months ended $ 703 $ 541 Six months ended 1,279 1,007
2012 2011
SOSARS Shares
Wtd AvgExercise
Price Shares
Wtd AvgExercise
PriceOutstanding at Jan. 1, 2,298,288 $ 12.35 2,061,877 $ 12.28 Granted 356,570 15.55 345,290 12.56 Exercised (65,637) 10.57 — — Canceled / forfeited (10,000) 14.96 (102,970) 12.55
Outstanding at Jun. 30, 2,579,221 $ 12.82 2,304,197 $ 12.31
SOSAR Grants Weighted average grant date
fair value per share $ 4.93 $ 4.09 Aggregate grant date fair value
(in thousands) $ 1,757 $ 1,412 Black-Scholes assumptions
Dividend yield 2.32% 2.87% Risk free rate of return 1.02% 2.55% Volatility 41.49% 41.91% Expected life 6 yrs 6 yrs
June 30 In thousands 2012 2011
Three months ended $372 $411 Six months ended 726 880
The following table provides information with respect to the net periodic costs of our pension and post retirement medical benefit plans.
7. RETIREMENT PLANS AND OTHER POST-RETIREMENT BENEFITS
Three months ended
June 30 In thousands 2012 2011
Pension Benefits
Service cost $ 2,625 $ 2,338 Interest cost 5,762 6,033 Expected return on plan assets (10,547) (10,449) Amortization of prior service
cost 614 637 Amortization of unrecognized
loss 4,187 3,082
Net periodic benefit cost $ 2,641 $ 1,641
Other Benefits
Service cost $ 708 $ 693 Interest cost 607 691 Expected return on plan assets (113) (130) Amortization of prior service
cost (235) (306) Amortization of unrecognized
loss 152 183
Net periodic benefit cost $ 1,119 $ 1,131
Six months ended
June 30 In thousands 2012 2011
Pension Benefits
Service cost $ 5,556 $ 4,943 Interest cost 11,534 12,097 Expected return on plan assets (21,110) (20,914) Amortization of prior service
cost 1,227 1,283 Amortization of unrecognized
loss 8,510 6,626
Net periodic benefit cost $ 5,717 $ 4,035
Other Benefits
Service cost $ 1,418 $ 1,453 Interest cost 1,216 1,408 Expected return on plan assets (226) (260) Amortization of prior service
cost (469) (611) Amortization of unrecognized
loss 331 441
Net periodic benefit cost $ 2,270 $ 2,431

- 10 -
Inventories, net of reserves, were as follows:
Long-term debt is summarized as follows:
On November 21, 2011, we entered into an amendment to our revolving credit agreement with a consortium of banks (the “Revolving Credit Facility”) which increased the amount available for borrowing to $350 million, extended the maturity of the facility to November 21, 2016, and instituted a lower interest rate pricing grid.
For all U.S. dollar denominated borrowings under the Revolving Credit Facility, the borrowing rate is, at our option, (a) the bank’s base rate which is equal to the greater of i) the prime rate; ii) the federal funds rate plus 50 basis points plus an applicable spread ranging from 25 basis points to 125 basis points based on our corporate credit ratings determined by Standard & Poor’s Rating Services and Moody’s Investor Service, Inc. (the “Corporate Credit Rating”); or iii) the daily Euro-rate plus 100 basis points; or (b) the daily Euro-rate plus an applicable margin ranging from 125 basis points to 225 basis points based on the Corporate Credit Rating. For non-US dollar denominated borrowings, interest is based on (b) above.
8. INVENTORIES
In thousands Jun. 30,
2012 Dec. 31,
2011
Raw materials $ 65,624 $ 57,547 In-process and finished 103,622 93,096 Supplies 57,882 56,064
Total $227,128 $206,707
9. LONG-TERM DEBT
In thousands Jun. 30,
2012 Dec. 31,
2011
Revolving credit facility, due Nov. 2016 $ 18,000 $ 27,000
7 / % Notes, due May 2016 200,000 200,000
Total long-term debt 218,000 227,000 Less current portion — —
Long-term debt, net of current portion $218,000 $227,000
1 8
The Revolving Credit Facility contains a number of customary covenants for financings of this type that, among other things, restrict our ability to dispose of or create liens on assets, incur additional indebtedness, repay other indebtedness, limits certain intercompany financing arrangements, make acquisitions and engage in mergers or consolidations. We are also required to comply with specified financial tests and ratios including: i) maximum net debt to earnings before interest, taxes, depreciation and amortization (“EBITDA”) ratio; ii) a consolidated EBITDA to interest expense ratio; and iii) beginning December 31, 2015, a minimum liquidity ratio. A breach of these requirements would give rise to certain remedies under the Revolving Credit Facility, among which are the termination of the agreement and accelerated repayment of the outstanding borrowings plus accrued and unpaid interest under the credit facility.
On April 28, 2006 we completed an offering of $200.0 million aggregate principal amount of our 7 / % Senior Notes due May 2016 (“7 / % Notes”). Net proceeds from this offering totaled approximately $196.4 million, after deducting the commissions and other fees and expenses relating to the offering.
Interest on the 7 / % Notes is payable semiannually in arrears on May 1 and November 1.
The 7 / % Notes contain cross default provisions that could result in all such notes becoming due and payable in the event of a failure to repay debt outstanding under the Revolving Credit Agreement at maturity or a default under the Revolving Credit Agreement that accelerates the debt outstanding thereunder. As of June 30, 2012, we met all of the requirements of our debt covenants.
As of June 30, 2012 and December 31, 2011, we had $4.6 million, respectively, of letters of credit issued to us by certain financial institutions. Such letters of credit reduce amounts available under our revolving credit facility. The letters of credit primarily provide financial assurances for the benefit of certain state workers compensation insurance agencies in conjunction with our self-insurance program. We bear the credit risk on this amount to the extent that we do not comply with the provisions of certain agreements. No amounts are outstanding under the letters of credit.
1 81 8
1 8
1 8

- 11 -
During 2008, we recorded $11.5 million representing the estimated fair value of asset retirement obligations related to the legal requirement to close several lagoons at the Spring Grove, PA facility. Historically, the lagoons were used to dispose of residual waste material. Closure of the lagoons will be accomplished by installing a non-permeable liner which will be covered with soil to construct the required cap over the lagoons. The amount referred to above, in addition to upward revisions to the original estimate, was accrued with a corresponding increase in the carrying value of the property, equipment and timberlands caption on the consolidated balance sheet. The amount capitalized is being amortized as a charge to operations on the straight-line basis over the expected closure period. Following is a summary of activity recorded during the first six months of 2012 and 2011:
At June 30, 2012, $3.6 million of the total liability is recorded in the accompanying consolidated balance sheet, under the caption “Other current liabilities” and $5.9 million is recorded under the caption “Other long-term liabilities.”
The amounts reported on the condensed consolidated balance sheets for cash and cash equivalents, accounts receivable and short-term debt approximate fair value. The following table sets forth carrying value and fair value of long-term debt:
As of June 30, 2012, and December 31, 2011, we had $200.0 million of 7 / % fixed rate debt. These bonds are publicly registered, but thinly traded. Accordingly, the values set forth above are based on debt instruments with similar characteristics (Level – 2). The fair value of financial derivatives is set forth below in Note 12.
10. ASSET RETIREMENT OBLIGATION
In thousands 2012 2011
Balance at Jan. 1, $9,679 $9,717 Accretion 244 265 Payments (463) (518)
Balance at Jun. 30, $9,460 $9,464
11. FAIR VALUE OF FINANCIAL INSTRUMENTS
Jun. 30, 2012 Dec. 31, 2011
In thousands Carrying
Value Fair Value Carrying
Value Fair Value
Fixed-rate bonds $200,000 $205,005 $200,000 $204,000 Variable rate
debt 18,000 18,000 27,000 27,000
Total $218,000 $223,005 $227,000 $231,000
1 8
As part of our overall risk management practices, we enter into financial derivatives primarily designed to either i) hedge foreign currency risks associated with forecasted transactions – “cash flow hedges”; or ii) mitigate the impact that changes in currency exchange rates have on intercompany financing transactions and foreign currency denominated receivables and payables – “foreign currency hedges.”
Derivatives Designated as Hedging Instruments – Cash Flow Hedges We use currency forward contracts as cash flow hedges to manage our exposure to fluctuations in the currency exchange rates on certain forecasted production costs expected to be incurred over a maximum of twelve months. Currency forward contracts involve fixing the EUR-USD exchange rate or USD-CAD for delivery of a specified amount of foreign currency on a specified date.
We designate certain currency forward contracts as cash flow hedges of forecasted raw material purchases and certain other identified manufacturing cost with exposure to changes in foreign currency exchange rates. The effective portion of changes in the fair value of derivatives designated and that qualify as cash flow hedges of foreign exchange risk is deferred as a component of accumulated other comprehensive income in the accompanying consolidated balance sheet and is subsequently reclassified into cost of products sold in the period that inventory produced using the hedged transaction affects earnings. The ineffective portion of the change in fair value of the derivative is recognized directly to earnings and reflected in the accompanying consolidated statement of income as non-operating income (expense) under the caption “Other-net.”
We had the following outstanding derivatives that were used to hedge foreign exchange risks associated with forecasted transactions and designated as hedging instruments:
These contracts have maturities of twelve months or less.
Derivatives Not Designated as Hedging Instruments – Foreign Currency Hedges We also enter into forward foreign exchange contracts to mitigate the impact changes in currency exchange rates have on balance sheet
12. FINANCIAL DERIVATIVES AND HEDGING ACTIVITIES
in thousands Jun. 30, 2012 Dec. 31, 2011 Derivative Buy Notional
Sell / Buy
Euro / U.S. dollar 28,279 22,730 U.S. dollar / Canadian dollar 10,973 11,019

- 12 -
monetary assets and liabilities. None of these contracts are designated as hedges for financial accounting purposes and, accordingly, changes in value of the foreign exchange forward contracts and in the offsetting underlying on-balance-sheet transactions are reflected in the accompanying statement of operations under the caption “Other – net.”
These contracts have maturities of one month from the date originally entered into.
Fair Value Measurements The following table summarizes the fair values of derivative instruments as of the periods indicated and the line items in the accompanying consolidated balance sheet where the instruments are recorded:
The amounts set forth in the table above represent the net asset or liability with each counterparty giving effect to rights of offset.
The following table summarizes the amount of income or loss from derivative instruments recognized in our results of operations for the periods indicated and the line items in the accompanying consolidated income statement where the results are recorded:
in thousands Jun. 30, 2012 Dec. 31, 2012 Derivative Sell Notional
Sell / Buy
Euro / U.S. dollar 19,000 25,500 Euro / British Pound 3,000 — U.S. dollar / Canadian dollar 1,500 — Philippine peso / U.S. dollar — 150,000
In thousands Jun. 30,
2012 Dec. 31,
2011Jun. 30,
2012 Dec. 31,
2011
Balance sheet caption
Prepaid and Other
Current Assets
Other Current
Liabilities
Designated as hedging:
Forward foreign currency exchange contracts $ 949 $1,520 $ 37 —
Not designated as hedging:
Forward foreign currency exchange contracts $ 9 $ 338 $ 328 $ 15
The impact on our results of operations of marking-to-market activity not designated as hedging was substantially all offset by the remeasurement of the underlying on-balance sheet item.
The fair value hierarchy consists of three broad levels, which gives the highest priority to unadjusted quoted prices in active markets for identical assets or liabilities (Level 1) and the lowest priority to unobservable inputs (Level 3). The fair values of the foreign exchange forward contracts are considered to be Level 2. Foreign currency forward contracts are valued using foreign currency forward and interest rate curves. The fair value of each contract is determined by comparing the contract rate to the forward rate and discounting to present value. Contracts in a gain position are recorded in the consolidated balance sheet under the caption “Prepaid and other current assets” and the value of contracts in a loss position is recorded under the caption “Other current liabilities.”
A rollforward of fair value amounts recorded as a component of accumulated other comprehensive income is as follows:
We expect substantially all of the amounts recorded as a component of accumulated other comprehensive income will be realized in results of operations within the next twelve months and the amount will vary depending on market rates.
Credit risk related to derivative activity arises in the event a counterparty fails to meet its obligations to us. This exposure is generally limited to the amounts, if any, by which the counterparty’s obligations exceed our obligation to them. Our policy is to enter into contracts only with financial institutions which meet certain minimum credit ratings.
Three months ended
June 30 Six months ended
June 30 In thousands 2012 2011 2012 2011 Designated as hedging:
Forward foreign currency exchange contracts:
Effective portion – cost of products sold $ 545 — $ 1,117 —
Ineffective portion – other – net 86 (1) 226 (1)
Not designated as hedging: Forward foreign currency
exchange contracts: Other – net $ 1,464 ($ 1,496) $ 394 ($ 5,842)
In thousands 2012 2011
Balance at January 1 $ 1,649 $ 0 Deferred gains on cash flow hedges 639 22 Reclassified to earnings (1,117) 0
Balance at June 30 $ 1,171 $22

- 13 -
In May 2012, our Board of Directors authorized a new share repurchase program for up to $25.0 million of our outstanding common stock, exclusive of commissions. The following table summarizes share repurchases under this program:
In April 2011, our Board of Directors authorized a share repurchase program for up to $50.0 million of our outstanding common stock, exclusive of commissions, all of which was used, including 82,533 shares at a cost of $1.2 million repurchased under this program in the first quarter of 2012.
Fox River – Neenah, Wisconsin Background We have significant uncertainties associated
with environmental claims arising out of the presence of polychlorinated biphenyls (“PCBs”) in sediments in the lower Fox River and in the Bay of Green Bay Wisconsin (“Site”). As part of our 1979 acquisition of the Bergstrom Paper Company, we acquired a facility located at the Site (the “Neenah Facility”). The Neenah Facility used wastepaper as a source of fiber. Discharges to the lower Fox River from the Neenah Facility that may have contained PCBs from wastepaper may have occurred from 1954 to the late 1970s. We believe that any PCBs that the Neenah Facility may have discharged into the lower Fox River resulted from the presence of PCBs in NCR -brand carbonless copy paper in the wastepaper that was recycled at the Neenah Facility. We closed the Neenah Facility in June 2006.
The United States, the State of Wisconsin and various state and federal governmental agencies (collectively, the “Governments”), as well as other entities (including local Native American tribes), have found PCBs in sediments in the bed of the Fox River, apparently from a number of sources at municipal and industrial facilities along the upstream and downstream portions of the Site. The Governments have identified manufacturing and recycling of NCR -brand carbonless copy paper as the principal source of that contamination.
13. SHARE REPURCHASES
shares (thousands)
Authorized amount n/a $ 25,000 Repurchases 172,157 (2,605)
Remaining authorization $ 22,395
14. COMMITMENTS, CONTINGENCIES AND LEGAL PROCEEDINGS
®
®
The United States Environmental Protection Agency (“EPA”) has divided the lower Fox River and the Bay of Green Bay site into five “operable units” (the “OUs”), including the most upstream (“OU1”) and four downstream reaches of the river and bay (“OU2-5”). OU1 extends from primarily Lake Winnebago to the dam at Appleton, and is comprised of Little Lake Butte des Morts. The Neenah Facility discharged its wastewater into OU1.
Our liabilities, if any, for this contamination primarily arise under the federal Comprehensive Environmental, Response, Compensation and Liability Act (“CERCLA” or “Superfund”), pursuant to which the Governments have sought to recover “response actions” or “response costs,” which are the costs of studying and cleaning up contamination. Other agencies and natural resource trustee agencies (collectively, the “Trustees”) have sought to recover natural resource damages (“NRDs”), including natural resource damage assessment costs.
We are one of eight entities that have been formally notified that they are potentially responsible parties (“PRPs”) under CERCLA for response costs or NRDs. Others, including the United States and the State of Wisconsin, may also be liable for some or all of the costs of NRD at this Site.
The Governments have sought to recover response actions, response costs, and NRDs from us through three principal enforcement actions.
OU1 CD. On October 1, 2003, the United States and the State of Wisconsin commenced an action captioned United States v. P .H. Glatfelter Co. against us and WTM I Company (“WTM I”). in the United States District Court for the Eastern District of Wisconsin and simultaneously lodged a consent decree (“OU1 CD”) that the court entered on April 12, 2004. Under that OU1 CD, and an amendment dated August 2008, we and WTM I, with a limited fixed contribution from Menasha Corp. and funds provided by the United States from an agreement with others, have implemented the remedy for OU1. We have also resolved claims for all Governmental response costs in OU1 after July 2003 and made a payment on NRDs. That remedy is complete. We have continuing operation and maintenance obligations that we expect to fund from contributions we and WTM I have already made to an escrow account for OU1 under the OU1 CD.
OU2-5 UAO. In November 2007, the United States Environmental Protection Agency (“EPA”) issued an administrative order for remedial action (“UAO”) to Appleton Papers Inc. (“API”), CBC Coating, Inc. (formerly known as Riverside Paper Corporation),

- 14 -
Georgia-Pacific Consumer Products, L.P. (formerly known as Fort James Operating Company), Menasha Corporation, NCR Corporation, Glatfelter, U.S. Paper Mills Corp., and WTM I directing those respondents to implement the remedy in OU2-5. Shortly following issuance of the UAO, API and NCR commenced litigation against us and others, as described below. Accordingly, we have no vehicle for complying with the UAO’s overall requirements other than answering a judgment in the litigation, and we have so informed EPA, but, to minimize disruptions, have paid certain de minimis amounts to EPA for oversight costs under the UAO.
Government Action. On October 14, 2010, the United States and the State of Wisconsin filed an action in the United States District Court for the Eastern District of Wisconsin captioned United States v. NCR Corp. (the “Government Action”) against 12 parties, including us. The Government Action seeks to recover from each of the defendants, jointly and severally, all of the governments’ past costs of response, which are approximately $17 million to date, a declaration as to liability for all of the governments’ future costs of response, and compensation for natural resource damages, as well as a declaration as to liability for compliance with the UAO for OU2-5. The United States twice sought a preliminary injunction in 2011 to obtain “full-scale remediation” from NCR or API, and those motions were denied. NCR implemented less than a full season of work in 2011. On March 19, 2012, the United States again moved for a preliminary injunction to require NCR and API to conduct “full-scale” remediation – defined as dredging of 660,000 cubic yards of sediment – in 2012. On April 10, 2012, the court granted summary judgment to API, holding that API was not a successor to the Appleton Coated Papers Division of NCR Corporation. On April 27, 2012, the court granted the preliminary injunction that the United States had requested, but against NCR only. NCR has appealed that preliminary injunction to the United States Court of Appeals for the Seventh Circuit. That appeal was argued on June 4, 2012, and we expect a decision at any time. The preliminary injunction has not been stayed pending appeal, so work continues in OU2-5. Active litigation of the United States’ claim for a declaratory judgment or permanent injunctive relief against all recipients of the UAO for OU2-5, including us, is on an accelerated schedule, and the district court has scheduled it for a trial beginning December 3, 2012. Among other issues, disposition of that claim will require litigation of challenges to the United States’ selection of the remedy for this Site and will also require disposition of various parties’ asserted defenses that liability for some or all of this Site is not joint and several and may be apportioned. Should the government obtain the order against us that it is now seeking on the claim to be tried, the court would issue a mandatory injunction requiring us, jointly and severally with any other defendants against which the government were to prevail, to complete the remedy for OU2-5. However, the government is not seeking at that trial any change to the rulings in the Whiting Litigation under which NCR bears full responsibility for any obligations we share jointly with NCR.
Whiting Litigation. On January 7, 2008, NCR and API commenced litigation in the United States District Court for the Eastern District of Wisconsin captioned Appleton Papers Inc. v. George A. Whiting Paper Co., seeking to reallocate costs and damages allegedly incurred or paid or to be incurred or paid by NCR or API (the “Whiting Litigation”). The case involves allocation claims among the two plaintiffs and 28 defendants including us. We and other defendants counterclaimed against NCR and API. Some of the claims have since been resolved as described below.
Claims against governments. The Whiting Litigation involves claims by certain parties against federal agencies who are responsible parties for this site. In the Government Action many defendants, including us, asserted counterclaims against the United States and the State of Wisconsin.
Settlements. Certain parties have resolved their liability to the United States affording them contribution protection. These settlements are embodied in consent decrees. Notably, we entered into the OU1 CD. Also, in a case captioned United States v. George A. Whiting Paper Co., the district court entered two consent decrees under which 13 de minimis defendants in the Whiting Litigation settled with the United States and Wisconsin. The Court of Appeals for the Seventh Circuit denied an appeal of these settlements by NCR and API on May 4, 2011. Further, Georgia-Pacific Consumer Products LP, has entered into a consent decree resolving its liability for NRDs and a separate consent decree in the Government Action that resolves all of its liabilities except for the downstream portion of the OU4 remedy. Finally, the United States has lodged a consent decree that would resolve the liability of itself and two municipalities. The United States moved for entry of that consent decree, but later withdrew that motion due to a ruling by the court adverse to the government in a related case captioned Menasha Corp. v. United States Department of Justice, seeking disclosure of certain documents under the Freedom of Information Act. We oppose entry of that consent decree, which the district court must approve. The United States or the State of Wisconsin may enter into settlements with us or with other parties that would affect our ultimate obligations because settling parties may become unavailable to pay any share other than their settlement amount, depending upon the terms of the settlement and the court’s order entering any consent decree.
Cleanup Decisions. The extent of our exposure depends, in large part, on the decisions made by EPA and the Wisconsin Department of Natural Resources

- 15 -
(“WDNR”) as to how the Site will be cleaned up and the costs and timing of those response actions. The nature of the response actions has been highly controversial. Between 2002 and 2008, the EPA issued records of decision (“RODs”) regarding required remedial actions for the OUs. Some of those RODs have been amended. We contend that the remedy for OU2-5 is arbitrary and capricious. We and others have begun to litigate that issue in the Government Action. If we were to be successful in modifying any existing selected remedy, our exposure could be reduced materially.
NRD Assessment. We are engaged in disputes as to (i) whether various documents prepared by the Trustees taken together constitute a sufficient NRD assessment under applicable regulations; and (ii) on a number of legal grounds, whether the Trustees may recover from us on the specific NRD claims they have made.
Cost estimates. Estimates of the Site remediation change over time as we, or others, gain additional data and experience at the Site. In addition, disagreement exists over the likely costs for some of this work. Based upon estimates made by the Governments and independent estimates commissioned by various potentially responsible parties, we have no reason to disagree with the Governments’ assertion that total past and future costs and NRDs at this site may exceed $1 billion and that $1.5 billion is a reasonable “outside estimate.”
NRDs. Of that amount, the Trustees’ assessment documents claimed that we are jointly and severally responsible for NRDs with a value between $176 million and $333 million. They now claim that this range should be inflated to 2009 dollars and then certain unreimbursed past assessment costs should be added, so that the range of their claim would be $287 million to $423 million. We deny liability for most of these NRDs and believe that even if anyone is liable, that we are not jointly and severally liable for the full amount. Moreover, we believe that the Trustees may not legally pursue this claim at this late date, as the limitations period for NRD claims is three years from discovery.
Allocation and Divisibility. We contend that we are not jointly and severally liable for costs or damages arising from the presence of PCBs downstream of OU1. In addition, we contend that NCR or other sources of NCR -brand carbonless copy paper that our Neenah Mill recycled bear most, if not all, of the responsibility for costs and damages arising from the presence of PCBs in OU1 and downstream.
On December 16, 2009, the court granted motions for summary judgment in our favor in the Whiting Litigation holding that neither NCR nor API may seek contribution
®
from us or other recyclers under CERCLA. The Court made no ruling as to any other allocation, the liability of NCR or API to us for costs we have incurred, or our liability to the Governments or Trustees. NCR and API have stated their intention to appeal, but an appeal is not yet timely because the court has not entered a final judgment.
We also filed counterclaims against NCR and API to recover the costs we have incurred and may later incur and the damages we have paid and may later pay in connection with the Site. Other defendants have similar claims. On February 28, 2011, the district court granted our summary judgment motions on those counterclaims in part and denied them in part. The court granted a declaration that NCR and API are liable to us (and to others) in contribution for 100% of any costs of response (that is, clean up) that we may be required to pay for work in OU2-5 in the future. On September 30, 2011, the court clarified its ruling with respect to NRDs and natural resource damage assessment costs, holding that NCR and API owe full contribution to us (and others) for NRDs or natural resource damage assessment costs that we have paid or may be required to pay in the future. The court required further proceedings to decide whether or to what extent NCR and API owe contribution to us and others for costs that we and others incurred in the past and costs that we and others incurred in connection with OU1. In addition, NCR and API contended that some of the costs we claim are not recoverable and that our insurance coverage settlements ought to be set off against any recovery in whole or in part. Those issues were tried to the court in February 2012. On July 3, 2012, the court issued findings of fact and conclusions of law awarding us approximately $4.25 million in claimed past costs associated with the work of the “Fox River Group,” subject to an unresolved insurance coverage settlement off-set. The court also found that the sale of production scrap known as “broke” from NCR’s predecessor Appleton Coated Paper Company to recyclers did not constitute “arranging” for disposal of the PCBs coated on that broke and therefore did not render NCR liable on that basis for costs we had incurred in OU1, a decision with which we disagree. Further motions are now pending to determine whether NCR or API may be responsible for our costs in OU1 on any other theory. An appeal of the court’s February 28, 2011, September 30, 2011, and July 3, 2012, decisions is not yet ripe for any party.
Reserves for the Site. As of June 30, 2012, our reserve for our claimed liability at the Site, including our remediation and ongoing monitoring obligations at OU1, our claimed liability for the remediation of the rest of the Site, our claimed liability for NRDs associated with PCB contamination at the Site and all pending, threatened or asserted and unasserted claims against us relating to PCB contamination at the Site totaled $16.5 million. Of our

- 16 -
total reserve for the Fox River, $0.3 million is recorded in the accompanying consolidated balance sheets under the caption “Environmental liabilities” and the remainder is recorded under the caption “Other long term liabilities.”
Although we believe that amounts already funded by us and WTM I to implement the OU1 remedy are adequate and no payments have been required since January 2009, there can be no assurance that these amounts will in fact suffice. WTM I has filed a bankruptcy petition in the Bankruptcy Court in Richmond; accordingly, there can be no assurance that WTM I will be able to fulfill its obligation to pay half of any additional costs, if required.
We believe that we have strong defenses to liability for further remediation downstream of OU1, including the existence of ample data that indicate that PCBs did not leave OU1 in concentrations that could have caused or contributed to the need for additional cleanup downstream. Others, including the EPA and other PRPs, disagree with us and, as a result, the EPA has issued a UAO to us and to others to perform the additional remedial work, and filed the Government Action seeking, in part, the same relief. NCR and API commenced the Whiting Litigation and joined us and others as defendants, but, to this point, have not prevailed.
Even if we are not successful in establishing that we have no further remediation liability, we do not believe that we would be allocated a significant percentage share of liability in any equitable allocation of the remediation costs and natural resource damages. The accompanying consolidated financial statements do not include reserves for defense costs for the Whiting Litigation, the Government Action, or any future defense costs related to our involvement at the Site, which could be significant.
In setting our reserve for the Site, we have assessed our legal defenses, including our successful defenses to the allegations made in the Whiting Litigation, and assumed that we will not bear the entire cost of remediation or damages to the exclusion of other known PRPs at the Site, who are also potentially jointly and severally liable. The existence and ability of other PRPs to participate has also been taken into account in setting our reserve, and is generally based on our evaluation of recent publicly available financial information on certain of the PRPs and any known insurance, indemnity or cost sharing agreements between PRPs and third parties. In addition, our assessment is based upon the magnitude, nature, location and circumstances associated with the various discharges of PCBs to the river and the relationship of those discharges to identified contamination. We will continue to evaluate our exposure and the level of our reserves, including, but not limited to, our potential share of the costs and NRDs, if any, associated with the Site.
The amount and timing of future expenditures for environmental compliance, cleanup, remediation and personal injury, NRDs and property damage liabilities cannot be ascertained with any certainty due to, among other things, the unknown extent and nature of any contamination, the response actions that may ultimately be required, the availability of remediation equipment, and landfill space, and the number and financial resources of any other PRPs.
Other Information. The Governments have published studies estimating the amount of PCBs discharged by each identified PRP’s facility to the lower Fox River and Green Bay. These reports estimate the Neenah Facility’s share of the mass of PCBs discharged to be as high as 27%. We do not believe the discharge mass estimates used in these studies are accurate because (a) the studies themselves disclose that they are not accurate and (b) the PCB mass estimates contained in the studies are based on assumptions that are unsupported by existing data on the Site. We believe that the Neenah Facility’s absolute and relative contribution of PCB mass is significantly lower than the estimates set forth in these studies.
In any event, based upon the court’s December 16, 2009, and February 28, 2011, rulings in the Whiting Litigation, statements in the court’s disposition of the United States’ 2011 and 2012 motions for a preliminary injunction in the Government Action, as well as certain other procedural orders, we continue to believe that an allocation in proportion to mass of PCBs discharged would not constitute an equitable allocation of the potential liability for the contamination at the Fox River. We contend that other factors, such as the location of contamination, the location of discharge, and a party’s role in causing discharge, must be considered in order for the allocation to be equitable.
We previously entered into interim cost-sharing agreements with six of the other PRPs, which provided for those PRPs to share certain costs relating to scientific studies of PCBs discharged at the Site (“Interim Cost Sharing Agreements”). These Interim Cost Sharing Agreements do not establish the final allocation of remediation costs incurred at the Site. Based upon our evaluation of the Court’s December 16, 2009, February 28, 2011, and July 3, 2012, rulings in the Whiting Litigation as well as the volume, nature and location of the various discharges of PCBs at the Site and the relationship of those discharges to identified contamination, we believe our allocable share of liability at the Site is less than our share of costs under the Interim Cost Sharing Agreements.

- 17 -
Range of Reasonably Possible Outcomes. Our analysis of the range of reasonably possible outcomes is derived from all available information, including but not limited to official documents such as RODs, discussions with the United States and other PRPs, as well as legal counsel and engineering consultants. Based on our analysis of the current RODs and cost estimates for work to be performed at the Site, we believe that it is reasonably possible that our costs associated with the Fox River matter may exceed our cost estimates and the aggregate amounts accrued for the Fox River matter by amounts that are insignificant or that could range up to $265 million over an undeterminable period that could range beyond 10 years. We believe that the likelihood of an outcome in the upper end of the monetary range is significantly less than other possible outcomes within the range and that the possibility of an outcome in excess of the upper end of the monetary range is remote. The two summary judgments in our favor in the Whiting Litigation, if sustained on appeal, suggest that outcomes in the upper end of the monetary range have become somewhat less likely, while the result of the February 2012 trial and increases in cost estimates for some of the work may make an outcome in the upper end of the range more likely.
Summary. Our current assessment is that we will be able to manage this environmental matter without a long-term, material adverse impact on the Company. This matter could, however, at any particular time or for any particular year or years, have a material adverse effect on our consolidated financial position, liquidity and/or results of operations or could result in a default under our debt covenants. Moreover, there can be no assurance that our reserves will be adequate to provide for future obligations related to this matter, that our share of costs and/or damages will not exceed our available resources, or that such obligations will not have a long-term, material adverse effect on our consolidated financial position, liquidity or results of operations. Should a court grant the United States or the State of Wisconsin relief which requires us either to perform directly or to contribute significant amounts towards remedial action downstream of OU1 or to natural resource damages, those developments could have a material adverse effect on our consolidated financial position, liquidity and results of operations and might result in a default under our loan covenants.

The following table sets forth financial and other information by business unit for the periods indicated:
The clerical accuracy of the amounts set forth above may be affected by, or the amounts may not agree to the consolidated financial statements included herein due to, rounding.
15. SEGMENT INFORMATION
Three months ended June 30 In millions Specialty Papers Composite Fibers
Advanced AirlaidMaterials Other and Unallocated Total
2012 2011 2012 2011 2012 2011 2012 2011 2012 2011
Net sales $214.1 $216.7 $108.6 $116.4 $ 62.0 $ 64.9 — — $384.7 $398.0 Energy and related sales, net 1.6 2.1 — — — — — — 1.6 2.1
Total revenue 215.7 218.8 108.6 116.4 62.0 64.9 — — 386.3 400.0 Cost of products sold 197.5 206.5 90.7 97.6 55.0 58.3 2.2 0.1 345.4 362.5
Gross profit 18.3 12.2 17.9 18.8 6.9 6.6 (2.2) (0.1) 40.9 37.5 SG&A 14.0 12.3 10.0 9.6 2.3 2.8 3.8 6.6 30.1 31.3 Gains on dispositions of plant, equipment and
timberlands, net — — — — — — (7.0) — (7.0) —
Total operating income (loss) 4.2 (0.1) 7.9 9.2 4.6 3.8 1.0 (6.7) 17.7 6.2 Other non-operating income (expense) — — — — — — (4.0) (6.6) (4.0) (6.6)
Income (loss) before income taxes $ 4.2 $ (0.1) $ 7.9 $ 9.2 $ 4.6 $ 3.8 $ (3.0) $ (13.3) $ 13.8 $ (0.4)
Supplementary Data Net tons sold 186.8 191.8 23.0 22.9 22.7 22.3 — — 232.5 237.0 Depreciation, depletion and amortization $ 9.0 $ 8.9 $ 5.8 $ 6.4 $ 2.2 $ 2.1 — — $ 17.0 $ 17.4 Capital expenditures 9.1 9.4 6.3 6.6 0.9 3.7 0.1 — 16.4 19.8
Six months ended June 30 In millions Specialty Papers Composite Fibers
Advanced AirlaidMaterials Other and Unallocated Total
2012 2011 2012 2011 2012 2011 2012 2011 2012 2011
Net sales $437.9 $437.2 $220.6 $231.6 $123.6 $126.0 — — $782.0 $794.8 Energy and related sales, net 3.5 5.0 — — — — — — 3.5 5.0
Total revenue 441.4 442.2 220.6 231.6 123.6 126.0 — — 785.5 799.8 Cost of products sold 386.1 393.9 182.3 190.6 110.1 115.0 5.2 2.6 683.7 702.1
Gross profit 55.3 48.3 38.3 41.0 13.4 11.0 (5.2) (2.6) 101.8 97.7 SG&A 27.4 26.2 19.5 19.4 5.0 5.5 8.3 12.0 60.1 63.1 Gains on dispositions of plant, equipment and
timberlands, net — — — — — — (7.0) (3.2) (7.0) (3.2)
Total operating income (loss) 27.9 22.1 18.8 21.6 8.4 5.5 (6.5) (11.5) 48.8 37.8 Other non-operating income (expense) — — — — — — (7.9) (12.8) (7.9) (12.8)
Income (loss) before income taxes $ 27.9 $ 22.1 $ 18.8 $ 21.6 $ 8.4 $ 5.5 $ (14.4) $ (24.3) $ 40.9 $ 24.9
Supplementary Data Net tons sold 382.6 390.5 45.7 45.8 45.1 43.8 — — 473.3 480.2 Depreciation, depletion and amortization $ 17.9 $ 17.5 $ 11.8 $ 12.5 $ 4.3 $ 4.3 — — $ 34.1 $ 34.3 Capital expenditures 13.7 13.3 15.3 10.5 1.4 4.1 0.1 — 30.6 27.9
- 18 -
Results of individual business units are presented based on our management accounting practices and management structure. There is no comprehensive, authoritative body of guidance for management accounting equivalent to accounting principles generally accepted in the United States of America; therefore, the financial results of individual business units are not necessarily comparable with similar information for any other company. The management accounting process uses assumptions and allocations to measure performance of the business units. Methodologies are refined from time to time as management accounting practices are enhanced and businesses change. The costs incurred by support areas not directly aligned with the business unit are allocated primarily based on an estimated utilization of support area services.
Management evaluates results of operations of the business units before pension income or expense, alternative fuel mixture and cellulosic biofuel credits, charges related to the Fox River environmental reserves, acquisition and integration related costs, restructuring related charges, unusual items, certain corporate level costs, and the effects of asset dispositions. Management believes that this is a more meaningful representation of the operating performance of its core businesses, the profitability of business units and the extent of cash flow generated from these core operations. Such amounts are presented under the caption “Other and Unallocated.” This presentation is aligned with the management and operating structure of our company. It is also on this basis that our performance is evaluated internally and by the Company’s Board of Directors.

Our 7 / % Notes have been fully and unconditionally guaranteed, on a joint and several basis, by certain of our 100%-owned domestic subsidiaries: PHG Tea Leaves, Inc., Mollanvick, Inc., The Glatfelter Pulp Wood Company, and Glatfelter Holdings, LLC.
The following presents our condensed consolidating statements of income and cash flow, and our condensed consolidating balance sheets. These financial statements reflect P. H. Glatfelter Company (the parent), the guarantor subsidiaries (on a combined basis), the non-guarantor subsidiaries (on a combined basis) and elimination entries necessary to combine such entities on a consolidated basis.
Condensed Consolidating Statement of Income for the three months ended June 30, 2012
Condensed Consolidating Statement of Income for the three months ended June 30, 2011
- 19 -
16. GUARANTOR FINANCIAL STATEMENTS
In thousand Parent
Company Guarantors Non
Guarantors Adjustments/Eliminations Consolidated
Net sales $214,113 $12,002 $170,580 $ (12,002) $ 384,693 Energy and related sales – net 1,630 — — — 1,630
Total revenues 215,743 12,002 170,580 (12,002) 386,323 Costs of products sold 200,549 11,103 145,827 (12,034) 345,445
Gross profit 15,194 899 24,753 32 40,878 Selling, general and administrative expenses 17,691 602 11,820 — 30,113 Gains on dispositions of plant, equipment and timberlands, net (497) (6,451) (13) — (6,961)
Operating income (2,000) 6,748 12,946 32 17,726 Other non-operating income (expense)
Interest expense, net (4,830) 1,699 (925) — (4,056) Other – net 13,611 285 388 (14,181) 103
Total other non-operating income (expense) 8,781 1,984 (537) (14,181) (3,953)
Income (loss) before income taxes 6,781 8,732 12,409 (14,149) 13,773 Income tax provision (benefit) (6,651) 3,793 3,186 13 341
Net income (loss) 13,432 4,939 9,223 (14,162) 13,432 Other comprehensive income (loss) (10,619) — (13,532) 13,532 (10,619)
Comprehensive income $ 2,813 $ 4,939 $ (4,309) $ (630) $ 2,813
In thousand Parent
Company Guarantors Non
Guarantors Adjustments/Eliminations Consolidated
Net sales $216,708 $11,986 $181,277 $ (11,986) $ 397,985 Energy and related sales – net 2,060 — — — 2,060
Total revenues 218,768 11,986 181,277 (11,986) 400,045 Costs of products sold 208,575 11,271 154,753 (12,054) 362,545
Gross profit 10,193 715 26,524 68 37,500 Selling, general and administrative expenses 17,293 688 13,339 — 31,320 Gains on dispositions of plant, equipment and timberlands, net (29) — — — (29)
Operating income (7,071) 27 13,185 68 6,209 Other non-operating income (expense)
Interest expense, net (6,608) 1,992 (1,695) — (6,311) Other – net 12,863 34 (100) (13,072) (275)
Total other non-operating income (expense) 6,255 2,026 (1,795) (13,072) (6,586)
Income (loss) before income taxes (816) 2,053 11,390 (13,004) (377) Income tax provision (benefit) (3,317) 676 (257) 20 (2,878)
Net income (loss) 2,501 1,377 11,647 (13,024) 2,501 Other comprehensive income (loss) 5,974 — 3,786 (3,786) 5,974
Comprehensive income $ 8,475 $ 1,377 $ 15,433 $ (16,810) $ 8,475
1 8

Condensed Consolidating Statement of Income for the six months ended June 30, 2012
Condensed Consolidating Statement of Income for the six months ended June 30, 2011
- 20 -
In thousands Parent
Company Guarantors Non
Guarantors Adjustments/Eliminations Consolidated
Net sales $437,915 $27,372 $344,141 $ (27,383) $ 782,045 Energy and related sales – net 3,491 — — — 3,491
Total revenues 441,406 27,372 344,141 (27,383) 785,536 Costs of products sold 393,425 25,051 292,568 (27,356) 683,688
Gross profit 47,981 2,321 51,573 (27) 101,848 Selling, general and administrative expenses 34,727 1,341 24,012 — 60,080 Gains on dispositions of plant, equipment and timberlands, net (522) (6,451) (25) — (6,998)
Operating income 13,776 7,431 27,586 (27) 48,766 Non-operating income (expense)
Interest expense, net (9,786) 3,341 (1,757) — (8,202) Other – net 24,800 374 861 (25,736) 299
Total other income (expense) 15,014 3,715 (896) (25,736) (7,903)
Income (loss) before income taxes 28,790 11,146 26,690 (25,763) 40,863 Income tax provision (benefit) (3,520) 4,886 7,198 (11) 8,553
Net income (loss) 32,310 6,260 19,492 (25,752) 32,310 Other comprehensive income 1,032 — (4,898) 4,898 1,032
Comprehensive income $ 33,342 $ 6,260 $ 14,594 $ (20,854) $ 33,342
In thousand Parent
Company Guarantors Non
Guarantors Adjustments/Eliminations Consolidated
Net sales $437,162 $24,818 $357,594 $ (24,818) $ 794,756 Energy and related sales – net 5,047 — — — 5,047
Total revenues 442,209 24,818 357,594 (24,818) 799,803 Costs of products sold 399,537 22,742 304,855 (24,998) 702,136
Gross profit 42,672 2,076 52,739 180 97,667 Selling, general and administrative expenses 36,011 1,247 25,832 — 63,090 Gains on dispositions of plant, equipment and timberlands, net (42) (3,158) (4) — (3,204)
Operating income 6,703 3,987 26,911 180 37,781 Non-operating income (expense)
Interest expense, net (9,937) 3,872 (3,199) (3,300) (12,564) Other – net 23,389 121 (179) (23,599) (268)
Total other income (expense) 13,452 3,993 (3,378) (26,899) (12,832)
Income (loss) before income taxes 20,155 7,980 23,533 (26,719) 24,949 Income tax provision (benefit) 228 3,132 2,836 (1,174) 5,022
Net income (loss) 19,927 4,848 20,697 (25,545) 19,927 Other comprehensive income 22,959 — 18,200 (18,200) 22,959
Comprehensive income $ 42,886 $ 4,848 $ 38,897 $ (43,745) $ 42,886

Condensed Consolidating Balance Sheet as of June 30, 2012
Condensed Consolidating Balance Sheet as of December 31, 2011
- 21 -
In thousands Parent
Company Guarantors Non
Guarantors Adjustments/ Eliminations Consolidated
Assets
Current assets Cash and cash equivalents $ 1,436 $ 3,424 $ 18,577 $ — $ 23,437 Other current assets 264,584 422,835 228,525 (494,262) 421,682
Plant, equipment and timberlands – net 240,564 6,179 348,312 — 595,055 Other assets 761,892 157,083 47,659 (852,024) 114,610
Total assets $1,268,476 $589,521 $643,073 $(1,346,286) $1,154,784
Liabilities and Shareholders’ Equity
Current liabilities $ 390,880 $ 53,140 $282,452 $ (497,833) $ 228,639 Long-term debt 218,000 — — — 218,000 Deferred income taxes 27,959 3,643 38,913 (16,187) 54,328 Other long-term liabilities 115,596 10,048 9,049 3,083 137,776
Total liabilities 752,435 66,831 330,414 (510,937) 638,743 Shareholders’ equity 516,041 522,690 312,659 (835,349) 516,041
Total liabilities and shareholders’ equity $1,268,476 $589,521 $643,073 $(1,346,286) $1,154,784
In thousands Parent
Company Guarantors Non
Guarantors Adjustments/ Eliminations Consolidated
Assets
Current assets
Cash and cash equivalents $ 3,007 $ 2,894 $ 32,376 $ — $ 38,277 Other current assets 203,173 378,519 223,494 (421,050) 384,136 Plant, equipment and timberlands – net 243,554 6,648 351,748 — 601,950 Other assets 736,733 175,945 48,610 (848,726) 112,562
Total assets $1,186,467 $564,006 $656,228 $(1,269,776) $1,136,925
Liabilities and Shareholders’ Equity
Current liabilities $ 310,814 $ 31,328 $293,283 $ (424,185) $ 211,240 Long-term debt 227,000 — — — 227,000 Deferred income taxes 42,252 4,079 39,511 (16,051) 69,791 Other long-term liabilities 115,997 10,059 9,415 3,019 138,490
Total liabilities 696,063 45,466 342,209 (437,217) 646,521 Shareholders’ equity 490,404 518,540 314,019 (832,559) 490,404
Total liabilities and shareholders’ equity $1,186,467 $564,006 $656,228 $(1,269,776) $1,136,925

Condensed Consolidating Statement of Cash Flows for the six months ended June 30, 2012
Condensed Consolidating Statement of Cash Flows for the six months ended June 30, 2011
- 22 -
In thousands Parent
Company Guarantors Non
Guarantors Adjustments/Eliminations Consolidated
Net cash provided (used) by
Operating activities $3,464 $3,369 $21,699 $- $28,532
Investing activities
Purchase of plant, equipment and timberlands (13,767) (78) (16,742) - (30,587)
Proceeds from disposal plant, equipment and timberlands 533 6,620 36 - 7,189
Repayments from (advances of) intercompany loans, net and other 5,662 (9,381) (514) 4,233 -
Total investing activities (7,572) (2,839) (17,220) 4,233 (23,398)Financing activities
Net repayments of indebtedness (9,000) - - - (9,000)
Payment of dividends to shareholders (7,800) - - - (7,800)
Repurchases of common stock (3,565) - - - (3,565)
(Repayments) borrowings of intercompany loans, net 22,300 - (18,067) (4,233) -
Proceeds from stock options exercised and other 602 - 27 - 629
Total financing activities 2,537 - (18,040) (4,233) (19,736)
Effect of exchange rate on cash - - (238) - (238)
Net increase (decrease) in cash (1,571) 530 (13,799) - (14,840)Cash at the beginning of period 3,007 2,894 32,376 - 38,277
Cash at the end of period $1,436 $3,424 $18,577 $- $23,437
In thousands Parent
Company Guarantors Non
Guarantors Adjustments/Eliminations Consolidated
Net cash provided (used) by
Operating activities $38,587 $2,969 $10,057 $(3,300) $48,313 Investing activities
Purchase of plant, equipment and timberlands (13,284) (16) (14,577) – (27,877) Proceeds from disposals of plant, equipment
and timberlands 49 3,373 18 – 3,440 Repayments of (advances from)
intercompany loans, net (3,586) (2,156) – 5,742 –
Total investing activities (16,821) 1,201 (14,559) 5,742 (24,437) Financing activities
Net repayments of indebtedness – – (798) – (798) Payment of dividends to shareholders (8,396) – – – (8,396) Repurchases of common stock (4,369) – – – (4,369) (Repayments) borrowings of intercompany
loans, net 13,500 – (7,758) (5,742) –
Payment of intercompany dividends – (3,300) – 3,300 –
Proceeds from stock options exercised and other 117 – – – 117
Total financing activities 852 (3,300) (8,556) (2,442) (13,446) Effect of exchange rate on cash – – 2,078 – 2,078
Net increase (decrease) in cash 22,618 870 (10,980) - 12,508 Cash at the beginning of period 61,953 91 33,744 – 95,788
Cash at the end of period $84,571 $961 $22,764 $- $108,296

- 23 -
ITEM 2. MANAGEMENT’S DISCUSSION AND ANALYSIS OF FINANCIAL CONDITION AND RESULTS OF OPERATIONS The following discussion should be read in conjunction with the information in the unaudited condensed consolidated financial statements and notes thereto included herein and Glatfelter’s Financial Statements and Management’s Discussion and Analysis of Financial Condition and Results of Operations included in our 2011 Annual Report on Form 10-K.
Forward-Looking Statements This Quarterly Report on Form 10-Q includes forward-looking statements within the meaning of the Private Securities Litigation Reform Act of 1995. All statements other than statements of historical fact, including statements regarding industry prospects and future consolidated financial position or results of operations, made in this Report on Form 10-Q are forward looking. We use words such as “anticipates”, “believes”, “expects”, “future”, “intends” and similar expressions to identify forward-looking statements. Forward-looking statements reflect management’s current expectations and are inherently uncertain. Our actual results may differ significantly from such expectations. The following discussion includes forward-looking statements regarding expectations of, among others, non-cash pension expense, environmental costs, capital expenditures and liquidity, all of which are inherently difficult to predict. Although we make such statements based on assumptions that we believe to be reasonable, there can be no assurance that actual results will not differ materially from our expectations. Accordingly, we identify the following important factors, among others, which could cause our results to differ from any results that might be projected, forecasted or estimated in any such forward-looking statements:
i. variations in demand for our products including the impact of any unplanned market-related downtime, or variations in product pricing;
ii. changes in the cost or availability of raw materials we use, in particular pulpwood, pulp, pulp substitutes, caustic soda and abaca fiber;
iii. changes in energy-related costs and commodity raw materials with an energy component;
iv. our ability to develop new, high value-added products;
v. the impact of exposure to volatile market-based pricing for sales of excess electricity;
vi. the impact of competition, changes in industry production capacity, including the construction of new mills, the closing of mills and incremental changes due to capital expenditures or productivity increases;
We manufacture a wide array of specialty papers and fiber-based engineered materials. We manage our company along three business units:
vii. the gain or loss of significant customers and/or on-going viability of such customers;
viii. cost and other effects of environmental compliance, cleanup, damages, remediation or restoration, or personal injury or property damages related thereto, such as the costs of natural resource restoration or damages related to the presence of polychlorinated biphenyls (“PCBs”) in the lower Fox River on which our former Neenah mill was located;
ix. risks associated with our international operations, including local economic and political environments and fluctuations in currency exchange rates;
x. geopolitical events, including war and terrorism;
xi. disruptions in production and/or increased costs due to labor disputes;
xii. the impact of unfavorable outcomes of audits by various state, federal or international tax authorities;
xiii. enactment of adverse state, federal or foreign tax or other legislation or changes in government policy or regulation;
xiv. adverse results in litigation in the Fox River matter;
xv. our ability to finance, consummate and integrate acquisitions; and
xvi. the cost, and successful design and construction, of the Composite Fibers capacity expansion project.
i) Specialty Papers with revenue from the sale of carbonless papers and forms, book publishing, envelope & converting papers, and fiber-based engineered products;
ii) Composite Fibers with revenue from the sale of single-serve coffee and tea filtration papers, metallized papers, composite laminates used for decorative furniture and flooring applications, and other technical specialty papers; and
iii) Advanced Airlaid Materials with revenue from the sale of airlaid non-woven fabric like materials used in feminine hygiene products, adult incontinence products, cleaning pads, wipes, food pads, napkins, tablecloths, and baby wipes.

- 24 -
RESULTS OF OPERATIONS
Six months ended June 30, 2012 versus the Six months ended June 30, 2011
Overview For the first six months of 2012, net income was $32.3 million, or $0.74 per diluted share, compared with $19.9 million, or $0.43 per diluted share, in the same period of 2011.
Operationally, our results reflect $5.9 million of higher operating income from our business units primarily reflecting higher selling prices, efficient operations and continuous improvement initiatives.
Specialty Papers’ operating income increased $5.8 million to $27.9 million for the first six months of 2012. Volumes shipped declined 2.0%; however this unit’s profitability was favorably impacted by higher selling prices, the mix of products sold and efficient operations.
Our Composite Fibers business unit’s operating income declined $2.8 million to $18.8 million primarily due to lost production associated with two machine upgrades as well as the translation of foreign currencies. Volumes shipped were essentially unchanged in the comparison, although the demand trends were impacted by the uncertain European economic conditions.
Advanced Airlaid Materials’ operating income increased $2.9 million to $8.4 million, reflecting improvements in operating efficiency and lower raw material and energy costs.
Consolidated net income also benefited by $2.9 million, or $0.07 per diluted share, from lower interest expense as a result of the debt refinancing activities undertaken in the fourth quarter of 2011. Diluted shares outstanding for the first six months of 2012 declined by 3.0 million shares compared with the same period of 2011 primarily due to the 2011 share repurchase program.
The consolidated results of operations summarized above include the following significant items:
The above items increased earnings by $8.1 million, or $0.18 per diluted share, in the first six months of 2012 and by $0.9 million, or $0.02 per diluted share, in the first six months of 2011.
During the second quarter of 2012, we recorded a $4.4 million, or $0.10 per diluted share, benefit in connection with our intention to convert alternative fuel mixture credits earned in 2009 for cellulosic biofuel credits.
The consolidated amounts reported for 2012 and 2011 also includes $3.7 million and $1.7 million, respectively, in after-tax gains from timberland sales.
Six months ended
June 30 In thousands, except per share 2012 2011
Net sales $782,045 $794,756 Gross profit 101,848 97,667 Operating income 48,766 37,781 Net income 32,310 19,927 Earnings per diluted share 0.74 0.43
In thousands, except per share After-tax
Gain (loss) Diluted
EPS
2012
Conversion of Alternative fuel mixture for Cellulosic biofuel credits $ 4,440 $ 0.10
Timberland sales and related costs 3,696 0.08
2011
Timberlands sales and related costs $ 1,650 $ 0.04
Acquisition and integration costs (793) (0.02)

Business Unit Performance
The clerical accuracy of the amounts set forth above may be affected by, or the amounts may not agree to the consolidated financial statements included herein due to, rounding.
- 25 -
Six months ended June 30 In millions Specialty Papers Composite Fibers
Advanced AirlaidMaterials Other and Unallocated Total
2012 2011 2012 2011 2012 2011 2012 2011 2012 2011
Net sales $437.9 $437.2 $220.6 $231.6 $123.6 $126.0 — — $782.0 $794.8 Energy and related sales, net 3.5 5.0 — — — — — — 3.5 5.0
Total revenue 441.4 442.2 220.6 231.6 123.6 126.0 — — 785.5 799.8 Cost of products sold 386.1 393.9 182.3 190.6 110.1 115.0 5.2 2.6 683.7 702.1
Gross profit 55.3 48.3 38.3 41.0 13.4 11.0 (5.2) (2.6) 101.8 97.7 SG&A 27.4 26.2 19.5 19.4 5.0 5.5 8.3 12.0 60.1 63.1 Gains on dispositions of plant,
equipment and timberlands, net — — — — — — (7.0) (3.2) (7.0) (3.2)
Total operating income (loss) 27.9 22.1 18.8 21.6 8.4 5.5 (6.5) (11.5) 48.8 37.8 Other non-operating income
(expense) — — — — — — (7.9) (12.8) (7.9) (12.8)
Income (loss) before income taxes $ 27.9 $ 22.1 $ 18.8 $ 21.6 $ 8.4 $ 5.5 $ (14.4) $ (24.3) $ 40.9 $ 24.9
Supplementary Data Net tons sold 382.6 390.5 45.7 45.8 45.1 43.8 — — 473.3 480.2 Depreciation, depletion and
amortization $ 17.9 $ 17.5 $ 11.8 $ 12.5 $ 4.3 $ 4.3 — — $ 34.1 $ 34.3 Capital expenditures 13.7 13.3 15.3 10.5 1.4 4.1 0.1 — 30.6 27.9
Sales and Costs of Products Sold
Net sales for the first six months of 2012 decreased by $12.7 million, or 1.6%, to $782.0 million. The translation of foreign currencies unfavorably impacted net sales by $18.5 million in the comparison more than offsetting a $6.8 million benefit from higher selling prices. Total volumes shipped declined 1.4%.
The following table sets forth the contribution to consolidated net sales by each business unit:
Six months ended
June 30 In thousands 2012 2011 Change
Net sales $782,045 $794,756 $(12,711) Energy and related sales
– net 3,491 5,047 (1,556)
Total revenues 785,536 799,803 (14,267) Costs of products sold 683,688 702,136 (18,448)
Gross profit $101,848 $ 97,667 $ 4,181
Gross profit as a percent of Net sales 13.0% 12.3%
Six months ended
June 30 Percent of Total 2012 2011 Business Unit Specialty Papers 56.0% 55.0% Composite Fibers 28.2 29.1 Advanced Airlaid Material 15.8 15.9
Total 100.0% 100.0%
In the Specialty Papers business unit, net sales increased slightly primarily reflecting a $6.3 million benefit from higher selling prices and an improved mix of products sold, substantially offset by a 2.0% decline in volumes shipped.
Specialty Papers’ operating income in the first six months of 2012 was $5.8 million higher than the same period of 2011 reflecting the benefits from higher selling prices, a $0.5 million benefit from lower raw material costs, in addition to benefits from continuous improvement initiatives, production efficiencies, and cost control initiatives. These factors were partially offset by $1.5 million of lower energy and related sales. Results for the first six months of 2011 benefited by $2.8 million from an insurance recovery and the resolution of a tax audit.
We sell excess power generated by the Spring Grove, PA facility. The following table summarizes this activity for the first half of 2012 and 2011:
Renewable energy credits (“RECs”) represent sales of certified credits earned related to burning renewable sources of energy such as black liquor and wood waste.
Six months ended
June 30 In thousands 2012 2011 Change
Energy sales $ 2,112 $ 5,816 $(3,704) Costs to produce (1,805) (4,956) 3,151
Net 307 860 (553) Renewable energy credits 3,184 4,187 (1,003)
Total $ 3,491 $ 5,047 $(1,556)

- 26 -
We sell RECs into an emerging and illiquid market. The extent and value of future revenues from REC sales is dependent on many factors outside of management’s control. Therefore, we may not be able to generate consistent additional sales of RECs in future periods.
In Composite Fibers, net sales were $220.6 million, a decrease of $11.0 million, or 4.8%, primarily due to the translation of foreign currencies which unfavorably impacted the comparison by $12.7 million partially offset by a $0.7 million benefit from higher selling prices. Total volumes shipped were essentially unchanged in the comparison.
Composite Fibers’ operating income in the first half of 2012 decreased by $2.8 million, primarily due to $1.8 million from the translation of foreign currencies. In addition, unfavorable operating costs including higher energy costs, general inflation, and a $1.6 million impact from the completion of machine upgrades adversely affected the comparison.
In Advanced Airlaid Materials, net sales were $123.6 million and $126.0 million in the first half of 2012 and 2011, respectively. The total volumes shipped increased 3.0%; however, currency translation and average selling prices unfavorably affected the comparison by $5.7 million and $0.9 million, respectively.
Operating income in this business unit increased $2.9 million compared with the year ago quarter led by a $3.0 million benefit from lower raw material and energy costs in addition to continuous improvement initiatives including supply chain efficiencies, waste reduction and improved throughput, and benefits from a new festooner. The translation of foreign currencies negatively impacted results by $1.0 million.
Pension Expense The following table summarizes the amounts of pension expense recognized for the periods indicated:
The amount of pension expense recognized each year is determined using various actuarial assumptions and certain other factors.
Six months ended
June 30 In thousands 2012 2011 Change
Recorded as:
Costs of products sold $4,538 $3,264 $1,274 SG&A expense 1,179 771 408
Total $5,717 $4,035 $1,682
Other and Unallocated The amount of net expenses not allocated to a business unit and reported as “Other and Unallocated” in our table of Business Unit Performance totaled $6.5 million in the first half of 2012 compared with $11.5 million in the first half of 2011. The change was primarily due to a $3.8 million increase in gains on dispositions of plant, equipment and timberlands in the first half of 2012. Excluding these gains, other and unallocated net operating expenses decreased $1.2 million as lower legal and professional fees were partially offset by an increase in pension expense.
Non-operating income (expense) as presented in the Business Unit Performance table includes $8.4 million of interest expense for the first half of 2012, a decrease of $4.5 million in the comparison primarily due to the redemption in the fourth quarter of 2011 of $100.0 million of 7 / % bonds.
Income taxes For the first six months of 2012, we recorded a provision for income taxes of $8.6 million on $40.9 million of pretax income, or 20.9%. The comparable amounts in the first half of 2011 were income tax expense $5.0 million on $24.9 million of pretax income, or 20.1%. Income taxes in the first half of 2012 benefited by $4.4 million from the conversion of alternative fuel mixture credits to cellulosic biofuel credits. The 2011 amounts include the benefit recorded in connection with the resolution of certain foreign tax audits, partially offset by adjustments to the carrying value of deferred taxes in connection with changes in state tax laws.
Foreign Currency We own and operate facilities in Canada, Germany, France, the United Kingdom and the Philippines. The functional currency of our Canadian operations is the U.S. dollar. However, in Germany and France it is the Euro, in the UK, it is the British Pound Sterling, and in the Philippines the functional currency is the Peso. During the first six months of 2012, Euro functional currency operations generated approximately 25.9% of our sales and 24.7% of operating expenses and British Pound Sterling operations represented 7.5% of net sales and 7.3% of operating expenses. The translation of the results from these international operations into U.S. dollars is subject to changes in foreign currency exchange rates.
1 8

Business Unit Performance
Three months ended June 30 In millions Specialty Papers Composite Fibers
Advanced AirlaidMaterials Other and Unallocated Total
2012 2011 2012 2011 2012 2011 2012 2011 2012 2011
Net sales $214.1 $216.7 $108.6 $116.4 $62.0 $64.9 — — $384.7 $398.0 Energy and related sales, net 1.6 2.1 — — — — — — 1.6 2.1
Total revenue 215.7 218.8 108.6 116.4 62.0 64.9 — — 386.3 400.0 Cost of products sold 197.5 206.5 90.7 97.6 55.0 58.3 2.2 0.1 345.4 362.5
Gross profit 18.3 12.2 17.9 18.8 6.9 6.6 (2.2) (0.1) 40.9 37.5 SG&A 14.0 12.3 10.0 9.6 2.3 2.8 3.8 6.6 30.1 31.3 Gains on dispositions of plant,
equipment and timberlands, net — — — — — — (7.0) — (7.0) —
Total operating income (loss) 4.2 (0.1) 7.9 9.2 4.6 3.8 1.0 (6.7) 17.7 6.2 Other non-operating income
(expense) — — — — — — (4.0) (6.6) (4.0) (6.6)
Income (loss) before income taxes $ 4.2 $ (0.1) $ 7.9 $ 9.2 $ 4.6 $ 3.8 $ (3.0) $ (13.3) $ 13.8 $ (0.4)
Supplementary Data
The table below summarizes the effect from foreign currency translation on the first six months of 2012 reported results compared to the first six months 2011:
The above table only presents the financial reporting impact of foreign currency translations assuming currency exchange rates in 2012 were the same as 2011. It does not present the impact of certain competitive advantages or disadvantages of operating or competing in multi-currency markets.
In thousands Six months ended
June 30
Favorable
(unfavorable)
Net sales $ (18,493) Costs of products sold 14,225 SG&A expenses 1,528 Income taxes and other 225
Net income $ (2,515)
Three months ended June 30, 2012 versus the Three months ended June 30, 2011
Overview Net income in the second quarter of 2012 totaled $13.4 million, or $0.31 per diluted share compared with $2.5 million or $0.05 per diluted share for the second quarter of 2011. The following table sets forth summarized results of operations:
The consolidated results of operations for the three months ended June 30, 2012 and 2011 include the following significant items:
The above items increased earnings in the second quarter of 2012 by $8.1 million, or $0.18 per diluted share and reduced earnings by $0.6 million, or $0.01 per diluted share, in the second quarter of 2011.
Three months ended June 30 In thousands, except per share 2012 2011
Net sales $ 384,693 $ 397,985 Gross profit 40,878 37,500 Operating income 17,726 6,209 Net income 13,432 2,501 Earnings per diluted share 0.31 0.05
In thousands, except per share After-tax
Gain (loss) Diluted EPS
2012
Conversion of Alternative fuel mixture for Cellulosic biofuel credits $ 4,440 $ 0.10
Timberland sales and related costs 3,696 0.08
2011
Timberlands sales and related costs $ (69) —
Acquisition and integration costs (518) (0.01)

The clerical accuracy of the amounts set forth above may be affected by, or the amounts may not agree to the consolidated financial statements included herein due to, rounding.
- 27 -
Net tons sold 186.8 191.8 23.0 22.9 22.7 22.3 — — 232.5 237.0 Depreciation, depletion and
amortization $ 9.0 $ 8.9 $ 5.8 $ 6.4 $ 2.2 $ 2.1 — — $ 17.0 $ 17.4 Capital expenditures 9.1 9.4 6.3 6.6 0.9 3.7 0.1 — 16.4 19.8

- 28 -
Sales and Costs of Products Sold
The following table sets forth the contribution to consolidated net sales by each business unit:
Net sales for the second quarter of 2012 were $384.7 million, a 3.3% decrease compared with the second quarter of 2011, primarily due to unfavorable translation of foreign currencies.
On a year-over-year basis, Specialty Papers’ net sales decreased 1.2% as shipping volumes declined 2.6% partially offset by a $2.6 million benefit from higher selling prices.
During the second quarters of 2012 and 2011, the Company completed annually scheduled maintenance outages at its Chillicothe, OH and Spring Grove, PA facilities. The outages adversely impacted operating income by $19.9 million in the second quarter of 2012, compared with $20.6 million in the same quarter a year ago.
Specialty Papers’ 2012 second quarter operating income increased by $4.3 million compared with the 2011 second quarter due to the benefit from higher selling prices, $2.0 million from lower raw material and energy prices, and $1.9 million from continuous improvement initiatives and production efficiencies. These factors were partially offset by $1.6 million of higher selling, general and administrative costs primarily related to corporate support services and incentive compensation.
Three months ended June 30 In thousands 2012 2011 Change
Net sales $384,693 $397,985 $(13,292) Energy and related
sales – net 1,630 2,060 (430)
Total revenues 386,323 400,045 (13,722) Costs of products
sold 345,445 362,545 (17,100)
Gross profit $ 40,878 $ 37,500 $ 3,378
Gross profit as a percent of Net sales 10.6% 9.4%
Three months ended June 30 Percent of Total 2012 2011
Business Unit
Specialty Papers 55.7% 54.5% Composite Fibers 28.2 29.2 Advanced Airlaid Material 16.1 16.3
Total 100.0% 100.0%
The following table summarizes sales of excess power and related items for the second quarters of 2012 and 2011:
Composite Fibers’ net sales decreased $7.7 million, or 6.7%, primarily due to the translation of foreign currencies which unfavorably impacted the comparison by $9.4 million while selling prices were substantially unchanged.
Composite Fibers’ second-quarter 2012 operating income decreased by $1.3 million primarily due to the negative impact from foreign currency translation totaling $1.3 million. Operating results were also negatively impacted by an aggregate $0.9 million due to start-up costs associated with the completion of machine upgrades at two facilities as well as costs associated with intermittent, external power supply interruptions at one of its facilities. The business unit was able to offset the impact of these factors with benefits from ongoing continuous improvement initiatives.
On a year-over-year basis, Advanced Airlaid Materials’ net sales decreased $2.9 million or 4.5% primarily due to a $4.3 million unfavorable impact from the translation of foreign currencies. Volumes shipped increased 2.0% and average selling prices declined in the comparison.
Second-quarter 2012 operating income increased $0.9 million, or 23.8%, compared with the year ago quarter primarily due to a $2.0 million benefit from lower raw material and energy costs partially offset by $0.8 million from unfavorable foreign currency translations.
Pension Expense The following table summarizes the amounts of pension expense recognized for the periods indicated:
The amount of pension expense or income recognized each year is determined using various actuarial assumptions and certain other factors.
Three months ended June 30 In thousands 2012 2011 Change
Energy sales $ 1,073 $ 2,924 $(1,851) Costs to produce (795) (2,479) 1,684
Net 278 445 (167) Renewable energy
credits 1,352 1,615 (263)
Total $ 1,630 $ 2,060 $ (430)
Three months ended June 30 In thousands 2012 2011 Change
Recorded as:
Costs of products sold $ 1,915 $ 1,189 $ 726 SG&A expense 726 452 274
Total $ 2,641 $ 1,641 $1,000

- 29 -
Other and Unallocated The amount of net expenses not allocated to a business unit and reported as “Other and Unallocated” in the Company’s table of Business Unit Performance, excluding gains from sales of plant, equipment and timberlands, totaled $6.0 million in the second quarter of 2012 compared with expenses of $6.7 million in the second quarter of 2011. The Company completed the sale of 3,345 acres of timberlands during the second quarter of 2012 and realized a $6.4 million pre-tax gain. Aggregate cash proceeds received totaled $6.6 million after closing costs. Interest expense declined $2.3 million in the year-over-year comparison primarily reflecting the redemption of $100.0 million of 7 / percent bonds at the end of 2011.
Income taxes In the second quarter of 2012, we recorded a $0.3 million provision for income taxes on pretax income of $13.8 million. The provision for income taxes includes a $4.4 million benefit from the conversion of alternative fuel mixture credits to cellulosic biofuel production credits. In the second quarter of 2011, we recorded an income tax benefit of $2.9 million on a pretax loss of $0.4 million. The benefit was primarily due to the resolution of certain foreign tax audits, partially offset by adjustments to the carrying value of deferred taxes in connection with changes in state tax laws.
Foreign Currency We own and operate facilities in Canada, Germany, France, the United Kingdom and the Philippines. The functional currency of our Canadian operations is the U.S. dollar. However, in Germany and France it is the Euro, in the UK it is the British Pound Sterling, and in the Philippines the currency is the Peso. During the second quarter of 2012, Euro functional currency operations generated approximately 26.1% of our sales and 24.6% of operating expenses and British Pound Sterling operations represented 8.0% of net sales and 7.7% of operating expenses. The translation of the results from these international operations into U.S. dollars is subject to changes in foreign currency exchange rates.
The table below summarizes the effect from foreign currency translation on second quarter 2012 reported results compared to the second quarter 2011:
The above table only presents the financial reporting impact of foreign currency translations assuming currency exchange rates in 2012 were the same as 2011. It does not present the impact of certain competitive advantages or disadvantages of operating or competing in multi-currency markets.
In thousands Three months ended June 30 Favorable (unfavorable)
Net sales $ (13,656) Costs of products sold 10,502 SG&A expenses 1,104 Income taxes and other 134
Net income $ (1,917)
1 8
LIQUIDITY AND CAPITAL RESOURCES
Our business is capital intensive and requires significant expenditures for new or enhanced equipment, for environmental compliance matters, to support our research and development efforts and for our business strategy. In addition we have mandatory debt service requirements of both principal and interest. The following table summarizes cash flow information for each of the years presented:
As of June 30, 2012, we had $23.4 million in cash and cash equivalents and $327.4 million available under our revolving credit agreement, which matures in November 2016.
Operating cash flow declined in the year-over-year comparison by $19.8 million. The decline was primarily due to $17.8 million of cellulosic biofuel credits in 2011. In 2012, there was no impact on operating cash flows from such credits.
Net cash used by investing activities totaled $23.4 million in the first six months of 2012 compared with $24.4 million in the first six months of 2011. Capital expenditures totaled $30.6 million in the first six months of 2012 compared with $27.9 million in the same period of 2011. Increased capital expenditures include $7.3 million for the Composite Fibers capacity expansion. Capital expenditures are expected to approximate $90 million to $95 million in 2012 including $30 million of the $50 million investment to expand capacity to serve Composite Fibers’ growth markets.
Net cash used by financing activities increased $6.3 million in the first half of 2012 compared with the same period of 2011, reflecting a $9.0 million reduction in borrowings under our revolving credit facility in the first six months of 2012.
Six months ended June 30In thousands 2012 2011
Cash and cash equivalents at beginning of period $ 38,277 $ 95,788
Cash provided by (used for)
Operating activities 28,532 48,313 Investing activities (23,398) (24,437) Financing activities (19,736) (13,446)
Effect of exchange rate changes on cash (238) 2,078
Net cash provided (used) (14,840) 12,508
Cash and cash equivalents at end of period $ 23,437 $108,296

- 30 -
During the first six months of 2012 and 2011 cash dividends paid on common stock totaled $7.8 million and $8.4 million, respectively. Our Board of Directors determines what, if any, dividends will be paid to our shareholders. Dividend payment decisions are based upon then-existing factors and conditions and, therefore, historical trends of dividend payments are not necessarily indicative of future payments.
In May 2012, our Board of Directors authorized a two year share repurchase program for up to $25.0 million of our outstanding common stock. The timing and actual number of shares repurchased will depend on a variety of factors including the market price of our stock, regulatory, legal and contractual requirements, and other market factors. The program, which does not obligate us to repurchase any particular amount of common stock, may be modified or suspended at any time at the Board’s discretion. The following table summarizes share repurchases made under this program through June 30, 2012:
The following table sets forth our outstanding long-term indebtedness:
Our revolving credit facility contains a number of customary compliance covenants. In addition, the 7 / % Notes contain cross default provisions that could result in all such notes becoming due and payable in the event of a failure to repay debt outstanding under the credit agreement at maturity, or a default under the credit agreement, that accelerates the debt outstanding thereunder. As of June 30, 2012, we met all of the requirements of our debt covenants. The significant terms of the debt instruments are more fully discussed in Item 1 – Financial Statements – Note 9.
We are subject to various federal, state and local laws and regulations which operate to protect the environment as well as human health and safety. We have, at various times, incurred significant cost to comply with these regulations, as new regulations are developed or regulatory priorities change. Currently, we anticipate that
shares (thousands)
Authorized amount n/a $ 25,000 Repurchases 172,157 (2,605)
Remaining authorization $ 22,395
In thousands Jun. 30,
2012 Dec. 31,
2011
Revolving credit facility, due Nov. 2016 $ 18,000 $ 27,000
7 / % Notes, due May 2016 200,000 200,000
Total long-term debt 218,000 227,000 Less current portion — —
Long-term debt, net of current portion $218,000 $227,000
1 8
1 8
we could incur material capital and operating costs to comply with several air quality regulations including the U.S. EPA Best Available Retrofit Technology rule (BART; otherwise known as the Regional Haze Rule) and the Boiler Maximum Achievable Control Technology rule (Boiler MACT). For example, on March 21, 2011, the U. S. Environmental Protection Agency issued new rules which could require process modifications and/or installation of air pollution controls on power boilers at two of our facilities. We are currently reviewing these rules, and challenges to them filed by others in the court system, to understand the effect they may have on our operations if we are required to comply with the rules in their current form. We are also evaluating options that may be available to us, such as reducing or curtailing boiler usage or modifying the types of boilers operated or fuel consumed. The cost of compliance is likely to be significant. Our initial estimates to implement viable options could result in additional capital spending in excess of $30 million; however, the amount ultimately incurred may be less depending on the outcome of challenges to current rules or on our successful implementation of appropriate available options. In addition, the timing of any additional capital spending is uncertain. Enactment of new environmental laws or regulations or changes in existing laws or regulations could significantly change our estimates.
In addition, we may incur obligations to remove or mitigate any adverse effects on the environment resulting from our operations, including the restoration of natural resources and liability for personal injury and for damages to property and natural resources. See Item 1 – Financial Statements – Note 14 for a summary of significant environmental matters.
In connection with our intention to amend our federal income tax returns to convert alternative fuel mixture credits to cellulosic biofuel credits, we will be required to return to the Internal Revenue Service approximately $25 million during the third quarter of 2012. Based on current regulations and on our assumptions regarding future financial results, we expect to be able to utilize the cellulosic biofuel production credits to reduce future income tax payments, including $9.7 million in the second half of 2012. However, changes in regulations or actual financial performance could affect our ability to utilize such credits.
We expect to meet all of our near- and longer-term cash needs from a combination of operating cash flow, cash and cash equivalents, our credit facility or other bank lines of credit and other long-term debt. However, as discussed in Item 1 – Financial Statements – Note 14, an unfavorable outcome of various environmental matters could have a material adverse impact on our consolidated financial position, liquidity and/or results of operations.
Off-Balance-Sheet Arrangements As of June 30, 2012 and December 31, 2011, we had not entered into any off-balance-sheet arrangements. Financial derivative instruments, to which we are a party, and guarantees of

- 31 -
ITEM 3. QUANTITATIVE AND QUALITATIVE DISCLOSURES ABOUT MARKET RISKS
Year Ended December 31 At June 30, 2012
Dollars in thousands 2012 2013 2014 2015 2016 Carrying
Value Fair Value
Long-term debt
Average principal outstanding
At fixed interest rates – Bond $200,000 $200,000 $200,000 $200,000 $76,923 $200,000 $205,005 At variable interest rates 18,000 18,000 18,000 18,000 15,231 18,000 18,000
$218,000 $223,005
Weighted-average interest rate
On fixed rate debt – Bond 7.13% 7.13% 7.13% 7.13% 7.13%
On variable rate debt 2.00% 2.00% 2.00% 2.00% 2.00%
indebtedness, which solely consist of obligations of subsidiaries and a partnership, are reflected in the condensed consolidated balance sheets included herein in Item 1 – Financial Statements.
Outlook For Specialty Papers, we expect shipping volumes to increase by approximately 5% in the third quarter of 2012 compared with the second quarter of 2012. The impact of selling price increases announced earlier in the year is expected to slightly outpace overall input cost increases compared to the second quarter. During the second quarter the business completed its annual maintenance outages at a cost of $19.9 million. For the third quarter, maintenance spending is expected to be higher than normal quarterly rates due to ongoing initiatives to enhance this business unit’s machine reliability and operating efficiencies.
We anticipate Composite Fibers’ shipping volumes to be slightly higher in the third quarter compared to the second quarter while selling prices and input costs are expected to be generally in line with the second quarter of 2012 upgrades. In addition, start-up issues associated with two machine upgrades completed in the first half of 2012 are expected to be resolved during the third quarter cost control measures are offset to benefit results.
Shipping volumes for the Advanced Airlaid Materials business unit in the third quarter of 2012 are expected to be slightly higher than the second quarter of 2012, while selling prices and input costs are expected to be in-line with the second quarter. We expect ongoing benefits from continuous improvement initiatives.
The table above presents the average principal outstanding and related interest rates for the next five years for debt outstanding as of June 30, 2012. Fair values included herein have been determined based upon rates currently available to us for debt with similar terms and remaining maturities.
Our market risk exposure primarily results from changes in interest rates and currency exchange rates. At June 30, 2012, we had long-term debt outstanding of $218.0 million, of which $18.0 million, or 8.3%, was at variable interest rates. Variable-rate debt outstanding represents borrowings under our revolving credit agreement that accrues interest based on one month LIBOR plus a margin. At June 30, 2012, the weighted-average interest rate paid was approximately 2.00%. A hypothetical 100 basis point increase or decrease in the interest rate on variable rate debt would increase or decrease annual interest expense by $0.2 million.
As part of our overall risk management practices, we enter into financial derivatives primarily designed to either i) hedge foreign currency risks associated with forecasted transactions – “cash flow hedges”; or ii) mitigate the impact that changes in currency exchange rates have on intercompany financing transactions and foreign currency denominated receivables and payables – “foreign currency hedges.” For a more complete discussion of this activity, refer to Item 1 – Financial Statements – Note 12.
We are subject to certain risks associated with changes in foreign currency exchange rates to the extent our operations are conducted in currencies other than the U.S. Dollar. During the first six months of 2012, Euro functional currency operations generated approximately 25.9% of our sales and 24.7% of operating expenses and British Pound Sterling operations represented 7.5% of net sales and 7.3% of operating expenses.

PART II
The following exhibits are filed herewith or incorporated by reference as indicated.
- 32 -
ITEM 6. EXHIBITS
31.1
Certification of Dante C. Parrini, Chairman and Chief Executive Officer of Glatfelter, pursuant to Section 302(a) of the Sarbanes-Oxley Act of 2002.
31.2
Certification of John P. Jacunski, Senior Vice President and Chief Financial Officer of Glatfelter, pursuant to Section 302(a) of the Sarbanes-Oxley Act of 2002.
32.1
Certification of Dante C. Parrini, Chairman and Chief Executive Officer of Glatfelter, pursuant to Section 906 of the Sarbanes-Oxley Act of 2002, 18 U.S.C. Section 1350.
32.2
Certification of John P. Jacunski, Senior Vice President and Chief Financial Officer of Glatfelter, pursuant to Section 906 of the Sarbanes-Oxley Act of 2002, 18 U.S.C. Section 1350.
101.INS XBRL Instance Document *
101.SCH XBRL Taxonomy Extension Schema *
101.CAL XBRL Extension Calculation Linkbase *
101.DEF XBRL Extension Definition Linkbase *
101.LAB XBRL Extension Label Linkbase *
101.PRE XBRL Extension Presentation Linkbase *
* Furnished herewith.
Evaluation of Disclosure Controls and Procedures Our chief executive officer and our principal financial officer, after evaluating the effectiveness of our disclosure controls and procedures (as defined in Exchange Act Rules 13a-15(e) and 15d-15(e)) as of June 30, 2012, have concluded that, as of the evaluation date, our disclosure controls and procedures are effective.
ITEM 4. CONTROLS AND PROCEDURES
Changes in Internal Controls There were no changes in our internal control over financial reporting during the three months ended June 30, 2012, that have materially affected or are reasonably likely to materially affect our internal control over financial reporting.

SIGNATURES
Pursuant to the requirements of Section 13 or 15(d) of the Securities Exchange Act of 1934, the Registrant has duly caused this report to be signed on its behalf by the undersigned, thereunto duly authorized.
- 33 -
P. H. GLATFELTER COMPANY (Registrant)
August 1, 2012
By /s/ David C. Elder David C. Elder
Vice President, Finance

EXHIBIT 31.1
CERTIFICATION PURSUANT TO SECTION 302 (a) OF THE SARBANES-OXLEY ACT OF 2002 I, Dante C. Parrini, certify that:
August 1, 2012
- 34 -
1. I have reviewed this Quarterly Report on Form 10-Q for the quarter ended June 30, 2012, of P. H. Glatfelter Company (“Glatfelter”);
2. Based on my knowledge, this report does not contain any untrue statement of a material fact or omit to state a material fact necessary to make the statements made, in light of the circumstances under which such statements were made, not misleading with respect to the period covered by this report;
3. Based on my knowledge, the financial statements, and other financial information included in this report, fairly present in all material respects the financial condition, results of operations and cash flows of the registrant as of, and for, the periods presented in this report.
4. Glatfelter’s other certifying officer and I are responsible for establishing and maintaining disclosure controls and procedures (as defined in Exchange Act Rules 13a-15(e) and 15d-15(e)) and internal control over financial reporting (as defined in Exchange Act Rules 13a-15(f) and 15d-15(f)) for Glatfelter and have:
(a) Designed such disclosure controls and procedures, or caused such disclosure controls and procedures to be designed under our supervision, to ensure that material information relating to Glatfelter, including its consolidated subsidiaries, is made known to us by others within those entities, particularly during the period in which this report is being prepared;
(b) Designed such internal control over financial reporting, or caused such internal control over financial reporting to be designed under our supervision, to provide reasonable assurance regarding the reliability of financial reporting and the preparation of financial statements for external purposes in accordance with generally accepted accounting principles;
(c) Evaluated the effectiveness of Glatfelter’s disclosure controls and procedures and presented in this report our
conclusions about the effectiveness of the disclosure controls and procedures, as of the end of the period covered by this report based on such evaluation; and
(d) Disclosed in this report any change in Glatfelter’s internal control over financial reporting that occurred during
Glatfelter’s most recent fiscal quarter (the fourth fiscal quarter in the case of an annual report) that has materially affected, or is reasonably likely to materially affect, Glatfelter’s internal control over financial reporting.
5. Glatfelter’s other certifying officer and I have disclosed, based on our most recent evaluation of internal control over financial reporting, to Glatfelter’s auditors and the audit committee of Glatfelter’s board of directors (or persons performing similar functions):
(a) All significant deficiencies and material weaknesses in the design or operation of internal control over financial
reporting which are reasonably likely to adversely affect Glatfelter’s ability to record, process, summarize and report financial information; and
(b) Any fraud, whether or not material, that involves management or other employees who have a significant role in
Glatfelter’s internal control over financial reporting.
By /s/ Dante C. Parrini Dante C. Parrini Chairman and Chief Executive Officer

EXHIBIT 31.2
CERTIFICATION PURSUANT TO SECTION 302 (a) OF THE SARBANES-OXLEY ACT OF 2002 I, John P. Jacunski, certify that:
August 1, 2012
- 35 -
1. I have reviewed this Quarterly Report on Form 10-Q for the quarter ended June 30, 2012, of P. H. Glatfelter Company (“Glatfelter”);
2. Based on my knowledge, this report does not contain any untrue statement of a material fact or omit to state a material fact necessary to make the statements made, in light of the circumstances under which such statements were made, not misleading with respect to the period covered by this report;
3. Based on my knowledge, the financial statements, and other financial information included in this report, fairly present in all material respects the financial condition, results of operations and cash flows of the registrant as of, and for, the periods presented in this report.
4. Glatfelter’s other certifying officer and I are responsible for establishing and maintaining disclosure controls and procedures (as defined in Exchange Act Rules 13a-15(e) and 15d-15(e)) and internal control over financial reporting (as defined in Exchange Act Rules 13a-15(f) and 15d-15(f)) for Glatfelter and have:
(a) Designed such disclosure controls and procedures, or caused such disclosure controls and procedures to be designed under our supervision, to ensure that material information relating to Glatfelter, including its consolidated subsidiaries, is made known to us by others within those entities, particularly during the period in which this report is being prepared;
(b) Designed such internal control over financial reporting, or caused such internal control over financial reporting to be designed under our supervision, to provide reasonable assurance regarding the reliability of financial reporting and the preparation of financial statements for external purposes in accordance with generally accepted accounting principles;
(c) Evaluated the effectiveness of Glatfelter’s disclosure controls and procedures and presented in this report our
conclusions about the effectiveness of the disclosure controls and procedures, as of the end of the period covered by this report based on such evaluation; and
(d) Disclosed in this report any change in Glatfelter’s internal control over financial reporting that occurred during
Glatfelter’s most recent fiscal quarter (the fourth fiscal quarter in the case of an annual report) that has materially affected, or is reasonably likely to materially affect, Glatfelter’s internal control over financial reporting.
5. Glatfelter’s other certifying officer and I have disclosed, based on our most recent evaluation of internal control over financial reporting, to Glatfelter’s auditors and the audit committee of Glatfelter’s board of directors (or persons performing similar functions):
(a) All significant deficiencies and material weaknesses in the design or operation of internal control over financial
reporting which are reasonably likely to adversely affect Glatfelter’s ability to record, process, summarize and report financial information; and
(b) Any fraud, whether or not material, that involves management or other employees who have a significant role in
Glatfelter’s internal control over financial reporting.
By /s/ John P. Jacunski John P. Jacunski Senior Vice President and Chief Financial Officer

EXHIBIT 32.1
CERTIFICATION PURSUANT TO SECTION 906 OF THE SARBANES-OXLEY ACT OF 2002 18 U.S.C. SECTION 1350
In connection with the Quarterly Report on Form 10-Q for the quarter ended June 30, 2012, of P. H. Glatfelter Company (the “Company”) as filed with the Securities and Exchange Commission on the date hereof (the “Report”), I, Dante C. Parrini, Chairman, President and Chief Executive Officer of the Company, certify to the best of my knowledge, pursuant to Section 906 of the Sarbanes-Oxley Act of 2002, 18 U.S.C. Section 1350, that:
A signed original of this written statement required by Section 906 has been provided to Glatfelter and will be retained by Glatfelter and furnished to the Securities and Exchange Commission or its staff upon request.
August 1, 2012
- 36 -
1) The Report fully complies with the requirements of section 13(a) or 15(d) of the Securities Exchange Act of 1934, as
amended; and
2) The information contained in the Report fairly presents, in all material respects, the financial condition and results of
operations of the Company.
By /s/ Dante C. Parrini Dante C. Parrini Chairman and Chief Executive Officer

EXHIBIT 32.2
CERTIFICATION PURSUANT TO SECTION 906 OF THE SARBANES-OXLEY ACT OF 2002 18 U.S.C. SECTION 1350
In connection with the Quarterly Report on Form 10-Q for the quarter ended June 30, 2012, of P. H. Glatfelter Company (the “Company”) as filed with the Securities and Exchange Commission on the date hereof (the “Report”), I, John P. Jacunski, Senior Vice President and Chief Financial Officer of the Company, certify to the best of my knowledge, pursuant to Section 906 of the Sarbanes-Oxley Act of 2002, 18 U.S.C. Section 1350, that:
A signed original of this written statement required by Section 906 has been provided to Glatfelter and will be retained by Glatfelter and furnished to the Securities and Exchange Commission or its staff upon request.
August 1, 2012
- 37 -
1) The Report fully complies with the requirements of section 13(a) or 15(d) of the Securities Exchange Act of 1934, as
amended; and
2) The information contained in the Report fairly presents, in all material respects, the financial condition and results of
operations of the Company.
By /s/ John P. Jacunski John P. Jacunski Senior Vice President and Chief Financial Officer