FORM 10-K ANNUAL REPORT PURSUANT TO SECTION … · Item No. 11 Executive Compensation ......
67
UNITED STATES SECURITIES AND EXCHANGE COMMISSION WASHINGTON, D.C. 20549 ____________ FORM 10-K ANNUAL REPORT PURSUANT TO SECTION 13 OR 15(d) OF THE SECURITIES EXCHANGE ACT OF 1934 For the Fiscal Year Ended December 31, 2017 (Mark One) ANNUAL REPORT PURSUANT TO SECTION 13 OR 15 (d) OF THE SECURITIES EXCHANGE ACT OF 1934 For the fiscal year ended December 31, 2017 OR TRANSITION REPORT PURSUANT TO SECTION 13 OR 15 (d) OF THE SECURITIES EXCHANGE ACT OF 1934 For the transition period from _________to_________ Commission File Number 000-19932 RELIV’ INTERNATIONAL, INC. (Exact name of Registrant as specified in its charter) Delaware 371172197 (State or other jurisdiction of (I.R.S. Employer Identification Number) incorporation or organization) 136 Chesterfield Industrial Boulevard Chesterfield, Missouri 63005 (Address of principal executive offices) (Zip Code) (636) 537-9715 Registrant’s telephone number, including area code Securities registered pursuant to Sections 12(b) of the Act: Title of Each Class Name of Each Exchange on Which Registered Common Stock, par value $0.001 NASDAQ Global Select Market Securities registered pursuant to Section 12(g) of the Act: None Indicate by check mark if the registrant is a well-known seasoned issuer, as defined in Rule 405 of the Securities Act. Yes No Indicate by check mark if the registrant is not required to file reports pursuant to Section 13 or Section 15(d) of the Act. Yes No Indicate by check mark whether the registrant (1) has filed all reports required to be filed by Section 13 or 15(d) of the Securities Exchange Act of 1934 during the preceding 12 months (or for such shorter period that the
Transcript of FORM 10-K ANNUAL REPORT PURSUANT TO SECTION … · Item No. 11 Executive Compensation ......

UNITED STATESSECURITIES AND EXCHANGE COMMISSION
WASHINGTON, D.C. 20549____________
FORM 10-KANNUAL REPORT PURSUANT TO
SECTION 13 OR 15(d) OF THE SECURITIESEXCHANGE ACT OF 1934
For the Fiscal Year Ended December 31, 2017(Mark One)
ANNUAL REPORT PURSUANT TO SECTION 13 OR 15 (d) OF THE SECURITIESEXCHANGE ACT OF 1934
For the fiscal year ended December 31, 2017
OR
TRANSITION REPORT PURSUANT TO SECTION 13 OR 15 (d) OF THE SECURITIESEXCHANGE ACT OF 1934
For the transition period from _________to_________
Commission File Number000-19932
RELIV’ INTERNATIONAL, INC.(Exact name of Registrant as specified in its charter)
Delaware 371172197(State or other jurisdiction of (I.R.S. Employer Identification Number)incorporation or organization)
136 Chesterfield Industrial BoulevardChesterfield, Missouri 63005
(Address of principal executive offices) (Zip Code)
(636) 537-9715Registrant’s telephone number, including area code
Securities registered pursuant to Sections 12(b) of the Act:
Title of Each Class Name of Each Exchange on Which Registered
Common Stock, par value $0.001 NASDAQ Global Select Market
Securities registered pursuant to Section 12(g) of the Act: None
Indicate by check mark if the registrant is a well-known seasoned issuer, as defined in Rule 405 of theSecurities Act. Yes No
Indicate by check mark if the registrant is not required to file reports pursuant to Section 13 orSection 15(d) of the Act. Yes No
Indicate by check mark whether the registrant (1) has filed all reports required to be filed by Section 13 or15(d) of the Securities Exchange Act of 1934 during the preceding 12 months (or for such shorter period that the

registrant was required to file such reports), and (2) has been subject to such filing requirements for the past90 days. Yes No
Indicate by check mark whether the registrant has submitted electronically and posted on its corporate Website, if any, every Interactive Data File required to be submitted and posted pursuant to Rule 405 of Regulation S-T(§ 232.405 of this chapter) during the preceding 12 months (or for such shorter period that the registrant wasrequired to submit and post such files). Yes No
Indicate by check mark if disclosure of delinquent filers pursuant to Item 405 of Regulation S-K (§229.405of this chapter) is not contained herein, and will not be contained, to the best of registrant’s knowledge, in definitiveproxy or information statements incorporated by reference in Part III of this Form 10-K or any amendment to thisForm 10-K.
Indicate by check mark whether the registrant is a large accelerated filer, an accelerated filer, a non-accelerated filer, a smaller reporting company, or emerging growth company. See the definitions of “largeaccelerated filer,” “accelerated filer,” “smaller reporting company,” and "emerging growth company" in Rule 12b-2of the Exchange Act. (Check one):
Large accelerated filer Accelerated filer Non-accelerated filer (Do not check if a smaller reporting company)
Smaller reporting company Emerging growth company
If an emerging growth company, indicate by check mark if the registrant has elected not to use the extendedtransition period for complying with any new or revised financial accounting standards provided pursuant to Section13(a) of the Exchange Act.
Indicate by check mark whether registrant is a shell company (as defined in Rule 12b-2 of the ExchangeAct). Yes No
Based upon the closing price of $8.78 per share of the registrant’s common stock as reported on theNASDAQ Global Select Market on June 30, 2017, the aggregate market value of the common stock held by non-affiliates of the registrant was approximately $9.9 million. (The determination of stock ownership by non-affiliateswas made solely for the purpose of responding to the requirements of the Form and the registrant is not bound bythis determination for any other purpose.)
The number of shares outstanding of the registrant’s common stock as of March 19, 2018 was 1,845,160(excluding treasury shares).
DOCUMENTS INCORPORATED BY REFERENCE
DocumentPart of Form 10-K into Which
Document Is Incorporated
Sections of the registrant’s definitive Proxy Statement for the AnnualMeeting of Stockholders to be held on May 24, 2018, which is expectedto be filed no later than 120 days after December 31, 2017
Part III

INDEX
Part I
Item No. 1 Business ................................................................................................................................ 1Item No. 2 Properties .............................................................................................................................. 17Item No. 3 Legal Proceedings ................................................................................................................. 17
Part II
Item No. 5 Market for Registrant’s Common Equity, Related StockholderMatters and Issuer Purchases of Equity Securities................................................................ 18
Item No. 7 Management’s Discussion and Analysis ofFinancial Condition and Results of Operations..................................................................... 19
Item No. 8 Financial Statements and Supplementary Data ..................................................................... 28Item No. 9 Changes in and Disagreements with Accountants
on Accounting and Financial Disclosure .............................................................................. 28Item No. 9A Controls and Procedures ....................................................................................................... 28Item No. 9B Other Information ................................................................................................................. 28
Part III
Item No. 10 Directors, Executive Officers and Corporate Governance .................................................... 29Item No. 11 Executive Compensation....................................................................................................... 29Item No. 12 Security Ownership of Certain Beneficial Owners
and Management and Related Stockholder Matters.............................................................. 29Item No. 13 Certain Relationships and Related Transactions, and Director Independence ...................... 29Item No. 14 Principal Accounting Fees and Services ............................................................................... 29
Part IV
Item No. 15 Exhibits and Financial Statement Schedules......................................................................... 29

1
FORWARD-LOOKING STATEMENTS
This annual report includes both historical and “forward-looking statements” within the meaning of Section21E of the Securities Exchange Act of 1934, as amended. We have based these forward-looking statements on ourcurrent expectations and projections about future results. Words such as “may,” “should,” “could,” “would,”“expect,” “plan,” “anticipate,” “believe,” “estimate,” “predict,” “potential,” “continue,” or similar words areintended to identify forward-looking statements, although not all forward-looking statements contain these words.Although we believe that our opinions and expectations reflected in the forward-looking statements are reasonable,we cannot guarantee future results, levels of activity, performance or achievements, and our actual results may differsubstantially from the views and expectations set forth in this annual report. We disclaim any intent or obligation toupdate any forward-looking statements after the date of this annual report to conform such statements to actualresults or to changes in our opinions or expectations.
PART I
Item No. 1 - Business
Overview
We are a developer, manufacturer and marketer of a proprietary line of nutritional supplements addressingbasic nutrition, specific wellness needs, weight management and sports nutrition. We sell our products through aninternational network marketing system using independent distributors. We have sold products in the United Statessince 1988 and in selected international markets since 1991.
We currently offer 18 nutritional supplements, and our product offering has selectively evolved over ourhistory. Our core line of nutritional supplements which represented 59.3% of net sales for the year ended December31, 2017, included the following five products:
• Reliv Classic and Reliv NOW — two basic nutritional supplements containing a full and balancedblend of vitamins, minerals, protein and herbs
• Innergize! — an isotonic sports supplement in two flavors• FibRestore — a high-fiber and antioxidant supplement• LunaRich X — a soy concentrate with elevated levels of lunasin, in capsule form
Following the introduction of our LunaRich X capsules in 2013, we experienced a gradual shift in ourproduct sales mix reflecting an increasing emphasis on Reliv NOW and LunaRich X capsules. For the year endedDecember 31, 2017, Reliv NOW constituted 21.1% of net product sales, and LunaRich X capsules represented15.9%. The combination of Reliv NOW and LunaRich X capsules have increasingly become the focus of ourproduct strategy. As a result of this strategy, we offer a Super Pack product kit that contains four cans of RelivNOW and four bottles of LunaRich X each containing 60 capsules. We also offer a Super Pack kit with RelivClassic instead of Reliv NOW. The Super Pack was designed as a simple, focused approach that capitalizes on ourmost popular products and provides an entry point at a 25% discount for new distributors who want to build abusiness.
In February 2017, we launched our Fit3 fitness and weight loss program in the United States to broaden andbolster our weight management offering, and to appeal to a broader demographic than our essential nutrition. TheFit3 program consists of three principal components: (1) nutrition coaching, (2) exercise coaching and videos, and(3) three fitness products: Active, Burn and Purify. The Fit3 program involves our most interactive offering fordistributors and customers, including a separate website with independent content and a focused social mediaoutreach and support initiative. We offer a Fit Kit that includes a 90-day supply of the Fit3 products and access tothe information, tools and videos we offer through the program. We believe the Fit3 program provides an attractivealternate entry point for new distributors or customers who are more interested in weight loss and fitness than ouressential nutrition or targeted solutions.
We periodically refine our products and introduce related new products and product categories. Ourinternal research and development team has developed most of our products, and we hold U.S. patents on five of

2
these products —ReversAge, GlucAffect, ProVantage, 24K and CardioSentials. We also own several U.S. andinternational patents and patent applications related to lunasin through our acquisition of the lunasin technology inSeptember 2016.
We believe that our network marketing model is the best method for the marketing and sale of our productsbecause it utilizes ongoing personal contact among our distributors and their retail customers. This enables ourdistributors to communicate directly regarding the products, the business opportunity we offer and their personalexperiences with both. We provide our distributors with a financially rewarding and entrepreneurial businessopportunity, affording them the ability to earn compensation both from the direct sale of products and from salesvolume generated by distributors they sponsor. We actively support our distributors by providing marketingmaterials, a dependable product fulfillment system and frequent educational, training and motivational programs.
The majority of our sales traditionally has been, and is expected to continue to be, made through ourdistributors in the United States. We also currently generate sales through distributor networks in Australia, Austria,Canada, France, Germany, Indonesia, Ireland, Malaysia, Mexico, the Netherlands, New Zealand, the Philippines,Singapore and the United Kingdom. In each country in which we conduct business, our distributors operate under abusiness and compensation model that maintains consistent marketing, sales, fulfillment, and complianceprocedures. As of December 31, 2017, our network consisted of approximately 33,620 distributors and preferredcustomers —23,050 in the United States and 10,570 across our international markets.
We manufacture nearly all of our powdered nutritional supplements and all of our encapsulated products atour facility in Chesterfield, Missouri. We believe our ability to formulate and manufacture our own nutritionalsupplements enables us to produce our products efficiently while maintaining our high standards of qualityassurance and proprietary product composition.
Industry Overview
Nutritional Supplement Market
We operate primarily in the $41.1 billion U.S. nutritional supplement market which is up 5.9% from theprior year. This is part of the broader $140 billion U.S. nutrition industry according to data published by theNutrition Business Journal, or NBJ, and an estimated $320.0 billion global nutrition industry, also according to theNBJ. Additionally, more than 170 million Americans, or 76% of all U.S. adults, take dietary supplements annuallyaccording to the Council for Responsible Nutrition, an increase of 5 percentage points from 2016.
A combination of demographic, healthcare and lifestyle trends are expected to drive continued growth inthe nutritional supplement market. These trends include:
• Aging Population: The older population (persons 65 years or older) numbered 47.8 million in 2015according to latest information from the Department of Health and Human Services. This populationsegment grew 1.6 million from 2014 and they represented 14.9% of the U.S. population, or about onein every seven Americans. By 2060, there will be approximately 98.2 million older persons, nearly onein four U.S. residents. Recent data from the Council for Responsible Nutrition shows that 80% ofadults aged 55 and over take dietary supplements. This is up from 74% in 2016. We believe this ever-growing population, living longer lives than in previous decades, will continue to focus on theirnutritional needs as they age.
• Rising Healthcare Costs and Commitment to Health: The cost of healthcare in the United States isprojected to have grown 4.6% in 2017, up slightly from 4.3% growth in 2016, according to the Centersfor Medicare and Medicaid Services (CMS). In 2015, U.S. healthcare spending reached $3.3 trillion or$10,348 per person. As reported from Frost and Sullivan, approximately 75% of total U.S. health careexpenditures are spent on preventable health issues. Many studies have demonstrated that dietarysupplements have a positive effect on reducing the potential for health issues and consumers arereacting to this by taking charge of their personal health. In a recent survey conducted by Harris Poll,taking vitamins was one of the top five responses from participants wanting to improve health and

3
wellness habits. We believe more consumers will seek the use of nutritional supplements to maintainquality of life as well as reduce medical costs.
• Continued Focus on Weight Management: According to a report published by The State of Obesity inSeptember 2016, nearly 38%, or more than one-third of U.S. men and women were obese, as werealmost 17% of U.S. children. It is estimated that 86.3% of Americans will be overweight or obese by2030. Health care costs related to obesity currently account for almost 21% of U.S. health care costsaccording to a report by Cornell University and are expected to grow to as much as $956.9 billion by2030. Being overweight is linked to more than 90 chronic diseases and can lead to more serious healthconcerns such as diabetes, heart disease and other chronic illnesses. According to a May 2016 reportfrom Technavio, the global weight loss supplement market via direct selling was valued at $624.9million in 2015 and North America accounted for more than one-third of those sales. Bearing thesefacts in mind, we believe that there will be a continual need not only for weight loss products but alsofor wellness products.
Direct Selling Market
Health and nutrition products are distributed through various market means, including retailers such assupermarkets, drugstores, mass merchants and specialty retailers; direct marketers such as mail order companies andInternet retailers; and direct sellers such as network marketers and healthcare practitioners. We distribute ourproducts through the direct selling channel via our network marketers.
Direct selling involves the marketing of products and services directly to consumers in a person-to-personmanner. Direct selling is a significant global industry largely utilized for the sale of a wide range of consumerproducts from companies such as Avon Products Inc., Alticor Global Holdings, Inc. (Amway Corp.) andTupperware Brands Corporation. According to the World Federation of Direct Selling Associations, or WFDSA, the2016 global direct selling market (for all product categories) was estimated to be $182.6 billion, an increase from$179.1 billion in 2015. The WFDSA estimates that the number of individuals engaged in direct selling has nearlytripled between 1999 and 2016, from 35.9 million sellers to 107.3 million in 2016. The United States had 20.5million direct sellers in 2016, the most of any country. Globally, wellness products came in as the top sellingcategory, the second year in a row that it has come in ahead of cosmetics and personal care.
While the United States is currently the largest direct selling market with $35.5 billion in annual sales in2016, international markets account for 81% of the entire industry, according to the WFDSA. Twenty-fourcountries (including the United States) have annual direct sales revenue of at least $1 billion and another twenty-nine have annual direct sales revenue of at least $100 million, according to the WFDSA.
We believe that we are well positioned to capitalize on the world-wide growth trends in direct sales, as botha developer and manufacturer of proprietary nutritional products, utilizing our network marketing distributionsystem.
Our Competitive Strengths
We believe that we possess a number of competitive strengths that are the keys to our growth andprofitability in the future.
Leading Marketer of Bioavailable Lunasin-Containing Products. We own certain technology andproprietary testing and manufacturing processes that allow us to produce LunaRich X, to our knowledge, the onlycommercial source of soy concentrate with elevated levels of bioactive lunasin. One 310 mg capsule of LunaRich Xcontains an amount of lunasin equivalent to 25 grams of high quality soy protein. In addition to our LunaRich Xcapsules, we fortified seven other nutritional supplements with LunaRich X so that a serving of those productsyields an amount of bioactive lunasin equivalent to consuming 25 grams of soy protein. The products fortified withLunaRich X are Reliv NOW, Reliv NOW for Kids, ProVantage, GlucAffect, SoySentials, Slimplicity and Fit3Active.

4
Complete, Simple Nutrition. We focus on the completeness, balance and simplicity of our basic nutritionalsupplements — Reliv Classic or Reliv NOW — combined with LunaRich X. Our recommended daily regimen ofessential nutrition for any new distributor or customer is one shake of either Reliv NOW or Reliv Classic and twocapsules of LunaRich X. Our two basic nutritional supplements each contain a full and balanced blend of vitamins,minerals, proteins and herbs supporting an individual’s daily nutritional needs and our LunaRich X capsules supportan individual’s wellness at the epigenetic level. The combination of Reliv NOW or Reliv Classic and LunaRich Xmakes supplementation simple and effective for the consumer. For more specific individual needs, we provide 15additional supplements. We believe that our two basic nutritional supplements, together with LunaRich X and ouradditional supplements, enhance the ability of our distributors to build their businesses by providing acomprehensive, simple product offering.
In-House Development and Production. We utilize nutrition science as the basis for product formulation.We maintain an ongoing research and development effort led by Carl W. Hastings, Ph.D., our Chief ScientificOfficer and Vice Chairman. Since 1993, we have manufactured substantially all of our nutritional products at ourfacility in Chesterfield, Missouri. In 2015, we installed an encapsulator and bottling line to produce ourencapsulated products, and in 2017, we installed a canister line to produce our Active product and potentially otherproducts as we transition our product packaging from cardboard cans to plastic canisters. We outsource productionof our ready-to-drink product, 24K. We believe our ability to formulate and manufacture nearly all of ournutritional supplement products enables us to maintain our high standards of quality assurance and proprietaryproduct composition.
Experienced Ambassador Team. Our Ambassador corps consists of distributors who have achieved thelevel of Master Director, have earned royalty payments of at least $4,000 in consecutive months and meet ourleadership and character criteria necessary to garner our invitation to be an Ambassador. Our Ambassadors generallyare our most productive distributors and are essential in recruiting, motivating and training our entire distributornetwork. We, and our Ambassadors, lead hundreds of annual events throughout all of our markets to motivate andtrain distributors, including regular recruiting meetings, trainings, conference calls, training schools for MasterAffiliates and higher levels and regional, national and international distributor conferences.
Experienced and Incentivized Management Team. Our management team is led by our founder, Robert L.Montgomery, who has been our Chief Executive Officer since the inception of our company in 1985. Our executiveofficers have been employed by our company for an average of 22 years and are experienced in their areas of focus,which include manufacturing, sales, finance, marketing and operations. As of March 19, 2018, our directors andexecutive officers beneficially own approximately 39.1% of our common stock.
Our Business Strategy
Our basic objective is to increase our net sales by adding customers and distributors, increasing theproductivity of our distributors, and by periodically improving our existing products and introducing new products.We also intend to invest in our infrastructure to improve our operating efficiencies, provide better service to ourcustomers and distributors and leverage our current operating facilities to improve our profitability. We seek toaccomplish these objectives by employing the following strategic initiatives:
Leverage and Expand our Existing Distributor Base Throughout the United States. The United States hasbeen and will continue to be our largest market. Our growth strategy in the United States involves multipleinitiatives, such as the launch in early 2017 of our Fit3 product line and fitness program, continued investment incompany-sponsored events and distributor training and better utilization of our upper-level distributors acrossdifferent geographical areas to increase our distributor base.
Increase Appeal to Broader Demographic. Traditionally, our customer and distributor demographic hasskewed towards baby boomers and older individuals searching for nutritional solutions to supplement their diet andsupport overall wellness. While continuing to maintain our focus on the needs of this important segment, we believethere is an opportunity to expand our sales and distributor base by increasing our appeal to younger generationsinterested in nutrition and an active healthy lifestyle. In February 2017, we launched our Fit3 product line andfitness program aimed at individuals seeking to improve their fitness levels and incorporate healthier options intotheir daily routines. We believe the nutritional and fitness aspects of Fit3 will attract health conscious on-the-goindividuals, many of whom fall within the under-40 demographic. Further, we maintain an active presence on

5
popular social media sites including Facebook, Twitter, YouTube and several other social networks that are popularwith younger generations. Our internal social media team is comprised of Gen X and Gen Y staffers who regularlyinteract with distributors, customers and prospects. We plan to continue to develop products and programs andexpand our technology offerings in an effort to further appeal to younger generations interested in healthy activelifestyles and a vibrant evolving business opportunity.
Expand in Existing and New International Markets. We believe there is a significant opportunity toincrease our net sales in international markets. We have a business model that is compatible across all of ourmarkets and encourages our distributors to pursue their business in multiple markets. We believe this businessmodel supports expansion of our distributor network in our existing international markets and will provide aframework that facilitates our entry into new international markets. To that end, we continue to monitor businessconditions in potential new markets and will selectively expand as timing and conditions are appropriate.
Invest in Improved and New Products. As a developer of nutritional supplements, it is vital to continue toinvest in the research and development of new and innovative products. For example, in January 2017, weintroduced our Fit3 line of products and in January 2013 we launched LunaRich X to support heart health andoverall wellness. Additionally, we will continue to improve and validate the efficacy of our existing product line.These types of investments should facilitate customer and distributor retention, as well as the recruitment of newdistributors.
Expand and Improve our Manufacturing and Distribution Capabilities. We currently manufacture all ofour powdered nutritional supplements and our encapsulated products at our facility in Chesterfield, Missouri. Thisallows us to precisely control product composition and quality assurance as well as better manage inventory levels.Periodically, we make appropriate investments that enhance our manufacturing capabilities and capacity to furtherleverage our existing facilities and trained production staff. In mid-2017, we installed a canister line in our facilitiesto produce Active and allow us the option to transition the packaging of our other products to a plastic canister. Inthe second half of 2014, we purchased and installed an encapsulation production line. We expect to continue tomake appropriate investments in our manufacturing and fulfillment facilities.
Our Products
Product Overview
Our product line includes nutritional supplements that address basic nutrition, specific wellness needs,weight management and sports nutrition. We combine ingredients from science and nature in targeted, well-balanced, easy-to-use formulas that are specifically designed to enhance wellness and increase performance andenergy in specific applications. All but four of our supplements are in powdered form that the consumer mixes withwater, juice or other liquid. 24K is a ready-to-drink nutritional supplement and LunaRich X, Burn and Purify areavailable in capsule form.
We currently offer 18 nutritional supplements. Our basic nutritional supplements are formulated to providea balanced and complete level of supplementation for the consumer. For more specific needs, we provide otherfocused product formulations. We have purposely been selective in the number and types of products that we offer.By providing a line of targeted products, we make it simple for our distributors and consumers to choose productsappropriate for their objectives. We consider four of our oldest and best selling products — Reliv Classic, RelivNOW, Innergize!, and FibRestore — along with LunaRich X capsules to be our primary or “core” products.

6
The following table summarizes our product categories as of December 31, 2017. The net sales figures arefor the year ended December 31, 2017:
Product Category Product Name% of 2017Net Sales(1)
YearIntroduced
Basic Nutrition Reliv NOW 18.8 1988Reliv Classic 9.9 1988NOW for Kids 5.3 2000
Specific Wellness FibRestore 9.2 1993Arthaffect 6.7 1996ReversAge 3.6 2000SoySentials 1.4 1998CardioSentials 1.6 2005GlucAffect 1.0 200824K 1.6 2011LunaRich X capsules 14.2 2013
Weight Management Fit3 product line 4.7 2017Meal Replacements(2) 0.3 VariousCellebrate 0.4 1995
Sports Nutrition Innergize! 7.3 1991ProVantage 3.3 1997
______________________
(1) This table does not include net sales for the year ended December 31, 2017 related to freight and handling andsales of marketing materials, which represented approximately 10.7% of net sales for the year ended December31, 2017.
(2) Since its introduction in February 2007, our Slimplicity Meal Replacement formula has replaced Reliv Ultrim-Plus (available since 1988) in all but our Canadian and Mexican markets. Upon introduction of our Slimplicityproducts in a particular market, our Reliv Ultrim-Plus line was discontinued in that market. In October 2013,Reliv ReShape was launched in our Australian and New Zealand markets, at which time Slimsimply wasdiscontinued in those markets. With the launch of our Fit3 program and products in February 2017, wediscontinued Slimplicity.
Basic Nutrition Supplements
Our three basic nutrition supplements provide consumers with a broad spectrum of essential nutrients.Every formulation is specifically designed to optimize and enhance the benefits of the nutrients it contains.
• Reliv NOW is a nutritional supplement containing a variety of vitamins and minerals, soy and variousherbs. Reliv NOW is available in every country where we operate. In Australia, the product ismarketed as Nourish.
• Reliv Classic is a nutritional supplement containing a variety of vitamins and minerals, soy and variousherbs. It is a vegetarian product that contains no animal compounds, artificial preservatives, artificialflavors or added simple sugars. Reliv Classic is available in the United States, Canada, France,Germany, Austria, the Netherlands, the United Kingdom and Ireland.
• NOW for Kids is a product designed to provide a balanced nutritional supplement for a child’s diet andcontains a variety of vitamins and minerals. NOW for Kids is available in Australia, New Zealand, theUnited States, the United Kingdom, France, Germany, Ireland, Austria, the Netherlands, Mexico,Malaysia and the Philippines. In Australia, the product is marketed as Nourish for Kids.

7
Specific Wellness Supplements
Our line of eight specific wellness supplements contains specific compounds that target certain nutritionalneeds. Each product is intended to work in conjunction with our basic nutritional supplement formulas to provide aneffective and balanced method for sustaining health and well-being.
• ReversAge is a patented youth-promoting nutritional supplement designed to slow down the effects ofthe aging process. Three proprietary complexes form the foundation of the supplement: longevitycomplex, antioxidant complex and herbal complex. The longevity complex is restorative and designedto replenish key hormones while creating balance within the body’s major systems; the antioxidantcomplex is designed to slow aging at the cellular level; and the herbal complex delivers a variety ofherbs, including Ginkgo Biloba and Maca. ReversAge is available in every country where we operateexcept Germany, the United Kingdom, France, the Netherlands and Ireland. In Canada, the product ismarketed as Nutriversal.
• SoySentials is a nutritional supplement containing soy as well as other vitamins, minerals and herbsdesigned for use by women. SoySentials provides a woman with key nutrients targeted to promotewomen’s health and ease the symptoms of menopause and PMS. SoySentials is available in the UnitedStates and Mexico.
• CardioSentials is a patented berry-flavored nutritional supplement that promotes heart health. Theproduct contains 1,500 mg of phytosterols per serving, policosanol and several powerful antioxidants.In a clinical study of this product, participants experienced meaningful reductions in cholesterol aswell as improvement in their high-density lipoprotein, or HDL, and low-density lipoprotein, or LDL,ratios. CardioSentials is available only in the United States.
• Arthaffect is a nutritional supplement containing Arthred, a form of hydrolyzed collagen protein,which is clinically reported to support healthy joint function. The product is available in the UnitedStates, Australia, New Zealand, Mexico, the Philippines, Malaysia, Singapore, and Canada. Theproduct is marketed as A-Affect in Australia, New Zealand and Canada due to local productregulations.
• FibRestore is a nutritional supplement containing fiber, vitamins, minerals and herbs. A modifiedversion of the FibRestore formula is marketed in Canada under the name Herbal Harmony to complywith Canada’s nutritional regulations. FibRestore is available in all of the countries in which weoperate.
• GlucAffect is a patented cinnamon cream flavored nutritional supplement designed to support healthyblood sugar levels. GlucAffect contains Pycnogenol® and other clinically supported active ingredients.GlucAffect has been clinically proven to assist in healthy blood sugar management and support weightloss. GlucAffect is available in the United States.
• 24K is a patented ready-to-drink healthy energy product. 24K is our first ready-to-drink nutritionalsupplement available in a multi-serving 30-ounce bottle and in a two-ounce double serving bottle. 24Kis formulated with a synergistic blend of 24 active ingredients designed to enhance the body’s naturalvitality and provide energy, focus and stress relief. It contains no caffeine and only 5 calories perserving. 24K is available only in the United States.
• LunaRich X is a nutritional supplement available in capsule form and comes in a bottle of 60 or 120capsules. LunaRich X is a soy concentrate with elevated levels of bioactive lunasin, a soy peptideshown to have heart health and wellness benefits. LunaRich X is currently available in the UnitedStates, Canada, Mexico, the United Kingdom, France, Germany, Ireland, Austria, the Netherlands,Indonesia, the Philippines, Singapore and New Zealand. The product is marketed as LunaRich C inGermany, Austria, the United Kingdom, France, the Netherlands and Ireland due to local regulations.

8
Weight Management Supplements
Our five weight management supplements combine advanced weight loss promoting complexes withscientifically balanced nutrition and protein for muscle development and toning. Our ingredients are designed towork together, along with proper diet and exercise, to turn unwanted fat into energy without sacrificing musclemass.
• Active is a nutritional supplement designed as the protein, energy and recovery product for use in ourFit3 program introduced in February 2017. Active combines a three-protein blend of whey, casein andnon-GMO soy with active ingredients to support weight loss, physical performance and energy whencombined with healthy eating and exercise. Active is currently available in the United States.
• Burn is a nutritional supplement in our Fit 3 program that promotes weight loss when combined withhealthy eating and exercise through a targeted fat-burning formula. Burn is available in the UnitedStates.
• Purify is a nutritional supplement in our Fit3 program that contains probiotics and liver and metabolicsupporting ingredients intended to cleanse the digestive system and allow maximum absorption andmetabolic efficiency. Purify is available in the United States.
• Reliv ReShape is designed as a meal replacement or a nutritious snack delivering 12 grams ofprotein. Reliv ReShape is only sold in Australia and New Zealand.
• Reliv Ultrim-Plus is designed as a meal replacement (for a maximum of two meals per day) for use ina weight loss program. Reliv Ultrim-Plus is sold only in Mexico.
Sports Nutrition Supplements
Our two sports nutrition supplements contain a balance of nutrients scientifically designed to improveathletic performance and endurance, as well as muscle recovery and repair.
• Innergize! is a sports supplement, containing vitamins and minerals designed for performanceenhancement. Innergize! is available in every country where we operate. In Canada, the product ismarketed as Optain due to local product regulations.
• ProVantage is a patented nutritional supplement containing soy designed to enhance athleticperformance with a balance of nutrients needed to improve endurance, muscle recovery and repair. Theproduct also benefits those seeking to increase their soy intake. ProVantage is available in the UnitedStates and Canada.
Research and Development
We maintain an ongoing research and development effort, led by Carl W. Hastings, Ph.D., and consult withother industry professionals with respect to developments in nutritional science, product enhancements and newproducts. Since 2011, we have introduced five nutritional supplement products, including 24K, LunaRich X, Active,Burn and Purify. From time to time, we reformulate and enhance our products. Our research and development teamconsistently evaluates product advancements in the marketplace and advancements in raw materials and ingredientsavailable for new product ideas and developments.
For the years ended December 31, 2017 and 2016, our research and development expenses were $488,000and $694,000, respectively.

9
SL Technology, Inc.
In mid-2013, we formed a wholly-owned subsidiary, SL Technology, Inc. (“SLTI”) for the purpose ofentering into a Technology License Agreement (the “License Agreement”) with Soy Labs, LLC (“Soy Labs”).Pursuant to this License Agreement, Soy Labs granted SLTI an exclusive license for its intellectual property relatedto its soy concentrate with elevated levels of bioactive lunasin and other soy-related ingredients. The license coveredan issued patent and several patent applications related to lunasin and soy-related peptides, proprietary informationand manufacturing processes of Soy Labs.
In September 2016, we entered into a letter agreement with Soy Labs to acquire sole ownership ofintellectual property subject to the License Agreement. In consideration for acceleration of the final payment underthe License Agreement, Soy Labs transferred all rights, title and interest in the technology to us and terminated anyof our future royalty obligations under the License Agreement.
Network Marketing Program
General Overview
We market and sell our products through a network marketing system of independent distributors, whopurchase our products from us, or from other distributors, and who then sell our products directly to consumers. Inaddition to selling our products, our distributors also recruit others to distribute our products. Distributors receivecompensation from both the sale of the products they have purchased at wholesale and, in the case of MasterAffiliates and above, commissions on the volume of products sold by their downline organization. We believenetwork marketing is an effective way to distribute our products because it allows and relies on personal contact,education and endorsement of products which are not as readily available through other distribution channels.
We recognize that our sales growth is based on the continued development and growth of our independentdistributor force and we strive to maintain an active and motivated distributor network through a combination ofquality products, and a business opportunity with distributor discounts, commissions and bonus payments, salesconventions, training, personal recognition and a variety of publications and promotional materials.
Program Structure
Individuals that do not wish to become distributors, but want to purchase products directly from thecompany may enroll as retail or preferred customers, so long as they are sponsored by an existing distributor. Wecreated a Preferred Customer program in the United States and Canada, effective February 1, 2016. Those wishingto join as a preferred customer may enroll for an annual fee of $10, for which they receive a 10% discount from theretail prices of our products.
Individuals who desire to market and sell our products may become distributors by being sponsored intothe program by an existing distributor, and becoming part of that distributor’s “downline.” We offer a tiereddiscount and commission, or royalty, format that consists of four principal levels and several sub-levels, which aredesigned to compensate and motivate distributors to increase their networks and sales volumes.
Our distributors consist principally of individuals, although we also permit entities such as corporations,partnerships, limited liability companies and trusts to become distributors. A new distributor is required to completea distributor application and, in most areas, to purchase a package of distributor materials (for $40 plus sales tax inthe United States, as of February 1, 2016) consisting of a Distributor Guide and CD, business forms and promotionalmaterials. The Distributor Agreement, when accepted by us, becomes the contract between us and the distributor andobligates the distributor to the terms of the agreement, which includes our Policies and Procedures for conduct oftheir business. All distributors are independent contractors and are not our employees.
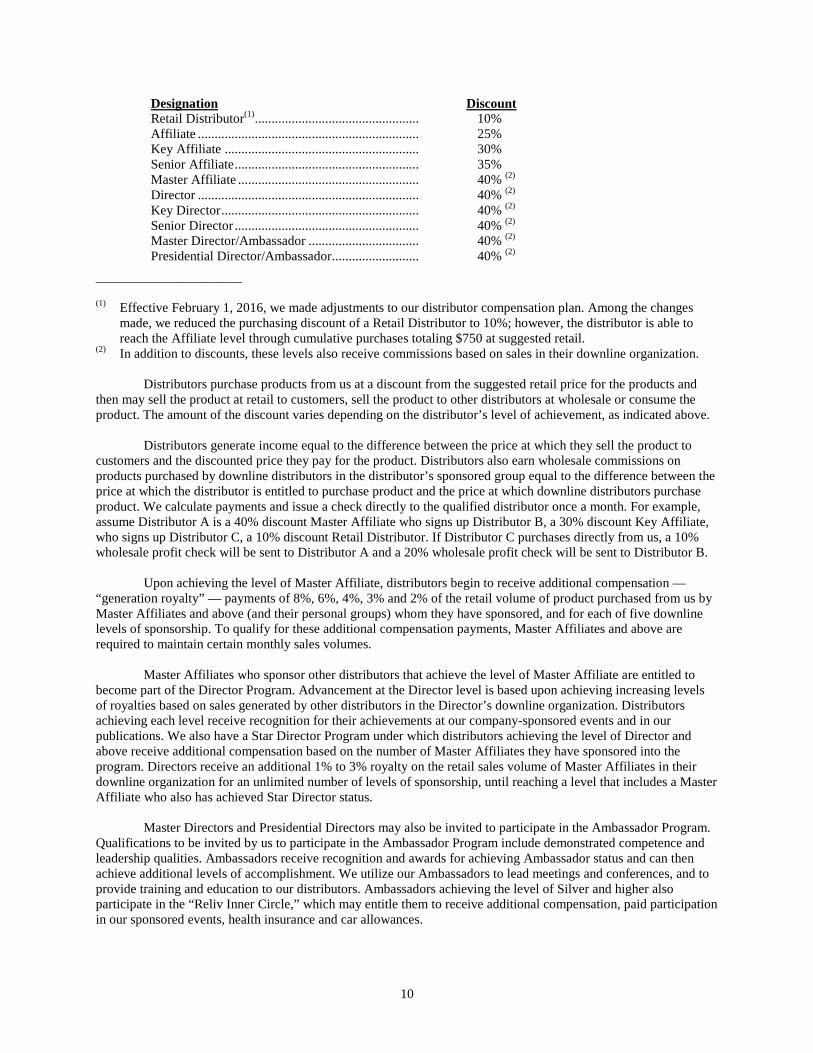
In each country in which we conduct business, distributors operate under a compensation system pursuantto which distributors generally are compensated based on their sales volumes. On the basis of sales volume orcommission volume, distributors may achieve the following successive levels of achievement and compensation:
10
Designation DiscountRetail Distributor(1)................................................. 10%Affiliate .................................................................. 25%Key Affiliate .......................................................... 30%Senior Affiliate....................................................... 35%Master Affiliate ...................................................... 40% (2)
Director .................................................................. 40% (2)
Key Director........................................................... 40% (2)
Senior Director ....................................................... 40% (2)
Master Director/Ambassador ................................. 40% (2)
Presidential Director/Ambassador.......................... 40% (2)
______________________
(1) Effective February 1, 2016, we made adjustments to our distributor compensation plan. Among the changesmade, we reduced the purchasing discount of a Retail Distributor to 10%; however, the distributor is able toreach the Affiliate level through cumulative purchases totaling $750 at suggested retail.
(2) In addition to discounts, these levels also receive commissions based on sales in their downline organization.
Distributors purchase products from us at a discount from the suggested retail price for the products andthen may sell the product at retail to customers, sell the product to other distributors at wholesale or consume theproduct. The amount of the discount varies depending on the distributor’s level of achievement, as indicated above.
Distributors generate income equal to the difference between the price at which they sell the product tocustomers and the discounted price they pay for the product. Distributors also earn wholesale commissions onproducts purchased by downline distributors in the distributor’s sponsored group equal to the difference between theprice at which the distributor is entitled to purchase product and the price at which downline distributors purchaseproduct. We calculate payments and issue a check directly to the qualified distributor once a month. For example,assume Distributor A is a 40% discount Master Affiliate who signs up Distributor B, a 30% discount Key Affiliate,who signs up Distributor C, a 10% discount Retail Distributor. If Distributor C purchases directly from us, a 10%wholesale profit check will be sent to Distributor A and a 20% wholesale profit check will be sent to Distributor B.
Upon achieving the level of Master Affiliate, distributors begin to receive additional compensation —“generation royalty” — payments of 8%, 6%, 4%, 3% and 2% of the retail volume of product purchased from us byMaster Affiliates and above (and their personal groups) whom they have sponsored, and for each of five downlinelevels of sponsorship. To qualify for these additional compensation payments, Master Affiliates and above arerequired to maintain certain monthly sales volumes.
Master Affiliates who sponsor other distributors that achieve the level of Master Affiliate are entitled tobecome part of the Director Program. Advancement at the Director level is based upon achieving increasing levelsof royalties based on sales generated by other distributors in the Director’s downline organization. Distributorsachieving each level receive recognition for their achievements at our company-sponsored events and in ourpublications. We also have a Star Director Program under which distributors achieving the level of Director andabove receive additional compensation based on the number of Master Affiliates they have sponsored into theprogram. Directors receive an additional 1% to 3% royalty on the retail sales volume of Master Affiliates in theirdownline organization for an unlimited number of levels of sponsorship, until reaching a level that includes a MasterAffiliate who also has achieved Star Director status.
Master Directors and Presidential Directors may also be invited to participate in the Ambassador Program.Qualifications to be invited by us to participate in the Ambassador Program include demonstrated competence andleadership qualities. Ambassadors receive recognition and awards for achieving Ambassador status and can thenachieve additional levels of accomplishment. We utilize our Ambassadors to lead meetings and conferences, and toprovide training and education to our distributors. Ambassadors achieving the level of Silver and higher alsoparticipate in the “Reliv Inner Circle,” which may entitle them to receive additional compensation, paid participationin our sponsored events, health insurance and car allowances.

11
In addition to the levels of compensation described, we also provide a variety of incentives, bonuses,awards and trips to distributors who achieve high sales volumes and who advance in the distributor ranks.
Distributor Training, Motivation and Management
Our marketing efforts are focused on the development, training, motivation and support of our independentdistributors. We support an active training program for our distributors in which our representatives and experienceddistributors, usually Ambassadors, lead group training sessions. We provide distributors with manuals, brochuresand other promotional, training and informational publications. We encourage distributors to hold regular weeklyrecruiting meetings and training sessions. We sponsor weekly training conference calls in which a significantnumber of distributors participate.
Our sponsorship generally includes the following:
• During 2017, we sponsored numerous special events in cities across all of our markets led by corporateexecutives and/or experienced Ambassadors;
• For the key markets in which we operate, we sponsor our annual conference for distributors; and
• In the United States during 2017, we sponsored an annual International Conference in the summer forU.S. distributors.
During 2017, we invested approximately $1.25 million in training, conferences and promotional events forour distributors worldwide compared with $1.59 million in 2016.
Distributor Compliance
Our distributor organization and business model are designed and intended to promote the sale of ourproducts to consumers by distributors. Sales training and promotional efforts emphasize that intention. To that end,we monitor purchases by distributors to identify potentially excessive individual purchases and keep detailedinformation regarding customer purchases through our corporate shopping cart and as part of our autoship program.Distributors are not required at any time to purchase product, although Master Affiliates and above are required tomaintain certain minimum sales levels in their personal groups to continue receiving generation royaltycompensation payments.
Distributors may create their own advertising provided that it is within our advertising rules. Unless adistributor is using our designed and approved advertisements, the distributor must submit for approval in writing alladvertising (e.g. brochures, flyers, audio tapes, classified or display ads, radio scripts) to our ComplianceDepartment before placing it or arranging for placement.
Pursuant to our Policies and Procedures, which are incorporated by reference into our DistributorAgreement, distributors are permitted to make only those claims about our products that have been approved by usand/or provided in sales and training materials. Distributors acknowledge that our products are not represented asdrugs and they are not authorized to make any diagnosis of any medical condition, make drug-type claims for, orprescribe our products to treat or cure, any disease or condition. We do not authorize or permit our distributors tomake any express or implied references with regard to our products that they cure, prevent or relieve disease, replaceor augment medication, provide therapy, promote healing, alleviate illnesses or symptoms of illnesses, or make anyother medical claims for specific ailments.
In order to comply with regulations that apply to both us and our distributors, we conduct considerableresearch into the applicable regulatory framework prior to entering any new market to identify all necessary licensesand approvals and applicable limitations on operations in that market. We devote substantial resources to obtainingthe necessary licenses and approvals and maintaining operations that are in compliance with the applicablelimitations. We also research laws applicable to distributor operations and revise or alter distributor materials andproducts, as required by applicable regulations in each market.

12
Regulations in existing and new markets often are ambiguous and subject to considerable interpretive andenforcement discretion by the responsible regulators. In addition, regulations affecting our business often changeand are subject to varying interpretation and application. We make every effort to monitor and comply with changesin laws and regulations as they occur.
We have a Compliance Department that receives and reviews allegations of distributor misconduct. If wedetermine that a distributor has violated our Policies and Procedures, we may take a number of disciplinary actions.For example, we may impose sanctions such as warnings or suspensions until specific conditions are satisfied, ortake other appropriate actions at our discretion, including termination of the distributor’s agreement.
Geographic Presence
Markets
We currently sell our products throughout the United States and in 14 other countries around the world. Wehave sold products in the United States since 1988 and our first product outside of the United States in 1991 whenwe entered Australia. In 2017, approximately 22.3% of our net sales were generated outside of the United States.
The table below shows the countries in which we operate and the year we commenced selling products:
Country Year Entered Country Year EnteredUnited States 1988 Ireland 2003Australia 1991 Singapore 2004New Zealand 1992 Germany 2005Canada 1992 Austria 2006Mexico 1993 Netherlands 2006United Kingdom(1) 1995 Indonesia 2009Philippines 2000 France 2013Malaysia 2003
______________________
(1) Includes Great Britain, Scotland, Wales and Northern Ireland.
Within the United States, we sell our products to distributors in all 50 states. We derived 42.8% of ourdomestic net sales in 2017 in California, Pennsylvania, Illinois, Michigan, Texas, Ohio, and Florida, with each statecontributing at least 4% of net sales. We believe that there is the opportunity to increase the number of ourdistributors in all markets where we sell our products.
We organize all of our international operations under our wholly owned subsidiary, Reliv’ World. As ofDecember 31, 2017, Reliv’ World consisted of the following market-specific entities: Reliv’ Australia, Reliv’ NewZealand, Reliv’ Canada, Reliv’ Mexico, Reliv’ Europe, Reliv’ Philippines, Reliv’ Malaysia, Reliv’ Singapore, andPT Reliv’ Indonesia. We have utilized this method of separate corporations in most of our markets, as local businesslicensing and product approvals require a local legal entity.
We believe that there is a significant opportunity to increase sales in our current international markets, as awhole. We have established a substantially consistent business model and compensation plan across all of ourmarkets, and we continue to support our international markets with additional marketing programs and materials.
In addition to increasing sales in current international markets, our expansion strategy targets selected newforeign markets, when appropriate.
New Market Entry Process
When conditions warrant, we evaluate new markets for our products. In order to do so, we perform ananalysis of synergies between new and existing countries and distributor presence or interest in new markets, marketconditions, regulatory conditions, product approval procedures and competition before selecting markets to enter.

13
Once we decide to enter a new market, we first hire local legal counsel and/or a consultant with appropriateexpertise to:
• help ensure that our network marketing system and products comply with all applicable regulations;
• help establish favorable public relations in the new market by acting as an intermediary between us andlocal regulatory authorities, public officials and business people; and
• explain our products and product ingredients to appropriate regulators and, when necessary, to arrangefor local technicians to conduct required ingredient analysis tests of the products.
Where regulatory approval in a foreign market is required, we utilize local counsel and/or consultants towork with regulatory agencies to confirm that all of the ingredients in our products are permissible within the newmarket. Where reformulation of one or more of our products is required, we attempt to obtain substitute orreplacement ingredients. During the regulatory compliance process, we may alter the formulation, packaging,branding or labeling of our products to conform to applicable regulations as well as local variations in customs andconsumer habits, and we may modify some aspects of our network marketing system as necessary to comply withapplicable regulations.
Following completion of the regulatory compliance phase, we undertake the steps necessary to meet theoperations requirements of the new market. In the majority of our new markets, we establish a sales center in amajor city and provide for product purchases by telephone and/or pick up. Product is shipped to the purchaser froma warehouse located in the general geographic market or the distributor may walk in to the local office and purchaseproducts, if a pick up center is available. In addition, we initiate plans to satisfy inventory, personnel andtransportation requirements of the new market, and we modify our distributor materials, recordings, videos and othertraining materials as necessary to be suitable for the new market.
In some countries, regulations applicable to the activities of our distributors also may affect our businessbecause in some countries we are, or regulators may assert that we are, responsible for our distributors’ conduct. Inthese countries, regulators may request or require that we take steps to ensure that our distributors comply with localregulations.
Manufacturing
We established a manufacturing line at our headquarters facility in Chesterfield, Missouri and began tomanufacture all of our nutritional supplements in early 1993. We expanded our Chesterfield facility in 1997 to nowinclude 126,000 square feet of total space. At this facility, we manufacture all of our powdered nutritionalsupplements and encapsulated products for distribution both domestically and internationally. Currently, our 24Kproduct is manufactured by a third party. In 2017, we installed a canister production line to produce Active and anyother products we determine to produce in a plastic canister versus our traditional cardboard can.
Our ability to manufacture nearly all of our nutritional supplements is a competitive advantage overcompetitors not engaged in manufacturing and contributes to our ability to provide high-quality products. Ourproduct manufacturing includes identifying suppliers of raw materials, acquiring the finest quality raw materials,blending exact amounts of raw materials into batches, and packaging and labeling the finished products. Since wecarefully select our ingredient suppliers, we are able to control the quality of raw materials and our finishedproducts. We have not experienced any significant difficulty in obtaining supplies of raw materials for ournutritional supplements or finished product of our 24K or Active products. By monitoring and testing products at allstages of the manufacturing process, we precisely control product composition. In addition, we believe we can moreefficiently control costs by manufacturing nearly all of our nutritional supplements.
Fulfillment
Distributors and their customers order product in either case lots or individual units of each product and payfor the goods prior to shipment. We also have a preferred customer plan that allows these customers to purchaseproduct at a 10% discount for an annual enrollment fee of $10. We also offer a monthly or quarterly autoship

14
program for distributors and customers. Product is shipped directly to the distributor or customer and uplinedistributors earn wholesale profits or, if applicable, a commission on all sales.
In the United States, our products are warehoused at our Chesterfield facility and shipped by commoncarrier to distributors and customers upon order. Our facility in Chesterfield, Missouri serves all parts of the country.Our products are also warehoused in, and shipped to local distributors from: Sydney, Australia; Auckland, NewZealand; Oakville, Canada; Guadalajara, Mexico; Redditch (Birmingham), England; Makati (Manila), Philippines;Subang Jaya (Kuala Lumpur), Malaysia; Singapore; and Jakarta, Indonesia. With the exception of our Canada, NewZealand, and Singapore subsidiaries, each of our subsidiaries maintains an office and personnel to receive, record,and fill orders from distributors. Distributors in Ireland, France, Germany, Austria, and the Netherlands order andreceive product from our UK-based subsidiary.
We maintain a policy that unused product may be returned by a customer to the selling distributor for a fullrefund or exchange within 30 days after purchase. We also maintain a policy that any distributor who terminates hisor her distributorship may return saleable product which was purchased from us within twelve months of thetermination for a refund of 100% of the purchase price less any compensation received relating to the purchase ofthe products. We believe this buyback policy addresses and satisfies a number of regulatory compliance issuespertaining to network marketing systems.
Historically, product returns and buy backs have not been significant. Product returns and buy backs havebeen approximately 0.25% and 0.20% of net sales in 2017 and 2016, respectively.
Intellectual Property
Our formulas are protected as trade secrets and, to the extent necessary, by confidentiality agreements. Inaddition, we have obtained U.S. patents on five products as set forth below:
Product Patent Expiration Date
ReversAge May 2021ProVantage December 2030GlucAffect November 202924K February 2032CardioSentials January 2029
In addition to our patented formulas, we own three U.S. patents, 13 international patents and two patent applicationsrelated to our soy concentrate ingredient with elevated levels of bioactive lunasin, the key ingredient in ourLunaRich X product. Further, we utilize a proprietary production process to produce our soy concentrate that weprotect as a trade secret, along with the bioassay to determine the bioavailability of lunasin in our products.
Currently, we have 14 trademarks registered with the U.S. Patent and Trademark Office, or USPTO,including Reliv and the names of 12 of our 18 nutritional products. Reliv NOW for Kids, LunaRich X, ReShape,Active, Burn and Purify are not registered with the USPTO. Cellebrate and Slimplicity trademarks have beenabandoned due to their discontinuance. Trademark registrations for selected marks have been issued or applied for inAustralia, New Zealand, Canada, Mexico, the United Kingdom, Ireland, the Philippines, Malaysia, Singapore,Germany and several other foreign countries that offer network marketing opportunities. We consider ourtrademarks to be an important asset of our business.
Regulation
Product Regulation
The formulation, manufacturing, labeling and advertising or promotion of our products are subject toregulation by the Food and Drug Administration, or FDA, which regulates our products under the federal Food,Drug and Cosmetic Act, or FDCA, the Federal Trade Commission, or FTC, and various agencies of the states orcountries into which our products are shipped or sold. FDA regulations include requirements and limitations withrespect to the labeling of our food products and also with respect to the formulation of those products. FDA

15
regulations also limit and control the extent to which health or other claims can be made with respect to the efficacyof any food or cosmetic. The FDCA has been amended several times with respect to dietary supplements, mostrecently by the Nutrition Labeling and Education Act of 1990, or NLEA, and the Dietary Supplement Health andEducation Act of 1994, or DSHEA, and related regulations. Such legislation governs the formulation,manufacturing, marketing and sale of nutritional supplements, including the content and presentation of health-related information included on the labels or labeling of nutritional supplements.
The majority of the products we market are classified as dietary supplements under the FDCA. Dietarysupplements such as those we manufacture and sell, for which no “drug” claim is made, are not subject to FDAapproval prior to their sale. However, DSHEA established a pre-market notification process for dietary supplementsthat contain a “new dietary ingredient,” or NDI, a term that is defined as “a dietary ingredient that was not marketedin the United States before October 15, 1994,” the date on which DSHEA was signed into law. Certain NDIs thathave been “present in the food supply” are exempt from the notification requirement. For those NDIs that are notexempt, DSHEA requires the manufacturer or distributor of a dietary supplement containing an NDI to submit to theFDA, at least 75 days prior to marketing, a notification containing the basis for concluding that the dietarysupplement containing the NDI will “reasonably be expected to be safe.” Dietary supplement products can beremoved from the market if shown to be unsafe, or if the FDA determines, based on the labeling of products, that theintended use of the product is for the diagnosis, cure, mitigation, treatment or prevention of disease. The FDA canregulate those products as “drugs” and require premarket approval of a “new drug application.” Manufacturers ofdietary supplements that make any claims for dietary supplements, including product performance and health benefitclaims must have substantiation that the statements are truthful and not misleading.
In January 2000, the FDA published a final rule that defines the types of statements that can be madeconcerning the effect of a dietary supplement on the structure or function of the body pursuant to DSHEA. UnderDSHEA, dietary supplement labeling may bear “structure/function” claims, which are claims that the products affectthe structure or function of the body, without prior FDA approval. They may not, without prior FDA approval, beara claim that they can prevent, treat, cure, mitigate or diagnose disease, otherwise known as a “drug claim.” The finalrule describes how the FDA will distinguish drug claims from structure/function claims. Dietary supplements, likeconventional foods, are also permitted to make “health claims,” which are claims that are exempt from regulation as“drug” claims pursuant to the amendments to the FDCA established by the NLEA in 1990. A “health claim” is aclaim, ordinarily approved by FDA regulation, on a food or dietary supplement product’s labeling that“characterizes the relationship of any substance to a disease or health-related condition.” To help assure that foods,dietary supplements and cosmetics comply with the provisions of the FDCA and FDA’s regulations, the FDA hasnumerous enforcement tools, including the ability to issue warning letters, initiate product seizures and injunctionsand pursue criminal penalties.
The manufacture of dietary supplements is subject to existing FDA current good manufacturing practice, orcGMP, regulations for food. In June 2007, the FDA issued regulations relating to more detailed cGMP specificallyfor dietary supplements. Under these regulations, we qualify as a small business and became subject to theregulations in June 2009. We are periodically audited by the FDA and believe our systems and facilities inChesterfield are in full compliance with cGMP.
Advertisements for our products are subject to regulation by the FTC. The FTC prohibits unfair methods ofcompetition and unfair or deceptive acts or practices in or affecting commerce and provides that the dissemination ofany false advertisement pertaining to drugs, cosmetics or foods, including dietary supplements, is an unfair ordeceptive practice. Under the FTC’s substantiation doctrine, an advertiser must have a “reasonable basis” for allclaims made about a product. The failure to be able to adequately substantiate claims may be considered eitherdeceptive or unfair practices. In order to avoid a violation of the FTC standards, we endeavor to assure that we haveadequate substantiation for all advertising claims made for our products. In addition, the FTC has increased itsscrutiny of the use of distributor testimonials. Although it is impossible for us to monitor all the product claimsmade by our independent distributors, we make efforts to monitor distributor testimonials and restrict inappropriatedistributor claims. The FTC has been more aggressive in pursuing enforcement against dietary supplement productssince the passage of DSHEA in 1994, and has brought numerous actions against dietary supplement companies,some resulting in several million dollar civil penalties and/or restitution as well as court-ordered injunctions.
We are aware that there is adverse publicity in many markets, including the United States, concerningfoods that are grown from genetically modified organisms, or GMOs. In some markets, the possibility of health risks

16
thought to be associated with GMOs has prompted proposed or actual governmental regulation. Nearly allingredients in our formulas are non-GMO. We use non-GMO ingredients when required by governmentalregulations and strive to use non-GMO ingredients in every other instance when commercially feasible andavailable. We believe compliance with regulatory requirements in this area should not have a material adverseeffect on our business.
Sales Program Regulation
Our distribution and sales program is subject to regulation by the FTC and other federal and state regulationas well as regulations in several countries in which we conduct business. Various state agencies regulate multi-leveldistribution services. We are required to register with, and submit information to, certain of such agencies and webelieve we have complied fully with such requirements. We actively strive to comply with all applicable state andfederal laws and regulations affecting our products and our sales and distribution programs. The Attorneys Generalof several states have taken an active role in investigating and prosecuting companies whose compensation plansthey claim violate local anti-pyramid and/or consumer protection statutes. We are unable to predict the effect suchincreased activity will have on our business in the future nor are we able to predict the probability of future laws,regulations or interpretations which may be passed by state or federal regulatory authorities.
Federal and state laws directed at network marketing programs have been adopted throughout the years toprevent the use of fraudulent practices often characterized as “pyramid schemes.” Illegal pyramid schemescompensate participants primarily for the introduction or enrollment of additional participants into the program.Often these schemes are characterized by large up-front entry or sign-up fees, over-priced products of low value,little or no emphasis on the sale or use of products, high-pressure recruiting tactics and claims of huge and quickfinancial rewards with little or no effort. Generally, these laws are directed at ensuring that product sales ultimatelyare made to consumers and that advancement within such sales organizations is based on sales of products.
We believe that our network marketing system satisfies the standards and case law defining a legalmarketing system. It is an ongoing part of our business to monitor and respond to regulatory and legaldevelopments, including those that may affect our network marketing system. However, the regulatory and legalrequirements concerning network marketing systems do not include “bright line” rules and are inherently fact-based.
Competition
The business of developing and distributing nutritional products such as those we offer is highlycompetitive. Numerous manufacturers, distributors and retailers compete for consumers and, in the case of othernetwork marketing companies, for distributors. Our competitors include both network marketing companies such asAlticor Global Holdings, Inc. (Amway Corp.), Avon Products Inc., Herbalife Ltd., Mary Kay Inc., Melaleuca, Inc.,Mannatech, Inc., Nature’s Sunshine Products Inc., NuSkin Enterprises Inc. and USANA Health Sciences Inc., aswell as specialty and mass retail establishments. Our ability to remain competitive depends on the underlyingscience and high quality of our products and our success in recruiting and retaining distributors. The pool ofindividuals interested in network marketing tends to be limited in each market and may be reduced to the extentother network marketing companies successfully recruit these individuals into their businesses. We believe that weoffer a rewarding compensation plan with attractive financial benefits to compete for the time, attention andcommitment of distributors. Our compensation plan is seamless, permitting international expansion.
Reliv NOW and Reliv Classic compete with numerous supplements that offer multi-vitamin benefits. Ourfitness and weight management products compete with other products in the weight loss market, includingnationally advertised products such as SlimFast. Many companies have entered, or have plans to enter, the sportsdrink market in which Innergize! and ProVantage compete, a market led by Gatorade. 24K competes with 5-HourEnergy and numerous other liquid energy shots and drinks. With Arthaffect, FibRestore, ReversAge, GlucAffect,CardioSentials, SoySentials, and LunaRich X, we are in the specific wellness needs, food and anti-aging markets,which are extremely competitive and led by the major food companies.
Employees
As of December 31, 2017, we and all of our subsidiaries had approximately 160 full-time employeescompared with 161 such employees at the end of 2016.

17
Additional Available Information
We make available, free of charge, copies of our annual reports on Form 10-K, quarterly reports on Form10-Q, current reports on Form 8-K, and all amendments to these reports as soon as reasonably practicable after suchmaterial is electronically filed with, or furnished to the SEC pursuant to Section 13(a) or 15(d) of the Exchange Act.This information is available on our corporate web site at www.reliv.com under the “Investor Relations” section.This information may also be obtained from the SEC’s on-line database located at www.sec.gov.
Item No. 2 – Properties
We own approximately six acres of land and a building containing approximately 126,000 square feet ofoffice, manufacturing and warehouse space located in Chesterfield, Missouri, where we maintain our corporateheadquarters and sole manufacturing facility. We believe that our worldwide facilities are suitable and adequate inrelation to our present and immediate future needs.
The following table summarizes information related to our worldwide facilities as of March 19, 2018:
Location Nature of Use Square Feet Owned/Leased
Chesterfield, MO, USA corporate headquarters/callcenter/manufacturing/warehouse
126,000 Owned
Seven Hills (Sydney), Australia central office/call center 1,000 LeasedOakville, Ontario, Canada warehouse/distribution 2,100 LeasedGuadalajara, Mexico central office/warehouse/call center 2,300 LeasedMakati City (Manila), Philippines central office/
warehouse/distribution4,000 Leased
Redditch (Birmingham), England,UK
central office/warehouse/distribution
11,500 Leased
Subang Jaya (Kuala Lumpur),Malaysia
central office/call center 900 Leased
Jakarta, Indonesia central office/warehouse/distribution
1,100 Leased
Item No. 3 - Legal Proceedings
From time to time, we are involved in litigation incidental to the conduct of our business. We do notbelieve that any current proceedings will have a material adverse effect on our business, financial condition,results of operations or cash flows.

18
PART II
Item No. 5 - Market for Registrant’s Common Equity, Related Stockholder Matters and Issuer Purchases ofEquity Securities
Our common stock is listed on the NASDAQ Global Select Market under the symbol: RELV. Thefollowing table sets forth the high and low sales prices of our common stock and the quarterly dividends per sharepaid on our common stock during the years ended December 31, 2017 and 2016. We executed a one-for-seven(1:7) reverse stock split on our common stock, effective when the market opened on October 4, 2016. All stockprices prior to that date have been adjusted for the effect of the reverse split for purposes of this table.
High Low Dividend
Year Ending December 31, 2017Fourth Quarter $ 8.44 $ 3.72 $ -Third Quarter 13.77 6.22 -Second Quarter 9.00 5.18 -First Quarter 8.87 4.13 -
Year Ending December 31, 2016Fourth Quarter $ 12.53 $ 3.84 $ -Third Quarter 7.91 3.85 -Second Quarter 6.02 3.57 -First Quarter 7.14 3.43 -
As of March 19, 2018, there were approximately 856 holders of record of our common stock and anadditional 2,215 beneficial owners, including shares of common stock held in street name.
We have not declared any cash dividends over the past two years. The declaration of future dividends issubject to the discretion of our Board of Directors and will depend upon various factors, including our earnings,financial condition, restrictions imposed by any indebtedness that may be outstanding, cash requirements, and otherfactors deemed relevant by our Board of Directors. Our current lending agreements contain covenants which maylimit our ability to declare cash dividends.

19
Item No. 7 - Management’s Discussion and Analysis of Financial Condition and Results of Operations
The following discussion and analysis of our financial condition and results of operations should be read inconjunction with our financial statements and related notes included elsewhere in this Annual Report on Form 10-K. The following discussion and analysis discusses the financial condition and results of our operations on aconsolidated basis, unless otherwise indicated.
Overview
We are a developer, manufacturer and marketer of a proprietary line of nutritional supplements addressingbasic nutrition, specific wellness needs, weight management and sports nutrition. We sell our products through aninternational network marketing system utilizing independent distributors. Sales in the United States representedapproximately 77.7% of worldwide net sales for the year ended December 31, 2017 compared to approximately78.2% for the year ended December 31, 2016. Our international operations currently generate sales throughdistributor networks with facilities in Australia, Canada, Indonesia, Malaysia, Mexico, the Philippines, and theUnited Kingdom. We also operate in Ireland, France, Germany, Austria and the Netherlands from our UnitedKingdom distribution center, in New Zealand from our Australia office, and in Singapore from our Malaysia office.
We derive our revenues principally through product sales made by our global independent distributor base,which, as of December 31, 2017, consisted of approximately 33,620 distributors and preferred customers. Our salescan be affected by several factors, including our ability to attract new distributors and retain our existing distributorbase, our ability to properly train and motivate our distributor base and our ability to develop new products andsuccessfully maintain our current product line.
All of our sales to distributors outside the United States are made in the respective local currency;therefore, our earnings and cash flows are subject to fluctuations due to changes in foreign currency rates ascompared to the U.S. dollar. As a result, exchange rate fluctuations may have an effect on sales and gross margins.Accounting practices require that our results from operations be converted to U.S. dollars for reporting purposes.Consequently, our reported earnings may be significantly affected by fluctuations in currency exchange rates,generally increasing with a weaker U.S. dollar and decreasing with a strengthening U.S. dollar. Productsmanufactured by us for sale to our foreign subsidiaries are transacted in U.S. dollars. From time to time, we enterinto foreign exchange forward contracts to mitigate our foreign currency exchange risk.
Components of Net Sales and Expense
Product sales represent the actual product purchase price typically paid by our distributors, after givingeffect to distributor allowances, which can range from 10% to 40% of suggested retail price, depending on the rankof a particular distributor. Handling and freight income represents the amounts billed to distributors for shippingcosts. We record net sales and the related commission expense when the merchandise is shipped.
Our primary expenses include cost of products sold, distributor royalties and commissions and selling,general and administrative expenses.
Cost of products sold primarily consists of expenses related to raw materials, labor, quality control andoverhead directly associated with production of our products and sales materials, as well as shipping costs relating tothe shipment of products to distributors, and duties and taxes associated with product exports. Cost of products soldis impacted by the cost of the ingredients used in our products, the cost of shipping distributors’ orders, and ourefficiency in managing the production of our products.
Distributor royalties and commissions are monthly payments made to distributors, based on products soldin their downline organization. Based on our distributor agreements, these expenses typically approximate 23% ofsales at suggested retail. Distributor royalties and commissions are paid on an amount referred to as the businessvalue (“BV”), which typically ranges between 80% and 90% of the suggested retail price of each product. Also, weinclude other sales leadership bonuses, such as Ambassador bonuses, within this caption. Overall, distributorroyalties and commissions remain directly related to the level of our sales and should continue at comparable levelsas a percentage of net sales going forward. We have implemented or are in the process of implementing similarpricing structures in all of our international markets.

20
Selling, general and administrative expenses include the compensation and benefits paid to our employeesexcept for those in manufacturing, all other selling expenses, marketing, promotional expenses, travel and othercorporate administrative expenses. These other corporate administrative expenses include professional fees, non-manufacturing depreciation and amortization, occupancy costs, communication costs and other similar operatingexpenses. Selling, general and administrative expenses can be affected by a number of factors, including staffinglevels and the cost of providing competitive salaries and benefits; the amount we decide to invest in distributortraining and motivational initiatives; and the cost of regulatory compliance.
Results of Operations
Year Ended December 31, 2017 Compared to Year Ended December 31, 2016
Net sales decreased by 8.2% worldwide, as net sales in the United States decreased by 8.8% in the yearended December 31, 2017 compared with 2016. During 2017, our international net sales decreased by 6.1% overthe prior year with 3.4% of the decline due to the impact of foreign currency fluctuation as the result of a strongerU.S. dollar in certain markets. Net sales in Europe, our largest foreign market, decreased by 16.6% in 2017compared to the prior year, with 4.3% of the decline due to the impact of foreign currency fluctuation. Sales in Asiaincreased by 39.7% in 2017 compared to the prior year.
The following table summarizes net sales by geographic market for the years ended December 31, 2017and 2016.
Net Sales by Market Year Ended December 31,
(in thousands) 2017 2016 Change from prior year
Amount% of Net
Sales Amount% of Net
Sales Amount %(dollars in thousands)
United States $ 32,475 77.7% $ 35,592 78.2% $ (3,117) (8.8)%Australia/New Zealand 923 2.2 1,079 2.4 (156) (14.5)Canada 915 2.2 1,065 2.3 (150) (14.1)Mexico 445 1.0 530 1.2 (85) (16.0)Europe 4,578 11.0 5,491 12.0 (913) (16.6)Asia 2,453 5.9 1,756 3.9 697 39.7
Consolidated total $ 41,789 100.0% $ 45,513 100.0% $ (3,724) (8.2)%
The following table sets forth, as of December 31, 2017 and 2016, the number of our active distributors andMaster Affiliates and above. The total number of active distributors includes Master Affiliates and above. Wedefine an active distributor as one that enrolls as a distributor or renews his or her distributorship during the priortwelve months. Master Affiliates and above are distributors that have attained the highest level of discount and areeligible for royalties generated by Master Affiliate groups in their downline organization. In February 2016, weintroduced a formal Preferred Customer program in the United States and Canada. As a result, we are includingPreferred Customers as part of our Active Distributor count. Preferred Customer programs were previously in placein Europe and other foreign markets. Preferred Customers represent approximately 4,990 and 5,050 of the ActiveDistributor count as of December 31, 2017 and 2016, respectively. The significant majority of these PreferredCustomers are in Europe.

21
Active Distributors/Master December 31, 2017 December 31, 2016 % ChangeAffiliates by Market Active
Distributorsand Preferred
Customers
MasterAffiliates and
Above
ActiveDistributors
and PreferredCustomers
MasterAffiliates and
Above
ActiveDistributors
and PreferredCustomers
MasterAffiliates and
Above
United States 23,050 2,820 27,220 4,080 (15.3)% (30.9)%Australia/New Zealand 1,100 110 1,530 130 (28.1) (15.4)Canada 660 90 840 150 (21.4) (40.0)Mexico 710 60 940 90 (24.5) (33.3)Europe 3,800 450 4,860 530 (21.8) (15.1)Asia 4,300 380 3,090 340 39.2 11.8
Consolidated total 33,620 3,910 38,480 5,320 (12.6)% (26.5)%
Use of Non-GAAP Financial Information
Net sales expressed in local currency or net sales adjusted for the impact of foreign currency fluctuation arenon-GAAP financial measures. We use these measurements to assess the level of business activity in a foreignmarket, absent the impact of foreign currency fluctuation relative to the U.S. dollar, which our local managementhas no ability to influence. This is a meaningful measurement to management, and we believe this is a usefulmeasurement to provide to shareholders.
The following table provides key statistics related to distributor activity by market and should be read inconjunction with the following discussion.
Distributor Activity by Market International
United States AUS/NZ Canada Mexico Europe Asia -- Total
Sales in USD (in 000's):
Year ended 12/31/2017 32,475$ 923$ 915$ 445$ 4,578$ 2,453$ 9,314$
Year ended 12/31/2016 35,592$ 1,079$ 1,065$ 530$ 5,491$ 1,756$ 9,921$
% change in sales-2017 vs. 2016:
Change in GAAP sales in USD -8.8% -14.5% -14.1% -16.0% -16.6% 39.7% -6.1%
Due to currency fluctuation - 2.4% 1.8% -1.0% -4.3% -8.2% -3.4%
Sales in local currency
(non-GAAP) -8.8% -16.9% -15.9% -15.0% -12.3% 47.9% -2.7%
# of new distributors-2017(1)
4,667 168 145 271 1,646 2,632 4,862
# of new distributors-2016(1)
5,553 370 165 389 2,110 1,720 4,754
% change -16.0% -54.6% -12.1% -30.3% -22.0% 53.0% 2.3%
# of new Master Affiliates-2017 534 8 15 15 108 215 361
# of new Master Affiliates-2016 747 28 22 20 152 129 351
% change -28.5% -71.4% -31.8% -25.0% -28.9% 66.7% 2.8%
# of Product orders-2017 125,648 5,537 3,060 3,235 16,246 25,926 54,004
# of Product orders-2016 145,172 6,846 3,716 3,698 20,850 12,937 48,047
% change -13.4% -19.1% -17.7% -12.5% -22.1% 100.4% 12.4%
______________________(1)
The new distributor totals for 2017 and 2016 include 3,587 and 3,510, respectively, new worldwide preferred customers.
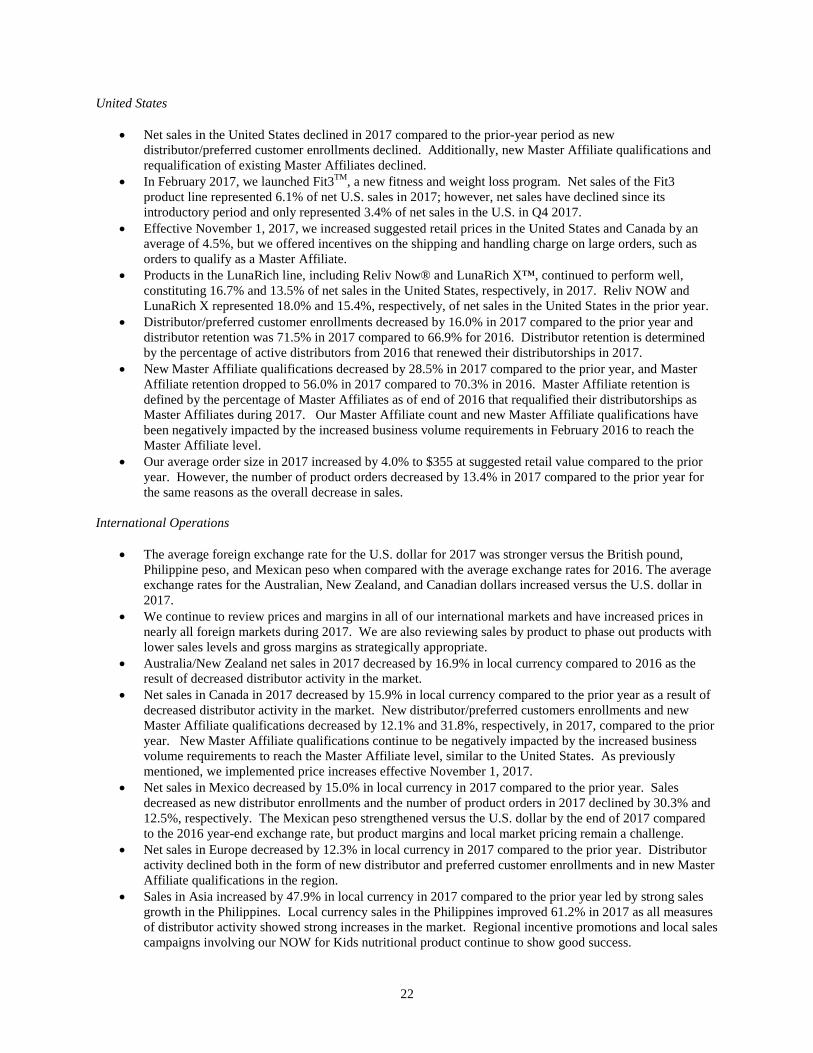
22
United States
• Net sales in the United States declined in 2017 compared to the prior-year period as newdistributor/preferred customer enrollments declined. Additionally, new Master Affiliate qualifications andrequalification of existing Master Affiliates declined.
• In February 2017, we launched Fit3TM, a new fitness and weight loss program. Net sales of the Fit3product line represented 6.1% of net U.S. sales in 2017; however, net sales have declined since itsintroductory period and only represented 3.4% of net sales in the U.S. in Q4 2017.
• Effective November 1, 2017, we increased suggested retail prices in the United States and Canada by anaverage of 4.5%, but we offered incentives on the shipping and handling charge on large orders, such asorders to qualify as a Master Affiliate.
• Products in the LunaRich line, including Reliv Now® and LunaRich X™, continued to perform well,constituting 16.7% and 13.5% of net sales in the United States, respectively, in 2017. Reliv NOW andLunaRich X represented 18.0% and 15.4%, respectively, of net sales in the United States in the prior year.
• Distributor/preferred customer enrollments decreased by 16.0% in 2017 compared to the prior year anddistributor retention was 71.5% in 2017 compared to 66.9% for 2016. Distributor retention is determinedby the percentage of active distributors from 2016 that renewed their distributorships in 2017.
• New Master Affiliate qualifications decreased by 28.5% in 2017 compared to the prior year, and MasterAffiliate retention dropped to 56.0% in 2017 compared to 70.3% in 2016. Master Affiliate retention isdefined by the percentage of Master Affiliates as of end of 2016 that requalified their distributorships asMaster Affiliates during 2017. Our Master Affiliate count and new Master Affiliate qualifications havebeen negatively impacted by the increased business volume requirements in February 2016 to reach theMaster Affiliate level.
• Our average order size in 2017 increased by 4.0% to $355 at suggested retail value compared to the prioryear. However, the number of product orders decreased by 13.4% in 2017 compared to the prior year forthe same reasons as the overall decrease in sales.
International Operations
• The average foreign exchange rate for the U.S. dollar for 2017 was stronger versus the British pound,Philippine peso, and Mexican peso when compared with the average exchange rates for 2016. The averageexchange rates for the Australian, New Zealand, and Canadian dollars increased versus the U.S. dollar in2017.
• We continue to review prices and margins in all of our international markets and have increased prices innearly all foreign markets during 2017. We are also reviewing sales by product to phase out products withlower sales levels and gross margins as strategically appropriate.
• Australia/New Zealand net sales in 2017 decreased by 16.9% in local currency compared to 2016 as theresult of decreased distributor activity in the market.
• Net sales in Canada in 2017 decreased by 15.9% in local currency compared to the prior year as a result ofdecreased distributor activity in the market. New distributor/preferred customers enrollments and newMaster Affiliate qualifications decreased by 12.1% and 31.8%, respectively, in 2017, compared to the prioryear. New Master Affiliate qualifications continue to be negatively impacted by the increased businessvolume requirements to reach the Master Affiliate level, similar to the United States. As previouslymentioned, we implemented price increases effective November 1, 2017.
• Net sales in Mexico decreased by 15.0% in local currency in 2017 compared to the prior year. Salesdecreased as new distributor enrollments and the number of product orders in 2017 declined by 30.3% and12.5%, respectively. The Mexican peso strengthened versus the U.S. dollar by the end of 2017 comparedto the 2016 year-end exchange rate, but product margins and local market pricing remain a challenge.
• Net sales in Europe decreased by 12.3% in local currency in 2017 compared to the prior year. Distributoractivity declined both in the form of new distributor and preferred customer enrollments and in new MasterAffiliate qualifications in the region.
• Sales in Asia increased by 47.9% in local currency in 2017 compared to the prior year led by strong salesgrowth in the Philippines. Local currency sales in the Philippines improved 61.2% in 2017 as all measuresof distributor activity showed strong increases in the market. Regional incentive promotions and local salescampaigns involving our NOW for Kids nutritional product continue to show good success.

23
Costs and Expenses
The following table sets forth selected results of our operations expressed as a percentage of net sales forthe years ended December 31, 2017 and 2016. Our results of operations for the periods described below are notnecessarily indicative of results of operations for future periods.
Statement of Operations data
(amounts in thousands)
Amount % of net sales Amount % of net sales
Net sales 41,789$ 100.0 % 45,513$ 100.0 %
Costs and expenses:
Cost of products sold 9,401 22.5 10,024 22.0
Distributor royalties and commissions 14,686 35.1 16,095 35.4
Selling, general and adminstrative 17,885 42.8 20,206 44.4
Loss from operations (183) (0.4) (812) (1.8)
Interest income 102 0.2 107 0.2
Interest expense (109) (0.3) (107) (0.2)
Other income 38 0.1 196 0.4
Loss before income taxes (152) (0.4) (616) (1.4)
Provision for income taxes 545 1.3 9 -
Net loss (697)$ (1.7) % (625)$ (1.4) %
Loss per common share-Basic (0.38)$ (0.34)$
Loss per common share-Diluted (0.38)$ (0.34)$
2017 2016
Cost of Products Sold:• The cost of products sold as a percentage of net sales in 2017 increased by 0.5% compared to the prior-year
period. The cost of products sold as a percentage of net sales in 2017 was negatively impacted by lowerplant utilization and promotions in the United States that reduced our handling and freight income.
Distributor Royalties and Commissions:• Distributor royalties and commissions as a percentage of net sales for 2017 decreased by 0.3% of net sales
when compared to the prior-year period. Over the course of 2017, we increased the prices of our productsin most of our markets, with prices increased in the U.S. and Canada effective November 1, 2017. As partof the price increase, we did not increase the BV of the products. The BV represents the amount percommissionable product that is paid in distributor royalties and commissions. This accounts for the slightdecrease in the percentage paid of net sales.
Selling, General and Administrative Expenses:• Selling, general and administrative expenses declined by $2.32 million in 2017 compared to the prior-year
period.• Salaries, salary-related expenses, and incentive compensation decreased in the aggregate by $880,000 in
2017, compared to the prior-year period. Total compensation expense decreased as the result of continuedimpact of headcount reductions in the United States through attrition and a worldwide workforce reductionthat took place in May 2016.

24
• Sales and marketing expenses decreased by $706,000 in 2017 compared to 2016. Components of thedecrease include:
o $422,000 decrease in Star Director and other distributor bonuses, credit card fees, and otherexpenses related to the level of sales.
o $321,000 decrease in distributor conferences and meeting expenses as we have reduced thequantity of corporate-sponsored events and the cost of our major distributor conference.
• Other general and administrative expenses decreased by $693,000 in 2017 as compared to 2016.Significant expense reductions include:
o Research & development expenses, along with other foreign product compliance requirementsdecreased by $290,000 in 2017 compared to the prior-year period.
o Other significant decreases from 2017 vs. 2016 include: Consulting, legal, and accounting fees decreased by $107,000. Utility expenses decreased by $52,000. Computer software maintenance expenses decreased by $66,000. Shareholder communication and other SEC-related expenses decreased by $88,000. Depreciation and amortization expense decreased by $65,000.
Other Income/Expense:• The other income in 2017 and 2016 is primarily the result of foreign currency exchange gains on
intercompany debt denominated in U.S. dollars in certain of our subsidiaries.
Income Taxes:• We reported income tax expense of $545,000 for 2017, compared to income tax expense of $9,000 in 2016.• During the fourth quarter of 2017, we determined that it was more likely than not that operating results in
our European subsidiary would not be sufficient to realize our net operating loss carryforwards.Accordingly, we placed a valuation allowance of $509,000 on our deferred tax asset in that subsidiary.
• During 2016, we determined that it was more likely than not that Federal and various state net operatinglosses generated in 2016 and beyond will not be realized based on projections of future taxable income andother considerations. Accordingly, the tax provisions as of December 31, 2017 and 2016 include theimpact of recording a valuation allowance of $198,000 and $292,000, respectively, against the lossesgenerated from a U.S. tax perspective.
• See Note 11 of the Consolidated Financial Statements for additional detail regarding income taxes,including a reconciliation of the income tax expense/benefit to the U.S. statutory rate for each period.
Net Income/Loss:• For 2017, we reported a net loss of $697,000 compared to a net loss of $625,000 in 2016. The impact of
the decline in net sales in the United States and other foreign markets was offset by the reduction in selling,general and administrative expenses in 2017 vs. 2016; however, the impact of the valuation allowance onthe European subsidiary’s deferred tax asset resulted in a larger loss in 2017 compared to 2016.
Liquidity and Capital Resources
In 2017, we used $157,000 of net cash in operating activities, $377,000 was used in investing activities,and we generated $136,000 in financing activities. This compares to $1.53 million generated in operating activities,$70,000 used in investing activities, and $1.02 million used in financing activities in 2016. Cash and cashequivalents decreased by $334,000 to $3.27 million as of December 31, 2017 compared to $3.61 million as ofDecember 31, 2016.
Significant changes in working capital items consisted of a decrease in accounts receivable of $105,000, adecrease in prepaid expenses and other current assets of $107,000, and a decrease in accounts payable and accruedexpenses of $1.03 million in 2017. The decrease in accounts receivable is primarily from the decrease in tradeaccounts receivable from external customers as of December 31, 2017 compared to the prior year end. The decreasein prepaid expenses is result of smaller prepayments made on upcoming incentive trips as of the end of 2017 and thedecrease in accounts payable and accrued expenses is the result of reduced accrued distributor commissions relatedto the decline in sales in December 2017 compared to December 2016 and reduced trade payables as of December31, 2017 compared to December 31, 2016.
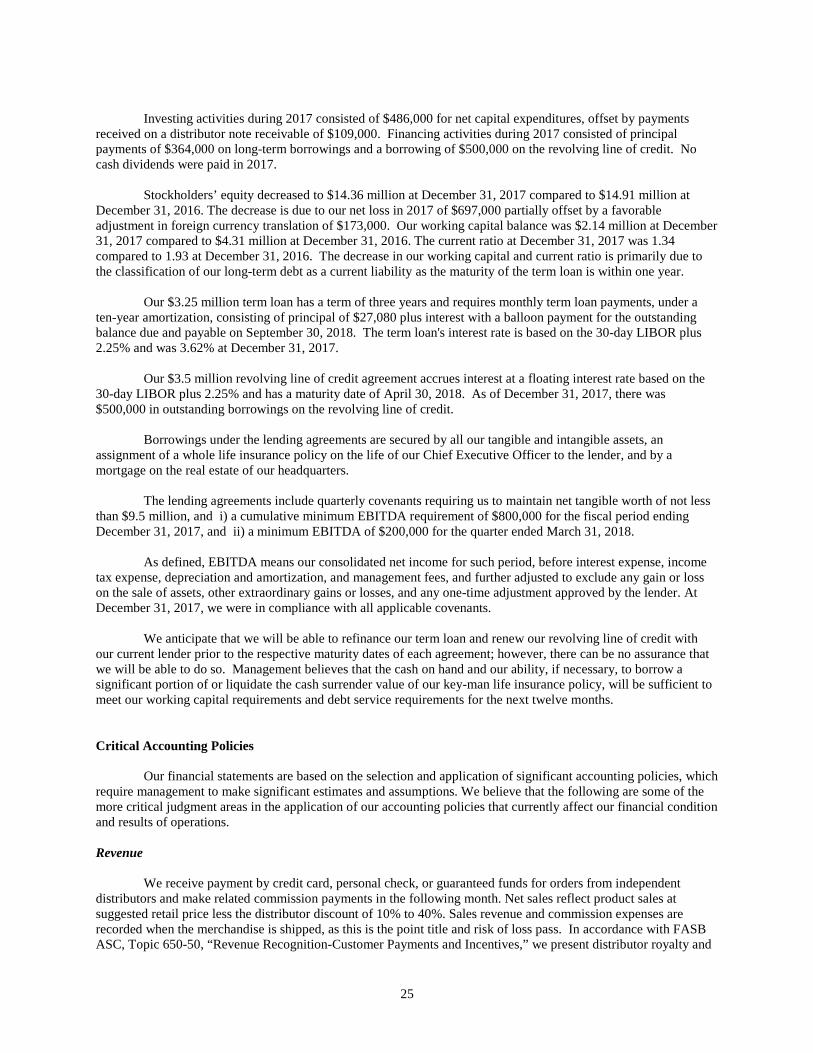
25
Investing activities during 2017 consisted of $486,000 for net capital expenditures, offset by paymentsreceived on a distributor note receivable of $109,000. Financing activities during 2017 consisted of principalpayments of $364,000 on long-term borrowings and a borrowing of $500,000 on the revolving line of credit. Nocash dividends were paid in 2017.
Stockholders’ equity decreased to $14.36 million at December 31, 2017 compared to $14.91 million atDecember 31, 2016. The decrease is due to our net loss in 2017 of $697,000 partially offset by a favorableadjustment in foreign currency translation of $173,000. Our working capital balance was $2.14 million at December31, 2017 compared to $4.31 million at December 31, 2016. The current ratio at December 31, 2017 was 1.34compared to 1.93 at December 31, 2016. The decrease in our working capital and current ratio is primarily due tothe classification of our long-term debt as a current liability as the maturity of the term loan is within one year.
Our $3.25 million term loan has a term of three years and requires monthly term loan payments, under aten-year amortization, consisting of principal of $27,080 plus interest with a balloon payment for the outstandingbalance due and payable on September 30, 2018. The term loan's interest rate is based on the 30-day LIBOR plus2.25% and was 3.62% at December 31, 2017.
Our $3.5 million revolving line of credit agreement accrues interest at a floating interest rate based on the30-day LIBOR plus 2.25% and has a maturity date of April 30, 2018. As of December 31, 2017, there was$500,000 in outstanding borrowings on the revolving line of credit.
Borrowings under the lending agreements are secured by all our tangible and intangible assets, anassignment of a whole life insurance policy on the life of our Chief Executive Officer to the lender, and by amortgage on the real estate of our headquarters.
The lending agreements include quarterly covenants requiring us to maintain net tangible worth of not lessthan $9.5 million, and i) a cumulative minimum EBITDA requirement of $800,000 for the fiscal period endingDecember 31, 2017, and ii) a minimum EBITDA of $200,000 for the quarter ended March 31, 2018.
As defined, EBITDA means our consolidated net income for such period, before interest expense, incometax expense, depreciation and amortization, and management fees, and further adjusted to exclude any gain or losson the sale of assets, other extraordinary gains or losses, and any one-time adjustment approved by the lender. AtDecember 31, 2017, we were in compliance with all applicable covenants.
We anticipate that we will be able to refinance our term loan and renew our revolving line of credit withour current lender prior to the respective maturity dates of each agreement; however, there can be no assurance thatwe will be able to do so. Management believes that the cash on hand and our ability, if necessary, to borrow asignificant portion of or liquidate the cash surrender value of our key-man life insurance policy, will be sufficient tomeet our working capital requirements and debt service requirements for the next twelve months.
Critical Accounting Policies
Our financial statements are based on the selection and application of significant accounting policies, whichrequire management to make significant estimates and assumptions. We believe that the following are some of themore critical judgment areas in the application of our accounting policies that currently affect our financial conditionand results of operations.
Revenue
We receive payment by credit card, personal check, or guaranteed funds for orders from independentdistributors and make related commission payments in the following month. Net sales reflect product sales atsuggested retail price less the distributor discount of 10% to 40%. Sales revenue and commission expenses arerecorded when the merchandise is shipped, as this is the point title and risk of loss pass. In accordance with FASBASC, Topic 650-50, “Revenue Recognition-Customer Payments and Incentives,” we present distributor royalty and

26
commission expense as an operating expense, rather than a reduction to net sales, as these payments are not made tothe purchasing distributor.
Actual and estimated returns are classified as a reduction of net sales. We estimate and accrue a reserve forproduct returns based on our return policy and historical experience. Our return policy allows for a distributor toreturn product only upon termination of his or her distributorship. Allowable returns are limited to saleable productwhich was purchased within twelve months of the termination for a refund of 100% of the original purchase priceless any distributor royalties and commission received relating to the original purchase of the returned products.Total returns have been approximately 0.25% and 0.20% of net sales in 2017 and 2016, respectively. We recordhandling and freight income as a component of net sales and record handling and freight costs as a component ofcost of products sold. Total revenues do not include sales tax as we consider ourselves a pass-through conduit forcollecting and remitting applicable sales taxes.
Inventories
Inventories are valued at the lower of cost or market. Product cost includes raw material, labor andoverhead costs and is accounted for using the first-in, first-out basis. On a periodic basis, we review our inventorylevels in each country for estimated obsolescence or unmarketable items, as compared to future demandrequirements and the shelf life of the various products. Based on this review, we record inventory write-downs whencosts exceed expected net realizable value. Historically, our estimates of obsolete or unmarketable items have beenmaterially accurate.
Sales aids and promotional materials inventories represent distributor kits, product brochures, and othersales and business development materials which are held for sale to distributors. Costs of the sales aids andpromotional materials held for sale are capitalized as inventories and subsequently recorded to cost of goods soldupon recognition of revenue when sold to distributors. All other advertising and promotional costs are expensedwhen incurred.
Legal Proceedings
In the ordinary course of business, we are subject to various legal proceedings, including lawsuits and otherclaims related to labor, product and other matters. We are required to assess the likelihood of adverse judgments andoutcomes to these matters as well as the range of potential loss. Such assessments are required to determine whethera loss contingency reserve is required under the provisions of FASB ASC Topic 450, “Contingencies,” and todetermine the amount of required reserves, if any. These assessments are subjective in nature. Management makesthese assessments for each individual matter based on consultation with outside counsel and based on priorexperience with similar claims. To the extent additional information becomes available or our strategies orassessments change, our estimates of potential liability for a given matter may change. Changes to estimates ofliability would result in a corresponding additional charge or benefit recognized in the statement of operations in theperiod in which such changes become known. We recognize the costs associated with legal defense in the periodsincurred. Accordingly, the future costs of defending claims are not included in our estimated liability.
Income Tax Matters
We account for income taxes in accordance with FASB ASC Topic 740, “Income Taxes,” (ASC Topic740) which requires that deferred tax assets and liabilities be recognized using enacted tax rates for the effect oftemporary differences between the book and tax bases of recorded assets and liabilities. ASC Topic 740 alsorequires that deferred tax assets be reduced by a valuation allowance if it is “more likely than not” that some portionor the entire deferred tax asset will not be realized. In our quarterly evaluation of the need for a valuation allowance,we consider and weigh both positive and negative factors, including the expected level of future taxable income andavailable tax planning strategies. If actual results differ from the assumptions made in our previous evaluation ofour valuation allowance, we may record a change in valuation allowance through income tax expense in the periodthis determination is made.
The calculations of our tax liabilities involve dealing with uncertainties in the application of complex taxregulations. We recognize liabilities for uncertain tax positions based on the two-step process prescribed in theguidance under ASC Topic 740. The first step is to evaluate the tax position for recognition by determining if the

27
weight of available evidence indicates that it is more likely than not that the position will be sustained on audit,including resolution of related appeals or litigation processes, if any. The second step requires us to estimate andmeasure the tax benefit as the largest amount that is more than 50% likely to be realized upon ultimate settlement. Itis inherently difficult and subjective to estimate such amounts, as we have to determine the probability of variouspossible outcomes. We reevaluate these uncertain tax positions on a quarterly basis. This evaluation is based onfactors including, but not limited to, changes in facts or circumstances, changes in tax law, effectively settled issuesunder audit, or new audit activity. Such a change in recognition or measurement would result in the recognition of atax benefit or an additional charge to the tax provision.
During 2016 and 2017, we determined that it was more likely than not that U.S. federal and various statenet operating losses primarily generated in 2016 and 2017 will not be realized based on projections of future U.S.taxable income, estimated reversals of existing taxable timing differences, and other considerations. Accordingly,the 2017 and 2016 income tax provisions include the impact of recording a full deferred tax asset valuationallowance of approximately $198,000 and $292,000 against the annual losses generated from a U.S. tax perspective.
At December 31, 2017, we had deferred tax assets related to net operating loss carryforwards and otherincome tax credits in our foreign operations with a tax value of $3.4 million. These net operating loss carryforwardsprincipally do not expire, depending on the country and period in which they occurred. As of December 31, 2017,we assessed the realizability of the European subsidiary’s deferred tax assets and concluded that future realizationfailed to meet the threshold of more likely than not based upon the subsidiary’s recent tax operating losses.Accordingly, we recorded a full valuation allowance to the European subsidiary’s deferred tax assets and recorded adeferred income tax charge of $509,000 at December 31, 2017. We continue to have a full valuation allowanceapplied to all other net operating loss carryforwards in our foreign operations.
The United States Tax Cuts and Jobs Act (TCJA) was enacted in December 2017. Under the TJCA’srepatriation tax, we estimate our cumulative amount of unremitted foreign earnings is expected to be negative andany related tax is immaterial.
Current-Year Adoption of Recent Accounting Pronouncements
Discussion regarding our adoption of accounting pronouncements is included in Note 1 to the ConsolidatedFinancial Statements.

28
Item No. 8 - Financial Statements and Supplementary Data
Reference is made to the Consolidated Financial Statements contained in Part IV hereof.
Item No. 9 - Changes in and Disagreements with Accountants on Accounting andFinancial Disclosure
None
Item No. 9A - Controls and Procedures
Evaluation of Disclosure Controls and Procedures
Our management, under the supervision and with the participation of our Chief Executive Officer andChief Financial Officer, has reviewed and evaluated the effectiveness of the design and operation of our disclosurecontrols and procedures as of December 31, 2017. Based on such review and evaluation, our Chief ExecutiveOfficer and Chief Financial Officer have concluded that the disclosure controls and procedures were effective as ofDecember 31, 2017, to ensure that the information required to be disclosed by us in the reports that we file or submitunder the Securities Exchange Act of 1934, as amended, (a) is recorded, processed, summarized and reported withinthe time period specified in the SEC’s rules and forms and (b) is accumulated and communicated to ourmanagement, including the officers, as appropriate to allow timely decisions regarding required disclosure.
Management’s Annual Report on Internal Control over Financial Reporting
Management is responsible for establishing and maintaining adequate internal control over financialreporting. Our management conducted an evaluation of the effectiveness of our internal control over financialreporting based on the 2013 framework in Internal Control – Integrated Framework issued by the Committee ofSponsoring Organizations of the Treadway Commission. This evaluation included review of the documentation ofcontrols, evaluation of the design effectiveness of controls, testing of the operating effectiveness of controls and aconclusion on this evaluation. Although there are inherent limitations in the effectiveness of any system of internalcontrol over financial reporting, based on our evaluation, management has concluded our internal controls overfinancial reporting were effective as of December 31, 2017.
Attestation Report of the Registered Public Accounting Firm
This Annual Report on Form 10-K does not include an attestation report of our registered public accountingfirm regarding internal control over financial reporting. Management’s report was not subject to attestation by ourregistered public accounting firm pursuant to rules of the SEC that permit us to provide only management’s report inthis Annual Report on Form 10-K.
Changes in Internal Control over Financial Reporting
There were no material changes in our internal control over financial reporting during the fourth quarter of2017 that have materially affected or are reasonably likely to materially affect our internal controls over financialreporting.
Item No. 9B - Other Information
None

29
PART III
Item No. 10 - Directors, Executive Officers and Corporate Governance
Information called for by Item 10 of Part III is incorporated by reference to the definitive Proxy Statementfor the 2018 Annual Meeting of Shareholders to be held on May 24, 2018, which is expected to be filed with theCommission within 120 days after December 31, 2017.
Item No. 11 - Executive Compensation
Information called for by Item 11 of Part III is incorporated by reference to the definitive Proxy Statementfor the 2017 Annual Meeting of Shareholders to be held on May 24, 2018, which is expected to be filed with theCommission within 120 days after December 31, 2017.
Item No. 12 - Security Ownership of Certain Beneficial Owners and Management and Related StockholderMatters
Information called for by Item 12 of Part III is incorporated by reference to the definitive Proxy Statementfor the 2018 Annual Meeting of Shareholders to be held on May 24, 2018, which is expected to be filed with theCommission within 120 days after December 31, 2017.
Item No. 13 - Certain Relationships and Related Transactions, and Director Independence
Information called for by Item 13 of Part III is incorporated by reference to the definitive Proxy Statementfor the 2018 Annual Meeting of Shareholders to be held on May 24, 2018, which is expected to be filed with theCommission within 120 days after December 31, 2017.
Item No. 14 - Principal Accountant Fees and Services
Information called for by Item 14 of Part III is incorporated by reference to the definitive Proxy Statementfor the 2018 Annual Meeting of Shareholders to be held on May 24, 2018, which is expected to be filed with theCommission within 120 days after December 31, 2017.
PART IV
Item No. 15 - Exhibits and Financial Statement Schedules
(a) 1. The Consolidated Financial Statements filed as part of this report on Form 10-K are listed on theaccompanying Index to Consolidated Financial Statements and Consolidated Financial StatementSchedules.
2. Financial schedules required to be filed by Item 8 of this form, and by Item 15(d) below:
All other financial schedules are not required under the related instructions or are inapplicable andtherefore have been omitted.
3. Exhibits: See the Exhibit Index immediately following the signature page of this Annual Reporton Form 10-K.

30
SIGNATURES
Pursuant to the requirements of Section 13 or 15(d) of the Securities Exchange Act of 1934, the registranthas duly caused this report to be signed on its behalf by the undersigned, thereunto duly authorized.
RELIV’ INTERNATIONAL, INC.
By: /s/ Robert L. MontgomeryRobert L. Montgomery, Chairman of the Board of Directors and Chief Executive Officer
Date: March 29, 2018
Pursuant to the requirements of the Securities Act of 1934, this report has been signed by the following persons onbehalf of the registrant and in the capacities and on the dates indicated.
By: /s/ Robert L. MontgomeryRobert L. Montgomery, Chairman of the Board of Directors and Chief Executive Officer
Date: March 29, 2018
By: /s/ Steven D. AlbrightSteven D. Albright, Chief Financial Officer (and accounting officer)
Date: March 29, 2018
By: /s/ Carl W. HastingsCarl W. Hastings, Vice Chairman, Chief Scientific Officer, Director
Date: March 29, 2018
By: /s/ John B. AkinJohn B. Akin, Director
Date: March 29, 2018
By: /s/ Robert M. HenryRobert M. Henry, Director
Date: March 29, 2018
By: /s/ John M. KlimekJohn M. Klimek, Director
Date: March 29, 2018
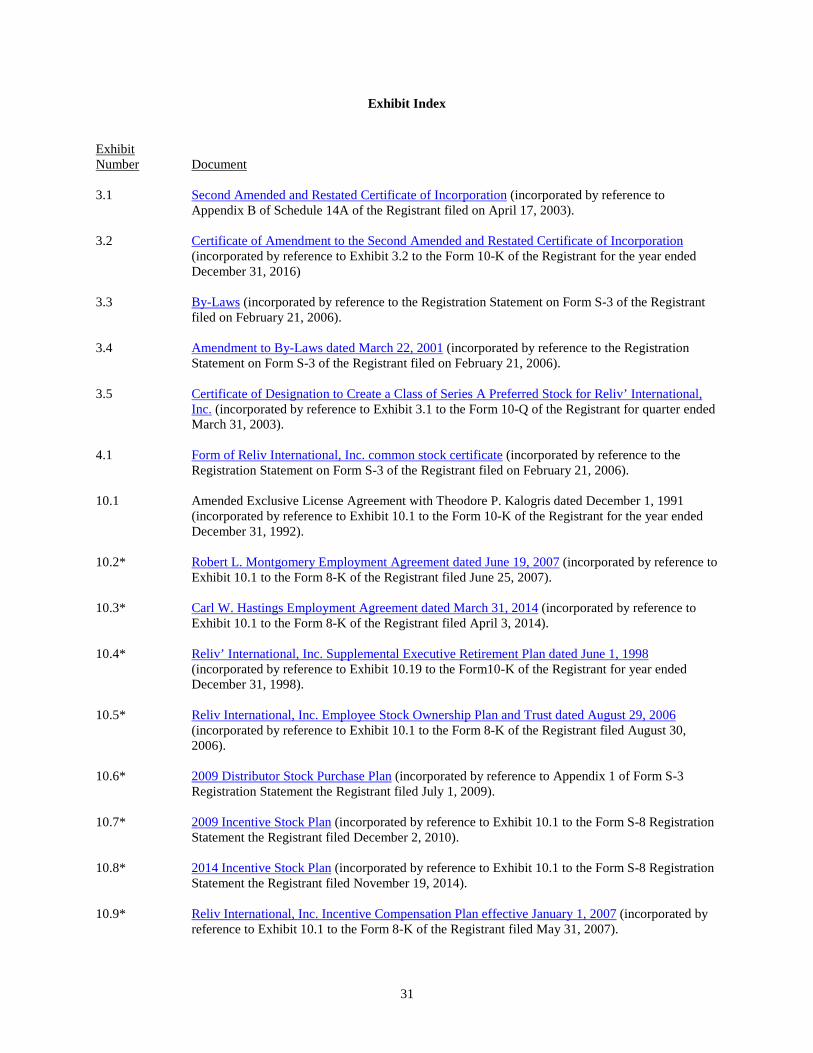
31
Exhibit Index
ExhibitNumber Document
3.1 Second Amended and Restated Certificate of Incorporation (incorporated by reference toAppendix B of Schedule 14A of the Registrant filed on April 17, 2003).
3.2 Certificate of Amendment to the Second Amended and Restated Certificate of Incorporation(incorporated by reference to Exhibit 3.2 to the Form 10-K of the Registrant for the year endedDecember 31, 2016)
3.3 By-Laws (incorporated by reference to the Registration Statement on Form S-3 of the Registrantfiled on February 21, 2006).
3.4 Amendment to By-Laws dated March 22, 2001 (incorporated by reference to the RegistrationStatement on Form S-3 of the Registrant filed on February 21, 2006).
3.5 Certificate of Designation to Create a Class of Series A Preferred Stock for Reliv’ International,Inc. (incorporated by reference to Exhibit 3.1 to the Form 10-Q of the Registrant for quarter endedMarch 31, 2003).
4.1 Form of Reliv International, Inc. common stock certificate (incorporated by reference to theRegistration Statement on Form S-3 of the Registrant filed on February 21, 2006).
10.1 Amended Exclusive License Agreement with Theodore P. Kalogris dated December 1, 1991(incorporated by reference to Exhibit 10.1 to the Form 10-K of the Registrant for the year endedDecember 31, 1992).
10.2* Robert L. Montgomery Employment Agreement dated June 19, 2007 (incorporated by reference toExhibit 10.1 to the Form 8-K of the Registrant filed June 25, 2007).
10.3* Carl W. Hastings Employment Agreement dated March 31, 2014 (incorporated by reference toExhibit 10.1 to the Form 8-K of the Registrant filed April 3, 2014).
10.4* Reliv’ International, Inc. Supplemental Executive Retirement Plan dated June 1, 1998(incorporated by reference to Exhibit 10.19 to the Form10-K of the Registrant for year endedDecember 31, 1998).
10.5* Reliv International, Inc. Employee Stock Ownership Plan and Trust dated August 29, 2006(incorporated by reference to Exhibit 10.1 to the Form 8-K of the Registrant filed August 30,2006).
10.6* 2009 Distributor Stock Purchase Plan (incorporated by reference to Appendix 1 of Form S-3Registration Statement the Registrant filed July 1, 2009).
10.7* 2009 Incentive Stock Plan (incorporated by reference to Exhibit 10.1 to the Form S-8 RegistrationStatement the Registrant filed December 2, 2010).
10.8* 2014 Incentive Stock Plan (incorporated by reference to Exhibit 10.1 to the Form S-8 RegistrationStatement the Registrant filed November 19, 2014).
10.9* Reliv International, Inc. Incentive Compensation Plan effective January 1, 2007 (incorporated byreference to Exhibit 10.1 to the Form 8-K of the Registrant filed May 31, 2007).

32
10.10* R. Scott Montgomery Employment Agreement dated January 2, 2008 (incorporated by referenceto Exhibit 10.1 to the Form 8-K of the Registrant filed January 4, 2008).
10.11* Ryan A. Montgomery Employment Agreement dated January 2, 2008 (incorporated by referenceto Exhibit 10.2 to the Form 8-K of the Registrant filed January 4, 2008).
10.12* Steven G. Hastings Employment Agreement dated January 2, 2008 (incorporated by reference toExhibit 10.3 to the Form 8-K of the Registrant filed January 4, 2008).
10.13* Steven D. Albright Employment Agreement dated January 2, 2008 (incorporated by reference toExhibit 10.4 to the Form 8-K of the Registrant filed January 4, 2008).
10.14* Brett M. Hastings Employment Agreement dated January 2, 2008 (incorporated by reference toExhibit 10.5 to the Form 8-K of the Registrant filed January 4, 2008).
10.15 Loan Sale Agreement between 2010-1 RADC/CADC Venture, LLC and Reliv International, Inc.dated March 16, 2012 (incorporated by reference to Exhibit 10.1 to the Form 10-Q of theRegistrant for the quarter ended March 31, 2012).
10.16 Technology License Agreement by and between SL Technology, Inc. and Soy Labs, LLC datedJuly 23, 2013 (incorporated by reference to Exhibit 10.1 to the Form 8-K of the Registrant filedJuly 25, 2013).
10.17 Agreement by and among Reliv International, Inc., SL Technology, Inc., Soy Labs, LLC and1Soy, Inc. dated July 23, 2013 (incorporated by reference to Exhibit 10.2 to the Form 8-K of theRegistrant filed July 25, 2013).
10.18 Letter agreement between SL Technology, Inc. and Soy Labs, LLC dated September 2, 2016(incorporated by reference to Exhibit 10.18 to the Form 10-K of the Registrant for the year endedDecember 31, 2016)
10.19 Promissory Note (term loan) dated September 30, 2015 among Reliv International, Inc., Reliv,Inc., Reliv World Corporation, and SL Technology, Inc., as Borrowers and Enterprise Bank &Trust (incorporated by reference to Exhibit 10.1 to the Form 10-Q of the Registrant filedNovember 13, 2015).
10.20 Promissory Note (revolving credit facility) dated September 30, 2015 among Reliv International,Inc., Reliv, Inc., Reliv World Corporation, and SL Technology, Inc., as Borrowers and EnterpriseBank & Trust (incorporated by reference to Exhibit 10.2 to the Form 10-Q of the Registrant filedNovember 13, 2015).
10.21 Business Loan Agreement dated September 30, 2015 among Reliv International, Inc., Reliv, Inc.,Reliv World Corporation, and SL Technology, Inc., as Borrowers and Enterprise Bank & Trust(incorporated by reference to Exhibit 10.3 to the Form 10-Q of the Registrant filed November 13,2015).
10.22 Deed of Trust dated September 30, 2015 between Reliv International, Inc. as Grantor andEnterprise Bank & Trust (incorporated by reference to Exhibit 10.4 to the Form 10-Q of theRegistrant filed November 13, 2015).
10.23 First Amendment to Loan Agreement dated September 30, 2016 among Reliv International, Inc.,Reliv, Inc., Reliv World Corporation, and SL Technology, Inc., as Borrowers and Enterprise Bank& Trust (incorporated by reference to Exhibit 10.1 to the Form 10-Q of the Registrant filedNovember 14, 2016).
10.24 Change in Terms Agreement (revolving credit facility) dated September 30, 2016 among RelivInternational, Inc., Reliv, Inc., Reliv World Corporation, and SL Technology, Inc., as Borrowers

33
and Enterprise Bank & Trust (incorporated by reference to Exhibit 10.2 to the Form 10-Q of theRegistrant filed November 14, 2016).
11 Statement re: computation of per share earnings (incorporated by reference to Note 8 of theConsolidated Financial Statements contained in Part IV).
21 Subsidiaries of the Registrant (filed herewith).
23 Consent of Ernst & Young LLP, Independent Registered Public Accounting Firm (filed herewith).
31.1 Certification of Chief Executive Officer pursuant to Rule 13a-14(a) and Rule 15d-14(a) of theSecurities Exchange Act, as amended (filed herewith).
31.2 Certification of Chief Financial Officer pursuant to Rule 13a-14(a) and Rule 15d-14(a) of theSecurities Exchange Act, as amended (filed herewith).
32 Certification of Chief Executive Officer and Chief Financial Officer pursuant to 18 U.S.C.1350, as adopted pursuant to Section 906 of the Sarbanes-Oxley Act of 2002 (filed herewith).
101 Interactive Data Files, including the following materials from the Company’s Annual Report onForm 10-K for the year ended December 31, 2017, formatted in XBRL: (i) the ConsolidatedBalance Sheets, (ii) the Consolidated Statements of Net Loss and Comprehensive Loss, (iii) theConsolidated Statements of Stockholders’ Equity, (iv) the Consolidated Statements of Cash Flows,and (v) the Notes to Consolidated Financial Statements.
*Indicates management compensation plan, contract or arrangement.

[this page intentionally left blank]

Reliv’ International, Inc.and Subsidiaries
Consolidated Financial Statements
Years ended December 31, 2017 and 2016
Contents
Consolidated Financial Statements:Report of Independent Registered Public Accounting Firm.....................................F-1Consolidated Balance Sheets as of December 31, 2017 and 2016 ...........................F-2Consolidated Statements of Net Loss and Comprehensive
Loss for the years ended December 31, 2017 and 2016 ........................................F-4Consolidated Statements of Stockholders’ Equity for the years ended
December 31, 2017 and 2016 ................................................................................F-5Consolidated Statements of Cash Flows for the years endedDecember 31, 2017 and 2016 .................................................................................F-6
Notes to Consolidated Financial Statements – December 31, 2017 .........................F-8

F-1
Report of Independent Registered Public Accounting Firm
The Board of Directors and Stockholders
Reliv’ International, Inc.
Opinion on the Financial Statements
We have audited the accompanying consolidated balance sheets of Reliv’ International, Inc. and Subsidiaries (theCompany) as of December 31, 2017 and 2016, and the related consolidated statements of net loss andcomprehensive loss, stockholders’ equity, and cash flows for each of the two years in the period ended December31, 2017, and the related notes (collectively referred to as the “consolidated financial statements”). In our opinion,the consolidated financial statements present fairly, in all material respects, the financial position of the Company atDecember 31, 2017 and 2016, and the results of its operations and its cash flows for each of the two years in theperiod ended December 31, 2017, in conformity with U.S. generally accepted accounting principles.
Basis for Opinion
These financial statements are the responsibility of the Company’s management. Our responsibility is to express anopinion on the Company’s financial statements based on our audits. We are a public accounting firm registered withthe Public Company Accounting Oversight Board (United States) (PCAOB) and are required to be independent withrespect to the Company in accordance with the U.S. federal securities laws and the applicable rules and regulationsof the Securities and Exchange Commission and the PCAOB.
We conducted our audits in accordance with the standards of the PCAOB. Those standards require that we plan andperform the audit to obtain reasonable assurance about whether the financial statements are free of materialmisstatement, whether due to error or fraud. The Company is not required to have, nor were we engaged to perform,an audit of its internal control over financial reporting. As part of our audits we are required to obtain anunderstanding of internal control over financial reporting but not for the purpose of expressing an opinion on theeffectiveness of the Company’s internal control over financial reporting. Accordingly, we express no such opinion.
Our audits included performing procedures to assess the risks of material misstatement of the financial statements,whether due to error or fraud, and performing procedures that respond to those risks. Such procedures includedexamining, on a test basis, evidence regarding the amounts and disclosures in the financial statements. Our auditsalso included evaluating the accounting principles used and significant estimates made by management, as well asevaluating the overall presentation of financial statements. We believe that our audits provide a reasonable basis forour opinion.
/s/ Ernst & Young LLP
We have served as the Company’s auditor since 1991.
St. Louis, MissouriMarch 29, 2018

F-2
Reliv’ International, Inc. and Subsidiaries
Consolidated Balance Sheets
2017 2016
Assets
Current assets:
Cash and cash equivalents 3,272,788$ 3,606,817$Accounts receivable, less allowances of $26,300
in 2017 and $26,700 in 2016 29,760 126,113
Accounts due from employees and distributors 138,497 139,931
Inventories:
Finished goods 2,762,249 2,629,541
Raw materials 1,653,466 1,728,136
Sales aids and promotional materials 139,770 130,153
Total inventories 4,555,485 4,487,830
Refundable income taxes 26,552 97,194
Prepaid expenses and other current assets 372,602 474,183
Total current assets 8,395,684 8,932,068
Other assets 337,190 305,137
Cash surrender value of life insurance 3,086,522 2,965,981
Note receivable due from distributor 1,405,113 1,521,005
Deferred income taxes - 487,000
Intangible assets, net 2,174,248 2,400,234
Property, plant, and equipment 19,055,260 18,600,665
Less accumulated depreciation 13,378,021 12,746,363
Property, plant, and equipment, net 5,677,239 5,854,302
Total assets 21,075,996$ 22,465,727$
December 31
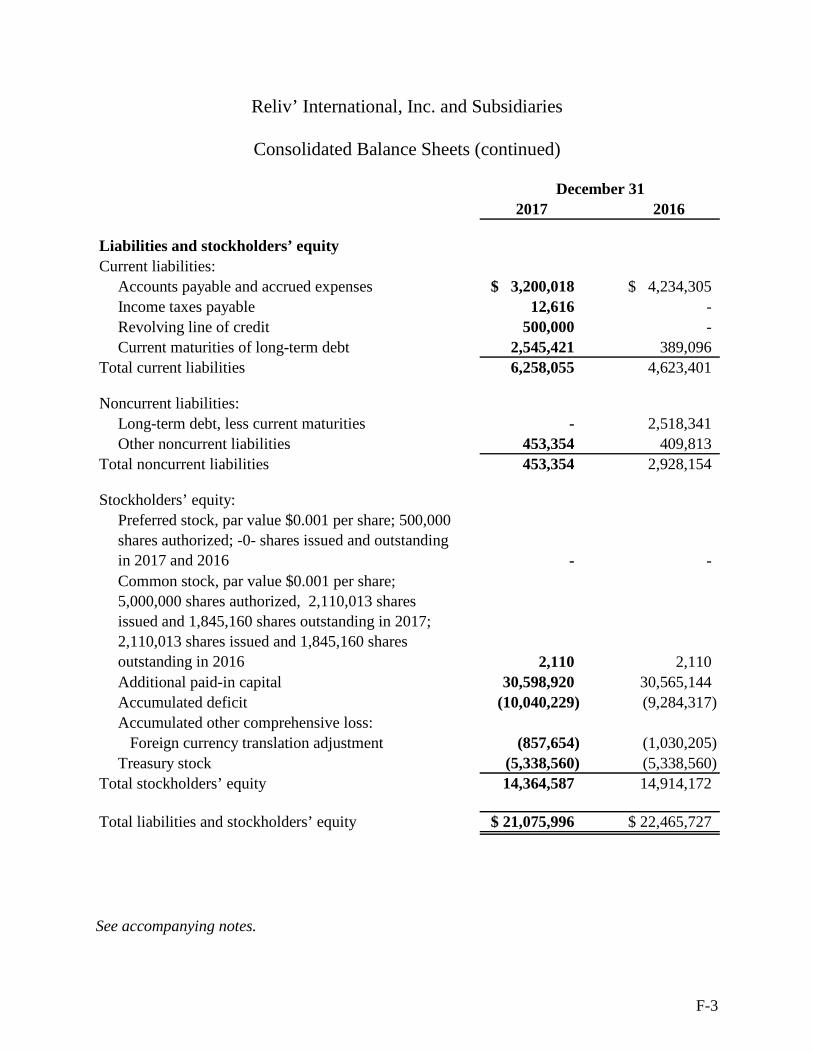
F-3
Reliv’ International, Inc. and Subsidiaries
Consolidated Balance Sheets (continued)
2017 2016
Liabilities and stockholders’ equity
Current liabilities:
Accounts payable and accrued expenses 3,200,018$ 4,234,305$
Income taxes payable 12,616 -
Revolving line of credit 500,000 -
Current maturities of long-term debt 2,545,421 389,096
Total current liabilities 6,258,055 4,623,401
Noncurrent liabilities:
Long-term debt, less current maturities - 2,518,341
Other noncurrent liabilities 453,354 409,813
Total noncurrent liabilities 453,354 2,928,154
Stockholders’ equity:
Preferred stock, par value $0.001 per share; 500,000
shares authorized; -0- shares issued and outstanding
in 2017 and 2016 - -
Common stock, par value $0.001 per share;
5,000,000 shares authorized, 2,110,013 shares
issued and 1,845,160 shares outstanding in 2017;
2,110,013 shares issued and 1,845,160 shares
outstanding in 2016 2,110 2,110
Additional paid-in capital 30,598,920 30,565,144
Accumulated deficit (10,040,229) (9,284,317)
Accumulated other comprehensive loss:
Foreign currency translation adjustment (857,654) (1,030,205)
Treasury stock (5,338,560) (5,338,560)
Total stockholders’ equity 14,364,587 14,914,172
Total liabilities and stockholders’ equity 21,075,996$ 22,465,727$
December 31
See accompanying notes.

F-4
Reliv’ International, Inc. and Subsidiaries
Consolidated Statements of Net Lossand Comprehensive Loss
2017 2016
Product sales 38,751,357$ 42,004,961$
Handling & freight income 3,037,425 3,507,875
Net sales 41,788,782 45,512,836
Costs and expenses:
Cost of products sold 9,401,406 10,024,021
Distributor royalties and commissions 14,685,553 16,095,032
Selling, general, and administrative 17,885,226 20,205,762
Loss from operations (183,403) (811,979)
Other income (expense):
Interest income 101,901 107,006
Interest expense (109,254) (106,682)
Other income (expense) 38,844 195,600
Loss before income taxes (151,912) (616,055)
Provision for income taxes 545,000 9,000
Net loss available to commonshareholders (696,912)$ (625,055)$
Other comprehensive income (loss):
Foreign currency translation adjustment 113,551 (395,932)
Comprehensive loss (583,361)$ (1,020,987)$
Loss per common share - Basic ($0.38) ($0.34)
Weighted average shares 1,845,000 1,845,000
Loss per common share - Diluted ($0.38) ($0.34)
Weighted average shares 1,845,000 1,845,000
Year ended December 31
See accompanying notes.

Reliv' International, Inc. and SubsidiariesConsolidated Statements of Stockholders' Equity
Accumulated
Additional Other
Common Stock Paid-In Accumulated Comprehensive Treasury Stock
Shares Amount Capital Deficit Loss Shares Amount Total
Balance at December 31, 2015 2,110,436 2,110$ 30,512,480$ (8,659,262)$ (634,273)$ 264,853 (5,338,560)$ 15,882,495$
Net loss - - - (625,055) - - - (625,055)
Other comprehensive income (loss):
Foreign currency translation adjustment - - - - (395,932) - - (395,932)
Total comprehensive loss (1,020,987)
Stock-based compensation - - 60,342 - - - - 60,342
Expired stock options & warrants; deferred tax effect - - (5,467) - - - - (5,467)
Common stock repurchased and retired (423) - (2,211) - - - - (2,211)
Balance at December 31, 2016 2,110,013 2,110 30,565,144 (9,284,317) (1,030,205) 264,853 (5,338,560) 14,914,172
Net loss - - - (696,912) - - - (696,912)
Other comprehensive income (loss):
Foreign currency translation adjustment - - - - 113,551 - - 113,551
Income tax effects of Tax Cuts & Jobs Act - Note 1 - - - (59,000) 59,000 - - -
Total comprehensive loss (583,361)
Stock-based compensation - - 33,776 - - - - 33,776
Balance at December 31, 2017 2,110,013 2,110$ 30,598,920$ (10,040,229)$ (857,654)$ 264,853 (5,338,560)$ 14,364,587$
Applicable 2015 amounts have been restated for the 2016 reverse stock split; see Note 1.
See accompanying notes.
F-5
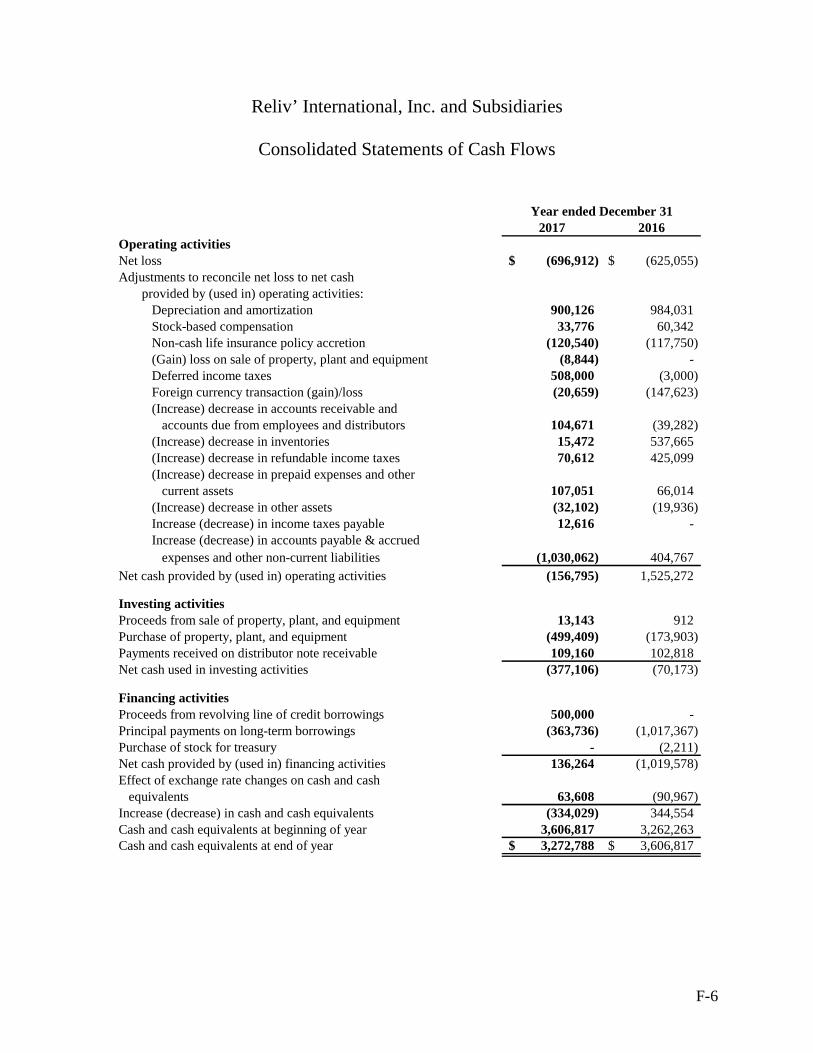
F-6
Reliv’ International, Inc. and Subsidiaries
Consolidated Statements of Cash Flows
2017 2016Operating activitiesNet loss (696,912)$ (625,055)$Adjustments to reconcile net loss to net cash
provided by (used in) operating activities:Depreciation and amortization 900,126 984,031Stock-based compensation 33,776 60,342Non-cash life insurance policy accretion (120,540) (117,750)(Gain) loss on sale of property, plant and equipment (8,844) -Deferred income taxes 508,000 (3,000)Foreign currency transaction (gain)/loss (20,659) (147,623)(Increase) decrease in accounts receivable and
accounts due from employees and distributors 104,671 (39,282)(Increase) decrease in inventories 15,472 537,665(Increase) decrease in refundable income taxes 70,612 425,099(Increase) decrease in prepaid expenses and other
current assets 107,051 66,014(Increase) decrease in other assets (32,102) (19,936)Increase (decrease) in income taxes payable 12,616 -Increase (decrease) in accounts payable & accrued
expenses and other non-current liabilities (1,030,062) 404,767
Net cash provided by (used in) operating activities (156,795) 1,525,272
Investing activitiesProceeds from sale of property, plant, and equipment 13,143 912Purchase of property, plant, and equipment (499,409) (173,903)Payments received on distributor note receivable 109,160 102,818Net cash used in investing activities (377,106) (70,173)
Financing activitiesProceeds from revolving line of credit borrowings 500,000 -Principal payments on long-term borrowings (363,736) (1,017,367)Purchase of stock for treasury - (2,211)Net cash provided by (used in) financing activities 136,264 (1,019,578)Effect of exchange rate changes on cash and cash
equivalents 63,608 (90,967)Increase (decrease) in cash and cash equivalents (334,029) 344,554Cash and cash equivalents at beginning of year 3,606,817 3,262,263Cash and cash equivalents at end of year 3,272,788$ 3,606,817$
Year ended December 31

F-7
Reliv’ International, Inc. and Subsidiaries
Consolidated Statements of Cash Flows (continued)
2017 2016
Supplemental disclosures of cash flow information:Cash paid during the year for:
Interest 99,800$ 94,100$
Income taxes paid (received), net (52,500)$ (398,900)$
Year ended December 31
See accompanying notes.
Reliv’ International, Inc. and Subsidiaries
Notes to Consolidated Financial Statements
F-8
December 31, 2017
1. Nature of Business and Significant Accounting Policies
Nature of Business
Reliv’ International, Inc. (the Company) produces a proprietary line of nutritional supplementsaddressing basic nutrition, specific wellness needs, weight management, and sports nutrition.These products are sold by subsidiaries of the Company to a sales force of independentdistributors of the Company that sell products directly to consumers. The Company and itssubsidiaries sell products to distributors throughout the United States and in Australia, Austria,Canada, France, Germany, Indonesia, Ireland, Malaysia, Mexico, the Netherlands, New Zealand,the Philippines, Singapore, and the United Kingdom.
Basis of Presentation
The consolidated financial statements include the accounts of the Company and its foreign anddomestic subsidiaries. All significant intercompany accounts and transactions have beeneliminated.
On October 4, 2016, the Company effected a 1-for-7 reverse stock split of the Company’scommon stock. Each stockholder’s percentage ownership and proportional voting powerremained unchanged as a result of the reverse stock split. All applicable share data, per shareamounts, and related information in these consolidated financial statements and notes theretohave been adjusted retroactively to give effect to the 1-for-7 reverse stock split.
Cash Equivalents
The Company's policy is to consider the following as cash and cash equivalents: demanddeposits and short-term investments with a maturity of three months or less when purchased.
Inventories
Inventories are valued at the lower of cost or market. Product cost includes raw materials, labor,and overhead costs and is accounted for on a first-in, first-out basis. On a periodic basis, theCompany reviews its inventory levels, as compared to future demand requirements and the shelflife of the various products. Based on this review, the Company records inventory write-downswhen necessary.
Sales aids and promotional materials inventories represent distributor kits, product brochures,and other sales and business development materials which are held for sale to distributors. Costof the sales aids and promotional materials held for sale are capitalized as inventories andsubsequently recorded to cost of goods sold upon recognition of revenue when sold todistributors. All other advertising and promotional costs are expensed when incurred.

Reliv’ International, Inc. and Subsidiaries
Notes to Consolidated Financial Statements
F-9
1. Nature of Business and Significant Accounting Policies (continued)
Property, Plant, and Equipment
Property, plant, and equipment are stated on the cost basis. Depreciation is computed using thestraight-line or an accelerated method over the useful life of the related assets. Generally,computer equipment and software are depreciated over 3 to 5 years, office equipment andmachinery over 7 years, and real property over 39 years.
Foreign Currency Translation and Transaction Gains or Losses
All balance sheet accounts have been translated using the exchange rates in effect at the balancesheet date. Statements of net income (loss) amounts have been translated using the averageexchange rate for the year. The gains and losses resulting from the changes in exchange ratesfrom year to year have been reported in other comprehensive income (loss). The foreigncurrency translation adjustment is the only component of accumulated other comprehensive loss.If applicable, foreign currency translation adjustments exclude income tax expense (benefit) ascertain of the Company’s investments in non-U.S. subsidiaries are deemed to be reinvested foran indefinite period of time. Foreign currency transaction gains (losses) were $20,659 and$147,623 for 2017 and 2016, respectively.
Basic and Diluted Earnings per Share
Basic earnings per common share are computed using the weighted average number of commonshares outstanding during the year. Diluted earnings per common share are computed using theweighted average number of common shares and potential dilutive common shares that wereoutstanding during the period. Potential dilutive common shares consist of outstanding stockoptions, outstanding stock warrants, and convertible preferred stock. See Note 8 for additionalinformation regarding earnings per share.
Stock-Based Compensation
The Company has stock-based incentive plans under which it may grant stock option, restrictedstock, and unrestricted stock awards. The Company recognizes stock-based compensationexpense based on the grant date fair value of the award and the related vesting terms. Dependingupon the characteristics of the option, the fair value of stock-based awards is primarilydetermined using the Black-Scholes model, which incorporates assumptions and managementestimates including the risk-free interest rate, expected volatility, expected option life, anddividend yield. See Note 7 for additional information.
The Company accounts for options granted to non-employees and warrants granted todistributors under the fair value approach required by FASB ASC Topic 505-50, “Equity BasedPayments to Non-Employees.”

Reliv’ International, Inc. and Subsidiaries
Notes to Consolidated Financial Statements
F-10
1. Nature of Business and Significant Accounting Policies (continued)
Revenue Recognition
The Company receives payment by credit card, personal check, or guaranteed funds for ordersfrom independent distributors and makes related commission payments in the following month.Generally, net sales reflect product sales less the distributor discount of 20 percent to 40 percentof the suggested retail price. Sales revenue and commission expenses are recorded when themerchandise is shipped, as this is the point title and risk of loss pass to the distributor. Inaccordance with Financial Accounting Standards Board (“FASB”) Accounting StandardsCodification (“ASC”) Topic 605-50, “Revenue Recognition – Customer Payments andIncentives,” the Company presents distributor royalty and commission expense as an operatingexpense, rather than a reduction to net sales, as these payments are not made to the purchasingdistributor.
Actual and estimated sales returns are classified as a reduction of net sales. The Companyestimates and accrues a reserve for product returns based on the Company’s return policy andhistorical experience. The Company’s return policy allows for distributors to return product onlyupon termination of his or her distributorship. Allowable returns are limited to saleable productwhich was purchased within twelve months of the termination for a refund of 100% of theoriginal purchase price less any distributor royalties and commission received relating to theoriginal purchase of the returned products. For the years ended December 31, 2017 and 2016,total returns as a percent of net sales were approximately 0.25% and 0.20%, respectively.
The Company records handling and freight income as a component of net sales and recordshandling and freight costs as a component of cost of products sold. Total net sales do not includesales tax as the Company considers itself a pass-through conduit for collecting and remittingapplicable sales taxes.
Fair Value Measurements
FASB ASC Topic 820, “Fair Value Measurements and Disclosures,” defines fair value,establishes a framework for measuring fair value, and requires disclosures about fair valuemeasurements required under other accounting pronouncements. See Note 5 for furtherdiscussion.
Income Taxes
The provision for income taxes is computed using the liability method. The primary differencesbetween financial statement and taxable income result from financial statement accruals andreserves and differences between depreciation and amortization for book and tax purposes.
Unrecognized tax benefits are accounted for as required by FASB ASC Topic 740 whichprescribes a more likely than not threshold for financial statement presentation and measurementof a tax position taken or expected to be taken in a tax return. See Note 11 for further discussion.

Reliv’ International, Inc. and Subsidiaries
Notes to Consolidated Financial Statements
F-11
1. Nature of Business and Significant Accounting Policies (continued)
Advertising
Costs of sales aids and promotional materials are capitalized as inventories. All other advertisingand promotional costs are expensed when incurred. The Company recorded $22,300 and$36,900 of advertising expense in 2017 and 2016, respectively.
Research and Development Expenses
Research and development expenses, which are charged to selling, general, and administrativeexpenses as incurred, were $488,000 and $694,000 in 2017 and 2016, respectively.
Amortizable Intangible Assets
The Company records intangible assets based on management’s determination of the fair valueof the respective assets at the time of acquisition. Determining the fair value of intangible assetsis judgmental and involves the use of significant estimates and assumptions of future companyoperations. The Company bases its fair value estimates and related asset lives on assumptions itbelieves to be reasonable but that are unpredictable and inherently uncertain. Actual futureresults may differ from these estimates.
Intangible assets estimated to have finite lives are amortized over their estimated economic lifeunder the straight-line method; such method correlates to management’s estimate of the assets’economic benefit. Based on management’s estimates at origination, these lives range from twoto seventeen years. Related amortization expense is presented within Selling, General, andAdministrative in the accompanying consolidated statements of net loss and comprehensive loss.As of December 31, 2017, remaining lives of intangible assets range from seven to twelve years.
Use of Estimates
The preparation of financial statements in conformity with accounting principles generallyaccepted in the United States requires management to make estimates and assumptions thataffect the amounts reported in the financial statements and accompanying notes. Actual resultscould differ from those estimates.

Reliv’ International, Inc. and Subsidiaries
Notes to Consolidated Financial Statements
F-12
1. Nature of Business and Significant Accounting Policies (continued)
New Accounting Pronouncements – Adopted in 2017
In July 2015, the Financial Accounting Standards Board (FASB) issued Accounting StandardsUpdate (ASU) No. 2015-11, Inventory (Topic 330): Simplifying the Measurement of Inventory,which requires inventory within the scope of this update to be measured at the lower of its cost ornet realizable value, with net realizable value being the estimated selling price in the ordinarycourse of business, less reasonably predictable costs of completion, disposal, and transportation.As required, the Company adopted this new standard effective January 1, 2017. The Company’sadoption of this standard did not impact its consolidated financial statements and relateddisclosures.
In March 2016, the FASB issued ASU No. 2016-09, Compensation – Stock Compensation(Topic 718): Improvements to Employee Share-Based Payment Accounting. This amendment isintended to simplify several aspects of the accounting for share-based payment transactions,including the income tax consequences, classification of awards as either equity or liability,forfeitures, and classification on the statement of cash flows. As required, the Company adoptedthis new standard effective January 1, 2017. Concurrently with the adoption of this newstandard, the Company revised its accounting policy to recognize share-based compensationcosts based on actual stock option forfeitures versus previous accounting guidance whichrequired the Company to recognize share-based compensation costs based on management’sestimate of future stock option forfeitures. The Company’s adoption of this standard did notimpact its consolidated financial statements and related disclosures.
In February 2018, the FASB issued ASU No. 2018-02, Income Statement – ReportingComprehensive Income (Topic 220): Reclassification of Certain Tax Effects from AccumulatedOther Comprehensive Income. This amendment is intended to allow a reclassification fromaccumulated other comprehensive income to retained earnings for stranded tax effects resultingonly from the December 2017 enacted United States Tax Cuts and Jobs Act (TCJA) and is notintended to impact underlying accounting guidance that requires that the effect of a change in taxlaws or tax rates be included in income from operations. This update is effective for fiscal yearsbeginning after December 31, 2018 with earlier adoption permitted. The Company has earlyadopted this update in its fourth quarter ending December 31, 2017 resulting in a $59,000reclassification from accumulated other comprehensive income (loss) and a corresponding$59,000 reduction to retained earnings. This reclassification from accumulated othercomprehensive income (loss) relates to the deferred income tax stranded tax effects resultingfrom the change in the U.S. federal corporate income tax rate under the TCJA. The foreigncurrency translation adjustment is the Company’s only component of accumulated othercomprehensive income (loss).

Reliv’ International, Inc. and Subsidiaries
Notes to Consolidated Financial Statements
F-13
1. Nature of Business and Significant Accounting Policies (continued)
New Accounting Pronouncements – Not Yet Adopted
In May 2014, the FASB issued ASU No. 2014-09, Revenue from Contracts with Customers,which requires an entity to recognize the amount of revenue to which it expects to be entitled forthe transfer of promised goods or services to customers. The ASU will replace most existingU.S. GAAP revenue recognition guidance and will be adopted by the Company, when required,on January 1, 2018. The new standard permits the use of either the retrospective or modifiedretrospective transition method. The Company will select the modified retrospective method.The Company’s primary source of revenue is from the sale of nutritional products to theCompany’s independent distributors whereby revenue is currently recognized when product isshipped and risk of loss has passed to the customer. Upon adoption of this new standard, theCompany believes that the timing of revenue recognition related to nutritional product sales willremain materially consistent with its current practice. Based upon its completed evaluation, theCompany has identified membership fee-type revenue as an area that will be affected by the newstandard resulting in, upon adoption on January 1, 2018, a one-time reduction to retainedearnings of approximately $367,500.
In February 2016, the FASB issued ASU No. 2016-2, Leases (Topic 842) which supersedes theexisting lease guidance. This update requires lessees to recognize a lease liability and a leaseasset for all leases, including operating leases, with a lease term greater than twelve months onits balance sheet. The update also expands the required quantitative and qualitative disclosuressurrounding leases. This update is effective for fiscal years beginning after December 15, 2018and interim periods within those fiscal years, with earlier application permitted. The Companyexpects the adoption of this standard to result in the recognition of right-of-use assets and leaseliabilities not currently recorded in the Company’s consolidated financial statements. TheCompany is evaluating its transition method and other effects that the new standard will have onits consolidated financial statements and related disclosures.
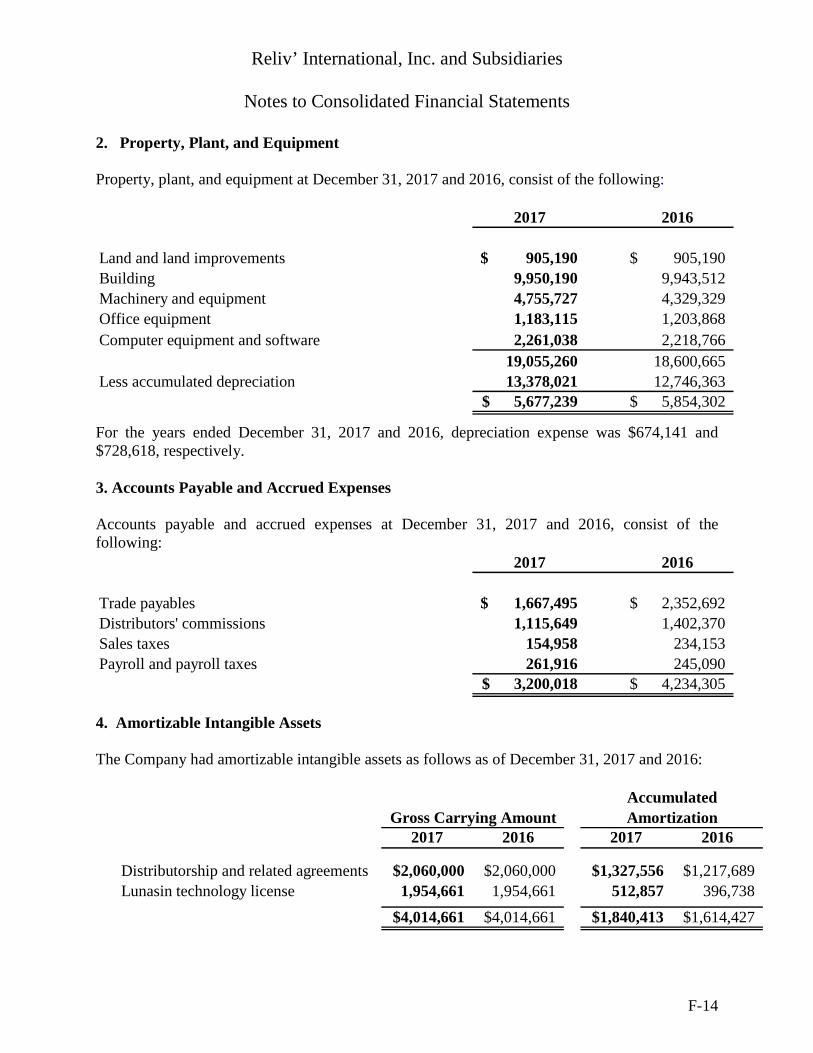
Reliv’ International, Inc. and Subsidiaries
Notes to Consolidated Financial Statements
F-14
2. Property, Plant, and Equipment
Property, plant, and equipment at December 31, 2017 and 2016, consist of the following:
2017 2016
Land and land improvements 905,190$ 905,190$
Building 9,950,190 9,943,512
Machinery and equipment 4,755,727 4,329,329
Office equipment 1,183,115 1,203,868
Computer equipment and software 2,261,038 2,218,766
19,055,260 18,600,665
Less accumulated depreciation 13,378,021 12,746,3635,677,239$ 5,854,302$
For the years ended December 31, 2017 and 2016, depreciation expense was $674,141 and$728,618, respectively.
3. Accounts Payable and Accrued Expenses
Accounts payable and accrued expenses at December 31, 2017 and 2016, consist of thefollowing:
2017 2016
Trade payables 1,667,495$ 2,352,692$
Distributors' commissions 1,115,649 1,402,370
Sales taxes 154,958 234,153
Payroll and payroll taxes 261,916 245,090
3,200,018$ 4,234,305$
4. Amortizable Intangible Assets
The Company had amortizable intangible assets as follows as of December 31, 2017 and 2016:
2017 2016 2017 2016
Distributorship and related agreements $2,060,000 $2,060,000 $1,327,556 $1,217,689
Lunasin technology license 1,954,661 1,954,661 512,857 396,738
$4,014,661 $4,014,661 $1,840,413 $1,614,427
Gross Carrying Amount Amortization
Accumulated

Reliv’ International, Inc. and Subsidiaries
Notes to Consolidated Financial Statements
F-15
4. Amortizable Intangible Assets (continued)
Amortization expense for intangible assets totaled $225,985 and $255,413 in 2017 and 2016,respectively. Amortization expense for amortizable intangible assets over the next five years isestimated to be:
Intangible
Amortization
2018 $226,000
2019 226,000
2020 226,000
2021 226,000
2022 226,000
5. Fair Value of Financial Instruments
The carrying amount and fair value of financial instruments at December 31, 2017 and 2016were approximately as follows:
Carrying Fair
Description Amount Value Level 1 Level 2 Level 3
December 31, 2017
Long-term debt $3,045,421 $3,045,421 - $3,045,421 -
Note receivable 1,521,005 1,684,000 - 1,684,000 -
Marketable securities 330,000 330,000 $330,000 - -
December 31, 2016
Long-term debt $2,907,437 $2,907,437 - $2,907,437 -
Note receivable 1,630,164 1,812,000 - 1,812,000 -
Marketable securities 296,000 296,000 $296,000 - -
Fair value can be measured using valuation techniques such as the market approach (comparablemarket prices), the income approach (present value of future income or cash flow), and the costapproach (cost to replace the service capacity of an asset or replacement cost). Accountingstandards utilize a fair value hierarchy that prioritizes the inputs to valuation techniques used tomeasure fair value into three broad levels. The following is a brief description of those levels:
Level 1: Observable inputs such as quoted prices (unadjusted) in active markets for identicalassets or liabilities.
Level 2: Inputs other than quoted prices that are observable for the asset or liability, eitherdirectly or indirectly. These include quoted prices for similar assets or liabilities inactive markets or similar assets or liabilities in markets that are not active.

Reliv’ International, Inc. and Subsidiaries
Notes to Consolidated Financial Statements
F-16
5. Fair Value of Financial Instruments (continued)
Level 3: Unobservable inputs that reflect the reporting entity’s own assumptions.
Long-term debt: The fair value of the Company’s term and revolver loans approximate carryingvalue as these loans have variable market-based interest rates that reset every thirty days.
Note receivable: The Company’s note receivable is a variable rate residential mortgage-basedfinancial instrument. An average of published interest rate quotes for a fifteen-year residentialjumbo mortgage, a comparable financial instrument, was used to estimate fair value of this notereceivable under a discounted cash flow model.
Marketable securities: The assets (trading securities) of the Company’s Supplemental ExecutiveRetirement Plan are recorded at fair value on a recurring basis, and are presented within OtherAssets in the consolidated balance sheets.
The carrying value of other financial instruments, including cash, accounts receivable andaccounts payable, and accrued liabilities approximate fair value due to their short maturities orvariable-rate nature of the respective balances.
6. Debt
Debt at December 31, 2017 and 2016 consists of the following:
2017 2016
Term loan 2,545,421$ 2,843,301$Revolving line of credit 500,000 -Notes payable - 64,136
3,045,421 2,907,437Less current maturities 3,045,421 389,096Long-term portion -$ 2,518,341$
Term Loan and Revolving Loan Agreements
Effective September 30, 2015, the Company entered into a series of lending agreements with anew primary lender which include agreements for a $3.25 million term loan and $3.5 millionrevolving credit facility. These lending agreements replace similar borrowings under agreementswith the Company’s former primary lender.
Reliv’ International, Inc. and Subsidiaries
Notes to Consolidated Financial Statements
F-17
6. Debt (continued)
Term Loan and Revolving Loan Agreements (continued)
The new $3.25 million term loan is for a period of three years and requires monthly term loanpayments, under a ten-year amortization, consisting of principal of $27,080 plus interest with aballoon payment for the outstanding balance due and payable on September 30, 2018. The termloan’s interest is based on the 30-day LIBOR plus 2.25% and was 3.62% at December 31, 2017.
The new $3.5 million revolving line of credit agreement, originally dated September 30, 2015,accrues interest at a floating interest rate based on the 30-day LIBOR plus 2.25% and had anoriginal term of one year. Effective September 30, 2016, the revolving line of credit agreementwas extended under similar terms to April 30, 2018. As of December 31, 2017, there wereoutstanding borrowings of $500,000 under the revolving line of credit.
The proceeds from the new $3.25 million term loan were used to pay off the outstanding termloan and revolving line of credit balances, plus accrued interest, due under loan agreements withthe Company’s former primary lender.
Borrowings under the current lending agreements are secured by all tangible and intangibleassets of the Company, a whole life insurance policy on the life of the Company’s ChiefExecutive Officer, which was assigned to the lender, and by a mortgage on the real estate of theCompany’s headquarters.
The Company anticipates being able to successfully renegotiate and extend the maturity of boththe revolving line of credit and term note prior to becoming due. If the loan extension terms arenot mutually agreeable, the Company would consider utilizing proceeds from its cash surrendervalue life insurance policy to repay the lender as such loan obligations become due.
The original September 30, 2015 lending agreements include a quarterly covenant requiring theCompany to maintain net tangible worth of not less than $9.5 million. The September 30, 2016revolving line of credit agreement extension added a quarterly financial covenant under whichthe Company had or will have: i) a quarterly minimum requirement of earnings before interestexpense, income tax expense, depreciation, and amortization (“EBITDA”) of $200,000 for thequarter ended December 31, 2016; ii) a cumulative minimum EBITDA requirement of $200,000,$400,000, $600,000, and $800,000 for the fiscal periods ending March 31, 2017, June 30, 2017,September 30, 2017, and December 31, 2017, respectively; and iii) a minimum EBITDA of$200,000 for the quarter ended March 31, 2018.
As defined, EBITDA means the Company’s consolidated net income for such period, beforeinterest expense, income tax expense, depreciation and amortization, management fees, andfurther adjusted to exclude any gain or loss on the sale of assets, other extraordinary gains orlosses, and any one-time adjustments approved by the lender.
At December 31, 2017, the Company was in compliance with its loan covenant requirements.

Reliv’ International, Inc. and Subsidiaries
Notes to Consolidated Financial Statements
F-18
7. Stockholders’ Equity
Stock Options – Incentive Stock Plans
The Company sponsors an incentive stock plan (the “2014 Plan”) allowing for a maximum of142,857 shares to be granted in the form of either incentive stock options, non-qualified stockoptions, restricted stock awards, or unrestricted stock awards. Employees, directors, advisors,and consultants of the Company are eligible to receive the grants. This plan has been approvedby the stockholders of the Company. The Compensation Committee of the Board of Directorsadministers the plan.
The 2014 Plan provides that options may be issued under the Plan at an option price not less thanfair market value of the stock at the time the option is granted. Under the plan, restricted stockof the Company may be granted at no cost to the grantee. The grantees are entitled to dividendsand voting rights for their respective shares. Restrictions limit the sale or transfer of these sharesduring the requisite service period. In addition, the committee may grant or sell unrestrictedstock at a purchase price to be determined by the committee. Vesting terms and restrictions, ifapplicable, under the plan, are set by the committee and will be 10 years or less. The 2014 Planexpires in 2024.
A summary of the Company’s stock option activity and related information for the years endedDecember 31 follows:
Options
Weighted
Avg.
Exercise
Price Options
Weighted
Avg.
Exercise
Price
Outstanding beginning of the year 236,844 $8.14 261,700 $8.11Granted - -Exercised - -Expired and forfeited (96,420) 8.57 (24,856) 7.96Outstanding at end of year 140,424 $7.85 236,844 $8.14
Exercisable at end of year 13,713 $7.77 55,066 $8.54
2017 2016
The aggregate intrinsic value of stock options outstanding and currently exercisable at December31, 2017 was $-0-.
In May 2017, the Company’s shareholders voted to approve a 2017 Incentive Stock Plan (2017Plan) which authorizes the issuance of up to 200,000 shares of the Company’s common stock invarious forms of stock options and/or stock awards. The 2017 Plan will not become effectiveuntil registered with the Securities and Exchange Commission.

Reliv’ International, Inc. and Subsidiaries
Notes to Consolidated Financial Statements
F-19
7. Stockholders’ Equity (continued)
Stock Options – Incentive Stock Plans (continued)
Range of
Exercise Prices
Number
Outstanding
Weighted Avg.
Remaining Life
Weighted Avg.
Exercise Price
Number
Exercisable
Weighted Avg.
Remaining Life
Weighted Avg.
Exercise Price
$7.77 114,282 2.17 $7.77 13,713 2.17 $7.77$8.19 26,142 0.17 8.19 - - -
$7.77 - $8.19 140,424 1.80 $7.85 13,713 2.17 $7.77
Options Outstanding Options ExercisableAs of December 31, 2017
Compensation cost for the stock option plan was approximately $27,000 ($27,000 net of tax) and$56,000 ($56,000 net of tax) for the years ended December 31, 2017 and 2016, respectively, andhas been recorded in selling, general, and administrative expense. As of December 31, 2017, thetotal remaining unrecognized compensation cost related to the non-vested portion of time vestingstock options totaled $54,000 ($54,000 net of tax), which will be amortized over the weightedremaining requisite service period of 2.17 years.
Distributor Stock Purchase Plan
In July 2009, the Company established a Distributor Stock Purchase Plan (2009 Plan) whichreplaced a similar plan which had expired.
The plan allows distributors who have reached the “Ambassador” status the opportunity toallocate up to 10% of their monthly compensation into the plan to be used to purchase theCompany’s common stock at the current market value. The plan also states that at the end ofeach year, the Company will grant warrants to purchase additional shares of the Company’scommon stock based on the number of shares purchased by the distributors under the plan duringthe year. The warrant exercise price will equal the market price for the Company’s commonstock at the date of issuance. The warrants issued shall be in the amount of 25% of the totalshares purchased under the plan during the year and the warrants are fully vested upon grant.
The Company records expense under the fair value method for warrants granted to distributors.Total expense recorded for these warrants was $6,600 and $4,062 in 2017 and 2016,respectively.
Reliv’ International, Inc. and Subsidiaries
Notes to Consolidated Financial Statements
F-20
7. Stockholders’ Equity (continued)
Distributor Stock Purchase Plan (continued)
The fair value of the warrants was estimated at the date of grant using a Black-Scholes optionpricing model with the following assumptions:
2017 2016
Expected warrant life (years) 3.0 3.0
Risk-free weighted average interest rate 1.98% 1.47%
Stock price volatility 73.8% 75.9%
Dividend yield 0.0% 0.0%
Year ended December 31
A summary of the Company’s warrant activity and related information for the years endedDecember 31 follows:
Warrants
Weighted
Avg.
Exercise
Price Warrants
Weighted
Avg.
Exercise
Price
Outstanding beginning of the year 6,291 $5.34 5,484 $10.13Granted 1,258 4.77 2,519 4.64Exercised - -Expired (1,589) 8.19 (1,712) 19.67
Outstanding at end of year 5,960 $4.46 6,291 $5.34
Exercisable at end of year 5,960 6,291
Range of
Exercise Prices Warrants
Weighted
Avg. Exercise
Price
$ 4.06 2,183 $4.06$ 4.64 2,519 4.64$ 4.77 1,258 4.77
$4.06 - $4.77 5,960 $4.46
3.00
1.84
Warrants Outstanding and ExercisableAs of December 31, 2017
20162017
Weighted
Avg. Remaining
Life1.002.00
The intrinsic value for stock warrants outstanding at December 31, 2017 was $2,000.

Reliv’ International, Inc. and Subsidiaries
Notes to Consolidated Financial Statements
F-21
8. Loss per Share
The following table sets forth the computation of basic and diluted loss per share:
2017 2016Numerator:
Net loss ($696,912) ($625,055)Denominator:
Denominator for basic loss per share – weighted
average shares 1,845,000 1,845,000
Dilutive effect of employee stock options and
other warrants - -
Denominator for diluted loss per share – adjusted
weighted average shares 1,845,000 1,845,000
Basic loss per share ($0.38) ($0.34)
Diluted loss per share ($0.38) ($0.34)
Year ended December 31
For the years ended December 31, 2017 and 2016, options and warrants totaling 146,384 and238,433, respectively, shares of common stock were not included in the denominator for dilutedloss per share because their effect would be anti-dilutive or because the shares were deemedcontingently issuable.
9. Leases
The Company leases certain office facilities, storage, and equipment. These leases have varyingterms, and certain leases have renewal and/or purchase options. Future minimum payments undernon-cancelable leases with initial or remaining terms in excess of one year consist of thefollowing at December 31, 2017:
2018 252,901$
2019 191,831
2020 150,081
2021 10,243
2022 10,242
Thereafter -
615,298$
Rent expense for operating leases was $338,734 and $370,554 for the years ended December 31,2017 and 2016, respectively.

Reliv’ International, Inc. and Subsidiaries
Notes to Consolidated Financial Statements
F-22
10. Note Receivable Due From Distributor
In March 2012, the Company purchased a note and mortgage (“Note”) from a real estateinvestment management firm on certain properties in Wyoming and Idaho for $2 million. InMay 2012, the Company entered into a Loan Modification Agreement (“LMA”) with the Note’soriginal and present borrower (“Borrower”) to restructure the Note’s principal amount due andrelated terms. The LMA terms are for a principal balance due of $2 million with interest onlypayments made monthly in 2012. The LMA’s interest rate is the greater of 6% or prime andthere is no prepayment penalty for voluntary principal payments. Concurrently, with theexecution of the LMA, the Company and the Borrower also entered into a Security Agreement inwhich repayment of the LMA is secured by the Borrower’s Reliv distributorship business.
As originally structured, beginning in 2013, the LMA was to require monthly payment ofprincipal and interest under a five-year amortization period. In February 2013, while retainingthe Company’s right to require Borrower’s compliance with the LMA’s terms, the Company andthe Borrower agreed to a verbal modification in the payment schedule in which the Companyagreed to accept monthly payments of principal and interest under a fifteen-year amortizationperiod. The outstanding balance of the note receivable was $1,521,005 and $1,630,164 as ofDecember 31, 2017 and 2016, respectively.
11. Income Taxes
Compenents of loss before income taxes:
2017 2016
United States ($30,606) ($499,004)
Foreign (121,306) (117,051)($151,912) ($616,055)
Year ended December 31
Compenents of provision (benefit) for income taxes:
2017 2016
Current:
Federal ($2,000) ($15,000)
State 5,000 (10,000)
Foreign 33,000 29,000
Total current 36,000 4,000
Deferred:
Federal - (27,000)
State - (4,000)
Foreign 509,000 36,000
Total deferred 509,000 5,000
$545,000 $9,000
Year ended December 31

Reliv’ International, Inc. and Subsidiaries
Notes to Consolidated Financial Statements
F-23
11. Income Taxes (continued)
The provision (benefit) for income taxes is different from the amounts computed by applying theUnited States federal statutory income tax rate of 34%. The reasons for these differences are asfollows:
2017 2016
Income taxes at U.S. statutory rate ($52,000) ($209,000)
State income taxes, net of federal benefit 11,000 11,000
Higher/(lower) effective taxes on earnings/losses
in foreign countries (65,000) (104,000)
Foreign corporate income taxes 33,000 44,000
Foreign tax credit carryover (66,000) -
Effect of future tax rate changes to foreign
deferred income taxes - 21,000
Nondeductible meals and entertainment expense 13,000 15,000
Net operating loss carryback claims - (19,000)
Valuation allowance, net 707,000 292,000
Other (36,000) (42,000)
$545,000 $9,000
Year ended December 31
During 2016 and 2017, the Company determined that it was more likely than not that U.S.federal and various state net operating losses primarily generated in 2016 and 2017 will not berealized based on projections of future U.S. taxable income, estimated reversals of existingtaxable timing differences, and other considerations. Accordingly, the 2017 and 2016 incometax provisions include the impact of recording a full deferred tax asset valuation allowance ofapproximately $198,000 and $292,000, respectively, against the annual losses generated from aU.S. tax perspective. The Company has domestic federal net operating loss carryforwards ofapproximately $186,000 at December 31, 2017 which will expire between 2036 and 2037.
The Company has a deferred tax asset of $3,413,000 and $3,237,000 at December 31, 2017 and2016, respectively, relating to foreign net operating loss carryforwards (NOLs) in variousjurisdictions which principally do not expire.
As of December 31, 2017, management’s assessment of the realizability of its Europe’ssubsidiary’s deferred tax assets concluded that it no longer meets the threshold of more likelythan not based upon the subsidiary’s recent declining operating results. Accordingly, theCompany has recorded a full valuation allowance against the Europe subsidiary’s deferred taxassets with a corresponding deferred income tax charge of $509,000 at December 31, 2017.
The Company has recorded a valuation allowance of $2,904,000 against all other foreign netoperating loss carryforward balances as it is more likely than not that this asset will not berealized.

Reliv’ International, Inc. and Subsidiaries
Notes to Consolidated Financial Statements
F-24
11. Income Taxes (continued)
The components of the deferred tax assets and liabilities, and the related tax effects of eachtemporary difference at December 31, 2017 and 2016, are as follows:
2017 2016
Deferred tax assets:
Product refund reserve 7,000$ 10,000$
Inventory obsolescence reserve 62,000 25,000
Vacation accrual - 6,000
Stock-based compensation - 9,000
Organization costs 127,000 189,000
Deferred compensation 94,000 108,000
Miscellaneous accrued expenses 13,000 10,000
Domestic net operating loss carryforwards 186,000 282,000
Foreign net operating loss carryforwards 3,413,000 3,237,000
Valuation allowance (3,767,000) (3,042,000)
135,000 834,000
Deferred tax liabilities:
Depreciation and amortization 28,000 182,000
Foreign currency exchange 107,000 165,000
135,000 347,000Net deferred tax assets (liabilities) -$ 487,000$
Reported as:
Non-current deferred tax assets -$ 487,000$
Non-current deferred tax liabilities - -
Net deferred tax assets -$ 487,000$
The United States Tax Cuts and Jobs Act (TCJA) was enacted in December 2017, whichsignificantly changes U.S. tax law, principally by permanently reducing the U.S. federalstatutory rate to 21% effective January 1, 2018, implementing a territorial tax system, andimposing a repatriation tax on deemed repatriated earnings of foreign subsidiaries. Under theTJCA’s repatriation tax, the Company estimates its cumulative amount of unremitted foreignearnings and related tax is immaterial. The effect of the federal tax rate reduction to 21% isreflected as a reduction in the U.S. deferred tax assets with a corresponding reduction in thevaluation allowance.
Securities and Exchange Commission (“SEC”) issued Staff Accounting Bulletin (“SAB”) 118 toprovide guidance to companies on the reporting of the impacts of TCJA in their financialstatements. Under SAB 118, the Company is recording affected items as provisional to allowadditional time for clarifying technical guidance from Treasury and analysis of the effect to theCompany’s current tax positions.

Reliv’ International, Inc. and Subsidiaries
Notes to Consolidated Financial Statements
F-25
11. Income Taxes (continued)
At December 31, 2017 and 2016, the Company had $36,000 and $43,000, respectively, ofcumulative unrecognized tax benefits, of which only the net amount of $26,000 would impact theeffective income tax rate if recognized.
The aggregate changes in the balance of gross unrecognized tax benefits were as follows:
2017 2016
Beginning of year $32,000 $46,000
Settlements and effective settlements with tax authorities - -
Lapse of statute of limitations (6,000) (13,000)
Decrease to tax positions taken during prior periods (6,000) (7,000)
Increase to tax positions taken during current period 6,000 6,000
End of year $26,000 $32,000
The Company applied applicable accounting guidance relating to accounting for uncertainty inincome taxes. Reserves for uncertainty in income taxes are adjusted quarterly in light ofchanging facts and circumstances, such as the progress of tax audits, case law, and emerginglegislation. The primary difference between gross unrecognized tax benefits and netunrecognized tax benefits is the U.S. federal tax benefit from state tax deductions. It is theCompany’s practice to recognize interest and / or penalties related to income tax matters inincome tax expense.
At December 31, 2017 and 2016, the Company had $11,000 and $13,000, respectively, accruedfor interest and penalties within the balance of unrecognized tax benefits. The Company’sunrecognized tax benefits balance is included within other noncurrent liabilities on theconsolidated balance sheets.
The Company, including its domestic and foreign subsidiaries, is subject to U.S. federal incometax as well as income tax of multiple state and foreign jurisdictions. The Company hasconcluded all U.S. federal income tax matters for years through 2013 and concluded yearsthrough 2013 with its primary state jurisdiction.
One of the Company’s foreign subsidiaries is presently under local country audit for allegeddeficiencies (totaling approximately $800,000 plus interest at 20% per annum) in value-addedtax (VAT) and withholding tax for the years 2004 through 2006. The Company, in consultationwith its legal counsel, believes that there are strong legal grounds that it should not be liable topay the majority of the alleged tax deficiencies. As of December 31, 2010, managementestimated and reserved approximately $185,000 for resolution of this matter and recorded thisamount within Selling, General, and Administrative expense in the 2010 Consolidated Statementof Income. In 2011, the Company made good faith deposits to the local tax authority under thetax agency’s administrative judicial resolution process. As of December 31, 2017,management’s estimated reserve (net of deposits) for this matter is approximately $181,000.

Reliv’ International, Inc. and Subsidiaries
Notes to Consolidated Financial Statements
F-26
12. Employee Benefit Plans
The Company sponsors a 401(k) employee savings plan which covers substantially allemployees. Employees can contribute up to 15% of their gross income to the plan. TheCompany matched a percentage of the employee’s contribution at a rate of 10% for the yearsended December 31, 2017, and 2016, respectively. Company contributions under the 401(k)plan totaled $35,400 and $44,200 in 2017 and 2016, respectively.
The Company sponsors an employee stock ownership plan ("ESOP") which covers substantiallyall U.S. employees. Contributions to the ESOP are funded by the Company on a discretionarybasis. In 2017 and 2016, the Company did not make any contributions to the ESOP.
13. Incentive Compensation Plans
Under a Board of Directors approved incentive compensation plan, bonuses are payablequarterly in an amount not to exceed 18% of the Company’s Income from Operations for anyperiod, subject to the Company achieving a minimum quarterly Income from Operations of atleast $500,000. For fiscal years 2017 and 2016, the Board determined that the aggregate amountof incentive compensation available under the Plan shall be equal to 18% of the Company’sIncome from Operations. The bonus pool is allocated to executives according to a specifiedformula, with a portion allocated to a middle management group determined by the ExecutiveCommittee of the Board of Directors. The Company expensed a total of $109,500 and $-0- tothe participants of the bonus pool for 2017 and 2016, respectively.
The Company sponsors a Supplemental Executive Retirement Plan (SERP) to allow certainexecutives to defer a portion of their annual salary and bonus into a grantor trust. A grantor trustwas established to hold the assets of the SERP. The Company funds the grantor trust by payingthe amount deferred by the participant into the trust at the time of deferral. Investment earningsand losses accrue to the benefit or detriment of the participants. The SERP also provides for adiscretionary matching contribution by the Company not to exceed 100% of the participant’sannual contribution. In 2017 and 2016, the Company did not provide a match. The participantsfully vest in the deferred compensation three years from the date they enter the SERP. Theparticipants are not eligible to receive distribution under the SERP until retirement, death, ordisability of the participant. At December 31, 2017 and 2016, SERP assets were $330,000 and$296,000, respectively, and are included in “Other Assets” in the accompanying consolidatedbalance sheets. At December 31, 2017 and 2016, SERP liabilities were $332,000 and $299,000,respectively, and are included in “Other Non-Current Liabilities” in the accompanyingconsolidated balance sheets. The changes in the balances of SERP assets and SERP liabilitiesduring 2017 and 2016 were due to net realized and unrealized investment gains/losses incurredby the plan.

Reliv’ International, Inc. and Subsidiaries
Notes to Consolidated Financial Statements
F-27
14. Segment Information
Description of Products and Services by Segment
The Company operates in one reportable segment, a network marketing segment consisting ofsix operating units that sell nutritional and dietary products to a sales force of independentdistributors that sell the products directly to customers. These operating units are based ongeographic regions. Geographic area data for the years ended December 31, 2017 and 2016follow:
2017 2016
Net sales to external customers
United States $32,474,797 $35,591,831
Australia/New Zealand 922,594 1,079,054
Canada 914,775 1,065,147
Mexico 445,299 529,871
Europe (1)4,578,095 5,490,508
Asia (2)2,453,222 1,756,425
Total net sales $41,788,782 $45,512,836
Assets by area
United States $18,100,872 $18,563,523
Australia/New Zealand 572,368 568,890
Canada 265,629 375,264
Mexico 219,501 311,102
Europe (1)1,032,641 1,694,113
Asia (2)884,985 952,835
Total consolidated assets $21,075,996 $22,465,727
(1) Europe consists of United Kingdom, Ireland, France, Germany, Austria, and the Netherlands.(2) Asia consists of Philippines, Malaysia, Singapore, and Indonesia.
The Company classifies its sales into two categories of sales products plus handling & freightincome. Net sales by product category data for the years ended December 31, 2017 and 2016,follow:
2017 2016
Net sales by product category
Nutritional and dietary supplements $37,326,863 $40,554,312
Sales aids and other 1,424,494 1,450,649
Handling & freight income 3,037,425 3,507,875
Total net sales $41,788,782 $45,512,836
Reliv’ International, Inc. and Subsidiaries
Notes to Consolidated Financial Statements
F-28
15. Restructuring Activities - 2016
In May 2016, the Company implemented an employee headcount cost reduction programresulting in the reduction of approximately 9% of the Company’s worldwide employees. Thetotal cost of the program, representing severance and benefits, was approximately $275,000 in2016, and was included within Selling, General, and Administrative in the accompanyingconsolidated statements of net loss and comprehensive loss. The aggregate annual salaries of theaffected employees was approximately $1,100,000. At December 31, 2016, there was noremaining reserve for severance and benefits under the program.

Corporate Information
Corporate Headquarters: Annual Meeting:Reliv International, Inc.136 Chesterfield Industrial Blvd.Chesterfield, Missouri 63005Phone: 636.537.9715www.reliv.com
The annual meeting of the stockholders will beheld at 9:00 am Central Daylight Time onThursday, May 24, 2018 atReliv Corporate Headquarters136 Chesterfield Industrial Blvd.Chesterfield, Missouri 63005
Independent Auditors: Stock Exchange Listing:Ernst & Young LLP NASDAQ Stock Market under the symbol RELV
Fiscal Year-End: Financial Information:December 31 Reliv International maintains a website at
www.reliv.com/investor-relations
Shareholder Questions: Transfer Agent:Communications concerning stock transferrequirements, lost certificates, change ofaddress or questions regarding the DividendReinvestment Program should be directed toAmerican Stock Transfer & Trust at800.937.5449
American Stock Transfer & Trust Co.6201 15th AvenueBrooklyn, NY 11219800.937.5449Email: [email protected]