FORM 10-K - AnnualReports.com€¦ · 7deohri&rqwhqwv 3$57,,whp %xvlqhvv 2yhuylhz
193
YAHOO INC FORM 10-K (Annual Report) Filed 03/01/17 for the Period Ending 12/31/16 Address YAHOO! INC. 701 FIRST AVENUE SUNNYVALE, CA 94089 Telephone 4083493300 CIK 0001011006 Symbol YHOO SIC Code 7373 - Computer Integrated Systems Design Industry Internet Services Sector Technology Fiscal Year 12/31 http://www.edgar-online.com © Copyright 2017, EDGAR Online, Inc. All Rights Reserved. Distribution and use of this document restricted under EDGAR Online, Inc. Terms of Use.
Transcript of FORM 10-K - AnnualReports.com€¦ · 7deohri&rqwhqwv 3$57,,whp %xvlqhvv 2yhuylhz

YAHOO INC
FORM 10-K(Annual Report)
Filed 03/01/17 for the Period Ending 12/31/16
Address YAHOO! INC.701 FIRST AVENUESUNNYVALE, CA 94089
Telephone 4083493300CIK 0001011006
Symbol YHOOSIC Code 7373 - Computer Integrated Systems Design
Industry Internet ServicesSector Technology
Fiscal Year 12/31
http://www.edgar-online.com© Copyright 2017, EDGAR Online, Inc. All Rights Reserved.
Distribution and use of this document restricted under EDGAR Online, Inc. Terms of Use.

Table of Contents
UNITED STATES
SECURITIES AND EXCHANGE COMMISSIONWashington, D.C. 20549
Form 10-K
☑☑ ANNUAL REPORT PURSUANT TO SECTION 13 OR 15(d) OF THE SECURITIES EXCHANGE ACT OF 1934For the fiscal year ended December 31, 2016
OR
☐☐ TRANSITION REPORT PURSUANT TO SECTION 13 OR 15(d) OF THE SECURITIES EXCHANGE ACT OF1934For the transition period from to
Commission File Number 000-28018
Yahoo! Inc.(Exact name of Registrant as specified in its charter)
Delaware 77-0398689(State or other jurisdiction of incorporation or organization) (I.R.S. Employer Identification No.)
701 First AvenueSunnyvale, California 94089
(Address of principal executive offices, including zip code)
Registrant’s telephone number, including area code: (408) 349-3300Securities registered pursuant to Section 12(b) of the Act:
Title of Each Class Name of Each Exchange on Which RegisteredCommon stock, $.001 par value
The NASDAQ Stock Market LLC(NASDAQ Global Select Market)
Securities registered pursuant to Section 12(g) of the Act: None(Title of Class)
Indicate by check mark if the Registrant is a well-known seasoned issuer, as defined in Rule 405 of the Securities Act. Yes ☑ No ☐
Indicate by check mark if the Registrant is not required to file reports pursuant to Section 13 or Section 15(d) of the Act. Yes ☐ No ☑
Indicate by check mark whether the Registrant (1) has filed all reports required to be filed by Section 13 or 15(d) of the Securities Exchange Act of 1934 during the preceding12 months (or for such shorter period that the Registrant was required to file such reports), and (2) has been subject to such filing requirements for the past 90 days. Yes ☑ No ☐
Indicate by check mark whether the Registrant has submitted electronically and posted on its corporate Web site, if any, every Interactive Data File required to be submittedand posted pursuant to Rule 405 of Regulation S-T (§232.405 of this chapter) during the preceding 12 months (or for such shorter period that the registrant was required tosubmit and post such files). Yes ☑ No ☐
Indicate by check mark if disclosure of delinquent filers pursuant to Item 405 of Regulation S-K (§229.405 of this chapter) is not contained herein, and will not be contained, tothe best of Registrant’s knowledge, in definitive proxy or information statements incorporated by reference in Part III of this Form 10-K or any amendment to this Form 10-K. ☐
Indicate by check mark whether the Registrant is a large accelerated filer, an accelerated filer, a non-accelerated filer, or a smaller reporting company. See definitions of “largeaccelerated filer,” “accelerated filer,” and “smaller reporting company” in Rule 12b-2 of the Exchange Act. Large accelerated filer ☑ Accelerated filer ☐Non-accelerated filer ☐ (Do not check if a smaller reporting company) Smaller reporting company ☐
Indicate by check mark whether the Registrant is a shell company (as defined by Rule 12b-2 of the Exchange Act). Yes ☐ No ☑
As of June 30, 2016, the last business day of the Registrant’s most recently completed second fiscal quarter, the aggregate market value of voting stock held by non-affiliatesof the Registrant, based upon the closing sales price for the Registrant’s common stock, as reported on the NASDAQ Global Select Market was $32,522,108,074. Shares ofcommon stock held by each officer and director and by each person who owns 10 percent or more of the outstanding common stock have been excluded in that such personsmay be deemed to be affiliates. This determination of affiliate status is not necessarily a conclusive determination for any other purpose.
The number of shares of the Registrant’s common stock outstanding as of February 10, 2017 was 956,487,217.
DOCUMENTS INCORPORATED BY REFERENCEThe following documents (or parts thereof) are incorporated by reference into the following parts of this Form 10-K:Proxy Statement for the 2017 Annual Meeting of Shareholders—Part III Items 10, 11, 12, 13, and 14.

Table of Contents
YAHOO! INC.Form 10-K
Fiscal Year Ended December 31, 2016
INDEX ITEM Page
PART I ITEM 1 Business 4 ITEM 1A Risk Factors 13 ITEM 1B Unresolved Staff Comments 37 ITEM 2 Properties 37 ITEM 3 Legal Proceedings 37 ITEM 4 Mine Safety Disclosures 37
PART II ITEM 5 Market for Registrant’s Common Equity, Related Stockholder Matters and Issuer Purchases of Equity Securities 38 ITEM 6 Selected Financial Data 40 ITEM 7 Management’s Discussion and Analysis of Financial Condition and Results of Operations 43 ITEM 7A Quantitative and Qualitative Disclosures About Market Risk 89 ITEM 8 Financial Statements and Supplementary Data 92 ITEM 9 Changes in and Disagreements With Accountants on Accounting and Financial Disclosure 170 ITEM 9A Controls and Procedures 170 ITEM 9B Other Information 171
PART III ITEM 10 Directors, Executive Officers and Corporate Governance 172 ITEM 11 Executive Compensation 172 ITEM 12 Security Ownership of Certain Beneficial Owners and Management and Related Stockholder Matters 172 ITEM 13 Certain Relationships and Related Transactions, and Director Independence 172 ITEM 14 Principal Accounting Fees and Services 173
PART IV ITEM 15 Exhibits, Financial Statement Schedules 173 ITEM 16 Form 10-K Summary 173 Signatures 174
The trademarks and/or registered trademarks of Yahoo! Inc. and its subsidiaries referred to herein include, but are not limited to, Yahoo!, the Yahoo family ofmarks, Tumblr, BrightRoll, Xobni, Flurry and Flurry Analytics, Altaba, and Polyvore, and their respective logos. Other names are trademarks and/or registeredtrademarks of their respective owners.
2

Table of Contents
Forward-Looking Statements In addition to current and historical information, this Annual Report on Form 10-K contains forward-looking statements within the meaning of the PrivateSecurities Litigation Reform Act of 1995. These statements relate to our future operations, prospects, potential products, services, developments, and businessstrategies. These statements can, in some cases, be identified by the use of terms such as “may,” “will,” “should,” “could,” “would,” “intend,” “expect,” “plan,”“anticipate,” “believe,” “estimate,” “predict,” “project,” “potential,” or “continue,” the negative of such terms, or other comparable terminology. This Annual Reporton Form 10-K includes, among others, forward-looking statements regarding: • expectations regarding the pending transaction with Verizon Communications Inc.; • the Security Incidents (as defined below); • expectations about revenue, including search, display, and other revenue, as well as revenue from our offerings in mobile, video, native, and social
(“Mavens”); • expectations about the financial and operational impacts of our Search and Advertising Services and Sales Agreement with Microsoft Corporation and our
Google Services Agreement with Google Inc.; • expectations about the opportunities for monetization of, and revenue growth from, our mobile offerings; • expectations about growth in users; • expectations about changes to our operating expenses; • anticipated capital expenditures; • expectations about changes in our earnings in equity interests and net income; • expectations about the amount of unrecognized tax benefits, the outcome of tax assessment appeals, the adequacy of our existing tax reserves, future tax
expenditures, and tax rates; • expectations about the sufficiency of our available sources of liquidity to meet normal operating requirements and capital expenditures; and • expectations regarding the future outcome of legal proceedings in which we are involved.
These statements involve certain known and unknown risks and uncertainties that could cause our actual results to differ materially from those expressed orimplied in our forward-looking statements. You are urged to carefully review the disclosures made concerning risks and uncertainties that may affect ourbusiness or operating results, which include, among others, those listed in Part 1, Item 1A “Risk Factors” of this Annual Report on Form 10-K. We do not intend,and undertake no obligation, to update or revise any of our forward-looking statements after the date of this Annual Report on Form 10-K to reflect newinformation, actual results or future events or circumstances.
3

Table of Contents
PART I
Item 1. BusinessOverview Yahoo! Inc., together with its consolidated subsidiaries (“Yahoo,” the “Company,” “we,” or “us”), is a guide to digital information discovery, focused on informing,connecting, and entertaining our users through our search, communications, and digital content products. By creating highly personalized experiences, we helpusers discover the information that matters most to them around the world—on mobile or desktop.
We create value for advertisers with a streamlined, simple advertising technology that leverages Yahoo’s data, content, and technology to connect advertiserswith their target audiences. Advertisers can build their businesses through advertising to targeted audiences on our online properties and services (“YahooProperties”) and a distribution network of third-party entities (“Affiliates”) who integrate our advertising offerings into their websites or other offerings (“Affiliatesites”). Our revenue is generated principally from search and display advertising.
We are proud of our rich history that has evolved with the Internet, beginning in 1994 when our founders, Jerry Yang and David Filo, then graduate students atStanford University, created Jerry and Dave’s Guide to the World Wide Web , a simple directory of websites to help people navigate the Internet. Yahoo wasincorporated in 1995 and is a Delaware corporation. We completed our initial public offering on April 12, 1996, and our stock is listed on the NASDAQ GlobalSelect Market under the symbol “YHOO.” Yahoo is a global company headquartered in Sunnyvale, California.
Executive Leadership The current executive management team includes: • Marissa Mayer—President and Chief Executive Officer; • David Filo—Co-Founder and Chief Yahoo; • Ken Goldman—Chief Financial Officer; • Lisa Utzschneider—Chief Revenue Officer; • Debra Berman—Senior Vice President, Marketing; • Jeff Bonforte—Senior Vice President, Product and Engineering, Communications; • Adam Cahan—Senior Vice President, Product and Engineering, Video, Design and Emerging Products; • Simon Khalaf—Senior Vice President, Product and Engineering, Publisher Products; • Laurence Mann—Chief Information Officer; • Enrique Muñoz Torres—Senior Vice President, Product and Engineering, Advertising and Search; • Martha Nelson—Senior Vice President, Global Editor-in-Chief; • Bryan Power—Senior Vice President, People;
4

Table of Contents
• Jay Rossiter—Senior Vice President, Product and Engineering, Science and Technology; • Rose Tsou—Senior Vice President, Asia Pacific; and • Ian Weingarten—Senior Vice President, Corporate Development and Partnerships.
Our current Board of Directors is composed of: • Marissa Mayer, our President and CEO; Eric Brandt, our Chairman of the Board; Maynard Webb, our Chairman Emeritus; Tor Braham; David Filo;
Catherine Friedman; Eddy Hartenstein; Richard Hill; Thomas McInerney; Jane Shaw Ph.D.; and Jeffrey Smith.
Pending Sale of the Operating Business to Verizon Communications Inc.
On July 23, 2016, we entered into a Stock Purchase Agreement (the “Original Stock Purchase Agreement”) with Verizon Communications Inc. (“Verizon”),pursuant to which we have agreed to sell, and Verizon has agreed to purchase (the “Sale”), all of the outstanding shares of Yahoo Holdings, Inc., a newly formedwholly-owned subsidiary of Yahoo (“Yahoo Holdings”) (and prior to the sale of Yahoo Holdings, to cause Yahoo Holdings to sell to a foreign subsidiary of Verizonall of the equity interests in a foreign subsidiary of Yahoo Holdings that will hold certain foreign subsidiaries relating to our operating business), which,immediately prior to the consummation of the Sale, will own our operating business. Under the Original Stock Purchase Agreement, the aggregate considerationto be paid to us by Verizon in connection with the Sale was $4,825,800,000 in cash, subject to certain adjustments as provided in the Original Stock PurchaseAgreement.
Concurrently with the execution of the Original Stock Purchase Agreement, we entered into a Reorganization Agreement (the “Original ReorganizationAgreement”) with Yahoo Holdings, pursuant to which we will transfer to Yahoo Holdings prior to the consummation of the Sale all of our assets and liabilitiesrelating to our operating business, other than specified excluded assets and retained liabilities (the “Reorganization”).
On February 20, 2017, Yahoo and Verizon entered into an Amendment to Stock Purchase Agreement amending the Original Stock Purchase Agreement (the“SPA Amendment” and, together with the Original Stock Purchase Agreement, the “Amended Stock Purchase Agreement”), and, concurrently with the executionof the SPA Amendment, Yahoo and Yahoo Holdings entered into an Amendment to Reorganization Agreement amending the Original ReorganizationAgreement (the “RA Amendment”). Additionally, concurrently with the execution of the SPA Amendment and the RA Amendment, Yahoo, Yahoo Holdings, andVerizon entered into a Settlement and Release Agreement (the “Settlement and Release Agreement”).
The SPA Amendment, among other things, (i) reduced the consideration to be paid by Verizon to Yahoo in connection with the Sale by $350,000,000 to$4,475,800,000, (ii) provided that certain data security incidents to which Yahoo has been subject will be disregarded for purposes of determining whethercertain closing conditions have been satisfied and in determining whether a “Business Material Adverse Effect” has occurred, and (iii) provided that the date afterwhich each of Yahoo and Verizon may terminate the Amended Stock Purchase Agreement if the Closing (as defined in the Amended Stock PurchaseAgreement) has not occurred has been extended to July 24, 2017.
The RA Amendment provides, among other things, that Yahoo and Verizon will each be responsible for 50 percent of certain post-closing cash liabilities relatedto certain data security incidents and other data breaches incurred by the Company.
5

Table of Contents
Under the terms of the Settlement and Release Agreement, among other things, Verizon released certain claims, subject to certain exceptions, it (and itsaffiliates and representatives) may have against the Company (or its affiliates and representatives) relating to certain data security incidents and other databreaches incurred by the Company.
Upon completion of the Sale, Verizon will also receive for its benefit and that of its current and certain of its future affiliates, a non-exclusive, worldwide,perpetual, royalty-free license to certain intellectual property not core to the operating business held by Excalibur IP, LLC, a wholly-owned subsidiary of theCompany (“Excalibur”), that is not being transferred to Yahoo Holdings with the operating business.
The excluded assets include our cash and marketable securities as of the closing of the Sale, our shares in Alibaba Group Holding Limited (“Alibaba Group”) andYahoo Japan Corporation (“Yahoo Japan”), certain other minority equity investments, and all of the equity in Excalibur. The retained liabilities will include the0.00% Convertible Senior Notes due 2018 (“Notes”) we issued in November 2013, securityholder litigation, certain director and officer indemnificationobligations, and, pursuant to the RA Amendment, 50 percent of certain post-closing cash liabilities related to certain data security incidents and other databreaches incurred by Yahoo. Following the closing of the Sale, the excluded assets and retained liabilities will remain in Yahoo which will be renamed Altaba Inc.and will become an independent, publicly traded, management investment company registered under the Investment Company Act of 1940.
The closing of the Sale is subject to certain conditions, including, among others, the approval of the Sale by our stockholders, the closing of the Reorganization,and certain other customary closing conditions.
For additional detail, refer to “Item 7. Management’s Discussion and Analysis of Financial Condition and Results of Operations” in this Annual Report on Form10-K.
User Offerings Yahoo is focused on informing, connecting, and entertaining our users with our search (Yahoo Search), communications (including Yahoo Mail and YahooMessenger), and digital content products (including Tumblr, and our four core verticals: Yahoo News, Yahoo Sports, Yahoo Finance, and Yahoo Lifestyle).
Our user offerings include:
Search
YahooSearchserves as a guide for users to discover the information on the Internet that matters to them the most. In 2016, Yahoo continued to invest inplatform enhancements; in acquiring new users through default search set and home page sets through our network and through partners; and in building outcompelling search experiences for major events, such as the Summer Olympics and the 2016 U.S. Presidential election.
We plan to continue investing in a differentiated mobile and desktop search experience by allocating additional resources to develop new search advertisingtechnology through our Yahoo Gemini platform that provides personalized, commercial results for the user and anticipates the user’s needs.
Under our Search and Advertising Services and Sales Agreement (“Search Agreement”) with Microsoft Corporation (“Microsoft”), Microsoft provides algorithmicand paid search advertising
6
Table of Contents
services on a non-exclusive basis for Yahoo Properties on mobile, desktop, and Affiliate sites. This agreement is subject to a volume commitment by theCompany to request paid search results from Microsoft for 51 percent of its search queries originating from desktop computers accessing Yahoo Properties andits Affiliate sites and to display only Microsoft’s paid search results on such search result pages. In October 2015, Yahoo entered into the Google ServicesAgreement (the “Services Agreement”) with Google Inc. (“Google”) that provides Yahoo with additional flexibility to choose among suppliers of search results andads. Google’s offerings complement the search services provided by Microsoft and Yahoo Gemini (Yahoo’s platform for search and native advertising). See“Advertiser Products” and “Advertising Formats” below for further information about our Yahoo Gemini platform. Yahoo continues to develop and launch featuresaround the results to enhance the search experience for our users.
Communications
YahooMailis a primary driver of engagement across our user offerings. Yahoo Mail connects users to the people and content most important to them acrossmobile and desktop. We support connecting external mail providers (such as Gmail, AOL, and Outlook) for users to manage multiple accounts from the YahooMail client. Each Yahoo Mail account comes with one terabyte of free storage and is integrated with contacts, calendar, and messaging (see Yahoo Messengersection below). The Yahoo Mail mobile app includes user-centric features such as account key, compose assistant, document preview, and smart contacts.
YahooMessenger, our instant messaging service, provides an interactive and personalized way for users to connect, communicate, and share experiences inreal-time. It incorporates many of our existing platforms including Tumblr and Xobni, with features like GIF search, “hearting” messages, and unsend. YahooMessenger is available as a mobile app, on the web, and also integrated directly into Yahoo Mail on desktop to drive deeper engagement with users.
DigitalContent
Our Digital Content offerings include: Tumblr, our global social platform, and our four core verticals: Yahoo News, Yahoo Sports, Yahoo Finance, and YahooLifestyle. Our Digital Content is available on mobile or desktop.
YahooNews, which can be accessed through the Yahoo App and the Yahoo homepage at Yahoo.com , gives users access to discover , consume, and engagearound the news, content, and video they care about all in one place. We continue to provide current and trending news and information from Yahoo originaleditorial and partner content. Yahoo News is optimized to provide a consistent, easy-to-use content discovery experience across mobile and desktop withbreaking news, local weather, a personalized content stream, and social sharing capabilities.
YahooSportsserves one of the largest audiences of sports enthusiasts in the world and delivers experiences for every fan, every day. Yahoo Sports providesusers access to Fantasy Sports.
YahooFinanceprovides a comprehensive set of financial data, information, and tools that helps users make informed financial decisions. The robust content onYahoo Finance is a mix of Yahoo original editorial and syndicated news via relationships with several third-party partners.
YahooLifestylebrings together content, commerce, and community to engage users passionate about style, fashion, and entertainment. Yahoo’s Lifestylefeatures Yahoo’s original editorial voice to deliver authoritative and authentic style and beauty content. With Polyvore, users have access to discover and publishtheir own style trends, and to buy items featured in articles and sets through
7

Table of Contents
direct integration with commerce sites. And as part of Yahoo’s long-standing distribution partnership with Hulu, Yahoo View gives users access to watchepisodes of their favorite TV shows across mobile and desktop, and go beyond the episode with clips, recaps, and content from Tumblr.
Tumblroffers a web platform and mobile applications on iOS and Android that allow users to create, share, and curate content. Tumblr messaging enablesusers to engage with other users that share their same interests and passions.
Advertiser Offerings Yahoo has two core advertiser products: Gemini and BrightRoll, which includes the BrightRoll Demand Side Platform and BrightRoll Exchange. Advertisersbenefit from our comprehensive approach to digital advertising across search and display advertising, which includes native, video, premium, and audience ads.Gemini and BrightRoll are supported by Yahoo’s technology platform, data, and analytical tools.
AdvertiserProducts
YahooGeminiis Yahoo’s proprietary marketplace for search and native advertising across devices. Yahoo Gemini helps marketers achieve measurable resultswith intent-driven advertising. By leveraging Yahoo’s proprietary data, Gemini helps advertisers target the audiences they are interested in reaching acrossYahoo Properties and third-party publishers and engage those audiences through search and native ads. Gemini search is focused on helping advertisers reachtheir target audiences at the moment the user has made a relevant search query. Gemini native ads are built to match the content that a user is exploring. Byusing the surrounding content to establish relevancy for targeting, Gemini native ads drive higher audience engagement and brand awareness for the advertiser.
BrightRoll is Yahoo’s unified brand for programmatic advertising technology, offering a suite of media-agnostic tools to help advertisers, publishers, andpartners connect with users across ad formats and devices. The BrightRoll Demand Side Platform (“BrightRoll DSP”) is technology that enables brand andperformance advertisers to plan, execute, optimize, and measure programmatic digital advertising campaigns. Our targeting solutions allow advertisers to reachusers across Yahoo, exclusive publishing partners, and a wide variety of sites and mobile apps with the scale and efficiency of programmatic buying. BrightRollDSP offers advertisers greater control and transparency with advanced programmatic buying capabilities and access to Yahoo’s proprietary data. Advertiserscan reach the right people with custom audience definition and manage frequency on any device with independent campaign measurement and insights. TheBrightRoll Exchange connects display, video, and native inventory from the top publishers and ad exchanges with demand from the top DSPs, agencies, adnetworks, and advertisers. The BrightRoll Exchange delivers revenue to publishers with the goal of maximizing yield and offers buyers access to a variety ofpremium digital advertising inventory and unique data with the goal of enabling them to efficiently value supply.
AdvertisingFormats
Search Advertising. Yahoo Gemini connects advertisers with the audiences across our network, with the support of strategic account teams, reporting,analytics, and extensive campaign controls. Yahoo continues to focus on developing new search ad formats, features, and capabilities to engage users andoptimize performance across devices, including click-to-call functionality, sitelink extensions, location extensions, and product ads. To provide the richestpossible experience for our users, Yahoo also serves search ads from partners, including Microsoft and Google.
8

Table of Contents
DisplayAdvertising. Yahoo display ads leverage a comprehensive set of proprietary data signals to identify and engage the right users on Yahoo and acrossthe web. With display ads, Yahoo can help brands make meaningful connections with the right users at the right time, across devices.
Native Advertising. Yahoo native ads are a seamless part of a user’s experience on Yahoo sites across devices, as well as third-party partner publisher sitesand mobile apps. This natural integration helps advertisers connect with people in a compelling and impactful way, driving awareness and performance,especially on mobile where native ads are the predominant ad format. Yahoo native ads are visually rich and come in a variety of formats, like text, image, andvideo that deliver measurable branding and sales results. Yahoo offers native ads through Yahoo Gemini and the BrightRoll DSP.
Video Advertising. Yahoo video ads enable brands to align with premium, contextually relevant video programming across our properties and third partypublisher partners. In addition, we leverage Yahoo’s unique user data to connect brands to their target audiences at scale across devices.
Premium Advertising. Yahoo premium ads offer a unique and engaging canvas for brand storytelling. We offer high-impact advertising opportunities onYahoo.com, Yahoo Mail, and program sponsorships of major events. Brands have the ability to anchor buys within premium content and scale programmatically,while applying unique data strategies to reach their target audience.
Audience Advertising. Yahoo audience ads leverage a comprehensive set of proprietary data signals to identify and engage the right users on Yahoo andacross the web. With audience ads, Yahoo can help brands make meaningful connections with the right users at the right time, across ad formats and devices.
Developer Offerings The Yahoo Mobile Developer Suite gives developers the ability to measure, monetize, advertise, and improve their apps with Yahoo tools.
FlurryAnalyticsis a free mobile app analytics solution that is implemented in applications on more than 2 billion devices worldwide. Flurry is integrated in third-party applications via a lightweight software developer kit (“SDK”). Flurry provides mobile app developers insight into the actions their users are taking in-app, aswell as their audience’s interests and demographics. Additionally, Flurry Pulse allows users to share data with partners and comScore for data validation.
YahooAppPublishing(“YAP”) enables third-party app developers to monetize their app experiences with native and video advertising from Yahoo Gemini,Flurry, and BrightRoll advertisers. Developers can integrate YAP through the Flurry SDK.
YahooAppMarketinggives third-party app developers the ability to advertise their apps through targeted native and video advertising on Yahoo, Tumblr, andacross our app network. Yahoo App Marketing ads are powered by Yahoo Gemini and priced on a cost-per-click basis.
TumblrIn-AppSharingallows developers to integrate a Tumblr sharing button into their app experiences to enable their users to share content directly toTumblr without leaving their app. When a user shares content from a developer’s app, it will be posted to the user’s Tumblr blog along with a deep-link back tothe developer’s app. By clicking this deep-link, users will be directed to the developer’s app, and if the user does not have the developer’s app, they will see aprompt to install it.
Product Development Yahoo continually launches, improves, and scales products and features to meet evolving user, advertiser, and publisher needs. Most of our software productsand features are developed internally.
9

Table of Contents
In some instances, however, we might purchase technology and license intellectual property rights if the opportunity is strategically aligned, operationallycompatible, and economically advantageous. While it may be necessary in the future to seek or renew licenses relating to various aspects of our products, webelieve based on past experience and industry practice that such licenses generally could be obtained on commercially-reasonable terms. We believe ourcontinuing innovation and product development are not materially dependent upon any single license or other agreement with a third-party relating to thedevelopment of our products.
Yahoo’s product teams, which include a broad array of engineering and product talent, support a large portion of the Yahoo product portfolio and technologyinfrastructure. Our product teams have expertise in web and mobile user applications, scalable software platforms, information retrieval, machine learning andscience, editorial, networking/communications technologies, and presentation layer frameworks. We take security and privacy very seriously, and continuouslyinnovate to protect our users and their data.
Our engineering and production teams are primarily located in our Sunnyvale, California headquarters. Product development expenses for 2014, 2015, and 2016totaled approximately $1,156 million, $1,178 million, and $1,055 million, respectively, which included stock-based compensation expense of $139 million,$190 million, and $213 million, respectively.
Global Operations We manage our business geographically. The primary areas of measurement and decision-making are Americas, EMEA (Europe, Middle East, and Africa), andAsia Pacific. Additional information required by this item is incorporated herein by reference to Note 18—“Segments” of the Notes to our consolidated financialstatements, which appears in Part II, Item 8 of this Annual Report on Form 10-K.
We own a majority or 100 percent of all of these international operations (except in Australia, New Zealand, and Japan where we have joint ventures and/ornoncontrolling interests). We support these businesses through a network of offices worldwide.
Revenue is primarily attributed to individual countries according to the international online property that generated the revenue.
Information regarding risks involving our international operations is included in Part I, Item 1A “Risk Factors” of this Annual Report on Form 10-K and isincorporated herein by reference.
Sales We sell our advertising services through four primary channels: field, mid-market, reseller/small business, and platform and exchange. Our field advertising salesteam sells display advertising in all markets and search advertising to both premium and non-premium advertisers using Yahoo Gemini. Previously under theSearch Agreement, Yahoo had sales exclusivity for both the Company’s and Microsoft’s premium advertisers. Pursuant to the current terms of the SearchAgreement, as amended on April 15, 2015 by the Eleventh Amendment to the Search Agreement (the “Eleventh Amendment”), this sales exclusivity terminatedon July 1, 2015. In 2016, the Company and Microsoft completed the transition of premium advertisers for Microsoft’s paid search services to Microsoft on amarket-by-market basis (other than Taiwan and Hong Kong which will not transition). Our mid-market channel sells our advertising services to medium-sizedbusinesses, while our reseller/small business channel allows us to sell advertising services to additional regional and small business
10

Table of Contents
advertisers. Our platform sales team sells display, video and native advertising through the BrightRoll DSP, Yahoo’s demand side platform to agencies andagency trading desks. Our exchange sales team sells display, video and native advertising through the BrightRoll Exchange, Yahoo’s ad marketplace, todemand side platforms, agency trading desks and brands. Our U.S. sales force is structured vertically, allowing us to offer customers integrated customer-centricsolutions. We believe this approach allows us to provide the best solutions across all of our products based on a deeper understanding of our customers’businesses.
In the U.S., we employ sales professionals in multiple locations, including Atlanta, Boston, Chicago, Dallas, Detroit, Hillsboro, the Los Angeles area, Miami, NewYork, Omaha, San Francisco, and Sunnyvale as of December 31, 2016. In international markets, we either have our own internal sales professionals or rely onour established sales agency relationships in 35 countries, regions, and territories as of December 31, 2016.
Revenue under the Search Agreement represented approximately 35 percent, 35 percent, and 37 percent of our revenue for the years ended December 31,2014, 2015, and 2016, respectively, and no other individual customer represented more than 10 percent of our revenue in 2014, 2015, or 2016.
Internet usage is subject to seasonal fluctuations, typically declining during customary summer vacation periods and increasing during the fourth quarter holidayperiod due to higher online retail activity. These seasonal patterns have affected, and we expect will continue to affect, our business and quarterly sequentialrevenue growth rates.
Marketing Yahoo is one of the most recognized brands in the world. Our products, services, and content enable us to attract, retain, and engage users, advertisers, andpublishers. Our marketing team will help shape our offerings to better market them to our potential and existing users.
Competition Our industry is characterized by rapid evolution and innovation through disruptive technologies. We face significant competition from a wide range of businesses,particularly companies that seek to connect people with digital content and with each other. We compete on a global scale for audience share, marketers, andtalent. Our competition includes: • General purpose search engines and information services such as Alphabet’s Google and Microsoft’s Bing. • Companies such as Facebook and Twitter that provide mail, photo sharing, blogging, microblogging, and other social or communication services. These
areas are attracting an increasing share of users, users’ online time (across mobile and desktop), and advertising dollars. • Companies that offer an integrated variety of Internet products, advertising services, technologies, online services, and/or content in a manner similar to us
that compete for the attention of our users, advertisers, developers, and third-party website publishers. We also compete with these companies to obtainagreements with third parties to promote or distribute our services.
• Digital, broadcast, and print media companies with which we compete for the attention of consumer audiences and share of advertising dollars. This area
has become increasingly competitive as traditional media companies make the shift online to compete for users, users’ time, and advertising dollars acrossmobile and desktop.
11

Table of Contents
• Advertising networks, exchanges, demand side and supply side platforms, and traditional media companies, with which we compete for a share ofadvertisers’ marketing budgets and in the development of the tools and systems for managing and optimizing advertising campaigns.
• Companies that provide analytics, monetization and marketing tools for mobile and desktop developers. • In a number of international markets, especially those in Asia, Europe, Middle East and Latin America, we face substantial competition from local Internet
service providers and other entities that offer search, communications, and other commercial services and often have a competitive advantage due todominant market share in their territories, greater local brand recognition, focus on a single market, familiarity with local tastes and preferences, or greaterregulatory and operational flexibility.
As we introduce new products and our existing products evolve, we may become subject to additional competition.
We believe our principal competitive strengths relating to attracting users include the usefulness, accessibility, integration, and personalization of the onlineservices that we offer; the quality, personalization, and presentation of our search results; and the overall user experience on our premium properties. Ourprincipal competitive strengths relating to attracting advertisers and publishers are the reach, effectiveness, and efficiency of our marketing services as well asthe creativity of the marketing solutions that we offer.
Additional information regarding competition is included in Part I, Item 1A “Risk Factors” of this Annual Report on Form 10-K and is incorporated herein byreference.
Intellectual Property We create, own, and maintain a wide array of intellectual property assets that we believe are among our most valuable assets. Our intellectual property assetsinclude patents and patent applications related to our innovations, products and services; trademarks related to our brands, products and services; copyrights insoftware and creative content; trade secrets; and other intellectual property rights and licenses of various kinds. We seek to protect our intellectual propertyassets through patents, copyrights, trade secrets, trademarks and laws of the U.S. and other countries, and through contractual provisions. We enter intoconfidentiality and invention assignment agreements with our employees and contractors, and utilize non-disclosure agreements with third parties with whom weconduct business in order to secure and protect our proprietary rights and to limit access to, and disclosure of, our proprietary information. We consider theYahoo! trademark and our many related company brands to be among our most valuable assets, and we have registered these trademarks in the U.S. and othercountries throughout the world and actively seek to protect them. We have licensed in the past, and expect that we may license in the future, certain of ourtechnology and proprietary rights, such as trademark, patent, copyright, and trade secret rights, to third parties. In addition, Excalibur, our wholly ownedsubsidiary, owns a portfolio of patent assets that are not core to our operating business (the “Excalibur IP Assets”). Upon completion of the Sale transaction withVerizon, (i) Excalibur will remain an asset of Altaba Inc., and (ii) Verizon will receive, for its benefit and that of its current and certain of its future affiliates, anon-exclusive, worldwide, perpetual, royalty-free license to the Excalibur IP Assets.
Additional information regarding certain risks related to our intellectual property is included in Part I, Item 1A “Risk Factors” of this Annual Report on Form 10-Kand is incorporated herein by reference.
12

Table of Contents
Employees As of December 31, 2016, we had approximately 8,500 full-time employees and 600 contractors. Our future success is substantially dependent on theperformance of our senior management and key technical personnel, as well as our continuing ability to attract, maintain the caliber of, and retain highly qualifiedtechnical, executive, and managerial personnel. We remain committed to our talented employees and providing the best possible workplace culture for them.Additional information regarding certain risks related to our employees is included in Part I, Item 1A “Risk Factors” of this Annual Report on Form 10-K and isincorporated herein by reference.
Available Information Our website is located at https://www.yahoo.com. Our investor relations website is located at https://investor.yahoo.net. We make available free of charge on ourinvestor relations website under “Financial Info” our Annual Reports on Form 10-K, Quarterly Reports on Form 10-Q, Current Reports on Form 8-K, and anyamendments to those reports as soon as reasonably practicable after we electronically file or furnish such materials to the U.S. Securities and ExchangeCommission (“SEC”). The SEC maintains a website that contains reports, proxy and information statements, and other information regarding our filings athttp://www.sec.gov .
Item 1A. Risk FactorsWefacesignificantcompetitionforusers,advertisers,publishers,developers,anddistributors.
We face significant competition from online search engines, sites offering integrated internet products and services, social media and networking sites,e-commerce sites, companies providing analytics, monetization and marketing and publishing tools for mobile and desktop advertisers, publishers, developersand distributors, and digital, broadcast and print media. In a number of international markets, especially those in Asia, Europe, the Middle East and LatinAmerica, we face substantial competition from local Internet service providers and other entities that offer search, communications, and other commercialservices.
Several of our competitors offer an integrated variety of Internet products, advertising services, technologies, online services and content. We compete againstthese and other companies to attract and retain users, advertisers, developers, and third-party website publishers as participants in our Affiliate network, and toobtain agreements with third parties to promote or distribute our services. We also compete with social media and networking sites which are increasingly usedto communicate and share information, and which are attracting a substantial and increasing share of users, users’ online time, content, and online advertisingdollars.
A key element of our strategy is increasing revenue growth. As part of this strategy, we are focusing on mobile products and mobile advertising formats, as wellas increasing our revenue from mobile. A number of our competitors also have devoted significant resources to the development of products, services and appsfor mobile devices. Several of our competitors have mobile revenue significantly greater than ours. If we are unable to develop products for mobile devices thatusers find engaging and that help us grow our mobile revenue, our competitive position, our financial condition and our operating results could be harmed.
In addition, a number of competitors offer products, services and apps that directly compete for users with our offerings, including e-mail, search, video, social,sports, news, finance, micro-blogging,
13

Table of Contents
and messaging. Similarly, our competitors or other participants in the online advertising marketplace offer advertising exchanges, ad networks, demand sideplatforms, ad serving technologies, sponsored search offerings, and other services that directly compete for advertisers with our offerings. Additionally, as theuse of programmatic advertising continues to increase, we compete with companies that have also invested in programmatic platform offerings. We alsocompete with traditional print and broadcast media companies to attract domestic and international advertising spending. Some of our existing competitors andpossible entrants have greater brand recognition for certain products, services and apps, more expertise in particular market segments, and greater operational,strategic, technological, financial, personnel, or other resources than we do. Many of our competitors have access to considerable financial and technicalresources with which to compete aggressively, including by funding future growth and expansion and investing in acquisitions, technologies, and research anddevelopment. Further, emerging start-ups may be able to innovate and provide new products, services and apps faster than we can. In addition, competitorsmay consolidate or collaborate with each other, and new competitors may enter the market. Some of our competitors in international markets have a substantialcompetitive advantage over us because they have dominant market share in their territories, have greater local brand recognition, are focused on a singlemarket, are more familiar with local tastes and preferences, or have greater regulatory and operational flexibility due to the fact that we may be subject to bothU.S. and foreign regulatory requirements.
If our competitors are more successful than we are in developing and deploying compelling products or in attracting and retaining users, advertisers, publishers,developers, or distributors, our revenue and growth rates could decline.
We generate the majority of our revenue from search and display advertising, and the reduction in spending by or loss of current or potentialadvertiserswouldcauseourrevenueandoperatingresultstodecline.
For the twelve months ended December 31, 2016, 90 percent of our total revenue came from search and display advertising. Our ability to retain and growsearch and display revenue depends upon: • maintaining and increasing our daily active users, logged in users, page views and engagement; • introducing engaging new products that are popular with users and advertisers and are distributable on mobile and other alternative devices and platforms; • maintaining and expanding our advertiser base on desktop computers and mobile devices; • achieving a better traffic mix from our Yahoo Properties and Affiliates and improving our monetization rates on such traffic; • broadening our relationships with advertisers to small- and medium-sized businesses; • successfully implementing changes and improvements to our advertising management platforms and formats and obtaining the acceptance of our
advertising management platforms by advertisers, website publishers, and online advertising networks; • successfully acquiring, investing in, and implementing new technologies; • successfully implementing changes in our sales force, sales development teams, and sales strategy; • continuing to innovate and improve the monetization capabilities of our display and native advertising and our mobile products; • effectively monetizing mobile and other search queries;
14
Table of Contents
• improving the quality of our user and advertiser products; • continuing to innovate and improve users’ search experiences; • maintaining and expanding our Affiliate program for search and display advertising services; and • deriving better demographic and other information about our users to enable us to offer better, more personalized and targeted experiences to both our
users and advertisers.
In most cases, our agreements with advertisers have a term of one year or less, and may be terminated at any time by the advertiser or by us. Payments underour agreements with advertisers often depend upon performance and click-through levels. Accordingly, it is difficult to forecast search and display revenueaccurately. In addition, our expense levels are based in part on expectations of future revenue, including any guaranteed minimum payments and other trafficacquisition costs to our Affiliates in connection with search and/or display advertising, and in some cases, the expenses could exceed the revenue that wegenerate. The state of the global economy, growth rate of the online advertising market, and availability of capital impacts the advertising spending patterns ofour existing and potential advertisers. Any reduction in spending by, or loss of, existing or potential advertisers would negatively impact our revenue andoperating results. Further, we may be unable to adjust our expenses and capital expenditures quickly enough to compensate for any unexpected revenueshortfall.
Asmorepeople accessourproductsviamobile devicesrather thandesktopcomputersandmobile advertisingcontinuestoevolve, if wedonotcontinuetoattractandretainmobileusersandgrowmobilerevenue,ourfinancialresultswillbeadverselyimpacted.
The number of people who access the Internet through mobile devices rather than a desktop computer, including mobile telephones, smartphones and tablets, isincreasing and will likely continue to increase dramatically. More than 650 million of our monthly users (including Tumblr users) are now accessing us on mobiledevices. In addition, search queries are increasingly being undertaken through mobile devices. As a result, our ability to grow advertising revenue increasinglydepends on our ability to generate revenue from ads displayed on mobile devices.
A key element of our strategy is focusing on mobile devices, and we expect to continue to devote significant resources to the creation and support of developingnew and innovative mobile products, services and apps. However, if our new mobile products, services and apps, including new forms of Internet advertising formobile devices, do not continue to attract and retain mobile users, advertisers and device manufacturers and to generate and grow mobile revenue, ouroperating and financial results will be adversely impacted. We are dependent on the interoperability of our products and services with mobile operating systemswe do not control and we may not be successful in maintaining relationships with the key participants in the mobile industry that control such mobile operatingsystems. The manufacturer or access provider might promote a competitor’s or its own products and services, impair users’ access to our services by blockingaccess through their devices, make it hard for users to readily discover, install, update or access our products on their devices, or charge us for delivery of ads,or limit our ability to deliver ads or measure their effectiveness. If distributors impair access to or refuse to distribute our services or apps, or charge for or limitour ability to deliver ads or measure the effectiveness of our ads, then our user engagement and revenue could decline.
Ifwedonotmanageouroperatingexpenseseffectively,ourprofitabilitycouldfailtoimproveandcoulddecline.
We plan to continue to seek to operate efficiently and to manage our costs effectively. However, we are also investing in areas we believe will grow revenue andour operating expenses might increase
15

Table of Contents
as a result of these investments. We have also incurred significant costs in connection with the Sale transaction with Verizon and in connection with the SecurityIncidents, and we expect these costs will continue in the foreseeable future. If our operating expenses or other expenses increase at a greater pace than ourrevenue grows, or if we fail to manage costs effectively, our profitability could fail to improve and could decline.
Risks and uncertainties associated with the pending Sale transaction with Verizon may adversely affect our business, financial performance andstockprice.
There is no assurance that the Sale transaction will be consummated in a timely manner or at all. In addition, the anticipated benefits of the Sale transaction maynot be realized. Potential risks and uncertainties related to the Sale transaction include, among others: • the inability to consummate the transaction in a timely manner or at all, due to the inability to obtain or delays in obtaining the approval of our stockholders,
the necessary regulatory approvals, or satisfaction of other conditions to the closing of the Sale transaction; • the existence or occurrence of any event, change, or other circumstance that could give rise to the termination of the Amended Stock Purchase Agreement,
which, in addition to other adverse consequences, could result in the Company incurring substantial fees, including, in certain circumstances, the paymentof a termination fee to Verizon under the Amended Stock Purchase Agreement;
• potential adverse effects on our relationships with our existing and potential advertisers, suppliers, customers, vendors, distributors, landlords, licensors,
licensees, joint venture partners, and other business partners; • the implementation of the Sale transaction will require significant time, attention, and resources of our senior management and others within the Company,
potentially diverting their attention from the conduct of our business; • risks related to our ability to retain or recruit key talent; • costs, fees, expenses and charges related to or triggered by the Sale transaction; • the net proceeds that the Company will receive from Verizon is subject to uncertainties as a result of the purchase price adjustments in the Amended Stock
Purchase Agreement; • restrictions on the conduct of our business, including the ability to make certain acquisitions and divestitures, enter into certain contracts, and incur certain
indebtedness and expenditures until the earlier of the completion of the Sale transaction or the termination of the Amended Stock Purchase Agreement; • potential adverse effects on our business, properties or operations caused by us implementing the Sale transaction or foregoing opportunities that we might
otherwise pursue absent the pending Sale transaction; • the initiation or outcome of any legal proceedings or regulatory proceedings that may be instituted against us and our directors and/or officers relating to the
Sale transaction as well as certain liabilities arising out of governmental or third party investigations, litigation or claims related to certain data securityincidents for which the Company will retain liability following the closing; and
• following the closing of the Sale transaction, the Company will be required to register and be regulated as an investment company under the Investment
Company Act of 1940, which will result in, among other things, the Company having to comply with the regulations thereunder, certain stockholderspotentially being prohibited from holding or acquiring shares of the
16

Table of Contents
Company, and the Company likely being removed from the Standard and Poor’s 500 Index and other indices which could have an adverse impact on theCompany’s share price following the Sale transaction.
All of these risks and uncertainties could potentially have an adverse impact on our business and financial performance, and could cause our stock price todecline.
Wearestill in theprocessof assessingthefull extentof theimpactof theSecurityIncidentsandtherelatedgovernmentinvestigationsandcivillitigationonourresultsofoperations,whichcouldbematerial.
We are still in the process of assessing the financial and other effects of the Security Incidents (See Item 7—“Management’s Discussion and Analysis ofFinancial Condition and Results of Operations—Security Incidents”), which may have an adverse impact on our business, results of operations and reputation.As a result of the Security Incidents, we are facing approximately 43 putative consumer class action lawsuits, four stockholder derivative actions and oneputative stockholder class action, and other lawsuits and claims may be asserted by or on behalf of users, partners, shareholders, or others seeking damages orother related relief, allegedly arising out of the Security Incidents. We are also facing investigations by a number of federal, state, and foreign governmentalofficials and agencies. These claims and investigations may adversely affect how we operate our business, divert the attention of management from theoperation of the business, and result in additional costs and potential fines. In addition, the governmental agencies investigating the Security Incidents may seekto impose injunctive relief, consent decrees, or other civil or criminal penalties which could, among other things, materially increase our data security costs, andaffect how we operate our systems and collect and use customer and user information.
OursecuritymeasuresmaybebreachedastheywereintheSecurityIncidentsanduserdataaccessed,whichmaycauseusersandcustomerstocurtailorstopusingourproductsandservices,andmaycauseustoincursignificantlegalandfinancialexposure.
Our products and services involve the storage and transmission of Yahoo’s users’ and customers’ personal and proprietary information in our facilities and onour equipment, networks, and corporate systems. Yahoo is routinely targeted by outside third parties, including technically sophisticated and well-resourcedstate-sponsored actors, attempting to access or steal our user and customer data or otherwise compromise user accounts. We believe such a state-sponsoredactor was responsible for the theft involved in the 2014 Security Incident and for at least some of the Cookie Forging Activity. Security breaches or otherunauthorized access or actions expose us to a risk of theft of user data, regulatory actions, litigation, investigations, remediation costs, damage to our reputationand brand, loss of user and partner confidence in the security of our products and services and resulting fees, costs, and expenses, loss of revenue, damage toour reputation, and other potential liability. Outside parties may attempt to fraudulently induce our employees, users, partners, customers, or other parties todisclose sensitive information or take other actions to gain access to our data or our users’ or customers’ data, and such unauthorized access may continueundetected for an extended period of time. In addition, hardware, software, or applications we procure from third parties may contain defects in design ormanufacture or other problems that could unexpectedly compromise network and data security. In addition, systems and software implemented by us or ourpartners may contain security vulnerabilities, or may be implemented improperly due to human error or limitations in affected systems. Additionally, some thirdparties, such as our distribution partners, service providers, vendors, and app developers, may receive, transmit, process, access or store information providedby us or by our users through systems and applications that are integrated with Yahoo systems, properties and services. If these third parties fail to adopt oradhere to adequate data security practices, or in the event of a breach of their networks, our data or our users’ data may be improperly
17

Table of Contents
accessed, used, or disclosed. Security breaches or other unauthorized data disclosure, acquisition or access (such as the Security Incidents) have resulted in,and may in the future result in, a combination of significant legal and financial exposure, increased remediation and other costs, damage to our reputation, and aloss of confidence in the security of our products, services, and networks that could have a significantly adverse effect on our business. We take steps to preventunauthorized data disclosure or access to our systems; however, because the techniques used to obtain unauthorized access, disable or degrade service, orsabotage systems change frequently or may be disguised or difficult to detect, or designed to remain dormant until a triggering event, we may be unable toanticipate these techniques or implement adequate preventative measures. Breaches of our security measures, such as the Security Incidents, or perceivedbreaches, have caused and may in the future cause, the market perception of the effectiveness of our security measures to be harmed and could cause us tolose users and customers, or detrimentally affect our relationships with distribution partners, service providers, vendors and app developers.
Changesinregulationsor user concernsregardingprivacyandprotectionof user data, or anyfailure to comply with suchlaws, could adverselyaffectourbusiness.
Federal, state, and international laws and regulations govern the collection, use, retention, disclosure, sharing and security of data that we receive from andabout our users. The use of consumer data by online service providers and advertising networks is a topic of active interest among federal, state, andinternational regulatory bodies, and the regulatory environment is unsettled. Many states have passed laws requiring notification to users where there is asecurity breach for personal data, such as California’s Information Practices Act. We face similar risks in international markets where our products, services andapps are offered. Any failure, or perceived failure, by us to comply with or to make effective modifications to our policies, or to comply with any applicable federal,state, or international privacy, data-retention or data-protection-related laws, regulations, orders or industry self-regulatory principles could result in proceedingsor actions against us by governmental entities or others, a loss of user confidence, damage to the Yahoo brands, and a loss of users, advertising partners, orAffiliates, any of which could potentially have an adverse effect on our business.
In addition, various federal, state and foreign legislative or regulatory bodies may enact new or additional laws and regulations concerning privacy, dataretention, data transfer and data protection issues, including laws or regulations mandating disclosure to domestic or international law enforcement bodies, whichcould adversely impact our business, our brand or our reputation with users. For example, some countries are considering or have enacted laws mandating thatuser data regarding users in their country be maintained in their country. Having to maintain local data centers in individual countries could increase ouroperating costs significantly. In addition, there currently is a data protection regulation, known as the General Data Protection Regulation, which has beenfinalized and is pending implementation by the member states of the European Union by May 2018 that includes operational and compliance requirements thatare different than those currently in place and that also includes significant penalties for non-compliance. The European Union is also considering an update toits Privacy and Electronic Communications (e-Privacy) Directive to, among other things, amend the current directive’s rules on the use of cookies.
The European Court of Justice invalidated the European Commission’s 2000 Safe Harbor Decision that we had previously relied on for data transfers betweenthe European Union and United States. The model contractual clauses and other mechanisms that we currently rely on to address European Union dataprotection requirements for transfers of data are subject to uncertainty and legal challenges. The European Union and United States recently agreed to thePrivacy Shield Framework, an alternative mechanism to comply with European Union data protection requirements. We are not currently relying on the PrivacyShield Framework. Challenges to our existing data transfer mechanisms, and any future legal challenges to data transfer mechanisms that we may adopt, could
18

Table of Contents
cause us to incur additional costs, require us to change business practices in a manner adverse to our business, or affect the manner in which we provide ourservices.
The interpretation and application of privacy, data protection, data transfer and data retention laws and regulations are often uncertain and in flux in the UnitedStates and internationally. These laws may be interpreted and applied inconsistently from country to country and inconsistently with our current policies andpractices, complicating long-range business planning decisions. If privacy, data protection, data transfer or data retention laws are interpreted and applied in amanner inconsistent with our current policies and practices we may be fined or ordered to change our business practices in a manner that adversely impacts ouroperating results. Complying with these varying international requirements could cause us to incur substantial costs or require us to change our businesspractices in a manner adverse to our business and operating results.
Weareregularlyinvolvedinclaims,suits,governmentinvestigations,andotherproceedingsthatmayresultinadverseoutcomes.
We are regularly involved in claims, suits, government investigations, and proceedings arising from the ordinary course of our business, including actions withrespect to intellectual property claims, privacy, consumer protection, information security, data protection or law enforcement matters, tax matters, labor andemployment claims, commercial claims, as well as actions involving content generated by our users, stockholder derivative actions, purported class action andclass action lawsuits, and other matters. Such claims, suits, government investigations, and proceedings are inherently uncertain and their results cannot bepredicted with certainty. Regardless of the outcome, such legal proceedings can have an adverse impact on us because of legal costs, diversion of managementand other personnel, and other factors. In addition, it is possible that a resolution of one or more such proceedings could result in reputational harm, liability,penalties, or sanctions, as well as judgments, consent decrees, or orders preventing us from offering certain features, functionalities, products, or services, orrequiring a change in our business practices, products or technologies, which could in the future materially and adversely affect our business, operating results,and financial condition. See Note 12—“Commitments and Contingencies” in the Notes to our consolidated financial statements.
RisksassociatedwithourSearchAgreementwithMicrosoftmayadverselyaffectourbusinessandoperatingresults.
Under our Search Agreement with Microsoft, Microsoft was the exclusive provider of algorithmic and paid search services for Yahoo Properties and Affiliate siteson personal computers and the non-exclusive provider of such services on mobile devices. As of April 15, 2015, Microsoft became the non-exclusive provider ofsuch services on all devices. Commencing on May 1, 2015, the Company is required to request paid search results from Microsoft for 51 percent of its searchqueries originating from personal computers accessing Yahoo Properties and its Affiliate sites (the “Volume Commitment”) and will display only Microsoft’s paidsearch results on such search result pages. Approximately 37 percent, 35 percent, and 35 percent, of our revenue for 2016, 2015, and 2014, respectively, wereattributable to the Microsoft Search Agreement (or approximately 25 percent for 2016 after excluding the impact of the change in revenue presentation related tothe implementation of the Eleventh Amendment to the Microsoft Search Agreement during the second quarter of 2016). Our business and operating resultswould be adversely affected by a significant decline in or loss of this revenue if we are not able to successfully replace this revenue with revenue from searchresults displayed through our Yahoo Gemini platform or our Services Agreement with Google.
As a result of the Volume Commitment, we continue to be dependent on Microsoft continuing to invest and innovate to maintain and improve its algorithmic andpaid search services and to be
19

Table of Contents
competitive with other search providers. If Microsoft fails to do this, our revenue and profitability could decline and our ability to maintain and expand ourrelationships with Affiliates for search and paid search advertising could be negatively impacted. Further, our competitors may continue to increase revenue,profitability, and market share at a higher rate than we do.
The term of the Microsoft Search Agreement is 10 years from its commencement date, February 23, 2010, subject to earlier termination as provided in theMicrosoft Search Agreement. On or after October 1, 2015, either the Company or Microsoft may terminate the Microsoft Search Agreement by delivering awritten notice of termination to the other party. The Microsoft Search Agreement will remain in effect for four months from the date of a termination notice toprovide for a transition period. If Microsoft terminated the Microsoft Search Agreement and the Company was unable to rely on its own services or the ServicesAgreement with Google, the termination could have an adverse impact on our business, revenue and operating results.
RisksassociatedwithourServicesAgreementwithGooglemayadverselyaffectourbusinessandoperatingresults.
Under our Services Agreement with Google, Google will provide us with search advertisements through Google’s AdSense for Search service, web algorithmicsearch services through Google’s Websearch Service, and image search services. We entered into the Services Agreement with Google in the fourth quarter of2015. In addition, if Microsoft were to terminate its Search Agreement with us, we would be required to rely on the Services Agreement and our Yahoo Geminiplatform to replace the search revenue we currently receive under the Microsoft Search Agreement.
We are dependent on Google continuing to invest and innovate to maintain and improve its algorithmic and paid search services and to be competitive with othersearch providers. If Google fails to do this, our revenue and profitability could decline. Further, Google has a number of termination rights under the ServicesAgreement. If Google terminated the Services Agreement and we were unable to rely on our Yahoo Gemini platform or the Microsoft Search Agreement, thetermination could have an adverse impact on our business, revenue and operating results.
If weareunabletoprovideinnovativesearchexperiencesandotherproductsandservicesthatdifferentiateourservicesandgeneratesignificanttraffictoourwebsites,ourbusinesscouldbeharmed,causingourrevenuetodecline.
Internet search is characterized by rapidly changing technology, significant competition, evolving industry standards, and frequent product and serviceenhancements. Although we have agreements with Microsoft and Google to use their paid search platforms, we still need to continue to invest in our YahooGemini search platform and to innovate to improve our users’ search experience (especially on mobile) to continue to differentiate our services and attract,retain, and expand our user base and paid search advertiser base. We also generate revenue through other online products, services and apps, and continue toinnovate the products, services and apps in our portfolio. The research and development of new, technologically advanced products is a complex process thatrequires significant levels of innovation and investment, as well as accurate anticipation of technology, market and consumer trends.
If we are unable to provide innovative search experiences and other products and services which differentiate our services, gain user acceptance and generatesignificant traffic to our websites, or if we are unable to effectively monetize the traffic from such products and services, our business could be harmed, causingour revenue to decline.
20

Table of Contents
Ourbusinessdependsonastrongbrand,andfailingtomaintainorenhancetheYahoobrandsinacost-effectivemannercouldharmouroperatingresults.
Maintaining and enhancing our brands is an important aspect of our efforts to attract and expand our user, advertiser, and Affiliate base. We believe that theimportance of brand recognition will increase due to the relatively low barriers to entry in certain portions of the Internet market. Maintaining and enhancing ourbrands will depend largely on our ability to provide high-quality, innovative products, and services, which we might not do successfully. We have spent andexpect to spend considerable money and resources on the establishment and maintenance of our brands, as well as advertising, marketing, and other brand-building efforts to preserve and enhance consumer awareness of our brands. Our brands may be negatively impacted by a number of factors such as serviceoutages, product malfunctions, data protection and security issues, exploitation of our trademarks by others without permission, and poor presentation orintegration of our search marketing offerings by Affiliates on their sites or in their software and services.
Further, while we attempt to ensure that the quality of our brands is maintained by our licensees, our licensees might take actions that could impair the value ofour brands, our proprietary rights, or the reputation of our products and media properties. If we are unable to maintain or enhance our brands in a cost-effectivemanner, or if we incur excessive expenses in these efforts, our business, operating results and financial condition could be harmed.
Ifweareunabletoattract,sustain,andrenewdistributionarrangementsonfavorableterms,ourrevenuemaydecline.
We enter into distribution arrangements with third parties to promote or supply our services to their users. For example: • We maintain search and display advertising relationships with Affiliate sites, which integrate our advertising offerings into their websites. • We enter into distribution alliances with Internet service providers (including providers of cable and broadband Internet access) and software distributors to
promote our services to their users. • We enter into agreements with mobile phone, tablet, television, and other device manufacturers, electronics companies and carriers to promote our software
and services on their devices.
In some markets, we depend on a limited number of distribution arrangements for a significant percentage of our user, publisher, and advertiser activity. A failureby our distributors to attract or retain their user bases would negatively impact our user activity and, in turn, reduce our revenue. For mobile app distribution, wedepend on a limited number of distributors, primarily the developers of the operating systems or device manufacturers. If we are unable to reach agreementswith these distributors for distribution of our mobile apps or they refuse to distribute or block our mobile apps, our operating results will be harmed. In the future,as new methods for accessing the Internet and our services become available, including through alternative devices, we may need to enter into amendeddistribution agreements with existing access providers, distributors, and manufacturers to cover the new devices and new arrangements. We face a risk thatexisting and potential new access providers, distributors, and manufacturers may decide not to offer distribution of our services on reasonable terms, or at all.
Distribution agreements often involve revenue sharing. Competition to enter into distribution arrangements has caused and may in the future cause our trafficacquisition costs to increase. In some cases, we guarantee distributors a minimum level of revenue and, as a result, run a risk that the distributors’ performance(in terms of ad impressions, toolbar installations, etc.) might not be sufficient to otherwise earn their minimum payments, in which case our payments couldexceed the
21

Table of Contents
revenue that we receive. In other cases, we agree that if the distributor does not realize specified minimum revenue we will adjust the distributor’s revenue-sharepercentage or provide make-whole arrangements.
Some of our distribution agreements are not exclusive, have a short term, are terminable at will, or are subject to early termination provisions. The loss ofdistributors, increased distribution costs, or the renewal of distribution agreements on significantly less favorable terms may cause our revenue to decline.
If we are unable to license, acquire, create or aggregate compelling content and services at reasonable cost, or receive compelling content, thenumberofusersof ourservicesmaynotgrowasanticipated, ormaydecline, orusers’ level of engagementwithourservicesmaydecline, all ofwhichcouldharmouroperatingresults.
Our future success depends in part on our ability to aggregate compelling content and deliver that content through our online properties. We license from thirdparties much of the content and services on our online properties, such as news, stock quotes, weather, sports, video, and photos. In addition, our users alsocontribute content to us, and our employees and contractors produce unique content for us. We believe that users will increasingly demand high-quality contentand services. We may need to make substantial payments to third parties from whom we license or acquire such content or services. Our ability to maintain andbuild relationships with such third-party providers is critical to our success. In addition, as users increasingly access the Internet via mobile and other alternativedevices, we may need to enter into amended agreements with existing third-party providers to cover new devices. We may be unable to enter into new, orpreserve existing, relationships with the third-parties whose content or services we seek to obtain. In addition, as competition for compelling content increasesboth domestically and internationally, our third-party providers may increase the prices at which they offer their content and services to us, stop offering theircontent or services to us, or offer their content and services on terms that are not agreeable to us. An increase in the prices charged to us by third-partyproviders or in the costs we incur to produce our own content could harm our operating results and financial condition. Further, because many of our licenses forour content and services with third parties are non-exclusive, other media providers may be able to offer similar or identical content. This increases theimportance of our ability to deliver compelling editorial content and personalization of this content for users in order to differentiate Yahoo from other businesses.If we are unable to license or acquire compelling content at reasonable cost, if other companies distribute content or services that are similar to or the same asthat provided by us, or if we do not receive compelling content from our users, the number of users of our services may not grow as anticipated, or may decline,users’ level of engagement with our services may decline, clicks on our ads may decrease, or advertisers may reduce future purchases of our ads, all or any ofwhich could harm our operating results.
Interruptions,delays,orfailuresintheprovisionofourservicescoulddamageourreputationandharmouroperatingresults.
Delays or disruptions to our service, or the loss or compromise of data, could result from a variety of causes, including the following: • Our operations are susceptible to outages and interruptions due to fire, flood, earthquake, tsunami, other natural disasters, power loss, equipment or
telecommunications failures, cyber attacks, terrorist attacks, political or social unrest, and other events over which we have little or no control. We do nothave multiple site capacity for all of our services and some of our systems are not fully redundant in the event of delays or disruptions to service, so somedata or systems may not be fully recoverable after such events.
22
Table of Contents
• The systems through which we provide our products and services are highly technical, complex, and interdependent. Design errors might exist in thesesystems, or might be introduced when we make modifications, which might cause service malfunctions or require services to be taken offline whilecorrective responses are developed.
• Despite our implementation of security measures, our servers and platforms are vulnerable to computer viruses, malware, worms, hacking, physical and
electronic break-ins, router disruption, sabotage or espionage, and other disruptions from unauthorized access and tampering (including through socialengineering such as phishing attacks), as well as coordinated denial-of-service attacks. We may not be in a position to promptly address attacks or toimplement adequate preventative measures if we are unable to immediately detect such attacks. Such events could result in large expenditures toinvestigate or remediate, to recover data, to repair or replace networks, information systems, or platforms, including changes to security measures, todeploy additional personnel, to defend litigation or regulatory actions or to protect against similar future events, and may cause damage to our reputation orloss of revenue.
• We rely on third-party providers over which we have little or no control for our principal Internet connections and co-location of a significant portion of our
data servers, as well as for our payment processing capabilities and key components or features of certain of our products and services. Any disruption ofthe services they provide us or any failure of these third-party providers to handle higher volumes of use could, in turn, cause delays or disruptions in ourservices and loss of revenue. In addition, if our agreements with these third-party providers are terminated for any reason, we might not have a readilyavailable alternative.
Prolonged delays or disruptions to our service could result in a loss of users, damage to our brands, legal costs or liability, and harm to our operating results.
Technologies,tools,software,andapplicationscouldblockouradvertisements,impairourabilitytodeliverinterest-basedadvertising,orshiftthelocationinwhichadvertisingappears,whichcouldharmouroperatingresults.
Technologies, tools, software, and applications (including new and enhanced browsers) have been developed and are likely to continue to be developed that canblock or allow users to opt out of display, search, and interest-based advertising and content, delete or block the cookies used to deliver such advertising, or shiftthe location in which advertising appears on pages so that our advertisements do not show up in the most monetizable places on our pages or are obscured.Most of our revenue is derived from fees paid by advertisers in connection with the display of graphical and non-graphical advertisements or clicks on searchadvertisements on web pages. As a result, the adoption of such technologies, tools, software, and applications could reduce the number of search and displayadvertisements that we are able to deliver and/or our ability to deliver interest-based advertising and this, in turn, could reduce our advertising revenue andoperating results.
Ifweareunabletorecruit,hire,motivate,andretainkeypersonnel,wemaynotbeabletoexecuteourbusinessplan.
Our business is dependent on our ability to recruit, hire, motivate, and retain talented, highly skilled personnel. Achieving this objective may be difficult due tomany factors, including the pending Sale transaction with Verizon; the intense competition for such highly skilled personnel in the San Francisco Bay Area andother metropolitan areas where our offices are located; competitors’ hiring practices; the effectiveness of our compensation and retention programs; andfluctuations in global economic and industry conditions. If we do not succeed in retaining and motivating our existing key employees, and in attracting new keypersonnel, we may be unable to meet our business plan and as a result, our revenue and profitability may decline.
23

Table of Contents
Our intellectual property rights are valuable, and any failure or inability to sufficiently protect them could harm our business and our operatingresults.
We create, own, and maintain a wide array of copyrights, patents, trademarks, trade dress, trade secrets, rights to domain names and other intellectual propertyassets which we believe are collectively among our most valuable assets. We seek to protect our intellectual property assets through patent, copyright, tradesecret, trademark, and other laws of the U.S. and other countries of the world, and through contractual provisions. However, the efforts we have taken to protectour intellectual property and proprietary rights might not be sufficient or effective at stopping unauthorized use of those rights. Protection of the distinctiveelements of Yahoo might not always be available under copyright law or trademark law, or we might not discover or determine the full extent of any unauthorizeduse of our copyrights and trademarks in order to protect our rights. In addition, effective trademark, patent, copyright, and trade secret protection might not beavailable or cost-effective in every country in which our products and media properties are distributed or made available through the Internet. Changes in patentlaw, such as changes in the law regarding patentable subject matter, could also impact our ability to obtain patent protection for our innovations. In particular,recent amendments to the U.S. patent law may affect our ability to protect our innovations and defend against claims of patent infringement. Further, given thecosts of obtaining patent protection, we might choose not to protect (or not to protect in some jurisdictions) certain innovations that later turn out to be important.There is also a risk that the scope of protection under our patents may not be sufficient in some cases or that existing patents may be deemed invalid orunenforceable. To help maintain our trade secrets, we have entered into confidentiality agreements with most of our employees and contractors, andconfidentiality agreements with many of the parties with whom we conduct business, in order to limit access to and disclosure of our proprietary information. Ifthese confidentiality agreements are breached it could compromise our trade secrets and cause us to lose any competitive advantage provided by those tradesecrets.
If we are unable to protect our proprietary rights from unauthorized use, the value of our intellectual property assets may be reduced. In addition, protecting ourintellectual property and other proprietary rights is expensive and time consuming. Any increase in the unauthorized use of our intellectual property could make itmore expensive to do business and consequently harm our operating results.
Weare,andmayinthefuturebe,subjecttointellectualpropertyinfringementorotherthird-partyclaims,whicharecostlytodefend,couldresultinsignificantdamageawards,andcouldlimitourabilitytoprovidecertaincontentorusecertaintechnologiesinthefuture.
Internet, technology, media, and patent holding companies often possess a significant number of patents. Further, many of these companies and other partiesare actively developing or purchasing search, indexing, e-commerce, and other Internet-related technologies, as well as a variety of online business models andmethods.
We believe that these parties will continue to take steps such as seeking patent protection to protect these technologies. In addition, patent holding companiesmay continue to seek to monetize patents they have purchased or otherwise obtained. As a result, disputes regarding the ownership of technologies and rightsassociated with online businesses are likely to continue to arise in the future. From time to time, parties assert patent infringement claims against us. Currently,we are engaged in a number of lawsuits regarding patent issues and have been notified of a number of other potential disputes.
In addition to patent claims, third parties have asserted, and are likely in the future to assert, claims against us alleging infringement of copyrights, trademarkrights, trade secret rights or other proprietary rights, or alleging unfair competition, violation of federal or state statutes or other claims,
24

Table of Contents
including alleged violation of international statutory and common law. In addition, third parties have made, and may continue to make, infringement and otherclaims against us over the display of content or search results triggered by search terms.
As we develop new technologies, products and services, we may become increasingly subject to intellectual property infringement and other claims, includingthose that may arise under international laws. In the event that there is a determination that we have infringed third-party proprietary rights such as patents,copyrights, trademark rights, trade secret rights, or other third-party rights such as publicity and privacy rights, we could incur substantial monetary liability, or berequired to enter into costly royalty or licensing agreements or be prevented from using such rights, which could require us to change our business practices inthe future, hinder us from offering certain features, functionalities, products or services, require us to develop non-infringing products or technologies, and limitour ability to compete effectively. We may also incur substantial expenses in defending against third-party claims regardless of the merit of such claims. Inaddition, many of our agreements with our customers or Affiliates require us to indemnify them for some types of third-party intellectual property infringementclaims, which could increase our costs in defending such claims and our damages. Furthermore, such customers and Affiliates may discontinue the use of ourproducts, services, and technologies either as a result of injunctions or otherwise. The occurrence of any of these results could harm our brands or have anadverse effect on our business, financial position, operating results, and cash flows.
Wemayberequiredtorecordasignificantchargetoearningsifourgoodwill,intangibleassets,investmentsinequityinterests,orotherinvestmentsbecomeimpaired.
We have previously recorded charges to earnings when our goodwill, intangible assets, investments in equity interests, including investments held by any equitymethod investee, and other investments became impaired. For example, we recorded a $4.461 billion non-cash goodwill impairment charge during the fourthquarter of 2015 and a non-cash goodwill impairment charge of $395 million and a non-cash intangible assets impairment charge of $87 million during the secondquarter of 2016. We are required under generally accepted accounting principles to test goodwill for impairment at least annually and to review our intangibleassets, investments in equity interests (including investments held by any equity method investee), and our other investments, for impairment when events orchanges in circumstance indicate the carrying value may not be recoverable. Factors that could lead to impairment of goodwill, intangible assets (includinggoodwill or assets acquired via acquisitions) and other investments include significant adverse changes in the business climate and actual or projected operatingresults (affecting our company as a whole or affecting any particular reporting unit) and declines in the financial condition of our business. Factors that could leadto impairment of investments in equity interests include a prolonged period of decline in the stock price or operating performance of, or an announcement ofadverse changes or events by, the companies in which we invested or the investments held by those companies. Factors that could lead to an impairment ofU.S. government securities, which constitute a significant portion of our current assets, include any downgrade of U.S. government debt or concern about thecreditworthiness of the U.S. government. We may be required in the future to record additional charges to earnings if our goodwill, intangible assets, investmentsin equity interests, including investments held by any equity method investee, or other investments become impaired. Any such charge would adversely impactour financial results .
Fluctuationsinforeigncurrencyexchangeratesmayadverselyaffectouroperatingresultsandfinancialcondition.
Revenue generated and expenses incurred by our international subsidiaries and any equity method investee are often denominated in the currencies of the localcountries. As a result, our consolidated U.S. dollar financial statements are subject to fluctuations due to changes in exchange rates as the financial results ofour international subsidiaries and any equity method investee are translated from
25
Table of Contents
local currencies into U.S. dollars. Our financial results are also subject to changes in exchange rates that impact the settlement of transactions in non-localcurrencies. The carrying values of our equity investments in any equity investee are also subject to fluctuations in the exchange rates of foreign currencies.
We use derivative instruments, such as foreign currency forward contracts, to partially offset certain exposures to fluctuations in foreign currency exchange rates.The use of such instruments may not offset any, or more than a portion, of the adverse financial effects of unfavorable movements in foreign currency exchangerates. Any losses on these instruments that we experience may adversely impact our financial results, cash flows and financial condition. Further, we hedge aportion of our net investment in Yahoo Japan Corporation (“Yahoo Japan”) with currency forward contracts. If the Japanese yen has appreciated at maturitybeyond the contract execution rate, we would be required to settle the contract by making a cash payment which could be material and could adversely impactour cash flows and financial condition. See Part II, Item 7A—“Quantitative and Qualitative Disclosures About Market Risk” of this Annual Report.
Acquisitionsandstrategicinvestmentscouldresultinadverseimpactsonouroperationsandinunanticipatedliabilities.
We have acquired, and have made strategic investments in, a number of companies (including through joint ventures). Such acquisitions and strategicinvestments to date were accompanied by a number of risks, including: • the difficulty of integrating the operations, personnel, systems, and controls of acquired companies as a result of cultural, regulatory, systems, and
operational differences; • the potential disruption of our ongoing business and distraction of management; • the incurrence of additional operating losses and operating expenses of the businesses we acquired or in which we invested; • the difficulty of integrating acquired technology and rights into our services and unanticipated expenses related to such integration; • the failure to successfully further develop an acquired business or technology and any resulting impairment of amounts currently capitalized as intangible
assets; • the failure of strategic investments to perform as expected or to meet financial projections; • the potential for patent and trademark infringement and data privacy and security claims against the acquired companies, or companies in which we have
invested; • litigation or other claims in connection with acquisitions, acquired companies, or companies in which we have invested; • the impairment or loss of relationships with customers and partners of the companies we acquired or in which we invested or with our customers and
partners as a result of the integration of acquired operations; • the impairment of relationships with, or failure to retain, employees of acquired companies or our existing employees as a result of integration of new
personnel; • the impairment of goodwill and/or purchased long-lived assets; • our lack of, or limitations on our, control over the operations of our joint venture companies; • in the case of foreign acquisitions and investments, the impact of particular economic, tax, currency, political, legal and regulatory risks associated with
specific countries; and
26
Table of Contents
• the impact of known potential liabilities or liabilities that may be unknown, including as a result of inadequate internal controls, associated with thecompanies we acquired or in which we invested.
Our failure to be successful in addressing these risks or other problems encountered in connection with our acquisitions and strategic investments could causeus to fail to realize the anticipated benefits of such acquisitions or investments, incur unanticipated liabilities, and harm our business generally.
AvarietyofnewandexistingU.S.andforeigngovernmentlawsandregulationscouldsubjectustoclaims,judgments,monetaryliabilitiesandotherremedies,andtolimitationsonourbusinesspractices.
We are subject to numerous U.S. and foreign laws and regulations covering a wide variety of subject matters. New laws and regulations, changes in existinglaws and regulations or the interpretation of them, our introduction of new products or forms of advertising (such as native advertising), or an extension of ourbusiness into new areas, could increase our future compliance costs, make our products and services less attractive to our users, or cause us to change or limitour business practices. We may incur substantial expenses to comply with laws and regulations or defend against a claim that we have not complied with them.Further, any failure on our part to comply with any relevant laws or regulations may subject us to significant civil or criminal liabilities, penalties, and negativepublicity.
The application of existing domestic and international laws and regulations to us relating to issues such as user privacy and data protection, data transfer, datalocalization, security, defamation, pricing, advertising, taxation, gambling, sweepstakes, promotions, billing, real estate, fantasy sports, consumer protection,accessibility, content regulation, quality of services, law enforcement demands, telecommunications, mobile, television, and intellectual property ownership andinfringement in many instances is unclear or unsettled. Further, the application to us or our subsidiaries of existing laws regulating or requiring licenses forcertain businesses of our advertisers can be unclear. For example, paid fantasy sports contests are an area of current regulatory uncertainty, with variousgovernment authorities having taken positions that some types of contests are unlawful and/or subject to licensing requirements. Similarly, there are a number oflegislative proposals in the European Union and its member states that could impose new obligations in areas affecting our business, including, but not limited to,copyright. U.S. export control laws and regulations also impose requirements and restrictions on exports to certain nations and persons and on our business.Internationally, we may also be subject to laws regulating our activities in foreign countries and to foreign laws and regulations that are inconsistent from countryto country.
The Digital Millennium Copyright Act (“DMCA”) is intended, in part, to limit the liability of eligible online service providers for caching, hosting, listing or linking to,third-party websites or user content that include materials that give rise to copyright infringement. Portions of the Communications Decency Act (“CDA”) areintended to provide statutory protections to online service providers who distribute third-party content. We rely on the protections provided by both the DMCAand the CDA in conducting our business, and may be adversely impacted by future legislation and future judicial decisions altering these safe harbors or ifinternational jurisdictions refuse to apply similar protections.
Various U.S. and international laws restrict the distribution of materials considered harmful to children and impose additional restrictions on the ability of onlineservices to collect information from minors. These laws currently impose restrictions and requirements on our business, and future federal, state or internationallaws and legislative efforts designed to protect children on the Internet may impose additional requirements on us.
27

Table of Contents
Ourinternationaloperationsexposeustoadditionalrisksthatcouldharmourbusiness,operatingresults,andfinancialcondition.
In addition to uncertainty about our ability to continue to generate revenue from our foreign operations, there are additional risks inherent in doing businessinternationally (including through our international joint ventures), including: • tariffs, trade barriers, customs classifications and changes in trade regulations; • difficulties in developing, staffing, and simultaneously managing a large number of varying foreign operations as a result of distance, language, and cultural
differences; • stringent local labor laws and regulations; • longer payment cycles; • credit risk and higher levels of payment fraud; • profit repatriation restrictions and foreign currency exchange restrictions; • political or social unrest, economic instability, repression, or human rights issues; • geopolitical events, including natural disasters, acts of war and terrorism; • import or export regulations; • compliance with U.S. laws such as the Foreign Corrupt Practices Act, and local laws prohibiting bribery and corrupt payments to government officials; • antitrust and competition regulations; • potentially adverse tax developments; • seasonal volatility in business activity and local economic conditions; • economic uncertainties relating to volatility in emerging markets and global economic uncertainty; • laws, regulations, licensing requirements, and business practices that favor local competitors or prohibit foreign ownership or investments; • different, uncertain or more stringent user protection, content, data protection, privacy, intellectual property and other laws; and • risks related to other government regulation (including actions restricting access to our products or services), required compliance with local laws or lack of
legal precedent.
The recent advisory referendum on the United Kingdom’s membership in the European Union, and any resulting changes to UK or EU policies, may, amongother things, adversely affect business activity and economic conditions, cause unfavorable exchange rate fluctuations, create uncertainty regarding internationaldata protection and transfer, government requests for information, advertising regulations, and tax rates, and affect our ability to recruit and retain employees.
We are subject to numerous and sometimes conflicting U.S. and foreign laws and regulations which increase our cost of doing business. Violations of thesecomplex laws and regulations that apply to our international operations could result in damage awards, fines, criminal actions, sanctions, or penalties against us,our officers or our employees, prohibitions on the conduct of our business and our ability to offer products and services, and damage to our reputation. Althoughwe have implemented policies and procedures designed to promote compliance with these laws, there can be no assurance that our employees, contractors, oragents will not violate our policies. These risks inherent in our international operations and expansion increase our costs of doing business internationally andcould result in harm to our business, operating results, and financial condition.
28

Table of Contents
Wemaybesubjecttolegalliabilityassociatedwithprovidingonlineservicesorcontent.
We host and provide a wide variety of services and technology products that enable and encourage individuals and businesses to exchange information; uploador otherwise generate photos, videos, text, and other content; advertise products and services; conduct business; and engage in various online activities bothdomestically and internationally. The law relating to the liability of providers of online services and products for activities of their users is currently unsettled bothwithin the United States and internationally. As a publisher, producer, and distributor of content, we may be subject to claims such as copyright, libel, defamationor improper use of publicity rights, as well as other infringement claims such as plagiarism. Claims have been threatened and brought against us for defamation,negligence, breaches of contract, plagiarism, copyright and trademark infringement, unfair competition, unlawful activity, tort, including personal injury, fraud, orother theories based on the nature and content of information which we publish or to which we provide links or that may be posted online or generated by us orby third parties, including our users. In addition, we have been and may again in the future be subject to domestic or international actions alleging that certaincontent we have generated or third-party content that we have made available within our services violates laws in domestic and international jurisdictions. Wecould also face restrictions or blocking of our services in particular countries as a result of content hosted on our services. We arrange for the distribution of third-party advertisements to third-party publishers and advertising networks, and we offer third-party products, services, or content, such as stock quotes and tradinginformation or search results, under the Yahoo brand or via distribution on Yahoo Properties. We may be subject to claims concerning these products, services,or content by virtue of our involvement in marketing, branding, broadcasting, or providing access to them, even if we do not ourselves host, operate, provide, orprovide access to these products, services, or content. While our agreements with respect to these products, services, and content may provide that we will beindemnified against such liabilities, the ability to receive such indemnification may be disputed, could result in substantial costs to enforce or defend, anddepends on the financial resources of the other party to the agreement, and any amounts received might not be adequate to cover our liabilities or the costsassociated with defense of such proceedings. Defense of any such actions could be costly and involve significant time and attention of our management andother resources, may result in monetary liabilities or penalties, and may require us to change our business in an adverse manner.
It is also possible that if any information provided directly by us contains errors or is otherwise wrongfully provided to users, third parties could make claimsagainst us. For example, we offer web-based e-mail services, which expose us to potential risks, such as liabilities or claims, by our users and third parties,resulting from unsolicited e-mail, lost or misdirected messages, illegal or fraudulent use of e-mail, alleged violations of policies, property interests, or privacyprotections, including civil or criminal laws, or interruptions or delays in e-mail service. We may also face purported consumer class actions or state actionsrelating to our online services, including our fee-based services (particularly in connection with any decision to discontinue a fee-based service). In addition, ourcustomers, third parties, or government entities may assert claims or actions against us if our online services or technologies are used to spread or facilitatemalicious or harmful code or applications.
Investigating and defending these types of claims are expensive, even if the claims are without merit or do not ultimately result in liability, and could subject us tosignificant monetary liability or cause a change in business practices that could negatively impact our ability to compete.
Certain of our metrics are subject to inherent challenges in measurement, and real or perceived inaccuracies in such metrics may harm ourreputationandnegativelyaffectourbusiness.
We present key metrics such as unique users, number of Ads Sold, number of Paid Clicks, Search click-driven revenue, Price-per-Click, Price-per-Ad, pageviews, mail messages sent and read, and searches that are calculated using unaudited internal company data. We periodically review, refine
29

Table of Contents
and update our methodologies for monitoring, gathering, and calculating these metrics. In addition, from time to time we provide, or rely on, certain other metrics,including those relating to the reach and effectiveness of our ads.
While our metrics are based on what we believe to be reasonable measurements and methodologies, there are inherent challenges in deriving our metricsacross large online and mobile populations around the world. In addition, our user metrics may differ from estimates published by third parties or from similarmetrics of our competitors due to differences in methodology. Furthermore, over time we may revise or cease reporting certain metrics that we no longer believeare useful or meaningful measures of our performance and add new metrics which we believe are better measurements of performance.
If advertisers, publishers or partners do not perceive our metrics to be accurate, or if we discover material inaccuracies in our metrics, it could negatively affectour reputation, business and financial results.
Any failure to scale and adapt our existing technology architecture to manage expansion of user-facing services and to respond to rapidtechnologicalchangecouldadverselyaffectourbusiness.
As some of the most visited sites on the Internet, Yahoo Properties deliver a significant number of products, services, page views, and advertising impressions tousers around the world. We expect our products and services to continue to expand and change significantly and rapidly in the future to accommodate newtechnologies, new devices, new Internet advertising solutions, and new means of content delivery.
In addition, widespread adoption of new Internet, networking or telecommunications technologies, or other technological or platform changes, could requiresubstantial expenditures to modify or adapt our services or infrastructure. The technology architectures and platforms utilized for our services are highly complexand may not provide satisfactory security features or support in the future, as usage increases and products and services expand, change, and become morecomplex. In the future, we may make additional changes to our existing, or move to completely new, architectures, platforms and systems, such as the changeswe have made in response to the increased use of mobile devices such as tablets and smartphones. Such changes may be technologically challenging todevelop and implement, may take time to test and deploy, may cause us to incur substantial costs or data loss, and may cause changes, delays or interruptionsin service. These changes, delays, or interruptions in our service may cause our users, Affiliates and other advertising platform participants to becomedissatisfied with our service or to move to competing providers or seek remedial actions or compensation. Further, to the extent that demands for our servicesincrease, we will need to expand our infrastructure, including the capacity of our hardware servers and the sophistication of our software. This expansion is likelyto be expensive and complex and require additional technical expertise. As we acquire users who rely upon us for a wide variety of services, it becomes moretechnologically complex and costly to retrieve, store, and integrate data that will enable us to track each user’s preferences. Any difficulties experienced inadapting our architectures, platforms and infrastructure to accommodate increased traffic, to store user data, and track user preferences, together with theassociated costs and potential loss of traffic, could harm our operating results, cash flows from operations, and financial condition.
Werely on third parties to provide the technologies necessary to deliver content, advertising, and services to ourusers, and any change in thelicensingterms,costs,availability,oracceptanceoftheseformatsandtechnologiescouldadverselyaffectourbusiness.
We rely on third parties to provide the technologies that we use to deliver the majority of the content, advertising, and services to our users. There can be noassurance that these providers will
30

Table of Contents
continue to license their technologies or intellectual property to us on reasonable terms, or at all. Providers may change the fees they charge users or otherwisechange their business model in a manner that slows the widespread acceptance of their technologies. In order for our services to be successful, there must be alarge base of users of the technologies necessary to deliver our content, advertising, and services. We have limited or no control over the availability oracceptance of those technologies, and any change in the licensing terms, costs, availability, or user acceptance of these technologies could adversely affect ourbusiness.
Ourbusiness dependsoncontinuedandunimpededaccess to the Internet by usandour users. Internet access providersmaybeabletoblock,degrade,orchargeforaccesstocertainofourproductsandservices,whichcouldleadtoadditionalexpensesandthelossofusersandadvertisers.
Our products and services depend on the ability of our users to access the Internet, and certain of our products require significant bandwidth to work effectively.Currently, this access is provided by companies that have significant market power in the broadband and internet access marketplace, including incumbenttelephone companies, cable companies, mobile communications companies, and government-owned service providers. Some of these providers may take, orhave stated that they may take, measures that could degrade, disrupt, or increase the cost of user access to certain of our products by restricting or prohibitingthe use of their infrastructure to support or facilitate our offerings, or by charging increased fees to us or our users to provide our offerings. Such interferencecould result in a loss of existing users and advertisers, and increased costs, and could impair our ability to attract new users and advertisers, thereby harmingour revenues and growth. The adoption of any laws or regulations that limit access to the Internet by blocking, degrading or charging access fees to us or ourusers for certain services could decrease the demand for, or the usage of, our products, services and apps, increase our cost of doing business and adverselyaffect our operating results.
Anyfailuretomanagechangestoourbusinesscouldadverselyaffectouroperatingresults.
If we are unable to effectively manage a large and geographically dispersed group of employees, our business may be adversely affected. Our business relieson data systems, billing systems, and financial reporting and control systems, among others. All of these systems have become increasingly complex in therecent past due to the growing complexity of our business, acquisitions of new businesses with different systems, and increased regulation over controls andprocedures. To manage our business in a cost-effective manner, we will need to continue to upgrade and improve our data systems, billing systems, and otheroperational and financial systems, procedures, and controls. In some cases, we are outsourcing administrative functions to lower-cost providers. Theseupgrades, improvements and outsourcing changes will require a dedication of resources and in some cases are likely to be complex. If we are unable to adaptour systems and put adequate controls in place in a timely manner, our business may be adversely affected. In particular, sustained failures of our billingsystems to accommodate increasing numbers of transactions, to accurately bill users and advertisers, or to accurately compensate Affiliates could adverselyaffect the viability of our business model.
We have dedicated resources to provide a variety of premium enhancements to our products, services and apps, whichmight not prove to besuccessfulingeneratingsignificantrevenueforus.
We offer fee-based enhancements for many of our free services. The development cycles for these technologies are long and generally require investment byus. We have invested and will continue to invest in premium products, services and apps. Some of these premium products, services and apps might notgenerate anticipated revenue or might not meet anticipated user adoption rates. We have previously discontinued some non-profitable premium services andmay discontinue others. General economic conditions as well as the rapidly evolving competitive landscape may affect users’ willingness to pay for suchpremium services. If we cannot generate revenue from our premium
31

Table of Contents
services that are greater than the cost of providing such services, our operating results could be harmed.
Wemayhaveexposuretoadditionaltaxliabilitieswhichcouldnegativelyimpactourincometaxprovision,netincome,andcashflow.
We are subject to income taxes and other taxes in both the United States and the foreign jurisdictions in which we currently operate or have historically operated.The determination of our worldwide provision for income taxes and current and deferred tax assets and liabilities requires judgment and estimation. Our incometaxes could be adversely affected by earnings being lower than anticipated in jurisdictions that have lower statutory tax rates and higher than anticipated injurisdictions that have higher statutory tax rates, by changes in the valuation of our deferred tax assets and liabilities, or by changes in tax laws, regulations, oraccounting principles.
In the ordinary course of our business, there are many transactions and calculations where the ultimate tax determination is uncertain. As a U.S. multinationalcorporation, we are subject to changing tax laws both within and outside of the United States. We cannot predict the form or timing of potential legislativechanges, but any newly enacted tax law could have a material adverse impact on our tax expense and cash flow. For example, several jurisdictions have soughtto increase revenues by imposing new taxes on internet advertising or increasing general business taxes. In addition, the Organization for EconomicCo-operation and Development (“OECD”), which represents a coalition of member countries, is supporting changes to numerous long-standing tax principlesthrough its base erosion and profit shifting (BEPS) project, which is focused on a number of issues, including the shifting of profits between affiliated entities indifferent tax jurisdictions. To the extent any of these proposals are enacted into legislation by OECD member countries, or if other international, consensus-based tax policies and principles are amended or implemented, they could adversely affect the amount of tax we pay and thereby our financial position andresults of operations.
We earn a material amount of our income from outside the United States. As of December 31, 2016, we had undistributed foreign earnings of approximately $3.3 billion, related to our equity method investment in Yahoo Japan. While we do not currently anticipate repatriating these earnings, any repatriation of funds inforeign jurisdictions to the United States could result in higher effective tax rates for us and subject us to significant additional U.S. income tax liabilities.
We are subject to regular review and audit by both domestic and foreign tax authorities as well as subject to the prospective and retrospective effects ofchanging tax regulations and legislation. Although we believe our tax estimates are reasonable, the ultimate tax outcome may materially differ from the taxamounts recorded in our consolidated financial statements and may materially affect our income tax provision, net income, or cash flows in the period or periodsfor which such determination and settlement is made.
The pending transaction with Verizon requires significant legal entity restructuring and realignment of corporate assets. While the restructuring and realignmentare intended to be performed in the most tax efficient manner, there is no assurance that the anticipated benefits will be realized and that additional cash taxeswon’t become due.
Proprietary document formats may limit the effectiveness of our search technology by preventing our technology fromaccessing the content ofdocumentsinsuchformats,whichcouldlimittheeffectivenessofourproductsandservices.
A large amount of information on the Internet is provided in proprietary document formats. These proprietary document formats may limit the effectiveness ofsearch technology by preventing the
32
Table of Contents
technology from accessing the content of such documents. The providers of the software applications used to create these documents could engineer thedocument format to prevent or interfere with the process of indexing the document contents with search technology. This would mean that the documentcontents would not be included in search results even if the contents were directly relevant to a search. The software providers may also seek to require us topay them royalties in exchange for giving us the ability to search documents in their format. If the search platform technology we employ is unable to indexproprietary format web documents as effectively as our competitors’ technology, usage of our search services might decline, which could cause our revenue tofall.
Adversemacroeconomicconditionscouldcausedecreasesordelaysinspendingbyouradvertisersandcouldharmourabilitytogeneraterevenueandourresultsofoperations.
Advertising expenditures tend to be cyclical, reflecting overall economic conditions and budgeting and buying patterns. Since we derive most of our revenue fromadvertising, adverse macroeconomic conditions have caused, and future adverse macroeconomic conditions could cause, decreases or delays in advertisingspending and negatively impact our advertising revenue and short-term ability to grow our revenue. Further, any decreased collectability of accounts receivableor early termination of agreements, whether resulting from customer bankruptcies or otherwise due to adverse macroeconomic conditions, could negativelyimpact our results of operations.
Ourstockpricehasbeenvolatilehistoricallyandmaycontinuetobevolatileregardlessofouroperatingperformance.
The trading price of our common stock has been and may continue to be subject to broad fluctuations. During the twelve months ended December 31, 2016, theclosing sale price of our common stock on the NASDAQ Global Select Market ranged from $26.76 to $44.71 per share and the closing sale price onFebruary 10, 2017 was $45.03 per share. Our stock price may fluctuate in response to a number of events and factors, such as variations in quarterly operatingresults or announcements of technological innovations, significant transactions, or new features, products or services by us or our competitors; changes infinancial estimates and recommendations by securities analysts; the operating and stock price performance of, or other developments involving, othercompanies that investors may deem comparable to us; trends in our industry; general economic conditions; and the operating performance and market valuationof Alibaba Group Holding Limited (“Alibaba Group”) and Yahoo Japan in which we have investments. Following the closing of the Sale transaction with Verizon,our stock price will be materially impacted by the operating performance and market valuation of Alibaba Group and Yahoo Japan. The equity valuation of ourinvestment in Yahoo Japan may be impacted due to fluctuations in foreign currency exchange rates. We present our investment in Alibaba Group on ourconsolidated balance sheet as an available-for-sale marketable security. Consequently, the carrying value of this investment on our consolidated balance sheetwill vary over time and fluctuations in its valuation may cause our stock price to fluctuate.
In addition, the stock market in general, and the market prices for companies in our industry, have experienced volatility that often has been unrelated tooperating performance. These broad market and industry fluctuations may adversely affect the price of our stock, regardless of our operating performance. Adecrease in the market price of our common stock would likely adversely impact the trading price of the 0.00% Convertible Senior Notes due 2018 that weissued in November 2013 (the “Notes”). Volatility or a lack of positive performance in our stock price may also adversely affect our ability to retain key employeeswho have been granted stock options or other stock-based awards. A sustained decline in our stock price and market capitalization could lead to an impairmentcharge to our long-lived assets.
33

Table of Contents
Delawarestatutesandcertainprovisionsinourcharterdocumentscouldmakeitmoredifficultforathird-partytoacquireus.
Our Board has the authority to issue up to 10 million shares of preferred stock and to determine the price, rights, preferences, privileges and restrictions,including voting rights, of those shares without any further vote or action by the stockholders. The rights of the holders of our common stock may be subject to,and may be adversely affected by, the rights of the holders of any preferred stock that may be issued in the future. The issuance of preferred stock may have theeffect of delaying, deterring or preventing a change in control of Yahoo without further action by the stockholders and may adversely affect the voting and otherrights of the holders of our common stock.
Some provisions of our charter documents, including provisions eliminating the ability of stockholders to take action by written consent and limiting the ability ofstockholders to raise matters at a meeting of stockholders without giving advance notice, may have the effect of delaying or preventing changes in control orchanges in our management, which could have an adverse effect on the market price of our stock and the value of the $1.4375 billion aggregate principalamount of the Notes we issued in November 2013. In addition, our charter documents do not permit cumulative voting, which may make it more difficult for athird-party to gain control of our Board. Further, we are subject to the anti-takeover provisions of Section 203 of the Delaware General Corporation Law, whichwill prohibit us from engaging in a “business combination” with an “interested stockholder” for a period of three years after the date of the transaction in which theperson became an interested stockholder, even if such combination is favored by a majority of stockholders, unless the business combination is approved in aprescribed manner. The application of Section 203 also could have the effect of delaying or preventing a change in control of us.
Any of these provisions could, under certain circumstances, depress the market price of our common stock and the Notes.
Risks Relating to the Notes TheconditionalconversionfeatureoftheNotes,iftriggered,mayadverselyaffectourfinancialconditionandoperatingresults.
In the event the conditional conversion feature of the Notes is triggered, holders of Notes will be entitled to convert the Notes at any time during specified periodsat their option. If one or more holders elect to convert their Notes, unless we elect to satisfy our conversion obligation by delivering solely shares of our commonstock (other than paying cash in lieu of delivering any fractional share), we would be required to settle a portion or all of our conversion obligation through thepayment of cash, which could adversely affect our liquidity. In addition, even if holders do not elect to convert their Notes, we could be required under applicableaccounting rules to reclassify all or a portion of the outstanding principal of the Notes as a current rather than long-term liability, which would result in a materialreduction of our net working capital.
WemaynothavetheabilitytoraisethefundsnecessarytosettleconversionsoftheNotesincashortorepurchasetheNotesuponafundamentalchange,andourfuturedebtmaycontainlimitationsonourabilitytopaycashuponconversionorrepurchaseoftheNotes.
Holders of the Notes will have the right to require us to repurchase all or a portion of their Notes upon the occurrence of a fundamental change at a repurchaseprice equal to 100% of the principal amount of the Notes to be repurchased, plus accrued and unpaid special interest, if any. We may not have enough availablecash or be able to obtain financing at the time we are required to make repurchases of Notes surrendered therefore, or pay cash with respect to Notes beingconverted if we elect not to issue shares, which could harm our reputation and affect the trading price of our common stock.
34

Table of Contents
ThenotehedgeandwarranttransactionsmayaffectthevalueoftheNotesandourcommonstock.
In connection with the pricing of the Notes, we entered into note hedge transactions with the option counterparties. The note hedge transactions are generallyexpected to reduce the potential dilution upon conversion of the Notes and/or offset any cash payments we are required to make in excess of the principalamount of converted Notes, as the case may be. We also entered into warrant transactions with the option counterparties. However, the warrant transactionscould separately have a dilutive effect to the extent that the market price per share of our common stock exceeds the applicable strike price of the warrants. Theinitial strike price of the warrants was $71.24. Counterparties to the warrants may make adjustments to certain terms of the warrants upon the occurrence ofspecified events, including the announcement of the Stock Purchase Agreement, if the event results in a material change to the trading price of our commonstock or the value of the warrants. To date, two counterparties have given us notices of adjustments reducing their warrant exercise prices.
In connection with establishing their initial hedge of the note hedge and warrant transactions, the option counterparties or their respective affiliates havepurchased shares of our common stock and/or entered into various derivative transactions with respect to our common stock concurrently with or shortly afterthe pricing of the Notes. In addition, the option counterparties or their respective affiliates may modify their hedge positions by entering into or unwinding variousderivatives with respect to our common stock and/or purchasing or selling our common stock or other securities of ours in secondary market transactions prior tothe maturity of the Notes (and are likely to do so during any observation period related to a conversion of Notes or following any repurchase of Notes by us onany fundamental repurchase date or otherwise). This activity could cause or avoid an increase or a decrease in the market price of our common stock or theNotes.
AnyadversechangeintheratingoftheNotesortheCompanymaycausetheirtradingpricetodecline.
While we did not solicit a credit rating on the Company or on the Notes, one rating service has rated both the Notes and the Company. If that rating serviceannounces its intention to put the Company or the Notes on credit watch or lowers its rating on the Company or the Notes below any rating initially assigned tothe Company or the Notes, the trading price of the Notes could decline.
Theaccountingmethodforconvertibledebtsecuritiesthatmaybesettledincash,suchastheNotes,couldhaveamaterialeffectonourreportedfinancialresults.
In May 2008, the Financial Accounting Standards Board (“FASB”) issued FASB Staff Position No. APB 14-1, Accounting for Convertible Debt Instruments ThatMay Be Settled in Cash Upon Conversion (Including Partial Cash Settlement), which has subsequently been codified as Accounting Standards Codification(“ASC”) 470-20, Debt with Conversion and Other Options, which we refer to as ASC 470-20. Under ASC 470-20, an entity must separately account for theliability and equity components of the convertible debt instruments (such as the Notes) that may be settled entirely or partially in cash upon conversion in amanner that reflects the issuer’s economic interest cost. The effect of ASC 470-20 on the accounting for the Notes is that the equity component is required to beincluded in the additional paid-in capital section of stockholders’ equity on our consolidated balance sheet, and the value of the equity component would betreated as debt discount for purposes of accounting for the debt component of the Notes. As a result, we will be required to record a greater amount of non-cashinterest expense in current periods presented as a result of the amortization of the discounted carrying value of the Notes to their face amount over the term ofthe Notes. We will report lower net income in our financial results because ASC 470-20 will require interest to include the current period’s amortization of thedebt discount, which could adversely affect our reported or future financial results, the trading price of our common stock and the trading price of the Notes.
35

Table of Contents
In addition, under certain circumstances, convertible debt instruments (such as the Notes) that may be settled entirely or partly in cash are currently accountedfor utilizing the treasury stock method, the effect of which is that the shares issuable upon conversion of the Notes are not included in the calculation of dilutedearnings per share except to the extent that the conversion value of the Notes exceeds their principal amount. Under the treasury stock method, for dilutedearnings per share purposes, the transaction is accounted for as if the number of shares of common stock that would be necessary to settle such excess, if weelected to settle such excess in shares, are issued. We cannot be sure that the accounting standards in the future will continue to permit the use of the treasurystock method. If we are unable to use the treasury stock method in accounting for the shares issuable upon conversion of the Notes, then our diluted earningsper share would be adversely affected.
36
Table of Contents
Item 1B. Unresolved Staff CommentsNone.
Item 2. PropertiesOur headquarters is located in Sunnyvale, California and consists of owned space aggregating approximately one million square feet. We lease office space inAustralia, Brazil, Canada, France, Germany, Hong Kong, India, Ireland, Israel, Japan, New Zealand, Norway, Singapore, Taiwan, and the United Kingdom. In theUnited States, we lease offices in various locations, including Atlanta, Beaverton, Boston, Champaign, Chicago, Dallas, Detroit, Hillsboro, the Los Angeles Area,Miami, Mountain View, New York, Omaha, San Francisco, and Washington, D.C. Our data centers are operated in locations in the United States, Brazil, Europe,and Asia. In connection with our strategic plan, we are exploring contract terminations and subleases where we feel we no longer need office space.
We believe that our existing facilities will be adequate to meet current requirements, and that suitable additional or substitute space will be available as neededto accommodate any further physical expansion of operations and for any additional sales offices.
Item 3. Legal ProceedingsFor a description of our material legal proceedings, see “Legal Contingencies” in Note 12—“Commitments and Contingencies” in the Notes to our consolidatedfinancial statements, which is incorporated herein by reference.
Item 4. Mine Safety DisclosuresNot applicable.
37

Table of Contents
PART II
Item 5. Market for Registrant’s Common Equity, Related StockholderMatters and Issuer Purchases of Equity SecuritiesMarket Information for Common Stock Yahoo! Inc. common stock is quoted on the NASDAQ Global Select Market under the symbol “YHOO.” The following table sets forth the range of high and lowper share sales prices as reported for each period indicated: 2015 2016 High Low High Low First quarter $ 50.78 $ 41.80 $ 37.28 $ 26.15 Second quarter $ 46.17 $ 38.85 $ 38.19 $ 35.05 Third quarter $ 39.98 $ 27.20 $ 44.92 $ 37.06 Fourth quarter $ 36.39 $ 28.43 $ 44.08 $ 38.24
Stockholders We had 8,672 stockholders of record as of February 10, 2017.
Dividends We have not declared or paid any cash dividends on our common stock. We presently do not have plans to pay any cash dividends in the near future.
Issuer Repurchases of Equity Securities We did not purchase any shares of our common stock during the fourth quarter of 2016.
38

Table of Contents
Performance Graph This performance graph shall not be deemed “filed” for purposes of Section 18 of the Securities Exchange Act of 1934, as amended (the “Exchange Act”), orotherwise subject to the liabilities under that section and shall not be deemed to be incorporated by reference into any filing of Yahoo! Inc. under the SecuritiesAct or the Exchange Act.
The following graph compares, for the five-year period ended December 31, 2016, the cumulative total stockholder return for Yahoo’s common stock, theNASDAQ 100 Index, the Standard & Poor’s North American Technology-Internet Index (the “S&P Internet”), and the Standard & Poor’s 500 Stock Index (the“S&P 500”). Measurement points are the last trading day of each of Yahoo’s fiscal years ended December 31, 2012, 2013, 2014, 2015, and 2016. The graphassumes that $100 was invested at the market close on December 31, 2011 in the common stock of Yahoo, the NASDAQ 100 Index, the S&P Internet, and theS&P 500 and assumes reinvestment of any dividends. The stock price performance on the following graph is not necessarily indicative of future stock priceperformance.
39

Table of Contents
Item 6. Selected Financial DataThe following selected consolidated financial data should be read in conjunction with the consolidated financial statements and notes thereto and“Management’s Discussion and Analysis of Financial Condition and Results of Operations” appearing elsewhere in this Annual Report on Form 10-K. Theconsolidated statements of operations data and the consolidated balance sheets data for the years ended, and as of, December 31, 2012, 2013, 2014, 2015,and 2016 are derived from our audited consolidated financial statements.
Consolidated Statements of Operations Data: Years Ended December 31, 2012 (3) 2013 (4) 2014 (5) 2015 (6) 2016 (7)(8) (in thousands, except per share amounts) Revenue $ 4,986,566 $ 4,680,380 $ 4,618,133 $ 4,968,301 $ 5,169,135 Total operating expenses $ 4,420,198 $ 4,090,454 $ 4,475,191 $ 9,716,795 $ 5,814,193 Income (loss) from operations (1) $ 566,368 $ 589,926 $ 142,942 $ (4,748,494) $ (645,058) Other income (expense), net (2) $ 4,647,839 $ 43,357 $ 10,369,439 $ (75,782) $ (53,916) (Provision) benefit for income taxes $ (1,940,043) $ (153,392) $ (4,038,102) $ 89,598 $ 126,228 Earnings in equity interests $ 676,438 $ 896,675 $ 1,057,863 $ 383,571 $ 363,283 Net income (loss) attributable to Yahoo! Inc. $ 3,945,479 $ 1,366,281 $ 7,521,731 $ (4,359,082) $ (214,321)
Net income (loss) attributable to Yahoo! Inc. commonstockholders per share—basic $ 3.31 $ 1.30 $ 7.61 $ (4.64) $ (0.23)
Net income (loss) attributable to Yahoo! Inc. commonstockholders per share—diluted $ 3.28 $ 1.26 $ 7.45 $ (4.64) $ (0.23)
Shares used in per share calculation—basic 1,192,775 1,052,705 987,819 939,141 949,843
Shares used in per share calculation—diluted 1,202,906 1,070,811 1,004,108 939,141 949,843
(1) Includes: Stock-based compensation expense $ 224,365 $ 278,220 $ 420,174 $ 457,153 $ 491,902 Restructuring charges, net $ 236,170 $ 3,766 $ 103,450 $ 104,019 $ 88,629
(2) Includes: Gain on sale of Alibaba Group shares $ 4,603,322 $ — $ — $ — $ — Gain on sale of Alibaba Group ADSs $ — $ — $ 10,319,437 $ — $ —
40

Table of Contents
(3) Our net income attributable to Yahoo! Inc. for the year ended December 31, 2012 included a pre-tax gain of approximately $4.6 billion and an after-taxgain of $2.8 billion related to our sale to Alibaba Group of 523 million ordinary shares of Alibaba Group (“Alibaba Group shares”). In addition, in the yearended December 31, 2012, we recorded net restructuring charges of $236 million related to our cost reduction initiatives. In the aggregate, these itemshad a net positive impact of $2.6 billion on net income attributable to Yahoo! Inc., or $2.15 per basic share and $2.13 per diluted share, for the yearended December 31, 2012.
(4) Our net income attributable to Yahoo! Inc. for the year ended December 31, 2013 included pre-tax gains of approximately $80 million related to sales of
patents and a goodwill impairment charge of $64 million. In the year ended December 31, 2013, we recorded net restructuring charges of $4 millionrelated to our cost reduction initiatives. The tax impact of these items was $22 million, and in the aggregate, these items had a net negative impact of$10 million on net income attributable to Yahoo! Inc., or $0.01 per both basic and diluted share, for the year ended December 31, 2013.
(5) Our net income attributable to Yahoo! Inc. for the year ended December 31, 2014 included a pre-tax gain of approximately $10.3 billion and an after-tax
gain of $6.3 billion related to our sale of American Depositary Shares (“ADSs”) of Alibaba Group in Alibaba Group’s initial public offering (the “AlibabaGroup IPO”) in September 2014. In addition, in the year ended December 31, 2014, we recorded gains of approximately $98 million related to sales ofpatents, a gain on the Hortonworks Inc. (“Hortonworks”) warrants of $98 million, a goodwill impairment charge of $88 million, and net restructuringcharges of $103 million related to our cost reduction initiatives. The tax impact of these items was $3.9 billion, and in the aggregate, these items had anet positive impact of $6 billion on net income attributable to Yahoo! Inc., or $6.04 per basic share and $5.94 per diluted share, for the year endedDecember 31, 2014.
(6) Our net loss attributable to Yahoo! Inc. for the year ended December 31, 2015 included a goodwill impairment charge of $4,461 million, net restructuring
charges of $104 million related to our cost reduction initiatives, an asset impairment charge of $44 million related to originally developed and acquiredcontent, a loss on the Hortonworks warrants of $19 million, an intangible assets impairment charge of $15 million and gains of approximately $11 millionrelated to sales of patents. The tax impact of these items was a $129 million benefit, and in the aggregate, these items had a net negative impact of$4,503 million on net income attributable to Yahoo! Inc., or $4.79 per both basic share and diluted share, for the year ended December 31, 2015.
(7) Our net loss attributable to Yahoo! Inc. for the year ended December 31, 2016 included a goodwill impairment charge of $395 million, net restructuring
charges of $89 million related to our cost reduction initiatives, a loss on the Hortonworks warrants of $50 million, an intangible assets impairment chargeof $87 million, a gain on sale of land of $120 million and gains of approximately $2 million related to sales of patents. The tax impact of these items was a$25 million benefit, and in the aggregate, these items had a net negative impact of $474 million on net loss attributable to Yahoo! Inc., or $0.50 per bothbasic share and diluted share, for the year ended December 31, 2016.
(8) Commencing in the second quarter of 2016, TAC payments related to the Microsoft Search Agreement, which previously would have been recorded as a
reduction to revenue, began to be recorded as cost of revenue—TAC due to a required change in revenue presentation.
Years Ended December 31, 2014 2015 2016 Cost of revenue - TAC in transitioned markets $ — $ — $ 812,105 Reduction to revenue in transitioned markets $ 1,319,242 $ 1,269,134 $ 273,705
41

Table of Contents
See Note 1—“The Company and Summary of Significant Accounting Policies” and Note 19—“Microsoft Search Agreement” in the Notes to ourconsolidated financial statements for additional information.
Consolidated Balance Sheets Data: December 31, 2012 (1) 2013 (2) 2014 (3) 2015 (4) 2016 (In thousands) Cash and cash equivalents $ 2,667,778 $ 2,077,590 $ 2,664,098 $ 1,631,911 $ 1,119,469 Marketable securities $ 3,354,600 $ 2,919,804 $ 7,558,304 $ 5,201,073 $ 6,790,632 Alibaba Group equity securities $ — $ — $ 39,867,789 $ 31,172,361 $ 33,680,879 Alibaba Group Preference Shares $ 816,261 $ — $ — $ — $ — Working capital $ 4,362,481 $ 3,685,545 $ 4,929,438 $ 6,229,939 $ 6,838,736 Goodwill $ 3,826,749 $ 4,679,648 $ 5,152,570 $ 808,114 $ 415,809 Investments in equity interests $ 2,840,157 $ 3,426,347 $ 2,489,578 $ 2,503,229 $ 3,192,884 Total assets $ 17,103,253 $ 16,804,959 $ 61,707,336 $ 45,203,966 $ 48,083,079 Income taxes payable related to the sale of AlibabaGroup ADSs $ — $ — $ 3,282,293 $ — $ — Long-term deferred tax liabilities related to AlibabaGroup equity securities $ — $ — $ 16,154,906 $ 12,611,867 $ 13,633,988 Long-term liabilities $ 1,207,418 $ 2,334,050 $ 2,251,855 $ 2,235,299 $ 2,077,591 Total Yahoo! Inc. stockholders’ equity $ 14,560,200 $ 13,074,909 $ 38,741,837 $ 29,043,537 $ 31,049,283 (1) During the year ended December 31, 2012, we received $13.54 per Alibaba Group share, or approximately $7.1 billion in total consideration, for the
523 million Alibaba Group shares we sold back to Alibaba Group. Approximately $6.3 billion of the consideration was received in cash and $800 millionwas received in Alibaba Group Preference Shares. We paid cash taxes of $2.3 billion related to the transaction.
(2) During the year ended December 31, 2013, we received net proceeds of $1.4 billion from the issuance of the $1.4375 billion of 0.00% Convertible Notes
due 2018 (the “Notes”) issued in November 2013. See Note 11—“Convertible Notes” in the Notes to our consolidated financial statements for additionalinformation.
(3) During the year ended December 31, 2014, we received net proceeds of $9.4 billion from the sale of Alibaba Group ADSs in Alibaba Group’s IPO. As a
result of the Alibaba Group IPO, we no longer account for Alibaba Group using the equity method of accounting, and reflect our remaining investment asan equity security rather than in investments in equity interests.
(4) During the year ended December 31, 2015, we satisfied the $3.3 billion income tax liability related to the sale of ADSs in Alibaba Group’s IPO in
September 2014.
42

Table of Contents
Item 7. Management’s Discussion and Analysis of Financial Condition andResults of OperationsOverview Yahoo! Inc., together with its consolidated subsidiaries (“Yahoo,” the “Company,” “we,” or “us”), is a guide to digital information discovery, focused on informing,connecting, and entertaining our users through our search, communications, and digital content products. By creating highly personalized experiences, we helpusers discover the information that matters most to them around the world—on mobile or desktop. We create value for advertisers with a streamlined, simpleadvertising technology that leverages Yahoo’s data, content, and technology to connect advertisers with their target audiences. Advertisers can build theirbusinesses through advertising to targeted audiences on our online properties and services (“Yahoo Properties”) and a distribution network of third party entities(“Affiliates”) who integrate our advertising offerings into their websites or other offerings (“Affiliate sites”). Our revenue is generated principally from search anddisplay advertising. We continue to manage and measure our business geographically, principally in the Americas, EMEA (Europe, Middle East, and Africa), andAsia Pacific.
In the following Management’s Discussion and Analysis, we provide information regarding the following areas: • Recent Developments; • Significant Transactions; • Key Financial Metrics; • Results of Operations; • Segment Reporting; • Liquidity and Capital Resources; • Critical Accounting Policies and Estimates; and • Recent Accounting Pronouncements.
Recent Developments
PendingSaleoftheOperatingBusinesstoVerizonCommunicationsInc.
On July 23, 2016, we entered into a Stock Purchase Agreement (the “Original Stock Purchase Agreement”) with Verizon Communications Inc. (“Verizon”),pursuant to which we have agreed to sell, and Verizon has agreed to purchase (the “Sale”), all of the outstanding shares of Yahoo Holdings, Inc., a newly formedwholly-owned subsidiary of Yahoo (“Yahoo Holdings”) (and prior to the sale of Yahoo Holdings, to cause Yahoo Holdings to sell to a foreign subsidiary of Verizonall of the equity interests in a foreign subsidiary of Yahoo Holdings that will hold certain foreign subsidiaries relating to our operating business), which,immediately prior to the consummation of the Sale, will own our operating business. Under the Original Stock Purchase Agreement, the aggregate considerationto be paid to us by Verizon in connection with the Sale was $4,825,800,000 in cash, subject to certain adjustments as provided in the Original Stock PurchaseAgreement.
Concurrently with the execution of the Original Stock Purchase Agreement, we entered into a Reorganization Agreement (the “Original ReorganizationAgreement”) with Yahoo Holdings,
43
Table of Contents
pursuant to which we will transfer to Yahoo Holdings prior to the consummation of the Sale all of our assets and liabilities relating to our operating business,other than specified excluded assets and retained liabilities (the “Reorganization”).
On February 20, 2017, Yahoo and Verizon entered into an Amendment to Stock Purchase Agreement amending the Original Stock Purchase Agreement (the“SPA Amendment” and, together with the Original Stock Purchase Agreement, the “Amended Stock Purchase Agreement”), and, concurrently with the executionof the SPA Amendment, Yahoo and Yahoo Holdings entered into an Amendment to Reorganization Agreement amending the Original ReorganizationAgreement (the “RA Amendment”). Additionally, concurrently with the execution of the SPA Amendment and the RA Amendment, Yahoo, Yahoo Holdings, andVerizon entered into a Settlement and Release Agreement (the “Settlement and Release Agreement”).
The SPA Amendment, among other things, (i) reduced the consideration to be paid by Verizon to Yahoo in connection with the Sale by $350,000,000 to$4,475,800,000, (ii) provided that certain data security incidents to which Yahoo has been subject will be disregarded for purposes of determining whethercertain closing conditions have been satisfied and in determining whether a “Business Material Adverse Effect” has occurred, and (iii) provided that the date afterwhich each of Yahoo and Verizon may terminate the Amended Stock Purchase Agreement if the Closing (as defined in the Amended Stock PurchaseAgreement) has not occurred has been extended to July 24, 2017.
The RA Amendment provides, among other things, that Yahoo and Verizon will each be responsible for 50 percent of certain post-closing cash liabilities relatedto certain data security incidents and other data breaches incurred by the Company.
Under the terms of the Settlement and Release Agreement, among other things, Verizon released certain claims, subject to certain exceptions, it (and itsaffiliates and representatives) may have against the Company (or its affiliates and representatives) relating to certain data security incidents and other databreaches incurred by the Company.
Upon completion of the Sale, Verizon will also receive for its benefit and that of its current and certain of its future affiliates, a non-exclusive, worldwide,perpetual, royalty-free license to certain intellectual property not core to the operating business held by Excalibur IP, LLC, a wholly-owned subsidiary of theCompany (“Excalibur”), that is not being transferred to Yahoo Holdings with the operating business.
The excluded assets include our cash and marketable securities as of the closing of the Sale, our shares in Alibaba Group Holding Limited (“Alibaba Group”) andYahoo Japan Corporation (“Yahoo Japan”), certain other minority equity investments, and all of the equity in Excalibur. The retained liabilities will include the0.00% Convertible Senior Notes due 2018 (“Notes”) we issued in November 2013, securityholder litigation, certain director and officer indemnificationobligations, and, pursuant to the RA Amendment, 50 percent of certain post-closing cash liabilities related to certain data security incidents and other databreaches incurred by Yahoo. Following the closing of the Sale, the excluded assets and retained liabilities will remain in Yahoo which will be renamed Altaba Inc.and will become an independent, publicly traded, management investment company registered under the Investment Company Act of 1940.
The closing of the Sale is subject to certain conditions, including, among others, the approval of the Sale by our stockholders, the closing of the Reorganization,and certain other customary closing conditions.
44

Table of Contents
The Amended Stock Purchase Agreement may be terminated by us or Verizon in certain circumstances. If the Amended Stock Purchase Agreement isterminated, we may be required to pay Verizon a termination fee of $134,274,000 (which was reduced from $144,744,000 pursuant to the SPA Amendment) incertain circumstances, including if we terminate the Amended Stock Purchase Agreement to enter into a superior proposal satisfying certain requirements.
Under the terms of the Amended Stock Purchase Agreement, each of our stock options outstanding immediately prior to the closing will, if not already vested,become fully vested as of the closing and will remain outstanding in accordance with its terms, and we will retain all liabilities and obligations with respect to suchoutstanding stock options. Each restricted stock unit (an “RSU”) of the Company that is outstanding immediately prior to the closing generally will be replacedwith a cash-settled Verizon RSU award, and will be subject to the same vesting and other terms and conditions as the Yahoo RSUs.
The Sale is expected to close in the second quarter of 2017.
We filed a preliminary proxy statement regarding the Sale with the U.S. Securities and Exchange Commission on September 9, 2016.
SecurityIncidents
Description of Events
On September 22, 2016, we disclosed that a copy of certain user account information for approximately 500 million user accounts was stolen from Yahoo’snetwork in late 2014 (the “2014 Security Incident”). The Company believes the user account information was stolen by a state-sponsored actor. The useraccount information taken included names, email addresses, telephone numbers, dates of birth, hashed passwords (the vast majority with the “bcrypt” hashingalgorithm) and, in some cases, encrypted or unencrypted security questions and answers. Our forensic investigation indicates that the stolen information did notinclude unprotected passwords, payment card data, or bank account information. Payment card data and bank account information are not stored in the systemthat the investigation found to be affected. We have no evidence that the state-sponsored actor is currently in or accessing the Company’s network.
On December 14, 2016, we disclosed that, based on our outside forensic expert’s analysis of data files provided to the Company in November 2016 by lawenforcement, we believe an unauthorized third party stole data associated with more than one billion user accounts in August 2013 (the “2013 SecurityIncident”). We have not been able to identify the intrusion associated with this theft, and we believe this incident is likely distinct from the 2014 Security Incident.For potentially affected accounts, the user account information stolen included names, email addresses, telephone numbers, dates of birth, hashed passwords(using the MD5 algorithm) and, in some cases, encrypted or unencrypted security questions and answers. The stolen information did not include passwords inclear text, payment card data, or bank account information.
In November and December 2016, we disclosed that our outside forensic experts were investigating the creation of forged cookies that could allow an intruder toaccess users’ accounts without a password. Based on the investigation, we believe an unauthorized third party accessed the Company’s proprietary code tolearn how to forge certain cookies. The outside forensic experts have identified approximately 32 million user accounts for which they believe forged cookieswere used or taken in 2015 and 2016 (the “Cookie Forging Activity”). We believe that some of this activity is connected to the same state-sponsored actorbelieved to be responsible for the 2014 Security Incident. The forged cookies have been invalidated by the Company so they cannot be used to access useraccounts.
45

Table of Contents
The 2013 Security Incident, the 2014 Security Incident, and the Cookie Forging Activity are collectively referred to herein as the “Security Incidents.” With respectto each of the Security Incidents, the impacted users and appropriate regulatory and law enforcement agencies have been notified.
The Company, with the assistance of outside forensic experts, has concluded its investigation of the Security Incidents. The Company continues to work withU.S. law enforcement authorities on these matters.
Current and Future Expenses and Losses
We recorded expenses of $16 million related to the Security Incidents in the year ended December 31, 2016, of which $5 million was associated with theongoing forensic investigation and remediation activities and $11 million was associated with nonrecurring legal costs. The Security Incidents did not have amaterial adverse impact on our business, cash flows, financial condition, or results of operations for the year ended December 31, 2016. However, we havesubsequently incurred additional expenses related to the Security Incidents to investigate and take remedial actions to notify and protect our users and systems,and expect to continue to incur investigation, remediation, legal, and other expenses associated with the Security Incidents in the foreseeable future. We willrecognize and include these expenses as part of our operating expenses as they are incurred. The Company does not have cybersecurity liability insurance.
Litigation, Claims, and Governmental Investigations
To date, approximately 43 putative consumer class action lawsuits have been filed against the Company in U.S. federal and state courts, and in foreign courts,relating to the Security Incidents. The plaintiffs, who purport to represent various classes of users, generally claim to have been harmed by the Company’salleged actions and/or omissions in connection with the Security Incidents and assert a variety of common law and statutory claims seeking monetary damagesor other related relief. In addition, a putative stockholder class action has been filed against the Company, and certain current officers of the Company, assertingclaims under Sections 10(b) and 20(a) of the Securities Exchange Act of 1934 and seeking class certification, unspecified damages, interest, and an award ofattorney’s fees and costs. Four stockholder derivative actions have also been filed purportedly on behalf of the Company against current and former directorsand officers. See Note 12—“Commitments and Contingencies” in the Notes to our consolidated financial statements for additional information. Additional lawsuitsand claims related to the Security Incidents may be asserted by or on behalf of users, partners, shareholders, or others seeking damages or other related relief.
In addition, the Company is cooperating with federal, state, and foreign governmental officials and agencies seeking information and/or documents about theSecurity Incidents and related matters, including the U.S. Securities and Exchange Commission (“SEC”), the U.S. Federal Trade Commission, the U.S.Attorney’s Office for the Southern District of New York, and two State Attorneys General.
Independent Committee Investigation
As previously disclosed, an independent committee (the “Independent Committee”) of the Board of Directors (the “Board”) has investigated the Security Incidentsand related matters, including the scope of knowledge within the Company in 2014 of access to Yahoo’s network by the state-sponsored actor responsible forthe theft and related incidents, the Company’s internal and external reporting processes and remediation efforts related to the 2014 Security Incident and relatedincidents. The Independent Committee has concluded its investigation, although it will continue to review developments regarding the Security Incidents andreport to the Board on these issues, and cooperate with various government entities. The Independent Committee was assisted by independent counsel,
46

Table of Contents
Sidley Austin LLP, and a forensic expert. The Board has separately been advised by other outside counsel regarding the Security Incidents andrecommendations regarding remedial actions.
Based on its investigation, the Independent Committee concluded that the Company’s information security team had contemporaneous knowledge of the 2014compromise of user accounts, as well as incidents by the same attacker involving cookie forging in 2015 and 2016. In late 2014, senior executives and relevantlegal staff were aware that a state-sponsored actor had accessed certain user accounts by exploiting the Company’s account management tool. The Companytook certain remedial actions, notifying 26 specifically targeted users and consulting with law enforcement. While significant additional security measures wereimplemented in response to those incidents, it appears certain senior executives did not properly comprehend or investigate, and therefore failed to actsufficiently upon, the full extent of knowledge known internally by the Company’s information security team. Specifically, as of December 2014, the informationsecurity team understood that the attacker had exfiltrated copies of user database backup files containing the personal data of Yahoo users but it is unclearwhether and to what extent such evidence of exfiltration was effectively communicated and understood outside the information security team. However, theIndependent Committee did not conclude that there was an intentional suppression of relevant information.
Nonetheless, the Committee found that the relevant legal team had sufficient information to warrant substantial further inquiry in 2014, and they did notsufficiently pursue it. As a result, the 2014 Security Incident was not properly investigated and analyzed at the time, and the Company was not adequatelyadvised with respect to the legal and business risks associated with the 2014 Security Incident. The Independent Committee found that failures incommunication, management, inquiry and internal reporting contributed to the lack of proper comprehension and handling of the 2014 Security Incident. TheIndependent Committee also found that the Audit and Finance Committee and the full Board were not adequately informed of the full severity, risks, andpotential impacts of the 2014 Security Incident and related matters.
Actions the Company is Taking in Response to the Independent Committee’s Findings
Based on the Independent Committee’s findings, the Board has taken the management related actions described below, adopted certain process and structurechanges to address the Company’s issues with respect to the Security Incidents, and taken certain other disciplinary actions.
Management Changes
In response to the Independent Committee’s findings related to the 2014 Security Incident, the Board determined not to award to the Chief Executive Officer acash bonus for 2016 that was otherwise expected to be paid to her. In addition, in discussions with the Board, the Chief Executive Officer offered to forgo any2017 annual equity award given that the 2014 Security Incident occurred during her tenure and the Board accepted her offer.
On March 1, 2017, Ronald S. Bell resigned as the Company’s General Counsel and Secretary and from all other positions with the Company. No payments arebeing made to Mr. Bell in connection with his resignation.
Other Remedial Actions
Additionally, in response to the Independent Committee’s findings and recommendations, the Board has directed the Company to implement or enhance anumber of corrective actions, including revision of its technical and legal information security incident response protocols to help ensure: escalation ofcybersecurity incidents to senior executives and the Board of Directors; rigorous investigation of cybersecurity incidents and engagement of forensic experts asappropriate; rigorous assessment of
47

Table of Contents
and documenting any legal reporting obligations and engagement of outside counsel as appropriate; comprehensive risk assessments with respect tocybersecurity events; effective cross-functional communication regarding cybersecurity events; appropriate and timely disclosure of material cybersecurityincidents; and enhanced training and oversight to help ensure processes are followed.
Significant Transactions
MicrosoftSearchAgreementThe term of the Search and Advertising Services and Sales Agreement (“Microsoft Search Agreement”) with Microsoft Corporation (“Microsoft”) is 10 years fromits commencement date, February 23, 2010, subject to earlier termination as provided in the Microsoft Search Agreement. Under the current terms of theMicrosoft Search Agreement, as amended on April 15, 2015 by the Eleventh Amendment to the Microsoft Search Agreement (the “Eleventh Amendment”), weare entitled to receive a percentage of the revenue (the “Revenue Share Rate”) generated from Microsoft’s services on Yahoo Properties and on Affiliate sitesequal to 93 percent. Microsoft receives its 7 percent revenue share before deduction of the Affiliate site’s share of revenue. Yahoo is responsible for paying theAffiliate for the Affiliate site’s share of revenue. Pursuant to the Eleventh Amendment, commencing on May 1, 2015, we also agreed to request paid searchresults from Microsoft for 51 percent of our search queries originating from personal computers accessing Yahoo Properties and our Affiliate sites and willdisplay only Microsoft’s paid search results on such search result pages.
Traffic acquisition costs (“TAC”) related to our Microsoft Search Agreement were recorded as a reduction to revenue through March 31, 2016. Pursuant to theEleventh Amendment to the Microsoft Search Agreement, we completed the transition of our exclusive sales responsibilities to Microsoft for Microsoft’s paidsearch services to premium advertisers in the United States, Canada, and Europe on April 1, 2016 and in the remaining markets (other than Taiwan and HongKong) on June 1, 2016. Following the transition in each respective market, we are considered the principal in the sale of traffic to Microsoft and other customersbecause we are the primary obligor in our arrangements with Microsoft and have discretion in how search queries from Affiliate sites will be fulfilled andmonetized. As a result, amounts paid to Affiliates under the Microsoft Search Agreement in the transitioned markets are recorded as cost of revenue—TACrather than as a reduction to revenue, resulting in GAAP revenue from the Microsoft Search Agreement being reported on a gross rather than a net basis.
Effective June 3, 2016, Yahoo and Microsoft further amended the Microsoft Search Agreement to provide that sales responsibilities for premium advertisers inTaiwan and Hong Kong will not be transitioned. TAC in those markets will continue to be reported as a reduction to revenue.
The table below presents how we accounted for amounts paid to Affiliates related to the Microsoft Search Agreement in transitioned markets, and shows theimpact of the implementation of the Eleventh Amendment in transitioned markets (in thousands): Years Ended December 31, 2014 2015 2016 Cost of revenue—TAC in transitioned markets (*) $ — $ — $ 812,105 Reduction to revenue in transitioned markets $ 1,319,242 $ 1,269,134 $ 273,705 (*) Includes $701 million in the Americas segment, $106 million in the EMEA segment, and $5 million in the Asia Pacific segment.
48

Table of Contents
Revenue under the Search Agreement represented approximately 35 percent, 35 percent, and 37 percent of our revenue for the years ended December 31,2014, 2015, and 2016, respectively. The increase in revenue from Microsoft from 2015 to 2016 was due to the change in revenue presentation related to theEleventh Amendment that took place in the second quarter of 2016 for which we now account for amounts paid to Affiliates in transitioned markets as cost ofrevenue—TAC rather than as a reduction to GAAP revenue, resulting in revenue from the Microsoft Search Agreement being reported on a gross rather than netbasis. Excluding the impact of the change in revenue presentation related to the Eleventh Amendment, revenue under the Search Agreement representedapproximately 25 percent of our revenue for the year ended December 31, 2016. This was partially offset by a shift in composition of revenue due to the use ofGoogle and Yahoo Gemini (our unified marketplace for search and native advertising on Yahoo Properties and Affiliate sites) to source search results andadvertisements as allowed by the Eleventh Amendment. See Note 19—“Microsoft Search Agreement” in the Notes to our consolidated financial statements foradditional information.
Key Financial Metrics The key financial metrics we use are as follows: revenue; revenue less traffic acquisition costs (“TAC”), or revenue ex-TAC; income (loss) from operations; netincome (loss) attributable to Yahoo! Inc.; adjusted EBITDA; net cash provided by (used in) operating activities; and free cash flow. Revenue ex-TAC, adjustedEBITDA, and free cash flow are financial measures that are not defined in accordance with U.S. generally accepted accounting principles (“GAAP”). We usethese non-GAAP financial measures for internal managerial purposes and to facilitate period-to-period comparisons. See “Non-GAAP Financial Measures” belowfor a description of, and limitations specific to, each of these non-GAAP financial measures. Years Ended December 31, 2014 2015 2016 (in thousands) Revenue $ 4,618,133 $ 4,968,301 $ 5,169,135 Revenue ex-TAC $ 4,400,602 $ 4,090,787 $ 3,518,349 Income (loss) from operations (1) $ 142,942 $ (4,748,494) $ (645,058) Net income (loss) attributable to Yahoo! Inc. $ 7,521,731 $ (4,359,082) $ (214,321) Adjusted EBITDA $ 1,361,548 $ 951,740 $ 872,672 Net cash provided by (used in) operating activities $ 916,350 $ (2,383,422) $ 1,248,863 Free cash flow (2)(3) $ 586,632 $ (3,010,172) $ 1,120,580 (1) Includes:
Stock-based compensation expense $ 420,174 $ 457,153 $ 491,902 Restructuring charges, net $ 103,450 $ 104,019 $ 88,629 Asset impairment charge $ — $ 44,381 $ — Goodwill impairment charge $ 88,414 $ 4,460,837 $ 394,901 Intangible assets impairment charge $ — $ 15,423 $ 87,335
(2) During the year ended December 31, 2015, we satisfied the $3.3 billion income tax liability related to the sale of Alibaba Group American DepositaryShares (“ADSs”) in Alibaba Group’s initial public offering (“Alibaba Group IPO”) in September 2014.
(3) During the year ended December 31, 2016, we received net cash proceeds from the sale of land of $246 million and a cash tax refund of $190 million
associated with our claim to carry back our 2015 losses and tax attributes to earlier taxable years.
49
Table of Contents
Revenueex-TAC. Revenue ex-TAC is a non-GAAP financial measure defined as GAAP revenue less TAC that has been recorded as a cost of revenue. TACconsists of payments made to Affiliates and payments made to companies that direct consumer and business traffic to Yahoo Properties. TAC is recorded eitheras a reduction to revenue or as cost of revenue.
We present revenue ex-TAC to provide investors a metric used by us for evaluation and decision-making purposes and to provide investors with comparablerevenue numbers when comparing to our historical reported financial information. A limitation of revenue ex-TAC is that it is a measure we defined for internaland investor purposes that may be unique to us, and therefore it may not enhance the comparability of our results to those of other companies in our industrywho have similar business arrangements but address the impact of TAC differently. Management compensates for these limitations by also relying on thecomparable GAAP financial measures of revenue and cost of revenue—TAC.
AdjustedEBITDA. Adjusted EBITDA is a non-GAAP financial measure defined as net income (loss) attributable to Yahoo! Inc. before taxes, depreciation,amortization of intangible assets, stock-based compensation expense, other income (expense), net (which includes interest), earnings in equity interests, netincome attributable to noncontrolling interests, and other gains, losses, and expenses that we do not believe are indicative of our ongoing results.
We present adjusted EBITDA because the exclusion of certain gains, losses, and expenses facilitates comparisons of the operating performance of ourCompany on a period-to-period basis. Adjusted EBITDA has limitations as an analytical tool and should not be considered in isolation or as a substitute forresults reported under GAAP. These limitations include: adjusted EBITDA does not reflect tax payments and such payments reflect a reduction in cash availableto us; adjusted EBITDA does not reflect the periodic costs of certain capitalized tangible and intangible assets used in generating revenues in our businesses;adjusted EBITDA does not include stock-based compensation expense related to our workforce; adjusted EBITDA also excludes other income (expense), net(which includes interest), earnings in equity interests, net income attributable to noncontrolling interests and other gains, losses, and expenses that we do notbelieve are indicative of our ongoing results, and these items may represent a reduction or increase in cash available to us; and adjusted EBITDA is a measurethat may be unique to us, and therefore it may not enhance the comparability of our results to other companies in our industry. Management compensates forthese limitations by also relying on the comparable GAAP financial measure of net income (loss) attributable to Yahoo! Inc., which includes taxes, depreciation,amortization, stock-based compensation expense, other income (expense), net (which includes interest), earnings in equity interests, net income attributable tononcontrolling interests and the other gains, losses and expenses that are excluded from adjusted EBITDA.
FreeCashFlow. Free cash flow is a non-GAAP financial measure defined as net cash provided by (used in) operating activities (adjusted to include excesstax benefits from stock-based awards), less acquisition of property and equipment, net (i.e., acquisition of property and equipment less proceeds received fromdisposition of property and equipment including land) and dividends received from equity investees.
We consider free cash flow to be a liquidity measure which provides useful information to management and investors about the amount of cash generated bybusiness operations, after deducting our net payments for acquisitions and dispositions of property and equipment, which cash can then be used for strategicopportunities or other business purposes including, among others, investing in our business, making strategic acquisitions, strengthening the balance sheet, andrepurchasing stock. A limitation of free cash flow is that it does not represent the total increase or decrease in the cash balance for the period. Managementcompensates for this limitation by also
50

Table of Contents
relying on the net change in cash and cash equivalents as presented in our consolidated statements of cash flows prepared in accordance with GAAP whichincorporates all cash movements during the period.
In this Management’s Discussion and Analysis, we also present adjusted GAAP revenue and cost of revenue—TAC amounts for the year ended December 31,2016 that exclude the effect of the change in revenue presentation related to implementation of the Eleventh Amendment to the Microsoft Search Agreement.We believe providing this additional information to investors is useful because it provides investors with comparable revenue and cost of revenue—TACmeasures for comparison to our historical reported financial information.
RevenueandRevenueex-TAC(anon-GAAPFinancialMeasure)
Years Ended December 31, 2014-2015 2015-2016 2014 2015 2016 % Change % Change
(dollars in thousands) Revenue $4,618,133 $4,968,301 $5,169,135 8% 4% Less: TAC 217,531 877,514 1,650,786 303% 88%
Revenue ex-TAC $4,400,602 $4,090,787 $3,518,349 (7)% (14)%
For the year ended December 31, 2016, revenue and TAC increased $201 million and $773 million, respectively, or 4 percent and 88 percent, compared to2015. For the year ended December 31, 2016, revenue ex-TAC (a non-GAAP financial measure) decreased $572 million, or 14 percent, compared to 2015. Theincrease in revenue for the year ended December 31, 2016 was primarily attributable to an increase in search revenue of $559 million, partially offset by declinesin other revenue and display revenue of $254 million and $104 million, respectively.
The increase in search revenue was primarily due to the change in revenue presentation related to the implementation of the Eleventh Amendment to theMicrosoft Search Agreement, as noted above. The revenue and TAC increase from the change in revenue presentation was $812 million for the year endedDecember 31, 2016. Excluding the impact of the change in revenue presentation, search revenue declined $253 million, or 12 percent, primarily in the Americassegment due to a decline in Paid Clicks on Yahoo Properties and Affiliate sites driven by a decline in traffic, partially offset by an increase in Affiliate site revenuedue to improved pricing.
The decline in display revenue was primarily associated with a decline in revenue on Affiliate sites due to a decline in video advertising and, to a lesser extent,audience advertising, partially offset by an increase in native advertising. This was partially offset by an increase in display revenue from Yahoo Properties forthe year ended December 31, 2016. The increase in display revenue from Yahoo Properties was primarily due to an increase in audience advertising, and to alesser extent, video advertising, partially offset by a decline in premium advertising and, to a lesser extent, native advertising.
The decline in other revenue was primarily attributable to the completion of recognition of deferred revenue under the Technology and Intellectual PropertyLicense Agreement (“TIPLA”) with Alibaba Group pursuant to which we recognized $199 million in the year ended December 31, 2015 (for which no similarrevenue was recognized in 2016), and a decline in listings-based revenue of $36 million due to a decline in e-commerce revenue and a directory product shutdown in 2015.
51

Table of Contents
Total revenue and TAC noted above included declines of $77 million and $40 million, respectively, for the year ended December 31, 2016 as compared to thesame period of 2015, associated with the agreement we entered into with Mozilla Corporation (“Mozilla”) in November 2014 to compensate Mozilla for making usthe default search provider on certain of Mozilla’s products in the United States. The decline in total revenue was due to a decline in Firefox browser searchvolume, while the decline in TAC was associated with an amendment to the Mozilla Agreement in the third quarter of 2016.
For the year ended December 31, 2015, revenue and TAC increased $350 million and $660 million, respectively, or 8 percent and 303 percent, compared to2014. For the year ended December 31, 2015, revenue ex-TAC (a non-GAAP financial measure) decreased $310 million, or 7 percent, compared to 2014. Theincrease in revenue for the year ended December 31, 2015 was primarily attributable to an increase in search and display revenue resulting from an increase inrevenue from distribution partners, including Mozilla, revenue from mobile devices and incremental revenue from the BrightRoll acquisition, a programmaticvideo advertising platform that we acquired in December 2014. This growth was partially offset by declines in our legacy desktop display business, searchrevenue driven by a decline in Yahoo search traffic, and a decline in other revenue associated with Alibaba Group royalty revenue pursuant to the TIPLA, forwhich we ceased recognizing fees revenue in September 2014 due to our sale of American Depositary Shares (“ADSs”) of Alibaba Group in the Alibaba Group’sinitial public offering (the “Alibaba Group IPO”). The increase in TAC for the year ended December 31, 2015, which exceeded the revenue increases for thesame period resulting in a decline in revenue ex-TAC, was primarily driven by higher payments to distribution partners, including Mozilla, TAC increaseassociated with Yahoo Gemini, and incremental TAC related to the BrightRoll acquisition. Yahoo Gemini is our unified marketplace for search and nativeadvertising on Yahoo Properties and Affiliate sites. Gemini ads appear on search results pages in response to queries and also as native ads alongside displaycontent. Advertisers place ads on the Gemini platform through our simple self-serve interface, as well as through Yahoo’s traditional sales force; we do notsource Gemini ads from Microsoft or other third-party providers. Because we are the primary obligor to Gemini advertisers, we recognize Gemini revenue grossof the related TAC paid to Affiliates.
Of the $350 million increase in revenue and $660 million increase in TAC for the year ended December 31, 2015, $394 million and $375 million were attributableto the agreement we entered into in November 2014 to compensate Mozilla for making us the default search provider on certain of Mozilla’s products in theUnited States.
See “Results of Operations” for a more detailed discussion of the factors that contributed to the changes in revenue and TAC during this period.
Mavens Revenue
One of our primary strategies is to invest in and grow our Mavens offerings. Revenue from our Mavens offerings is generated from, without duplication, (i) mobile(as defined below), (ii) video ads and video ad packages, (iii) native ads, and (iv) Tumblr and Polyvore ads and fees.
Mavens revenue for the year ended December 31, 2016 increased to $2,010 million, compared to $1,660 million for the year ended December 31, 2015. Thechange in revenue presentation associated with the Eleventh Amendment to the Microsoft Search Agreement contributed $386 million to Mavens revenue in theyear ended December 31, 2016. Excluding the impact of the revenue presentation noted above, Mavens revenue would have been $1,624 million for the yearended December 31, 2016, a decline of $36 million, or 2 percent, compared to the same period of 2015. The decline in Mavens revenue for the year endedDecember 31, 2016 was primarily attributable to a decline in video advertising on Affiliate sites associated with pricing and demand, partially offset by anincrease in mobile advertising and, to a lesser extent, social advertising.
52
Table of Contents
Mavens revenue for the year ended December 31, 2015 increased 45 percent to $1,660 million, compared to $1,148 million for the year ended December 31,2014. The increase in Mavens revenue for the year ended December 31, 2015 was primarily related to growth in mobile advertising, and to a lesser extent,growth in native and video advertising.
Mobile Revenue
With the significant platform shift to mobile devices, including smartphones and tablets, we continue to focus on mobile products and mobile ad formats. Wehave continued to refresh the user experience on mobile with the launch of Yahoo Newsroom, Yahoo Fantasy Sports, Yahoo Sports, Yahoo Finance and YahooView apps. As of December 31, 2016, we had more than 650 million monthly mobile users (including mobile Tumblr users).
Mobile revenue is generated in connection with user activity on mobile devices, including smartphones and tablets (a “device-based” approach), regardless ofwhether the device is accessing a mobile-optimized service. Mobile revenue is primarily generated by search and display advertising. Mobile search revenue isgenerated from clicks on text-based links to advertisers’ websites that appear primarily on search results pages. Search revenue is recognized based on PaidClicks. A Paid Click occurs when an end-user clicks on a sponsored listing on Yahoo Properties or Affiliate sites for which an advertiser pays on a per clickbasis. Mobile display revenue is generated from the display of graphical, non-graphical, and video advertisements on mobile devices. The Company recognizesrevenue from display advertising on Yahoo Properties and Affiliate sites as impressions of or clicks on display advertisements are delivered. Impressions aredelivered when a sold advertisement appears in pages viewed by users. Clicks are delivered when a user clicks on a native advertisement. Mobile revenue alsoincludes leads, listings and fees revenue and e-commerce revenue allocated to user activity on mobile devices. Mobile revenue is included within Search,Display, and Other revenue that we have reported.
Mobile revenue for the year ended December 31, 2016 increased to $1,494 million, compared to $1,048 million for the year ended December 31, 2015. Thechange in revenue presentation associated with the Eleventh Amendment to the Microsoft Search Agreement contributed $386 million to mobile revenue in theyear ended December 31, 2016. Excluding the impact of the revenue presentation, noted above, mobile revenue would have been $1,107 million for the yearended December 31, 2016, an increase of $60 million, or 6 percent, compared to the same period of 2015. The increase in mobile revenue for the year endedDecember 31, 2016 was primarily attributable to growth in graphical display advertising revenue as well as an increase in search advertising revenue (excludingthe impact of the change in revenue presentation) driven by Yahoo Gemini search.
Mobile revenue for the year ended December 31, 2015 increased 36 percent to $1,048 million, compared to $768 million for the year ended December 31, 2014.The increase in mobile revenue for the year ended December 31, 2015 was primarily attributable to growth in display revenue on mobile devices driven by nativeadvertising and growth in search revenue on mobile devices driven by mobile search advertising on our Yahoo Gemini platform.
TAC rates that we pay to Affiliates for Mavens and mobile are substantially consistent with our TAC rates for our other revenue streams.
53

Table of Contents
Results of Operations Years Ended December 31, 2014 2015 2016 (dollars in thousands) Total revenue $ 4,618,133 $ 4,968,301 $ 5,169,135 Total operating expenses (1) 4,475,191 9,716,795 5,814,193
Income (loss) from operations $ 142,942 $ (4,748,494) $ (645,058)
(1) Includes: Stock-based compensation expense $ 420,174 $ 457,153 $ 491,902 Restructuring charges, net $ 103,450 $ 104,019 $ 88,629 Asset impairment charge $ — $ 44,381 $ — Goodwill impairment charge $ 88,414 $ 4,460,837 $ 394,901 Intangible assets impairment charge $ — $ 15,423 $ 87,335
Items as a percentage of revenue Total revenue 100% 100% 100% Total operating expenses 97% 196% 112%
Income (loss) from operations 3% (96)% (12)%
Includes: Stock-based compensation expense 9% 9% 10%
Revenue
We generate revenue principally from search and display advertising on Yahoo Properties and Affiliate sites, with the majority of our revenue coming fromadvertising on Yahoo Properties. Our margins on revenue from advertising on Yahoo Properties are higher than our margins on revenue from advertising onAffiliate sites, as we pay TAC to our Affiliates. Additionally, we generate revenue from other sources including listings-based services, e-commerce transactions,royalties, patent licenses, and consumer and business fee-based services.
In the first quarter of 2016, we reclassified certain amounts from other revenue to either search or display revenue. To conform to the current presentation, wereclassified $29.7 million and $11.6 million to search and display revenue, respectively, previously included in other revenue for the year ended December 31,2015, and we reclassified $39.1 million and $12.1 million to search and display revenue, respectively, previously included in other revenue for the year endedDecember 31, 2014.
Search Revenue
Search revenue is generated from mobile and desktop clicks on text-based links to advertisers’ websites that appear primarily on search results pages (“searchadvertising”). We recognize revenue from search advertising on Yahoo Properties and Affiliate sites. Search revenue is recognized based on Paid Clicks. A PaidClick occurs when an end-user clicks on a sponsored listing on Yahoo Properties or Affiliate sites for which an advertiser pays on a per click basis. In October2015, we reached an agreement with Google that provides us with additional flexibility to choose among suppliers of search results and ads. Google’s offeringscomplement the search services provided by Microsoft and Yahoo Gemini. We are considered the principal in the sale of traffic to Microsoft (in markets that havetransitioned pursuant to the Eleventh Amendment to the Microsoft Search
54

Table of Contents
Agreement) and Google because we are the primary obligor in our arrangements with Microsoft (in transitioned markets) and Google and have discretion in howsearch queries from Affiliate sites will be fulfilled and monetized. We perform the search service for mobile ads served through Yahoo Gemini, and, accordingly,we are considered the primary obligor to the advertisers who are the customers of the search advertising service. Revenue from Affiliates is reported gross ofTAC payments for Microsoft (in markets that have transitioned pursuant to the Eleventh Amendment to the Microsoft Search Agreement), Google and YahooGemini. We also generate search revenue from a revenue sharing arrangement with Yahoo Japan for search technology and services as reported.
The following table presents search revenue and search revenue as a percentage of total revenue for the periods presented (dollars in thousands): Years Ended December 31, 2014 2015 2016 Search
Yahoo Properties $ 1,557,159 $ 1,839,420 $ 1,802,546 Affiliate sites 274,826 274,428 870,554
Total search revenue $ 1,831,985 $ 2,113,848 $ 2,673,100
Search as a percentage of total revenue Yahoo Properties 34% 37% 35% Affiliate sites 6% 6% 17%
Total search revenue 40% 43% 52%
Search revenue for the year ended December 31, 2016 increased $559 million, compared to 2015. The increase in search revenue was primarily due to thechange in the revenue presentation associated with the Eleventh Amendment to the Microsoft Search Agreement that took place in the second quarter of 2016for which we now record amounts paid to Affiliates in transitioned markets as cost of revenue—TAC rather than as a reduction to GAAP revenue, resulting inrevenue from the Microsoft Search Agreement being reported on a gross rather than net basis. The revenue and TAC increase from the change in revenuepresentation was $812 million for the year ended December 31, 2016. See “Significant Transactions—Microsoft Search Agreement,” above, for further detail.Excluding the impact of the change in revenue presentation, noted above, search revenue for the year ended December 31, 2016 declined $253 million, or12 percent, primarily in the Americas segment due to a decline in Paid Clicks on Yahoo Properties and Affiliate sites driven by a decline in traffic. A decline inrevenue of $77 million associated with the Mozilla Agreement also contributed to the decline in search revenue on Yahoo Properties. For the year endedDecember 31, 2016, despite the decline in Paid Clicks on Affiliate sites, advertising revenue on Affiliate sites grew by $112 million (excluding the impact of thechange in revenue presentation) primarily from improved Price-per-Click in the Americas segment due to a significant reduction in lower monetizing Affiliateclicks as compared to the same period of 2015.
Search revenue for the year ended December 31, 2015 increased $282 million, or 15 percent, compared to 2014, which was attributable to growth in revenuegenerated on Yahoo Properties in the Americas segment. This increase resulted from higher search volume on desktop due primarily to the Mozilla Agreement,which contributed $394 million, as well as an increase in revenue from search advertising on mobile devices. The increase was partially offset by a decline inclick volume on other visits to Yahoo Properties. Affiliate search revenue overall remained flat but consisted of declines in the Asia Pacific and EMEA segmentsof $30 million and $13 million, respectively, partially offset by an increase in the Americas segment of $42 million.
55

Table of Contents
The total increase in search revenue for the year ended December 31, 2015 described above included the impact of unfavorable foreign exchange fluctuationsof $41 million using the foreign currency exchange rates from the year ended December 31, 2014.
Display Revenue
Display revenue is generated from the display of graphical, non-graphical, and video advertisements (“display advertising”). We earn revenue from guaranteed or“premium” display advertising by delivering advertisements according to advertisers’ specified criteria, such as number of impressions during a fixed periodtargeted to a specific audience or on a specific placement. Also, we earn revenue from non-guaranteed display advertising, which includes native advertising, bydelivering advertisements on a preemptible basis.
We recognize revenue from display advertising on Yahoo Properties and Affiliate sites as impressions of or clicks on display advertisements, including nativeadvertising, are delivered. Impressions are delivered when a sold advertisement appears in pages viewed by users. Clicks are delivered when a user clicks onan advertisement. Arrangements for these services generally have terms of up to one year. For display advertising on Affiliate sites, we pay TAC to Affiliates forthe revenue generated from the display of these advertisements on the Affiliate sites. The display revenue derived from these arrangements that involve trafficsupplied by Affiliates is reported on a gross basis (before deducting the TAC paid to Affiliates as cost of revenue—TAC) when we are the primary obligor to theadvertisers who are the customers of the display advertising service.
The following table presents display revenue and display revenue as a percentage of total revenue for the periods presented (dollars in thousands): Years Ended December 31, 2014 2015 2016 Display
Yahoo Properties $ 1,702,787 $ 1,490,650 $ 1,530,094 Affiliate sites 177,330 595,104 451,441
Total display revenue $ 1,880,117 $ 2,085,754 $ 1,981,535
Display as a percentage of total revenue Yahoo Properties 37% 30% 29% Affiliate sites 4% 12% 9%
Total display revenue 41% 42% 38%
During the first quarter of 2016, we changed the account coding for certain transactions to properly reflect the allocation of display revenue between YahooProperties and Affiliate sites. Prior period amounts have been revised to conform to the current presentation.
Display revenue for the year ended December 31, 2016 decreased $104 million, or 5 percent, compared to 2015, due to a decline in advertising revenue fromAffiliate sites of $144 million, partially offset by an increase in advertising revenue from Yahoo Properties of $39 million. The decline in display revenue onAffiliate sites was attributable to a decline in video advertising driven by volume and pricing declines. The increase in display revenue on Yahoo Properties wasprimarily due to an increase in audience advertising driven by increases in volume and pricing, partially offset by a decline in volume and pricing of premiumadvertising.
56

Table of Contents
The total decrease in display revenue for the year ended December 31, 2016 described above included the impact of unfavorable foreign exchange fluctuationsof $22 million using the foreign currency exchange rates from the year ended December 31, 2015.
Display revenue for the year ended December 31, 2015 increased $206 million, or 11 percent, compared to 2014. For the year ended December 31, 2015, theincrease in display revenue was driven by increased Affiliate revenue in the Americas, EMEA and Asia Pacific segments of $335 million, $48 million and$34 million, respectively. This was partially offset by declines in display revenue on Yahoo Properties in the Americas, EMEA and Asia Pacific segments of$97 million, $57 million and $59 million, respectively. The increase in Affiliate display revenue for the year ended December 31, 2015 resulted primarily from anincrease in video and native advertising, including incremental revenue from the BrightRoll acquisition and an increase in revenue from native advertising onmobile devices. The decrease in display revenue on Yahoo Properties in the Americas segment for the year ended December 31, 2015 was primarily due to adecline in volume of premium advertising as well as a decline in pricing and volume of audience advertising, partially offset by an increase in native advertising.The decrease in display revenue on Yahoo Properties in the EMEA and Asia Pacific segments for the year ended December 31, 2015 was primarily driven bydeclines in volume and pricing of premium and audience advertising, partially offset by an increase in volume of native advertising.
The total increase in display revenue for the year ended December 31, 2015 described above included the impact of unfavorable foreign exchange fluctuationsof $68 million using the foreign currency exchange rates from the year ended December 31, 2014.
Other Revenue
Other revenue includes listings-based services revenue, transaction revenue, royalties, patent licenses and fees revenue. Listings-based services revenue isgenerated from a variety of consumer and business listings-based services, including classified advertising, such as Yahoo Local and other services. Werecognize listings-based services revenue when the services are performed. Transaction revenue is generated from facilitating commercial transactions throughYahoo Properties, principally from Yahoo Small Business, Yahoo Travel, and Yahoo Shopping. We recognize transaction revenue when there is evidence thatqualifying transactions have occurred. We also receive royalties from Yahoo Japan that are recognized when earned. We received royalties from Alibaba Groupthrough the third quarter of 2015 that were recognized when earned. See Note 8—“Investments in Equity Interests Accounted for Using the Equity Method ofAccounting” in the Notes to our consolidated financial statements for additional information on revenue earned from Yahoo Japan and Alibaba Group. Feesrevenue consists of revenue generated from a variety of consumer and business fee-based services as well as services for small businesses. We recognize feesrevenue when the services are performed.
The following table presents other revenue and other revenue as a percentage of total revenue for the periods presented (dollars in thousands): Years Ended December 31, 2014 2015 2016 Other revenue $ 906,031 $ 768,699 $ 514,500 Other revenue as a percentage of total revenue 19% 15% 10%
Other revenue for the year ended December 31, 2016 decreased $254 million, or 33 percent, compared to 2015, primarily attributable to a decline in fees andlistings-based revenue of
57

Table of Contents
$218 million and $36 million, respectively. The decline in fees revenue was primarily due to the completion of recognition of deferred revenue under the TIPLAwith Alibaba Group pursuant to which we recognized $199 million in the year ended December 31, 2015. The decline in listings-based revenue for the yearended December 31, 2016 was primarily attributable to a decline in e-commerce revenue and a directory product that we shut down in 2015.
Other revenue for the year ended December 31, 2015 decreased $137 million, or 15 percent, compared to 2014, primarily attributable to a decline in fees andlistings-based revenue of $79 million and $59 million, respectively. The decline in fees revenue was primarily attributable to a decline in Alibaba Group royaltyrevenue pursuant to the TIPLA, for which we ceased recognizing fees revenue in September 2014 due to the Alibaba Group IPO. The decline in listings-basedrevenue was attributable to a decline in auction and exchange fees, shopping traffic, and expiration of a partner agreement. The decline in fees and listings-based revenue was also attributable to declines in Yahoo Small Business associated with a reduction in its subscriber base.
The decline in other revenue for the year ended December 31, 2015 described above included the impact of unfavorable foreign exchange fluctuations of$10 million using the foreign currency exchange rates from the year ended December 31, 2014.
SearchandDisplayMetrics
We present information below regarding the number of “Paid Clicks” and “Price-per-Click” for search and the number of “Ads Sold” and “Price-per-Ad” fordisplay. This information is derived from internal data.
“Paid Clicks” are defined as clicks by end-users on sponsored search listings (excluding native ad units, which are defined as display ads that appear in thecontent streams viewed by users) on Yahoo Properties and Affiliate sites. Advertisers generally pay for sponsored search listings on a per-click basis. “Searchclick-driven revenue” is gross search revenue (GAAP search revenue plus the related revenue share with third parties), excluding search revenue from YahooJapan. “Price-per-Click” is defined as search click-driven revenue divided by our total number of Paid Clicks.
“Ads Sold” consist of display ad impressions for paying advertisers on Yahoo Properties and Affiliate sites. “Price-per-Ad” is defined as display revenue fromYahoo Properties and Affiliate sites divided by our total number of Ads Sold. Our price and volume metrics for display are based on display revenue which wereport on a gross basis (before TAC), and include data for graphical, sponsorship, and native ad units on Yahoo Properties and Affiliate sites.
We periodically review, refine and update our methodologies for monitoring, gathering, and counting number of Paid Clicks and Ads Sold and for calculatingsearch click-driven revenue, Price-per-Click, and Price-per-Ad. Commencing in the first quarter 2015, our display price and volume metrics (Price-per-Ad andAds Sold) include (a) results from Yahoo Properties worldwide (other than Japan, where Yahoo branded sites are operated by third-party licensees), whereaspreviously those metrics excluded countries and regions where historical data was not previously retained in a manner that would supportperiod-to-period comparisons; (b) results from Affiliate sites (including Affiliates of Flurry and BrightRoll) and (c) historical Tumblr data. Prior period amounts havebeen updated to conform to the current presentation.
Search Metrics
For the year ended December 31, 2016, Paid Clicks decreased 22 percent and Price-per-Click increased 10 percent, compared to 2015. The decline in PaidClicks was primarily due to a decline in
58

Table of Contents
Paid Clicks on Affiliate sites and Yahoo Properties, including on desktop, due to a decline in traffic. The increase in Price-per-Click was due to a mix shift towardYahoo Properties and higher monetizing Affiliate clicks, which resulted from a significant reduction in lower monetizing Affiliate clicks. Search click-drivenrevenue declined 14 percent for the year ended December 31, 2016, as compared to the same period of 2015, driven by the decline in traffic on YahooProperties and Affiliate sites.
For the year ended December 31, 2015, Paid Clicks increased 6 percent and Price-per-Click increased 2 percent, compared to 2014. The increase in Paid Clicksfor the year ended December 31, 2015 was primarily attributable to an increase in Paid Clicks on Yahoo Properties in the Americas segment, attributable to ouragreements with Mozilla and other distribution partners, partially offset by a decline in Paid Clicks from Affiliate and Yahoo traffic. The increase inPrice-per-Click for year ended December 31, 2015 was attributable to a higher mix of traffic from the Americas segment, which is higher monetizing as comparedto other segments, as well as improved pricing from Affiliate traffic. Improvements in the search metrics resulted in year-over-year growth of 9 percent in searchclick-driven revenue for the year ended December 31, 2015.
Display Metrics
For the year ended December 31, 2016, number of Ads Sold increased 4 percent and Price-per-Ad decreased 8 percent, compared to 2015. The increase innumber of Ads Sold was primarily due to an increase in native and audience Ads Sold, partially offset by a decline in premium Ads Sold. Native ad unitsrepresented approximately 46 percent of total Ads Sold for the year ended December 31, 2016 compared to 44 percent of total Ads Sold for the year endedDecember 31, 2015. Native Ads Sold grew primarily due to our syndication (third-party, affiliate) business and an increase in native Ads Sold internationally. Thedecrease in Price-per-Ad was primarily due to a decline in overall pricing of premium, video and native Ads Sold, partially offset by an increase in pricing ofaudience Ads Sold on both Yahoo Properties and Affiliate sites.
For the year ended December 31, 2015, number of Ads Sold increased 12 percent and Price-per-Ad increased 2 percent, compared to 2014. The increase inAds Sold year-over-year for the year ended December 31, 2015 was attributable to an increase in native and video ad units sold which was partially offset by adecline in premium ad units sold. The increase in native ad units sold was primarily attributable to growth internationally and growth in our network of mobileapps. Native ad units represented approximately 44 percent of total Ads Sold for the year ended December 31, 2015, as compared to 31 percent of total AdsSold for the year ended December 31, 2014. The increase in Price-per-Ad was due to improved pricing for native advertising and video representing a largershare of the inventory mix, partially offset by a shift in the mix of Ads Sold from premium advertising to native advertising.
OperatingCostsandExpenses
Cost of Revenue—TAC
Cost of revenue—TAC consists of payments made to third-party entities that have integrated our advertising offerings into their websites or other offerings andpayments made to companies that direct consumer and business traffic to Yahoo Properties. We enter into agreements of varying duration that involve TAC.There are generally two economic structures of the Affiliate agreements: (i) variable payments based on a percentage of our revenue or based on a certainmetric, such as number of searches or paid clicks, or (ii) fixed payments with or without a guaranteed minimum amount of traffic delivered. We expense TACunder two different methods. Agreements based on a percentage of revenue, number of searches, or other metrics are expensed based on the volume of theunderlying activity or revenue multiplied by the agreed-upon price or rate. Agreements with fixed
59

Table of Contents
payments are expensed ratably over the term the fixed payment covers or as traffic is delivered. We have an agreement to compensate Mozilla for making usthe default search provider on certain of Mozilla’s products in the United States. We record those payments as cost of revenue—TAC. Additionally, pursuant tothe Eleventh Amendment to the Microsoft Search Agreement, we now record amounts paid to Affiliates under the Microsoft Search Agreement in transitionedmarkets as cost of revenue—TAC rather than as a reduction to revenue.
The following table presents cost of revenue—TAC and those expenses as a percentage of revenue for the periods presented (dollars in thousands): Years Ended December 31, 2014 2015 2016 Cost of revenue—TAC $ 217,531 $ 877,514 $ 1,650,786 Cost of revenue—TAC as a percentage of revenue 5% 18% 32%
Cost of revenue—TAC for the year ended December 31, 2016 increased $773 million, or 88 percent, compared to 2015, primarily due to the change in revenuepresentation related to the implementation of the Eleventh Amendment to the Microsoft Search Agreement that took place in the second quarter of 2016 forwhich we now record amounts paid to Affiliates in transitioned markets as cost of revenue—TAC rather than as a reduction to GAAP revenue, resulting inrevenue from the Microsoft Search Agreement being reported on a gross rather than net basis. The revenue and TAC increase from the change in revenuepresentation was $812 million for the year ended December 31, 2016. See “Significant Transactions—Microsoft Search Agreement” above for further detail. Forthe year ended December 31, 2016, excluding the impact of the change in revenue presentation, TAC decreased $39 million or 4 percent. The decline in cost ofrevenue—TAC for the year ended December 31, 2016 was attributable to declines in display TAC of $113 million and TAC associated with the MozillaAgreement of $40 million due to an amendment entered into in the third quarter of 2016. This was partially offset by an increase in search TAC primarily fromYahoo Gemini.
Cost of revenue—TAC for the year ended December 31, 2015 increased $660 million, or 303 percent, compared to 2014, primarily due to increased payments todistribution partners (including Mozilla which contributed $375 million) as well as increased TAC associated with Yahoo Gemini, and incremental TAC from theBrightRoll acquisition.
Cost of Revenue—Other
Cost of revenue—other consists of bandwidth costs, stock-based compensation, content and other expenses associated with the production and usage of YahooProperties, including content expense and amortization of developed technology and patents. Cost of revenue—other also includes costs for Yahoo’s technologyplatforms and infrastructure, including depreciation expense and other operating costs, directly related to revenue generating activities.
The following table presents cost of revenue—other and those expenses as a percentage of revenue for the periods presented (dollars in thousands): Years Ended December 31, 2014 2015 2016 Cost of revenue—other $ 1,169,844 $ 1,200,234 $ 1,068,108 Cost of revenue—other as a percentage of revenue 25% 24% 21%
60

Table of Contents
Cost of revenue—other for the year ended December 31, 2016 decreased $132 million, or 11 percent, compared to 2015, primarily due to declines in contentexpense of $65 million, compensation costs of $24 million, credit card costs of $16 million, depreciation and amortization of $13 million, maintenance contracts of$5 million and outside service provider expense of $4 million. The decline in content expense was primarily due to original content production costs in 2015 forwhich we have no similar costs in 2016.
Cost of revenue—other increased $30 million, or 3 percent, for the year ended December 31, 2015, compared to 2014, primarily due to higher cost of revenue of$48 million related to algorithmic serving costs, our e-commerce business in the Asia Pacific segment, BrightRoll video advertising fees, an increase indepreciation and amortization expense of $16 million, and an increase in content expense of $13 million. This increase in cost of revenue—other was partiallyoffset by declines in bandwidth costs of $21 million, stock-based compensation expense of $10 million, and compensation costs of $17 million.
Sales and Marketing
Sales and marketing expenses consist primarily of advertising and other marketing-related expenses, compensation-related expenses (including stock-basedcompensation expense), sales commissions, and travel costs.
The following table presents sales and marketing expenses and those expenses as a percentage of revenue for the periods presented (dollars in thousands): Years Ended December 31, 2014 2015 2016 Sales and marketing expenses $ 1,084,438 $ 1,080,718 $ 881,521 Sales and marketing expenses as a percentage of revenue 24% 22% 17%
Sales and marketing expenses for the year ended December 31, 2016 decreased $199 million, or 18 percent, compared to 2015, primarily due to declines incompensation costs of $88 million, marketing and public relations expense of $58 million, bad debt expense of $28 million, outside service provider expense of$11 million, travel and entertainment expense of $9 million, and facilities expense of $3 million. The decline in compensation costs was primarily attributable to a19 percent decrease in headcount year-over-year. The decline in marketing and public relations expense was primarily attributable to brand marketingcampaigns in 2015 for which there were no similar campaigns in 2016. The decline in bad debt expense reflected improved collections of total and agedaccounts receivable balances.
Sales and marketing expenses for the year ended December 31, 2015 decreased $4 million compared to 2014, primarily attributable to declines in compensationcosts of $52 million, stock-based compensation expense of $4 million and travel and entertainment expense of $4 million, partially offset by increases inmarketing expense of $38 million, bad debt expense of $14 million, and outside service provider expense of $5 million. The decline in compensation costs wasprimarily attributable to a 17 percent decrease in headcount year-over-year. The increase in marketing expense was primarily due to costs associated with apartner deal entered into in 2015 and brand marketing campaigns in 2015 for which there were no similar campaigns in 2014.
Product Development
Product development expenses consist primarily of compensation-related expenses (including stock-based compensation expense) incurred for the developmentof, enhancements to and maintenance of
61
Table of Contents
Yahoo Properties, research and development, and Yahoo’s technology platforms and infrastructure. Depreciation expense and other operating costs are alsoincluded in product development.
The following table presents product development expenses and those expenses as a percentage of revenue for the periods presented (dollars in thousands): Years Ended December 31, 2014 2015 2016 Product development expenses $ 1,156,386 $ 1,177,923 $ 1,055,462 Product development expenses as a percentage of revenue 24% 24% 20%
Product development expenses for the year ended December 31, 2016 decreased $122 million, or 10 percent, compared to 2015, primarily attributable todeclines in compensation costs of $82 million, depreciation and amortization expense of $63 million, facilities and equipment expense of $17 million, and traveland entertainment expense of $5 million. These declines were partially offset by an increase in stock-based compensation expense of $23 million, an increase of$10 million related to product initiatives to drive search volume, and an increase in outside service provider expense of $5 million. The decline in compensationcosts was primarily attributable to a 19 percent decline in headcount year-over-year. The decline in depreciation and amortization expense was primarilyassociated with a decrease in depreciation from capitalized labor. The decline in facilities and equipment expense was driven by lower telephone, data network,maintenance and building expenses. The increase in stock-based compensation expense was primarily due to higher expense in the current year related toretention grants and performance equity awards.
Product development expenses for the year ended December 31, 2015 increased $22 million, or 2 percent, compared to 2014, primarily attributable to anincrease of $51 million in stock-based compensation expense, as well as an increase in investment activities supporting our search, communications and otherproduct initiatives of $35 million. This increase was partially offset by a decline in depreciation and amortization expense of $37 million, facilities and equipmentexpense of $15 million and compensation costs of $11 million. The increase in stock-based compensation expense was due to an increase in the number ofawards granted at a higher fair value. The decline in compensation costs is primarily attributable to a 17 percent decline in headcount year-over-year, as well asa decline in transition and relocation costs.
General and Administrative
General and administrative expenses consist primarily of compensation-related expenses (including stock-based compensation expense) related to othercorporate departments and fees for professional services.
The following table presents general and administrative expenses and those expenses as a percentage of revenue for the periods presented (dollars inthousands): Years Ended December 31, 2014 2015 2016 General and administrative expenses $ 686,272 $ 687,804 $ 650,708 General and administrative expenses as a percentage of revenue 15% 14% 13%
62

Table of Contents
General and administrative expenses for the year ended December 31, 2016 decreased $37 million, or 5 percent, compared to 2015, primarily attributable todeclines in compensation costs of $32 million, facilities and equipment expense of $25 million, travel and entertainment expense of $9 million, depreciation andamortization expense of $3 million, and marketing and public relations expense of $3 million, partially offset by an increase in outside service provider expense of$36 million (including advisory fees) and an increase in stock-based compensation expense of $8 million. The decline in compensation costs was primarilyattributable to a 15 percent decline in headcount year-over-year. The decline in facilities and equipment expense was driven by lower building and movingexpenses.
General and administrative expenses for the year ended December 31, 2015 increased $2 million compared to 2014, primarily attributable to increases of$26 million due to net gains on disposal of assets, business tax refunds received and legal settlements in 2014 for which there are no similar benefits in 2015,depreciation and amortization expense of $14 million, travel and entertainment expense of $4 million and marketing and public relations expense of $4 million.These increases in general and administrative expenses were partially offset by declines in facilities and equipment expense of $16 million, outside serviceprovider expense of $16 million and compensation costs of $14 million. The decline in compensation costs was primarily attributable to a 19 percent decline inheadcount year-over-year.
Amortization of Intangibles
We have purchased, and may continue purchasing, assets and/or businesses, which may include the purchase of intangible assets. Intangible assets includecustomer, affiliate, and advertiser-related relationships and tradenames, trademarks and domain names. Amortization of developed technology and patents isincluded in the cost of revenue—other, and not in amortization of intangibles.
The following table presents amortization of intangibles and those expenses as a percentage of revenue for the periods presented (dollars in thousands): Years Ended December 31, 2014 2015 2016 Amortization of intangibles $ 66,750 $ 79,042 $ 58,302 Amortization of intangibles as a percentage of revenue 2% 2% 1%
Amortization of intangibles for the year ended December 31, 2016 decreased $21 million, or 26 percent, respectively, compared to 2015, driven primarily by adecline in amortizable Tumblr assets as a result of the impairment recorded in the second quarter of 2016.
Amortization of intangibles for the year ended December 31, 2015 increased $12 million, or 18 percent, compared to 2014, primarily driven by incrementalamortization of intangible assets related to BrightRoll, which we acquired in the fourth quarter of 2014, as well as incremental amortization of intangibles assetsrelated to companies acquired in 2015.
Gain on Sale of Patents and Land
The following table presents gain on sale of patents and land and those gains as a percentage of revenue for the periods presented (dollars in thousands): Years Ended December 31, 2014 2015 2016 Gain on sale of patents and land $ (97,894) $ (11,100) $ (121,559) Gain on sale of patents and land as a percentage of revenue (2)% 0% (2)%
63

Table of Contents
For the year ended December 31, 2016, we sold certain property located in Santa Clara, California and recorded a gain on sale of land of $120 million. Also,during the year ended December 31, 2016, we sold certain patents and recorded a gain on sale of patents of approximately $2 million.
For the year ended December 31, 2015, we sold certain patents and recorded a gain on sale of patents of approximately $11 million.
For the year ended December 31, 2014, we sold certain patents and recorded a gain on sale of patents of approximately $98 million. The gain on sale of patentsinclude patents sold to a wholly-owned affiliate of Alibaba Group for a gain on sale of $24 million and patents sold to Yahoo Japan for a gain on sale of$12 million.
See Note 4—“Acquisitions and Dispositions” in the Notes to our consolidated financial statements for additional information.
Asset Impairment Charge
The following table presents asset impairment charge and those charges as a percentage of revenue for the periods presented (dollars in thousands): Years Ended December 31, 2014 2015 2016 Asset impairment charge $ — $44,381 $ — Asset impairment charge as a percentage of revenue 0% 1% 0%
During the year ended December 31, 2015, we recorded an asset impairment charge of $16 million related to originally developed content equal to the amountby which the unamortized cost of the originally developed content exceeded its estimated fair value and $28 million for acquired content equal to the amount bywhich the unamortized cost of the acquired content exceeded its net realizable value.
Goodwill Impairment Charge
The following table presents goodwill impairment charge and those charges as a percentage of revenue for the periods presented (dollars in thousands): Years Ended December 31, 2014 2015 2016 Goodwill impairment charge $ 88,414 $ 4,460,837 $ 394,901 Goodwill impairment charge as a percentage of revenue 2% 90% 8%
After recording the goodwill impairment charge for Tumblr during the fourth quarter of 2015 based on our assessment performed as of October 31, 2015, the fairvalue of the Tumblr reporting unit approximated its carrying value. As such, any significant unfavorable changes in the forecast would result in the fair valuebeing less than the carrying value. Subsequent to the annual goodwill impairment assessment performed as of October 31, 2015, we continued to monitor theactual performance of our reporting units. During the three months ended June 30, 2016, we determined that there were indicators present to suggest that it wasmore likely than not that the fair value of the Tumblr reporting unit was less than its carrying amount. The significant changes for the Tumblr reporting unitsubsequent to the annual goodwill impairment test performed as of October 31, 2015 included a decline in the 2016 and beyond forecasted revenue, operatingincome and cash flows.
64

Table of Contents
During the year ended December 31, 2016, we recorded a goodwill impairment charge of $395 million, which was a result of the interim impairment analysisperformed in the second quarter of 2016 related to our Tumblr reporting unit, as discussed above. We did not have any goodwill impairment as a result of theannual impairment test performed as of October 31, 2016.
During 2015, we recorded a $4,461 million goodwill impairment charge. The impairments were a result of a combination of factors, including a sustaineddecrease in our market capitalization in the fourth quarter of 2015 and lower estimated projected revenue and profitability in the near term. We concluded thatthe carrying value of our U.S. & Canada, Europe, Tumblr, and Latin America reporting units exceeded their respective estimated fair values and recorded agoodwill impairment charge of approximately $3,692 million, $531 million, $230 million and $8 million, respectively.
During 2014, we recorded an $88 million goodwill impairment charge for the Middle East and India & Southeast Asia reporting units. The impairment resultedfrom a decline in business conditions in the Middle East and India & Southeast Asia during the latter half of 2014.
It is reasonably possible that future changes in judgments, assumptions and estimates we made in assessing the fair value of goodwill could cause us toconsider some portion or all of the remaining goodwill of the Tumblr reporting unit to become impaired. For example, a future decline in market conditions,changes in our market share, and/or other factors could negatively impact the estimated future cash flows and discount rates used in the income approach todetermine the fair value of the Tumblr reporting unit and could result in one or more additional impairment charges in the future.
See Note 5—“Goodwill” in the Notes to our consolidated financial statements and “Critical Accounting Policies— Goodwill ” within Management’s Discussion andAnalysis for additional information.
Intangible Assets Impairment Charge
The following table presents intangible assets impairment charge and those charges as a percentage of revenue for the periods presented (dollars inthousands): Years Ended December 31, 2014 2015 2016 Intangible assets impairment charge $ — $15,423 $87,335 Intangible assets impairment charge as a percentage of revenue 0% 0% 2%
During the second quarter of 2016, we reviewed our Tumblr asset group for impairment as there were events and changes in circumstances that indicated thatthe carrying value of the long-lived assets may not be recoverable. As a result, we performed a quantitative test comparing the fair value of the Tumblr long-livedassets with the carrying amounts and recorded an impairment charge of $87 million during the second quarter of 2016 associated with its definite-lived intangibleassets, which were included within customer, affiliate, and advertiser related relationships and tradenames, trademarks, and domain names.
In the fourth quarter of 2015, we reviewed both definite-lived and indefinite-lived intangible assets for impairment. No impairment was identified for definite-livedintangibles. For indefinite-lived intangibles, we performed a quantitative test comparing the fair value of the indefinite-lived intangible assets with their carryingamount and recorded an impairment charge of $15 million related to certain indefinite-lived intangible assets in the EMEA segment.
65

Table of Contents
See Intangible Assets within Note 1—“The Company and Summary of Significant Accounting Policies” and Note 6—“Intangible Assets, Net” in the Notes to ourconsolidated financial statements for additional information.
Restructuring Charges, Net
Restructuring charges, net was comprised of the following (in thousands): Year Ended December 31, 2014 2015 2016 Employee severance pay and related costs $ 30,749 $ 69,042 $ 57,940 Non-cancelable lease, contract termination, and other charges 79,317 36,526 26,126 Reversals of previous charges (3,222) (7,404) (4,038) Non-cash accelerations of stock-based compensation expense — 2,705 7,374 Other non-cash (credits) charges, net (3,394) 3,150 1,227
Restructuring charges, net $ 103,450 $ 104,019 $ 88,629
We have implemented various restructuring plans to reduce our cost structure, align resources with our product strategy and improve efficiency, which haveresulted in workforce reductions and the consolidation of certain real estate facilities and data centers.
For the year ended December 31, 2016, we recorded expense of $65 million, $20 million, and $4 million related to the Americas, EMEA, and Asia Pacificsegments, respectively. The amounts recorded during the year ended December 31, 2016 were primarily related to the plan we announced in February 2016 toreduce our workforce by approximately 15 percent by the end of 2016 and exit six offices in Dubai, Mexico City, Buenos Aires, Madrid, Milan and Burbank,California, subject to applicable laws and consultation processes, as a part of the strategic plan to simplify our product portfolio. During the year endedDecember 31, 2016, in connection with this action, we incurred pre-tax cash charges of $47 million for severance pay expenses and related cash expenditures,pre-tax cash charges of $17 million related to the consolidation and exit of facilities related to non-cancelable lease costs and other related costs, pre-taxnon-cash charges of $7 million related to stock-based compensation expense and less than $1 million related to impairment costs.
For the year ended December 31, 2015, we recorded expense of $69 million, $31 million, and $4 million related to the Americas, EMEA, and Asia Pacificsegments, respectively. The amounts recorded during the year ended December 31, 2015 were primarily related to severance, facility and other related costspursuant to restructuring plans that we initiated in 2015.
For the year ended December 31, 2014, we recorded expense of $76 million, $25 million, and $2 million related to the Americas, EMEA, and Asia Pacificsegments, respectively. The amounts recorded during the year ended December 31, 2014 were primarily related to the consolidation of a data center as weceased use of that facility pursuant to a restructuring plan we initiated in 2011 and severance charges related to restructuring plans that we initiated in 2014 aspart of our location strategy and to align resources.
The $43 million restructuring liability as of December 31, 2016 consists of $3 million for employee severance expenses, which we expect to substantially pay outby the end of the second quarter of 2017, and $40 million related to non-cancelable lease costs, which we expect to pay over the terms of the related obligationsthrough the fourth quarter of 2025, less estimated sublease income.
66

Table of Contents
OtherIncome(Expense),Net
Other income (expense), net was as follows (in thousands): Years Ended December 31, 2014 2015 2016 Interest and investment income $ 26,309 $ 34,383 $ 60,931 Interest expense (68,851) (71,865) (73,783) Gain on sale of Alibaba Group ADSs 10,319,437 — — Gain (loss) on Hortonworks warrants 98,062 (19,199) (50,046) Foreign exchange (loss) gain (14,687) (22,226) 4,282 Other 9,169 3,125 4,700
Total other income (expense), net $ 10,369,439 $ (75,782) $ (53,916)
Interest and investment income consists of income earned from cash and cash equivalents in bank accounts and marketable debt securities. Interest andinvestment income increased $27 million and $8 million for the years ended December 31, 2016 and 2015, respectively, compared to 2015 and 2014,respectively. The increase for the year ended December 31, 2016 was primarily due to an increase in interest income on our portfolio of investments as a resultof increases in short-term interest rates as well as a higher average invested balance.
Interest expense is related to the $1.4375 billion of Notes we issued in November 2013, interest expense on notes payable related to building obligations, andcapital lease obligations for data centers. Interest expense increased $2 million and $3 million for the years ended December 31, 2016 and 2015, respectively,compared to 2015 and 2014, respectively, primarily due to the accreted non-cash interest expense related to the Notes.
For the year ended December 31, 2014, we recorded a pre-tax gain of approximately $10 billion related to the sale of Alibaba Group ADSs.
We hold warrants that vested upon the December 12, 2014 initial public offering of Hortonworks Inc. (“Hortonworks”), which entitle us to purchase an aggregateof 3.7 million shares of Hortonworks common stock upon exercise of the warrants. We hold 6.5 million preferred warrants that are exercisable for 3.25 millionshares of common stock at an exercise price of $0.01 per share, as well as 0.5 million common warrants that are exercisable for 0.5 million shares of commonstock at an exercise price of $8.46 per share. We determined the estimated fair value of the warrants using the Black-Scholes model. For the years endedDecember 31, 2016 and 2015, we recorded losses of $50 million and $19 million, respectively, due to the change in estimated fair value of the Hortonworkswarrants during the period, which was recorded through other income (expense), net in our consolidated statements of operations. During the year endedDecember 31, 2014, we recorded a gain of $57 million upon the initial public offering of Hortonworks and a $41 million gain related to the mark to market of thewarrants held as of December 31, 2014, which were included within other income (expense), net on the consolidated statements of operations.
Foreign exchange (loss) gain consists of foreign exchange gains and losses due to re-measurement of monetary assets and liabilities denominated innon-functional currencies, and unrealized and realized foreign currency transaction gains and losses, including gains and losses related to balance sheethedges.
67

Table of Contents
Other consists of gains from other non-operational items.
Other income (expense), net may fluctuate in future periods due to changes in our average investment balances, changes in interest and foreign exchangerates, changes in the fair value of foreign currency forward contracts, realized gains and losses on investments, and impairments of investments.
IncomeTaxes
The benefit for income taxes for the year ended December 31, 2016 differs from the amount computed by applying the federal statutory income tax rate toincome before benefit for income taxes and earnings in equity interests as follows (dollars in thousands): Years Ended December 31, 2014 (*) 2015 (*) 2016 (*) Income tax provision (benefit) at the U.S. federal statutory rate of 35 percent (1)(2) $ 3,679,333 35% $ (1,688,496) 35% $ (244,641) 35% State income taxes, net of federal benefit 400,824 4% (7,912) 0% 2,514 0% Stock-based compensation expense 8,132 0% 9,508 0% 10,482 (1)% Research tax credits (23,775) 0% (15,659) 0% (17,291) 2% Effect of non-U.S. operations (3) (53,079) (1)% 165,203 (3)% (18,499) 3% Settlement with tax authorities (4) (24,870) 0% (1,981) 0% (8,400) 1% Remeasurement of prior year tax positions — 0% (5,286) 0% — 0% Acquisition related non-deductible expenses 16,881 0% 15,970 0% 13,059 (2)% Tax liquidation of acquired entities — 0% (56,170) 1% — 0% Goodwill impairment charge (2) 30,945 0% 1,486,792 (31)% 138,215 (20)% Intangible assets impairment charge — 0% 2,468 0% — 0% Other 3,711 0% 5,965 0% (1,667) 0%
Provision (benefit) for income taxes $ 4,038,102 38% $ (89,598) 2% $ (126,228) 18%
(*) Percent of income before income taxes and earnings in equity interests.
Significant variances year-over-year as shown above are further explained as follows: (1) In 2014, Yahoo! Hong Kong Holdings Limited (“YHK”) sold 140 million Alibaba Group ADSs in the Alibaba Group IPO at an initial public offering price of
$68.00 per ADS, which resulted in an increase in our provision for income taxes for 2014. (2) In 2015, our pre-tax loss included a goodwill impairment charge of $4,461 million, of which $213 million is tax deductible, while the rest is not deductible
for income tax purposes. The provision for income taxes for the year ended December 31, 2015 reflects the benefit from impairment of the tax deductiblegoodwill. In 2016, our pre-tax loss included a goodwill impairment charge of $395 million, which is not deductible for income tax purposes.
(3) In 2014, a detriment of $8 million was included in “effect of non-U.S. operations” to account for the corresponding adjustments from the IRS on foreign
earnings available at the time of our
68

Table of Contents
2012 repatriation in which we made a one-time distribution of cash from certain of our consolidated foreign subsidiaries. In 2015, the tax effect of ournon-U.S. operations is a detriment. This results primarily from our election to deduct foreign taxes for U.S. tax purposes rather than claim a tax credit. In2016, we repatriated cumulative earnings from our wholly owned foreign subsidiaries. This resulted in a $17 million tax expense (primarily related to$172 million of dividend income recognizable in the U.S. with an associated $67 million U.S. tax credit for foreign income taxes that have been paid onsuch earnings) related to this repatriation that is included in “effect of non-U.S. operations.” This $17 million tax expense is included as part of the totalincome tax benefit for the year ended December 31, 2016.
(4) In 2014, we settled the IRS income tax examination for the 2007 through 2010 returns resulting in a benefit of approximately $25 million. In 2015 and
2016, we settled states and foreign tax audits for various taxable years resulting in a benefit of $2 million and $8 million, respectively.
As of December 31, 2016, we repatriated cumulative earnings from our wholly-owned foreign subsidiaries and also intend to repatriate our future earnings fromthese foreign subsidiaries. As of December 31, 2016, we do not have a plan to repatriate approximately $3.3 billion of earnings related to our equity methodinvestment in Yahoo Japan. If those earnings were to be repatriated in the future, we may be subject to additional U.S. income taxes (subject to an adjustmentfor foreign tax credits). It is not practicable to determine the income tax liability that might be incurred if these earnings were to be repatriated.
In the first quarter of 2016, we received a cash tax refund of $190 million associated with our claim to carry back 2015 losses and tax attributes to earlier taxableyears.
Our gross amount of unrecognized tax benefits as of December 31, 2016 was $1.1 billion, of which $1.0 billion is recorded on our consolidated balance sheets.The gross unrecognized tax benefits as of December 31, 2016 increased by $7 million from the recorded balance as of December 31, 2015 primarily related totransfer prices among entities in different tax jurisdictions.
We are in various stages of examination and appeal in connection with our taxes both in the U.S. and in foreign jurisdictions. Those audits generally span taxyears 2005 through 2015. As of December 31, 2016, our 2011 through 2015 U.S. federal income tax returns are currently under examination. We have appealedthe proposed California Franchise Tax Board’s adjustments to the 2005 through 2008 returns, but no conclusions have been reached to date. Our 2009 through2010 California tax returns are currently under examination. Our 2011 through 2015 tax years remain subject to examination by the California Franchise TaxBoard for California tax purposes. While it is difficult to determine when the examinations will be settled or their final outcomes, certain audits in variousjurisdictions are expected to be resolved in the foreseeable future. We believe that we have adequately provided for any reasonably foreseeable adverseadjustment to our tax returns and that any settlement will not have a material adverse effect on our consolidated financial position, results of operations, or cashflows. It is reasonably possible that our unrecognized tax benefits could be reduced by up to approximately $20 million in the next twelve months.
In the first quarter of 2015, we satisfied the $3.3 billion income tax liability related to the sale by YHK, our wholly-owned subsidiary, of Alibaba Group ADSs in theAlibaba Group IPO on September 24, 2014. As of December 31, 2016, we accrued deferred tax liabilities of $13.6 billion associated with the Alibaba Groupshares that we retained. Such deferred tax liabilities will be subject to periodic adjustments due to changes in the fair value of the Alibaba Group shares.
We may have additional tax liabilities in China related to the sale to Alibaba Group of 523 million Alibaba Group shares that took place during the year endedDecember 31, 2012 and related to the
69

Table of Contents
sale of 140 million Alibaba Group ADSs sold in the Alibaba Group IPO that took place during the year ended December 31, 2014. Any taxes assessed and paidin China are expected to be ultimately offset and recovered in the U.S. through the use of foreign tax credits.
Tax authorities from the Brazilian State of Sao Paulo have assessed certain indirect taxes against our Brazilian subsidiary, Yahoo! do Brasil Internet Ltda.,related to online advertising services. The assessment is for calendar years 2008 through 2012 and as of December 31, 2016 totals approximately $140 million.We currently believe the assessment is without merit. We believe the risk of loss is remote and have not recorded an accrual for the assessment.
EarningsinEquityInterests
We record our share of the results of earnings in equity interests, including tax impacts, one quarter in arrears, within earnings in equity interests in theconsolidated statements of operations.
The following table presents earnings in equity interests for the periods presented (in thousands): Years Ended December 31, 2014 2015 2016 Earnings in equity interests $ 1,057,863 $ 383,571 $ 363,283
The decrease for the year ended December 31, 2016, compared to 2015, was due primarily to the financial performance of Yahoo Japan. The decrease for theyear ended December 31, 2015, compared to 2014, was due primarily to the change in accounting for our investment in Alibaba Group, which we now record asa marketable equity security. Commencing with the Alibaba Group IPO in September 2014, we no longer use the equity method to account for our interest inAlibaba Group, and our earnings in equity interests and net income have been and will continue to be materially lower.
See Note 8—“Investments in Equity Interests Accounted for Using the Equity Method of Accounting” in the Notes to our consolidated financial statements foradditional information.
NoncontrollingInterests
Noncontrolling interests represent the noncontrolling holders’ percentage share of income or losses from the subsidiaries in which we hold a majority, but lessthan 100 percent, ownership interest and the results of which are consolidated in our consolidated financial statements. Noncontrolling interests wereapproximately $5 million in 2016, compared to $8 million in 2015 and $10 million in 2014. Noncontrolling interests recorded in 2016, 2015, and 2014 were relatedto the Yahoo!7 venture in Australia and New Zealand.
NetIncome(Loss)AttributabletoYahoo!Inc.
Net loss attributable to Yahoo! Inc. for the year ended December 31, 2016 was $214 million compared to a loss of $4.4 billion in 2015, a decline of $4.1 billionyear-over-year, primarily due to a significant decrease in goodwill and asset impairment charges, and to a lesser extent, a decrease in sales and marketingexpense, product development expense, general and administrative expense, cost of revenue—other, a gain on sale of land in 2016, and a decline in TAC(excluding the impact of the change in revenue presentation associated with the Eleventh Amendment). This was partially offset by a decrease in revenue(excluding the impact of the change in revenue presentation associated with the Eleventh Amendment) and an increase in intangible assets impairment charge.
70

Table of Contents
Net loss attributable to Yahoo! Inc. for the year ended December 31, 2015 was $4.4 billion compared to income of $7.5 billion in 2014, a decline of $11.9 billionyear-over-year, primarily attributable to a decline in other income associated with a gain on sale of Alibaba Group shares in connection with the Alibaba GroupIPO for which there was no similar activity in 2015, a goodwill impairment charge, an increase in cost of revenue—TAC, an asset impairment charge related tooriginally developed and acquired content, a decrease in earnings in equity interests and a decrease in gain on sale of patents. This was partially offset by anincrease in revenue and an increase in benefit for income taxes.
AdjustedEBITDA(anon-GAAPfinancialmeasure) Years Ended December 31, 2014 2015 2016 (dollars in thousands) Net income (loss) attributable to Yahoo! Inc. $ 7,521,731 $ (4,359,082) $ (214,321) Advisory fees — 8,808 57,061 Security incidents costs — — 10,406 Gain on sale of land — — (120,059) Depreciation and amortization 606,568 609,613 507,555 Stock-based compensation expense 420,174 457,153 491,902 Asset impairment charge — 44,381 — Goodwill impairment charge 88,414 4,460,837 394,901 Intangible assets impairment charge — 15,423 87,335 Restructuring charges, net 103,450 104,019 88,629 Other income (expense), net (10,369,439) 75,782 53,916 (Provision) benefit for income taxes 4,038,102 (89,598) (126,228) Earnings in equity interests, net of tax (1,057,863) (383,571) (363,283) Net income attributable to noncontrolling interests 10,411 7,975 4,858
Adjusted EBITDA $ 1,361,548 $ 951,740 $ 872,672
Percentage of Revenue ex-TAC ( * ) 31% 23% 25%
(*) Net income (loss) attributable to Yahoo! Inc. as a percentage of GAAP revenue in 2014, 2015, and 2016 was 163 percent, (88) percent, and (4) percent,
respectively.
For the year ended December 31, 2016, adjusted EBITDA decreased $79 million, or 8 percent, compared to 2015, mainly due to a decline in revenue ex-TAC(as described above) partially offset by a decline in global operating costs as well as a decline in direct costs across the segments, as described in “SegmentReporting” below. Revenue ex-TAC, as noted above, was impacted by the completion of recognition of deferred revenue under the TIPLA with Alibaba Group inthe third quarter of 2015 for which no similar revenue was recognized in the year ended December 31, 2016.
For the year ended December 31, 2015, adjusted EBITDA decreased $410 million, or 30 percent, compared to 2014, mainly due to higher TAC payments tosupport our growth and partnership initiatives across Search, Communications and Digital Content, a lower benefit from patent sales year-over-year, and anincrease in direct costs in the Americas segment, partially offset by a decline in global operating costs.
71

Table of Contents
Segment Reporting We continue to manage our business geographically. The primary areas of measurement and decision making are currently the Americas, EMEA and AsiaPacific. Management relies on an internal reporting process that provides revenue, revenue ex-TAC, direct costs excluding TAC by segment, and consolidatedincome (loss) from operations for making decisions related to the evaluation of the financial performance of, and allocating resources to, our segments. Year Ended December 31, 2014-2015
% Change 2015-2016
% Change 2014 2015 2016 (dollars in thousands) Revenue by segment (1) :
Americas $3,517,861 $ 3,976,770 $4,172,836 13% 5% EMEA 374,833 343,646 397,768 (8)% 16% Asia Pacific 725,439 647,885 598,531 (11)% (8)%
Total revenue $4,618,133 $ 4,968,301 $5,169,135 8% 4%
TAC by segment (1) : Americas $ 166,545 $ 788,725 $1,463,221 374% 86% EMEA 36,867 57,284 144,547 55% 152% Asia Pacific 14,119 31,505 43,018 123% 37%
Total TAC $ 217,531 $ 877,514 $1,650,786 303% 88%
Revenue ex-TAC by segment: Americas $3,351,316 $ 3,188,045 $2,709,615 (5)% (15)% EMEA 337,966 286,362 253,221 (15)% (12)% Asia Pacific 711,320 616,380 555,513 (13)% (10)%
Total revenue ex-TAC $4,400,602 $ 4,090,787 $3,518,349 (7)% (14)%
Direct costs by segment (2) : Americas 249,971 284,875 263,010 14% (8)% EMEA 87,490 95,789 51,597 9% (46)% Asia Pacific 198,910 196,056 185,195 (1)% (6)%
Global operating costs (3) 2,600,577 2,582,235 2,214,842 (1)% (14)% Gain on sale of patents and land (97,894) (11,100) (121,559) (89)% 995% Asset impairment charge — 44,381 — 100% 100% Goodwill impairment charge 88,414 4,460,837 394,901 4945% (91)% Intangible assets impairment charge — 15,423 87,335 100% 100% Depreciation and amortization 606,568 609,613 507,555 1% (17)% Stock-based compensation expense 420,174 457,153 491,902 9% 8% Restructuring charges, net 103,450 104,019 88,629 1% (15)%
Income (loss) from operations $ 142,942 $(4,748,494) $ (645,058) (3422)% (86)%
(1) Commencing in the second quarter of 2016, TAC payments related to the Microsoft Search Agreement, which previously would have been recorded as a
reduction to revenue, began to be recorded as cost of revenue—TAC due to a required change in revenue presentation. See Note 1—“The Companyand Summary of Significant Accounting Policies” and Note 19—“Microsoft
72

Table of Contents
Search Agreement” in the Notes to our consolidated financial statements for additional information. (2) Direct costs for each segment include costs associated with the local sales teams and other cost of revenue. Prior to the second quarter of 2016, certain
account management costs associated with Yahoo Properties were managed locally and included as direct costs for each segment. Prior periodamounts have been revised to conform to the current presentation.
(3) Global operating costs include product development, marketing, real estate workplace, general and administrative, account management costs, and
other corporate expenses that are managed on a global basis and that are not directly attributable to any particular segment. Beginning in the secondquarter of 2016, certain account management costs associated with Yahoo Properties are managed globally and included as global costs. Prior periodamounts have been revised to conform to the current presentation.
RevenueandRevenueex-TACbySegment
Americas
Americas revenue for the year ended December 31, 2016 increased $196 million, or 5 percent, compared to 2015. The increase in Americas revenue for theyear ended December 31, 2016 was primarily attributable to an increase in search revenue of $478 million, partially offset by declines in other revenue anddisplay revenue of $235 million and $47 million, respectively. The increase in Americas search revenue was primarily due to the change in revenue presentationassociated with the implementation of the Eleventh Amendment to the Microsoft Search Agreement. The revenue and TAC increase from the change in revenuepresentation was $701 million for the year ended December 31, 2016. See “Significant Transactions—Microsoft Search Agreement” above for further detail.Excluding the impact of the change in revenue presentation, noted above, Americas search revenue declined $224 million, or 13 percent, for the year endedDecember 31, 2016 primarily due to a decline in Paid Clicks on Yahoo Properties and Affiliate sites driven by a decline in traffic, partially offset by an increase inAffiliate site revenue due to improved pricing. A decline in revenue of $77 million associated with the Mozilla Agreement also contributed to the decline inAmericas search revenue on Yahoo Properties. The decline in Americas other revenue was primarily due to a decline in fees revenue and, to a lesser extent, adecline in listings-based revenue. The decline in fees revenue was primarily due to the completion of recognition of deferred revenue pursuant to the TIPLA withAlibaba Group in which we recognized $199 million in the year ended December 31, 2015 for which no similar revenue was recognized in 2016. Listings-basedrevenue for the year ended December 31, 2016 declined $27 million, compared to the same period of 2015, primarily due to partner agreements that ended in2015 and a directory product shut down in 2015. The decline in Americas display revenue for the year ended December 31, 2016 was attributable to a decline inpremium advertising and, to a lesser extent, video and native advertising, partially offset by an increase in audience advertising.
Americas revenue for the year ended December 31, 2015 increased $459 million, or 13 percent, compared to 2014. The increase in Americas revenue for theyear ended December 31, 2015 was primarily attributable to increases in search and display revenue of $323 million and $239 million, respectively, partiallyoffset by a decline in other revenue of $103 million. The increase in Americas search revenue for the year ended December 31, 2015 was attributable to anincrease in search revenue from mobile devices as well as $390 million attributable to the Mozilla Agreement, partially offset by a decline in click volume on othervisits to Yahoo Properties and on Affiliate sites. The increase in Americas display revenue for the year ended December 31, 2015 was primarily associated withan increase in video and native advertising, including incremental revenue following the BrightRoll acquisition and an increase in revenue from mobile devicesdriven by native advertising. The increase in Americas display revenue for the year ended December 31, 2015 occurred despite
73
Table of Contents
unfavorable foreign exchange fluctuations related to Canada and Brazil of approximately $17 million. The decrease in Americas other revenue for the yearended December 31, 2015 was primarily attributable to declines in fees and listings-based revenue of $34 million and $68 million, respectively, due to a declinein Alibaba Group royalty revenue under the TIPLA, a decline in shopping traffic, expiration of a partner agreement, and declines in Yahoo Small Businessassociated with a reduction in its subscriber base.
Revenue in the Americas accounted for approximately 81 percent of total revenue for 2016, compared to 80 percent in 2015 and 76 percent in 2014.
Americas revenue ex-TAC for the year ended December 31, 2016 decreased $478 million, or 15 percent, compared to 2015, primarily due to declines in revenueof $505 million excluding the impact of the change in revenue presentation (described further above). Americas TAC for the year ended December 31, 2016decreased $27 million (excluding the impact of the change in revenue presentation) due to declines in display TAC of $102 million and TAC associated with theMozilla Agreement of $40 million associated with an amendment entered into in the third quarter of 2016. This was partially offset by an increase in search TACprimarily from Yahoo Gemini.
Americas revenue ex-TAC for the year ended December 31, 2015 decreased $163 million, or 5 percent, compared to 2014, due to an increase in TAC, partiallyoffset by an increase in revenue as discussed above. TAC in the Americas segment increased $622 million for the year ended December 31, 2015 due toincreased payments to distribution partners, including Mozilla, TAC associated with Yahoo Gemini, and incremental TAC from the BrightRoll acquisition.
Revenue ex-TAC in the Americas accounted for approximately 77 percent of total revenue ex-TAC for 2016, compared to 78 percent in 2015 and 76 percent in2014.
EMEA
EMEA revenue for the year ended December 31, 2016 increased $54 million, or 16 percent, compared to 2015. The increase in EMEA revenue for the yearended December 31, 2016 was attributable to an increase in search revenue of $83 million, partially offset by a decline in display revenue of $25 million andother revenue of $5 million. The increase in EMEA search revenue was primarily due to the change in revenue presentation associated with the implementationof the Eleventh Amendment to the Microsoft Search Agreement. The revenue and TAC increase from the change in revenue presentation was $106 million forthe year ended December 31, 2016. Excluding the impact of the change in revenue presentation, noted above, EMEA search revenue declined $22 million, or20 percent, for the year ended December 31, 2016, primarily due to unfavorable foreign exchange fluctuations of $13 million using the foreign exchange ratesfrom the year ended December 31, 2015 and a decline in Paid Clicks. The decline in EMEA display revenue for the year ended December 31, 2016 wasprimarily due to a decline in premium advertising and, to a lesser extent, audience advertising, partially offset by an increase in native advertising. Additionally,the decline in display revenue in the EMEA segment was partially due to unfavorable foreign exchange fluctuations of $14 million using the foreign exchangerates from the year ended December 31, 2015.
EMEA revenue for the year ended December 31, 2015 decreased $31 million, or 8 percent, compared to 2014, primarily due to unfavorable foreign exchangefluctuations of $44 million for the year ended December 31, 2015, using the foreign currency exchange rates from the year ended December 31, 2014. Excludingthe impact of foreign exchange, display and search revenue in the EMEA segment increased $21 million and $3 million, respectively, and other revenue declined$11 million. The increase in display revenue in the segment was attributable to an increase in Affiliate revenue in the region primarily from native advertising.
74

Table of Contents
Revenue in EMEA accounted for approximately 8 percent of total revenue for 2016, compared to 7 percent in 2015 and 8 percent in 2014.
EMEA revenue ex-TAC for the year ended December 31, 2016 decreased $33 million, or 12 percent, compared to 2015, primarily due to revenue declinesexceeding the TAC declines (excluding the impact of the change in revenue presentation). TAC declined $18 million (excluding the impact of the change inrevenue presentation) due to a decline in display TAC in the segment.
EMEA revenue ex-TAC for the year ended December 31, 2015 decreased $52 million, or 15 percent, compared to 2014, primarily due to an increase in TAC anda decrease in revenue as discussed above. The increase in TAC in the EMEA segment for the year ended December 31, 2015 was primarily driven by anincrease in display TAC of $17 million, associated with an increase in Affiliate TAC payments to partners.
Revenue ex-TAC in EMEA accounted for approximately 7 percent of total revenue ex-TAC for 2016, compared to 7 percent in 2015 and 8 percent in 2014.
Asia Pacific
Asia Pacific revenue for the year ended December 31, 2016 decreased $49 million, or 8 percent, compared to 2015. The decline in Asia Pacific revenue for theyear ended December 31, 2016 was primarily due to declines in display and other revenue of $33 million and $15 million, respectively. The decline in AsiaPacific display revenue for the year ended December 31, 2016 was primarily attributable to a decline in premium advertising, and to a lesser extent, audienceadvertising, partially offset by an increase in native advertising. The decline in Asia Pacific other revenue was attributable to declines in fees revenue andlistings-based revenue associated with e-commerce transactions.
Asia Pacific revenue for the year ended December 31, 2015 decreased $78 million, or 11 percent, compared to 2014, primarily due to unfavorable foreignexchange fluctuations of $52 million for the year ended December 31, 2015, using the foreign currency exchange rates from the year ended December 31, 2014.In addition to unfavorable foreign exchange fluctuations, the decline in Asia Pacific revenue for the year ended December 31, 2015 was driven primarily by adecrease in search and other revenue of $7 million and $15 million, respectively.
Revenue in Asia Pacific accounted for approximately 12 percent of total revenue for 2016, compared to 13 percent in 2015 and 16 percent in 2014.
We expect Asia Pacific revenue to decline following the expiration of a revenue sharing arrangement with Yahoo Japan in August 2017, under which werecognized approximately $113 million in 2016.
Asia Pacific revenue ex-TAC for the year ended December 31, 2016 decreased $61 million, or 10 percent, compared to 2015, primarily due to a decrease inrevenue of $49 million and an increase in display TAC of $8 million.
Asia Pacific revenue ex-TAC for year ended December 31, 2015 decreased $95 million, or 13 percent, compared to 2014, primarily due to an increase in TACand a decrease in revenue as discussed above. The increase in TAC in the Asia Pacific segment for the year ended December 31, 2015 was primarily driven byan increase in display TAC of $17 million primarily associated with an increase in Affiliate TAC payments to partners.
Revenue ex-TAC in Asia Pacific accounted for approximately 16 percent of total revenue ex-TAC for 2016, compared to 15 percent in 2015 and 16 percent in2014.
75

Table of Contents
DirectCostsbySegment
Americas
For the year ended December 31, 2016, direct costs attributable to the Americas segment decreased $22 million, or 8 percent, compared to 2015, primarilyattributable to declines in compensation costs of $16 million, other cost of revenue of $8 million, and travel and entertainment expense of $3 million, partiallyoffset by an increase in marketing and public relations expense of $4 million. The decline in compensation costs in the segment was primarily due to a19 percent decline in headcount year-over-year.
For the year ended December 31, 2015, direct costs attributable to the Americas segment increased $35 million, or 14 percent, compared to 2014. The increasein direct costs was primarily due to higher compensation costs from acquisitions of $32 million, marketing and public relations expense of $7 million, and othercost of revenue of $2 million, partially offset by lower content costs of $5 million.
Direct costs attributable to the Americas segment represented approximately 10 percent of Americas revenue ex-TAC for 2016, compared to 9 percent in 2015and 7 percent in 2014.
EMEA
For the year ended December 31, 2016, direct costs attributable to the EMEA segment decreased $44 million, or 46 percent, compared to 2015, primarily relatedto declines in bad debt expense of $28 million, compensation costs of $16 million, and other cost of revenue of $3 million, partially offset by an increase inmarketing and public relations expense of $5 million. The decline in compensation costs in the segment was primarily due to a 32 percent decline in headcountyear-over-year.
For the year ended December 31, 2015, direct costs attributable to the EMEA segment increased $8 million, or 9 percent, compared to 2014, primarily due to anincrease in bad debt expense of $15 million, partially offset by a decline in compensation costs of $6 million. The decline in bad debt expense reflected improvedcollections of total and aged accounts receivable balances.
Direct costs attributable to the EMEA segment represented approximately 20 percent of EMEA revenue ex-TAC for 2016, compared to 33 percent in 2015 and26 percent in 2014.
Asia Pacific
For the year ended December 31, 2016, direct costs attributable to the Asia Pacific segment decreased $11 million, or 6 percent, compared to 2015, primarilyattributable to declines in compensation costs of $10 million and marketing and public relations expense of $5 million, partially offset by an increase in other costof revenue of $5 million.
For the year ended December 31, 2015, direct costs attributable to the Asia Pacific segment decreased $3 million, or 1 percent, compared to 2014, primarily dueto a decline in compensation costs of $16 million and outside service provider expenses of $2 million, partially offset by an increase in other cost of revenue of$14 million related to our e-commerce business in the region.
Direct costs attributable to the Asia Pacific segment represented approximately 33 percent of Asia Pacific revenue ex-TAC for 2016, compared to 32 percent and28 percent in 2015 and 2014, respectively.
76

Table of Contents
Liquidity and Capital Resources
December 31,
2015 December 31,
2016 (dollars in thousands) Cash and cash equivalents $ 1,631,911 $ 1,119,469 Short-term marketable securities 4,225,112 5,700,925 Long-term marketable securities 975,961 1,089,707
Total cash, cash equivalents, and marketable securities $ 6,832,984 $ 7,910,101
Percentage of total assets 15% 16%
Years Ended December 31, Cash Flow Highlights 2014 2015 2016 (in thousands) Net cash provided by (used in) operating activities $ 916,350 $ (2,383,422) $ 1,248,863 Net cash provided by (used in) investing activities $ 3,738,501 $ 1,752,112 $ (1,574,265) Net cash used in financing activities $ (4,022,466) $ (377,258) $ (193,682)
Our operating activities for 2016 and 2014 have generated adequate cash to meet our operating needs. In 2015, we satisfied the $3.3 billion income tax liabilityassociated with the sale of Alibaba Group ADSs in the Alibaba Group’s IPO in 2014, which drove the net use of cash from operations.
As of December 31, 2016, we had cash, cash equivalents, and marketable securities (excluding Alibaba Group and Hortonworks equity securities) totaling$7.9 billion compared to $6.8 billion at December 31, 2015. The increase primarily was due to cash provided by operating activities, cash proceeds from the saleof certain property in Santa Clara, California of $246 million (net of closing costs of $4 million) and a cash tax refund of $190 million associated with our claim tocarry back 2015 losses and tax attributes to earlier taxable years.
As of December 31, 2015, we had cash, cash equivalents, and marketable securities (excluding Alibaba Group and Hortonworks equity securities) totaling$6.8 billion compared to $10.2 billion at December 31, 2014. The decrease was due to our purchase of Polyvore for $154 million in cash consideration, net ofcash acquired, the repurchase of 4 million shares of our outstanding common stock for $204 million, and the settlement of the $3.3 billion income tax liabilityrelated to the sale of Alibaba Group ADSs in September 2014.
Our foreign subsidiaries held $317 million of our total $7.9 billion of cash and cash equivalents and marketable securities (excluding Alibaba Group andHortonworks equity securities) as of December 31, 2016. We have recorded a $17 million tax expense related to the repatriation of cumulative earnings from ourwholly owned foreign subsidiaries for the year ended December 31, 2016. As of December 31, 2016, we do not have a plan to repatriate approximately$3.3 billion of earnings related to our equity method investment in Yahoo Japan. If those earnings were to be repatriated in the future, we may be subject toadditional U.S. income taxes (subject to an adjustment for foreign tax credits). It is not practicable to determine the income tax liability that might be incurred ifthese earnings were to be repatriated.
On May 18, 2016, we delivered notice to Citibank to terminate our credit agreement with Citibank, N.A., as Administrative Agent entered into on October 19,2012 (as amended on October 10, 2013,
77

Table of Contents
October 9, 2014, and July 24, 2015) which provided for a $750 million unsecured revolving credit facility. The termination of the credit agreement took effect onMay 23, 2016.
We invest excess cash predominantly in marketable debt securities, money market funds, and time deposits that are liquid and highly rated, and our investmentportfolio has an effective maturity of less than one year. Our marketable securities are classified as available-for-sale and are reported at fair value, withunrealized gains and losses, net of tax, recorded in accumulated other comprehensive income. Realized gains or losses and declines in value judged to beother-than-temporary, if any, on available-for-sale securities are reported in other income (expense), net. The fair value of securities is determined based onquoted market prices of the historical underlying security or from readily available pricing sources for the identical underlying securities that may not be activelytraded as of the valuation date. As of December 31, 2016, certain of our marketable securities had a fair value below cost due primarily to the changes in marketrates of interest and yields on these securities. We evaluate these investments periodically for possible other-than-temporary impairment. We have no currentrequirement or intent to sell these securities. We expect to recover up to (or beyond) the initial cost of the investment.
We currently hedge a portion of our net investment in Yahoo Japan with forward contracts to reduce the risk that our investment in Yahoo Japan will beadversely affected by foreign currency translation exchange rate fluctuations. The forward contracts are required to be settled in cash and the amount of cashpayment we receive or could be required to pay upon settlement could be material.
While we have evaluated possible acquisitions of, or strategic investments in, businesses, products, and technologies that are complementary to our business inthe past, we do not anticipate pursuing any acquisitions and/or investments that may require the use of cash at this time.
We use cash generated by operations as our primary source of liquidity and believe that existing cash, cash equivalents, and investments in marketablesecurities, together with any cash generated from operations, will be sufficient to meet normal operating requirements and capital expenditures for the nexttwelve months.
See Note 2—“Marketable Securities, Investments and Fair Value Disclosures” in the Notes to our consolidated financial statements for additional information.
CashFlowChanges
Net cash provided (used in) by operating activities . Cash provided by (used in) operating activities is driven by our net income (loss), adjusted fornon-cash items, working capital changes and dividends received from equity investees. Non-cash adjustments include depreciation, amortization of intangibleassets, accretion of convertible notes discount, stock-based compensation expense, non-cash restructuring charges, non-cash asset impairment charges,non-cash goodwill impairment charges, non-cash intangible assets impairment charges, non-cash accretion on marketable securities, foreign exchangegain/loss, gain/loss on sale of assets and other, gain/loss on sale of Hortonworks warrants, tax benefits from stock-based awards, excess tax benefits fromstock-based awards, deferred income taxes, earnings in equity interests, and gain on sale of patents and land.
Cash flows from operating activities for the year ended December 31, 2016 were driven by a net source of cash from working capital of $421 million (whichincluded a $190 million cash tax refund), dividends received from equity investees of $157 million and non-cash adjustments of $1,243 million, reduced by a netloss of $209 million and earnings in equity interests of $363 million.
Cash flows from operating activities for the year ended December 31, 2015 was reduced by a net loss of $4,351 million, changes in working capital of$3,445 million (which included the reduction of the
78

Table of Contents
income tax liability related to the sale of Alibaba Group shares in September 2014) and earnings in equity interests of $384 million offset by non-cash goodwilland other impairment charges of $4,521 million, other non-cash adjustments of $1,134 million, and dividends from equity investees of $142 million.
For the year ended December 31, 2014, operating activities provided $916 million in cash. Net income for the year ended December 31, 2014 was$7,532 million, which was offset by the gain on sale of Alibaba Group ADSs of $10,319 million and earnings in equity interests of $1,058 million. Additionally, wereceived dividends from equity investees of $84 million, incurred non-cash adjustments of $1,473 million and had a net source of cash from working capital of$3,204 million which included the income tax liability related to the sale of Alibaba Group shares in September 2014.
Net cash provided by (used in) investing activities. Cash provided by (used in) investing activities is primarily attributable to sales and maturities ofmarketable securities, sales of our strategic investments or settlement of derivative hedge contracts, proceeds from sale of patents, acquisitions, purchases ofmarketable securities, capital expenditures, investments in privately held companies and purchases of intangible assets.
During the year ended December 31, 2016, the $1,574 million used in investing activities was due to purchases of marketable securities, net of proceeds fromsales and maturities, of $1,614 million, partially offset by $29 million in net proceeds from settlement of derivative hedge contracts and net proceeds fromdisposition of property and equipment of $11 million.
During the year ended December 31, 2015, the $1,752 million provided by investing activities was due to proceeds from sales and maturities of marketablesecurities, net of purchases, of $2,308 million, $29 million in proceeds from the sale of patents, and $138 million in net proceeds from settlement of derivativehedge contracts, partially offset by $543 million used for capital expenditures, net, $176 million used for acquisitions, and $4 million used for the purchase ofintangibles and other activities.
During the year ended December 31, 2014, the $3.7 billion provided by investing activities was due to $9.4 billion in cash proceeds from the sale of AlibabaGroup ADSs, net of underwriting discounts, fees and commissions, proceeds from sales and maturities of marketable securities of $3.2 billion, $254 million inproceeds received from settlement of derivative hedge contracts, and $86 million in proceeds from sales of patents, partially offset by $7.9 billion in purchases ofmarketable securities, $396 million used for capital expenditures, $859 million used for acquisitions, and $74 million used for additional equity investments.
Netcashusedinfinancingactivities. Cash used in financing activities is primarily driven by tax withholding payments related to net share settlement ofrestricted stock units, stock repurchases offset by employee stock option exercises and employee stock purchases.
During the year ended December 31, 2016, the $194 million used in financing activities was due to $223 million used for tax withholding payments related to netshare settlements of restricted stock units and other financing activities and $6 million used for distribution to noncontrolling interests. This use of cash waspartially offset by $17 million in cash proceeds received from employee stock option exercises, and an excess tax benefit from stock-based awards of$18 million.
During the year ended December 31, 2015, the $377 million used in financing activities was due to $204 million used for the repurchase of 4 million shares ofcommon stock at an average price of $47.65 per share, $16 million used for distributions to non-controlling interests, and $274 million used for tax withholdingpayments related to net share settlements of restricted stock units and other
79

Table of Contents
financing activities. This use of cash was partially offset by $59 million in cash proceeds received from employee stock option exercises and employee stockpurchases made through our employee stock purchase plan, and an excess tax benefit from stock-based awards of $58 million.
During the year ended December 31, 2014, the $4 billion used in financing activities was due to $4.2 billion used for the repurchase of 102 million shares of ourcommon stock at an average price of $40.94 per share, $22 million used for distributions to noncontrolling interests, and $295 million used for tax withholdingpayments related to net share settlements of restricted stock units and other financing activities. This use of cash was partially offset by $308 million in cashproceeds received from employee stock option exercises and employee stock purchases made through our employee stock purchase plan, and an excess taxbenefit from stock-based awards of $150 million.
In 2016, 2015, and 2014, $18 million, $58 million, and $150 million, respectively, of excess tax benefits from stock-based awards for options exercised in currentand prior periods were included as a source of cash flows from financing activities. These excess tax benefits represent the reduction in income taxes otherwisepayable during the period, attributable to the actual gross tax benefits in excess of the expected tax benefits for options exercised in current and prior periods.We have accumulated excess tax deductions relating to stock options exercised prior to January 1, 2006 available to reduce income taxes otherwise payable. Tothe extent such deductions reduce income taxes payable in the current year, they are reported as financing activities in the consolidated statements of cashflows. See Note 14—“Employee Benefits” in the Notes to our consolidated financial statements for additional information.
CapitalExpenditures,Net
Capital expenditures, net are generally comprised of purchases of computer hardware, software, server equipment, furniture and fixtures, real estate, andcapitalized software and labor for internal use software projects.
Capital expenditures, net were $11 million net benefit in 2016, $543 million net expenditure in 2015, and $396 million net expenditure in 2014. Capitalexpenditures for the year ended December 31, 2016 were reduced by net cash proceeds of $246 million received from the sale of land in Santa Clara, California.Excluding the proceeds received from the land sale, capital expenditures, net were $235 million. The $308 million decrease in capital expenditures, net(excluding land sale proceeds) for the year ended December 31, 2016 was primarily due to the completion of certain Company initiatives, facilities expansionsand improvements in 2015, more efficient use of existing data center capacity and overall increased controls over expense and capital expenditures. Capitalexpenditures increased $147 million for the year ended December 31, 2015, compared to 2014, primarily due to incremental investment in hardware to supportCompany initiatives, facilities expansions and improvements, partially offset by a decline in capitalizable software projects.
We expect capital expenditures in 2017 to be slightly higher than the amount reported in 2016 excluding the land sale proceeds and will be funded by our cashflows from operating activities.
80
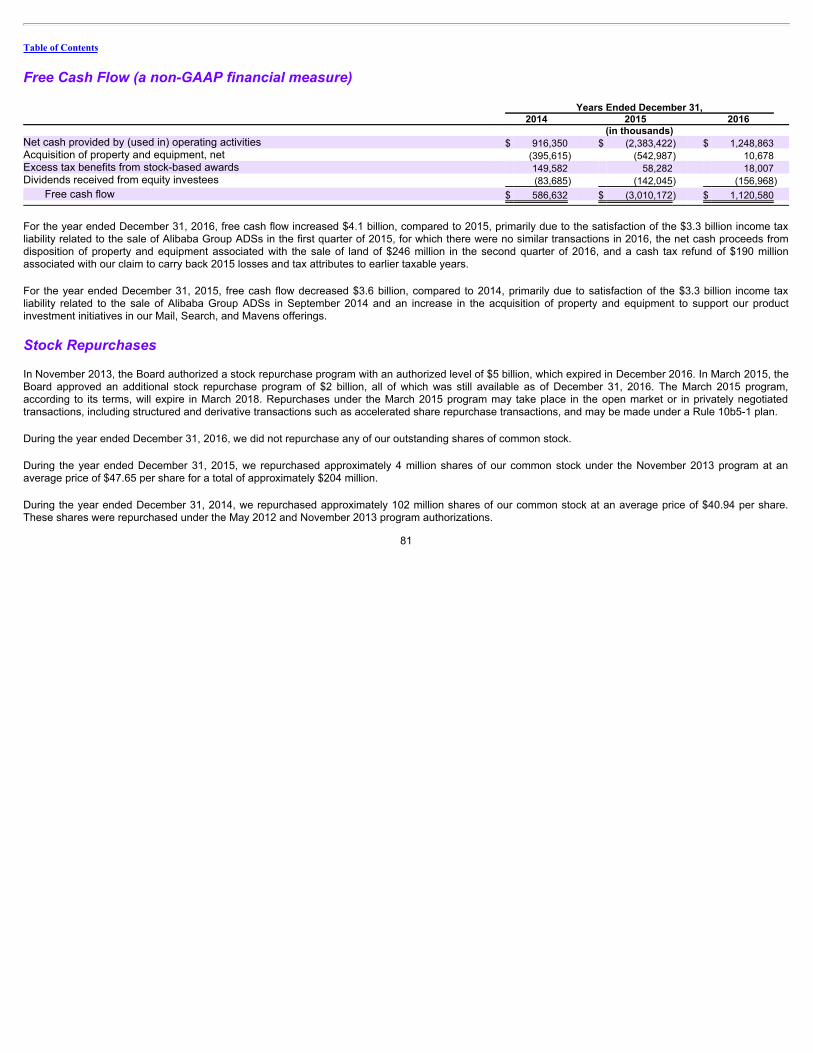
Table of Contents
FreeCashFlow(anon-GAAPfinancialmeasure) Years Ended December 31, 2014 2015 2016 (in thousands) Net cash provided by (used in) operating activities $ 916,350 $ (2,383,422) $ 1,248,863 Acquisition of property and equipment, net (395,615) (542,987) 10,678 Excess tax benefits from stock-based awards 149,582 58,282 18,007 Dividends received from equity investees (83,685) (142,045) (156,968)
Free cash flow $ 586,632 $ (3,010,172) $ 1,120,580
For the year ended December 31, 2016, free cash flow increased $4.1 billion, compared to 2015, primarily due to the satisfaction of the $3.3 billion income taxliability related to the sale of Alibaba Group ADSs in the first quarter of 2015, for which there were no similar transactions in 2016, the net cash proceeds fromdisposition of property and equipment associated with the sale of land of $246 million in the second quarter of 2016, and a cash tax refund of $190 millionassociated with our claim to carry back 2015 losses and tax attributes to earlier taxable years.
For the year ended December 31, 2015, free cash flow decreased $3.6 billion, compared to 2014, primarily due to satisfaction of the $3.3 billion income taxliability related to the sale of Alibaba Group ADSs in September 2014 and an increase in the acquisition of property and equipment to support our productinvestment initiatives in our Mail, Search, and Mavens offerings.
StockRepurchases
In November 2013, the Board authorized a stock repurchase program with an authorized level of $5 billion, which expired in December 2016. In March 2015, theBoard approved an additional stock repurchase program of $2 billion, all of which was still available as of December 31, 2016. The March 2015 program,according to its terms, will expire in March 2018. Repurchases under the March 2015 program may take place in the open market or in privately negotiatedtransactions, including structured and derivative transactions such as accelerated share repurchase transactions, and may be made under a Rule 10b5-1 plan.
During the year ended December 31, 2016, we did not repurchase any of our outstanding shares of common stock.
During the year ended December 31, 2015, we repurchased approximately 4 million shares of our common stock under the November 2013 program at anaverage price of $47.65 per share for a total of approximately $204 million.
During the year ended December 31, 2014, we repurchased approximately 102 million shares of our common stock at an average price of $40.94 per share.These shares were repurchased under the May 2012 and November 2013 program authorizations.
81

Table of Contents
RepurchaseCapacityunderApprovedPrograms
May 2012Program
November 2013Program
March 2015Program Total
(in millions) January 1, 2014 $ 93 $ 5,000 $ — $ 5,093 Total 2014 Repurchases (93) (4,070) — (4,163)
December 31, 2014 $ — $ 930 $ — $ 930
Authorized Share Repurchase amount under March 2015 Program $ — $ — $ 2,000 $ 2,000 Total 2015 Repurchases — (204) — (204)
December 31, 2015 $ — $ 726 $ 2,000 $ 2,726
Total 2016 Repurchases — — — — Program Expiration $ — $ (726) $ — $ (726)
December 31, 2016 $ — $ — $ 2,000 $ 2,000
ContractualObligationsandCommitments
The following table presents certain payments due under contractual obligations with minimum commitments as of December 31, 2016 (in millions): Payments Due by Period
Total Due in 2017
Due in 2018- 2019
Due in 2020- 2021 Thereafter
Convertible notes (1) $1,438 $ — $ 1,438 $ — $ — Note payable obligations 52 5 10 10 27 Operating lease obligations (2)(3) 408 103 135 84 86 Capital lease obligations 28 11 14 — 3 Affiliate commitments (4) 925 300 600 25 — Non-cancelable obligations (5) 172 86 72 7 7 Intellectual property rights (6) 12 6 3 2 1 Uncertain tax positions, including interest and penalties (7) 1,182 2 — — 1,180
Total contractual obligations $4,217 $ 513 $ 2,272 $ 128 $ 1,304
(1) During the year end December 31, 2013, we completed an offering of the Notes, which are due in 2018. The amount above represents the principal
balance to be repaid. See Note 11—“Convertible Notes” in the Notes to our consolidated financial statements for additional information. (2) We have entered into various non-cancelable operating lease agreements for our offices throughout the Americas, EMEA, and Asia Pacific regions with
original lease periods up to 15 years, expiring between 2017 and 2025. See Note 12—“Commitments and Contingencies” in the Notes to ourconsolidated financial statements for additional information.
82

Table of Contents
(3) In May 2013, we entered into a 12 year operating lease agreement for four floors of the former New York Times building in New York City with a totalexpected minimum lease commitment of $125 million. We have the option to renew the lease for an additional five years.
(4) We are obligated to make minimum payments under contracts to provide sponsored search and/or display advertising services to our Affiliates, which
represent TAC. (5) We are obligated to make payments under various arrangements with vendors and other business partners, principally for content, bandwidth, and
marketing arrangements. (6) We are committed to make certain payments under various intellectual property arrangements. (7) As of December 31, 2016, unrecognized tax benefits and potential interest and penalties resulted in accrued liabilities of $1,182 million, classified as
other accrued expenses and current liabilities and deferred and other long-term tax liabilities on our consolidated balance sheets. As of December 31,2016, the settlement period for the $1,180 million income tax liabilities cannot be determined. See Note 16—“Income Taxes” in the Notes to ourconsolidated financial statements for additional information.
StandbyLettersofCredit. As of December 31, 2016, we had outstanding potential obligations relating to standby letters of credit of $38 million. Standbyletters of credit are financial guarantees provided by third parties for ongoing operating liabilities such as leases, utility bills, taxes, and insurance. If any letter ofcredit is drawn upon by a beneficiary, we are obligated to reimburse the provider of the guarantee. The standby letters of credit generally renew annually.
OtherCommitmentsandOff-BalanceSheetArrangements . In the ordinary course of business, we may provide indemnifications of varying scope andterms to customers, vendors, lessors, joint ventures and business partners, purchasers of assets or subsidiaries and other parties with respect to certain matters,including, but not limited to, losses arising out of our breach of agreements or representations and warranties made by us, services to be provided by us,intellectual property infringement claims made by third parties or, with respect to the sale, lease, or assignment of assets or the sale of a subsidiary, mattersrelated to our conduct of the business and tax matters prior to the sale, lease, or assignment of assets. In addition, we have entered into indemnificationagreements with our directors and certain of our officers that will require us, among other things, to indemnify them against certain liabilities that may arise byreason of their status or service as directors or officers. We have also agreed to indemnify certain former officers, directors, and employees of acquiredcompanies in connection with the acquisition of such companies. We maintain director and officer insurance, which may cover certain liabilities arising from ourobligation to indemnify our current and former directors and officers, and former directors and officers of acquired companies, in certain circumstances. It is notpossible to determine the aggregate maximum potential loss under these indemnification agreements due to the limited history of prior indemnification claimsand the unique facts and circumstances involved in each particular agreement. Such indemnification agreements might not be subject to maximum loss clauses.Historically, we have not incurred material costs as a result of obligations under these agreements and we have not accrued any material liabilities related tosuch indemnification obligations in our consolidated financial statements.
As of December 31, 2016, we did not have any relationships with unconsolidated entities or financial partnerships, such as entities often referred to as structuredfinance or special purpose entities, established for the purpose of facilitating off-balance sheet arrangements or other contractually narrow or limited purposes.Accordingly, we are not exposed to any financing, liquidity, market, or credit risk that could arise if we had such relationships. In addition, we identified novariable interests currently held in entities for which we are the primary beneficiary. In addition, as of December 31, 2016, we had no off-balance sheetarrangements that have, or are reasonably likely to have, a current or future material effect on our consolidated financial condition, results of operations, liquidity,capital expenditures or capital resources.
83

Table of Contents
Critical Accounting Policies and Estimates Our discussion and analysis of our financial condition and results of operations is based upon our consolidated financial statements, which have been preparedin accordance with GAAP. The preparation of these consolidated financial statements requires us to make estimates, judgments, and assumptions that affect thereported amounts of assets, liabilities, revenue and expenses, and the related disclosure of contingent assets and liabilities. We base our estimates on historicalexperience and on various other assumptions that we believe are reasonable under the circumstances, the results of which form the basis for making judgmentsabout, among other things, the carrying values of assets and liabilities that are not readily apparent from other sources. Actual results may differ from theseestimates.
An accounting policy is considered to be critical if it requires an accounting estimate to be made based on assumptions about matters that are highly uncertain atthe time the estimate is made, and if different estimates that reasonably could have been used, or changes in the accounting estimate that are reasonably likelyto occur, could materially impact the consolidated financial statements. We believe that the following critical accounting policies reflect the more significantestimates and assumptions used in the preparation of our consolidated financial statements.
Management has discussed the development and selection of these critical accounting estimates with the Audit and Finance Committee (the “Audit Committee”)of our Board, and the Audit Committee has reviewed the disclosure below. In addition, there are other items within our financial statements that requireestimation, but are not deemed critical as defined above. Changes in estimates used in these and other items could have a material impact on our consolidatedfinancial statements.
Revenue Recognition. Our revenue is generated from search and display advertising, and other sources. Display advertising revenue is generated from thedisplay of graphical, non-graphical, and video advertisements and search advertising revenue is generated from clicks on text-based links to advertisers’websites that appear primarily on search results pages, and from a revenue sharing arrangement with Yahoo Japan for search technology and services. Otherrevenue consists of listings-based services revenue, e-commerce transaction revenue, royalties, patent licenses and fees revenue. While the majority of ourrevenue transactions contain standard business terms and conditions, there are certain transactions that contain contract-specific business terms andconditions. In addition, we enter into certain sales transactions that involve multiple elements (arrangements with more than one deliverable). We also enter intoarrangements to purchase goods and/or services from certain customers. As a result, significant contract interpretation is sometimes required to determine theappropriate accounting for these transactions including: (1) whether an arrangement exists; (2) whether fees are fixed or determinable; (3) how the arrangementconsideration should be allocated among potential multiple elements; (4) establishing selling prices for deliverables considering multiple factors; (5) when torecognize revenue on the deliverables; (6) whether all elements of the arrangement have been delivered; (7) whether the arrangement should be reported grossas a principal versus net as an agent; (8) whether we receive a separately identifiable benefit from the purchase arrangements with certain customers for whichwe can reasonably estimate fair value; and (9) whether the consideration received from a vendor should be characterized as revenue or a reimbursement ofcosts incurred. In addition, our revenue recognition policy requires an assessment as to whether collection is reasonably assured, which inherently requires us toevaluate the creditworthiness of our customers. Changes in judgments on these assumptions could materially impact the timing or amount of revenuerecognition.
Income Taxes. Significant judgment is required in evaluating our uncertain tax positions and determining our provision for income taxes. See Note 16—“Income Taxes” in the Notes to our
84

Table of Contents
consolidated financial statements for additional information. We establish liabilities for tax-related uncertainties based on estimates of whether, and the extent towhich, additional taxes will be due. These liabilities are established when we believe that certain positions might be challenged despite our belief that our taxreturn positions are in accordance with applicable tax laws. We adjust these liabilities in light of changing facts and circumstances, such as the closing of a taxaudit, new tax legislation, developments in case law or interactions with the tax authorities. To the extent that the final tax outcome of these matters is differentthan the amounts recorded, such differences will affect the provision for income taxes in the period in which such determination is made. The provision forincome taxes includes the effect of liability provisions and changes to reserves that are considered appropriate, as well as the related net interest and penalties.
We record a valuation allowance against certain of our deferred income tax assets if it is more likely than not that those assets will not be realized. In evaluatingour ability to realize our deferred income tax assets we consider all available positive and negative evidence, including our operating results, ongoing taxplanning, and forecasts of future taxable income on a jurisdiction by jurisdiction basis. In the event we were to determine that we would be able to realize thesedeferred income tax assets in the future, we would make an adjustment to the valuation allowance, which would reduce the provision for income taxes.
Goodwill. Goodwill is not amortized but is evaluated for impairment annually (as of October 31) or whenever we identify certain triggering events orcircumstances that would more likely than not reduce the estimated fair value of a reporting unit below its carrying amount. Events or circumstances that mightindicate an interim evaluation is warranted include, among other things, unexpected adverse business conditions, regulatory changes, loss of key personnel andreporting unit and macro-economic factors.
Goodwill is tested for impairment at the reporting unit level, which is at or one level below our operating segments. We identified U.S. & Canada, Latin America,and Tumblr as the reporting units below the Americas operating segment; EMEA is the reporting unit as well as the operating segment; and Taiwan, Hong Kong,Australia & New Zealand, and India & Southeast Asia as the reporting units below the Asia Pacific operating segment. These operating segments are the sameas our reportable segments.
To test for impairment, we use the two-step quantitative test. The first step of the quantitative test involves comparing the estimated fair value of our reportingunits to their carrying values, including goodwill. If the carrying value of the reporting unit exceeds its fair value, the second step of the quantitative test isperformed by comparing the carrying value of the goodwill in the reporting unit to its implied fair value. An impairment charge is recognized for the excess of thecarrying value of goodwill over its implied fair value.
We use a combination of income and market approaches for valuing the reporting units. Refer to Note 5—“Goodwill” in the Notes to our consolidated financialstatements for discussion of the methodologies utilized in 2016, 2015, and 2014 for each reporting unit. The components of these approaches, as outlinedbelow, require us to make assumptions about the timing and amount of future cash flows, growth rates and discount rates. Significant management judgment isinvolved in determining these estimates and assumptions, and actual results may differ from those used in valuations. Changes in these estimates andassumptions could materially affect the determination of fair value for each reporting unit which could trigger future impairment. • Marketcomparables . We select comparable companies in the specific regions in which these reporting units operate based on similarity of type of
business, primarily those involved in online advertising, relative size, financial profile, and other characteristics of those companies compared
85

Table of Contents
to these reporting units. Forward revenue multiples derived from these comparable companies are applied to financial metrics of these reporting units todetermine their estimated fair values.
• Estimatedfuturecashflows. We base cash flow projections for each reporting unit using a forecast of cash flows and a terminal value based on the
Perpetuity Growth Model. The forecast and related assumptions were derived from the most recent annual financial forecast for which the planning processcommenced in our fourth quarter of 2016. Key assumptions in estimating future cash flows include, among other items, revenue and operating expensegrowth rates, terminal value growth rate, and capital expenditure and working capital levels.
• Discount rates . We employ a Weighted Average Cost of Capital approach to determine the discount rates used in our cash flow projections. The
determination of the discount rates for each reporting unit includes factors such as the risk-free rate of return and the return an outside investor wouldexpect to earn based on the overall level of inherent risk. The determination of expected returns includes consideration of the beta (a measure of volatility)of traded securities of comparable companies and risk premiums of reporting units based on international cost of capital methods.
Discount rate assumptions for these reporting units take into account our assessment of the risks inherent in the future cash flows of the respective reporting unitand our weighted-average cost of capital. We also review marketplace data to assess the reasonableness of our computation of our overall weighted averagecost of capital and, when available, the discount rates utilized for each of these reporting units.
In determining the fair value of all of the reporting units for the annual goodwill impairment test as of October 31, 2016, we used the following assumptions: • Expected cash flows underlying our business plans for the periods 2017 through 2027. • Cash flows beyond 2027 are projected to grow at a perpetual growth rate. • In order to risk adjust the cash flow projections in determining fair value, we utilized discount rates ranging from 15 percent to 17.5 percent for these
reporting units.
For any reporting units where the carrying value exceeds the estimated fair value, as determined in step one, we perform a second step to measure the amountof impairment, if any. The second step of the quantitative test is performed by comparing the carrying value of the goodwill in the reporting unit to its implied fairvalue. The implied fair value is calculated by allocating all of the assets and liabilities of the reporting unit, including any unrecognized intangible assets, in ahypothetical analysis that calculates the implied fair value of goodwill in the same manner as if the reporting unit was being acquired in a business combination.An impairment charge is recognized for the excess of the carrying value of goodwill over its implied fair value. We did not book an impairment charge as a resultof our annual goodwill impairment test as of October 31, 2016.
Determining the fair value of each reporting unit is judgmental in nature and requires the use of significant estimates and assumptions, including revenue growthrates and operating margins, discount rates and future market conditions, among others. It is reasonably possible that a future decline in market conditionsand/or changes in our market share could negatively impact the market comparables, estimated future cash flows and discount rates used in the market andincome approaches to determine the fair value of each reporting unit and could result in some portion or all of the remaining goodwill to become impaired in theforeseeable future.
2016InterimGoodwillImpairment. After recording the goodwill impairment charge as of October 31, 2015 for Tumblr during the fourth quarter of 2015, thefair value of the Tumblr reporting
86

Table of Contents
unit approximated its carrying value. As such, any significant unfavorable changes in the forecast would result in the fair value being less than the carrying value.Subsequent to the annual goodwill impairment assessment performed as of October 31, 2015, we continued to monitor actual performance of our reportingunits. During the three months ended June 30, 2016, we determined that there were indicators present to suggest that it was more likely than not that the fairvalue of the Tumblr reporting unit was less than its carrying amount. The significant changes for the Tumblr reporting unit subsequent to the annual goodwillimpairment test performed as of October 31, 2015 included a decline in the 2016 and beyond forecasted revenue, operating income and cash flows.
In determining the fair value of the Tumblr reporting unit, we used the following assumptions: • Expected cash flows underlying our business plans for the periods 2016 through 2027. • Cash flows beyond 2026 are projected to grow at a perpetual growth rate. • In order to risk adjust the cash flow projections in determining fair value, we utilized a discount rate of 15 percent.
We recorded goodwill impairment charges of $395 million in the Tumblr reporting unit during the second quarter of 2016.
It is reasonably possible that future changes in judgments, assumptions and estimates we made in assessing the fair value of goodwill could cause us toconsider some portion or all of the remaining goodwill of the Tumblr reporting unit to become impaired, which comprised $124 million of our remaining$416 million goodwill balance as of December 31, 2016. In addition, a future decline in market conditions and/or changes in our market share could negativelyimpact the estimated future cash flows and discount rates used in the income approach to determine the fair value of the reporting unit and could result in animpairment charge in the foreseeable future.
See “Operating Costs and Expenses—Goodwill Impairment Charge” for additional goodwill impairment information for the years ended December 31, 2014,2015, and 2016 and also Note 5—“Goodwill” in the Notes to our consolidated financial statements.
Long-lived Assets . We amortize long-lived assets, including property and equipment and intangible assets, over their estimated useful lives. Identifiable long-lived assets are reviewed for impairment whenever events or changes in circumstances indicate that the carrying value may not be recoverable. Determination ofrecoverability is based on the lowest level of identifiable estimated undiscounted future cash flows resulting from use of the asset and its eventual disposition.Measurement of any impairment loss is based on the excess of the carrying value of the asset over its fair value. Fair value is determined based on the lowestlevel of identifiable estimated future cash flows using discount rates determined by our management to be commensurate with the risk inherent in our businessmodel. Our estimates of future cash flows attributable to our long-lived assets require significant judgment based on our historical and anticipated results and aresubject to many factors. Different assumptions and judgments such as revenue growth rates and operating margins, the estimation of the useful life over whichthe undiscounted cash flows will occur, and the terminal value of the asset group at the end of that useful life could materially affect estimated future cash flowsrelating to our long-lived assets which could trigger impairment. We recorded intangible assets impairment charges of $87 million associated with Tumblr duringthe second quarter of 2016. See “Operating Costs and Expenses—Asset Impairment Charge” and “Intangible Assets Impairment Charge” and Note 6—“Intangible Assets, Net” in the Notes to our consolidated financial statements in the Notes to our consolidated financial statements for additional information.
Investments in Equity Interests. We account for investments in the common stock of entities in which we have the ability to exercise significant influence butdo not own a majority equity interest
87

Table of Contents
or otherwise control using the equity method. In accounting for these investments we record our proportionate share of the entities’ net income or loss, onequarter in arrears.
We review our investments in equity interests for impairment whenever events or changes in business circumstances indicate that the carrying value of theinvestment may not be fully recoverable. Investments identified as having an indication of impairment are subject to further analysis to determine if theimpairment is other-than-temporary and this analysis requires estimating the fair value of the investment. The determination of fair value of the investmentinvolves considering factors such as the stock prices of public companies in which we have an equity investment, current economic and market conditions, theoperating performance of the companies, including current earnings trends and forecasted cash flows, and other company and industry specific information. Thefair value determination, particularly for investments in privately-held companies, requires significant judgment to determine appropriate estimates andassumptions. Changes in these estimates and assumptions could affect the calculation of the fair value of the investments and the determination of whether anyidentified impairment is other-than-temporary.
Stock-Based Compensation Expense. We recognize stock-based compensation expense net of an estimated forfeiture rate and therefore only recognizecompensation expense for those shares expected to vest over the service period of the award. Calculating stock-based compensation expense requires theinput of highly subjective assumptions, including the expected term of the stock-based options, stock price volatility, and the pre-vesting award forfeiture rate. Weestimate the expected life of options granted based on historical exercise patterns, which we believe are representative of future behavior. We estimate thevolatility of our common stock on the date of grant based on the implied volatility of publicly traded options on our common stock, with a term of one year orgreater. We believe that implied volatility calculated based on actively traded options on our common stock is a better indicator of expected volatility and futurestock price trends than historical volatility.
Therefore, expected volatility for the year ended December 31, 2016 was based on a market-based implied volatility. The assumptions used in calculating thefair value of stock-based awards represent our best estimates, but these estimates involve inherent uncertainties and the application of management judgment.As a result, if factors change and we use different assumptions, our stock-based compensation expense could be materially different in the future. In addition, weare required to estimate the expected pre-vesting award forfeiture rate, as well as the probability that performance conditions that affect the vesting of certainawards will be achieved, and recognize expense only for those shares expected to vest. Performance conditions are estimated and monitored throughout theyear. We estimate this forfeiture rate based on historical experience of our stock-based awards that are granted and cancelled before vesting. If our actualforfeiture rate is materially different from our original estimates, the stock-based compensation expense could be significantly different from what we haverecorded in the current period. Changes in the estimated forfeiture rate can have a significant effect on reported stock-based compensation expense, as theeffect of adjusting the forfeiture rate for all current and previously recognized expense for unvested awards is recognized in the period the forfeiture estimate ischanged. If the actual forfeiture rate is higher than the estimated forfeiture rate, then an adjustment will be made to increase the estimated forfeiture rate, whichwill result in a decrease to the expense recognized in our consolidated financial statements. If the actual forfeiture rate is lower than the estimated forfeiture rate,then an adjustment will be made to lower the estimated forfeiture rate, which will result in an increase to the expense recognized in our consolidated financialstatements. See Note 14—“Employee Benefits” in the Notes to our consolidated financial statements for additional information.
88

Table of Contents
Recent Accounting Pronouncements See Note 1—“The Company and Summary of Significant Accounting Policies” in the Notes to our consolidated financial statements, which is incorporated hereinby reference.
Item 7A. Quantitative and Qualitative Disclosures About Market RiskWe are exposed to financial market risks, including changes in currency exchange rates and interest rates and changes in the market values of our investments.We may use derivative financial instruments to mitigate certain risks in accordance with our investment and foreign exchange policies.
We enter into master netting arrangements, which are designed to reduce credit risk by permitting net settlement of transactions with the same counterparty. Wepresent our derivative assets and liabilities at their gross fair values on the consolidated balance sheets.
Interest Rate Exposure We are exposed to various risks that relate to our marketable securities portfolio, including market and interest rate risk. While our interest rate risk relatesprimarily to the marketable debt securities in which we invest, interest rates may also impact our costs associated with foreign exchange hedging. We investexcess cash in money market funds, time deposits, and liquid debt instruments of the U.S. and foreign governments and their agencies, and high credit-qualitycorporate issuers which are classified as cash equivalents and/or marketable securities.
Investments in fixed rate and floating rate interest earning instruments carry a degree of interest rate risk. Fixed rate securities may have their fair market valueadversely impacted due to a rise in interest rates, while floating rate securities may produce less income than expected if interest rates fall. Due in part to thesefactors, our future investment income may fall short of expectations due to changes in interest rates or we may suffer losses in principal if forced to sell securitiesthat have declined in market value due to changes in interest rates or changes in credit quality. A hypothetical 100 basis point increase in interest rates wouldresult in a $35 million and $28 million decrease in the fair value of our available-for-sale debt securities as of December 31, 2016 and 2015, respectively.
In November 2013, we issued $1.4375 billion of the Notes. We carry the Notes at face value less unamortized discount on our consolidated balance sheets. Thefair value of the Notes fluctuates due to changes in interest rates, credit spreads, and time to maturity. There is no coupon payment associated with the Notes.
Foreign Currency Exposure The objective of our foreign exchange risk management program is to identify material foreign currency exposures and identify methods to manage theseexposures to minimize the potential effects of currency fluctuations on our reported consolidated cash flows and results of operations. All counterparties to ourderivative contracts are major financial institutions. See Note 9—“Foreign Currency Derivative Financial Instruments” in the Notes to our consolidated financialstatements for additional information on our hedging programs.
89

Table of Contents
We transact business in various foreign currencies and have international revenue, as well as costs denominated in foreign currencies. This exposes us to therisk of fluctuations in foreign currency exchange rates.
We had net realized and unrealized foreign currency transaction gains of $4 million for the year ended December 31, 2016 and losses of $22 million and$15 million for the years ended December 31, 2015 and 2014, respectively, which include the impact of balance sheet hedging and remeasurements of foreigndenominated assets and liabilities on the balance sheets of the Company and our subsidiaries.
Translation Exposure. We are also exposed to foreign exchange rate fluctuations as we convert the financial statements of our foreign subsidiaries and ourinvestments in equity interests into U.S. dollars in consolidation. If there is a change in foreign currency exchange rates, the conversion of the foreignsubsidiaries’ financial statements into U.S. dollars results in a gain or loss which is recorded as foreign currency translation adjustments, net of tax withinaccumulated other comprehensive income which is part of stockholders’ equity.
A Value-at-Risk (“VaR”) sensitivity analysis was performed on all of our foreign currency derivative positions to assess the potential impact of fluctuations inexchange rates. The VaR model uses a Monte Carlo simulation to generate thousands of random price paths assuming normal market conditions. The VaR isthe maximum expected one day loss in fair value, for a given statistical confidence level, to our foreign currency derivative positions due to adverse movementsin rates. The VaR model is used as a risk management tool and is not intended to represent either actual or forecasted losses. Based on the results of the modelusing a 99 percent confidence interval, we estimate the maximum one-day loss in the net investment hedge portfolio was $6 million and $45 million atDecember 31, 2016 and 2015, respectively. The maximum one-day loss in the cash flow hedge portfolio was $1 million and $3 million at December 31, 2016 and2015, respectively. The maximum one-day loss in the balance sheet hedge portfolio was $5 million at December 31, 2016 compared to a $11 million and$2 million loss at December 31, 2015 and 2014, respectively. Actual future gains and losses associated with our derivative positions may differ materially fromthe sensitivity analysis performed as of December 31, 2016 due to the inherent limitations associated with predicting the timing and amount of changes in foreigncurrency exchange rates and our actual exposures and positions. In addition, the VaR sensitivity analysis may not reflect the complex market reactions that mayarise from the market shifts modeled within this VaR sensitivity analysis.
Revenue ex-TAC and related expenses generated from our international subsidiaries are generally denominated in the currencies of the local countries. Primarycurrencies include Australian dollars, British pounds, Euros, Japanese yen, Taiwan dollars, Hong Kong dollars, Canadian dollars and Singapore dollars. Thestatements of operations of our international operations are translated into U.S. dollars at exchange rates indicative of market rates during each applicableperiod. To the extent the U.S. dollar strengthens against foreign currencies, the translation of these foreign currency-denominated transactions results in reducedconsolidated revenue and operating expenses. Conversely, our consolidated revenue and operating expenses will increase if the U.S. dollar weakens againstforeign currencies. Using the foreign currency exchange rates from the year ended December 31, 2015, revenue ex-TAC for the Americas segment for the yearended December 31, 2016 would have been higher than we reported by $5 million; revenue ex-TAC for the EMEA segment would have been higher than wereported by $19 million; and revenue ex-TAC for the Asia Pacific segment would have been lower than we reported by $4 million. Using the foreign currencyexchange rates from the year ended December 31, 2015, direct costs for the Americas segment for the year ended December 31, 2016 would have been higherthan we reported by $2 million; direct costs for the EMEA segment would have been higher than we reported by $4 million; and direct costs for the Asia Pacificsegment would have been higher than we reported by $4 million.
90
Table of Contents
Investment Exposure We are exposed to investment risk as it relates to changes in the market value of our investments. We have investments in marketable debt securities and equityinstruments of public and private companies. As of the date of the Alibaba Group IPO, we no longer account for our remaining investment in Alibaba Groupusing the equity method and no longer record our proportionate share of Alibaba Group’s financial results in the consolidated financial statements. Instead, wenow reflect our remaining investment in Alibaba Group as an available-for-sale equity security on the consolidated balance sheet and adjust the investment tofair value each quarterly reporting period with changes in fair value recorded within other comprehensive income (loss), net of tax. The change in theclassification of our investment in Alibaba Group from an equity method investment to an available-for-sale equity security exposes our investment portfolio toincreased equity price risk. The fair value of the equity investment in Alibaba Group will vary over time and is subject to a variety of market risks including:company performance, macro-economic, regulatory, industry, and systemic risks of the equity markets overall.
The objective of our corporate investment policy is to preserve capital, meet liquidity requirements, and provide a reasonable rate of return. A large portion of ourcash and cash equivalents and short-term and long-term investments is managed by external managers according to the guidelines of our corporate investmentpolicy. We protect and preserve invested funds by limiting default, market, and reinvestment risk. To achieve this objective, we maintain our portfolio of cash andcash equivalents and short-term and long-term investments in a variety of marketable debt securities, including both government and corporate obligations andmoney market funds. As of both December 31, 2016 and 2015, net unrealized losses on these investments were $5 million.
A sensitivity analysis was performed on our marketable equity securities portfolio to assess the potential impact of fluctuations in stock price. Hypotheticaldeclines in stock price of ten percent, twenty percent, and thirty percent were selected based on potential near-term changes in the stock price that could havean adverse effect on our marketable equity securities portfolio. As of December 31, 2016 and 2015, the fair value of our marketable equity securities portfoliowas approximately $34 billion and $31 billion, respectively. As of December 31, 2016, declines in stock prices of ten percent, twenty percent and thirty percentwould result in a $3 billion, $7 billion and $10 billion decline, respectively, in the total value of our marketable equity securities portfolio.
We performed a separate sensitivity analysis on our Hortonworks warrants for which we estimate fair value using the Black-Scholes model. We have held allother inputs constant and determined the impact of hypothetical declines in stock price of ten percent, twenty percent, and thirty percent, based on potentialnear-term changes in the stock price that could have an adverse effect on the fair value of the warrants and result in a loss recorded to the consolidatedstatements of operations. As of December 31, 2016 and 2015, the fair value of the Hortonworks warrants was approximately $29 million and $79 million,respectively. As of December 31, 2016, declines in stock prices of ten percent, twenty percent and thirty percent would result in a $3 million, $6 million and$9 million decline, respectively, in the total value of the Hortonworks warrants.
91
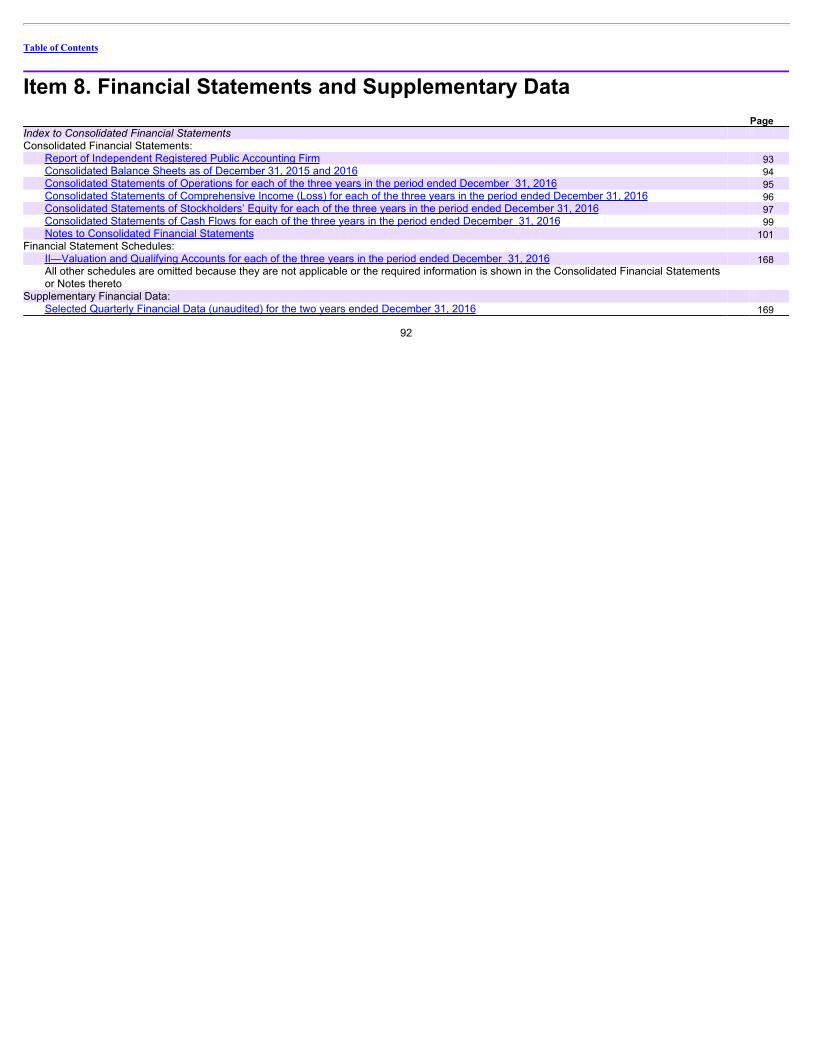
Table of Contents
Item 8. Financial Statements and Supplementary Data Page Index to Consolidated Financial Statements Consolidated Financial Statements:
Report of Independent Registered Public Accounting Firm 93 Consolidated Balance Sheets as of December 31, 2015 and 2016 94 Consolidated Statements of Operations for each of the three years in the period ended December 31, 2016 95 Consolidated Statements of Comprehensive Income (Loss) for each of the three years in the period ended December 31, 2016 96 Consolidated Statements of Stockholders’ Equity for each of the three years in the period ended December 31, 2016 97 Consolidated Statements of Cash Flows for each of the three years in the period ended December 31, 2016 99 Notes to Consolidated Financial Statements 101
Financial Statement Schedules: II—Valuation and Qualifying Accounts for each of the three years in the period ended December 31, 2016 168 All other schedules are omitted because they are not applicable or the required information is shown in the Consolidated Financial Statementsor Notes thereto
Supplementary Financial Data: Selected Quarterly Financial Data (unaudited) for the two years ended December 31, 2016 169
92

Table of Contents
Report of Independent Registered Public Accounting Firm
To the Board of Directors and Stockholders of Yahoo! Inc.:
In our opinion, the accompanying consolidated balance sheets and the related consolidated statements of operations, of comprehensive income (loss), ofstockholders’ equity and of cash flows present fairly, in all material respects, the financial position of Yahoo! Inc. and its subsidiaries at December 31, 2016 andDecember 31, 2015, and the results of their operations and their cash flows for each of the three years in the period ended December 31, 2016 in conformitywith accounting principles generally accepted in the United States of America. In addition, in our opinion, the financial statement schedule listed in theaccompanying index presents fairly, in all material respects, the information set forth therein when read in conjunction with the related consolidated financialstatements. Also in our opinion, the Company maintained, in all material respects, effective internal control over financial reporting as of December 31, 2016,based on criteria established in Internal Control—Integrated Framework (2013) issued by the Committee of Sponsoring Organizations of the TreadwayCommission (COSO). The Company’s management is responsible for these financial statements and financial statement schedule, for maintaining effectiveinternal control over financial reporting and for its assessment of the effectiveness of internal control over financial reporting, included in Management’s Reporton Internal Control Over Financial Reporting appearing under Item 9A. Our responsibility is to express opinions on these financial statements, on the financialstatement schedule, and on the Company’s internal control over financial reporting based on our integrated audits. We conducted our audits in accordance withthe standards of the Public Company Accounting Oversight Board (United States). Those standards require that we plan and perform the audits to obtainreasonable assurance about whether the financial statements are free of material misstatement and whether effective internal control over financial reportingwas maintained in all material respects. Our audits of the financial statements included examining, on a test basis, evidence supporting the amounts anddisclosures in the financial statements, assessing the accounting principles used and significant estimates made by management, and evaluating the overallfinancial statement presentation. Our audit of internal control over financial reporting included obtaining an understanding of internal control over financialreporting, assessing the risk that a material weakness exists, and testing and evaluating the design and operating effectiveness of internal control based on theassessed risk. Our audits also included performing such other procedures as we considered necessary in the circumstances. We believe that our audits providea reasonable basis for our opinions.
A company’s internal control over financial reporting is a process designed to provide reasonable assurance regarding the reliability of financial reporting and thepreparation of financial statements for external purposes in accordance with generally accepted accounting principles. A company’s internal control over financialreporting includes those policies and procedures that (i) pertain to the maintenance of records that, in reasonable detail, accurately and fairly reflect thetransactions and dispositions of the assets of the company; (ii) provide reasonable assurance that transactions are recorded as necessary to permit preparationof financial statements in accordance with generally accepted accounting principles, and that receipts and expenditures of the company are being made only inaccordance with authorizations of management and directors of the company; and (iii) provide reasonable assurance regarding prevention or timely detection ofunauthorized acquisition, use, or disposition of the company’s assets that could have a material effect on the financial statements.
Because of its inherent limitations, internal control over financial reporting may not prevent or detect misstatements. Also, projections of any evaluation ofeffectiveness to future periods are subject to the risk that controls may become inadequate because of changes in conditions, or that the degree of compliancewith the policies or procedures may deteriorate.
/s/ PricewaterhouseCoopers LLP
San Jose, CaliforniaMarch 1, 2017
93

Table of Contents
Yahoo! Inc.
Consolidated Balance Sheets
December 31,
2015 December 31,
2016 (in thousands, except par values)
ASSETS Current assets:
Cash and cash equivalents $ 1,631,911 $ 1,119,469 Short-term marketable securities 4,225,112 5,700,925 Accounts receivable, net of allowance of $57,503 and $32,537 as of December 31, 2015 and 2016, respectively 1,047,504 1,084,267 Prepaid expenses and other current assets (includes restricted cash of $29,678 and $55,168 as of December 31,2015 and 2016, respectively) 602,792 221,499
Total current assets 7,507,319 8,126,160 Long-term marketable securities 975,961 1,089,707 Property and equipment, net 1,547,323 1,209,937 Goodwill 808,114 415,809 Intangible assets, net 347,269 161,644 Other long-term assets and investments 342,390 206,059 Investment in Alibaba Group 31,172,361 33,680,879 Investments in equity interests 2,503,229 3,192,884
Total assets $ 45,203,966 $ 48,083,079
LIABILITIES AND EQUITY Current liabilities:
Accounts payable $ 208,691 $ 171,520 Other accrued expenses and current liabilities 934,658 1,006,676 Deferred revenue 134,031 109,228
Total current liabilities 1,277,380 1,287,424 Convertible notes 1,233,485 1,299,945 Long-term deferred revenue 27,801 39,583 Other long-term liabilities 118,689 95,597 Deferred tax liabilities related to investment in Alibaba Group 12,611,867 13,633,988 Deferred and other long-term tax liabilities 855,324 642,466
Total liabilities 16,124,546 16,999,003
Commitments and contingencies (Note 12) Yahoo! Inc. stockholders’ equity:
Preferred stock, $0.001 par value; 10,000 shares authorized; none issued or outstanding — — Common stock, $0.001 par value; 5,000,000 shares authorized; 962,959 shares issued and 945,854 sharesoutstanding as of December 31, 2015 and 972,472 shares issued and 955,308 shares outstanding as ofDecember 31, 2016 959 969 Additional paid-in capital 8,807,273 9,125,459 Treasury stock at cost, 17,105 shares as of December 31, 2015 and 17,164 shares as of December 31, 2016 (911,533) (908,996) Retained earnings 4,570,807 4,353,958 Accumulated other comprehensive income 16,576,031 18,477,893
Total Yahoo! Inc. stockholders’ equity 29,043,537 31,049,283 Noncontrolling interests 35,883 34,793
Total equity 29,079,420 31,084,076
Total liabilities and equity $ 45,203,966 $ 48,083,079
The accompanying notes are an integral part of these consolidated financial statements.
94
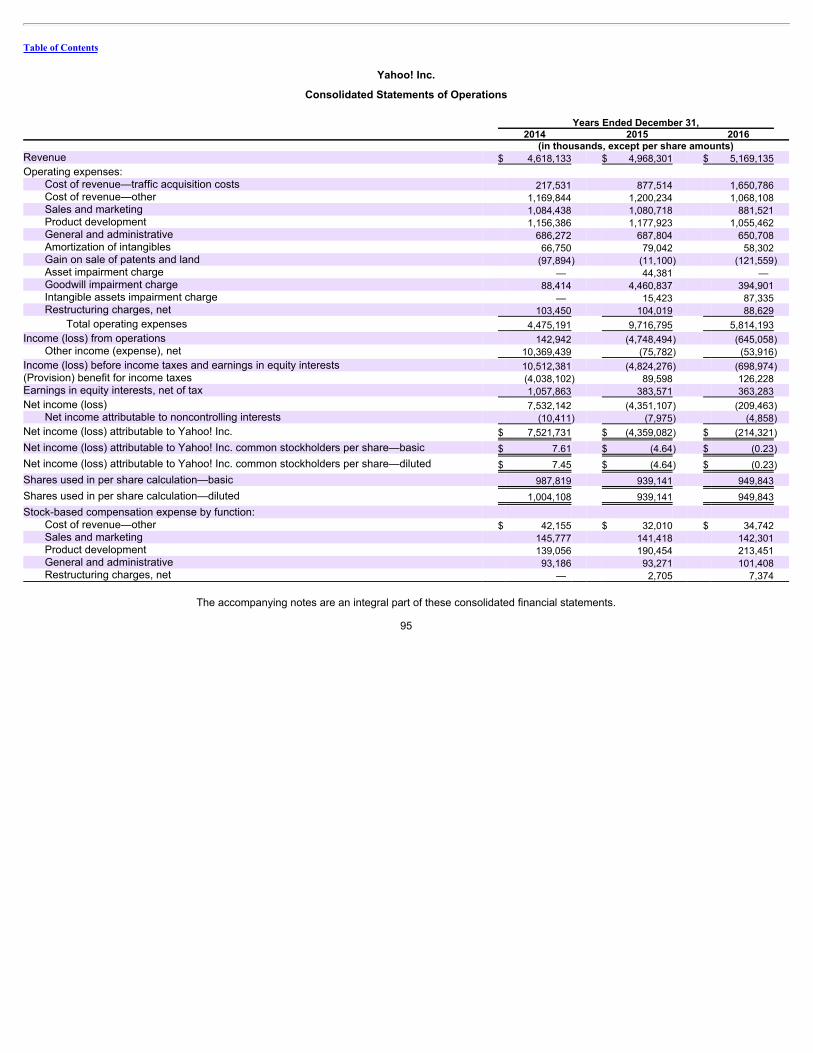
Table of Contents
Yahoo! Inc.
Consolidated Statements of Operations Years Ended December 31, 2014 2015 2016 (in thousands, except per share amounts) Revenue $ 4,618,133 $ 4,968,301 $ 5,169,135
Operating expenses: Cost of revenue—traffic acquisition costs 217,531 877,514 1,650,786 Cost of revenue—other 1,169,844 1,200,234 1,068,108 Sales and marketing 1,084,438 1,080,718 881,521 Product development 1,156,386 1,177,923 1,055,462 General and administrative 686,272 687,804 650,708 Amortization of intangibles 66,750 79,042 58,302 Gain on sale of patents and land (97,894) (11,100) (121,559) Asset impairment charge — 44,381 — Goodwill impairment charge 88,414 4,460,837 394,901 Intangible assets impairment charge — 15,423 87,335 Restructuring charges, net 103,450 104,019 88,629
Total operating expenses 4,475,191 9,716,795 5,814,193
Income (loss) from operations 142,942 (4,748,494) (645,058) Other income (expense), net 10,369,439 (75,782) (53,916)
Income (loss) before income taxes and earnings in equity interests 10,512,381 (4,824,276) (698,974) (Provision) benefit for income taxes (4,038,102) 89,598 126,228 Earnings in equity interests, net of tax 1,057,863 383,571 363,283
Net income (loss) 7,532,142 (4,351,107) (209,463) Net income attributable to noncontrolling interests (10,411) (7,975) (4,858)
Net income (loss) attributable to Yahoo! Inc. $ 7,521,731 $ (4,359,082) $ (214,321)
Net income (loss) attributable to Yahoo! Inc. common stockholders per share—basic $ 7.61 $ (4.64) $ (0.23)
Net income (loss) attributable to Yahoo! Inc. common stockholders per share—diluted $ 7.45 $ (4.64) $ (0.23)
Shares used in per share calculation—basic 987,819 939,141 949,843
Shares used in per share calculation—diluted 1,004,108 939,141 949,843
Stock-based compensation expense by function: Cost of revenue—other $ 42,155 $ 32,010 $ 34,742 Sales and marketing 145,777 141,418 142,301 Product development 139,056 190,454 213,451 General and administrative 93,186 93,271 101,408 Restructuring charges, net — 2,705 7,374
The accompanying notes are an integral part of these consolidated financial statements.
95

Table of Contents
Yahoo! Inc.
Consolidated Statements of Comprehensive Income (Loss) Years Ended December 31, 2014 2015 2016 (in thousands) Net income (loss) $ 7,532,142 $ (4,351,107) $ (209,463)
Available-for-sale securities: Unrealized gains (losses) on available-for-sale securities, net of taxes of $(15,170,607),$3,551,551, and $(1,000,094) for 2014, 2015, and 2016, respectively 22,072,073 (5,166,595) 1,458,245 Reclassification adjustment for realized (gains) losses on available-for-sale securitiesincluded in net income (loss), net of taxes of $1,339, $(104), and $(100) for 2014, 2015, and2016, respectively (2,218) 174 181
Net change in unrealized gains (losses) on available-for-sale securities, net of tax 22,069,855 (5,166,421) 1,458,426
Foreign currency translation adjustments (“CTA”): Foreign CTA (losses) gains, net of taxes of $1,734, $1,279, and $(90) for 2014, 2015, and2016, respectively (363,013) (279,135) 498,036 Net investment hedge CTA gains (losses), net of taxes of $(79,037), $(1,941), and $18,766for 2014, 2015, and 2016, respectively 130,904 3,333 (34,005) Reclassification adjustment for realized (gains) losses included in CTA, net of taxes of$30,325, $0, and $0 for 2014, 2015, and 2016, respectively (50,301) — (20,094)
Net foreign CTA (losses) gains, net of tax (282,410) (275,802) 443,937
Cash flow hedges: Unrealized gains (losses) on cash flow hedges, net of taxes of $(3,044), $(490), and $2,645for 2014, 2015, and 2016, respectively 5,704 (5,795) (4,799) Reclassification adjustment for realized (gains) losses on cash flow hedges included in netincome (loss), net of taxes of $2,771, $1,319, and $(2,369) for 2014, 2015, and 2016,respectively (5,259) 4,421 4,298
Net change in unrealized gains (losses) on cash flow hedges, net of tax 445 (1,374) (501)
Other comprehensive income (loss) 21,787,890 (5,443,597) 1,901,862
Comprehensive income (loss) 29,320,032 (9,794,704) 1,692,399 Less: comprehensive income attributable to noncontrolling interests (10,411) (7,975) (4,858)
Comprehensive income (loss) attributable to Yahoo! Inc. $ 29,309,621 $ (9,802,679) $ 1,687,541
The accompanying notes are an integral part of these consolidated financial statements.
96

Table of Contents
Yahoo! Inc.
Consolidated Statements of Stockholders’ Equity Years Ended December 31, 2014 2015 2016 (in thousands) Common stock
Balance, beginning of year $ 1,015 $ 945 $ 959 Common stock issued 24 14 10 Common stock retired (94) — —
Balance, end of year 945 959 969
Additional paid-in capital Balance, beginning of year 8,688,304 8,499,475 8,807,273 Common stock and stock-based awards issued 306,608 58,778 17,498 Stock-based compensation expense 432,614 464,586 503,468 Tax benefits from stock-based awards 145,711 41,729 6,256 Tax withholdings related to net share settlements of restricted stock awards (280,879) (257,731) (209,053) Retirement of treasury stock (794,596) — — Other 1,713 436 17
Balance, end of year 8,499,475 8,807,273 9,125,459
Treasury stock Balance, beginning of year (200,228) (712,455) (911,533) Repurchases of common stock (2,430,436) (203,771) — Treasury shares reissuance 4,189 4,693 2,537 Accelerated share repurchases (1,732,794) — — Retirement of treasury stock 3,646,814 — —
Balance, end of year (712,455) (911,533) (908,996)
Retained earnings Balance, beginning of year 4,267,429 8,934,244 4,570,807 Net income (loss) attributable to Yahoo! Inc. 7,521,731 (4,359,082) (214,321) Retirement of treasury stock (2,852,124) — — Treasury shares reissuance (2,792) (4,355) (2,528)
Balance, end of year 8,934,244 4,570,807 4,353,958
Accumulated other comprehensive income Balance, beginning of year 318,389 22,019,628 16,576,031 Net change in unrealized gains (losses) on available-for-sale securities, net of tax 22,069,855 (5,166,421) 1,458,426 Net change in unrealized gains (losses) on cash flow hedges, net of tax 445 (1,374) (501) Foreign currency translation adjustments, net of tax (369,061) (275,802) 443,937
Balance, end of year 22,019,628 16,576,031 18,477,893
Total Yahoo! Inc. stockholders’ equity $ 38,741,837 $ 29,043,537 $ 31,049,283
The accompanying notes are an integral part of these consolidated financial statements.
97

Table of Contents
Yahoo! Inc.
Consolidated Statements of Stockholders’ Equity—(Continued) Years Ended December 31, 2014 2015 2016 Number of Outstanding Shares (in thousands) Common stock
Balance, beginning of year 1,014,338 936,838 945,854 Common stock and restricted stock issued 24,197 12,824 9,569 Restricted stock issued (forfeited) under compensation arrangements related to acquisitions — 468 (115) Accelerated share repurchase (39,859) — — Repurchases of common stock (61,838) (4,276) —
Balance, end of year 936,838 945,854 955,308
The accompanying notes are an integral part of these consolidated financial statements.
98

Table of Contents
Yahoo! Inc.
Consolidated Statements of Cash Flows Years Ended December 31, 2014 2015 2016 (in thousands) CASH FLOWS FROM OPERATING ACTIVITIES:
Net income (loss) $ 7,532,142 $ (4,351,107) $ (209,463) Adjustments to reconcile net income (loss) to net cash provided by (used in) operatingactivities:
Depreciation 475,031 472,894 407,341 Amortization of intangible assets 131,537 136,719 100,214 Accretion of convertible notes discount 59,838 63,061 66,461 Stock-based compensation expense 420,174 459,858 499,276 Non-cash asset impairment charge — 44,381 — Non-cash goodwill impairment charge 88,414 4,460,837 394,901 Non-cash intangible assets impairment charge — 15,423 87,335 Non-cash restructuring (reversals) charges (3,394) 3,150 1,227 Non-cash accretion on marketable securities 30,878 47,218 25,280 Foreign exchange loss (gain) 15,978 4,376 (27,428) Gain on sale of assets and other (11,383) (2,878) (3,316) Gain on sale of Alibaba Group ADSs (10,319,437) — — Gain on sales of patents and land (97,894) (11,100) (121,559) (Gain) loss on Hortonworks warrants (98,062) 19,199 50,046 Earnings in equity interests (1,057,863) (383,571) (363,283) Tax benefits from stock-based awards 145,711 41,729 6,256 Excess tax benefits from stock-based awards (149,582) (58,282) (18,007) Deferred income taxes 465,873 (42,341) (224,737) Dividends received from equity investees 83,685 142,045 156,968 Changes in assets and liabilities, net of effects of acquisitions:
Accounts receivable 29,278 (39,065) (43,029) Prepaid expenses and other (82,419) 21,842 376,351 Accounts payable 14,165 (59,965) (4,550) Accrued expenses and other liabilities 156,307 109,776 105,677 Incomes taxes payable related to sale of Alibaba Group ADSs 3,282,293 (3,282,293) — Deferred revenue (194,920) (195,328) (13,098)
Net cash provided by (used in) operating activities 916,350 (2,383,422) 1,248,863
The accompanying notes are an integral part of these consolidated financial statements.
99

Table of Contents
Yahoo! Inc.
Consolidated Statements of Cash Flows—(Continued) Years Ended December 31, 2014 2015 2016 (in thousands) CASH FLOWS FROM INVESTING ACTIVITIES:
Acquisition of property and equipment (413,019) (554,163) (239,109) Proceeds from sales of property and equipment 17,404 11,176 249,787 Purchases of marketable securities (7,890,092) (5,206,245) (7,817,485) Proceeds from sales of marketable securities 2,269,659 822,997 387,254 Proceeds from maturities of marketable securities 945,696 6,691,645 5,816,713 Proceeds from sale of Alibaba Group ADSs, net of underwriting discounts,commissions, and fees 9,404,974 — — Acquisitions, net of cash acquired (859,036) (175,693) — Proceeds from sales of patents 86,300 29,100 1,500 Purchases of intangible assets (2,658) (4,811) (2,045) Proceeds from settlement of derivative hedge contracts 254,496 147,179 39,007 Payments for settlement of derivative hedge contracts (5,454) (8,817) (9,717) Payments for equity investments in privately held companies (74,399) — (9) Other investing activities, net 4,630 (256) (161)
Net cash provided by (used in) investing activities $ 3,738,501 $ 1,752,112 $ (1,574,265)
CASH FLOWS FROM FINANCING ACTIVITIES: Proceeds from issuance of common stock $ 308,029 $ 59,130 $ 17,517 Repurchases of common stock (4,163,227) (203,771) — Excess tax benefits from stock-based awards 149,582 58,282 18,007 Tax withholdings related to net share settlements of restricted stock units (280,879) (257,731) (209,053) Distributions to noncontrolling interests (22,344) (15,847) (5,948) Other financing activities, net (13,627) (17,321) (14,205)
Net cash used in financing activities (4,022,466) (377,258) (193,682)
Effect of exchange rate changes on cash and cash equivalents (45,877) (23,619) 6,642 Net change in cash and cash equivalents 586,508 (1,032,187) (512,442)
Cash and cash equivalents at beginning of period 2,077,590 2,664,098 1,631,911
Cash and cash equivalents at end of period $ 2,664,098 $ 1,631,911 $ 1,119,469
NON-CASH ACTIVITIES: Change in non-cash acquisitions of property and equipment $ (27,533) $ (12,392) $ (4,277)
The accompanying notes are an integral part of these consolidated financial statements.
100
Table of Contents
Yahoo! Inc.
Notes to Consolidated Financial Statements
Note 1 The Company and Summary of Significant Accounting Policies TheCompany. Yahoo! Inc., together with its consolidated subsidiaries (“Yahoo” or the “Company”), is a guide to digital information discovery, focused oninforming, connecting, and entertaining users through its search, communications, and digital content products. By creating highly personalized experiences, theCompany helps users discover the information that matters most to them around the world—on mobile or desktop. The Company creates value for advertiserswith a streamlined, simple advertising technology that leverages Yahoo’s data, content, and technology to connect advertisers with their target audiences.Advertisers can build their businesses through advertising to targeted audiences on the Company’s online properties and services (“Yahoo Properties”) and adistribution network of third party entities (“Affiliates”) who integrate the Company’s advertising offerings into their websites or other offerings (“Affiliate sites”).The Company’s revenue is generated principally from search and display advertising. The Company manages and measures its business geographically,principally in the Americas, EMEA (Europe, Middle East, and Africa) and Asia Pacific.
BasisofPresentation. The consolidated financial statements include the accounts of Yahoo! Inc. and its majority-owned or otherwise controlled subsidiaries.All intercompany accounts and transactions have been eliminated. Investments in entities in which the Company can exercise significant influence, but does notown a majority equity interest or otherwise control, are accounted for using the equity method and are included as investments in equity interests on theconsolidated balance sheets. The Company has included the results of operations of acquired companies from the date of the acquisition.
The preparation of consolidated financial statements in conformity with generally accepted accounting principles (“GAAP”) in the United States (“U.S.”) requiresmanagement to make estimates, judgments, and assumptions that affect the reported amounts of assets, liabilities, revenue, and expenses and the relateddisclosure of contingent assets and liabilities. On an ongoing basis, the Company evaluates its estimates, including those related to revenue, the useful lives oflong-lived assets including property and equipment and intangible assets, investment fair values, originally developed content, acquired content, stock-basedcompensation, goodwill, income taxes, contingencies, and restructuring charges. The Company bases its estimates of the carrying value of certain assets andliabilities on historical experience and on various other assumptions that are believed to be reasonable under the circumstances, when these carrying values arenot readily available from other sources. Actual results may differ from these estimates.
ConcentrationofRisk. Financial instruments that potentially subject the Company to significant concentration of credit and equity price risk consist primarilyof cash equivalents, marketable securities (including Alibaba Group Holding Limited (“Alibaba Group”) and Hortonworks, Inc. (“Hortonworks”) equity securities,as well as our portfolio of marketable debt securities), accounts receivable, and derivative financial instruments. The primary focus of the Company’s investmentstrategy is to preserve capital and meet liquidity requirements. A large portion of the Company’s cash and cash equivalents and short-term and long-terminvestments is managed by external managers within the guidelines of the Company’s investment policy. The Company’s investment policy addresses the levelof credit exposure by limiting the concentration in any one corporate issuer or sector and establishing a minimum allowable credit rating. To manage the riskexposure, the Company maintains its portfolio of cash and cash equivalents and short-term and long-term investments in marketable securities, including U.S.and foreign government, agency, municipal and highly rated corporate debt obligations and money market funds.
101

Table of Contents
The fair value of the equity investments in Alibaba Group and Hortonworks will vary over time and is subject to a variety of risks including: companyperformance, macro-economic, regulatory, industry, and systemic risks of the equity markets overall. Consequently, the carrying value of the Company’sinvestment portfolio will vary over time as the value of the Company’s investments in marketable equity securities fluctuates, including Alibaba Group andHortonworks changes.
Accounts receivable are typically unsecured and are derived from revenue earned from customers. The Company performs ongoing credit evaluations of itscustomers and maintains allowances for potential credit losses.
The Company’s derivative instruments, including the convertible note hedge transactions, expose the Company to credit risk to the extent that its derivativecounterparties become unable to meet their financial obligations under the terms of the agreements. The Company seeks to mitigate this risk by limiting itsderivative counterparties to major financial institutions and by spreading the risk across several major financial institutions. In addition, the potential risk of losswith any one counterparty resulting from this type of credit risk is monitored on an ongoing basis. See “Note 9—Foreign Currency Derivative FinancialInstruments” for additional information related to the Company’s derivative instruments.
The Company also holds warrants in Hortonworks, which expose the Company to variability in fair value based on changes in the stock price and volatility asinputs to the Black-Scholes model.
Revenue under the Company’s Search and Advertising Services and Sales Agreement (as amended, “Microsoft Search Agreement”) with Microsoft Corporation(“Microsoft”) represented approximately 35 percent, 35 percent, and 37 percent of the Company’s revenue for the years ended December 31, 2014, 2015, and2016, respectively, and no other individual customer accounted for 10 percent or more of the Company’s revenue for 2014, 2015, or 2016. As of December 31,2015 and 2016, no one customer accounted for 10 percent or more of the accounts receivable balance.
ComprehensiveIncome(Loss). Comprehensive income (loss) consists of two components, net income (loss) and other comprehensive income (loss). Othercomprehensive income (loss) refers to revenue, expenses, and gains and losses that under GAAP are recorded as an element of stockholders’ equity but areexcluded from net income (loss). The Company’s other comprehensive income (loss) consists of foreign currency translation adjustments from subsidiaries orequity method investments where the local currency is the functional currency, from unrealized gains and losses on marketable securities classified asavailable-for-sale, unrealized gains and losses on cash flow hedges, net changes in fair value of derivative instruments related to the Company’s net investmenthedges, as well as the Company’s share of its equity investees’ other comprehensive income.
ForeignCurrency. The functional currency of the Company’s international subsidiaries is evaluated on a case-by-case basis and is often the local currency.The financial statements of these subsidiaries are translated into U.S. dollars using period-end rates of exchange for assets and liabilities, historical rates ofexchange for equity, and average rates of exchange for the period for revenue and expenses. Translation gains (losses) are recorded in accumulated othercomprehensive income as a component of stockholders’ equity. In addition, the Company records translation gains (losses) related to its foreign equity methodinvestments in accumulated other comprehensive income. The Company records foreign currency transaction gains and losses, realized and unrealized andforeign exchange gains and losses due to re-measurement of monetary assets and liabilities denominated in non-functional currencies in other income(expense), net in the consolidated statements of operations. The Company recorded $15 million and $22 million net losses in 2014 and 2015, respectively, and a$4 million net gain in 2016.
102

Table of Contents
CashandCashEquivalents,Short-andLong-TermMarketableSecurities. The Company invests its excess cash in money market funds, time deposits,and liquid debt securities of the U.S. and foreign governments and their agencies, and high credit-quality corporate issuers which are classified as marketabledebt securities and cash equivalents. All investments in debt securities with an original maturity of 90 days or less are considered cash equivalents. Investmentsin debt securities with remaining maturities of less than 12 months from the balance sheet date are classified as current assets, which are available for use tofund current operations. Investments with remaining maturities greater than 12 months from the balance sheet date are classified as long-term assets.
Operating cash deposits held with banks may exceed the amount of insurance provided on such deposits. Generally, these deposits may be redeemed upondemand and are maintained with financial institutions with reputable credit and therefore bear limited credit risk. The Company seeks to mitigate its credit risk byspreading such risk across multiple counterparties and monitoring the risk profiles of these counterparties.
The Company’s marketable equity securities, including Alibaba Group and Hortonworks, are classified as available-for-sale and are reported at fair value, withunrealized gains and losses, net of tax, recorded in accumulated other comprehensive income. The change in the classification of the Company’s investments inAlibaba Group and Hortonworks to available-for-sale marketable securities exposes the Company’s investment portfolio to increased equity price risk. TheCompany evaluates the marketable equity securities periodically for possible other-than-temporary impairment. A decline of fair value below cost basis isconsidered an other-than-temporary impairment if the Company has the intent to sell the security or it is more likely than not that the Company will be required tosell the security before recovery of the entire cost basis. In those instances, an impairment charge equal to the difference between the fair value and the costbasis is recognized in earnings. Regardless of the Company’s intent or requirement to sell the marketable equity securities, an impairment is considered other-than-temporary if the Company does not expect to recover the entire cost basis; in those instances, a loss equal to the difference between fair value and the costbasis of the marketable equity security is recognized in earnings.
Realized gains or losses and declines in value judged to be other-than-temporary, if any, on available-for-sale securities are reported in other income (expense),net. The Company evaluates its marketable debt investments periodically for possible other-than-temporary impairment. A decline of fair value below amortizedcosts of debt securities is considered an other-than-temporary impairment if the Company has the intent to sell the security or it is more likely than not that theCompany will be required to sell the security before recovery of the entire amortized cost basis. In those instances, an impairment charge equal to the differencebetween the fair value and the amortized cost basis is recognized in earnings. Regardless of the Company’s intent or requirement to sell a debt security, animpairment is considered other-than-temporary if the Company does not expect to recover the entire amortized cost basis; in those instances, a credit loss equalto the difference between the present value of the cash flows expected to be collected based on credit risk and the amortized cost basis of the debt security isrecognized in earnings. The Company has no current requirement or intent to sell a material portion of debt securities as of December 31, 2016. The Companyexpects to recover up to (or beyond) the initial cost of investment for securities held. In computing realized gains and losses on available-for-sale securities, theCompany determines cost based on amounts paid, including direct costs such as commissions to acquire the security, using the specific identification method.During the years ended December 31, 2014, 2015, and 2016, gross realized gains and losses on available-for-sale marketable debt and equity securities werenot material.
AllowanceforDoubtfulAccounts. The Company records its allowance for doubtful accounts based upon its assessment of various factors. The Companyconsiders historical experience, the age of the
103

Table of Contents
accounts receivable balances, the credit quality of its customers, current economic conditions, and other factors that may affect customers’ ability to pay todetermine the level of allowance required.
ForeignCurrencyDerivativeFinancialInstruments. The Company uses derivative financial instruments, primarily foreign currency forward contracts, tomitigate certain foreign currency exposures. The Company hedges, on an after-tax basis, a portion of its net investment in Yahoo Japan Corporation (“YahooJapan”). The Company has designated these foreign currency forward contracts as net investment hedges. The effective portion of changes in fair value isrecorded in accumulated other comprehensive income on the Company’s consolidated balance sheet and any ineffective portion is recorded in other income(expense), net on the Company’s consolidated statements of operations. The Company expects the net investment hedges to be effective, on an after-tax basis,and effectiveness will be assessed each quarter. Should any portion of the net investment hedge become ineffective, the ineffective portion will be reclassified toother income (expense), net on the Company’s consolidated statements of operations. The fair values of the net investment hedges are determined usingquoted observable inputs. Gains and losses reported in accumulated other comprehensive income will not be reclassified into earnings until a sale of theCompany’s underlying investment.
For derivatives designated as cash flow hedges, the effective portion of the unrealized gains or losses on these forward contracts is recorded in accumulatedother comprehensive income on the Company’s consolidated balance sheets and reclassified into revenue in the consolidated statements of operations whenthe underlying hedged revenue is recognized. If the cash flow hedges were to become ineffective, the ineffective portion would be immediately recorded in otherincome (expense), net in the Company’s consolidated statements of operations.
The Company hedges certain of its net recognized foreign currency assets and liabilities with foreign exchange forward contracts to reduce the risk that itsearnings and cash flows will be adversely affected by changes in foreign currency exchange rates. These balance sheet hedges are used to partially offset theforeign currency exchange gains and losses generated by the re-measurement of certain assets and liabilities denominated in non-functional currency. Changesin the fair value of these derivatives are recorded in other income (expense), net on the Company’s consolidated statements of operations. The fair values of thebalance sheet hedges are determined using quoted observable inputs.
The Company recognizes all derivative instruments as other assets or liabilities on the Company’s consolidated balance sheets at fair value. See Note 9—“Foreign Currency Derivative Financial Instruments” for a full description of the Company’s derivative financial instrument activities and related accounting.
Property andEquipment. Buildings are stated at cost and depreciated using the straight-line method over the estimated useful lives of 20 to 25 years.Leasehold improvements are amortized over the lesser of their expected useful lives and the remaining lease term. Computers and equipment and furniture andfixtures are stated at cost and depreciated using the straight-line method over the estimated useful lives of the assets, generally three to five years.
Property and equipment to be held and used are reviewed for impairment whenever events or changes in circumstances indicate that the carrying value of theassets may not be recoverable. Determination of recoverability is based on the lowest level of identifiable estimated undiscounted future cash flows resultingfrom the use of the asset and its eventual disposition. Measurement of any impairment loss for long-lived assets that management expects to hold and use isbased on the excess of the carrying value of the asset over its fair value. No impairments of such assets were identified during any of the periods presented.
104

Table of Contents
CapitalizedSoftwareandLabor. The Company capitalized certain software and labor costs totaling approximately $85 million, $31 million, and $25 millionduring 2014, 2015, and 2016, respectively. The Company capitalizes eligible costs to acquire or develop internal-use software that are incurred subsequent tothe preliminary project stage through the development stage. The estimated useful life of costs capitalized is evaluated for each specific project and ranges fromone to three years. Actual economic lives may differ from estimated useful lives. Periodic reviews could result in a change in estimated useful lives and thereforeamortization expense in future periods. During 2014, 2015, and 2016, the amortization of capitalized costs totaled approximately $161 million, $144 million, and$85 million, respectively. Capitalized software and labor costs are included in property and equipment, net. Included in the capitalized amounts above are$12 million, $5 million, and $4 million, respectively, of stock-based compensation expense in the years ended December 31, 2014, 2015, and 2016.
Goodwill. Goodwill represents the excess of the purchase price over the fair value of the net tangible and intangible assets acquired in a businesscombination. Goodwill is not amortized, but is tested for impairment on an annual basis and more frequently if impairment indicators are present. The Company’sreporting units are one level below the operating segments level. The reporting unit’s carrying value is compared to its fair value. The estimated fair values of thereporting units are determined using either the market approach, income approach or a combination of the market and income approach. Goodwill is consideredimpaired if the carrying value of the reporting unit exceeds its estimated fair value. The income approach uses expected future operating results and failure toachieve these expected results may cause a future impairment of goodwill at the reporting unit. If the carrying value of the reporting unit exceeds its estimatedfair value, the second step of the goodwill impairment test is performed by comparing the carrying value of the goodwill in the reporting unit to its implied fairvalue. The implied fair value is calculated by allocating all of the assets and liabilities of the reporting unit, including any unrecognized intangible assets, in ahypothetical analysis that calculates the implied fair value of goodwill in the same manner as if the reporting unit was being acquired in a business combination.An impairment charge is recognized for the excess of the carrying value of goodwill over its implied estimated fair value. The Company conducted its annualgoodwill impairment test as of October 31, 2016. See Note 5—“Goodwill” for results of the goodwill impairment test.
IntangibleAssets. Definite-lived intangible assets are carried at cost and are amortized over their estimated useful lives, generally on a straight-line basisover one to seven years as the pattern of use is ratable. The Company reviews identifiable amortizable intangible assets to be held and used for impairmentwhenever events or changes in circumstances indicate that the carrying value of the assets may not be recoverable. Determination of recoverability is based onthe lowest level of identifiable estimated undiscounted cash flows resulting from use of the asset and its eventual disposition. Intangible assets with indefiniteuseful lives are not amortized but are reviewed for impairment whenever events or changes in circumstances indicate that it is more likely than not that the fairvalue is less than its carrying amount. If the Company determines that an intangible asset with an indefinite life is more likely than not impaired, a quantitativetest comparing the fair value of the indefinite-lived purchased intangible asset with its carrying amount is performed. The Company estimates the fair value ofindefinite-lived purchased intangible assets using an income approach. Measurement of any impairment losses on both definite-lived and indefinite-livedintangible assets are based on the excess of the carrying value of the asset over its fair value. See Note 6—“Intangible Assets, Net” for additional information.
Originally DevelopedContentandAcquiredContent. Originally developed content and acquired content are both carried at cost. Originally developedcontent is amortized based on the expected pattern of viewing. Acquired content is amortized on a straight-line basis over the shorter of each program’scontractual window of availability or estimated period of use, beginning with the month of first availability. Marketing and general and administrative costs areexpensed as incurred.
105
Table of Contents
For originally developed content, the Company performs regular recoverability assessments on a program-by-program basis. If there are any events or changesin circumstances indicating that the Company should assess whether the fair value of originally developed content is less than its unamortized costs, theCompany performs a fair value analysis using an expected cash flow approach. The amount by which the unamortized costs of the originally developed contentexceed estimated fair value is charged to expense as an asset impairment. During the year ended December 31, 2015, the Company recorded an assetimpairment charge of $16 million related to originally developed content.
For acquired content, the Company compares the net realizable value on a program-by-program basis with the unamortized cost. The amount by which theunamortized costs of the acquired content exceed net realizable value is charged to expense as an asset impairment. During the year ended December 31,2015, the Company recorded an asset impairment charge of $28 million related to acquired content, primarily driven by a reduction of forecasted revenues to begenerated from advertising on Yahoo Properties.
InvestmentsinEquityInterests. Investments in the common stock of entities in which the Company can exercise significant influence but does not own amajority equity interest or otherwise control are accounted for using the equity method and are included as investments in equity interests on the consolidatedbalance sheets. The Company records its share of the results of these companies one quarter in arrears within earnings in equity interests in the consolidatedstatements of operations. Investments in privately held equity interests in which the Company cannot exercise significant influence are accounted for using thecost method of accounting.
The Company reviews its investments for other-than-temporary impairment whenever events or changes in business circumstances indicate that the carryingvalue of the investment may not be fully recoverable. Investments identified as having an indication of impairment are subject to further analysis to determine ifthe impairment is other-than-temporary and this analysis requires estimating the fair value of the investment. The determination of fair value of the investmentinvolves considering factors such as the stock prices of public companies in which the Company has an equity investment, current economic and marketconditions, the operating performance of the companies including current earnings trends and forecasted cash flows, and other company and industry specificinformation.
Leasing. The Company leases office space and data centers under operating leases and certain data center equipment under capital lease agreements withoriginal lease periods up to 15 years. Assets acquired under capital leases are amortized over the lesser of the useful life of the asset or the lease term. For theyears ended December 31, 2014, 2015, and 2016, the Company expensed $5 million, $4 million, and $3 million of interest related to capital leases, respectively,which approximated the cash payments made for interest. As of December 31, 2015 and 2016, the Company had net capital lease obligations included in othershort-term and long-term liabilities on the consolidated balance sheets of $33 million and $23 million, respectively. Certain of the operating lease agreementscontain rent holidays and rent escalation provisions. For purposes of recognizing these lease incentives on a straight-line basis over the term of the lease, theCompany uses the date that the Company has the right to control the asset to begin rent expense. Lease renewal periods are considered on alease-by-lease basis and are generally not included in the period of straight-line recognition of rent expense.
The Company establishes assets and liabilities for the estimated construction costs incurred under build-to-suit lease arrangements to the extent the Company isinvolved in the construction of structural improvements or take construction risk prior to commencement of a lease. Upon the right to control the facilities underbuild-to-suit leases, the Company assesses whether these arrangements
106

Table of Contents
qualify for sales recognition under the sale-leaseback accounting guidance. If the Company continues to be the deemed owner, the facilities are accounted foras finance leases.
IncomeTaxes. Deferred income taxes are determined based on the differences between the financial reporting and tax bases of assets and liabilities and aremeasured using the currently enacted tax rates and laws. The Company records a valuation allowance against particular deferred income tax assets if it is morelikely than not that those assets will not be realized. The provision for income taxes comprises the Company’s current tax liability and change in deferred incometax assets and liabilities.
Significant judgment is required in evaluating the Company’s uncertain tax positions and determining its provision for income taxes. The Company establishesliabilities for tax-related uncertainties based on estimates of whether, and the extent to which, additional taxes will be due. These liabilities are established whenthe Company believes that certain positions might be challenged despite its belief that its tax return positions are in accordance with applicable tax laws. TheCompany adjusts these liabilities when new information becomes available, such as the closing of a tax audit, new tax legislation, developments in case law orinteractions with the tax authorities. To the extent that the final tax outcome of these matters is different than the amounts recorded, such differences will affectthe provision for income taxes in the period in which such determination is made. The provision for income taxes includes the effect of changes to liabilities fortax-related uncertainties that are considered appropriate, as well as the related net interest and penalties. Income taxes paid, net of refunds received, were$90 million, $3 billion in the years ended December 31, 2014 and 2015, respectively. Income taxes refund received, net of payments made, was $151 million inthe year ended December 31, 2016. Interest paid was not material in any of the years presented. See Note 16—“Income Taxes” for additional information.
RevenueRecognition. Revenue is generated from offerings, which include clicks on text-based links to advertisers’ websites that appear primarily on searchresults pages (“search advertising”), the display of graphical, non-graphical, and video advertisements (“display advertising”), and other sources.
Search Revenue. Search revenue is generated from mobile and desktop clicks on text-based links to advertisers’ websites that appear primarily on searchresults pages (“search advertising”). The Company recognizes revenue from search advertising on Yahoo Properties and Affiliate sites. Search revenue isrecognized based on Paid Clicks. A Paid Click occurs when an end-user clicks on a sponsored listing on Yahoo Properties and Affiliate sites for which anadvertiser pays on a per click basis. The Company also sells search traffic to certain customers where it does not have a direct relationship with the advertiser, inwhich case revenue is also recognized based on Paid Clicks. In the Microsoft Search Agreement, the Company agreed to request paid search results fromMicrosoft for 51 percent of search queries originating from desktop computers accessing Yahoo Properties and Affiliate sites (the “Volume Commitment”). Thereis no such Volume Commitment for traffic generated on mobile devices.
On April 15, 2015, the Company and Microsoft Corporation (“Microsoft”) entered into the Eleventh Amendment (the “Eleventh Amendment”) to the Search andAdvertising Services and Sales Agreement (“Microsoft Search Agreement”). Pursuant to the Eleventh Amendment, the Company completed the transition of itsexclusive sales responsibilities to Microsoft for Microsoft’s paid search services to premium advertisers in the United States, Canada, and Europe on April 1,2016 and in its remaining markets (other than Taiwan and Hong Kong) on June 1, 2016. Following the transition in each respective market, Yahoo is consideredthe principal in the sale of traffic to Microsoft and other customers because Yahoo is the primary obligor in its arrangements with Microsoft and has discretion inhow search queries from Affiliate sites will be fulfilled and monetized. As a result,
107
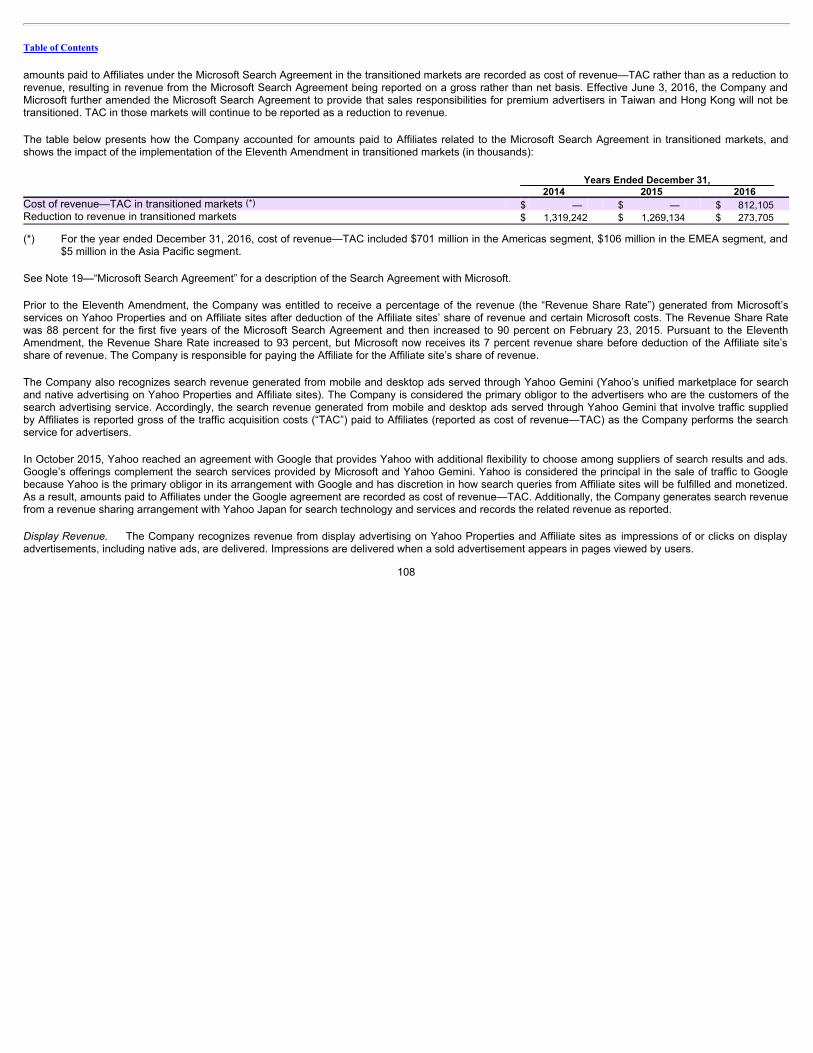
Table of Contents
amounts paid to Affiliates under the Microsoft Search Agreement in the transitioned markets are recorded as cost of revenue—TAC rather than as a reduction torevenue, resulting in revenue from the Microsoft Search Agreement being reported on a gross rather than net basis. Effective June 3, 2016, the Company andMicrosoft further amended the Microsoft Search Agreement to provide that sales responsibilities for premium advertisers in Taiwan and Hong Kong will not betransitioned. TAC in those markets will continue to be reported as a reduction to revenue.
The table below presents how the Company accounted for amounts paid to Affiliates related to the Microsoft Search Agreement in transitioned markets, andshows the impact of the implementation of the Eleventh Amendment in transitioned markets (in thousands): Years Ended December 31, 2014 2015 2016 Cost of revenue—TAC in transitioned markets (*) $ — $ — $ 812,105 Reduction to revenue in transitioned markets $ 1,319,242 $ 1,269,134 $ 273,705
(*) For the year ended December 31, 2016, cost of revenue—TAC included $701 million in the Americas segment, $106 million in the EMEA segment, and
$5 million in the Asia Pacific segment.
See Note 19—“Microsoft Search Agreement” for a description of the Search Agreement with Microsoft.
Prior to the Eleventh Amendment, the Company was entitled to receive a percentage of the revenue (the “Revenue Share Rate”) generated from Microsoft’sservices on Yahoo Properties and on Affiliate sites after deduction of the Affiliate sites’ share of revenue and certain Microsoft costs. The Revenue Share Ratewas 88 percent for the first five years of the Microsoft Search Agreement and then increased to 90 percent on February 23, 2015. Pursuant to the EleventhAmendment, the Revenue Share Rate increased to 93 percent, but Microsoft now receives its 7 percent revenue share before deduction of the Affiliate site’sshare of revenue. The Company is responsible for paying the Affiliate for the Affiliate site’s share of revenue.
The Company also recognizes search revenue generated from mobile and desktop ads served through Yahoo Gemini (Yahoo’s unified marketplace for searchand native advertising on Yahoo Properties and Affiliate sites). The Company is considered the primary obligor to the advertisers who are the customers of thesearch advertising service. Accordingly, the search revenue generated from mobile and desktop ads served through Yahoo Gemini that involve traffic suppliedby Affiliates is reported gross of the traffic acquisition costs (“TAC”) paid to Affiliates (reported as cost of revenue—TAC) as the Company performs the searchservice for advertisers.
In October 2015, Yahoo reached an agreement with Google that provides Yahoo with additional flexibility to choose among suppliers of search results and ads.Google’s offerings complement the search services provided by Microsoft and Yahoo Gemini. Yahoo is considered the principal in the sale of traffic to Googlebecause Yahoo is the primary obligor in its arrangement with Google and has discretion in how search queries from Affiliate sites will be fulfilled and monetized.As a result, amounts paid to Affiliates under the Google agreement are recorded as cost of revenue—TAC. Additionally, the Company generates search revenuefrom a revenue sharing arrangement with Yahoo Japan for search technology and services and records the related revenue as reported.
Display Revenue. The Company recognizes revenue from display advertising on Yahoo Properties and Affiliate sites as impressions of or clicks on displayadvertisements, including native ads, are delivered. Impressions are delivered when a sold advertisement appears in pages viewed by users.
108
Table of Contents
Clicks are delivered when a user clicks on an advertisement. Arrangements for these services generally have terms of up to one year. For display advertising onAffiliate sites, the Company pays Affiliates from the revenue generated from the display of these advertisements on the Affiliate sites. Traffic acquisition costs(“TAC”) are payments made to Affiliates and payments made to companies that direct consumer and business traffic to Yahoo Properties. The display revenuederived from these arrangements that involve traffic supplied by Affiliates is reported gross of the TAC paid to Affiliates (reported as cost of revenue—TAC) whenthe Company is the primary obligor to the advertisers who are the customers of the display advertising service.
From time-to-time, the Company may offer customized display advertising solutions to advertisers. These customized display advertising solutions combine theCompany’s standard display advertising with customized content, customer insights, and campaign analysis which are separate units of accounting. Due to theunique nature of these products, the Company may not be able to establish selling prices based on historical stand-alone sales or third-party evidence;therefore, the Company may use its best estimate to establish selling prices. The Company establishes best estimates within a range of selling pricesconsidering multiple factors including, but not limited to, class of advertiser, size of transaction, seasonality, margin objectives, observed pricing trends, availableonline inventory, industry pricing strategies, and market conditions. The Company believes the use of the best estimates of selling price allows revenuerecognition in a manner consistent with the underlying economics of the transaction.
Other Revenue. Other revenue includes listings-based services revenue, e-commerce transaction revenue, royalties, patent licenses and fees revenue.Listings-based services revenue is generated from a variety of consumer and business listings-based services, including classified advertising such as YahooLocal and other services. The Company recognizes listings-based services revenue when the services are performed. Transaction revenue is generated fromfacilitating commercial transactions through Yahoo Properties, principally from Yahoo Small Business, Yahoo Travel, and Yahoo Shopping. The Companyrecognizes transaction revenue when there is evidence that qualifying transactions have occurred. The Company also receives royalties from Yahoo Japanwhich are recognized when earned. Alibaba Group’s obligation to make royalty payments under the Technology and Intellectual Property License Agreement(the “TIPLA”) ceased on September 24, 2014 as a result of the Alibaba Group’s initial public offering (the “Alibaba Group IPO”) of American Depositary Shares(“ADSs”) and the Company’s recognition of the remaining TIPLA deferred revenue was completed on September 18, 2015. See Note 8—“Investments in EquityInterests Accounted for Using the Equity Method of Accounting” for additional information on the revenue recognized related to the TIPLA. Fees revenueconsists of revenue generated from a variety of consumer and business fee-based services as well as services for small businesses. The Company recognizesfees revenue when the services are performed.
In all cases, revenue is recognized only when the price is fixed or determinable, persuasive evidence of an arrangement exists, the service is performed, andcollectability of the related fee is reasonably assured. The Company’s arrangements generally do not include a provision for cancellation, termination, or refundsthat would significantly impact revenue recognition.
The Company accounts for cash consideration given to customers, for which it does not receive a separately identifiable benefit and cannot reasonably estimatefair value, as a reduction to revenue.
Current deferred revenue is comprised of contractual billings in excess of recognized revenue and payments received in advance of revenue recognition. Long-term deferred revenue includes amounts received for which revenue will not be earned within the next 12 months.
109

Table of Contents
Costofrevenue—TAC. TAC consists of payments made to Affiliates and payments made to companies that direct consumer and business traffic to YahooProperties. TAC is either recorded as a reduction of revenue or as cost of revenue—TAC.
TAC related to the Microsoft Search Agreement was recorded as a reduction to revenue for reporting periods through March 31, 2016. Beginning in the secondquarter of 2016, TAC related to the Microsoft Search Agreement is recorded as cost of revenue—TAC in markets that have completed the transition of exclusivesales responsibilities to Microsoft for paid search services to premium advertisers pursuant to the Eleventh Amendment as described above. See Note 19—“Microsoft Search Agreement” for additional information.
TAC recorded as cost of revenue—TAC also relates to the Company’s other offerings. The Company enters into Affiliate agreements of varying duration thatinvolve TAC. There are generally two economic structures of the Affiliate agreements: fixed payments with or without a guaranteed minimum amount of trafficdelivered or variable payments based on a percentage of the Company’s revenue or based on a certain metric, such as the number of searches or paid clicks.The Company expenses TAC under two different methods. Agreements with fixed payments are expensed ratably over the term the fixed payment covers or asthe traffic is delivered. Agreements based on a percentage of revenue, number of searches, or other metrics are expensed based on the volume of theunderlying activity or revenue multiplied by the agreed-upon price or rate.
The Company also has an agreement to compensate a third party, Mozilla Corporation (“Mozilla”), to make the Company the default search provider on certainof Mozilla’s products in the United States. The Company records these payments as cost of revenue—TAC.
Costofrevenue—other. Cost of revenue-other consists of bandwidth costs, stock-based compensation, content, and other expenses associated with theproduction and usage of Yahoo Properties, including expense and amortization of developed technology and patents. Cost of revenue—other also includescosts for Yahoo’s technology platforms and infrastructure, including depreciation expense of facilities and other operating costs, directly related to revenuegenerating activities.
AmortizationofIntangibles. Amortization of customer, affiliate, and advertiser-related relationships and tradenames, trademarks and domain names areclassified within amortization of intangibles. Amortization of developed technology and patents is included in cost of revenue—other.
ProductDevelopment. Product development expenses consist primarily of compensation-related expenses (including stock-based compensation expense)incurred for research and development, the development of, enhancements to, and maintenance and operation of Yahoo Properties, advertising products,technology platforms, and infrastructure. Depreciation expense, third-party technology and development expense, and other operating costs are also included inproduct development.
AdvertisingCosts. Costs of advertising are recorded as expense as advertising space or airtime is used. All other advertising costs are expensed asincurred. Advertising expense totaled approximately $142 million, $184 million, and $135 million for 2014, 2015, and 2016, respectively.
RestructuringCharges. The Company has developed and implemented restructuring initiatives to improve efficiencies across the organization, reduce itscost structure, and/or better align its resources with the Company’s product strategy. As a result of these plans, the Company has recorded restructuring chargescomprised principally of employee severance and associated termination costs related to the reduction of its workforce, the consolidation of certain real estatefacilities and data centers, losses on subleases, and contract termination costs. The Company’s
110
Table of Contents
restructuring plans include one-time termination benefits as well as certain contractual termination benefits or employee terminations under ongoing benefitarrangements. One-time termination benefits are recognized as a liability at estimated fair value when the approved plan of termination has been communicatedto employees, unless employees must provide future service, in which case the benefits are recognized ratably over the future service period. Ongoingtermination benefits arrangements are recognized as a liability at estimated fair value when the amount of such benefits becomes estimable and payment isprobable. Contract termination costs are recognized at estimated fair value when the entity terminates the contract in accordance with the contract terms.
These restructuring initiatives require management to make estimates in several areas including: (i) expenses for severance and other employee separationcosts; (ii) realizable values of assets made redundant, obsolete, or excessive; and (iii) the ability to generate sublease income and to terminate lease obligationsat the estimated amounts.
Stock-BasedCompensationExpense. The Company recognizes stock-based compensation expense, net of an estimated forfeiture rate and therefore onlyrecognizes compensation costs for those shares expected to vest over the service period of the award. Stock-based awards are valued based on the grant datefair value of these awards; the Company records stock-based compensation expense on a straight-line basis over the requisite service period, generally one tofour years.
Calculating stock-based compensation expense related to stock options requires the input of highly subjective assumptions, including the expected term of thestock options, stock price volatility, and the pre-vesting forfeiture rate of stock awards. The Company estimates the expected life of options granted based onhistorical exercise patterns, which the Company believes are representative of future behavior. The Company estimates the volatility of its common stock on thedate of grant based on the implied volatility of publicly traded options on its common stock, with a term of one year or greater. The Company believes thatimplied volatility calculated based on actively traded options on its common stock is a better indicator of expected volatility and future stock price trends thanhistorical volatility. The assumptions used in calculating the fair value of stock-based awards represent the Company’s best estimates, but these estimatesinvolve inherent uncertainties and the application of management judgment. As a result, if factors change and the Company uses different assumptions, theCompany’s stock-based compensation expense could be materially different in the future. In addition, the Company is required to estimate the expectedpre-vesting award forfeiture rate, as well as the probability that performance conditions that affect the vesting of certain awards will be achieved, and onlyrecognizes expense for those shares expected to vest. The Company estimates the forfeiture rate based on historical experience of the Company’s stock-basedawards that are granted and cancelled before vesting. See Note 14—“Employee Benefits” for additional information.
The Company uses the “with and without” approach in determining the order in which tax attributes are utilized. As a result, the Company recognizes a taxbenefit from stock-based awards in additional paid-in capital only if an incremental tax benefit is realized after all other tax attributes currently available to theCompany have been utilized. When tax deductions from stock-based awards are less than the cumulative book compensation expense, the tax effect of theresulting difference (“shortfall”) is charged first to additional paid-in capital, to the extent of the Company’s pool of windfall tax benefits, with any remainderrecognized in income tax expense. The Company determined that it had a sufficient windfall pool available through the end of 2016 to absorb any shortfalls. Inaddition, the Company accounts for the indirect effects of stock-based awards on other tax attributes, such as the research tax credit, through the consolidatedstatements of operations.
Recent AccountingPronouncements. In May 2014, the Financial Accounting Standards Board (“FASB”) issued Accounting Standards Update (“ASU”)2014-09, “Revenue from Contracts with
111

Table of Contents
Customers,” which supersedes the revenue recognition requirements in Topic 605, “Revenue Recognition” and requires entities to recognize revenue in a waythat depicts the transfer of promised goods or services to customers in an amount that reflects the consideration to which the entity expects to be entitled inexchange for those goods or services. In August 2015, the FASB issued ASU 2015-14, which defers by one year the effective date of ASU 2014-09.Accordingly, this guidance is effective for interim and annual periods beginning after December 15, 2017 with early adoption permitted for interim and annualperiods beginning after December 15, 2016. In March 2016, the FASB issued ASU 2016-08 “Principal versus Agent Considerations (Reporting Revenue Grossversus Net),” which finalizes its amendments to the guidance in the new revenue standard on assessing whether an entity is a principal or an agent in a revenuetransaction. This conclusion impacts whether an entity reports revenue on a gross or net basis. In April 2016, the FASB issued ASU 2016-10 “IdentifyingPerformance Obligations and Licensing” which finalizes its amendments to the guidance in the new revenue standard regarding the identification of performanceobligations and accounting for the license of intellectual property. In May 2016, the FASB issued ASU 2016-12 “Narrow-Scope Improvements and PracticalExpedients” which finalizes its amendments to the guidance in the new revenue standard on collectability, noncash consideration, presentation of sales tax, andtransition. The amendments are intended to make the guidance more operable and lead to more consistent application. The amendments have the sameeffective date and transition requirements as the new revenue recognition standard. The standard is required to be applied either retrospectively to each priorreporting period presented or retrospectively with the cumulative effect of initially applying it recognized at the date of initial application. The Company has notyet selected the transition method. The Company will adopt the new revenue standards in its first quarter of 2018. The Company is currently evaluating theeffects, if any, that the adoption of this guidance will have on the Company’s financial position, results of operations and cash flows.
In August 2014, the FASB issued ASU No. 2014-15, “Disclosure of Uncertainties about an Entity’s Ability to Continue as a Going Concern” that requiresmanagement to evaluate whether there are conditions and events that raise substantial doubt about the Company’s ability to continue as a going concern withinone year after the financial statements are issued on both an interim and annual basis. Management is required to provide certain footnote disclosures if itconcludes that substantial doubt exists or when its plans alleviate substantial doubt about the Company’s ability to continue as a going concern. ASU 2014-15 iseffective for annual periods ending after December 15, 2016 and for annual and interim reporting periods thereafter. The adoption of this ASU did not have anyimpact on the Company’s disclosures in the footnotes to its consolidated financial statements.
In January 2016, the FASB issued ASU No. 2016-01, “Financial Instruments-Overall: Recognition and Measurement of Financial Assets and FinancialLiabilities”. The new standard principally affects accounting standards for equity investments, financial liabilities where the fair value option has been elected, andthe presentation and disclosure requirements for financial instruments. Upon the effective date of the new standards, all equity investments in unconsolidatedentities, other than those accounted for using the equity method of accounting, will generally be measured at fair value through earnings. There will no longer bean available-for-sale classification and therefore, no changes in fair value will be reported in other comprehensive income (loss) for equity securities with readilydeterminable fair values. The new guidance on the classification and measurement will be effective for public business entities in fiscal years beginning afterDecember 15, 2017, including interim periods within those fiscal years and early adoption is permitted. The Company is in the process of evaluating the impactof the adoption of ASU 2016-01 on the consolidated financial statements and currently anticipates the new guidance would significantly impact its consolidatedstatements of operations and consolidated statements of comprehensive Income as the Company’s marketable equity securities, primarily the Company’sinvestments in Alibaba Group and Hortonworks, are currently classified as available-for-sale and are reported at fair value, with unrealized gains and losses, netof tax, recorded in accumulated other comprehensive income.
112

Table of Contents
In February 2016, the FASB issued ASU 2016-02, “Leases” which, for operating leases, requires a lessee to recognize a right-of-use asset and a lease liability,initially measured at the present value of the lease payments, in its balance sheet. The standard also requires a lessee to recognize a single lease cost,calculated so that the cost of the lease is allocated over the lease term, on a generally straight-line basis. The ASU is effective for public companies for fiscalyears beginning after December 15, 2018, including interim periods within those fiscal years. Early adoption is permitted. The Company is currently evaluatingthe effects that the adoption of ASU 2016-02 will have on the Company’s consolidated financial position, results of operations and cash flows and anticipates thenew guidance will significantly impact its consolidated financial statements given the Company has a significant number of leases.
In March 2016, the FASB issued ASU 2016-06, “Contingent put and call options in debt instruments, a consensus of the FASB’s Emerging Issues Task Force,”which simplifies the embedded derivative analysis for debt instruments containing contingent call or put options. The new guidance clarifies that an exercisecontingency does not need to be evaluated to determine whether it relates to interest rates and credit risk in an embedded derivative analysis. A contingent putor call option embedded in a debt instrument would be evaluated for possible separate accounting as a derivative instrument without regard to the nature of theexercise contingency. The ASU is effective for public companies for fiscal years beginning after December 15, 2016, and interim periods within those fiscalyears. Early adoption is permitted for any interim and annual financial statements that have not yet been issued. The new guidance is required to be applied on amodified retrospective basis to all existing and future debt instruments. An entity will be able to elect the fair value option at transition for the entire debtinstrument, including its embedded features, but will not be able to unwind a previously-elected fair value option. The Company is not early adopting thisstandard and will consider the guidance for future transactions once it is effective.
In March 2016, the FASB issued ASU 2016-07, “Simplifying the Transition to the Equity Method of Accounting,” which eliminates the requirement to apply theequity method of accounting retrospectively when a reporting entity obtains significant influence over a previously held investment in order to reduce recognitionand presentation complexity in financial reporting. Instead, the new guidance requires equity method of accounting to be applied prospectively from the datesignificant influence is obtained. The ASU is effective for public companies for fiscal years beginning after December 15, 2016, and interim periods within thosefiscal years. Early adoption is permitted for any interim and annual financial statements that have not yet been issued. The new guidance is required to beapplied prospectively for investments that qualify for the equity method of accounting after the effective date. The Company is not early adopting this standardand will consider the guidance for future transactions once it is effective.
In March 2016, the FASB issued ASU 2016-09, “Improvements to Employee Share-Based Payment Accounting” as part of its simplification initiative, whichinvolves several aspects of accounting for share-based payment transactions, including the income tax effects, statutory withholding requirements, forfeitures,and classification on the statement of cash flows. Under ASU 2016-09, stock based compensation excess benefits (if any) will be recorded to the consolidatedstatements of operations. The ASU is effective for public companies for fiscal years beginning after December 15, 2016 and interim periods within those fiscalyears. The Company will adopt this guidance in the first quarter of 2017. Upon adoption of this guidance, the Company will record the cumulative tax benefitsthat were not previously recognized because the related tax deduction had not reduced taxes payable. This cumulative impact is expected to increase retainedearnings by approximately $100 million.
In June 2016, the FASB issued ASU 2016-13, “Financial Instruments—Credit Losses”, which introduces new guidance for credit losses on instruments within itsscope. The new guidance introduces an
113

Table of Contents
approach based on expected losses to estimate credit losses on certain types of financial instruments, including, but not limited to, trade and other receivables,held-to-maturity debt securities, loans and net investments in leases. The new guidance also modifies the impairment model for available-for-sale debt securitiesand requires the entities to determine whether all or a portion of the unrealized loss on an available-for-sale debt security is a credit loss. The standard alsoindicates that entities may not use the length of time a security has been in an unrealized loss position as a factor in concluding whether a credit loss exists. TheASU is effective for public companies for fiscal years beginning after December 15, 2019, and interim periods within those fiscal years. Early adoption ispermitted for all entities for fiscal years beginning after December 15, 2018, including interim periods within those fiscal years. The Company is currentlyevaluating the effects, if any, that the adoption of this guidance will have on the Company’s consolidated financial position, results of operations and cash flows.
In June 2016, the FASB issued ASU 2016-15, “Statement of Cash Flows (Topic 230), a consensus of the FASB’s Emerging Issues Task Force.” The newguidance is intended to reduce diversity in practice in how certain transactions are classified in the statement of cash flows. The ASU is effective for publiccompanies for fiscal years beginning after December 15, 2017, and interim periods within those fiscal years. Early adoption is permitted, including interim periodswithin those fiscal years. An entity that elects early adoption must adopt all of the amendments in the same period. The guidance requires application using aretrospective transition method. The Company is currently evaluating the effects, if any, that the adoption of this guidance will have on the Company’sconsolidated cash flows.
In October 2016, the FASB issued ASU 2016-16, “Income Taxes: Intra-Entity Transfers of Assets Other than Inventory” which amends the accounting for incometaxes. The new guidance requires the recognition of the income tax consequences of an intra-entity asset transfer, other than transfers of inventory, when thetransfer occurs. For intra-entity transfers of inventory, the income tax effects will continue to be deferred until the inventory has been sold to a third party. TheASU is effective for reporting periods beginning after December 15, 2017, with early adoption permitted. The new guidance is required to be applied on amodified retrospective basis through a cumulative-effect adjustment directly to retained earnings as of the beginning of the period of adoption. The Company iscurrently evaluating the effects, if any, that the adoption of this guidance will have on the Company’s consolidated financial position, results of operations andcash flows.
In November 2016, the FASB issued ASU No. 2016-18 “Statement of Cash Flows (Topic 230), Restricted Cash” which provides guidance on the presentation ofrestricted cash and restricted cash equivalents in the statements of cash flows. The new guidance requires restricted cash and restricted cash equivalents to beincluded within the cash and cash equivalents balances when reconciling the beginning-of-period and end-of-period amounts shown on the statements of cashflows. The ASU is effective for reporting periods beginning after December 15, 2017 with early adoption permitted. The Company is currently evaluating theeffects, if any, that the adoption of this guidance will have on the Company’s consolidated cash flows.
In January 2017, the FASB issued ASU No. 2017-04 “Intangibles—Goodwill and Other (Topic 350), Simplifying the Test for Goodwill Impairment” whicheliminated Step 2 from the goodwill impairment test. In computing the implied fair value of goodwill under Step 2, an entity had to perform procedures todetermine the fair value at the impairment testing date of its assets and liabilities (including unrecognized assets and liabilities) following the procedure thatwould be required in determining the fair value of assets acquired and liabilities assumed in a business combination. Instead, under the amendments in this ASUan entity should perform its annual, or interim, goodwill impairment test by comparing the fair value of a reporting unit with its carrying amount. An entity shouldrecognize an impairment charge for the amount by which the carrying amount exceeds the reporting unit’s fair value; however, the loss recognized should notexceed the total amount of
114

Table of Contents
goodwill allocated to that reporting unit. Additionally, an entity should consider income tax effects from any tax deductible goodwill on the carrying amount of thereporting unit when measuring the goodwill impairment loss, if applicable. The ASU also eliminated the requirements for any reporting unit with a zero ornegative carrying amount to perform a qualitative assessment and, if it fails that qualitative test, to perform Step 2 of the goodwill impairment test. Therefore, thesame impairment assessment applies to all reporting units. An entity is required to disclose the amount of goodwill allocated to each reporting unit with a zero ornegative carrying amount of net assets. An entity still has the option to perform the qualitative assessment for a reporting unit to determine if the quantitativeimpairment test is necessary. The ASU is effective for reporting periods beginning after December 15, 2019 with early adoption permitted for interim or annualgoodwill impairment tests performed on testing dates after January 1, 2017. The Company is currently evaluating the effects, if any, that the adoption of thisguidance will have on the Company’s consolidated financial position, results of operations and cash flows.
Note 2 Marketable Securities, Investments and Fair Value Disclosures The following tables summarize the available-for-sale securities (in thousands): December 31, 2015
CostBasis
GrossUnrealized
Gains
GrossUnrealized
Losses EstimatedFair Value
Government and agency securities $ 616,501 $ 24 $ (635) $ 615,890 Corporate debt securities, commercial paper, time deposits, and bankcertificates of deposit 4,589,799 292 (4,908) 4,585,183 Alibaba Group equity securities 2,713,484 28,458,877 — 31,172,361 Hortonworks equity securities 26,246 57,977 — 84,223 Other corporate equity securities 298 — (101) 197
Total available-for-sale marketable securities $ 7,946,328 $ 28,517,170 $ (5,644) $ 36,457,854
December 31, 2016
CostBasis
GrossUnrealized
Gains
GrossUnrealized
Losses EstimatedFair Value
Government and agency securities $ 650,344 $ 43 $ (903) $ 649,484 Corporate debt securities, commercial paper, time deposits, and bankcertificates of deposit 6,144,991 812 (4,655) 6,141,148 Alibaba Group equity securities 2,713,484 30,967,395 — 33,680,879 Hortonworks equity securities 26,246 5,713 — 31,959 Other corporate equity securities 8,093 69 (3,057) (*) 5,105
Total available-for-sale marketable securities $ 9,543,158 $ 30,974,032 $ (8,615) $ 40,508,575
(*) Relates to the other corporate equity securities in an unrealized loss position for less than 12 months.
115

Table of Contents
December 31, 2015 2016 Reported as: Short-term marketable securities $ 4,225,112 $ 5,700,925 Long-term marketable securities 975,961 1,089,707 Investment in Alibaba Group 31,172,361 33,680,879 Other long-term assets and investments 84,420 37,064
Total $ 36,457,854 $ 40,508,575
Short-term, highly liquid investments of $667 million and $415 million as of December 31, 2015 and 2016, respectively, included in cash and cash equivalents onthe consolidated balance sheets are not included in the table above as the gross unrealized gains and losses were immaterial as the carrying valueapproximates fair value because of the short maturity of those instruments. Realized gains and losses from sales of available-for-sale marketable debt securitieswere not material for the years ended December 31, 2014, 2015, and 2016.
The remaining contractual maturities of available-for-sale marketable debt securities were as follows (in thousands): December 31, 2015 2016 Due within one year $ 4,225,112 $ 5,700,925 Due after one year through three years 975,961 1,089,707
Total available-for-sale marketable debt securities $ 5,201,073 $ 6,790,632
The following tables show all available-for-sale marketable debt securities in an unrealized loss position for which an other-than-temporary impairment has notbeen recognized and the related gross unrealized losses and fair value, aggregated by investment category and length of time that individual securities havebeen in a continuous unrealized loss position (in thousands):
December 31, 2015 Less than 12 Months 12 Months or Longer Total Fair
Value Unrealized
Loss Fair
Value Unrealized
Loss Fair
Value Unrealized
Loss Government and agency securities $ 552,041 $ (635) $ — $ — $ 552,041 $ (635) Corporate debt securities, commercial paper, and bankcertificates of deposit 2,415,347 (4,763) 99,214 (145) 2,514,561 (4,908)
Total available-for-sale marketable debt securities $ 2,967,388 $ (5,398) $ 99,214 $ (145) $ 3,066,602 $ (5,543)
116

Table of Contents
December 31, 2016 Less than 12 Months 12 Months or Longer Total
Fair
Value Unrealized
Loss Fair
Value Unrealized
Loss Fair
Value Unrealized
Loss Government and agency securities $ 543,605 $ (903) $ — $ — $ 543,605 $ (903) Corporate debt securities, commercial paper, and bankcertificates of deposit 2,355,935 (4,638) 46,438 (17) 2,402,373 (4,655)
Total available-for-sale marketable debt securities $ 2,899,540 $ (5,541) $ 46,438 $ (17) $ 2,945,978 $ (5,558)
The Company’s investment portfolio includes equity securities of Alibaba Group and Hortonworks, as well as liquid high-quality fixed income debt securitiesincluding government, agency and corporate debt, money market funds, commercial paper, certificates of deposit and time deposits held with financialinstitutions. The fair value of any debt or equity security will vary over time and is subject to a variety of market risks including: macro-economic, regulatory,industry, company performance, and systemic risks of the equity markets overall. Consequently, the carrying value of the Company’s investment portfolio willvary over time as the value of the various marketable securities changes.
Investments in instruments that earn a fixed rate or a floating rate interest earning instruments carry a degree of interest rate risk. Fixed rate securities may havetheir fair value adversely impacted due to a rise in interest rates, while floating rate securities may produce less income than expected if interest rates fall. Fixedincome securities may have their fair value adversely impacted due to a deterioration of the credit quality of the issuer. The longer the term of the securities, themore susceptible they are to changes in market rates.
Available-for-sale marketable debt securities are reviewed periodically to identify possible other-than-temporary impairment. The Company has no currentrequirement or intent to sell the securities in an unrealized loss position. The Company expects to recover up to (or beyond) the initial cost of investment forsecurities held.
117

Table of Contents
The following table sets forth the financial assets and liabilities, measured at fair value, by level within the fair value hierarchy as of December 31, 2015 (inthousands): Fair Value Measurements at Reporting Date Using Assets Level 1 Level 2 Level 3 Total Money market funds (1) $ 386,792 $ — $ — $ 386,792 Available-for-sale marketable debt securities:
Government and agency securities (1) — 635,917 — 635,917 Commercial paper and bank certificates of deposit (1) — 1,844,494 — 1,844,494 Corporate debt securities (1) — 2,918,496 — 2,918,496 Time deposits (1) — 82,703 — 82,703
Available-for-sale equity securities: Other corporate equity securities (2) 197 — — 197 Alibaba Group equity securities 31,172,361 — — 31,172,361 Hortonworks equity securities (2) 84,223 — — 84,223
Hortonworks warrants — — 78,861 78,861 Foreign currency derivative contracts (3) — 84,319 — 84,319
Financial assets at fair value $ 31,643,573 $ 5,565,929 $ 78,861 $ 37,288,363
Liabilities Foreign currency derivative contracts (3) — (5,661) — (5,661)
Total financial assets and liabilities at fair value $ 31,643,573 $ 5,560,268 $ 78,861 $ 37,282,702
118

Table of Contents
The following table sets forth the financial assets and liabilities, measured at fair value, by level within the fair value hierarchy as of December 31, 2016 (inthousands): Fair Value Measurements at Reporting Date Using Assets Level 1 Level 2 Level 3 Total Money market funds (1) $ 375,286 $ — $ — $ 375,286 Available-for-sale marketable debt securities:
Government and agency securities (1) — 649,484 — 649,484 Commercial paper and bank certificates of deposit (1) — 3,008,971 — 3,008,971 Corporate debt securities (1) — 3,132,177 — 3,132,177 Time deposits (1) — 39,598 — 39,598
Available-for-sale equity securities: Other corporate equity securities (2) 5,105 — — 5,105 Alibaba Group equity securities 33,680,879 — — 33,680,879 Hortonworks equity securities (2) 31,959 — — 31,959
Hortonworks warrants — — 28,815 28,815 Foreign currency derivative contracts (3) — 11,684 — 11,684
Financial assets at fair value $ 34,093,229 $ 6,841,914 $ 28,815 $ 40,963,958
Liabilities Foreign currency derivative contracts (3) — (9,333) — (9,333)
Total financial assets and liabilities at fair value $ 34,093,229 $ 6,832,581 $ 28,815 $ 40,954,625
(1) The money market funds, government and agency securities, commercial paper and bank certificates of deposit, corporate debt securities, and time
deposits are classified as part of either cash and cash equivalents or short or long-term marketable securities on the consolidated balance sheets. (2) The Hortonworks equity securities and other corporate equity securities are classified as part of other long-term assets and investments on the
consolidated balance sheets. (3) Foreign currency derivative contracts are classified as part of either current or noncurrent assets or liabilities on the consolidated balance sheets. The
notional amounts of the foreign currency derivative contracts were: $1.5 billion, including contracts designated as net investment hedges of $1.2 billion,as of December 31, 2015; and $0.6 billion, including contracts designated as net investment hedges of $0.2 billion, as of December 31, 2016.
The amount of cash included in cash and cash equivalents as of December 31, 2015 and 2016 was $965 million and $705 million, respectively.
The fair values of the Company’s Level 1 financial assets and liabilities are based on quoted prices in active markets for identical assets or liabilities. The fairvalues of the Company’s Level 2 financial assets and liabilities are obtained using quoted prices for similar assets or liabilities in active markets; quoted prices foridentical or similar assets in markets that are not active; and inputs other than quoted prices (e.g., interest rates and yield curves). The Company utilizes apricing service to assist in obtaining fair value pricing for the marketable debt securities. The fair value for the Company’s Level 3 financial asset was obtainedusing a Black-Scholes model.
119

Table of Contents
ActivitybetweenLevelsoftheFairValueHierarchy
During the years ended December 31, 2015 and 2016, the Company did not make any transfers between Level 1, Level 2 and Level 3 assets or liabilities.
Hortonworks
Prior to the December 12, 2014 initial public offering of Hortonworks, the Company held an approximate 16 percent interest in Hortonworks with an investmentbalance of $26 million, which was accounted for as a cost method investment. Subsequent to the initial public offering, the Company owns 3.8 millionunregistered shares. These shares were subject to a 6-month lock-up period which expired during 2015. These shares are accounted for as anavailable-for-sale security and had a fair value of $84 million and $32 million as of December 2015 and 2016, respectively.
The Company also holds warrants that vested upon the initial public offering of Hortonworks, which entitle the Company to purchase an aggregate of 3.7 millionshares of Hortonworks common stock upon exercise of the warrants. The Company holds 6.5 million preferred warrants that are exercisable for 3.25 millionshares of common stock at an exercise price of $0.01 per share, as well as 0.5 million common warrants that are exercisable for 0.5 million shares of commonstock at an exercise price of $8.46 per share. These warrants had a fair value of $79 million and $29 million as of December 31, 2015 and 2016, respectively.The Company determined the estimated fair value of the warrants using the Black-Scholes model with the following assumptions: Preferred Warrants Common Warrants Years Ended December 31, Years Ended December 31, 2015 2016 2015 2016 Expected dividend yield 0% 0% 0% 0% Risk-free interest rate 1.78% 1.70% 2.25% 2.25% Expected volatility 46.0% 44.0% 46.0% 44.0% Expected life (in years) 4.50 3.50 7.44 6.44
During the year ended December 31, 2014, the Company recorded a gain of $57 million upon the initial public offering of Hortonworks through othercomprehensive income on its consolidated balance sheet and a $41 million gain related to the mark to market of the warrants as of December 31, 2014, whichwas included within other income (expense), net in the consolidated statements of operations. During the year ended December 31, 2015, the Companyrecorded a loss of $19 million related to the mark to market of the respective warrants as of December 31, 2015, which was included within other income(expense), net in the Company’s consolidated statements of operations. During the year ended December 31, 2016, the Company recorded a loss of $50 millionrelated to the mark to market of the respective warrants as of December 31, 2016, which was included within other income (expense), net in the Company’sconsolidated statements of operations. Changes in the estimated fair value of the Hortonworks warrants are recorded through other income (expense), net in theCompany’s consolidated statements of operations.
AssetsandLiabilitiesatFairValueonaNonrecurringBasis
ConvertibleSeniorNotes. In 2013, the Company issued $1.4375 billion aggregate principal amount of 0.00% Convertible Senior Notes due in 2018 (the“Notes”). The Notes are carried at their original issuance value, net of unamortized debt discount, and are not marked to market each period. The approximateestimated fair value of the Notes as of December 31, 2015 and 2016 was $1.3 billion. The
120

Table of Contents
estimated fair value of the Notes was determined on the basis of quoted market prices observable in the market and is considered Level 2 in the fair valuehierarchy. See Note 11—“Convertible Notes” for additional information related to the Notes.
Goodwill andDefinite-LivedIntangibleAssets. The inputs used to measure the estimated fair value of goodwill and definite-lived intangible assets areclassified as a Level 3 fair value measurement due to the significance of unobservable inputs using company-specific information. The valuation methodologyused to estimate the fair value of goodwill and definite-lived intangible assets is discussed in Note 5—“Goodwill” and Note 6—“Intangible Assets, Net”.
OtherInvestments.As of both December 31, 2015 and 2016, the Company held approximately $83 million of investments in equity securities of privately-held companies that are accounted for using the cost method. These investments are included within other long-term assets and investments on theconsolidated balance sheets. Such investments are reviewed periodically for impairment.
Note 3 Consolidated Financial Statement Details
PrepaidExpensesandOtherCurrentAssets
As of December 31, prepaid expenses and other current assets consisted of the following (in thousands): 2015 2016 Prepaid expenses $ 87,843 $ 73,671 Foreign currency forward and option contract assets 84,136 11,684 Other receivables non-trade 167,198 33,519 Restricted cash (*) 29,678 55,168 Income tax receivables 220,996 35,059 Other 12,941 12,398
Total prepaid expenses and other current assets $ 602,792 $ 221,499
(*) The majority of the balance as of December 31, 2015 and 2016 represents customer funds received by the Company in connection with its online
e-commerce services in the Asia Pacific region that are restricted in a separate bank account. In addition, the balance as of December 31, 2016 alsoincluded customer funds received by the Company in connection with its fantasy sports that are restricted in separate bank accounts.
121

Table of Contents
PropertyandEquipment,Net
As of December 31, property and equipment, net consisted of the following (in thousands): 2015 2016 Land (1) $ 215,740 $ 89,960 Buildings (1)(2) 840,083 935,515 Leasehold improvements (2) 252,985 249,698 Computers and equipment (2) 2,143,413 1,901,619 Capitalized software and labor 643,758 679,902 Furniture and fixtures (1) 86,418 74,526 Assets not yet in use 83,164 15,505
4,265,561 3,946,725 Less: accumulated depreciation and amortization (2) (2,718,238) (2,736,788)
Total property and equipment, net $ 1,547,323 $ 1,209,937
(1) During 2016, the Company completed the sale of certain property located in Santa Clara, California. The total carrying value of the property assets was
$126 million, which mostly pertained to the land. (2) The Company recorded assets under capital leases, primarily for computers and equipment and leasehold improvements, which had gross carrying
values of $82 million and $57 million as of December 31, 2015 and 2016, respectively. Accumulated amortization related to these capital leases totaled$75 million and $52 million as of December 31, 2015 and 2016, respectively.
OtherLong-TermAssetsandInvestments
As of December 31, other long-term assets and investments consisted of the following (in thousands): 2015 2016 Deferred income taxes $ 21,745 $ 18,228 Investments in privately-held companies 82,610 82,780 Hortonworks equity securities and warrants 163,084 60,774 Foreign currency forward and option contracts 183 — Other 74,768 44,277
Total other long-term assets and investments $ 342,390 $ 206,059
122

Table of Contents
OtherAccruedExpensesandCurrentLiabilities
As of December 31, other accrued expenses and current liabilities consisted of the following (in thousands): 2015 2016 Accrued content, connection, traffic acquisition, and other costs $ 252,612 $ 400,172 Accrued compensation and related expenses 310,111 342,354 Income taxes payable 4,181 6,039 Accrued professional service expenses 40,914 30,827 Accrued sales and marketing related expenses 40,876 13,936 Accrued restructuring costs 40,283 27,041 Current liability for uncertain tax contingencies 12,586 2,409 Other 233,095 183,898
Total other accrued expenses and current liabilities $ 934,658 $ 1,006,676
DeferredandOtherLong-TermTaxLiabilities
As of December 31, deferred and other long-term tax liabilities consisted of the following (in thousands): 2015 2016 Deferred and other income tax liabilities (1) $ 12,312,013 $ 13,096,849 Long-term liability for uncertain tax contingencies (2) 1,155,178 1,179,605
Total deferred and other long-term tax contingencies $ 13,467,191 $ 14,276,454
Presented as: Deferred tax liabilities related to investment in Alibaba Group (1) $ 12,611,867 $ 13,633,988 Deferred and other long-term tax liabilities $ 855,324 $ 642,466
1) Deferred and other income tax liabilities are presented on a net basis by jurisdiction. The balances as of December 31, 2015 and 2016 include the
deferred tax liabilities related to investment in Alibaba Group. 2) Includes interest and penalties.
AccumulatedOtherComprehensiveIncome
As of December 31, the components of accumulated other comprehensive income were as follows (in thousands): 2015 2016 Unrealized gains on available-for-sale securities, net of tax $ 16,918,539 $ 18,376,965 Unrealized gains (losses) on cash flow hedges, net of tax 482 (19) Foreign currency translation adjustments, net of tax (342,990) 100,947
Accumulated other comprehensive income $ 16,576,031 $ 18,477,893
123

Table of Contents
NoncontrollingInterests
As of December 31, noncontrolling interests were as follows (in thousands): 2015 2016 Beginning noncontrolling interests $ 43,755 $ 35,883 Distributions to noncontrolling interests (15,847) (5,948) Net income attributable to noncontrolling interests 7,975 4,858
Ending noncontrolling interests $ 35,883 $ 34,793
OtherIncome(Expense),Net
Other income (expense), net for 2014, 2015, and 2016 were as follows (in thousands): Years Ended December 31, 2014 2015 2016 Interest and investment income $ 26,309 $ 34,383 $ 60,931 Interest expense (68,851) (71,865) (73,783) Gain on sale of Alibaba Group ADSs 10,319,437 — — Gain (loss) on Hortonworks warrants 98,062 (19,199) (50,046) Foreign exchange (loss) gain (14,687) (22,226) 4,282 Other 9,169 3,125 4,700
Total other income (expense), net $ 10,369,439 $ (75,782) $ (53,916)
Interest and investment income consists of income earned from cash and cash equivalents in bank accounts and investments made in marketable debtsecurities.
Interest expense is related to the Notes and notes payable related to building and capital lease obligations for data centers.
Gain on sale of Alibaba Group ADSs during the year ended December 31, 2014 is attributable to the pre-tax gain related to the sale of 140 million ADSs ofAlibaba Group in the Alibaba Group IPO on September 24, 2014.
During the year ended December 31, 2014, the Company recorded a gain of $57 million upon the initial public offering of Hortonworks and a $41 million gainrelated to the mark to market of the warrants as of December 31, 2014, which were included within other income (expense), net in the consolidated statementsof operations. During the year ended December 31, 2015, the Company recorded a loss of $19 million related to the mark to market of the warrants as ofDecember 31, 2015, which was included within other income (expense), net in the Company’s consolidated statements of operations. During the year endedDecember 31, 2016, the Company recorded a loss of $50 million related to the mark to market of the warrants as of December 31, 2016, which was includedwithin other income (expense), net in the Company’s consolidated statements of operations. Changes in the estimated fair value of the Hortonworks warrants willbe recorded through other income (expense), net in the Company’s consolidated statements of operations. See Note 2—“Marketable Securities, Investmentsand Fair Value Disclosures” for additional information.
124

Table of Contents
Foreign exchange losses consists of foreign exchange gains and losses due to re-measurement of monetary assets and liabilities denominated innon-functional currencies, and unrealized and realized foreign currency transaction gains and losses, including gains and losses related to balance sheethedges. Additionally, in 2016, the Company reclassified certain unrealized currency translation adjustments from accumulated other comprehensive income andrealized a net gain of $20 million due to the liquidation of foreign subsidiaries.
Other consists of gains from other non-operational items.
ReclassificationsOutofAccumulatedOtherComprehensiveIncome
Reclassifications out of accumulated other comprehensive income for the period ended December 31, 2014 were as follows(in thousands):
Amount Reclassified from
Accumulated Other
Comprehensive Income
Affected Line Item in the Statement of Income
Realized gains on cash flow hedges, net of tax $ (5,259) RevenueRealized gains on available-for-sale securities, net of tax (2,218) Other income (expense), netForeign currency translation adjustments (“CTA”):
Disposal of a portion of the investment in Alibaba Group, net of $30 million in tax (50,301) Other income (expense), net
Total reclassifications for the period $ (57,778)
Reclassifications out of accumulated other comprehensive income for the period ended December 31, 2015 were as follows(in thousands):
Amount Reclassified from
Accumulated Other
Comprehensive Income
Affected Line Item in the Statement of Income
Realized losses on cash flow hedges, net of tax $ 4,421 RevenueRealized losses on available-for-sale securities, net of tax 174 Other income (expense), net
Total reclassifications for the period $ 4,595
125

Table of Contents
Reclassifications out of accumulated other comprehensive income for the period ended December 31, 2016 were as follows(in thousands):
Amount Reclassified from
Accumulated Other
Comprehensive Income
Affected Line Item in the Statement of Income
Realized losses on cash flow hedges, net of tax $ 4,298 RevenueRealized losses on available-for-sale securities, net of tax 181 Other income (expense), netRealized (gains) losses on foreign currency translation adjustments (“CTA”):
Liquidation of foreign subsidiary CTA reclassification 1,110 Restructuring charges, netLiquidation of foreign subsidiary CTA reclassification (21,204) Other income (expense), net
Total reclassifications for the period $ (15,615)
Note 4 Acquisitions and Dispositions The following table summarizes acquisitions (including business combinations and asset acquisitions) completed during the three years ended December 31,2016 (in millions):
PurchasePrice Goodwill
AmortizableIntangibles
2014 Flurry $ 270 $ 194 $ 55 BrightRoll $ 581 $ 417 $ 113 Other acquisitions $ 66 $ 39 $ 18
2015 Polyvore $ 161 $ 131 $ 19 Other acquisition $ 23 $ 22 $ 5
At the completion date of each acquisition, the Company recorded goodwill where the purchase price exceeded the fair value of the net tangible and identifiableintangible assets acquired. Goodwill is not amortized, but is tested for impairment at the reporting unit level on an annual basis and more frequently if impairmentindicators are present. The majority of the goodwill originating from these acquisitions was subsequently impaired in the fourth quarter of 2015. See Note 5—“Goodwill” for results of the goodwill impairment test.
Transactionscompletedin2014
Flurry. On August 25, 2014, the Company completed the acquisition of Flurry, Inc. (“Flurry”), a mobile data analytics company that optimizes mobileexperiences for developers, marketers, and users. The combined scale of Yahoo and Flurry created more personalized and inspiring app experiences for usersand enabled more effective mobile advertising solutions for brands seeking to reach their audiences and gain cross-device insights.
126

Table of Contents
The total purchase price of approximately $270 million consisted of cash consideration. Under the terms of the agreement, the Company acquired all of theequity interests (including all outstanding vested options) of Flurry. Outstanding Flurry unvested options were assumed and converted into equivalent awards forYahoo common stock valued at $4 million, which is being recognized as stock-based compensation expense as the options vest over periods of up to four yearsfrom the date of the acquisition.
Separately, in connection with the acquisition, the Company issued restricted stock units valued at $23 million, which are being recognized as stock-basedcompensation expense as the restricted stock units vest over four years from the date of the acquisition.
The allocation of the purchase price of the assets acquired and liabilities assumed based on their fair values was as follows (in thousands): Cash acquired $ 12,139 Other tangible assets acquired 51,235 Amortizable intangible assets:
Developed technology 7,100 Customer contracts and related relationships 47,600 Other 720
Goodwill 194,081
Total assets acquired 312,875 Liabilities assumed (43,205)
Total $ 269,670
The amortizable intangible assets have useful lives not exceeding five years and a weighted average useful life of five years. The purchase price exceeded theestimated fair value of the tangible and identifiable intangible assets and liabilities acquired and, as a result of the allocation, the Company recorded goodwill of$194 million in connection with this transaction. Goodwill represented the excess of the purchase price over the estimated fair value of the net tangible andidentifiable intangible assets acquired and was not deductible for tax purposes.
BrightRoll. On December 12, 2014, the Company completed the acquisition of BrightRoll, Inc. (“BrightRoll”), a leading programmatic video advertisingplatform. The transaction combined Yahoo’s premium-desktop and mobile video advertising inventory with BrightRoll’s programmatic video platform andpublisher relationships to bring substantial value to advertisers on both platforms.
The purchase price of $581 million exceeded the estimated fair value of the net tangible and identifiable intangible assets and liabilities acquired and, as a result,the Company recorded goodwill of $417 million in connection with this transaction. Under the terms of the agreement, the Company acquired all of the equityinterests (including all outstanding vested options) in BrightRoll and BrightRoll stockholders and vested option holders were paid in cash. Outstanding BrightRollunvested options were assumed and converted into equivalent awards for Yahoo common stock valued at $25 million, which is being recognized as stock-basedcompensation expense as the options vest over periods of up to four years from the date of the acquisition.
Separately, in connection with the acquisition, the Company issued restricted stock units to employees valued at $78 million, which is being recognized as stock-based compensation expense as
127

Table of Contents
the restricted stock units vest over four years from the date of the acquisition and relate to continuing employment. In addition, the transaction resulted in cashconsideration of $54 million to be paid to BrightRoll’s founder over three years also provided that he remains an employee of the Company (or a successorcompany). Such cash payments are being recognized as compensation expense over the three-year service period from the date of the acquisition.
The total purchase price of approximately $581 million consisted mainly of cash consideration. The allocation of the purchase price of the assets acquired andliabilities assumed based on their fair values was as follows (in thousands): Cash acquired $ 41,899 Accounts receivable, net 99,330 Other tangible assets acquired 55,923 Amortizable intangible assets:
Developed technology 19,400 Customer contracts and related relationships 85,600 Other 8,100
Goodwill 416,580
Total assets acquired 726,832 Liabilities assumed (145,667)
Total $ 581,165
The amortizable intangible assets have useful lives not exceeding seven years and a weighted average useful life of five years. The purchase price exceededthe estimated fair value of the tangible and identifiable intangible assets and liabilities acquired and, as a result of the allocation, the Company recorded goodwillof $417 million in connection with this transaction. Goodwill represented the excess of the purchase price over the estimated fair value of the net tangible andidentifiable intangible assets acquired and was not deductible for tax purposes.
Other Acquisitions—Business Combinations. During the year ended December 31, 2014, the Company acquired nine other companies, all of which wereaccounted for as business combinations. The total purchase price for these acquisitions was $66 million less cash acquired of $4 million, which resulted in a netcash outlay of $62 million. The purchase price allocation of the assets acquired and liabilities assumed based on their estimated fair values was $39 millionallocated to goodwill, $18 million to amortizable intangible assets, $4 million to cash acquired, $10 million to other tangible assets, and $5 million to assumedliabilities.
Transactionscompletedin2015
Polyvore. On September 2, 2015, the Company acquired Polyvore, Inc. (“Polyvore”), a social commerce website that lets users across the globe discover andshop for their favorite products in fashion, beauty and home décor.
The total purchase price of approximately $161 million consisted of cash consideration. Under the terms of the agreement, the Company acquired all of theequity interests (including all outstanding vested options) of Polyvore. Outstanding Polyvore unvested options were assumed and converted into equivalentawards for Yahoo common stock valued at $7 million, which is being recognized as stock-based compensation expense as the options vest over periods of up tofour years from the date of the acquisition.
128
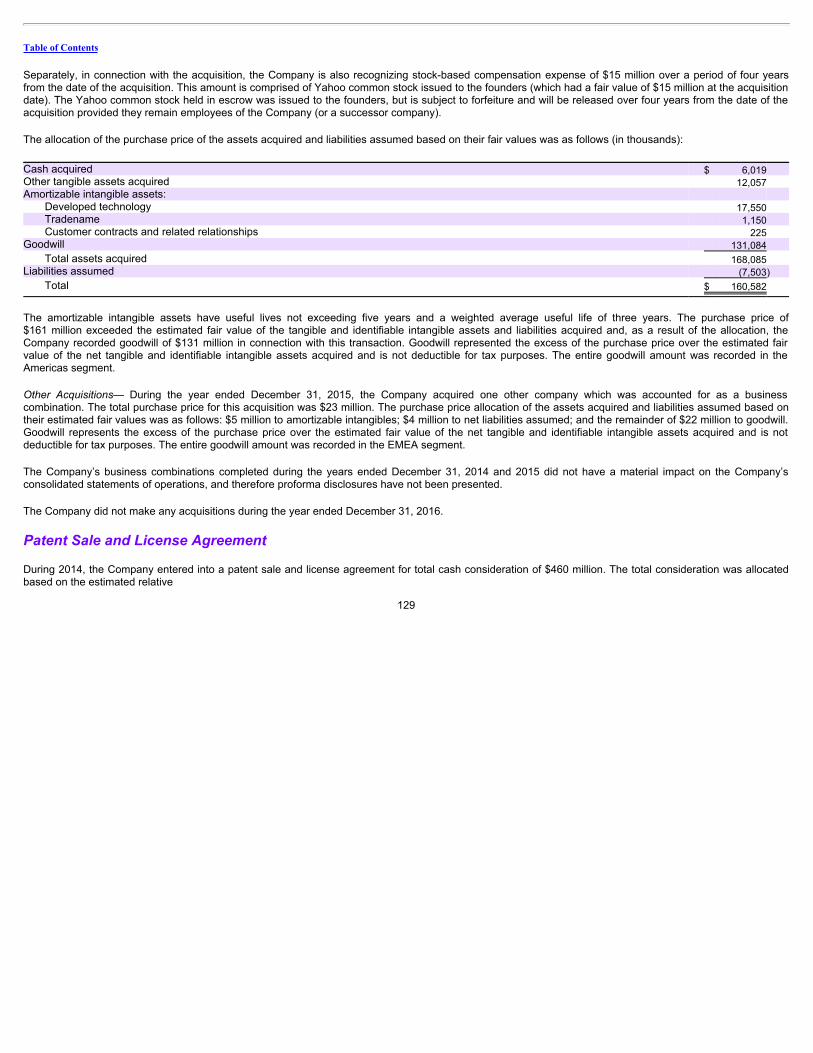
Table of Contents
Separately, in connection with the acquisition, the Company is also recognizing stock-based compensation expense of $15 million over a period of four yearsfrom the date of the acquisition. This amount is comprised of Yahoo common stock issued to the founders (which had a fair value of $15 million at the acquisitiondate). The Yahoo common stock held in escrow was issued to the founders, but is subject to forfeiture and will be released over four years from the date of theacquisition provided they remain employees of the Company (or a successor company).
The allocation of the purchase price of the assets acquired and liabilities assumed based on their fair values was as follows (in thousands): Cash acquired $ 6,019 Other tangible assets acquired 12,057 Amortizable intangible assets:
Developed technology 17,550 Tradename 1,150 Customer contracts and related relationships 225
Goodwill 131,084
Total assets acquired 168,085 Liabilities assumed (7,503)
Total $ 160,582
The amortizable intangible assets have useful lives not exceeding five years and a weighted average useful life of three years. The purchase price of$161 million exceeded the estimated fair value of the tangible and identifiable intangible assets and liabilities acquired and, as a result of the allocation, theCompany recorded goodwill of $131 million in connection with this transaction. Goodwill represented the excess of the purchase price over the estimated fairvalue of the net tangible and identifiable intangible assets acquired and is not deductible for tax purposes. The entire goodwill amount was recorded in theAmericas segment.
Other Acquisitions— During the year ended December 31, 2015, the Company acquired one other company which was accounted for as a businesscombination. The total purchase price for this acquisition was $23 million. The purchase price allocation of the assets acquired and liabilities assumed based ontheir estimated fair values was as follows: $5 million to amortizable intangibles; $4 million to net liabilities assumed; and the remainder of $22 million to goodwill.Goodwill represents the excess of the purchase price over the estimated fair value of the net tangible and identifiable intangible assets acquired and is notdeductible for tax purposes. The entire goodwill amount was recorded in the EMEA segment.
The Company’s business combinations completed during the years ended December 31, 2014 and 2015 did not have a material impact on the Company’sconsolidated statements of operations, and therefore proforma disclosures have not been presented.
The Company did not make any acquisitions during the year ended December 31, 2016.
PatentSaleandLicenseAgreement
During 2014, the Company entered into a patent sale and license agreement for total cash consideration of $460 million. The total consideration was allocatedbased on the estimated relative
129

Table of Contents
fair value of each of the elements of the agreement: $61 million was allocated to the sale of patents (“Sold Patents”), $135 million to the license to existingpatents (“Existing Patents”) and $264 million to the license of patents developed or acquired in the five years following the date the Company entered into theagreement (“Capture Period Patents”). The Company recorded $61 million as a gain on the Sold Patents during 2014.
The amounts allocated to the license of the Existing Patents are being recorded as revenue over the four-year payment period under the license when paymentsare due. The amounts allocated to the Capture Period Patents are being recorded as revenue over the five-year capture period. The Company recognized$43 million, $86 million, and $86 million in revenue related to the Existing Patents and the Capture Period Patents during the years ended December 31, 2014,2015, and 2016, respectively.
PatentSaleAgreements
During 2014, the Company entered into patent sale agreements with a wholly-owned affiliate of Alibaba Group pursuant to which the Company sold certainpatents for aggregate consideration of $23.5 million. The gain on sale of these patents are recorded as a part of gain on sale of patents in the consolidatedstatements of operations.
During 2014, the Company entered into a patent sale agreement with Yahoo Japan pursuant to which the Company sold certain patents for aggregateconsideration of $18 million. The gain on sale of these patents of $12 million is recorded as a part of gain on sale of patents in the consolidated statements ofoperations.
During 2015 and 2016, the Company sold certain patents and recorded a gain on sale of patents of approximately $11 million and $2 million, respectively.
SaleofSantaClaraProperty
During 2016, the Company entered into a purchase agreement to sell certain property located in Santa Clara, California. The total carrying value of the propertyassets was $126 million, which mostly pertained to the land, and was reported within the Americas segment. The decision to sell this property was largely basedupon a general lack of operational need for the land and recent improvements in market conditions for commercial real estate in the area. The sale under thepurchase agreement was finalized on June 16, 2016 for total proceeds of $246 million, net of closing costs of $4 million. During the year ended December 31,2016, the Company recorded a gain of $120 million, net of closing costs, on the sale of the property assets which is included in gain on sale of patents and landin the Company’s consolidated statements of operations.
PendingSaleoftheOperatingBusinesstoVerizonCommunicationsInc.
On July 23, 2016, the Company entered into a Stock Purchase Agreement (the “Original Stock Purchase Agreement”) with Verizon Communications Inc.(“Verizon”), pursuant to which the Company has agreed to sell, and Verizon has agreed to purchase (the “Sale”), all of the outstanding shares of YahooHoldings, Inc., a newly formed wholly-owned subsidiary of the Company (“Yahoo Holdings”) (and prior to the sale of Yahoo Holdings to cause Yahoo Holdings tosell to a foreign subsidiary of Verizon all of the equity interests in a foreign subsidiary of Yahoo Holdings that will hold certain foreign subsidiaries relating to theCompany’s operating business), which, immediately prior to the consummation of the Sale, will own the Company’s operating business. Under the Original StockPurchase Agreement, the aggregate consideration to be paid to the Company by Verizon in connection with the Sale was $4,825,800,000 in cash, subject tocertain adjustments as provided in the Original Stock Purchase Agreement.
130

Table of Contents
Concurrently with the execution of the Original Stock Purchase Agreement, the Company entered into a Reorganization Agreement (the “Original ReorganizationAgreement”) with Yahoo Holdings, pursuant to which the Company will transfer to Yahoo Holdings prior to the consummation of the Sale all of its assets andliabilities relating to its operating business, other than specified excluded assets and retained liabilities (the “Reorganization”).
On February 20, 2017, the Company and Verizon entered into an Amendment to Stock Purchase Agreement amending the Original Stock Purchase Agreement(the “SPA Amendment” and, together with the Original Stock Purchase Agreement, the “Amended Stock Purchase Agreement”), and, concurrently with theexecution of the SPA Amendment, the Company and Yahoo Holdings entered into an Amendment to Reorganization Agreement amending the OriginalReorganization Agreement (the “RA Amendment”). Additionally, concurrently with the execution of the SPA Amendment and the RA Amendment, the Company,Yahoo Holdings, and Verizon entered into a Settlement and Release Agreement (the “Settlement and Release Agreement”).
The SPA Amendment, among other things, (i) reduced the consideration to be paid by Verizon to the Company in connection with the Sale by $350,000,000 to$4,475,800,000, (ii) provided that certain data security incidents to which the Company has been subject will be disregarded for purposes of determining whethercertain closing conditions have been satisfied and in determining whether a “Business Material Adverse Effect” has occurred, and (iii) provided that the date afterwhich each of Yahoo and Verizon may terminate the Amended Stock Purchase Agreement if the Closing (as defined in the Amended Stock PurchaseAgreement) has not occurred has been extended to July 24, 2017.
The RA Amendment provides, among other things, that the Company and Verizon will each be responsible for 50 percent of certain post-closing cash liabilitiesrelated to certain data security incidents and other data breaches incurred by the Company.
Under the terms of the Settlement and Release Agreement, among other things, Verizon released certain claims, subject to certain exceptions, it (and itsaffiliates and representatives) may have against the Company (or its affiliates and representatives) relating to certain data security incidents and other databreaches incurred by the Company.
Upon completion of the Sale, Verizon will also receive for its benefit and that of its current and certain of its future affiliates, a non-exclusive, worldwide,perpetual, royalty-free license to certain intellectual property not core to the operating business held by Excalibur IP, LLC, a wholly-owned subsidiary of theCompany (“Excalibur”), that is not being transferred to Yahoo Holdings with the operating business.
The excluded assets include the Company’s cash and marketable securities as of the closing of the Sale, the Company’s shares in Alibaba Group and YahooJapan, certain other minority equity investments, and all of the equity in Excalibur. The retained liabilities will include the Notes, securityholder litigation, certaindirector and officer indemnification obligations, and, pursuant to the RA Amendment, 50 percent of certain post-closing cash liabilities related to certain datasecurity incidents and other data breaches incurred by the Company. Following the closing of the Sale, the excluded assets and retained liabilities will remain inthe Company which will be renamed Altaba Inc. and will become an independent, publicly traded, management investment company registered under theInvestment Company Act of 1940.
The closing of the Sale is subject to certain conditions, including, among others, the approval of the Sale by the Company’s stockholders, the closing of theReorganization, and certain other customary closing conditions.
131

Table of Contents
Note 5 Goodwill The changes in the carrying amount of goodwill for the years ended December 31, 2015 and 2016 were as follows (in thousands): Americas (1) EMEA (2) Asia Pacific (3) Total Net balance as of January 1, 2015 $ 4,322,219 $ 532,469 $ 297,882 $ 5,152,570 Acquisitions and related adjustments 130,450 21,606 — 152,056 Goodwill impairment charge (3,929,576) (531,261) — (4,460,837) Foreign currency translation adjustments (4,207) (22,814) (8,654) (35,675)
Net balance as of December 31, 2015 $ 518,886 $ — $ 289,228 $ 808,114 Goodwill impairment charge (394,901) — — (394,901) Foreign currency translation adjustments — — 2,596 2,596
Net balance as of December 31, 2016 $ 123,985 $ — $ 291,824 $ 415,809
(1) Gross goodwill balances for the Americas segment were $4.3 billion as of January 1, 2015 and $4.4 billion as of December 31, 2016. The Americas
segment includes accumulated impairment losses of $4.3 billion as of December 31, 2016. (2) Gross goodwill balances for the EMEA segment were $1.2 billion as of January 1, 2015 and December 31, 2016. The EMEA segment includes
accumulated impairment losses of $630 million as of January 1, 2015, and $1.2 billion as of December 31, 2016. (3) Gross goodwill balances for the Asia Pacific segment were $457 million as of January 1, 2015 and $451 million as of December 31, 2016. The Asia
Pacific segment includes accumulated impairment losses of $159 million as of January 1, 2015 and December 31, 2016.
GoodwillImpairmentTesting
Goodwill is not amortized but is tested for impairment annually (as of October 31) at the reporting unit level or whenever the Company identifies certain triggeringevents or circumstances that would more likely than not reduce the estimated fair value of a reporting unit below its carrying amount. Events or circumstancesthat might indicate an interim evaluation is warranted include, among other things, unexpected adverse business conditions, regulatory changes, loss of keypersonnel and reporting unit and macro-economic factors such as deterioration in general economic conditions, limitations on accessing capital, fluctuations inforeign exchange rates, or other developments in equity and credit markets.
Goodwill is tested for impairment at the reporting unit level, which is at or one level below the Company’s operating segments. The Company identified U.S. &Canada, Latin America, and Tumblr as the reporting units below the Americas operating segment; EMEA is the reporting unit as well as the operating segment;and Taiwan, Hong Kong, Australia & New Zealand, India & Southeast Asia as the reporting units below the Asia Pacific operating segment. These operatingsegments are the same as the Company’s reportable segments.
To test for impairment, the Company uses the two-step quantitative test.
Step One
The first step of the quantitative test involves comparing the estimated fair value of the Company’s reporting units to their carrying values, including goodwill.
132

Table of Contents
To estimate fair value, the company uses the market approach, income approach, or a combination of the two. Under the market approach, the Company utilizespublicly-traded comparable company information to determine revenue and earnings multiples that are used to value the Company’s reporting units. Under theincome approach, the Company determines fair value based on estimated future cash flows of each reporting unit discounted by an estimated weighted-averagecost of capital, reflecting the overall level of inherent risk of a reporting unit and the rate of return an outside investor would expect to earn. The Company basescash flow projections for each reporting unit using a forecast of cash flows and a terminal value based on the Perpetuity Growth Model.
Step Two
For any reporting units, where the carrying value exceeds the estimated fair value, as determined in step one, the Company performs step two to measure theamount of impairment, if any. The second step of the quantitative test is performed by comparing the carrying value of the goodwill in the reporting unit to itsimplied fair value. The implied fair value is calculated by allocating all of the assets and liabilities of the reporting unit, including any unrecognized intangibleassets, in a hypothetical analysis that calculates the implied fair value of goodwill in the same manner as if the reporting unit was being acquired in a businesscombination. An impairment charge is recognized for the excess of the carrying value of goodwill over its implied fair value.
2016 Impairment Testing
Interim Test. After recording the goodwill impairment charge for Tumblr during the fourth quarter of 2015, the fair value of the Tumblr reporting unitapproximated its carrying value. As such, any significant unfavorable changes in the forecast would result in the fair value being less than the carrying value.During the second quarter of 2016, the Company determined that there were indicators present to suggest that it was more likely than not that the fair value ofthe Tumblr reporting unit was less than its carrying amount. The significant changes for the Tumblr reporting unit subsequent to the annual goodwill impairmenttest performed as of October 31, 2015 included a decline in the 2016 and beyond forecasted revenue, operating income and cash flows.
To test the Tumblr reporting unit for impairment, the Company used the two-step quantitative test. Consistent with methodology used for the prior year’s annualgoodwill impairment testing, the Company estimated the fair value of the Tumblr reporting unit using an income approach which was deemed to be the mostindicative of fair value in an orderly transaction between market participants. Under the income approach, the Company determined fair value based onestimated future cash flows of the Tumblr reporting unit discounted by an estimated weighted-average cost of capital, reflecting the overall level of inherent riskof the Tumblr reporting unit and the rate of return an outside investor would expect to earn. The Company based its cash flow projections for the Tumblrreporting unit using a forecast of cash flows and a terminal value based on the Perpetuity Growth Model. The forecast and related assumptions were derivedfrom an updated financial forecast prepared during the second quarter of 2016. As a result of the analysis, the Company concluded that the carrying value of theTumblr reporting unit exceeded its estimated fair value. The second step of the quantitative test was performed by comparing the carrying value of the goodwillin the Tumblr reporting unit to its implied fair value. The step two quantitative test for the Tumblr reporting unit resulted in an impairment for the Tumblr reportingunit, and the Company recorded a goodwill impairment charge of $395 million during the second quarter of 2016.
Annual Test. As of October 31, 2016, the Company conducted its annual impairment test and no additional impairment was identified.
The remaining goodwill related to the Tumblr reporting unit as of December 31, 2016 was $124 million, which is included in the Americas operating segment. Asof December 31, 2016, there was also
133

Table of Contents
goodwill remaining for Taiwan, Hong Kong, and Australia & New Zealand reporting units, which are included in the Asia Pacific operating segment.
2015 Impairment Testing
In 2015, the estimated fair values of the reporting units for all reporting units identified, except for Tumblr and Latin America, were estimated using a combinationof a market approach and an income approach, giving equal weighting to each. This combination is deemed to be the most indicative of the reporting units’estimated fair value in an orderly transaction between market participants and is consistent with the methodology used for the goodwill impairment test in prioryears. For the Tumblr reporting unit, the fair value was estimated using an income approach which was deemed to be the most indicative of fair value in anorderly transaction between market participants. For the Latin America reporting unit, the fair value was estimated using the market approach as the incomeapproach yielded negative cash flows and was not deemed to be comparable. The forecast and related assumptions were derived from the most recent annualfinancial forecast for which the planning process commenced in the fourth quarter of 2015. The estimated fair values of the Company’s Taiwan, Hong Kong, andAustralia & New Zealand reporting units exceeded their estimated carrying values and therefore goodwill in those reporting units was not impaired. In 2015, thecarrying value exceeded the fair value for the following reporting units: U.S. & Canada, Europe, Tumblr and Latin America. The Company completed anassessment of the implied fair value of these reporting units, which resulted in an impairment of all goodwill for the U.S. & Canada, Europe, and Latin Americareporting units and a partial impairment for the Tumblr reporting unit. The Company recorded goodwill impairment charges of $3,692 million, $531 million,$230 million and $8 million, associated with the U.S. & Canada, Europe, Tumblr, and Latin America reporting units, respectively, for the year endedDecember 31, 2015. The impairments were a result of a combination of factors, including a sustained decrease in the Company’s market capitalization in fourthquarter of 2015 and lower estimated projected revenue and profitability in the near term. The lower estimated projected cash flows and higher discount rateswere used to estimate the fair value of each reporting unit affected by such changes.
2014 Impairment Testing
In 2014, as a result of the annual goodwill impairment test, the Company concluded that the carrying value of the Middle East reporting unit, included in theEMEA reportable segment, and the carrying value of the India & Southeast Asia reporting unit included in the Asia Pacific reportable segment both exceededtheir respective fair values. As required by the second step of the impairment test, the Company performed an allocation of the fair value to all the assets andliabilities of the reporting unit, including identifiable intangible assets, based on their estimated fair values, to determine the implied fair value of goodwill.Accordingly, the Company recorded a goodwill impairment charge related to the Middle East and India & Southeast Asia reporting units of $79 million and$9 million, respectively, during the quarter ended December 31, 2014 for the difference between the carrying value of the goodwill in the reporting unit and itsimplied fair value with no goodwill remaining in either reporting unit. The impairment resulted from a decline in business conditions in the Middle East and India &Southeast Asia during the latter half of 2014.
134

Table of Contents
Note 6 Intangible Assets, Net The following table summarizes the Company’s intangible assets, net (in thousands): December 31, 2015
Gross Carrying
Amount
AccumulatedAmortization
(*) Net Customer, affiliate, and advertiser related relationships $ 355,568 $ (135,513) $220,055 Developed technology and patents 170,289 (83,380) 86,909 Tradenames, trademarks, and domain names 67,119 (26,814) 40,305
Total intangible assets, net $ 592,976 $ (245,707) $347,269
December 31, 2016
Gross Carrying
Amount
AccumulatedAmortization
(*) Impairment
Charge Net Customer, affiliate, and advertiser related relationships $ 350,896 $ (181,451) $ (66,680) $102,765 Developed technology and patents 128,732 (81,489) — 47,243 Tradenames, trademarks, and domain names 66,631 (34,340) (20,655) 11,636
Total intangible assets, net $ 546,259 $ (297,280) $ (87,335) $161,644
(*) Cumulative foreign currency translation adjustments, reflecting movement in the currencies of the underlying entities, totaled approximately $18 million
and $17 million for the years ended as of December 31, 2015 and 2016, respectively.
Definite-lived intangible assets are carried at cost and are amortized over their estimated useful lives, generally on a straight-line basis, as follows: • Customer, affiliate, and advertiser related relationships—one to six years; • Developed technology and patents—three to six years; and • Tradenames, trademarks, and domain names—three to seven years.
The Company recognized amortization expense for intangible assets of $132 million, $137 million, and $100 million for 2014, 2015, and 2016, respectively,including $65 million, $58 million, and $42 million, respectively, included in cost of revenue-other. Based on the current amount of intangibles subject toamortization, the estimated amortization expense for each of the succeeding years is as follows: 2017: $76 million; 2018: $55 million; 2019: $30 million; and2020 and after: $1 million.
IntangiblesImpairmentTesting
The Company reviews identifiable intangible assets to be held and used for impairment whenever events or changes in circumstances indicate that the carryingvalue of the assets may not be recoverable. Determination of recoverability is based on the lowest level of identifiable estimated undiscounted cash flowsresulting from use of the asset and its eventual disposition. Intangible assets with indefinite useful lives are not amortized but are reviewed for impairmentwhenever events or changes in circumstances indicate that it is more likely than not that the fair value is less than its carrying amount. If the Companydetermines that an intangible asset with an indefinite life is more likely than not impaired, a quantitative test comparing the fair value of the indefinite-livedpurchased
135

Table of Contents
intangible asset with its carrying amount is performed. The Company estimates the fair value of indefinite-lived purchased intangible assets using an incomeapproach. Measurement of any impairment losses on both definite-lived and indefinite-lived intangible assets are based on the excess of the carrying value ofthe asset over its fair value.
As a result of the impairment testing performed in the fourth quarter of 2015, the entire carrying value of the indefinite-lived intangible assets were fully impairedas of December 31, 2015, and the Company did not purchase any indefinite-lived intangibles during 2016. As of December 31, 2016, the Company only haddefinite-lived intangible assets.
2016 Testing
During the second quarter of 2016, the Company reviewed its Tumblr asset group for impairment as there were events and changes in circumstances thatindicated that the carrying value of the long-lived assets may not be recoverable. As a result, the Company performed a quantitative test comparing the fair valueof the Tumblr long-lived assets with the carrying amounts and recorded a partial impairment charge of $87 million associated with its definite-lived intangibleassets, which were included within customer, affiliate, and advertiser related relationships and tradenames, trademarks, and domain names in the Americassegment.
In the fourth quarter of 2016, the Company reviewed its definite-lived intangible assets for impairment. No impairment was identified for definite-lived intangibles.
2015 Testing
In the fourth quarter of 2015, the Company reviewed both definite-lived and indefinite-lived intangible assets for impairment. No impairment was identified fordefinite-lived intangibles. For indefinite-lived intangibles, the Company performed a quantitative test comparing the fair value of the indefinite-lived intangibleassets with their carrying amount and recorded an impairment charge of $15 million related to certain indefinite-lived intangible assets in the EMEA segment. Asa result, the entire carrying value of the indefinite-lived intangible assets was fully impaired as of December 31, 2015.
Note 7 Basic and Diluted Net Income (Loss) Attributable to Yahoo! Inc. CommonStockholders Per Share Basic and diluted net income (loss) attributable to Yahoo! Inc. common stockholders per share is computed using the weighted average number of commonshares outstanding during the period, excluding net income attributable to participating securities (restricted stock units granted under the Directors’ Stock Plan(the “Directors’ Plan”)). Diluted net income (loss) per share is computed using the weighted average number of common shares and, if dilutive, potential commonshares outstanding during the period. Potential common shares are calculated using the treasury stock method and consist of unvested restricted stock andshares underlying unvested restricted stock units, the incremental common shares issuable upon the exercise of stock options, and shares to be purchasedunder the 1996 Employee Stock Purchase Plan (the “Employee Stock Purchase Plan”). The Company calculates potential tax windfalls and shortfalls byincluding the impact of deferred tax assets.
The Company takes into account the effect on consolidated net income (loss) per share of dilutive securities of entities in which the Company holds equityinterests that are accounted for using the equity method.
136

Table of Contents
For 2014, potentially dilutive securities representing approximately 3 million were excluded from the computation of diluted earnings per share for these periodsbecause their effect would have been anti-dilutive.
The Company has the option to pay cash, issue shares of common stock or any combination thereof for the aggregate amount due upon conversion of theNotes. The Company’s intent is to settle the principal amount of the Notes in cash upon conversion. As a result, upon conversion of the Notes, only the amountspayable in excess of the principal amounts of the Notes are considered in diluted earnings per share under the treasury stock method.
The denominator for diluted net income (loss) per share also does not include any effect from the note hedges. In future periods, the denominator for diluted netincome (loss) per share will exclude any effect of the note hedges, if their effect would be anti-dilutive. In the event an actual conversion of any or all of the Notesoccurs, the shares that would be delivered to the Company under the note hedges are designed to reduce the dilutive effect of the shares that the Companywould issue under the Notes. See Note 11—”Convertible Notes” for additional information.
The following table sets forth the computation of basic and diluted net income (loss) per share (in thousands, except per share amounts): Years Ended December 31, 2014 2015 2016 Basic: Numerator:
Net income (loss) attributable to Yahoo! Inc. $ 7,521,731 $ (4,359,082) $ (214,321) Less: Net income allocated to participating securities (68) — (4)
Net income (loss) attributable to Yahoo! Inc. common stockholders—basic $ 7,521,663 $ (4,359,082) $ (214,325)
Denominator: Weighted average common shares 987,819 939,141 949,843
Net income (loss) attributable to Yahoo! Inc. common stockholders per share—basic $ 7.61 $ (4.64) $ (0.23)
Diluted: Numerator:
Net income (loss) attributable to Yahoo! Inc. $ 7,521,731 $ (4,359,082) $ (214,321) Less: Net income allocated to participating securities (67) — — Less: Effect of dilutive securities issued by equity investees (43,689) — —
Net income (loss) attributable to Yahoo! Inc. common stockholders—diluted $ 7,477,975 $ (4,359,082) $ (214,321)
Denominator: Denominator for basic calculation 987,819 939,141 949,843 Weighted average effect of Yahoo! Inc. dilutive securities:
Restricted stock units 12,365 — — Stock options and employee stock purchase plan (*) 3,924 — —
Denominator for diluted calculation 1,004,108 939,141 949,843
Net income (loss) attributable to Yahoo! Inc. common stockholders per share—diluted $ 7.45 $ (4.64) $ (0.23)
(*) At the beginning of the first quarter of 2015, the Company discontinued the offering of the Employee Stock Purchase Plan to its employees. See Note 14
—“Employee Benefits” for additional information.
137

Table of Contents
Note 8 Investments in Equity Interests Accounted for Using the Equity Method of Accounting The following table summarizes the Company’s investments in equity interests using the equity method of accounting as of December 31, 2015 and 2016(dollars in thousands):
December 31,2015
Percent Ownership
December 31,2016
Percent Ownership
Yahoo Japan $ 2,496,657 35.5% $ 3,192,884 35.5% Other 6,572 20% — 0%
Total $ 2,503,229 $ 3,192,884
YahooJapan
During April 1996, the Company signed a joint venture agreement with Softbank, as amended in September 1997, which formed Yahoo Japan. Yahoo Japanwas formed to establish and manage a local version of Yahoo in Japan.
The investment in Yahoo Japan is accounted for using the equity method and the total investment, including net tangible assets, identifiable intangible assets,and goodwill, is classified as part of the investments in equity interests balance on the Company’s consolidated balance sheets. The Company records its shareof the results of Yahoo Japan and any related amortization expense, one quarter in arrears within earnings in equity interests in the consolidated statements ofoperations.
The Company makes adjustments to the earnings in equity interests line in the consolidated statements of operations for any material differences between U.S.GAAP and International Financial Reporting Standards (“IFRS”) issued by the International Accounting Standards Board, the standards by which Yahoo Japan’sfinancial statements are prepared.
The fair value of the Company’s ownership interest in the common stock of Yahoo Japan, based on the quoted stock price, was approximately $7.7 billion as ofDecember 31, 2016.
During the years ended December 31, 2014, 2015, and 2016, the Company received cash dividends from Yahoo Japan in the amounts of $84 million,$142 million, and $157 million, net of withholding taxes, respectively, which were recorded as reductions to the Company’s investment in Yahoo Japan.
During the year ended December 31, 2014, the Company sold data center assets and assigned a data center lease to Yahoo Japan for cash proceeds of$11 million and recorded a net gain of approximately $5 million.
138

Table of Contents
The following tables present summarized financial information derived from Yahoo Japan’s consolidated financial statements, which are prepared on the basis ofIFRS. The Company has made adjustments to the Yahoo Japan summarized financial information to address differences between IFRS and U.S. GAAP thatmaterially impact the summarized financial information below. Any other differences between U.S. GAAP and IFRS did not have any material impact on theYahoo Japan’s summarized financial information presented below (in thousands): Twelve Months Ended September 30, 2014 2015 2016 Operating data:
Revenue $ 4,046,412 $ 3,769,410 $ 4,368,106 Gross profit $ 3,262,450 $ 2,983,880 $ 3,415,075 Income from operations $ 1,896,368 $ 1,609,403 $ 1,515,171 Net income $ 1,236,583 $ 1,092,657 $ 1,020,168 Net income attributable to Yahoo Japan $ 1,225,221 $ 1,092,048 $ 1,028,076
September 30, 2015 2016
Balance sheet data: Current assets $ 6,150,688 $ 7,155,657 Long-term assets $ 2,430,699 $ 4,332,498 Current liabilities $ 2,003,960 $ 2,866,924 Long-term liabilities $ 245,834 $ 435,253 Noncontrolling interests $ 165,601 $ 209,363
Since acquiring its equity interest in Yahoo Japan, the Company has recorded cumulative earnings in equity interests, net of dividends received and relatedtaxes on dividends, of $3.3 billion, $3.7 billion, and $4 billion as of December 31, 2014, 2015, and 2016, respectively.
Under technology and trademark license and other commercial arrangements with Yahoo Japan, the Company records revenue from Yahoo Japan based on apercentage of advertising revenue earned by Yahoo Japan. The Company recorded revenue from Yahoo Japan of approximately $253 million, $228 million, and$257 million, respectively, for the years ended December 31, 2014, 2015, and 2016. As of December 31, 2015 and 2016, the Company had net receivablebalances from Yahoo Japan of approximately $37 million and $46 million, respectively.
AlibabaGroup
EquityInvestmentinAlibabaGroup. Prior to the closing of the Alibaba Group IPO in September 2014, the Company’s investment in Alibaba Group wasaccounted for using the equity method, and the total investment, including net tangible assets, identifiable intangible assets, and goodwill, was classified as partof investments in equity interests balance on the Company’s consolidated balance sheets. Prior to the Alibaba Group IPO, the Company recorded its share ofthe results of Alibaba Group one quarter in arrears within earnings in equity interests in the consolidated statements of operations, including any related taximpacts related to the earnings in equity interest. Subsequent to the Alibaba Group IPO, the Company reflects the investment in Alibaba Group as anavailable-for-sale equity security on the consolidated balance sheet and adjusts the investment to fair value each quarterly reporting period with changes in fairvalue recorded within other comprehensive income
139

Table of Contents
(loss), net of tax. See Note 2—“Marketable Securities, Investments and Fair Value Disclosures” and the consolidated statements of comprehensive income(loss) for additional information. The Company does not currently intend to sell its shares of Alibaba Group in response to changes in the market price of theshares.
TechnologyandIntellectual PropertyLicenseAgreement. As a result of the Alibaba Group IPO, Alibaba Group’s obligation to make royalty paymentsunder the TIPLA ceased on September 24, 2014 and the Company’s recognition of the remaining TIPLA deferred revenue was completed on September 18,2015. The Company recognized approximately $281 million and $199 million for the years ended December 31, 2014 and 2015, respectively, related to theTIPLA.
Note 9 Foreign Currency Derivative Financial Instruments The Company uses derivative financial instruments, primarily forward contracts (and previously including option contracts), to mitigate risk associated withadverse movements in foreign currency exchange rates.
The Company records all derivatives in the consolidated balance sheets at fair value, with assets included in prepaid expenses and other current assets or otherlong-term assets, and liabilities included in accrued expenses and other current liabilities or other long-term liabilities. The Company’s accounting treatment forthese instruments is based on whether or not the instruments are designated as a hedging instrument. The effective portions of net investment hedges arerecorded in other comprehensive income (expense) as a part of the cumulative translation adjustment. The effective portions of cash flow hedges are recordedin accumulated other comprehensive income until the hedged item is recognized in revenue on the consolidated statements of operations when the underlyinghedged revenue is recognized. Any ineffective portions of net investment hedges and cash flow hedges are recorded in other income (expense), net on theCompany’s consolidated statements of operations. For balance sheet hedges, changes in the fair value are recorded in other income (expense), net on theCompany’s consolidated statements of operations.
The Company has master netting arrangements, which are designed to reduce credit risk by permitting net settlement of foreign exchange contracts with thesame counterparty, subject to applicable requirements. The Company presents its derivative assets and liabilities at their gross fair values on the consolidatedbalance sheets. The Company is not required to pledge, and is not entitled to receive, cash collateral related to these derivative transactions.
DesignatedasHedgingInstruments
NetInvestmentHedges. The Company currently hedges, on an after-tax basis, a portion of its net investment in Yahoo Japan with forward contracts toreduce the risk that its investment in Yahoo Japan will be adversely affected by foreign currency exchange rate fluctuations. The total of the after-tax netinvestment hedge was less than the Yahoo Japan investment balance as of both December 31, 2015 and 2016. As such, the net investment hedge wasconsidered to be effective.
CashFlowHedges. The Company entered into foreign currency forward contracts designated as cash flow hedges of varying maturities through January 31,2017. The cash flow hedges were considered to be effective as of December 31, 2014, 2015, and 2016. All of the forward contracts designated as cash flowhedges that were settled were reclassified to revenue within fiscal years 2014, 2015 and 2016, and the Company recognized the hedge forecasted revenuerelated to these contacts as of December 31, 2014, 2015, and 2016. These trades were de-designated as of December 31, 2016 and all current outstandingcash flow hedges have been reclassified into revenue
140

Table of Contents
during 2016. For the years ended December 31, 2014, 2015, and 2016, the amounts recorded in other income (expense), net as a result of hedgeineffectiveness were not material.
NotDesignatedasHedgingInstruments
BalanceSheetHedges. The Company hedges certain of its net recognized foreign currency assets and liabilities with foreign exchange forward contracts toreduce the risk that its earnings and cash flows will be adversely affected by changes in foreign currency exchange rates. These derivative instruments hedgeassets and liabilities, including intercompany transactions, which are denominated in foreign currencies.
Notional amounts of the Company’s outstanding derivative contracts as of December 31, 2014, 2015, and 2016 (in millions) were as follows:
December 31, 2014 2015 2016
Derivatives designated as hedging instruments: Net investment hedge forward and option contracts $ 1,647 $ 1,150 $ 200 Cash flow hedge forwards $ 222 $ 75 $ 19
Derivatives not designated as hedging instruments: Balance sheet hedges $ 243 $ 225 $ 342
Foreign currency derivative activity for the year ended December 31, 2015 was as follows (in millions):
BeginningFair Value
Settlement Payment
(Receipt), Net
Gain (Loss) Recorded in
Other Income (Expense), Net
Gain (Loss) Recorded in
Other ComprehensiveIncome (Loss)
Gain (Loss)
Recordedin
Revenue Ending Fair
Value Derivatives designated as hedginginstruments:
Net investment hedges $ 185 $ (117) $ 1 $ 5 (*) $ — $ 74 Cash flow hedges $ 8 $ — $ (1) $ (2) $ (3) $ 2
Derivatives not designated ashedging instruments:
Balance sheet hedges $ 4 $ (21) $ 19 $ — $ — $ 2 (*) This amount does not reflect the tax impact of $2 million recorded during the twelve months ended December 31, 2015. The $3 million after tax impact of
the gain recorded within other comprehensive income (loss) was included in accumulated other comprehensive income on the Company’s consolidatedbalance sheets as of December 31, 2015.
141

Table of Contents
Foreign currency derivative activity for the year ended December 31, 2016 was as follows (in millions):
BeginningFair Value
SettlementPayment (Receipt),
Net
Gain (Loss) Recorded in Other Income
(Expense), Net
Gain (Loss) Recorded in
Other ComprehensiveIncome (Loss)
Gain (Loss)
Recordedin
Revenue Ending Fair
Value Derivatives designated as hedginginstruments:
Net investment hedges $ 74 $ (30) $ — $ (53) (*) $ — $ (9) Cash flow hedges $ 2 $ 5 $ 1 $ (1) $ (7) $ —
Derivatives not designated ashedging instruments:
Balance sheet hedges $ 2 $ (4) $ 13 $ — $ — $ 11 (*) This amount does not reflect the tax impact of $19 million recorded during the twelve months ended December 31, 2016. The $34 million after tax impact
of the loss recorded within other comprehensive income (loss) was included in accumulated other comprehensive income on the Company’sconsolidated balance sheets as of December 31, 2016.
Foreign currency derivative contracts balance sheet location and ending fair value was as follows (in millions):
Balance SheetLocation
December 31,2015
December 31,2016
Derivatives designated as hedging instruments: Net investment hedges Asset (1) $ 79 $ —
Liability (2) $ (5) $ (9) Cash flow hedges Asset (1) $ 2 $ —
Liability (2) $ — $ — Derivatives not designated as hedging instruments:
Balance sheet hedges Asset (1) $ 3 $ 12 Liability (2) $ (1) $ (1) (1) Included in prepaid expenses and other current assets or other long-term assets and investments on the consolidated balance sheets.
(2) Included in other accrued expenses and current liabilities or other long-term liabilities on the consolidated balance sheets.
See the Foreign Currency and Derivative Financial Instruments section within Note 1—“The Company and Summary of Significant Accounting Policies” foradditional information.
Note 10 Credit Agreement On May 18, 2016, the Company delivered notice to Citibank to terminate its credit agreement with Citibank, N.A., as Administrative Agent, entered into onOctober 19, 2012 (as amended on October 10,
142

Table of Contents
2013, October 9, 2014, and July 24, 2015) which provided for a $750 million unsecured revolving credit facility. The termination of the credit agreement tookeffect on May 23, 2016.
Note 11 Convertible Notes
0.00%ConvertibleSeniorNotes
As of December 31, 2016, the Company had $1.4 billion in principal amount of Notes outstanding. In 2013, the Company issued the Notes. The Notes were soldunder a purchase agreement, dated November 20, 2013, with J.P. Morgan Securities LLC and Goldman, Sachs & Co., as representatives of the several initialpurchasers named therein (collectively, the “Initial Purchasers”). The Notes were sold to the Initial Purchasers for resale to qualified institutional buyers pursuantto Rule 144A under the Securities Act of 1933, as amended.
In connection with the issuance of the Notes, the Company entered into an indenture (the “Indenture”) with The Bank of New York Mellon Trust Company, N.A.,as trustee. Under the Indenture, the Notes are senior unsecured obligations of Yahoo, the Notes do not bear regular interest, and the principal amount of theNotes was issued at par value. The Notes mature on December 1, 2018, unless previously purchased or converted in accordance with their terms prior to suchdate. The Company may not redeem the Notes prior to maturity. However, holders of the Notes may convert them at certain times and upon the occurrence ofcertain events in the future, as outlined in the indenture governing the Notes. Holders of the Notes who convert in connection with a “make-whole fundamentalchange,” as defined in the Indenture, may require Yahoo to purchase for cash all or any portion of their Notes at a purchase price equal to 100 percent of theprincipal amount, plus accrued and unpaid special interest as defined in the Indenture, if any. The Notes are convertible, subject to certain conditions, intoshares of Yahoo common stock at an initial conversion rate of 18.7161 shares per $1,000 principal amount of Notes (which is equivalent to an initial conversionprice of approximately $53.43 per share), subject to adjustment upon the occurrence of certain events. Certain corporate events described in the Indenture mayincrease the conversion rate for holders who elect to convert their Notes in connection with such corporate event should they occur. Upon conversion of theNotes, holders will receive cash, shares of Yahoo’s common stock, or a combination thereof, at Yahoo’s election. The Company’s intent is to settle the principalamount of the Notes in cash upon conversion. If the conversion value exceeds the principal amount, the Company would deliver shares of its common stock withrespect to the remainder of its conversion obligation in excess of the aggregate principal amount (conversion spread). The conversion spread will be included inthe denominator for the computation of diluted net income per common share, using the treasury stock method. As of December 31, 2016, none of theconditions allowing holders of the Notes to convert had been met.
In accounting for the issuance of the Notes, the Company separated the Notes into liability and equity components. The carrying amount of the liabilitycomponent was calculated by measuring the estimated fair value of a similar liability that does not have an associated convertible feature. The carrying amountof the equity component representing the conversion option was determined by deducting the fair value of the liability component from the face value of theNotes as a whole. The excess of the principal amount of the liability component over its carrying amount (“debt discount”) is amortized to interest expense overthe term of the Notes using the effective interest method with an effective interest rate of 5.26 percent per annum. The equity component is not remeasured aslong as it continues to meet the conditions for equity classification.
In accounting for the transaction costs related to the Note issuance, the Company allocated the total amount incurred to the liability and equity componentsbased on their relative values. Issuance costs
143
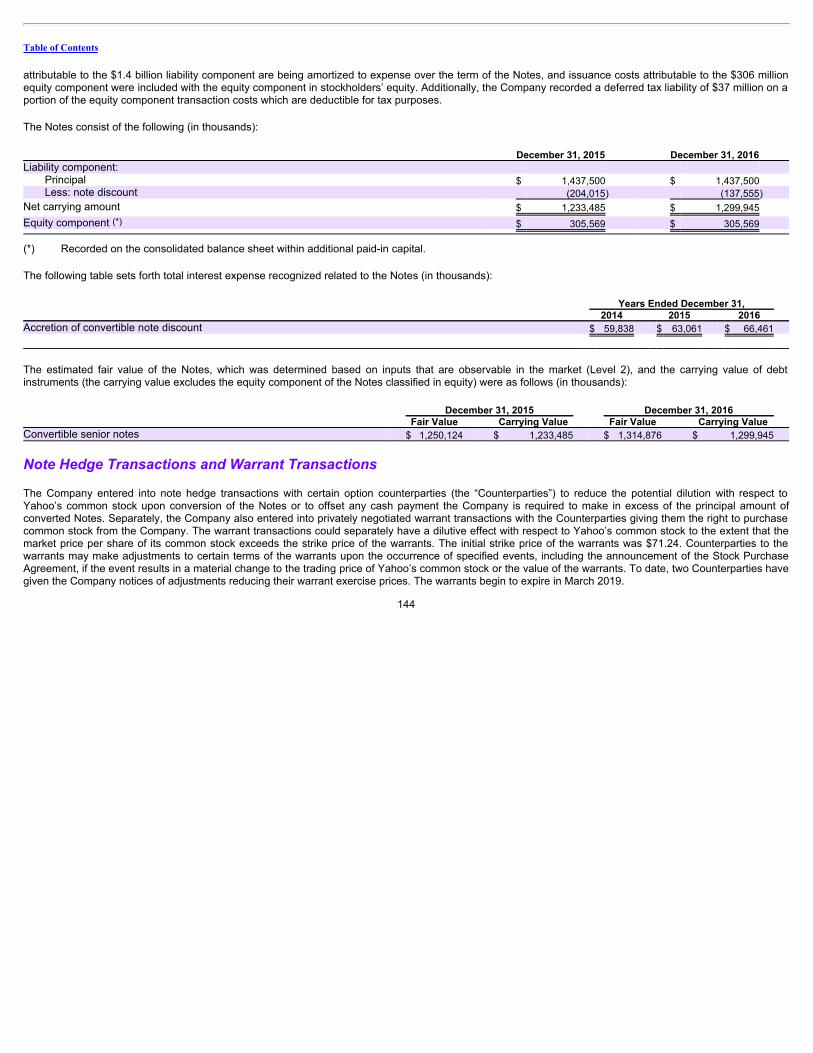
Table of Contents
attributable to the $1.4 billion liability component are being amortized to expense over the term of the Notes, and issuance costs attributable to the $306 millionequity component were included with the equity component in stockholders’ equity. Additionally, the Company recorded a deferred tax liability of $37 million on aportion of the equity component transaction costs which are deductible for tax purposes.
The Notes consist of the following (in thousands): December 31, 2015 December 31, 2016 Liability component:
Principal $ 1,437,500 $ 1,437,500 Less: note discount (204,015) (137,555)
Net carrying amount $ 1,233,485 $ 1,299,945
Equity component (*) $ 305,569 $ 305,569
(*) Recorded on the consolidated balance sheet within additional paid-in capital.
The following table sets forth total interest expense recognized related to the Notes (in thousands): Years Ended December 31, 2014 2015 2016 Accretion of convertible note discount $ 59,838 $ 63,061 $ 66,461
The estimated fair value of the Notes, which was determined based on inputs that are observable in the market (Level 2), and the carrying value of debtinstruments (the carrying value excludes the equity component of the Notes classified in equity) were as follows (in thousands):
December 31, 2015 December 31, 2016 Fair Value Carrying Value Fair Value Carrying Value
Convertible senior notes $ 1,250,124 $ 1,233,485 $ 1,314,876 $ 1,299,945
NoteHedgeTransactionsandWarrantTransactions
The Company entered into note hedge transactions with certain option counterparties (the “Counterparties”) to reduce the potential dilution with respect toYahoo’s common stock upon conversion of the Notes or to offset any cash payment the Company is required to make in excess of the principal amount ofconverted Notes. Separately, the Company also entered into privately negotiated warrant transactions with the Counterparties giving them the right to purchasecommon stock from the Company. The warrant transactions could separately have a dilutive effect with respect to Yahoo’s common stock to the extent that themarket price per share of its common stock exceeds the strike price of the warrants. The initial strike price of the warrants was $71.24. Counterparties to thewarrants may make adjustments to certain terms of the warrants upon the occurrence of specified events, including the announcement of the Stock PurchaseAgreement, if the event results in a material change to the trading price of Yahoo’s common stock or the value of the warrants. To date, two Counterparties havegiven the Company notices of adjustments reducing their warrant exercise prices. The warrants begin to expire in March 2019.
144

Table of Contents
Note 12 Commitments and Contingencies LeaseCommitments. The Company leases office space and data centers under operating and capital lease agreements with original lease periods of up to15 years which expire between 2017 and 2025.
Rent expense for all operating leases was approximately $86 million, $77 million, and $60 million for 2014, 2015, and 2016, respectively.
Many of the Company’s leases contain one or more of the following options which the Company can exercise at the end of the initial lease term: (i) renewal ofthe lease for a defined number of years at the then fair market rental rate or at a slight discount to the fair market rental rate; (ii) purchase of the property at thethen fair market value; or (iii) right of first offer to lease additional space that becomes available.
A summary of gross and net lease commitments as of December 31, 2016 was as follows (in millions):
Gross Operating Lease Commitments
SubleaseIncome
Net Operating Lease Commitments
Years ending December 31, 2017 $ 103 $ (16) $ 87 2018 75 (12) 63 2019 60 (9) 51 2020 47 (7) 40 2021 37 (5) 32 Due after 5 years 86 (2) 84
Total gross and net lease commitments $ 408 $ (51) $ 357
Capital
Lease Commitments Years ending December 31, 2017 $ 11 2018 9 2019 5 2020 — 2021 — Due after 5 years 3
Gross capital lease commitments $ 28 Less: interest 5
Net capital lease commitments included in other accrued expenses and current liabilities and other long-termliabilities $ 23
AffiliateCommitments. The Company is obligated to make payments, which represent TAC, to its Affiliates. As of December 31, 2016, these commitmentstotaled $925 million, of which $300 million will be payable in 2017, $300 million will be payable in 2018, $300 million will be payable in 2019, and $25 million willbe payable in 2020.
145

Table of Contents
Non-cancelableObligations. The Company is obligated to make payments under various non-cancelable arrangements with vendors and other businesspartners, principally for content, bandwidth, and marketing arrangements. As of December 31, 2016, these commitments totaled $172 million, of which$86 million will be payable in 2017, $55 million will be payable in 2018, $17 million will be payable in 2019, $4 million will be payable in 2020, $3 million will bepayable in 2021, and $7 million will be payable thereafter.
IntellectualPropertyRights. The Company is committed to make certain payments under various intellectual property arrangements of up to $12 millionthrough 2023.
NotePayableObligations.The Company is obligated to make payments for notes payable related to two buildings in Sunnyvale, California. The estimatedtiming and amounts of payments totaled $52 million, of which $5 million will be payable each year from 2017 through 2021, and $27 million will be payablethereafter.
StandbyLettersofCredit. As of December 31, 2016, the Company had outstanding potential obligations relating to standby letters of credit of $38 million.Standby letters of credit are financial guarantees provided by third parties for ongoing operating liabilities such as leases, utility bills, taxes, and insurance. If anyletter of credit is drawn upon by a beneficiary, the Company is obligated to reimburse the provider of the guarantee. The standby letters of credit generally renewannually.
OtherCommitments. In the ordinary course of business, the Company may provide indemnifications of varying scope and terms to customers, vendors,lessors, joint ventures and business partners, purchasers of assets or subsidiaries and other parties with respect to certain matters, including, but not limited to,losses arising out of the Company’s breach of agreements or representations and warranties made by the Company, services to be provided by the Company,intellectual property infringement claims made by third parties or, with respect to the sale, lease, or assignment of assets, or the sale of a subsidiary, mattersrelated to the Company’s conduct of the business and tax matters prior to the sale, lease or assignment. In addition, the Company has entered intoindemnification agreements with its directors and certain of its officers that will require the Company, among other things, to indemnify them against certainliabilities that may arise by reason of their status or service as directors or officers. The Company has also agreed to indemnify certain former officers, directors,and employees of acquired companies in connection with the acquisition of such companies. The Company maintains director and officer insurance, which maycover certain liabilities arising from its obligation to indemnify its current and former directors and officers, and former directors and officers of acquiredcompanies, in certain circumstances. It is not possible to determine the aggregate maximum potential loss under these indemnification agreements due to thelimited history of prior indemnification claims and the unique facts and circumstances involved in each particular agreement. Such indemnification agreementsmight not be subject to maximum loss clauses. Historically, the Company has not incurred material costs as a result of obligations under these agreements and ithas not accrued any material liabilities related to such indemnification obligations in the Company’s consolidated financial statements.
As of December 31, 2016, the Company did not have any relationships with unconsolidated entities or financial partnerships, such as entities often referred to asstructured finance or special purpose entities, established for the purpose of facilitating off-balance sheet arrangements or other contractually narrow or limitedpurposes. Accordingly, the Company is not exposed to any financing, liquidity, market, or credit risk that could arise if the Company had such relationships. Inaddition, the Company identified no variable interests currently held in entities for which it is the primary beneficiary.
146

Table of Contents
LegalContingencies
Patent Matters. From time to time, third parties assert patent infringement claims against the Company. Currently, the Company is engaged in lawsuitsregarding patent issues and has been notified of other potential patent disputes.
StockholderandSecuritiesMatters.On April 22, 2015, a stockholder action captioned Cathy Buch v. David Filo, et al ., was filed in the Delaware Court ofChancery against the Company and certain of its current and former directors. The complaint asserts both derivative claims, purportedly on behalf of Yahoo, andclass action claims, purportedly on behalf of the plaintiff and all similarly situated stockholders, relating to the termination of, and severance payments made to,the Company’s former chief operating officer, Henrique de Castro. The plaintiff claims that certain current and former board members allegedly violated oracquiesced in the violation of the Company’s Bylaws when Mr. de Castro was terminated without cause, and breached fiduciary duties by allowing Yahoo tomake allegedly false and misleading statements regarding the value of his severance. The plaintiff has also asserted claims against Mr. de Castro. The plaintiffseeks to have the full Board reassess the propriety of terminating Mr. de Castro without cause, potentially leading to disgorgement in favor of the Company ofthe severance paid to Mr. de Castro, an equitable accounting, monetary damages, declaratory relief, injunctive relief, and an award of attorneys’ fees and costs.The Company and the individual defendants filed a motion to dismiss the action, which the Court denied in part and granted in part on July 27, 2016.
On January 27, 2016, a stockholder action captioned UCFW Local 1500 Pension Fund v. Marissa Mayer, et al ., was filed in the U.S. District Court for theNorthern District of California against the Company, and certain current and former officers and directors of the Company. On April 29, 2016, the plaintiff filed anamended complaint. The amended complaint asserts derivative claims, purportedly on behalf of Yahoo, for violations of the Investment Company Act of 1940,breach of fiduciary duty, unjust enrichment, violations of Delaware General Corporation Law Section 124, and violations of California Business & ProfessionsCode Section 17200. The amended complaint seeks to rescind Yahoo’s employment contracts with the individual defendants because those defendantsallegedly caused Yahoo to illegally operate as an unregistered investment company. The plaintiff seeks disgorgement in favor of Yahoo, rescission, and anaward of attorneys’ fees and costs. In addition, the amended complaint asserts a direct claim against Yahoo for alleged violation of Delaware GeneralCorporation Law Section 124(1), based on the allegation that Yahoo has illegally operated as an unregistered investment company. Pursuant to this claim, theplaintiff seeks injunctive relief preventing Yahoo from entering into any future contracts, including any contracts to sell its assets. On October 19, 2016, theDistrict Court dismissed the amended complaint, with leave to amend. On November 18, 2016, the plaintiff filed a second amended complaint seekingsubstantially the same relief as it did in the amended complaint. On February 10, 2017, the District Court dismissed the second amended complaint withprejudice.
On January 24, 2017, a stockholder action captioned Madrack v. Yahoo! Inc., et al. , was filed in the U.S. District Court for the Northern District of Californiaagainst the Company and certain of its current officers. The plaintiff purports to represent a class of investors who purchased or otherwise acquired theCompany’s stock between November 12, 2013 and December 14, 2016. The complaint asserts claims under Sections 10(b) and 20(a) of the SecuritiesExchange Act of 1934. The complaint alleges that the Company’s public disclosures about its business, operations, and compliance policies were materiallymisleading in light of the Security Incidents discussed under “Security Incidents Contingencies” below. The complaint seeks class certification, damages,interest, and an award of attorneys’ fees and costs.
On February 9, 2017, a stockholder derivative action captioned The LR Trust, et al. v. Marissa Mayer, et al ., was filed in the Superior Court of California for theCounty of Santa Clara. The complaint asserts
147

Table of Contents
claims for breach of fiduciary duty, purportedly on behalf of the Company, against certain of the Company’s current and former directors and officers. Thecomplaint alleges that defendants failed to disclose the Security Incidents discussed under “Security Incidents Contingencies” below and caused or allowed theCompany to issue materially false and misleading statements in its public filings and other public statements. The complaint seeks unspecified damages,indemnification from the individual defendants, disgorgement of compensation obtained by defendants, an award of attorneys’ fees and costs, and other relatedequitable and injunctive relief.
On February 16, 2017, a stockholder derivative action captioned Summer v. Marissa Mayer, et al. , was filed in the U.S. District Court for the Northern District ofCalifornia purportedly on behalf of the Company against certain of its current and former directors and officers. On February 17, 2017, a substantially identicalstockholder derivative action captioned Bowser v. Marissa Mayer, et al. , was filed in the U.S. District Court for the Northern District of California against thesame defendants. The complaints allege that defendants failed to disclose the Security Incidents discussed under “Security Incidents Contingencies” below andcaused or allowed the Company to issue materially false and misleading statements in its public filings and other public statements. The complaints assertderivative claims, purportedly on behalf of the Company, for breach of fiduciary duty, unjust enrichment, and violations of Sections 14(a) and 20(a) of theSecurities Exchange Act of 1934. The complaints seek unspecified damages, to enjoin defendants from proceeding with, consummating, or closing thetransactions contemplated by the Amended Stock Purchase Agreement with Verizon, disgorgement of profits and compensation obtained by the defendants, anaward of attorneys’ fees and costs, and other related injunctive and equitable forms of relief.
On February 20, 2017, a stockholder derivative action captioned Oklahoma Firefighters Pension and Retirement System v. Eric Brandt, et al. , was filed in theDelaware Court of Chancery purportedly on behalf of the Company and against certain of its current officers and directors. The complaint asserts derivativeclaims for breach of fiduciary duty. The complaint alleges the defendants violated their fiduciary duties by, among other things, causing or allowing the Companyto issue materially false and misleading public statements and failing to disclose the Security Incidents in the Company’s public disclosures and inrepresentations and warranties provided to Verizon in connection with the Original Stock Purchase Agreement. The complaint seeks unspecified damages,equitable and injunctive relief, and an award to plaintiff of the costs and disbursements of the action, including but not limited to attorneys’ fees and expenses.
TCPALitigationConcerningYahooMessenger.On March 21, 2014 and April 16, 2014, civil complaints were filed in the U.S. District Court for the NorthernDistrict of Illinois by plaintiffs Rachel Johnson and Zenaida Calderin, respectively, against the Company, alleging that the process by which Yahoo Messengersends a notification SMS message in addition to delivering a user’s instant message to a recipient’s cellular telephone constitutes a violation of the TelephoneConsumer Protection Act (“TCPA”), 47 U.S.C. § 227. The penalty per violation ranges from $500 to $1,500. The complaints, which were consolidated, seekstatutory damages for a purported class of plaintiffs. In January 2016, the District Court denied class certification treatment proposed by plaintiff Calderin, whoaccepted a $1,500 offer of judgment to resolve her case in its entirety. The District Court certified a class proposed by plaintiff Johnson comprising more than300,000 potential members. The Company sought permission from the United States Court of Appeals for the Seventh Circuit to appeal the District Court’scertification order, which the Court of Appeals denied. No decision has been made on the merits of plaintiffs’ claims, which the Company is defending vigorously.The Company also previously defended related litigation in the United States District Court for the Southern District of California, which denied class certificationin September 2015; that case was dismissed with prejudice in March 2016.
General.The Company is regularly involved in claims, suits, government investigations, and proceedings arising from the ordinary course of the Company’sbusiness, including actions with
148
Table of Contents
respect to intellectual property claims, privacy, consumer protection, information security, data protection or law enforcement matters, tax matters, labor andemployment claims, commercial claims, as well as actions involving content generated by users, stockholder derivative actions, purported class action lawsuits,and other matters.
The Company has determined, based on current knowledge, that the amount or range of reasonably possible losses, including reasonably possible losses inexcess of amounts already accrued, is not reasonably estimable with respect to certain matters described above. The Company has also determined, based oncurrent knowledge, that the aggregate amount or range of losses that are estimable with respect to the Company’s legal proceedings, including the mattersdescribed above, would not have a material adverse effect on the Company’s consolidated financial position, results of operations or cash flows. Amountsaccrued as of December 31, 2016 were not material. The ultimate outcome of legal proceedings involves judgments, estimates and inherent uncertainties, andcannot be predicted with certainty. In the event of a determination adverse to Yahoo, its subsidiaries, directors, or officers in these matters, the Company mayincur substantial monetary liability, and be required to change its business practices. Either of these events could have a material adverse effect on theCompany’s financial position, results of operations, or cash flows. The Company may also incur substantial legal fees, which are expensed as incurred, indefending against these claims.
SecurityIncidentsContingencies
On September 22, 2016, the Company disclosed that a copy of certain user account information for approximately 500 million user accounts was stolen fromYahoo’s network in late 2014 (the “2014 Security Incident”). On December 14, 2016, the Company disclosed that, based on its outside forensic expert’s analysisof data files provided to the Company in November 2016 by law enforcement, the Company believes an unauthorized third party stole data associated with morethan one billion user accounts in August 2013 (the “2013 Security Incident”). In November and December 2016, the Company disclosed that based on aninvestigation by its outside forensic experts, it believes an unauthorized third party accessed the Company’s proprietary code to learn how to forge certaincookies. The outside forensic experts have identified approximately 32 million user accounts for which they believe forged cookies were used or taken in 2015and 2016 (the “Cookie Forging Activity”). The 2013 Security Incident, the 2014 Security Incident, and the Cookie Forging Activity are collectively referred toherein as the “Security Incidents.”
To date, approximately 43 putative consumer class action lawsuits have been filed against the Company in U.S. federal and state courts, and in foreign courts,relating to the Security Incidents. The plaintiffs, who purport to represent various classes of users, generally claim to have been harmed by the Company’salleged actions and/or omissions in connection with the Security Incidents and assert a variety of common law and statutory claims seeking monetary damagesor other related relief.
In addition, as described above, one putative stockholder class action has been filed against the Company and certain current officers of the Company and fourstockholder derivative actions have been filed purportedly on behalf of the Company against its current and former directors and officers, each asserting claimsrelated to the Security Incidents.
Additional lawsuits and claims related to the Security Incidents may be asserted by or on behalf of users, partners, shareholders, or others seeking damages orother related relief.
While a loss from these matters is reasonably possible, the Company cannot reasonably estimate a range of possible losses related to these legal proceedingsat this time because the legal proceedings remain in the early stages, alleged damages have not been specified, there is uncertainty as to the likelihood of aclass or classes being certified or the ultimate size of any class if certified, and there
149

Table of Contents
are significant factual and legal issues to be resolved. Based on current information, the Company does not believe that a loss from these matters is probableand therefore has not recorded an accrual for litigation or other contingencies relating to the Security Incidents. The Company will continue to evaluateinformation as it becomes known and will record an accrual for estimated losses at the time or times it is determined that a loss is both probable and reasonablyestimable.
Note 13 Stockholders’ Equity The Board has the authority to issue up to 10 million shares of preferred stock and to determine the price, rights, preferences, privileges, and restrictions,including voting rights, of those shares without any further vote or action by the stockholders.
StockRepurchases. In November 2013, the Board authorized a stock repurchase program with an authorized level of $5 billion, which expired in December2016. In March 2015, the Board authorized a stock repurchase program with an authorized level of $2 billion, all of which was still available as of December 31,2016. The March 2015 program, according to its terms, will expire in March 2018. Repurchases under the repurchase programs may take place in the openmarket or in privately negotiated transactions, including structured and derivative transactions such as accelerated share repurchase transactions, and may bemade under a Rule 10b5-1 plan.
During the year ended December 31, 2016, the Company did not repurchase any of its outstanding shares of common stock.
During the year ended December 31, 2015, the Company repurchased approximately 4 million shares of its common stock under its November 2013 program atan average price of $47.65 per share for a total of $204 million.
In September and October 2014, the Company entered into two unrelated accelerated share repurchase agreements (“ASR”) with a financial institution torepurchase shares of its common stock. Under the September 2014 agreement, the Company prepaid $1.1 billion and approximately 15 million shares wereinitially delivered to the Company on September 30, 2014 and are included in treasury stock. Final settlement occurred on October 17, 2014, resulting in a totalof approximately 23.5 million shares, inclusive of shares initially delivered, repurchased for $933 million, all of which are included in treasury stock. The Companyreceived a return of cash for the remaining amount not settled in shares of $167 million. Under the October 2014 agreement, the Company prepaid the maximumrepurchase amount of $1.0 billion and approximately 15 million shares were initially delivered on October 30, 2014. Final settlement occurred on December 9,2014, resulting in a total of approximately 16 million shares, inclusive of shares initially delivered, repurchased for $800 million, all of which are included intreasury stock. The Company received a return of cash for the remaining amount not settled in shares of $200 million. Both ASR agreements were entered intopursuant to the Company’s existing share repurchase program.
The Company accounted for the September 2014 ASR as two separate transactions: (i) approximately 15 million shares of common stock initially delivered tothe Company, and $600 million was accounted for as a treasury stock transaction and (ii) the remaining $500 million unsettled portion of the contract wasdetermined to be a forward contract indexed to the Company’s own common stock. The initial delivery of approximately 15 million shares resulted in animmediate reduction, on the delivery date, of the outstanding shares used to calculate the weighted-average common shares outstanding for basic and dilutednet income per share. The Company has determined that the forward contract, indexed to its common stock, met all of the applicable criteria for equityclassification. The Company recorded $600 million as treasury stock and recorded $500 million, the implied value of the forward contract, in additional paid-incapital on the
150

Table of Contents
consolidated balance sheets as of September 30, 2014. As the remainder of the shares were delivered to the Company, in the fourth quarter of 2014, theforward contract was reclassified from additional paid-in capital to treasury stock for the value of the additional shares received, and additional paid-in capital wasdebited for the cash returned for the remaining amount of shares not settled.
During the year ended December 31, 2014, in addition to the repurchase under the ASR’s, the Company repurchased approximately 62 million shares of itscommon stock under its stock repurchase program at an average price of $39.30 per share for a total of approximately $2.4 billion.
Retirements. During the year ended December 31, 2014, the Company retired 94 million shares, resulting in reductions of $94,000 in common stock,$795 million in additional paid-in capital, and $2.9 billion in retained earnings. During the year ended December 31, 2015 and 2016, the Company did not retireany of its remaining treasury stock.
Note 14 Employee Benefits BenefitPlans . The Company maintains the Yahoo! Inc. 401(k) Plan (the “401(k) Plan”) for its full-time employees in the U.S. The 401(k) Plan allowsemployees of the Company to contribute up to the Internal Revenue Code prescribed maximum amount. Employees may elect to contribute from 1 to100 percent of their annual compensation to the 401(k) Plan. The Company matches employee contributions at a rate of 25 percent, up to the IRS prescribedamount. Both employee and employer contributions vest immediately upon contribution. During 2014, 2015, and 2016, the Company’s contributions to the 401(k)Plan amounted to approximately $19 million, $21 million, and $18 million, respectively. The Company also contributed approximately $16 million, $15 million, and$12 million to its other defined contribution retirement benefit plans outside of the U.S. for 2014, 2015, and 2016, respectively.
StockPlans. The Stock Plan provides for the issuance of stock-based awards to employees, including executive officers, and consultants. The Stock Planpermits the granting of incentive stock options, non-statutory stock options, restricted stock, restricted stock units, stock appreciation rights, and dividendequivalents.
Options granted under the Stock Plan before May 19, 2005 generally expire 10 years after the grant date, and options granted after May 19, 2005 generallyexpire seven years after the grant date. Options generally become exercisable over a four-year period based on continued employment and vest either monthly,quarterly, semi-annually, or annually.
The Stock Plan permits the granting of restricted stock and restricted stock units (collectively referred to as “restricted stock awards”). The restricted stock awardvesting criteria are generally the passing of time, meeting certain performance-based objectives, or a combination of both, and continued employment throughthe vesting period (which varies but generally does not exceed four years). Restricted stock award grants are generally measured at fair value on the date ofgrant based on the number of shares granted and the quoted price of the Company’s common stock. Such value is recognized as an expense over thecorresponding service period.
The Stock Plan provides for the issuance of a maximum of 784 million shares, of which 96 million shares were still available for award grant purposes as ofDecember 31, 2016. Each share of the Company’s common stock issued in settlement of “full-value awards” (which include all awards other than options andstock appreciation rights) granted on or after June 25, 2009 under the Stock Plan counted as 1.75 shares against the Stock Plan’s share limit. Each share of theCompany’s common stock issued in settlement of “full-value awards” granted on or after June 25, 2014 under the Stock Plan is counted as 2.5 shares againstthe Stock Plan’s share limit.
151
Table of Contents
The Directors’ Plan provides for the grant of nonqualified stock options and restricted stock units to non-employee directors of the Company. The Directors’ Planprovides for the issuance of up to 9 million shares of the Company’s common stock, of which approximately 4 million were still available for award grantpurposes as of December 31,2016. Each share of the Company’s common stock issued in settlement of restricted stock units granted after the Company’s 2006annual meeting of shareholders under the Directors’ Plan is counted as 1.75 shares against the Directors’ Plan’s share limit.
Options granted under the Directors’ Plan before May 25, 2006 generally become exercisable, based on continued service as a director, for initial grants to newdirectors, in equal monthly installments over four years, and for annual grants, with 25 percent of such options vesting on the one year anniversary of the date ofgrant and the remaining options vesting in equal monthly installments over the remaining 36-month period thereafter. Such options generally expire seven to 10years after the grant date. Options granted on or after May 25, 2006 become exercisable, based on continued service as a director, in equal quarterlyinstallments over one year. Such options generally expire seven years after the grant date.
Restricted stock units granted under the Directors’ Plan generally vest in equal quarterly installments over a one-year period following the date of grant and,once vested, are generally payable in an equal number of shares of the Company’s common stock on the earlier of the end of the one-year vesting period or thedate the director ceases to be a member of the Board (subject to any deferral election that may be made by the director).
Non-employee directors are also permitted to elect an award of restricted stock units or a stock option under the Directors’ Plan in lieu of a cash payment of theirquarterly Board retainer and any cash fees for serving on committees of the Board. Such stock options or restricted stock unit awards granted in lieu of cash feesare fully vested on the grant date.
From time to time, the Company also assumes stock-based awards in connection with corporate mergers and acquisitions, which awards become payable inshares of the Company’s common stock.
Employee Stock Purchase Plan . During the first quarter of 2015, the Company discontinued the offering of the Employee Stock Purchase Plan to itsemployees. The Employee Stock Purchase Plan allowed employees to purchase shares of the Company’s common stock through payroll deductions of up to15 percent of their compensation subject to certain Internal Revenue Code limitations. The price of the common stock purchased under the plan was equal to90 percent of the lower of the fair market value of the common stock on the commencement date of each three-month offering period or the specified purchasedate.
For the years ended December 31, 2014 and 2015 stock-based compensation expense related to the activity under the plan was $12 million and $2 million,respectively.
152

Table of Contents
StockOptions. The Company’s Stock Plan, the Directors’ Plan, and stock-based awards assumed through acquisitions (including stock-based commitmentsrelated to continued service of acquired employees, such as holdbacks by Yahoo of shares of Yahoo common stock issued to founders of acquired companies inconnection with certain of the Company’s acquisitions) are collectively referred to as the “Plans”. Stock option activity under the Company’s Plans for the yearended December 31, 2016 is summarized as follows (in thousands, except years and per share amounts):
Shares
WeightedAverage Exercise Price per
Share
Weighted Average
Remaining Contractual
Life(in years)
Aggregate Intrinsic Value
Outstanding at December 31, 2015 (1) 6,522 $ 18.82 4.03 $ 103,230 Options granted — $ — Options assumed in acquisitions — $ — Options exercised (2) (1,203) $ 14.56 Options expired (442) $ 18.71 Options cancelled/forfeited (383) $ 18.00
Outstanding at December 31, 2016 (1) 4,494 $ 20.04 2.99 $ 92,503
Vested and expected to vest at December 31, 2016 (3) 4,467 $ 18.11 2.98 $ 91,950
Exercisable at December 31, 2016 3,537 $ 18.15 2.77 $ 72,708
(1) Includes shares subject to performance-based stock options for which performance goals had not been set as of the date shown. (2) The Company generally issues new shares to satisfy stock option exercises. (3) The expected to vest options are the result of applying the pre-vesting forfeiture rate assumptions to total outstanding options.
The weighted average grant date fair values of all options granted and assumed in the years ended December 31, 2014 and 2015 were $31.31 and $20.31,respectively. The Company did not grant any options in 2016.
The aggregate intrinsic value in the table above represents the total pre-tax intrinsic value (the aggregate difference between the closing stock price of theCompany’s common stock on December 31, 2016 and the exercise price for in-the-money options) that would have been received by the option holders if allin-the-money options had been exercised on December 31, 2016.
The total intrinsic values of options exercised in the years ended December 31, 2014, 2015, and 2016 were $167 million, $53 million, and $27 million,respectively.
As of December 31, 2016, there was $7 million of unamortized stock-based compensation expense related to unvested stock options, which is expected to berecognized over a weighted average period of 0.9 years.
Cash received from option exercises and purchases of shares under the Employee Stock Purchase Plan for the year ended December 31, 2016 was $18 million.
The total net tax benefit attributable to stock options exercised in the year ended December 31, 2016 was $6 million.
153

Table of Contents
The fair value of option grants, including assumed options from acquisitions, is determined using the Black-Scholes option pricing model with the followingweighted average assumptions: Stock Options Purchase Plan (5) Years Ended December 31, Year Ended December 31, 2014 2015 2014 Expected dividend yield (1) 0% 0% 0% Risk-free interest rate (2) 1.4% 0.9% 0% Expected volatility (3) 34.5% 34.5% 36.8% Expected life (in years) (4) 3.83 2.50 0.25 (1) The Company currently has no history or expectation of paying cash dividends on its common stock in the near future. (2) The risk-free interest rate is based on the U.S. Treasury yield for a term consistent with the expected term of the awards in effect at the time of grant. (3) The Company estimates the volatility of its common stock at the date of grant based on the implied volatility of publicly traded options on its common
stock, with a term of one year or greater. (4) The expected life of stock options granted under the Plans is based on historical exercise patterns, which the Company believes are representative of
future behavior. New grants issued by the Company had an expected life of 4 years in 2014. In 2015 and 2016, the Company did not issue new stockoptions. Options assumed in acquisitions had expected lives of less than 3 years.
(5) During the first quarter of 2015, the Company discontinued the offering of the Employee Stock Purchase Plan to its employees.
RestrictedStockandRestrictedStockUnits. Restricted stock and restricted stock unit activity under the Plans for the year ended December 31, 2016 issummarized as follows (in thousands, except per share amounts):
Shares
Weighted Average Grant Date Fair Value
Per Share Awarded and unvested at December 31, 2015 (1) 28,739 $ 39.15 Granted (2) 14,893 $ 34.54 Vested (14,427) $ 32.49 Cancelled/Forfeited (6,955) $ 35.88
Awarded and unvested at December 31, 2016 (1) 22,250 $ 41.40
(1) Includes the maximum number of shares issuable under the Company’s performance-based restricted stock unit awards (including future-year tranches
for which performance goals had not been set) as of the date shown. (2) Includes the maximum number of shares issuable under the performance-based restricted stock unit awards granted during the year ended
December 31, 2016 (including future-year tranches for which performance goals had not been set during the period); excludes tranches of previouslygranted performance-based restricted stock units for which performance goals were set during the year ended December 31, 2016.
154

Table of Contents
As of December 31, 2016, there was $497 million of unamortized stock-based compensation expense related to unvested restricted stock and restricted stockunits, which is expected to be recognized over a weighted average period of 2.3 years.
The total fair value of restricted stock awards vested during the years ended December 31, 2014, 2015, and 2016 was $415 million, $502 million, and$470 million, respectively.
During the year ended December 31, 2016, 14 million shares that were subject to previously granted restricted stock units vested. These vested restricted stockawards were net share settled. The Company withheld 5 million shares based upon the Company’s closing stock price on the vesting date, to satisfy theCompany’s tax withholding obligation relating to the employees’ minimum statutory obligation for the applicable income and other employment taxes. TheCompany then remitted cash to the appropriate taxing authorities.
Total payments for the employees’ tax obligations to the relevant taxing authorities were $209 million for the year ended December 31, 2016 and are reflected asa financing activity within the consolidated statements of cash flows. The payments were used for tax withholdings related to the net share settlements ofrestricted stock units. The payments had the effect of share repurchases by the Company as they reduced the number of shares that would have otherwise beenissued on the vesting date and were recorded as a reduction of additional paid-in capital.
In 2014, 2015, and 2016, $150 million, $58 million, and $18 million, respectively, of excess tax benefits from stock-based awards for options exercised andrestricted stock awards that vested in current and prior periods were included as a source of cash flows from financing activities. These excess tax benefitsrepresent the reduction in income taxes otherwise payable during the period, attributable to the actual gross tax benefits in excess of the expected tax benefitsfor options exercised and restricted stock awards that vested in current and prior periods. The Company has accumulated excess tax deductions relating to stockoptions exercised and restricted stock awards that vested prior to January 1, 2006 available to reduce income taxes otherwise payable. To the extent suchdeductions reduce income taxes payable in the current year, they are reported as financing activities in the consolidated statements of cash flows.
Performance-BasedExecutiveIncentiveEquityAwards
Performance Options. The financial performance stock options awarded by the Company in November 2012 to Ms. Mayer and Mr. Goldman include multipleperformance periods. The number of stock options that ultimately vest for each performance period will range from 0 percent to 100 percent of the target amountfor such period stated in each executive’s award agreement based on the Company’s performance relative to goals. The financial performance goals areestablished at the beginning of each performance period and the portion (or “tranche”) of the award related to each performance period is treated as a separategrant for accounting purposes. In March 2016, the Compensation Committee established performance goals under these stock options for the 2016 performanceyear. The 2016 financial performance metrics (and their weightings) under the performance stock options are GAAP revenue (one-third), revenue ex-TAC(one-third), and adjusted EBITDA (one-third). The grant date fair value of the 2016 tranche of the November 2012 financial performance stock options was$13 million, and is being recognized over the twelve-month service period. The Company began recording stock-based compensation expense for this tranche inMarch 2016, when the financial performance goals were established.
Performance RSUs. In March 2016, the Compensation Committee approved additional annual financial performance-based RSU awards to Ms. Mayer andother senior officers, and established the 2016 annual performance goals for these awards as well as for the similar performance-based RSUs
155

Table of Contents
granted in February 2013, February 2014, and March 2015. The 2013, 2014, 2015, and 2016 performance-based RSU awards are generally eligible to vest inequal annual target amounts over four years (three years for Ms. Mayer) based on the Company’s attainment of annual financial performance goals as well asthe executive’s continued employment through each vesting date. The number of shares that ultimately vest each year will range from 0 percent to 200 percentof the annual target amount, based on the Company’s performance. Annual financial performance metrics and goals are established for these RSU awards atthe beginning of each year and the tranche of each RSU award related to that year’s performance goal is treated as a separate annual grant for accountingpurposes. The 2016 financial performance metrics (and their weightings) established for the performance RSUs are: GAAP revenue (one-third), revenueex-TAC (one-third), and adjusted EBITDA (one-third). The grant date fair value of the first tranche of the March 2016 performance RSUs was $10 million, thegrant date fair value of the second tranche of the March 2015 performance RSUs was $8 million, the grant date fair value of the third tranche of the February2014 performance RSUs was $4 million, and the grant date fair value of the fourth tranche of the February 2013 performance RSUs was $8 million. Thesevalues are being recognized over the tranches’ twelve-month service periods. The Company began recording stock-based compensation expense for thesetranches in March 2016, when the financial performance goals were established.
Note 15 Restructuring Charges, Net Restructuring charges, net consists of employee severance pay and related costs, accelerations of stock-based compensation expense, facility restructuringcosts, contract termination and other non-cash charges associated with the exit of facilities, as well as reversals of restructuring charges arising from changes inestimates.
For the years ended December 31, 2014, 2015, and 2016, restructuring charges, net was comprised of the following (in thousands): Years Ended December 31, 2014 2015 2016 Employee severance pay and related costs $ 30,749 $ 69,042 $ 57,940 Non-cancelable lease, contract termination, and other charges 79,317 36,526 26,126 Reversals of previous charges (3,222) (7,404) (4,038) Non-cash accelerations of stock-based compensation expense — 2,705 7,374 Other non-cash (credits) charges, net (3,394) 3,150 1,227
Restructuring charges, net $ 103,450 $ 104,019 $ 88,629
Although the Company does not allocate restructuring charges to its segments, the amounts of the restructuring charges relating to each segment are presentedbelow. For the years ended December 31, 2014, 2015, and 2016, restructuring charges, net consists of the following (in thousands): Years Ended December 31, 2014 2015 2016 Americas $ 76,134 $ 68,637 $ 65,300 EMEA 25,612 31,251 19,379 Asia Pacific 1,704 4,131 3,950
Restructuring charges, net $ 103,450 $ 104,019 $ 88,629
156

Table of Contents
The Company has implemented multiple restructuring plans to reduce its cost structure, align resources with its product strategy and improve efficiency, whichhave resulted in workforce reductions and the consolidation of certain real estate facilities and data centers.
The amounts recorded during the year ended December 31, 2016 were primarily related to the Company’s plan announced in February 2016 to reduce itsworkforce by approximately 15 percent by the end of 2016 and exit six offices in Dubai, Mexico City, Buenos Aires, Madrid, Milan and Burbank, California,subject to applicable laws and consultation processes, as a part of the strategic plan to simplify the Company’s product portfolio. During the year endedDecember 31, 2016, in connection with this action, the Company incurred pre-tax cash charges of $47 million for severance pay expenses and related cashexpenditures, pre-tax cash charges of $17 million related to the consolidation and exit of facilities related to non-cancelable lease costs and other related costs,pre-tax non-cash charges of $7 million related to stock-based compensation expense and less than $1 million related to impairment costs.
The Company’s restructuring accrual activity for the years ended December 31, 2015 and 2016 is summarized as follows(in thousands): Total Accrual balance as of December 31, 2014 $ 83,608 Restructuring charges 104,019 Cash paid (114,749) Non-cash accelerations of stock-based compensation expense (2,705) Foreign currency translation and other adjustments (4,282)
Accrual balance as of December 31, 2015 $ 65,891 Restructuring charges 88,629 Cash paid (102,277) Non-cash accelerations of stock-based compensation expense (7,374) Foreign currency translation and other adjustments (1,411)
Accrual balance as of December 31, 2016 $ 43,458
The $43 million restructuring liability as of December 31, 2016 consisted of $3 million for employee severance expenses, which the Company expects tosubstantially pay out by the end of second quarter of 2017, and $40 million related to non-cancelable lease costs, which the Company expects to pay over theterms of the related obligations through the fourth quarter of 2025, less estimated sublease income.
As of December 31, restructuring accruals were included on the Company’s consolidated balance sheets as follows (in thousands): 2015 2016 Accrued expenses and other current liabilities $ 40,283 $ 27,041 Other long-term liabilities 25,608 16,417
Total restructuring accruals $ 65,891 $ 43,458
157

Table of Contents
As of December 31, restructuring accruals by segment consisted of the following (in thousands): 2015 2016 Americas $ 47,054 $ 38,041 EMEA 18,389 5,263 Asia Pacific 448 154
Total restructuring accruals $ 65,891 $ 43,458
Note 16 Income Taxes The components of income (loss) before income taxes and earnings in equity interests are as follows (in thousands): Years Ended December 31, 2014 2015 2016 United States $ 10,572,290 $ (4,394,462) $ (819,838) Foreign (59,909) (429,814) 120,864
Income (loss) before income taxes and earnings in equity interests $ 10,512,381 $ (4,824,276) $ (698,974)
The provision (benefit) for income taxes is composed of the following (in thousands):
Years Ended December 31, 2014 2015 2016
Current: United States federal $ 3,067,395 $ (89,498) $ 73,484 State 454,261 9,426 (1,619) Foreign 50,573 32,815 26,644
Total current provision (benefit) for income taxes $ 3,572,229 $ (47,257) $ 98,509 Deferred:
United States federal 348,887 (20,507) (206,096) State 120,938 (31,374) (18,007) Foreign (3,952) 9,540 (634)
Total deferred provision (benefit) for income taxes $ 465,873 $ (42,341) $ (224,737)
Provision (benefit) for income taxes $ 4,038,102 $ (89,598) $ (126,228)
158

Table of Contents
The provision (benefit) for income taxes differs from the amount computed by applying the federal statutory income tax rate to income before income taxes andearnings in equity interests as follows (in thousands):
Years Ended December 31, 2014 2015 2016
Income tax at the U.S. federal statutory rate of 35 percent $ 3,679,333 $ (1,688,496) $ (244,641) State income taxes, net of federal benefit 400,824 (7,912) 2,514 Stock-based compensation expense 8,132 9,508 10,482 Research tax credits (23,775) (15,659) (17,291) Effect of non-U.S. operations (53,079) 165,203 (18,499) Settlement with tax authorities (24,870) (1,981) (8,400) Remeasurement of prior year tax positions — (5,286) — Acquisition related non-deductible expenses 16,881 15,970 13,059 Tax liquidation of acquired entities — (56,170) — Goodwill impairment charge 30,945 1,486,792 138,215 Intangible assets impairment charge — 2,468 — Other 3,711 5,965 (1,667)
Provision (benefit) for income taxes $ 4,038,102 $ (89,598) $ (126,228)
159

Table of Contents
Deferred income taxes reflect the tax effects of temporary differences between the carrying amounts of assets and liabilities for financial reporting purposes andthe amounts used for income tax purposes. The components of deferred income tax assets and liabilities are as follows (in thousands): December 31, 2015 2016 Deferred income tax assets:
Net operating loss and tax credit carryforwards $ 185,425 $ 136,929 Stock-based compensation expense 34,644 39,211 Non-deductible accrued expenses 114,519 172,224 Deferred revenue 10,153 12,345 Fixed assets 14,096 12,181 Federal benefits relating to tax positions 308,347 336,963 Other 8,580 7,281
Gross deferred income tax assets 675,764 717,134 Valuation allowance (29,001) (36,354)
Deferred income tax assets $ 646,763 $ 680,780
Deferred income tax liabilities: Purchased intangible assets $ (86,905) $ (25,833) Fixed assets (146,234) (89,344) Alibaba unrealized gains (12,611,867) (13,633,988) Unrealized income in investments (85,761) (8,837) Restructuring liabilities (4,046) (95) Other (2,216) (1,278)
Deferred income tax liabilities $ (12,937,029) $ (13,759,375)
Net deferred income tax liabilities $ (12,290,266) $ (13,078,595)
As of December 31, 2016, the Company’s federal and California net operating loss carryforwards for income tax purposes were approximately $172 million and$134 million, respectively. The federal and California net operating loss carryforwards are subject to various limitations under Section 382 of the InternalRevenue Code and applicable state tax law. If not utilized, the federal and California net operating loss carryforwards will begin to expire in 2021.
In the three months ended March 31, 2015, the Company satisfied the $3.3 billion income tax liability related to the sale by Yahoo! Hong Kong Holdings Limited,the Company’s wholly-owned subsidiary, of Alibaba Group ADSs in the Alibaba Group IPO on September 24, 2014. As of December 31, 2016 the Companyaccrued deferred tax liabilities of $13.6 billion associated with the 384 million ordinary shares of Alibaba Group (“Alibaba Group shares”) retained by theCompany. Such deferred tax liabilities are subject to periodic adjustments due to changes in the fair value of the Alibaba Group shares.
The Company’s state research tax credit carryforward for income tax purposes is approximately $200 million and it can be carried forward indefinitely. Tax creditcarryforwards that result from the exercise of employee stock options are not recorded on the Company’s consolidated balance sheets
160
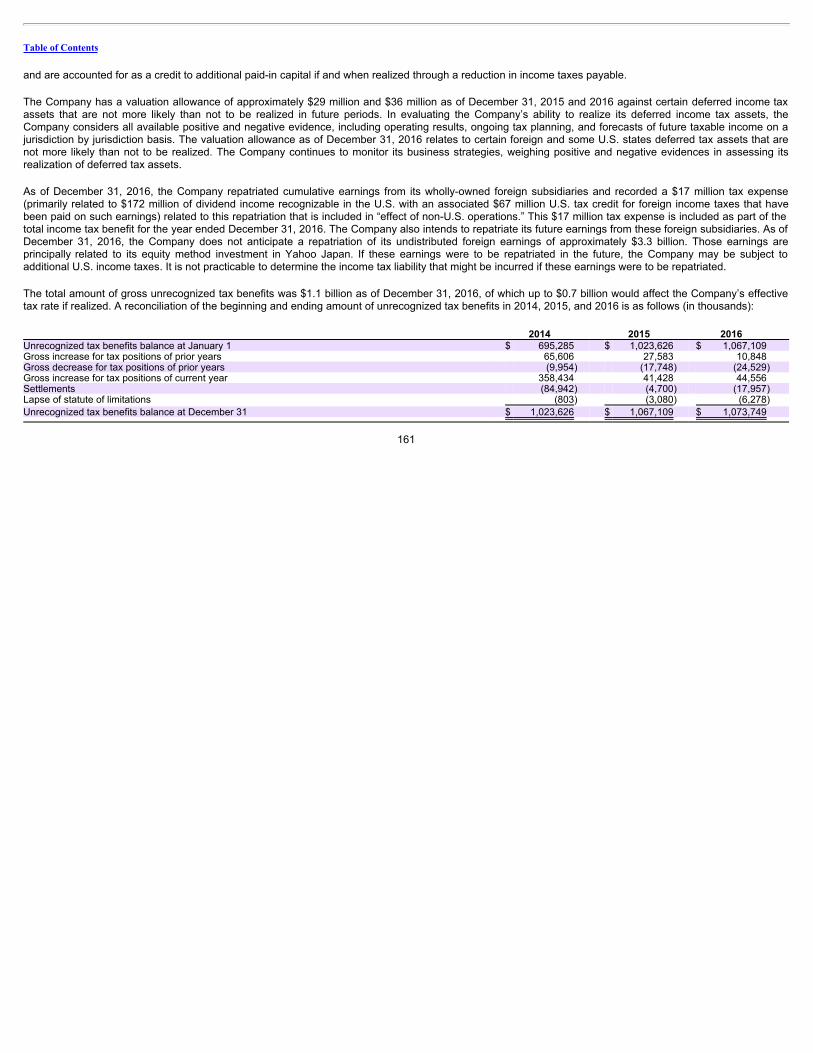
Table of Contents
and are accounted for as a credit to additional paid-in capital if and when realized through a reduction in income taxes payable.
The Company has a valuation allowance of approximately $29 million and $36 million as of December 31, 2015 and 2016 against certain deferred income taxassets that are not more likely than not to be realized in future periods. In evaluating the Company’s ability to realize its deferred income tax assets, theCompany considers all available positive and negative evidence, including operating results, ongoing tax planning, and forecasts of future taxable income on ajurisdiction by jurisdiction basis. The valuation allowance as of December 31, 2016 relates to certain foreign and some U.S. states deferred tax assets that arenot more likely than not to be realized. The Company continues to monitor its business strategies, weighing positive and negative evidences in assessing itsrealization of deferred tax assets.
As of December 31, 2016, the Company repatriated cumulative earnings from its wholly-owned foreign subsidiaries and recorded a $17 million tax expense(primarily related to $172 million of dividend income recognizable in the U.S. with an associated $67 million U.S. tax credit for foreign income taxes that havebeen paid on such earnings) related to this repatriation that is included in “effect of non-U.S. operations.” This $17 million tax expense is included as part of thetotal income tax benefit for the year ended December 31, 2016. The Company also intends to repatriate its future earnings from these foreign subsidiaries. As ofDecember 31, 2016, the Company does not anticipate a repatriation of its undistributed foreign earnings of approximately $3.3 billion. Those earnings areprincipally related to its equity method investment in Yahoo Japan. If these earnings were to be repatriated in the future, the Company may be subject toadditional U.S. income taxes. It is not practicable to determine the income tax liability that might be incurred if these earnings were to be repatriated.
The total amount of gross unrecognized tax benefits was $1.1 billion as of December 31, 2016, of which up to $0.7 billion would affect the Company’s effectivetax rate if realized. A reconciliation of the beginning and ending amount of unrecognized tax benefits in 2014, 2015, and 2016 is as follows (in thousands): 2014 2015 2016 Unrecognized tax benefits balance at January 1 $ 695,285 $ 1,023,626 $ 1,067,109 Gross increase for tax positions of prior years 65,606 27,583 10,848 Gross decrease for tax positions of prior years (9,954) (17,748) (24,529) Gross increase for tax positions of current year 358,434 41,428 44,556 Settlements (84,942) (4,700) (17,957) Lapse of statute of limitations (803) (3,080) (6,278)
Unrecognized tax benefits balance at December 31 $ 1,023,626 $ 1,067,109 $ 1,073,749
161

Table of Contents
The remaining balances are recorded on the Company’s consolidated balance sheets as follows (in thousands): December 31, 2015 2016 Total unrecognized tax benefits balance $ 1,067,109 $ 1,073,749 Amounts netted against related deferred tax assets (64,601) (77,024)
Unrecognized tax benefits recorded on consolidated balance sheets $ 1,002,508 $ 996,725
Amounts classified as accrued expenses and other current liabilities $ 12,586 $ 2,409 Amounts classified as deferred and other long-term tax liabilities, net 989,922 994,316
Unrecognized tax benefits recorded on consolidated balance sheets $ 1,002,508 $ 996,725
The Company’s gross amount of unrecognized tax benefits as of December 31, 2016 increased by $7 million from the recorded balance as of December 31,2015 primarily related to transfer prices among entities in different tax jurisdictions. The Company recognizes interest and/or penalties related to uncertain taxpositions in income tax expense. To the extent accrued interest and penalties do not ultimately become payable, amounts accrued will be reduced and reflectedas a reduction of the overall income tax provision in the period that such determination is made. During 2014, 2015, and 2016, interest and penalties recorded inthe consolidated statements of operations were a charge of $83 million, $7 million, and $24 million (including interest paid of $5 million), respectively. Theamounts of accrued interest and penalties recorded on the consolidated balance sheets as of December 31, 2015 and 2016 were approximately $167 millionand $186 million, respectively.
The Company is in various stages of examination and appeal in connection with its taxes both in the U.S. and in foreign jurisdictions. Those audits generallyspan tax years 2005 through 2015. As of December 31, 2016, the Company’s 2011 through 2015 U.S. federal income tax returns are currently underexamination. The Company has appealed the proposed California Franchise Tax Board’s adjustments to the 2005 through 2008 returns, but no conclusionshave been reached to date. The Company’s 2009 through 2010 California tax returns are currently under examination. The Company’s 2011 through 2015 taxyears remain subject to examination by the California Franchise Tax Board for California tax purposes. While it is difficult to determine when the examinationswill be settled or their final outcomes, certain audits in various jurisdictions are expected to be resolved in the foreseeable future. The Company believes that ithas adequately provided for any reasonably foreseeable adverse adjustment to its tax returns and that any settlement will not have a material adverse effect onits consolidated financial position, results of operations, or cash flows. It is reasonably possible that the Company’s unrecognized tax benefits could be reducedby up to approximately $20 million in the next twelve months.
The Company may have additional tax liabilities in China related to the sale to Alibaba Group of 523 million Alibaba Group shares that took place during the yearended December 31, 2012 and related to the sale of the 140 million Alibaba Group ADSs sold in the Alibaba Group IPO that took place during the year endedDecember 31, 2014. Any taxes assessed and paid in China are expected to be ultimately offset and recovered in the U.S. through the use of foreign tax credits.
Tax authorities from the Brazilian State of Sao Paulo have assessed certain indirect taxes against the Company’s Brazilian subsidiary, Yahoo! do Brasil InternetLtda., related to online advertising services. The assessment is for calendar years 2008 through 2012 and as of December 31, 2016 totals approximately$140 million. The Company currently believes the assessment is without merit. The Company believes the risk of loss is remote and has not recorded an accrualfor the assessment.
162

Table of Contents
Note 17 Transactions with Related Parties Revenue from related parties, excluding Yahoo Japan, represented approximately 1 percent of total revenue for the years ended December 31, 2014, 2015, and2016. Management believes that the terms of the agreements with these related parties are comparable to the terms obtained in arm’s-length transactions withunrelated similarly situated customers of the Company.
See Note 8—“Investments in Equity Interests Accounted for Using the Equity Method of Accounting” for additional information related to transactions involvingYahoo Japan.
Note 18 Segments The Company continues to manage its business geographically. The primary areas of measurement and decision-making are Americas, EMEA (Europe, MiddleEast, and Africa), and Asia Pacific. Management relies on an internal reporting process that provides revenue, revenue ex-TAC (which is defined as revenueless cost of revenue—TAC), direct costs excluding TAC by segment, and consolidated income (loss) from operations for making decisions related to theevaluation of the financial performance of, and allocating resources to, the Company’s segments.
163

Table of Contents
The following tables present summarized information by segment (in thousands): Years Ended December 31, 2014 2015 2016 Revenue by segment (1) :
Americas $ 3,517,861 $ 3,976,770 $ 4,172,836 EMEA 374,833 343,646 397,768 Asia Pacific 725,439 647,885 598,531
Total Revenue 4,618,133 4,968,301 5,169,135 TAC by segment (1) :
Americas 166,545 788,725 1,463,221 EMEA 36,867 57,284 144,547 Asia Pacific 14,119 31,505 43,018
Total TAC 217,531 877,514 1,650,786 Revenue ex-TAC by segment:
Americas 3,351,316 3,188,045 2,709,615 EMEA 337,966 286,362 253,221 Asia Pacific 711,320 616,380 555,513
Total Revenue ex-TAC 4,400,602 4,090,787 3,518,349 Direct costs by segment (2) :
Americas 249,971 284,875 263,010 EMEA 87,490 95,789 51,597 Asia Pacific 198,910 196,056 185,195
Global operating costs (3) 2,600,577 2,582,235 2,214,842 Gains on sales of patents and land (97,894) (11,100) (121,559) Asset impairment charge — 44,381 — Goodwill impairment charge 88,414 4,460,837 394,901 Intangible assets impairment charge — 15,423 87,335 Depreciation and amortization 606,568 609,613 507,555 Stock-based compensation expense 420,174 457,153 491,902 Restructuring charges, net 103,450 104,019 88,629
Income (loss) from operations $ 142,942 $ (4,748,494) $ (645,058)
(1) Commencing in the second quarter of 2016, TAC payments related to the Microsoft Search Agreement, which previously would have been recorded as a
reduction to revenue, began to be recorded as cost of revenue—TAC due to a required change in revenue presentation. See Note 1—“The Companyand Summary of Significant Accounting Policies” and Note 19—“Microsoft Search Agreement” for additional information.
(2) Direct costs for each segment include certain cost of revenue—other and costs associated with the local sales teams. Prior to the second quarter of
2016, certain account management costs associated with Yahoo Properties were managed locally and included as direct costs for each segment. Priorperiod amounts have been revised to conform to the current presentation.
164
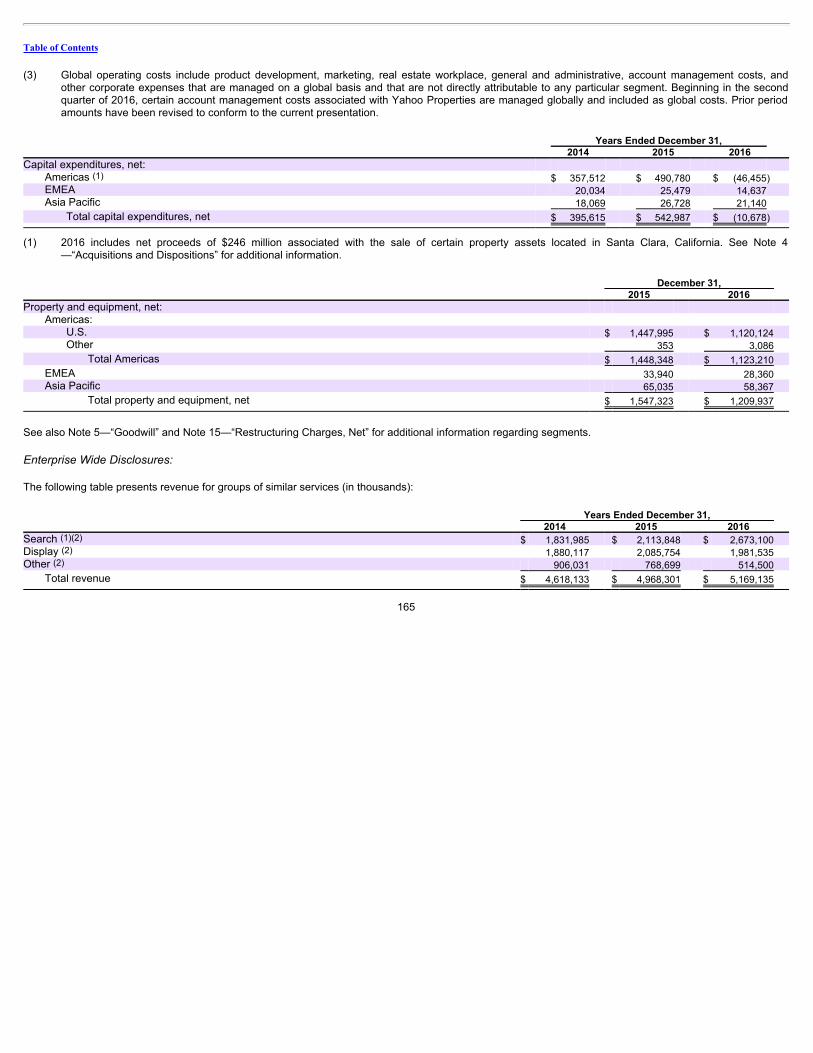
Table of Contents
(3) Global operating costs include product development, marketing, real estate workplace, general and administrative, account management costs, andother corporate expenses that are managed on a global basis and that are not directly attributable to any particular segment. Beginning in the secondquarter of 2016, certain account management costs associated with Yahoo Properties are managed globally and included as global costs. Prior periodamounts have been revised to conform to the current presentation.
Years Ended December 31, 2014 2015 2016 Capital expenditures, net:
Americas (1) $ 357,512 $ 490,780 $ (46,455) EMEA 20,034 25,479 14,637 Asia Pacific 18,069 26,728 21,140
Total capital expenditures, net $ 395,615 $ 542,987 $ (10,678)
(1) 2016 includes net proceeds of $246 million associated with the sale of certain property assets located in Santa Clara, California. See Note 4
—“Acquisitions and Dispositions” for additional information. December 31, 2015 2016 Property and equipment, net:
Americas: U.S. $ 1,447,995 $ 1,120,124 Other 353 3,086
Total Americas $ 1,448,348 $ 1,123,210
EMEA 33,940 28,360 Asia Pacific 65,035 58,367
Total property and equipment, net $ 1,547,323 $ 1,209,937
See also Note 5—“Goodwill” and Note 15—“Restructuring Charges, Net” for additional information regarding segments.
Enterprise Wide Disclosures:
The following table presents revenue for groups of similar services (in thousands): Years Ended December 31, 2014 2015 2016 Search (1)(2) $ 1,831,985 $ 2,113,848 $ 2,673,100 Display (2) 1,880,117 2,085,754 1,981,535 Other (2) 906,031 768,699 514,500
Total revenue $ 4,618,133 $ 4,968,301 $ 5,169,135
165

Table of Contents
Years Ended December 31, 2014 2015 2016 Revenue (1): U.S. $ 3,380,310 $ 3,865,772 $ 4,048,156 International 1,237,823 1,102,529 1,120,979
Total revenue $ 4,618,133 $ 4,968,301 $ 5,169,135
(1) Commencing in the second quarter of 2016, TAC payments related to the Microsoft Search Agreement, which previously would have been recorded as a
reduction to revenue, began to be recorded as cost of revenue—TAC due to a required change in revenue presentation. See Note 1—“The Companyand Summary of Significant Accounting Policies” and Note 19—“Microsoft Search Agreement” for additional information.
(2) At the beginning of 2016, the Company reclassified certain amounts from other revenue to either search or display revenue. Prior period amounts have
been revised to conform to the current presentation as follows: for the year ended December 31, 2014, the Company reclassified $39.1 million and$12.1 million to search and display revenue, respectively, previously included in other revenue; and for the year ended December 31, 2015, theCompany reclassified $29.7 million and $11.6 million to search and display revenue, respectively, previously included in other revenue.
Revenue is attributed to individual countries according to the online property that generated the revenue. No single foreign country accounted for more than10 percent of the Company’s revenue in 2014, 2015, and 2016, respectively.
Note 19 Microsoft Search Agreement On December 4, 2009, the Company entered into the Microsoft Search Agreement. On February 18, 2010, the Company received regulatory clearance fromboth the U.S. Department of Justice and the European Commission and on February 23, 2010 the Company commenced implementation of the MicrosoftSearch Agreement on a market-by-market basis.
On April 15, 2015, the Company and Microsoft entered into the Eleventh Amendment, pursuant to which the terms of the Microsoft Search Agreement wereamended. Previously under the Microsoft Search Agreement, Microsoft was the exclusive algorithmic and paid search services provider to Yahoo on personalcomputers for Yahoo Properties and for search services provided by Yahoo to Affiliate sites. Microsoft was the non-exclusive provider on mobile devices.Pursuant to the Eleventh Amendment, Microsoft will provide such services on a non-exclusive basis for Yahoo Properties and Affiliate sites on all devices.Commencing on May 1, 2015, Yahoo agreed to the Volume Commitment and displays only Microsoft’s paid search results on such search result pages.
Prior to the Eleventh Amendment, the Company was entitled to receive the Revenue Share Rate with respect to revenue generated from paid search results onYahoo Properties and on Affiliate sites after deduction of the Affiliate sites’ share of revenue and certain Microsoft costs. The Revenue Share Rate was88 percent for the first five years of the Microsoft Search Agreement and then increased to 90 percent on February 23, 2015. Pursuant to the EleventhAmendment, the Revenue Share Rate increased to 93 percent, but Microsoft now receives its 7 percent revenue share before deduction of the Affiliate site’sshare of revenue. The Company is responsible for paying the Affiliate for the Affiliate site’s share of revenue.
Additionally, pursuant to the Eleventh Amendment, the Company has the ability in response to queries on both personal computers and mobile devices torequest algorithmic listings only, paid
166

Table of Contents
listings only or both algorithmic and paid listings from Microsoft. To the extent the Company requests algorithmic listings only or requests paid listings but electsnot to display such paid listings, the Company pays Microsoft serving costs but not a revenue share. In other cases and with respect to the Volume Commitment,the Revenue Share Rate applies.
Previously under the Microsoft Search Agreement, Yahoo had sales exclusivity for both the Company’s and Microsoft’s premium advertisers. For reportingperiods ending December 31, 2014 and 2015, and March 31, 2016, TAC related to the Company’s Microsoft Search Agreement was recorded as a reduction torevenue. Pursuant to the Eleventh Amendment, the Company completed the transition of its exclusive sales responsibilities to Microsoft for Microsoft’s paidsearch services to premium advertisers in the United States, Canada, and Europe on April 1, 2016 and in its remaining markets (other than Taiwan and HongKong) on June 1, 2016. Following the transition in each respective market, Yahoo is considered the principal in the sale of traffic to Microsoft and othercustomers because Yahoo is the primary obligor in its arrangements with Microsoft and has discretion in how search queries from Affiliate sites will be fulfilledand monetized. As a result, the amounts paid to Affiliates under the Microsoft Search Agreement in the transitioned markets are recorded as cost of revenue—TAC rather than as a reduction to GAAP revenue, resulting in GAAP revenue from the Microsoft Search Agreement being reported on a gross rather than netbasis.
Effective June 3, 2016, the Company and Microsoft further amended the Microsoft Search Agreement to provide that sales responsibilities for premiumadvertisers in Taiwan and Hong Kong will not be transitioned. TAC in those markets will continue to be reported as a reduction to revenue.
The term of the Microsoft Search Agreement is 10 years from its commencement date, February 23, 2010, subject to earlier termination as provided in theMicrosoft Search Agreement. As of October 1, 2015, either the Company or Microsoft may terminate the Microsoft Search Agreement by delivering a writtennotice of termination to the other party. The Microsoft Search Agreement will remain in effect for four months from the date of the termination notice to provide fora transition period; however, the Company’s Volume Commitment will not apply in the third and fourth months of this transition period.
Approximately 35 percent, 35 percent, and 37 percent of the Company’s revenue for the years ended December 31, 2014, 2015, and 2016, respectively, wasattributable to the Microsoft Search Agreement. Commencing in the second quarter of 2016, TAC payments related to the Microsoft Search Agreement fortransitioned markets, which previously would have been recorded as a reduction to revenue, began to be recorded as a cost of revenue due to a requiredchange in revenue presentation. During the year ended December 31, 2016, $812 million of GAAP revenue and cost of revenue—TAC was due to the change inrevenue presentation. See Note 1—“The Company and Summary of Significant Accounting Policies” for additional information on change in revenuepresentation.
The Company’s uncollected revenue share in connection with the Microsoft Search Agreement was $267 million and $392 million, which is included in accountsreceivable, net, as of December 31, 2015 and 2016, respectively.
On December 4, 2009, in connection with entering into the Microsoft Search Agreement, the Company also entered into a License Agreement with Microsoft (asamended, the “License Agreement”). Under the License Agreement, Microsoft acquired an exclusive 10-year license to the Company’s core search technologyand has the ability to integrate this technology into its existing web search platforms. Pursuant to the Eleventh Amendment, the exclusive licenses granted toMicrosoft under the License Agreement became non-exclusive. The Company also agreed pursuant to the Eleventh Amendment to license certain sales tools toMicrosoft to use solely in connection with Microsoft’s paid search services pursuant to the terms of the License Agreement.
167

Table of Contents
Schedule II—Valuation and Qualifying AccountsYears Ended December 31, 2014, 2015, and 2016
Balance atBeginning
of Year Charged toExpenses
Write-Offs/ Adjustments,
Net of Recoveries
Balanceat Endof Year
(In thousands) Accounts receivable
Allowance for doubtful accounts 2014 $ 35,549 $ 15,406 $ (11,156) $ 39,799 2015 $ 39,799 $ 26,793 $ (9,089) $ 57,503 2016 $ 57,503 $ 14,301 $ (39,267) $ 32,537
Balance atBeginning
of Year
Charged(Credited) to
Expenses
Charged(Credited)to Other
Accounts(*)
Balanceat Endof Year
(In thousands) Deferred tax asset valuation allowance
2014 $ 36,690 $ (10,427) $ (2,410) $ 23,853 2015 $ 23,853 $ 7,150 $ (2,002) $ 29,001 2016 $ 29,001 $ 8,369 $ (1,016) $ 36,354
(*) Amounts not charged (credited) to expenses are charged (credited) to stockholders’ equity, deferred tax assets (liabilities), or goodwill.
168

Table of Contents
Selected Quarterly Financial Data(Unaudited)
Quarters Ended
March 31,
2015 (1) June 30, 2015 (2)
September 30, 2015 (3)
December 31, 2015 (4)
March 31, 2016 (5)
June 30, 2016 (6)
September 30, 2016 (7)
December 31, 2016 (8)
(In thousands, except per share amounts) Revenue (9) $ 1,225,970 $ 1,243,265 $ 1,225,673 $ 1,273,393 $ 1,087,152 $ 1,307,637 $ 1,305,206 $ 1,469,140 Total operating expenses $ 1,313,324 $ 1,288,059 $ 1,311,985 $ 5,803,427 $ 1,254,366 $ 1,797,313 $ 1,357,525 $ 1,404,989 (Loss) Income from operations $ (87,354) $ (44,794) $ (86,312) $ (4,530,034) $ (167,214) $ (489,676) $ (52,319) $ 64,151 Other (expense) income , net $ (31,063) $ (11,741) $ (23,955) $ (9,023) $ (47,416) $ 15,062 $ (6,122) $ (15,440) Benefit (provision)for income taxes $ 40,900 $ (58,495) $ 93,208 $ 13,985 $ 34,766 $ (15,543) $ 105,513 $ 1,492 Earnings in equity interests $ 99,690 $ 95,841 $ 95,195 $ 92,845 $ 81,574 $ 51,777 $ 116,228 $ 113,704 Net income (loss) attributable to Yahoo! Inc. $ 21,198 $ (21,554) $ 76,261 $ (4,434,987) $ (99,232) $ (439,913) $ 162,826 $ 161,998
Net income (loss) attributable to Yahoo! Inc.common stockholders per share—basic $ 0.02 $ (0.02) $ 0.08 $ (4.70) $ (0.10) $ (0.46) $ 0.17 $ 0.17
Net income (loss) attributable to Yahoo! Inc.common stockholders per share—diluted $ 0.02 $ (0.02) $ 0.08 $ (4.70) $ (0.10) $ (0.46) $ 0.17 $ 0.17
Shares used in per share calculation—basic 934,748 937,569 940,822 943,425 945,719 948,432 951,421 953,798
Shares used in per share calculation—diluted 947,976 937,569 946,934 943,425 945,719 948,432 957,304 958,624
(1) Net income attributable to Yahoo! Inc. for the quarter ended March 31, 2015 includes a gain on sale of patents of $2 million, a loss of $12 million due to
the decline in fair value of the Hortonworks warrants, and net restructuring charges of $51 million. (2) Net loss attributable to Yahoo! Inc. for the quarter ended June 30, 2015 includes a gain on sale of patents of $9 million, a gain of $5 million due to the
increase in fair value of the Hortonworks warrants, net restructuring charges of $20 million, and advisory fees of $8 million. (3) Net income attributable to Yahoo! Inc. for the quarter ended September 30, 2015 includes, a loss of $13 million due to the decline in fair value of the
Hortonworks warrants, asset impairment charge of $42 million related to the acquired and originally developed content, and net restructuring charges of$26 million.
(4) Net loss attributable to Yahoo! Inc. for the quarter ended December 31, 2015 includes goodwill impairment charge of $4.5 billion, asset impairment
charge of $2 million related to the originally developed content, intangible assets impairment charge of $15 million, net restructuring charges of$7 million, and advisory fees of $1 million.
169

Table of Contents
(5) Net loss attributable to Yahoo! Inc. for the quarter ended March 31, 2016 includes net restructuring charges of $57 million, advisory fees of $9 million anda loss of $39 million due to the decline in fair value of the Hortonworks warrants.
(6) Net loss attributable to Yahoo! Inc. for the quarter ended June 30, 2016 includes goodwill impairment charge of $395 million and intangible assets
impairment charge of $87 million related to Tumblr reporting unit, net restructuring charges of $19 million, advisory fees of $15 million and a gain of$120 million on the sale of land.
(7) Net income attributable to Yahoo! Inc. for the quarter ended September 30, 2016 includes advisory fees of $27 million, net restructuring charges of
$10 million and a loss of $8 million due to the decline in fair value of the Hortonworks warrants. (8) Net income attributable to Yahoo! Inc. for the quarter ended December 31, 2016 includes security incidents costs of $10 million, advisory fees of
$6 million and net restructuring charges of $2 million. (9) Commencing in the second quarter of 2016, TAC payments related to the Microsoft Search Agreement, which previously would have been recorded as a
reduction to revenue, began to be recorded as cost of revenue—TAC due to a required change in revenue presentation. See Note 1—“The Companyand Summary of Significant Accounting Policies” and Note 19—“Microsoft Search Agreement” in the Notes to the Company’s consolidated financialstatements for additional information.
Item 9. Changes in and Disagreements With Accountants on Accountingand Financial DisclosureNone.
Item 9A. Controls and ProceduresEvaluation of Disclosure Controls and Procedures The Company’s management, with the participation of the Company’s principal executive officer and principal financial officer, has evaluated the effectiveness ofthe Company’s disclosure controls and procedures (as such term is defined in Rules 13a-15(e) and 15d-15(e) under the Securities Exchange Act of 1934, asamended (the “Exchange Act”)), as of the end of the period covered by this Annual Report on Form 10-K. Based on such evaluation, the Company’s principalexecutive officer and principal financial officer have concluded (based on the findings and recommendations of the Independent Committee set forth in Item 7—“Management’s Discussion and Analysis of Financial Condition and Results of Operations—Security Incidents”) that, due exclusively to deficiencies in theCompany’s existing security incident response protocols related to the 2014 Security Incident, the Company’s disclosure controls and procedures were noteffective at December 31, 2016. The conclusion that the Company’s disclosure controls and procedures at December 31, 2016 were not effective did not affectour conclusion that our internal control over financial reporting was effective as of December 31, 2016. Further, the Company’s principal executive officer andprincipal financial officer have also concluded (based on the findings and recommendations of the Independent Committee as set forth in Item 7—“Management’s Discussion and Analysis of Financial Condition and Results of Operations—Security Incidents”) that, due exclusively to deficiencies in theCompany’s
170

Table of Contents
existing security incident response protocols related to the 2014 Security Incident, the Company’s disclosure controls and procedures for each of the annual andquarterly periods ended December 31, 2014 through September 30, 2016 were not effective at the end of each such period. When the Company’s principalexecutive officer and principal financial officer concluded that our disclosure controls and procedures were effective for each of the annual and quarterly periodsended December 31, 2014 through September 30, 2016, such conclusions were based on such persons’ knowledge at the time of certification.
The Company is in the process of remediating deficiencies in its existing disclosure controls and procedures related to its security incident response protocolsconsistent with the Independent Committee’s recommendations described in Item 7—“Management’s Discussion and Analysis of Financial Condition andResults of Operations—Security Incidents,” including revising the design of its technical and legal information security incident response protocols to ensure thatmaterial information about cybersecurity incidents we are required to disclose in reports filed or submitted under the Exchange Act is recorded, processed,summarized and reported within the time periods specified in the SEC’s rules and forms.
Management’s Report on Internal Control Over Financial Reporting The Company’s management is responsible for establishing and maintaining adequate internal control over financial reporting as defined in Rules 13a-15(f) and15d-15(f) under the Exchange Act. Under the supervision and with the participation of the Company’s management, including its principal executive officer andprincipal financial officer, the Company conducted an evaluation of the effectiveness of its internal control over financial reporting based on criteria established inthe framework in Internal Control—Integrated Framework issued by the Committee of Sponsoring Organizations of the Treadway Commission (2013 framework).Based on this evaluation, the Company’s management concluded that its internal control over financial reporting was effective as of December 31, 2016.
Because of its inherent limitations, internal control over financial reporting may not prevent or detect all misstatements. Also, projections of any evaluation ofeffectiveness to future periods are subject to the risk that controls may become inadequate because of changes in conditions, or that the degree of compliancewith the policies or procedures may deteriorate.
The Company’s independent registered public accounting firm has issued an attestation report regarding its assessment of the Company’s internal control overfinancial reporting as of December 31, 2016, which appears on page 93.
Changes in Internal Control Over Financial Reporting There have been no changes in Yahoo’s internal control over financial reporting (as such term is defined in Rules 13a-15(f) and 15d-15(f) under the ExchangeAct) during the quarter ended December 31, 2016 that have materially affected, or are reasonably likely to materially affect, internal control over financialreporting.
Item 9B. Other InformationThe information under “Item 7—“Management’s Discussion and Analysis of Financial Condition and Results of Operations—Security Incidents—ManagementChanges” with respect to the resignation of the Company’s General Counsel is incorporated herein by reference.
171

Table of Contents
PART III
Item 10. Directors, Executive Officers and Corporate GovernanceThe information required by this item is incorporated by reference to Yahoo’s Proxy Statement for its 2017 Annual Meeting of Shareholders to be filed with theSEC within 120 days after the end of the fiscal year ended December 31, 2016.
In addition, the Board has adopted a code of ethics, which is posted on the Company’s website at investor.yahoo.net. The code of ethics may be found asfollows: from the web address listed above, first click on “Corporate Governance” in the middle of the page, then on “Documents,” and then click on “ Code ofEthics”.
The Company’s code of ethics applies to the Company’s directors and employees, including our Chief Executive Officer, Chief Financial Officer, PrincipalAccounting Officer and Global Controller, and to contractors of the Company. The code of ethics sets forth the fundamental principles and key policies andprocedures that govern the conduct of the Company’s business. The Company’s employees receive training on the code of ethics. We intend to disclose anyamendment to, or waiver from, the code of ethics for our directors and executive officers, including our Principal Executive Officer, Principal Financial Officer,Principal Accounting Officer or Global Controller or persons performing similar functions, to the extent disclosure is required by applicable rules of the SEC andNASDAQ Stock Market LLC by posting such information on our website, at the address and location specified above.
Item 11. Executive CompensationThe information required by this item is incorporated by reference to Yahoo’s Proxy Statement for its 2017 Annual Meeting of Shareholders to be filed with theSEC within 120 days after the end of the fiscal year ended December 31, 2016.
Item 12. Security Ownership of Certain Beneficial Owners andManagement and Related Stockholder MattersThe information required by this item is incorporated by reference to Yahoo’s Proxy Statement for its 2017 Annual Meeting of Shareholders to be filed with theSEC within 120 days after the end of the fiscal year ended December 31, 2016.
Item 13. Certain Relationships and Related Transactions, and DirectorIndependenceThe information required by this item is incorporated by reference to Yahoo’s Proxy Statement for its 2017 Annual Meeting of Shareholders to be filed with theSEC within 120 days after the end of the fiscal year ended December 31, 2016.
172

Table of Contents
Item 14. Principal Accounting Fees and ServicesThe information required by this item is incorporated by reference to Yahoo’s Proxy Statement for its 2017 Annual Meeting of Shareholders to be filed with theSEC within 120 days after the end of the fiscal year ended December 31, 2016.
PART IV
Item 15. Exhibits, Financial Statement Schedules(a) The following documents are filed as part of this report:
1. Consolidated Financial Statements: Page Index To Consolidated Financial Statements Consolidated Financial Statements:
Report of Independent Registered Public Accounting Firm 93 Consolidated Balance Sheets as of December 31, 2015 and 2016 94 Consolidated Statements of Operations for each of the three years in the period ended December 31, 2016 95 Consolidated Statements of Comprehensive Income (Loss) for each of the three years in the period ended December 31, 2016 96 Consolidated Statements of Stockholders’ Equity for each of the three years in the period ended December 31, 2016 97 Consolidated Statements of Cash Flows for each of the three years in the period ended December 31, 2016 99 Notes to Consolidated Financial Statements 101
2. Financial Statement Schedules: Financial Statement Schedules:
II—Valuation and Qualifying Accounts for each of the three years in the period ended December 31, 2016 168 All other schedules are omitted because they are not applicable or the required information is shown in the Consolidated Financial Statementsor Notes thereto
Supplementary Financial Data: Selected Quarterly Financial Data (unaudited) for the two years ended December 31, 2016 169
3. Exhibits:
The exhibits listed in the Exhibit Index (following the signatures page of this report) are filed with, or incorporated by reference in, this report.
Item 16. Form 10-K SummaryNone.
173

Table of Contents
Signatures
Pursuant to the requirements of Section 13 or 15(d) of the Securities Exchange Act of 1934, the Registrant has duly caused this report to be signed on its behalfby the undersigned, thereunto duly authorized, on the 1st day of March 2017.
YAHOO! INC.
By: /S/ K EN G OLDMAN Ken Goldman
ChiefFinancialOfficer
Power of Attorney
KNOW ALL PERSONS BY THESE PRESENTS, that each person whose signature appears below constitutes and appoints Marissa A. Mayer and KenGoldman, or either of them, his or her attorneys-in-fact, each with the power of substitution, for him or her in any and all capacities, to sign any amendments tothis Annual Report on Form 10-K and to file the same, with Exhibits thereto and other documents in connection therewith with the Securities and ExchangeCommission, hereby ratifying and confirming all that each of said attorneys-in-fact, or substitute or substitutes may do or cause to be done by virtue hereof.
Pursuant to the requirements of the Securities Exchange Act of 1934, this report has been signed below by the following persons on behalf of the Registrant andin the capacities and on the dates indicated:
Signature Title Date
/ S / M ARISSA A. M AYER Marissa A. Mayer
Chief Executive Officer,President and Director(Principal Executive Officer)
March 1, 2017
/ S / K EN G OLDMAN Ken Goldman
Chief Financial Officer(Principal Financial and Accounting Officer)
March 1, 2017
/ S / E RIC K. B RANDT Eric K. Brandt
Chairman of the Board
March 1, 2017
/ S / M AYNARD G. W EBB , J R . Maynard G. Webb, Jr.
Chairman Emeritus and Director
March 1, 2017
/ S / T OR R. B RAHAM Tor R. Braham
Director
March 1, 2017
/ S / D AVID F ILO David Filo
Director
March 1, 2017
/ S / C ATHERINE J. F RIEDMAN Catherine J. Friedman
Director
March 1, 2017
174

Table of Contents
Signature Title Date
/ S / E DDY W. H ARTENSTEIN Eddy W. Hartenstein
Director
March 1, 2017
/ S / R ICHARD S. H ILL Richard S. Hill
Director
March 1, 2017
/ S / T HOMAS J. M CINERNEY Thomas J. McInerney
Director
March 1, 2017
/ S / J ANE E. S HAW Jane E. Shaw
Director
March 1, 2017
/ S / J EFFREY C. S MITH Jeffrey C. Smith
Director
March 1, 2017
175

Table of Contents
EXHIBIT INDEX
The following exhibits are included, or incorporated by reference, in this Annual Report on Form 10-K (and are numbered in accordance with Item 601 ofRegulation S-K). Pursuant to Item 601(a)(2) of Regulation S-K, this exhibit index immediately precedes the exhibits. Exhibit Number Description
2.1
Share Repurchase and Preference Share Sale Agreement, by and between Alibaba Group Holding Limited, the Registrant, and Yahoo! HongKong Holdings Limited, dated as of May 20, 2012 (previously filed as Exhibit 2.1 to the Registrant’s Current Report on Form 8-K filed May 24,2012 and incorporated herein by reference).
2.2
First Amendment to Share Repurchase and Preference Share Sale Agreement, by and between Alibaba Group Holding Limited, theRegistrant, and Yahoo! Hong Kong Holdings Limited, dated as of September 11, 2012 (previously filed as Exhibit 2.2 to the Registrant’sCurrent Report on Form 8-K filed September 19, 2012 and incorporated herein by reference).
2.3
Second Amendment to Share Repurchase and Preference Share Sale Agreement, by and among Alibaba Group Holding Limited, theRegistrant, and Yahoo! Hong Kong Holdings Limited, dated as of October 14, 2013 (previously filed as Exhibit 2.3 to the Registrant’s CurrentReport on Form 8-K filed October 15, 2013 and incorporated herein by reference).
2.4
Third Amendment to Share Repurchase and Preference Share Sale Agreement, by and among Alibaba Group Holding Limited, theRegistrant, and Yahoo! Hong Kong Holdings Limited, dated as of July 14, 2014 (previously filed as Exhibit 2.4 to the Registrant’s CurrentReport on Form 8-K filed July 15, 2014 and incorporated herein by reference).
2.5§
Stock Purchase Agreement, dated July 23, 2016, by and between the Registrant and Verizon Communications Inc. (previously filed as Exhibit2.1 to the Registrant’s Current Report on Form 8-K filed July 25, 2016 and incorporated herein by reference).
2.6§
Reorganization Agreement, dated July 23, 2016, by and between the Registrant and Yahoo Holdings, Inc. (previously filed as Exhibit 2.2 tothe Registrant’s Current Report on Form 8-K filed July 25, 2016 and incorporated herein by reference).
2.7§
Amendment to Stock Purchase Agreement, dated February 20, 2017, by and between Yahoo! Inc. and Verizon Communications Inc.(previously filed as Exhibit 2.1 to the Registrant’s Current Report on Form 8-K filed February 21, 2017 and incorporated herein by reference).
2.8§
Amendment to Reorganization Agreement, dated February 20, 2017, by and between Yahoo! Inc. and Yahoo Holdings, Inc. (previously filedas Exhibit 2.2 to the Registrant’s Current Report on Form 8-K filed February 21, 2017 and incorporated herein by reference).
3.1(A)
Amended and Restated Certificate of Incorporation of the Registrant (previously filed as Exhibit 3.1 to the Registrant’s Quarterly Report onForm 10-Q filed July 28, 2000 and incorporated herein by reference).
3.1(B)
Certificate of Designation, Preferences and Rights of Series A Junior Participating Preferred Stock of the Registrant (previously filed asExhibit 4.8 to the Registrant’s Quarterly Report on Form 10-Q filed May 4, 2001 and incorporated herein by reference).
176

Table of Contents
Exhibit Number Description
3.2
Amended and Restated Bylaws of the Registrant (previously filed as Exhibit 3.2 to the Registrant’s Current Report on Form 8-K filedMarch 30, 2016 and incorporated herein by reference).
4.1
Form of the Registrant’s Common Stock certificate (previously filed as Exhibit 4.1 to the Registrant’s Quarterly Report on Form 10-Q filedNovember 12, 2013 and incorporated herein by reference).
4.2
Indenture (including form of Notes) with respect to Yahoo’s 0.00% Convertible Senior Notes due 2018, dated as of November 26, 2013,between the Registrant and The Bank of New York Mellon Trust Company, N.A., as trustee (previously filed as Exhibit 4.2 to the Registrant’sAnnual Report on Form 10-K filed February 28, 2014 and incorporated herein by reference) (reflects minor corrections to Edgar conversionerrors where a plus (+) was reflected as a minus (-) in certain conversion formulas in Section 14.04 of the indenture).
10.1+
Form of Indemnification Agreement between the Registrant and each of its directors and executive officers (previously filed as Exhibit 10.1 tothe Registrant’s Quarterly Report on Form 10-Q filed November 6, 2009 and incorporated herein by reference).
10.2(A)+
Yahoo! Inc. Stock Plan, as amended and restated on April 8, 2014 (and effective June 25, 2014) (previously referred to as the “1995 StockPlan” and filed as Exhibit 10.1 to the Registrant’s Current Report on Form 8-K filed June 27, 2014 and incorporated herein by reference).
10.2(B)+
Form of Stock Option Agreement, including Notice of Stock Option Grant, under the Yahoo! Inc. Stock Plan (previously filed as Exhibit10.2(B) to the Registrant’s Quarterly Report on Form 10-Q filed August 8, 2013 and incorporated herein by reference).
10.2(C)+
Form of Stock Option Agreement for Executives, including Notice of Stock Option Grant to Executive, under the Yahoo! Inc. Stock Plan(previously filed as Exhibit 10.2(C) to the Registrant’s Quarterly Report on Form 10-Q filed August 8, 2013 and incorporated herein byreference).
10.2(D)+
Form of Restricted Stock Unit Award Agreement, including Notice of Grant, under the Yahoo! Inc. Stock Plan (previously filed as Exhibit10.2(D) to the Registrant’s Quarterly Report on Form 10-Q filed August 8, 2013 and incorporated herein by reference).
10.2(E)+
Form of Restricted Stock Unit Award Agreement for Executives (version 1), including Notice of Grant, under the Yahoo! Inc. Stock Plan(previously filed as Exhibit 10.4 to the Registrant’s Current Report on Form 8-K filed March 6, 2013 and incorporated herein by reference).
10.2(F)+
Form of Restricted Stock Unit Award Agreement for Executives (version 2), including the Notice of Grant, under the Yahoo! Inc. Stock Plan(previously filed as Exhibit 10.2(R) to the Registrant’s Quarterly Report on Form 10-Q filed May 8, 2014 and incorporated herein byreference).
10.2(G)+
Form of Restricted Stock Unit Award Agreement Letter Amendment between the Registrant and executives regarding tax withholdingelections (previously filed as Exhibit 10.2(P) to the Registrant’s Quarterly Report on Form 10-Q filed November 12, 2013 and incorporatedherein by reference).
10.2(H)+
Form of Performance Restricted Stock Unit Award Agreement for Executives (version 1), including Notice of Grant, under the Yahoo! Inc.Stock Plan (previously filed as Exhibit 10.2 to the Registrant’s Current Report on Form 8-K filed March 6, 2013 and incorporated herein byreference).
177

Table of Contents
Exhibit Number Description
10.2(I)+
Form of Performance Restricted Stock Unit Award Agreement for Executives (version 2), including the Notice of Grant, under the Yahoo!Inc. Stock Plan (previously filed as Exhibit 10.2(S) to the Registrant’s Quarterly Report on Form 10-Q filed May 8, 2014 and incorporatedherein by reference).
10.2(J)+
Form of Restricted Stock Unit Award Agreement for Executives (NEO Version), including the Notice of Grant, under the Yahoo! Inc. StockPlan (previously filed as Exhibit 10.2(J) to the Registrant’s Quarterly Report on Form 10-Q filed May 10, 2016 and incorporated herein byreference).
10.2(K)+
Form of Performance Restricted Stock Unit Award Agreement for Executives (NEO Version), including the Notice of Grant, under theYahoo! Inc. Stock Plan (previously filed as Exhibit 10.2(K) to the Registrant’s Quarterly Report on Form 10-Q filed May 10, 2016 andincorporated herein by reference).
10.2(L)+
Form of equity award agreement letter amendment, dated April 10, 2016, between the Registrant and executives clarifying the definition of“change in control” for purposes of outstanding awards under the Yahoo! Inc. Stock Plan (previously filed as Exhibit 10.2(L) to theRegistrant’s Quarterly Report on Form 10-Q filed May 10, 2016 and incorporated herein by reference).
10.2(M)+
Form of Restricted Stock Unit Award Agreement, including Notice of Grant (for certain grants made after the Registrant’s entry into theStock Purchase Agreement with Verizon), under the Yahoo! Inc. Stock Plan (previously filed as Exhibit 10.2(M) to the Registrant’sQuarterly Report on Form 10-Q filed November 9, 2016 and incorporated herein by reference).
10.3+
Yahoo! Inc. 1996 Employee Stock Purchase Plan (as amended on October 15, 2014) (previously filed as Exhibit 10.3(A) to the Registrant’sAnnual Report on Form 10-K filed February 27, 2015 and incorporated herein by reference).
10.4(A)+
Yahoo! Inc. Directors’ Stock Plan, as amended and restated on October 16, 2014 (and effective January 1, 2015) (previously referred to asthe “1996 Directors’ Stock Plan” and filed as Exhibit 10.4(A) to the Registrant’s Quarterly Report on Form 10-Q filed November 7, 2014 andincorporated herein by reference).
10.4(B)+
Form of Director Nonstatutory Stock Option Agreement, including Notice of Grant, under the Yahoo! Inc. Directors’ Stock Plan (previouslyfiled as Exhibit 10.4(B) to the Registrant’s Annual Report on Form 10-K filed February 27, 2015 and incorporated herein by reference).
10.4(C)+
Form of Notice of Restricted Stock Unit Grant and Director Restricted Stock Unit Award Agreement, including Notice of Grant, under theYahoo! Inc. Directors’ Stock Plan (previously filed as Exhibit 10.4(C) to the Registrant’s Annual Report on Form 10-K filed February 27,2015 and incorporated herein by reference).
10.5
Joint Venture Agreement dated April 1, 1996 by and between the Registrant and SOFTBANK Corporation (previously filed as Exhibit 10.7to the Registrant’s Annual Report on Form 10-K filed March 21, 2003 and incorporated herein by reference).
10.6
Amendment Agreement dated September 17, 1997 by and between Registrant and SOFTBANK Corporation (previously filed as Exhibit10.11 to the Registrant’s Annual Report on Form 10-K filed March 21, 2003 and incorporated herein by reference).
10.7
Amendment Agreement No. 2 to Joint Venture Agreement, dated June 17, 2015, by and between the Registrant and Softbank Corporation(previously filed as Exhibit 10.7 to the Registrant’s Quarterly Report on Form 10-Q filed August 7, 2015 and incorporated herein byreference).
178

Table of Contents
Exhibit Number Description
10.8
Yahoo Japan License Agreement dated April 1, 1996 by and between the Registrant and Yahoo Japan Corporation (previously filed asExhibit 10.43 to Amendment No. 2 to the Registrant’s Registration Statement on Form S-3, Registration No. 333-100298, filed onDecember 23, 2002 and incorporated herein by reference).
10.9
Amendment to Yahoo Japan License Agreement dated September 12, 1997 by and between the Registrant and Yahoo Japan Corporation(previously filed as Exhibit 10.40 to Amendment No. 1 of the Registrant’s Registration Statement on Form S-3, Registration No. 333-100298,filed on November 27, 2002 and incorporated herein by reference).
10.10
Amendment No. 2 to Yahoo Japan License Agreement dated January 31, 2005 by and between the Registrant and Yahoo JapanCorporation (previously filed as Exhibit 10.30 to the Registrant’s Annual Report on Form 10-K filed March 11, 2005 and incorporated hereinby reference).
10.11†
Amendment No. 3 to Yahoo! Japan License Agreement, effective as of April 29, 2016, by and between the Registrant and Yahoo JapanCorporation (previously filed as Exhibit 10.11 to the Registrant’s Quarterly Report on Form 10-Q filed August 8, 2016 and incorporated hereinby reference).
10.12+
Yahoo! Inc. Executive Incentive Plan for 2016 (previously filed as Exhibit 10.11(B) to the Registrant’s Quarterly Report on Form 10-Q filedMay 10, 2016 and incorporated herein by reference).
10.13(A)+
Form of Severance Agreement (2013 version) (previously filed as Exhibit 10.6 to the Registrant’s Current Report on Form 8-K filed March 6,2013 and incorporated herein by reference).
10.13(B)+
Form of Amendment to Executive Severance Agreement (previously filed as Exhibit 10.12(B) to the Registrant’s Quarterly Report on Form10-Q filed May 10, 2016 and incorporated herein by reference).
10.14(A)+
Yahoo! Inc. Change in Control Employee Severance Plan for Level I and Level II Employees, as amended on December 10, 2008(previously filed as Exhibit 10.15 to the Registrant’s Annual Report on Form 10-K filed February 27, 2009 and incorporated herein byreference).
10.14(B)+
Amendment, dated April 10, 2016, to Amended and Restated Yahoo! Inc. Change in Control Employee Severance Plan for Level I and LevelII Employees (previously filed as Exhibit 10.1 to the Registrant’s Current Report on Form 8-K filed April 14, 2016 and incorporated herein byreference).
10.15(A)†
Letter Agreement, dated July 29, 2009, between the Registrant and Microsoft Corporation (previously filed as Exhibit 10.21(A) to theRegistrant’s Quarterly Report on Form 10-Q filed November 6, 2009 and incorporated herein by reference).
10.15(B)†
Search and Advertising Services and Sales Agreement, dated December 4, 2009, between the Registrant and Microsoft Corporation(previously filed as Exhibit 10.18(B) to the Registrant’s Annual Report on Form 10-K filed February 26, 2010 and incorporated herein byreference).
10.15(C)†
License Agreement, dated December 4, 2009, between the Registrant and Microsoft Corporation (previously filed as Exhibit 10.18(C) to theRegistrant’s Annual Report on Form 10-K filed February 26, 2010 and incorporated herein by reference).
179

Table of Contents
Exhibit Number Description
10.15(D)†
First Amendment to Search and Advertising Services and Sales Agreement, dated as of July 14, 2010, by and between the Registrantand Microsoft Corporation (previously filed as Exhibit 10.18(D) to the Registrant’s Quarterly Report on Form 10-Q filed May 10, 2011 andincorporated herein by reference).
10.15(E)†
Second Amendment to Search and Advertising Services and Sales Agreement, dated as of October 10, 2010, by and between theRegistrant and Microsoft Corporation (previously filed as Exhibit 10.18(E) to the Registrant’s Quarterly Report on Form 10-Q filed May 10,2011 and incorporated herein by reference).
10.15(F)†
Third Amendment to Search and Advertising Services and Sales Agreement, dated as of March 31, 2011, by and between the Registrantand Microsoft Corporation (previously filed as Exhibit 10.18(F) to the Registrant’s Quarterly Report on Form 10-Q filed May 10, 2011 andincorporated herein by reference).
10.15(G)†
Amendment No. 1 to License Agreement, dated as of October 10, 2010, by and between the Registrant and Microsoft Corporation(previously filed as Exhibit 10.18(G) to the Registrant’s Quarterly Report on Form 10-Q filed May 10, 2011 and incorporated herein byreference).
10.15(H)†
Fourth Amendment to Search and Advertising Services and Sales Agreement, dated as of December 13, 2010, by and between theRegistrant and Microsoft Corporation (previously filed as Exhibit 10.18(H) to Amendment No. 1 to the Registrant’s Quarterly Report onForm 10-Q filed December 2, 2011 and incorporated herein by reference).
10.15(I)†
Fifth Amendment to Search and Advertising Services and Sales Agreement, dated as of July 2, 2011, by and between the Registrant andMicrosoft Corporation (previously filed as Exhibit 10.18(I) to Amendment No. 1 to the Registrant’s Quarterly Report on Form 10-Q filedDecember 2, 2011 and incorporated herein by reference).
10.15(J)†
Sixth Amendment to Search and Advertising Services and Sales Agreement, dated as of October 14, 2011, by and between theRegistrant and Microsoft Corporation (previously filed as Exhibit 10.18(J) to the Registrant’s Quarterly Report on Form 10-Q filedNovember 7, 2011 and incorporated herein by reference).
10.15(K)†
Seventh Amendment to Search and Advertising Services and Sales Agreement, dated as of January 1, 2012, by and between theRegistrant and Microsoft Corporation (previously filed as Exhibit 10.16(K) to the Registrant’s Quarterly Report on Form 10-Q filedAugust 9, 2012 and incorporated herein by reference).
10.15(L)†
Eighth Amendment to Search and Advertising Services and Sales Agreement, dated as of June 6, 2012, by and between the Registrantand Microsoft Corporation (previously filed as Exhibit 10.16(L) to the Registrant’s Quarterly Report on Form 10-Q filed August 9, 2012 andincorporated herein by reference).
10.15(M)†
Ninth Amendment to Search and Advertising Services and Sales Agreement, dated as of June 27, 2013, by and between the Registrantand Microsoft Corporation (previously filed as Exhibit 10.16(M) to the Registrant’s Quarterly Report on Form 10-Q filed August 8, 2013and incorporated herein by reference).
10.15(N)†
Tenth Amendment to Search and Advertising Services and Sales Agreement, effective as of March 23, 2015, by and between theRegistrant and Microsoft Corporation (previously filed as Exhibit 10.13(N) to the Registrant’s Quarterly Report on Form 10-Q filed May 7,2015 and incorporated herein by reference).
180

Table of Contents
Exhibit Number Description
10.15(O)†
Eleventh Amendment to Search and Advertising Services and Sales Agreement, effective as of April 15, 2015, by and between theRegistrant and Microsoft Corporation (previously filed as Exhibit 10.13(O) to the Registrant’s Quarterly Report on Form 10-Q filed May 7,2015 and incorporated herein by reference).
10.15(P)†
Twelfth Amendment to Search and Advertising Services and Sales Agreement, effective as of September 18, 2015, by and between theRegistrant and Microsoft Corporation (previously filed as Exhibit 10.14(P) to the Registrant’s Quarterly Report on Form 10-Q filed May 10,2016 and incorporated herein by reference).
10.15(Q)†
Thirteenth Amendment to Search and Advertising Services and Sales Agreement, effective as of November 17, 2015, by and between theRegistrant and Microsoft Corporation (previously filed as Exhibit 10.14(Q) to the Registrant’s Quarterly Report on Form 10-Q filed May 10,2016 and incorporated herein by reference).
10.15(R)†
Fourteenth Amendment to Search and Advertising Services and Sales Agreement, effective as of June 3, 2016, by and between theRegistrant and Microsoft Corporation (previously filed as Exhibit 10.14(R) to the Registrant’s Quarterly Report on Form 10-Q filed August 8,2016 and incorporated herein by reference).
10.16(A)†
Framework Agreement, dated as of July 29, 2011, by and among the Registrant, Alibaba Group Holding Limited, Softbank Corp.,Alipay.com Co., Ltd., APN Ltd., Zhejiang Alibaba E-Commerce Co., Ltd., Jack Ma Yun, Joseph C. Tsai and certain joinder parties(previously filed as Exhibit 10.1 to Amendment No. 1 to the Registrant’s Current Report on Form 8-K filed August 12, 2011 and incorporatedherein by reference).
10.16(B)
Amendment to Framework Agreement, dated as of November 15, 2012, by and among the Registrant, Alibaba Group Holding Limited,Softbank Corp., Alipay.com Co., Ltd., APN Ltd., Zhejiang Alibaba E-Commerce Co., Ltd., Jack Ma Yun, Joseph C. Tsai and certain joinderparties (previously filed as Exhibit 10.18 (B) to the Registrant’s Annual Report on Form 10-K filed March 1, 2013 and incorporated herein byreference).
10.16(C)
Waiver and Consent Agreement, dated January 23, 2014, by and among the Registrant, Alibaba Group Holding Limited, Softbank Corp.,Alipay.com Co., Ltd., APN Ltd., Zhejiang Alibaba E-Commerce Co., Ltd., Jack Ma Yun, Joseph C. Tsai and certain joinder parties(previously filed as Exhibit 10.15(C) to the Registrant’s Quarterly Report filed May 8, 2014 and incorporated herein by reference).
10.16(D)
Second Amendment to the Alipay Framework Agreement, dated as of May 3, 2014, by and among the Registrant, Alibaba Group HoldingLimited, Softbank Corp., Alipay.com Co., Ltd., APN Ltd., Zhejiang Alibaba E-Commerce Co., Ltd., Jack Ma Yun, Joseph C. Tsai and certainjoinder parties (previously filed as Exhibit 10.15(D) to the Registrant’s Quarterly Report filed May 8, 2014 and incorporated herein byreference).
10.16(E)
Share and Asset Purchase Agreement, dated August 12, 2014, by and among the Registrant, Alibaba Group Holding Limited, Alipay.comCo., Ltd, Zhejiang Ant Small and Micro Financial Services Company, Ltd. (formerly known as Zhejiang Alibaba E-Commerce Co., Ltd.),SoftBank Corp., APN Ltd., Jack Ma Yun, Joseph Chung Tsai and certain of their affiliates (previously filed as Exhibit 10.15(D) to theRegistrant’s Quarterly Report on Form 10-Q filed November 7, 2014 and incorporated herein by reference).
10.17(A)+
Employment Offer Letter, dated July 16, 2012, between the Registrant and Marissa A. Mayer (previously filed as Exhibit 10.1 to theRegistrant’s Current Report on Form 8-K filed July 19, 2012 and incorporated herein by reference).
181

Table of Contents
Exhibit Number Description
10.17(B)+
Form of Severance Agreement between the Registrant and Marissa A. Mayer (previously filed as Exhibit 10.7 to the Registrant’s CurrentReport on Form 8-K filed March 6, 2013 and incorporated herein by reference).
10.17(C)+
Form of Restricted Stock Unit Award Agreement (Retention and Grant), between the Registrant and Marissa A. Mayer (previously filed asExhibit 10.22(C) to the Registrant’s Quarterly Report on Form 10-Q filed August 9, 2012 and incorporated herein by reference).
10.17(D)+
Performance Stock Option Agreement (Retention Grant), including Notice of Grant, dated November 29, 2012, between the Registrantand Marissa A. Mayer (previously filed as Exhibit 10.21(D) to the Registrant’s Annual Report on Form 10-K filed March 1, 2013 andincorporated herein by reference).
10.17(E)+
First Amendment, dated April 14, 2014, to Performance Stock Option Agreement (Retention Grant), between the Registrant and MarissaA. Mayer (previously filed as Exhibit 10.17(K) to the Registrant’s Quarterly Report on Form 10-Q filed May 8, 2014 and incorporatedherein by reference).
10.17(F)+
Second Amendment, dated April 17, 2015, to Performance Stock Option Agreement (Retention Grant), between the Registrant andMarissa A. Mayer (previously filed as Exhibit 10.15(O) to the Registrant’s Quarterly Report on Form 10-Q filed May 7, 2015 andincorporated herein by reference).
10.17(G)+
Restricted Stock Unit Award Agreement, including Notice of Grant, dated February 27, 2014, between the Registrant and Marissa A.Mayer (previously filed as Exhibit 10.17(I) to the Registrant’s Quarterly Report on Form 10-Q filed May 8, 2014 and incorporated herein byreference).
10.17(H)+
Performance Restricted Stock Unit Award Agreement, including Notice of Grant, dated February 27, 2014, between the Registrant andMarissa A. Mayer (previously filed as Exhibit 10.17(J) to the Registrant’s Quarterly Report on Form 10-Q filed May 8, 2014 andincorporated herein by reference).
10.17(I)+
Restricted Stock Unit Award Agreement, including Notice of Grant, dated March 6, 2015, between the Registrant and Marissa A. Mayer(previously filed as Exhibit 10.15(N) to the Registrant’s Quarterly Report on Form 10-Q filed May 7, 2015 and incorporated herein byreference).
10.17(J)+
Performance Restricted Stock Unit Award Agreement, including Notice of Grant, dated March 6, 2015, between the Registrant andMarissa A. Mayer (previously filed as Exhibit 10.15(M) to the Registrant’s Quarterly Report on Form 10-Q filed May 7, 2015 andincorporated herein by reference).
10.17(K)+
Third Amendment, dated March 31, 2016, to Performance Stock Option Agreement (Retention Grant), between the Registrant andMarissa A. Mayer (previously filed as Exhibit 10.16(K) to the Registrant’s Quarterly Report on Form 10-Q filed May 10, 2016 andincorporated herein by reference).
10.17(L)+
Restricted Stock Unit Award Agreement, including Notice of Grant, dated March 7, 2016, between the Registrant and Marissa A. Mayer(previously filed as Exhibit 10.16(L) to the Registrant’s Quarterly Report on Form 10-Q filed May 10, 2016 and incorporated herein byreference).
10.17(M)+
Performance Restricted Stock Unit Award Agreement, including Notice of Grant, dated March 7, 2016, between the Registrant andMarissa A. Mayer (previously filed as Exhibit 10.16(M) to the Registrant’s Quarterly Report on Form 10-Q filed May 10, 2016 andincorporated herein by reference).
182
Table of Contents
Exhibit Number Description
10.18+
Employment Offer Letter, dated September 23, 2012, between the Registrant and Ken Goldman (previously filed as Exhibit 10.1 to theRegistrant’s Current Report on Form 8-K filed September 26, 2012 and incorporated herein by reference).
10.19
Form of Call Option Confirmation between the Registrant and each Option Counterparty (previously filed as Exhibit 10.1 to the Registrant’sCurrent Report on Form 8-K filed November 26, 2013 and incorporated herein by reference).
10.20
Form of Warrant Confirmation between the Registrant and each Option Counterparty (previously filed as Exhibit 10.2 to the Registrant’sCurrent Report on Form 8-K filed November 26, 2013 and incorporated herein by reference).
10.21+
Employment Offer Letter, dated May 31, 1999, between the Registrant and Ronald S. Bell (previously filed as Exhibit 10.24 to theRegistrant’s Quarterly Report on Form 10-Q filed May 8, 2014 and incorporated herein by reference).
10.22(A)†
Google Services Agreement, dated October 19, 2015, by and between the Registrant and Google Inc. (previously filed as Exhibit 10.22 tothe Registrant’s Annual Report on Form 10-K filed February 29, 2016 and incorporated herein by reference).
10.22(B)†
Amendment Number One to Google Services Agreement, effective as of March 1, 2016, by and between the Registrant and Google Inc.(previously filed as Exhibit 10.22(B) to the Registrant’s Quarterly Report on Form 10-Q filed May 10, 2016 and incorporated herein byreference).
10.22(C)*†
Amendment Number Two to Google Services Agreement, effective as of December 1, 2016, by and between the Registrant and GoogleInc.
10.23+
Employment Offer Letter, dated October 19, 2014, between the Registrant and Lisa Utzschneider (previously filed as Exhibit 10.23 to theRegistrant’s Annual Report on Form 10-K filed February 29, 2016 and incorporated herein by reference).
10.24
Settlement Agreement, dated April 26, 2016, among the Registrant, Starboard Value LP and each of the other persons and entities setforth on the signature pages thereto (previously filed as Exhibit 10.1 to the Registrant’s Current Report on Form 8-K filed April 27, 2016 andincorporated herein by reference).
10.25
Settlement and Release Agreement, dated February 20, 2017, by and among Yahoo! Inc., Yahoo Holdings, Inc., and VerizonCommunications Inc. (previously filed as Exhibit 10.1 to the Registrant’s Current Report on Form 8-K filed February 21, 2017 andincorporated herein by reference).
21.1* List of Subsidiaries.
23.1* Consent of Independent Registered Public Accounting Firm.
24.1 Power of Attorney (see the signature page of this Annual Report on Form 10-K)
31.1*
Certificate of Chief Executive Officer Pursuant to Securities Exchange Act Rules 13a-14(a) and 15d-14(a) as Adopted Pursuant toSection 302 of the Sarbanes-Oxley Act of 2002, dated March 1, 2017.
31.2*
Certificate of Chief Financial Officer Pursuant to Securities Exchange Act Rules 13a-14(a) and 15d-14(a) as Adopted Pursuant toSection 302 of the Sarbanes-Oxley Act of 2002, dated March 1, 2017.
32**
Certificate of Chief Executive Officer and Chief Financial Officer Pursuant to Securities Exchange Act Rules 13a-14(b) and 15d-14(b) and18 U.S.C. Section 1350, as Adopted Pursuant to Section 906 of the Sarbanes-Oxley Act of 2002, dated March 1, 2017.
183
Table of Contents
Exhibit Number Description
101.INS* XBRL Instance
101.SCH* XBRL Taxonomy Extension Schema
101.CAL* XBRL Taxonomy Extension Calculation
101.DEF* XBRL Taxonomy Extension Definition
101.LAB* XBRL Taxonomy Extension Labels
101.PRE* XBRL Taxonomy Extension Presentation * Filed herewith. ** Furnished herewith. + Indicates a management contract or compensatory plan or arrangement. † Portions of this exhibit have been omitted and filed separately with the U.S. Securities and Exchange Commission pursuant to a request for confidential
treatment. § Certain schedules and attachments have been omitted in accordance with Item 601(b)(2) of Regulation S-K. A copy of any omitted schedule and attachment
will be furnished supplementally to the SEC upon request.
184

Exhibit 10.22(C)
AMENDMENT NUMBER TWO TO GOOGLE SERVICES AGREEMENT
This Amendment Number Two to the Google Services Agreement (“ Amendment ”), effective as of December 1, 2016 (“ Amendment Two EffectiveDate ”), is between Yahoo! Inc. (“ Company ”) and Google Inc. (“ Google ”) and amends the Google Services Agreement that has an effective date ofOctober 1, 2015, as amended (the “ Agreement ”). Capitalized terms not defined in this Amendment have the meanings given to those terms in the Agreement.The parties agree as follows:
1. [*]in Search Results . [*] of the Agreement is deleted in its entirety and replaced with the following:
5.2 [*]
(a) [*]
(b) [*], which may be approved or rejected in Google’s sole discretion, Company may [*]. Notwithstanding anything to the contrary, such contentmay not [*]. With 15 days’ prior written notice, Google may require Company to [*] within any such Search Results Set and, following such notice period,Company will ensure that Google’s Search Result Sets are [*].
(c) [*]
2. General . The parties may execute this Amendment in counterparts, including facsimile, PDF, or other electronic copies, which taken together willconstitute one instrument. Except as expressly modified herein, the terms of the Agreement remain in full force and effect.
[*] Indicates that certain information in this exhibit has been omitted and filed separately with the Securities and Exchange Commission. Confidential treatmenthas been requested with respect to the omitted portions.

IN WITNESS WHEREOF, the parties have executed this Amendment by persons duly authorized.
GOOGLE INC. YAHOO! INC.
By: /s/ Phillipp Schindler By: /s/ Ian Weingarten
Name: Phillipp Schindler Name: Ian Weingarten
Title: Authorized Signatory Title: SVP, Corporate Development & Partnerships
Date: December 8, 2016 Date: December 7, 2016
GOOGLE ASIA PACIFIC PTE. LTD. YAHOO! SINGAPORE DIGITAL MARKETING PTE LTD.
By: /s/ Marco Borla By: /s/ Margaret Chang
Name: Marco Borla Name: Margaret Chang
Title: Finance Director Title: Senior Director
Date: December 8, 2016 Date: December 7, 2016
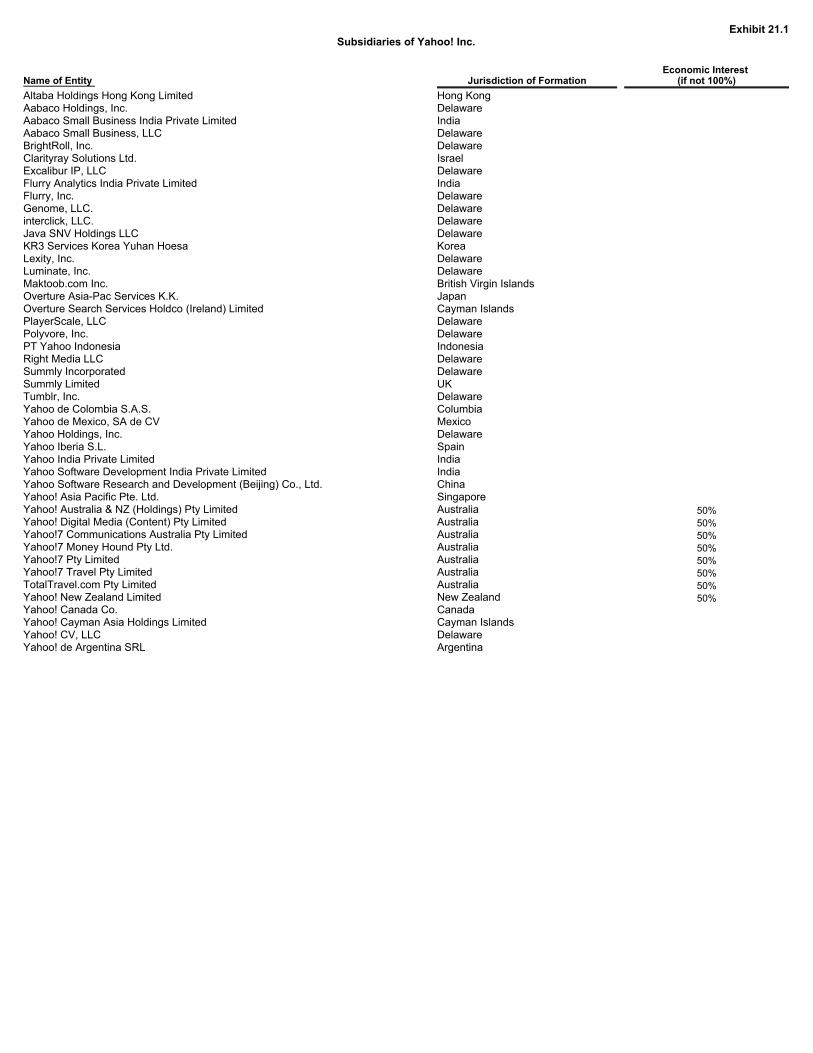
Exhibit 21.1Subsidiaries of Yahoo! Inc.
Name of Entity Jurisdiction of Formation
Economic Interest (if not 100%)
Altaba Holdings Hong Kong Limited Hong Kong Aabaco Holdings, Inc. Delaware Aabaco Small Business India Private Limited India Aabaco Small Business, LLC Delaware BrightRoll, Inc. Delaware Clarityray Solutions Ltd. Israel Excalibur IP, LLC Delaware Flurry Analytics India Private Limited India Flurry, Inc. Delaware Genome, LLC. Delaware interclick, LLC. Delaware Java SNV Holdings LLC Delaware KR3 Services Korea Yuhan Hoesa Korea Lexity, Inc. Delaware Luminate, Inc. Delaware Maktoob.com Inc. British Virgin Islands Overture Asia-Pac Services K.K. Japan Overture Search Services Holdco (Ireland) Limited Cayman Islands PlayerScale, LLC Delaware Polyvore, Inc. Delaware PT Yahoo Indonesia Indonesia Right Media LLC Delaware Summly Incorporated Delaware Summly Limited UK Tumblr, Inc. Delaware Yahoo de Colombia S.A.S. Columbia Yahoo de Mexico, SA de CV Mexico Yahoo Holdings, Inc. Delaware Yahoo Iberia S.L. Spain Yahoo India Private Limited India Yahoo Software Development India Private Limited India Yahoo Software Research and Development (Beijing) Co., Ltd. China Yahoo! Asia Pacific Pte. Ltd. Singapore Yahoo! Australia & NZ (Holdings) Pty Limited Australia 50%Yahoo! Digital Media (Content) Pty Limited Australia 50%Yahoo!7 Communications Australia Pty Limited Australia 50%Yahoo!7 Money Hound Pty Ltd. Australia 50%Yahoo!7 Pty Limited Australia 50%Yahoo!7 Travel Pty Limited Australia 50%TotalTravel.com Pty Limited Australia 50%Yahoo! New Zealand Limited New Zealand 50%Yahoo! Canada Co. Canada Yahoo! Cayman Asia Holdings Limited Cayman Islands Yahoo! CV, LLC Delaware Yahoo! de Argentina SRL Argentina

Name of Entity Jurisdiction of Formation Economic Interest
(if not 100%)Yahoo! Deutschland Services GmbH Germany Yahoo! Digital Marketing Limited Taiwan Yahoo! do Brasil Internet Ltda Brazil Yahoo! Domain Services, Inc. Delaware Yahoo! EMEA Limited Ireland Yahoo! France Holdings SAS France Yahoo! France SAS France Yahoo! Hispanic Americas, LLC Delaware Yahoo! Hong Kong Limited Hong Kong Yahoo! Hungary Labs Kft. Hungary Yahoo! International Services Holdings, Inc. Delaware Yahoo! International Services, Inc. Delaware Yahoo! Israel Labs Ltd. Israel Yahoo! Italia S.r.l. Italy Yahoo! Jordan Services PSC Jordan Yahoo! Korea Yuhan Hoesa Korea Yahoo! Malaysia Sdn. Bhd. Malaysia Yahoo! Mauritius Holdings Limited Mauritius Yahoo! Netherlands B.V. Netherlands Yahoo! Netherlands Holdings C. V. Netherlands Yahoo! Philippines Services Inc. Philippines Yahoo! Realty Inc. California Yahoo! Saudi Arabia Services Limited Saudi Arabia Yahoo! Search Marketing Australia Pty Limited Australia Yahoo! Singapore Digital Marketing Pte. Ltd. Singapore Yahoo! Switzerland Server Services Sàrl Switzerland Yahoo! Taiwan Holdings Limited Hong Kong Yahoo! Taiwan Inc. Taiwan Yahoo! Technologies Norway AS Norway Yahoo! UK Limited UK Yahoo! UK Services Limited UK Yahoo! Vietnam Company Limited Vietnam Zimbra Software Asia Pacific Private Limited India

Exhibit 23.1CONSENT OF INDEPENDENT REGISTERED PUBLIC ACCOUNTING FIRM
We hereby consent to the incorporation by reference in the Registration Statements on Form S-8 (No. 333-206956, No. 333-202330, No. 333-198688, No333-198687, No. 333-191123, No. 333-191122, No. 333-190495, No. 333-186976, 333-179782, No. 333-174943, No. 333-174942, No. 333-170933,No. 333-168296, No. 333-166712, No. 333-163853, No. 333-161808, No. 333-161806, No. 333-149417, No. 333-149416, No. 333-147125, No. 333-147124,No. 333-145046, No. 333-145044, No. 333-140917, No. 333-138422, No. 333-132226, No. 333-127322, No. 333-126581, No. 333-120999, No. 333-118093,No. 333-118088, No. 333-118067, No. 333-112596, No. 333-109914, No. 333-104137, No. 333-39105, No. 333-46492, No. 333-54426, No. 333-56781,No. 333-60828, No. 333-66067, No. 333-76995, No. 333-79675, No. 333-80227, No. 333-81635, No. 333-83770, No. 333-89948, and No. 333-93497), and theRegistration Statement on Form S-4 (No. 333-62694) of Yahoo! Inc. of our report dated March 1, 2017 relating to the consolidated financial statements, financialstatement schedule and the effectiveness of internal control over financial reporting, which appears in this Form 10-K.
/s/ PricewaterhouseCoopers LLP
San Jose, CaliforniaMarch 1, 2017

Exhibit 31.1
Certification of Chief Executive Officer Pursuant toSecurities Exchange Act Rules 13a-14(a) and 15d-14(a)
as Adopted Pursuant toSection 302 of the Sarbanes-Oxley Act of 2002
I, Marissa A. Mayer, certify that: 1. I have reviewed this Form 10-K of Yahoo! Inc.; 2. Based on my knowledge, this report does not contain any untrue statement of a material fact or omit to state a material fact necessary to make the
statements made, in light of the circumstances under which such statements were made, not misleading with respect to the period covered by this report; 3. Based on my knowledge, the financial statements, and other financial information included in this report, fairly present in all material respects the financial
condition, results of operations and cash flows of the registrant as of, and for, the periods presented in this report; 4. The registrant’s other certifying officer(s) and I are responsible for establishing and maintaining disclosure controls and procedures (as defined in Exchange
Act Rules 13a-15(e) and 15d-15(e)) and internal control over financial reporting (as defined in Exchange Act Rules 13a-15(f) and 15d-15(f)) for the registrantand have:
(a) Designed such disclosure controls and procedures, or caused such disclosure controls and procedures to be designed under our supervision, to
ensure that material information relating to the registrant, including its consolidated subsidiaries, is made known to us by others within those entities,particularly during the period in which this report is being prepared;
(b) Designed such internal control over financial reporting, or caused such internal control over financial reporting to be designed under our supervision,
to provide reasonable assurance regarding the reliability of financial reporting and the preparation of financial statements for external purposes inaccordance with generally accepted accounting principles;
(c) Evaluated the effectiveness of the registrant’s disclosure controls and procedures and presented in this report our conclusions about the effectivenessof the disclosure controls and procedures, as of the end of the period covered by this report based on such evaluation; and
(d) Disclosed in this report any change in the registrant’s internal control over financial reporting that occurred during the registrant’s most recent fiscal
quarter (the registrant’s fourth fiscal quarter in the case of an annual report) that has materially affected, or is reasonably likely to materially affect, theregistrant’s internal control over financial reporting; and
5. The registrant’s other certifying officer(s) and I have disclosed, based on our most recent evaluation of internal control over financial reporting, to the
registrant’s auditors and the audit committee of the registrant’s board of directors (or persons performing the equivalent functions):
(a) All significant deficiencies and material weaknesses in the design or operation of internal control over financial reporting which are reasonably likely toadversely affect the registrant’s ability to record, process, summarize and report financial information; and
(b) Any fraud, whether or not material, that involves management or other employees who have a significant role in the registrant’s internal control overfinancial reporting.
Dated: March 1, 2017 By: /s/ M ARISSA A. M AYER
Marissa A. Mayer Chief Executive Officer
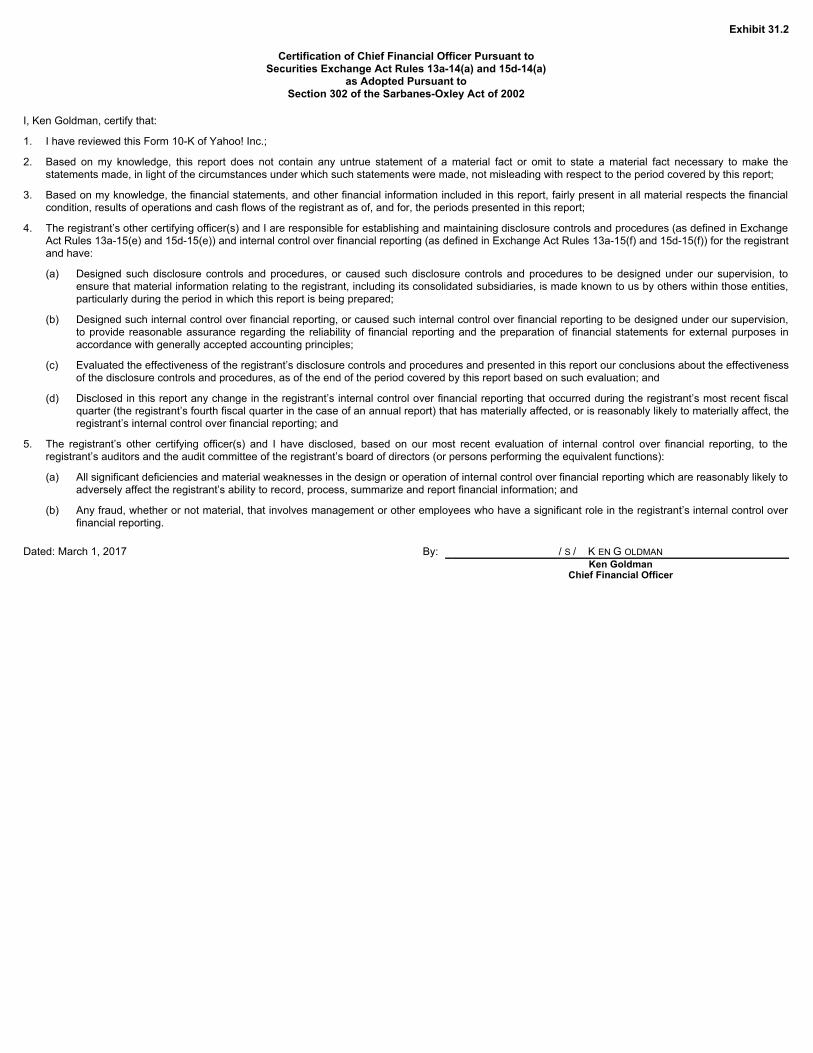
Exhibit 31.2
Certification of Chief Financial Officer Pursuant toSecurities Exchange Act Rules 13a-14(a) and 15d-14(a)
as Adopted Pursuant toSection 302 of the Sarbanes-Oxley Act of 2002
I, Ken Goldman, certify that: 1. I have reviewed this Form 10-K of Yahoo! Inc.; 2. Based on my knowledge, this report does not contain any untrue statement of a material fact or omit to state a material fact necessary to make the
statements made, in light of the circumstances under which such statements were made, not misleading with respect to the period covered by this report; 3. Based on my knowledge, the financial statements, and other financial information included in this report, fairly present in all material respects the financial
condition, results of operations and cash flows of the registrant as of, and for, the periods presented in this report; 4. The registrant’s other certifying officer(s) and I are responsible for establishing and maintaining disclosure controls and procedures (as defined in Exchange
Act Rules 13a-15(e) and 15d-15(e)) and internal control over financial reporting (as defined in Exchange Act Rules 13a-15(f) and 15d-15(f)) for the registrantand have:
(a) Designed such disclosure controls and procedures, or caused such disclosure controls and procedures to be designed under our supervision, to
ensure that material information relating to the registrant, including its consolidated subsidiaries, is made known to us by others within those entities,particularly during the period in which this report is being prepared;
(b) Designed such internal control over financial reporting, or caused such internal control over financial reporting to be designed under our supervision,
to provide reasonable assurance regarding the reliability of financial reporting and the preparation of financial statements for external purposes inaccordance with generally accepted accounting principles;
(c) Evaluated the effectiveness of the registrant’s disclosure controls and procedures and presented in this report our conclusions about the effectivenessof the disclosure controls and procedures, as of the end of the period covered by this report based on such evaluation; and
(d) Disclosed in this report any change in the registrant’s internal control over financial reporting that occurred during the registrant’s most recent fiscal
quarter (the registrant’s fourth fiscal quarter in the case of an annual report) that has materially affected, or is reasonably likely to materially affect, theregistrant’s internal control over financial reporting; and
5. The registrant’s other certifying officer(s) and I have disclosed, based on our most recent evaluation of internal control over financial reporting, to the
registrant’s auditors and the audit committee of the registrant’s board of directors (or persons performing the equivalent functions):
(a) All significant deficiencies and material weaknesses in the design or operation of internal control over financial reporting which are reasonably likely toadversely affect the registrant’s ability to record, process, summarize and report financial information; and
(b) Any fraud, whether or not material, that involves management or other employees who have a significant role in the registrant’s internal control overfinancial reporting.
Dated: March 1, 2017 By: / S / K EN G OLDMAN
Ken Goldman Chief Financial Officer
Exhibit 32
Certification of Chief Executive Officer and Chief Financial Officer Pursuant to18 U.S.C. Section 1350,as Adopted Pursuant to
Section 906 of the Sarbanes-Oxley Act of 2002
In connection with the Annual Report on Form 10-K of Yahoo! Inc. (the “Company”) for the year ended December 31, 2016 as filed with the Securities andExchange Commission on the date hereof (the “Report”), Marissa A. Mayer, as Chief Executive Officer of the Company, and Ken Goldman, as Chief FinancialOfficer of the Company, each hereby certifies, pursuant to 18 U.S.C. § 1350, as adopted pursuant to §906 of the Sarbanes-Oxley Act of 2002, to the best of heror his knowledge, respectively, that:
(1) The Report fully complies with the requirements of Section 13(a) or 15(d) of the Securities Exchange Act of 1934; and
(2) The information contained in the Report fairly presents, in all material respects, the financial condition and results of operations of the Company.
/ S / M ARISSA A. M AYER Name: Marissa A. MayerTitle: Chief Executive Officer
Dated: March 1, 2017
/ S / K EN G OLDMAN Name: Ken GoldmanTitle: Chief Financial Officer
Dated: March 1, 2017
The foregoing certification is being furnished pursuant to 18 U.S.C. Section 1350. It is not being filed for purposes of Section 18 of the Securities Exchange Actof 1934, as amended, and it is not to be incorporated by reference into any filing of the Company, regardless of any general incorporation language in such filing.


![PHQW/DZDQG/LWLJDWLRQ $1HZ:LQGIURP:DVKLQJWRQ … · 6wxg\0dwhuldo 3uhvhqwdwlrq6olghv 5hylhzriwkh6xsuhph&rxuw¶v(psor\phqw&dvhv 7hupv %\5rehuw% )lw]sdwulfn 7deohri&rqwhqwv 7deohri&dvhv](https://static.fdocuments.in/doc/165x107/6083d9a5a0e3777e0d763e12/phqwdzdqglwljdwlrq-1hzlqgiurpdvklqjwrq-6wxg0dwhuldo-3uhvhqwdwlrq6olghv-5hylhzriwkh6xsuhphrxuwvpsorphqwdvhv.jpg)