
Forex Medium-Term Outlook - Mizuho Bank · Forex Medium-Term Outlook 31 March 2014 ... Medium-term...
17
Forex Medium-Term Outlook 31 March 2014 Mizuho Bank, Ltd. Forex Division
Transcript of Forex Medium-Term Outlook - Mizuho Bank · Forex Medium-Term Outlook 31 March 2014 ... Medium-term...

Forex Medium-Term Outlook
31 March 2014
Mizuho Bank, Ltd. Forex Division

Medium-term Forex Outlook Mizuho Bank Ltd. 1
【Contents】 Overview of outlook ・・・・・・・・・・・・・・・・・・・・・・・・・・・・・・・・・・・ ・P.2
USD/JPY outlook : Signs of a widening of the U.S.-Japan interest rate gap The current JPY supply & demand – Current account deficit for fiscal year in sight ・・・・・・P.3 JPY tripped up by weak share prices – Japanese shares stumble at the start ・・・・・・・・P.5 U.S. monetary policies now and going forward –Interest rate gap expected to become effective only starting the second half of 2014 or early 2015・・・・・・・ ・・・・・・・・・・・・・・・P.6 Lessons from history -Waiting for selling JPY by Japanese – Is this the sixth time? ・・・・・・P.8 USD/JPY outlook -Situation continues to encourage buying on the dips as a matter of course・ P.10
EUR outlook : ECB’s “negative response”
ECB’s current monetary policies-March Governing Council Meeting returns a “negative response” rather than a “nil response”・・・・・・・・・・・・・・・・・・・・・・・・・・・・・・・・・P.11 Euro zone economy now and going forward – Deflation analysis by the European Commission ・・・・・・・・・・・・・・・・・・・・・・・・・・・・・・・・ ・・・・・・・P.13

Medium-term Forex Outlook Mizuho Bank Ltd. 2
Overview of outlook
My forecast for USD/JPY remains unchanged at “leaving the situation as is will lead to JPY depreciation.” From the interest rate (monetary policy) and supply-demand perspectives, reasons to purchase JPY remain scarce. Taking up the interest rate perspective first, following a revision of the monetary policy statement at the March FOMC meeting, and the press conference by FRB Chair Janet Yellen, forecasts of an early start of rate hikes have gained strength. Leaving aside the probability of such forecasts coming true, it is very clear that the gap between the FRB and the BOJ (which is looking for a good time to implement further monetary easing) is very wide. Again, on the supply-demand side, Japan is poised on the brink of a current account deficit for the fiscal year as well (having already posted a deficit for the calendar year). The U.S. current account deficit has been shrinking markedly, so both the U.S. and Japanese supply-demand situations promote JPY selling and USD purchasing. Taking into account that the history of JPY strength in USD/JPY markets has been the history of the Japanese current account surpluses, one cannot but predict JPY depreciation ahead, and this is the central pillar of my forecasts. Of course, during the current forecasting period, the crisis in Ukraine or uncertainties originating in emerging markets may spark alarming incidents that cause phases of JPY purchase, and such phases should be taken as good opportunities for buying on the dips. However, the FRB’s process of monetary policy normalization is expected to proceed at only a modest pace, and rate hikes are likely to begin only in the second half of 2015, if that. My forecast for the upper bound for USD/JPY this year remains 110.
EUR continues strong. In addition to the “JPY-ization” of EUR, thanks to the Euro zone now having disinflation and the world’s largest current account surplus, repatriations ahead of the planned stress tests also remain special factors strengthening EUR’s appreciation. Also taking into account the U.S. monetary policy normalization efforts, EUR/USD’s lower bound during the current forecasting period will probably be just under 1.30. The markets are assuming that the ECB will respond to counter the currency’s appreciation, so during the forecasting period, we will probably see phases of EUR sales triggered by market expectation of an additional stimulus whenever important Euro zone economic indicators such as the Harmonized Index of Consumer Prices (HICP) weaken. The ECB will probably resist being baited by such market tactics considering that it only has a few cards left to play, but it is also beginning to acknowledge that EUR strength is exerting disinflationary pressure on the economy. In the end, the ECB will be pushed, inch by inch, toward additional stimulus. With structural EUR-purchasing pressures working in opposition to EUR-selling pressures against the backdrop of ECB stimulus expectations and USD-purchasing pressure created by the FRB’s monetary policy normalization efforts, EUR/USD movements are expected to be weak during this forecasting period.
Summary table of forecasts
USD/JPY 100.76 ~ 105.45 98 ~ 106 99 ~ 108 100 ~ 110 101 ~ 111 102 ~ 112
EUR/USD 1.3477 ~ 1.3967 1.35 ~ 1.42 1.32 ~ 1.40 1.31 ~ 1.39 1.30 ~ 1.38 1.29 ~ 1.37
EUR/JPY 136.25 ~ 145.08 137 ~ 145 138 ~ 146 139 ~ 147 139 ~ 147 139 ~ 148
2014 Jan-Mar 2014 2014 2014 2015 2015
(108)
(Actual) Apr-Jun Jul-Sep Oct-Dec Jan-Mar Apr-Jun
(102.90) (103) (104) (106) (108)
(145)
(1.3760) (1.38) (1.37) (1.35) (1.34) (1.34)
(141.59) (142) (142) (143) (145)(Notes) 1. Actual results were released on 31March 2014 around 10am TKY time. 2. Forecast rates are quarter-end level

Medium-term Forex Outlook Mizuho Bank Ltd. 3
Exchange rate trends & forecasts
70
80
90
100
110
120
130
06/1Q 07/1Q 08/1Q 09/1Q 10/1Q 11/1Q 12/1Q 13/1Q 14/1Q 15/1Q
USD/JPY
1.1
1.2
1.3
1.4
1.5
1.6
1.7
06/1Q 07/1Q 08/1Q 09/1Q 10/1Q 11/1Q 12/1Q 13/1Q 14/1Q 15/1Q
EUR/USD
85
95
105
115
125
135
145
155
165
175
06/1Q 07/1Q 08/1Q 09/1Q 10/1Q 11/1Q 12/1Q 13/1Q 14/1Q 15/1Q
EUR/JPY
USD/JPY outlook – Signs of a widening of the U.S.-Japan interest rate gap
The current JPY supply & demand – Current account deficit for fiscal year in sight Deficit for fiscal year now seems likely The Ministry of Finance published Japan’s January Balance of Payments. Owing partially also to seasonal factors, January’s Trade Balance had posted an extremely large deficit of -JPY2.8 trillion, so a significant Current Account deficit had been expected, but the amount (-JPY1.589 trillion) exceeded market forecasts (-JPY1.4118 trillion). The January Balance of Goods and Services was the largest ever at -JPY2.8128 trillion, while the Primary Income Balance (previously Income Balance; new name starting this time) posted only a JPY1.3374 trillion surplus, bloating the Current Account deficit to unprecedented levels. Note also that the country’s Current Account Balance for the entire calendar year 2013 managed to post a surplus, even though it was the smallest surplus ever posted at JPY3.3061 trillion, but the Current Account Balance for FY2013 so far (April 2013 to January 2014) sank to JPY132.7 billion with the latest release. This raises the possibility of the first ever Current Account deficit on an entire year basis for the fiscal year, one step ahead of the calendar year. During February and March, an increase in interest income from foreign securities and the repatriation of dividends to Japan is expected, so the Primary Income Balance could increase, but on the other hand, imports could also increase to service the front-loaded demand ahead of the consumption tax hike. Therefore, the chances that the Current Account Balance will post a surplus during February and March and help prevent the slide into deficit for the fiscal year seem rather slender. Also, during the eight months of 2013 (February to September) that saw a Current Account surplus, the average monthly surplus amounted to just under JPY630 billion, so even if a similar level of surplus is posted during February and March this year, the total surplus for the fiscal year is unlikely to reach even JPY1.5 trillion – an amount that could be offset by single-month’s trade deficit at recent levels.
-40000
-30000
-20000
-10000
0
10000
20000
30000
40000
2010/01 2011/01 2012/01 2013/01 2014/01
(one hundred mio yen)
(Source)Ministry of Finance Japan
Japan's current account
Secondary income balancePrimary income balanceServicesTrade balanceCurrent account
*Primary income balance is previously income balance and secondary income balance ispreviously current transfers balance; new name starting from January 2014

Medium-term Forex Outlook Mizuho Bank Ltd. 4
Significant JPY depreciation during second half of 2015? If the Current Account Balance for the entire fiscal year posts a deficit, this would be an extremely symbolic event for Japan. It is also extremely significant news for JPY rates going forward. As discussed also in the February 8, 2014 issue of Mizuho Market Topics titled “Considering JPY from the perspective of the basic supply-demand following the release of the 2013 Balance of Payments,” the history of JPY appreciation has ultimately been the history of the Current Account surplus. Taking this into account, and going by the supply-demand balance trend shown clearly by the exhibit, there seems no question that we are now entering a phase of JPY weakness against USD strength. The import penetration rate is already increasing in a large number of industry sectors, so even if Japan resumes the operation of its nuclear power plants, it is unlikely that imports will decrease dramatically and contribute to a marked improvement in the Trade Balance. If the change in the supply-demand relationship, as suggested by the Current Account Balance shown in the exhibit, is assumed to affect forex rates with a time lag of two years or so, then the enormous Current Account deficit posted during the four months since October 2013 is likely to begin affecting forex rates starting from the second half of 2015. The level of JPY weakness at that time, instinctively speaking, may be an incredible 168 yen to 180 yen. Of course, so long as there is no final and conclusive evidence of the Japanese economy’s exit from deflation, it is hard to imagine JPY rates falling to those levels from a purchasing power parity (PPP) point of view, but going by the supply-demand relationship at the very least, it would not be wrong to say that a structural change is already taking place that makes it impossible to forecast the resurgence of a strong-JPY trend. The external economy sectors of Japan and the U.S. both support JPY selling & USD purchasing Note that such theories are more convincing than a comparison of the U.S. and Japanese current account balances. In March, the U.S. Current Account Balance for the October-December period last year was released. There was not much market response to the release, but I believe the results were extremely significant in indicating that the supply-demand balances for Japan and the U.S. are both changing in contrary directions. The U.S. October-December Current Account Balance (seasonally adjusted) posted a deficit of -USD81.12 billion, the smallest deficit in the over 14 years since July-September 1999. As a ratio of the nominal GDP, the deficit was 1.9%, the lowest since July-September 1997 (see exhibit). As a result, the Current Account Balance for the entire year 2013 was a deficit of -USD379.3 billion, at an average GDP ratio of 2.3%, the lowest in 16 years. The above trend of the U.S. Current Account Balance is in direct contrast to that of Japan’s, which posted the smallest surplus (approx. JPY3.3 trillion for 2013) ever seen since records began to be kept, making the reality increasingly consistent1 with my diagnosis in this report and the Mizuho Medium-Term Forex Outlook Report since 2011 that “based on the supply-demand balance, leaving the situation as is will lead to JPY depreciation.” At least when restricted to the USD-JPY currency pair, the external economy sectors of both countries are increasingly supporting a JPY sale & USD purchase scenario, and it would not be an exaggeration to say that this is our most important assumption when making forecasts.
1 Specifically, I believe that the JPY supply-demand balance made a clear shift toward JPY sale with the largest ever JPY-selling & USD-purchasing forex intervention, conducted on October 31, 2011. Please refer to the Mizuho Market Topic titled “Understanding yesterday’s JPY-selling forex intervention – Two gains” released on November 1, 2011, the day after the intervention.
60
80
100
120
140
160
180-0.5
0.0
0.5
1.0
1.5
2.0
2.5
87 89 91 93 95 97 99 01 03 05 07 09 11 13(source)Datastream
Current Account and USD/JPY(Trillion JPY) (JPY)
USD/JPY
Current Account(2yr ahead,6-month-moving average)
CA profits&JPY appreciation↑↓
CA deficits&JPY depreciation
-7.0%
-6.0%
-5.0%
-4.0%
-3.0%
-2.0%
-1.0%
0.0%
1.0%
2.0%
70 71 73 75 76 78 80 81 83 85 86 88 90 91 93 95 96 98 00 01 03 05 06 08 10 11 13
(vs nominal GDP)
(Source)US BEA
Transition of US current account balance vs nominal GDP

Medium-term Forex Outlook Mizuho Bank Ltd. 5
The graph plots the U.S.-Japan current account balance gap against USD/JPY (with the current account balance gap leading USD/JPY by two years). Going by the graph, USD/JPY rates in 2015 look likely to be in the 120-130 range, intuitively speaking. Even if it does not reach those levels of JPY depreciation, one thing is abundantly clear – it is getting more and more difficult to forecast JPY strength. Considering that a significant contribution to U.S. economic growth during 2013 came from inventory investments, it is natural that inventory adjustments will dampen U.S. domestic demand for some time to come, slowing down the growth of imports and contributing to a continued improvement in the U.S. trade balance. JPY tripped up by weak share prices – Japanese shares stumble at the start
Japanese shares stumble at the start: Net sales of Japanese shares for Jan-Mar period only for the third time following 2008 and 2009 As long as there is a stable relationship between the strength of the Nikkei Stock Price Average and JPY rates, Japanese share-related developments will be extremely important in the context of forecasting JPY rates. Looking at the cumulative results for the first 12 weeks of the year (approx. 3 months), Equity and investment fund shares in Portfolio Investment Liabilities posted a net purchase for four out of the 12 weeks, and a net sale for eight out of the 12 weeks. The amount is also a significant net sale of -JPY2.1663 trillion. The trend last year was in direct contrast to this, with 11 out of the first 12 weeks of 2013 recording a net purchase and only one out of the 12 weeks recording a net sale, the total amount being a net purchase of JPY3.4689 trillion. This may have been unavoidable, considering the chaos in emerging economies beginning with the crash of the Argentinean Peso (ARS), the start of QE tapering by the FRB, and the eruption of the Ukrainian crisis. However, it cannot be denied that there is also a cooling down of interest in Japanese shares compared with a year ago, when expectations of Abenomics were on the rise and the monetary policies of the new BOJ regime to begin from April (last year) were the focus of much interest and attention. As the exhibit also shows, it is only three times (2008, 2009, and 2014) since 2005 (for which comparison data is available) that Portfolio Investment Liabilities have stumbled at the start and posted a net sale for the first 12 weeks of the year. The old adage goes “share prices rise in the years of the dragon and serpent, and fall in the year of the horse in the Chinese astrological calendar.” So far, it seems to be on the mark. It was widely expected that front-loaded demand would be strong ahead of the consumption tax rate hike during the January-March period this year, and many predicted that share prices would also be strong during this period, reflecting the boost to the real economy from this demand. A deterioration in overseas circumstances during this period, however, ended up interfering with the predicted outcome and dealing it a serious blow. During the April-June period this year, a deterioration in domestic economic indicators following the increase in the consumption tax rate, especially a peaking out of the CPI growth rate, is feared to significantly affect the sentiment of overseas investors, who have so far been a great support for Abenomics. This is bound to make it difficult for share prices to strengthen during this period at the very least. From April on, if share price adjustments cause an especially large adjustment of USD/JPY, it may become necessary to revise my forecast range to a lower level.
-5
-4
-3
-2
-1
0
1
2
3
4
2005 2006 2007 2008 2009 2010 2011 2012 2013 2014
(Tril. yen)
(Source)Ministry of Finance Japan
Inward portfolio investment of Japanese stocks(trillion yen, 12 weeks f rom beginning of year)
0
50
100
150
200
250
30070
80
90
100
110
120
130
140
15089 90 91 92 94 95 96 97 99 00 01 02 04 05 06 07 09 10 11 12 14 15
(Bio dollar)(Yen)
(Source)US BEA, Ministry of Finance japan, Bank of japanNote: Current account balance is 2 years ahead
Transition of US-Japan current account balance & USD/JPY rate (4 quarterly average)
USD/JPY(left axis, reversed scale)
Current account balance(Japan-US)

Medium-term Forex Outlook Mizuho Bank Ltd. 6
U.S. monetary policies now and going forward –Interest rate gap expected to become effective only starting the second half of 2014 or early 2015 Markets taken by surprise in their “dovish” expectations of Yellen Yesterday’s high-profile FOMC meeting approved a USD10 billion asset acquisition taper, as expected by the markets, and eliminated the 6.5% unemployment rate forward guidance threshold. In her first press conference as FRB chair, Janet Yellen hinted that quantitative easing (QE) may be ended this autumn and that an interest rate hike may be implemented about six months later. FOMC members’ interest rate outlook also supported those expectations. In response to the FOMC meeting, USD surged, to 1.3810 against EUR and to 102.69 against JPY. Although the USD10 billion taper is in line with the established policy, it can be said that the elimination of forward guidance and the accelerated schedule for prospective interest rate hikes were unexpected. More than anything else, from the perspective of market players who have the idea that “Yellen is a dove,” it can be said that the statements were unexpectedly hawkish. Will there really be an interest rate hike in March 2015? Regarding forward guidance, besides eliminating the unemployment threshold, the previously used expression with respect to the inflation situation – “inflation between one and two years ahead is projected to be no more than a half percentage point above the Committee's 2 percent longer-run goal” – was not used. As previously noted, this reflects a “shift from quantitative judgments to qualitative judgments,” but this is not a major change, as it is merely a change to the conventional approach of making judgments based on comprehensive assessments of qualitative information. One might say that “there was no alternative since the unemployment rate was nearing the 6.5% target,” but, as explained below, it should be noted that such ad hoc modifications have increased the “dubiousness” of forward guidance. The following sentences were included at the end of the FOMC statement – “With the unemployment rate nearing 6.5 percent, the Committee has updated its forward guidance. The change in the Committee's guidance does not indicate any change in the Committee's policy intentions as set forth in its recent statements.” Ostensibly, this suggests that the elimination of unemployment and inflation thresholds should not be construed as a shift toward tightening. However, the elimination of the thresholds was accompanied by a change in the description of the prospective start of interest rate hike. While it was previously stated that it would be likely be appropriate to maintain the current interest rate level “well past the time that the unemployment rate declines below 6.5 percent,” the latest statement says that it would be appropriate “for a considerable time after the asset purchase program ends.” In response to a question about this at the press conference, she said – “So the language that we used in the statement is considerable period. So I, you know, this is the kind of term it’s hard to define. But, you know, probably means something on the order of around six months, that type of thing.” This has inevitably intensified speculation that interest rates will rise about six months from this autumn (some point during the period from September through November?), perhaps beginning sometime around March 2015. Moreover, there has also been an increase in the median forecast by FOMC members of federal funds rate year-end levels (end of 2015: 0.75%→ 1.00%; end of 2016: 1.75% → 2.25%), and the forex markets have consequently been forced to respond with USD buying. This article and the “Forex Medium-Term Outlook” has usually been presenting a USD/JPY uptrend scenario for the period from late 2014 through early 2015 based on rumors about interest rate hike-related discussions at FOMC meetings, but the latest FOMC meeting statement and FRB chair press conference seem to suggest a risk that the timing of this scenario may be accelerated somewhat. However, given that the labor force participation rate continues to be at historically low levels, it is rather difficult to believe that interest rate increases can actually be undertaken only a half year following the end of asset purchases. FRB staff projections – to full employment in 2016? Looking at the newly revised FRB staff projections for the 2014-2016 period, one finds that the upper limit of real GDP growth for each year has been revised downward by 0.2 percentage point, while the upper limit of the unemployment rate has been revised downward (in a positive direction) by 0.2-0.3 percentage point. In particular, the 2016 unemployment rate projection is for a range of “5.2% to 5.6%,” corresponding to the longer-run natural unemployment rate. In other words, the FRB staff is anticipating the attainment of full employment in 2016, and it is believed that the FRB’s current blueprint calls for the full employment to be accompanied by wage
FRB Economic Outlook (central tendency, %, as of March 2014)
2014 2015 2016 Long term
Real GDP Growth Rate 2.8~3.0 3.0~3.2 2.5~3.0 2.2~2.4(as of DEC) (2.8~3.2) (3.0~3.4) (2.5~3.2) (2.2~2.4)
Unemployment Rate 6.1~6.3 5.6~5.9 5.2~5.6 5.2~5.8(as of DEC) (6.3~6.6) (5.8~6.1) (5.3~5.8) (5.2~5.8)
PCE Inflation 1.5~1.6 1.5~2.0 1.7~2.0 2.0(as of DEC) (1.4~1.6) (1.5~2.0) (1.7~2.0) (2.0)
Core PCE Inflation 1.4~1.6 1.7~2.0 1.8~2.0(as of DEC) (1.4~1.6) (1.6~2.0) (1.8~2.0)
(Source)FRB
Medium-term Forex Outlook Mizuho Bank Ltd. 7
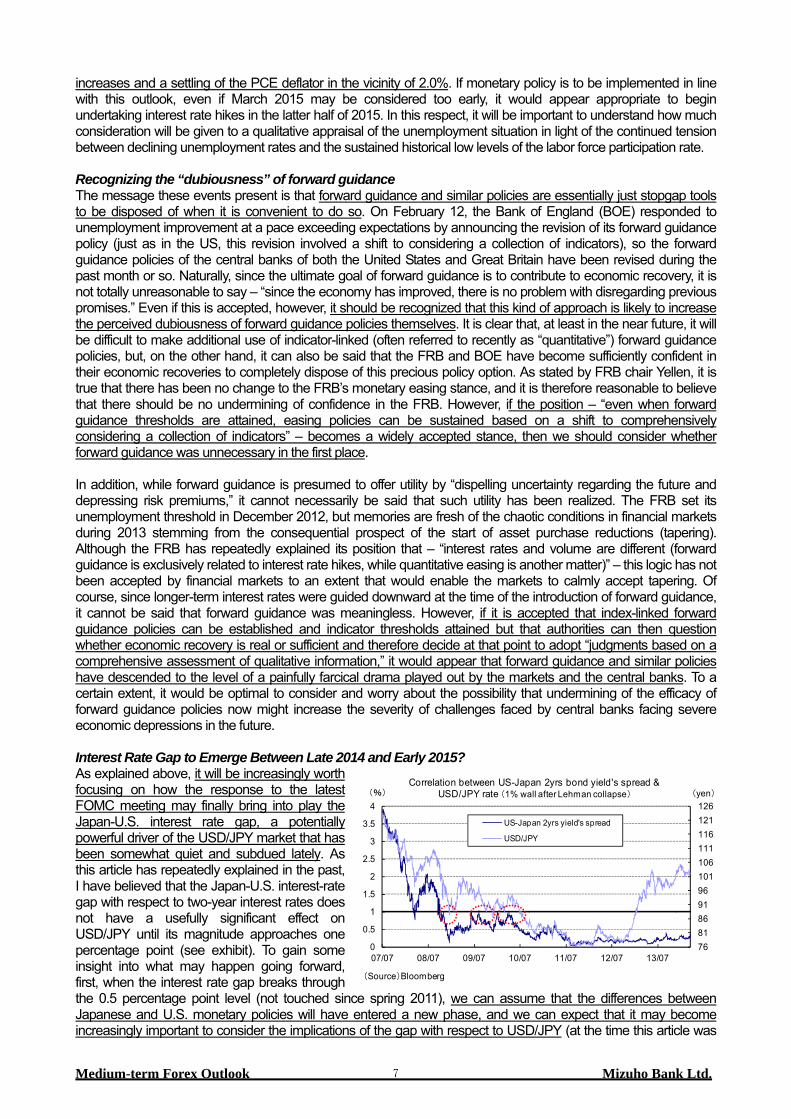
increases and a settling of the PCE deflator in the vicinity of 2.0%. If monetary policy is to be implemented in line with this outlook, even if March 2015 may be considered too early, it would appear appropriate to begin undertaking interest rate hikes in the latter half of 2015. In this respect, it will be important to understand how much consideration will be given to a qualitative appraisal of the unemployment situation in light of the continued tension between declining unemployment rates and the sustained historical low levels of the labor force participation rate. Recognizing the “dubiousness” of forward guidance The message these events present is that forward guidance and similar policies are essentially just stopgap tools to be disposed of when it is convenient to do so. On February 12, the Bank of England (BOE) responded to unemployment improvement at a pace exceeding expectations by announcing the revision of its forward guidance policy (just as in the US, this revision involved a shift to considering a collection of indicators), so the forward guidance policies of the central banks of both the United States and Great Britain have been revised during the past month or so. Naturally, since the ultimate goal of forward guidance is to contribute to economic recovery, it is not totally unreasonable to say – “since the economy has improved, there is no problem with disregarding previous promises.” Even if this is accepted, however, it should be recognized that this kind of approach is likely to increase the perceived dubiousness of forward guidance policies themselves. It is clear that, at least in the near future, it will be difficult to make additional use of indicator-linked (often referred to recently as “quantitative”) forward guidance policies, but, on the other hand, it can also be said that the FRB and BOE have become sufficiently confident in their economic recoveries to completely dispose of this precious policy option. As stated by FRB chair Yellen, it is true that there has been no change to the FRB’s monetary easing stance, and it is therefore reasonable to believe that there should be no undermining of confidence in the FRB. However, if the position – “even when forward guidance thresholds are attained, easing policies can be sustained based on a shift to comprehensively considering a collection of indicators” – becomes a widely accepted stance, then we should consider whether forward guidance was unnecessary in the first place. In addition, while forward guidance is presumed to offer utility by “dispelling uncertainty regarding the future and depressing risk premiums,” it cannot necessarily be said that such utility has been realized. The FRB set its unemployment threshold in December 2012, but memories are fresh of the chaotic conditions in financial markets during 2013 stemming from the consequential prospect of the start of asset purchase reductions (tapering). Although the FRB has repeatedly explained its position that – “interest rates and volume are different (forward guidance is exclusively related to interest rate hikes, while quantitative easing is another matter)” – this logic has not been accepted by financial markets to an extent that would enable the markets to calmly accept tapering. Of course, since longer-term interest rates were guided downward at the time of the introduction of forward guidance, it cannot be said that forward guidance was meaningless. However, if it is accepted that index-linked forward guidance policies can be established and indicator thresholds attained but that authorities can then question whether economic recovery is real or sufficient and therefore decide at that point to adopt “judgments based on a comprehensive assessment of qualitative information,” it would appear that forward guidance and similar policies have descended to the level of a painfully farcical drama played out by the markets and the central banks. To a certain extent, it would be optimal to consider and worry about the possibility that undermining of the efficacy of forward guidance policies now might increase the severity of challenges faced by central banks facing severe economic depressions in the future. Interest Rate Gap to Emerge Between Late 2014 and Early 2015? As explained above, it will be increasingly worth focusing on how the response to the latest FOMC meeting may finally bring into play the Japan-U.S. interest rate gap, a potentially powerful driver of the USD/JPY market that has been somewhat quiet and subdued lately. As this article has repeatedly explained in the past, I have believed that the Japan-U.S. interest-rate gap with respect to two-year interest rates does not have a usefully significant effect on USD/JPY until its magnitude approaches one percentage point (see exhibit). To gain some insight into what may happen going forward, first, when the interest rate gap breaks through the 0.5 percentage point level (not touched since spring 2011), we can assume that the differences between Japanese and U.S. monetary policies will have entered a new phase, and we can expect that it may become increasingly important to consider the implications of the gap with respect to USD/JPY (at the time this article was
76
81
86
91
96
101
106
111
116
121
126
0
0.5
1
1.5
2
2.5
3
3.5
4
07/07 08/07 09/07 10/07 11/07 12/07 13/07
(yen)(%)
(Source)Bloomberg
Correlation between US-Japan 2yrs bond yield's spread & USD/JPY rate (1% wall after Lehman collapse)
US-Japan 2yrs yield's spread
USD/JPY

Medium-term Forex Outlook Mizuho Bank Ltd. 8
written, the gap was approximately 0.35 percentage point). In any case, if the FRB blueprint explained at the recent FOMC meeting is progressively realized, it appears that the Japan-U.S. interest-rate gap will play an increasingly important role as a driver of USD/JPY beginning from the late 2014 to early 2015 period at the earliest, and beginning from late 2015 at the latest. Lessons from history – Waiting for selling JPY by Japanese – Is this the sixth time? “Selling JPY by the Japanese” is required for JPY depreciation phase Again, looking back at the history of JPY rates and taking into account the persistent Japanese current account surplus, the fact that over 90% of all JGBs were locked in internal debt, and that there were not that many foreign investors who would over-weighted Japanese shares, it seemed a cardinal rule that “only the Japanese had enough JPY to sell” and that “unless the Japanese sold JPY, a fundamental phase of JPY-weakness could not begin.” The context in which this cardinal rule applied is slowly beginning to change, but it remains a matter of interest both domestically and abroad to see “when the Japanese will make their move.” At what point in time will a market environment conducive to JPY selling by Japanese (≒the acquisition of risk) take shape? Such a thing would become possible only when the economy is performing well, or to put it another way, when share prices are rising. Even institutional investors (life insurance companies, pension funds and so on) would be unlikely to aggressively pursue foreign securities investment at a time when share prices are falling and appraisal losses are suffered. The figure above shows Nikkei Average and USD/JPY trends starting 1973, the year in which Japan entered the floating exchange rate system. Phases of conspicuously weak JPY (five phases numbered 1 to 5) have been encircled in red. There are bound to have been complicated circumstances leading to JPY weakness in each of these periods, but a basic correlation between a rising Nikkei Average and a weak JPY can be established, and in each of these phases, circumstances were conducive to Japanese investors taking on risk. During phase (1), in addition to USD value being propped up by the Carter administration’s USD defense program, the revision of the Foreign Exchange Act is also thought to have had a significant impact. The merger of the domestic and foreign money markets, which had until then been kept totally separate from each other, is said to have set off a major spree of risk-taking by Japanese investors. Phase (2) is, as everyone knows, the period when the Japanese economy experienced its most vigorous growth. It was also a period of extremely aggressive foreign investment, characterized by a Japanese real estate company acquiring the U.S. Rockefeller Center. This period in history also saw the Nikkei Average approach JPY40,000, and the deregulation of foreign securities investments for life insurance companies, which all created an environment extremely conducive to foreign investment by institutional investors (with Japanese life insurance companies so widely recognized that they came to be called “the seiho” even in foreign money markets). In Phase 3, Japan was able to exit a phase of extremely strong JPY. This was the period when JPY-selling interventions were intermittently made starting with the U.S.-Japan concerted intervention of July 7, 1995 and Japan’s Minister of Finance published its “Program to Encourage Foreign Investment and Financing” on August 2, 1995, once again encouraging the sale of JPY by Japanese investors. Phase 4 of weak-JPY is somewhat exceptional in that it was triggered by the collapse of the IT bubble which resulted in share prices plunging across the developed world including Japan, and not because of aggressive risk-taking by Japanese investors. Soon after the economy went into a recession, demand for USD rose, causing it to appreciate. This combined with the intermittent JPY-selling interventions (amounting to the sale of a total of JPY7 trillion in 2001-02) and the BOJ’s QE measures to cause USD/JPY to appreciate. The most recent phase of weak JPY is Phase 5, the longest continuous period of economic growth in Japan since the end of WWII, when the Nikkei Average soared above JPY18,000, and Japan’s extraordinarily low interest rates among all countries worldwide spurred on a brisk carry trade in JPY. This was a period when, for instance, a foreign bank with a branch in Japan could procure a JPY-denominated call loan cheaply, and loan this out in turn to its parent company or other branches of the same bank abroad to be invested in assets that earned a much higher rate of interest. The downward pressure on JPY exerted by such trends cannot be ignored (see figure). Again, currency trading on margin by Japanese individual investors and foreign currency investments by individual investors via investment trusts became so common that Japanese individual investors came to be known among foreign investors by the

Medium-term Forex Outlook Mizuho Bank Ltd. 9
nickname "Mrs. Watanabe." From the perspective of these foreign investors, the “Mrs. Watanabe” investors exerted an influence at par with the one-time “seihos.”
0
5000
10000
15000
20000
25000
30000
35000
40000
70
120
170
220
270
320
1973 1978 1983 1988 1993 1998 2003 2008 2013
(yen)(yen)
(Source)Bloomberg
Transition of USD/JPY rate(since January 1973)
Nikkei index
USD/JPY
①
②
③
④ ⑤
⑥?
Looking back at weak JPY history * Colored parts show time and events those accompanied “JPY selling by Japanese”(1) 1978-1984 Event Rough details of the event
1973, 1978 Two oil shocksIncrease in price of crude oil causes current account deficit inJapan. JPY begins to be seen as vulnerable to petroleum prices.
November 1978 Carter shock Dollar defense program causes USD to appreciate
December 1980First revision of the Foreign ExchangeAct
Liberalization of foreign transactions via exchange banks. U.S. 30-year interest rates of that time were 13 to 15%.
September 1985 Plaza accordG7 implements a concerted normalization of foreign exchangerates by bringing down USD rate◆End of weak-JPY phase
(2) 1987-1990
Second half of 1980s Japanese economic bubbleNikkei Average approaches JPY40,000 at one point in 1989. Assetappraisal gains of institutional investors soar.
August 1986Deregulation of foreign securitiesinvestment laws
Foreign denominated assets of institutional investors increase
February 1987 Louvre Accord Reversal of excessive USD devaluation caused by the Plaza
Since 1990Collapse of the Japanese economicbubble, etc.
Appraisal gains fall through the floor. SM regulations for lifeinsurance companies introduced in 1995
◆End of weak-JPY phase(3) 1995-1998
Second half of 1990s HF Carry TradeJapan faces financial crisis. Speculation of protracted ultra-lowinterest rates comes to the rescue.
1995Several factors causing JPY trendreversal
Washington G7 statement, U.S.-Japan concerted intervention,deregulation of foreign investment/financing, easing up of trade
April 1998Second revision of the ForeignExchange Act
Collapse of exchange banks. Prohibitions against free foreigntransactions by individuals and corporations
Aug - Sep 1998 Russian LTCM Crisis Position adjustment. Rollback in JPY carry trade.◆End of weak-JPY phase
(4) 2000-20022000 Collapse of the IT bubble Early recessionary phase, increase in demand for USD
2001-2002 Intermittent JPY selling intervention JPY sale in excess of JPY7 trillion
September 2001 Serial terrorist attacks on the U.S.JPY weakens alongside USD and U.S. shares. BOJ implementsan exceptional quantitative easing in March 2001
Since 2002 USD-carry phaseUSD becomes “ taking currency. ” Japan enters longest phase ofeconomic growth since end of WWII◆End of weak-JPY phase
(5) 2005-2007
2002-2007Longest postwar period of continuouseconomic recovery
Nikkei Average soars above JPY18,000
2005-2007 JPY-carry phaseJapan has exceptionally low interest rates among developedeconomies. Against this backdrop,Japanese individual investors ’ forex investments increase andinvestment trusts become popular
Since summer 2007 Intensification of financial crisis Position adjustment. Rollback in JPY carry trade.◆End of weak-JPY phase
(6) 2012-present
Since March 2011 Trade deficit become establishedTrade deficit break record year 2011 & 2012. Change of supplyand demand mechanism. Selling JPY by Japanese importers
February 2013 Monetary easing by BOJ USDJPY 200 days moving average started to bottom outDecember 2012 The second Abe administrarion start Abenomics. Powerful reflation policy
Since 2013 Selling JPY by investors? There is no trend has seen clearly yet
April 2013Introduction of quantitative &qualitative easing
Unprecedented quantitative easing

Medium-term Forex Outlook Mizuho Bank Ltd. 10
Looking back at historical particulars such as the above, economic recovery accompanied by a share price increase is essential for the transition to a weak-JPY phase, and, in particular, a continuous expansion of the U.S.-Japan interest rate gap is what will make carry trade attractive. In this sense, given that consumption taxes will be increased two years in a row in 2014 and 2015, the BOJ’s posture toward monetary easing is almost certain at least through this period. Meanwhile, as described above, the U.S. economy looks poised to continue its return to cruising speed, and barring unforeseen events, balance sheet adjustments may be completed by 2015. If that be the case, the U.S.-Japan interest rate gap will enter a trend of expansion, albeit very gradual, either in 2014 or 2015. There are, in fact, signs that the seeds of a fundamental trend of JPY weakness have already begun to sprout. USD/JPY outlook – Situation continues to encourage buying on the dips as a matter of course JPY will only strengthen in the event of alarming incidents
In the above sections, I discussed USD/JPY from the perspective of the comparative supply & demand in the U.S. and in Japan, monetary policies now and going forward, and lessons to be learned from past experiences. As mentioned in the course of the discussion, the JPY supply & demand balance is changing dramatically when seen from the viewpoint of the current account balances of both Japan and the U.S. From the interest rate point of view, if all goes well, tapering of QE will have made significant progress by autumn this year, and it would not be surprising to see an increase in discussions of a rate hike toward the end of the current forecasting period. There may be phases now and again of JPY strength if the Ukrainian crisis or chaos in the emerging markets spark some alarming incident, but from the long-term perspective, it would be safe to consider USD/JPY to be a currency pair that can be bought on the dips as a matter of course. However, I do not feel absolutely certain that the FRB will begin rate hikes from early spring 2015, so even if JPY depreciation accelerates alongside an expansion of the interest rate gap, the pace is likely to be gentle. Again, as I have been persistently pointing out in this report, USD150 is a big barrier for the Nikkei Stock Price Average in USD terms, beyond which it tends to become top-heavy. So as before, USD/JPY is also likely to be forced into a period of inaction whenever that happens in the months ahead. My view remains that 110 is a sufficient upper bound forecast for USD/JPY this year. Coming to major risks, it remains important to pay attention to the extent to which the public will support the “unfelt economic recovery,” which depends on a weak JPY (please refer to last month’s issue of Mizuho Forex Medium-Term Outlook for a more detailed discussion on this topic). FY2014 is likely to be characterized by a stronger wage-increase mood than the typical year, but the real wage scenario will continue harsh in light of the growth in CPI including the higher consumption tax rate. The BOJ is very likely (as expected by the markets) to look for an opportunity to implement further monetary easing in response to the economic slowdown following the consumption tax rate hike and the peaking out of CPI growth, but with growing awareness of the fact that monetary easing → JPY depreciation → dampening of real wage growth, the climate surrounding monetary policy operation may also become more oppressive. During the present forecasting period, I assume the authorities will somehow get by in the face of JPY depreciation and share price strength with greater monetary accommodation, but unless improvement in real wages keeps up with monetary easing, the economy could very possibly run into a dire situation in the form of JPY depreciation combined with share price weakness sometime in the future. Apart from the above, another domestic risk factor that merits attention is when and how the BOJ will withdraw from its “2% in two years” inflation target. When they finally come to terms with the fact that the inflation rate will rise no more, will overseas investors continue to buy Japanese shares? That remains uncertain. Overseas, FRB’s tapering schedule (of USD10 billion/month) being called off under the leadership of Janet Yellen was previously seen as a risk scenario, but recently there is more concern and caution over a scenario of earlier-than-assumed rate hikes. If that happens, it could invite a sudden jump in USD/JPY rates. Meanwhile, in the Euro zone, a stress test is scheduled for mid-year, and the uncertainty surrounding funding for capital injection following the stress test is a matter of concern.

Medium-term Forex Outlook Mizuho Bank Ltd. 11
EUR Outlook: ECB’s “negative response”
ECB’s current monetary policies – March Governing Council Meeting returns a “negative response” rather than a “nil response” A “negative response” rather than a “nil response”
The March ECB Governing Council Meeting retained the policy interest rate (interest rate on the main refinancing operations) at 0.25%, the upper limit of market interest rates (the interest rate on the marginal lending facility) at 0.75%, and the lower limit of market interest rates (the interest rate on the deposit facility) at 0.0%, thereby retaining the interest rate corridor (the difference between the upper and lower limits, and the target of the ECB’s policy operation) at 0.75 pp. Taking into consideration the introductory remarks by ECB President Mario Draghi at the February General Council Meeting press conference and the continuing lackluster performance by the various economic indicators, especially the inflation rate, my forecast for the March meeting had been that some sort of policy response was certain, but contrary to my expectations, not only was no concrete stimulus decided upon, there was no indication even of any agreement regarding action to be taken at the next or later meetings. Even among those who had predicted status quo, this level of apathy was probably not expected. The feeling is better summed up as a “negative response” rather than a “nil response.” Not just Mr. Draghi, all ECB General Council members are likely to have known that this level of apathy was likely to cause EUR to soar. This makes one think that, perhaps, EUR/USD in the region of 1.40 is being seen as permissible. To put it another way, the ECB seems to have weighed the option of “allowing EUR to appreciate to 1.40” against the option of “giving up its interest rate card” and chosen the former. As discussed again later, the relationship between EUR and the Harmonized Index of Consumer Prices (HICP) was brought up several times at the press conference following the March General Council Meeting, and it was clear that the ECB understood the extent to which EUR strength would increase the disinflationary pressure. Doubtless, the ECB decided to take no action this time in view of the side-effect on prices. At any rate, from the viewpoint of prior market expectations, the March General Council Meeting decision was undoubtedly hawkish. A stance of not bending to the will of the market is essential for preventing the BOJ-ization of the ECB, but to take the argument to its extreme – one has to wonder whether the Bank will maintain this stance even if EUR/USD appreciates to the neighborhood of 1.50.
A question of attitude - Is the glass half-full or half-empty? The ultimate reason behind the discrepancy between my prediction (of additional stimulus) and the actual outcome of the ECB meeting this time hinges on “how seriously the improvement in economic indicators is taken.” As mentioned also in the March 3, 2014 issue of Mizuho Market Topic titled “ECB General Council Meeting preview – Nil response not conceivable in present situation,” the important indicators (GDP, M3, HICP) had been slightly better than market expectations. However, other indicators (Industrial Production, Retail Sales, etc.) were certainly not satisfactory. Even the Manufacturing PMI had deteriorated for February, though showing an improvement for March (released this week), which was strongly praised by Mr. Draghi. Compared with ECB reference levels, the HICP grew by only half and M3 grew by one-fourth, both indicating the need for a monetary stimulus. Even so, Mr. Draghi said, “We saw our baseline scenario by and large confirmed. There is a continuation of a modest recovery. In the last quarter of last year we had an increase in GDP of 0.3%, after two consecutive quarters of positive growth. The news that has come out since the last monetary policy meeting is also, I would say, by and large on the positive side,” showing satisfaction in the level of performance of various indicators including the GDP. Country-wise, he described the -2 point improvement in the Portuguese unemployment rate as “quite striking.” In trying to anticipate the “next move” by the ECB at the upcoming and later meetings, therefore, it may be important to pay attention not just to the baseline scenario but also the unemployment and price trends in individual member states. A certain reporter asked, “I wonder whether you might have been somewhat disappointed by what we saw on the M3 data,” which Mr. Draghi side-stepped by saying, “It is always a matter of how you see the glass – you asked

Medium-term Forex Outlook Mizuho Bank Ltd. 12
me if I was disappointed by the credit developments: this is like the glass that could be seen as half empty or half full. We have seen a stabilisation of credit flows and we have seen an increase in M3.” Considering that Loans to the Private Sector have been decreasing yoy for the past 21 months in a row and M3, despite increasing, did so by a mere 1% (the reference level being 4.5%), Mr. Draghi’s explanation above is somewhat unconvincing. As in the case of the forward guidance, it is ambiguous which indicator should be taken with what level of seriousness, and in this sense, the ECB General Council Meetings are difficult to understand, especially as the minutes are not published (talking of which, the issue of whether the minutes should be published or not was supposed to be decided last autumn, but remains shelved.)
Regarding rate cuts and the end to SMP sterilization Considering Mr. Draghi’s remark “we had a broad discussion on changes in interest rates, as well as on other monetary policy instruments,” it appears that the recent decision was not unanimous. This is just my conjecture, but it seems likely that General Council members from southern European states (especially those from France, who tend to publicly criticize EUR strength) may be in favor of an additional stimulus. ECB members have not seemed all that favorably disposed to ending the sterilization of securities purchased through the Securities Market Programme (SMP), though. The reason given was: “We have not seen any developments in the money markets that would lead to an unwanted tightening of the monetary conditions,” but more significantly: “the benefits of sterilisation are relatively limited, given, for example, the short maturity of the bonds currently in the SMP portfolio. The net injection of the liquidity may really only last for a relatively short time, less than a year.” This has lowered the position of the instrument as a potential “next move.” Clarifying the relationship between forex rates and prices As mentioned at the start, the recent ECB decision was bound to result in EUR appreciation, whichever way one saw it, and that is, in fact, what happened. In this context, many reporters asked questions about the relationship between the forex rates and prices. Specifically, “To what extent is the strength of the euro affecting your inflation outlook,” “are you surprised at its strength given the comparative weakness of the Eurozone recovery,” and “should we (...) be viewing the exchange rate as part of the reaction function?” Mr. Draghi’s response to these questions was, “The exchange rate is not a policy target for us. But the exchange rate is very important for growth and price stability.” Coming from the president of the central bank, this answer can probably be interpreted to mean that EUR strength could become a reason (via prices) for policy change. Specific figures were also given in connection with the relationship between forex rates and prices this time: “each 10% permanent effective exchange rate appreciation lowers inflation by around -0.4 to -0.5 points.” This calculation is mild when compared with Mr. Draghi’s estimate that a 10% effective exchange rate appreciation lowers prices by -0.7 point in an ECB working paper from 2007 titled “The impact of exchange rate shocks on sectoral activity and prices in the Euro area,” but not all that divergent. It is safe to assume that the ECB considers a 10% appreciation in EUR to exert a deflationary pressure of -0.4 to -0.7 points. Based on this calculation, Mr. Draghi remarked that “The cumulative appreciation of the exchange rate between the euro and the dollar since the trough of 2012 has been around 9%. In effective terms the euro has strengthened by 8% since then. Now, as a rule of thumb, each 10% permanent effective exchange rate appreciation lowers inflation by around -0.4 to -0.5 points.” The assumed EUR/USD for the period from 2014-2016 in the recent ECB staff projections is 1.36, so the present rate of around 1.386 is already 2% higher than the assumed rate. If this trend continues, it will act to lower prices by -0.1 points.
ECB outlook March 2014 (%)
2013 2014 2015 2016
Ratio of increase in consumer prices 1.4 0.7~1.3 0.6~2.0 0.7~2.3
(previous:DEC 2013) (0.6~1.6) (0.5~2.1) -
Real GDP ▲ 0.4 0.8~1.6 0.4~2.6 0.7~2.9
(previous:DEC 2013) (0.4~1.8) (0.4~2.6) -
Consumption expenditure ▲ 0.6 0.7 1.2 1.4
Government expenditure 0.2 0.4 0.4 0.7
Gross domestic fixed capital formation ▲ 2.9 2.1 2.7 3.7
Export (goods & services) 1.1 3.6 4.7 5.1
Import (goods & services) 0.0 3.5 4.7 5.2
(Source)ECB ECB premises EUR/USD rate unchange at 1.36 for 2014-2016

Medium-term Forex Outlook Mizuho Bank Ltd. 13
An impressive question from a reporter As usual, there were also reporters who asked about the “Japan-ization” of the Euro zone. Specifically:
I have been covering the Bank of Japan for 15 years and so I saw Japan slipping into deflation, staying there and suffering from it. I know it is not good to draw a direct link between Japan and the euro area, which is very different for the reasons you set out at your press conference last month, but what are the key lessons you think the euro area could learn from Japan’s experience? I am asking because you say that long-term inflation expectations are well anchored (*cited in refutation of the possibility of a “Japan-ization”). However, inflation expectations are very hard to measure, and even in Japan, long-term inflation expectations have been very stable, even when the country was suffering from deflation. Furthermore, the Bank of Japan introduced zero interest rates and flooded markets with liquidity to beat deflation, but this did not really push up prices. Therefore, I am wondering why cutting rates or introducing any stimulus measures in the euro area would prevent it from slipping into deflation. I would just like to know how the transmission mechanism is different from that in Japan. In other words, the ECB’s refutations of potential “Japan-ization” are unconvincing in the face of the Japanese experience because it uses the ambiguous and changeable “inflation expectations” as the basis for its argument. Once prices begin decreasing, they persist in doing so, and it becomes very difficult to buoy them up again. Therefore, it is dangerous to argue that since everything is fine now, they will continue to be fine in the future. In response to the above question, apart from the argument that “inflation expectations are well anchored,” Mr. Draghi has cited the following: (1) “we have taken early decisive action on the monetary policy front for several years now and are, in fact, still doing so,” (2) “the condition of the balance sheets of both companies and banks in the euro area today is not what it was in Japan at the end of the 1990s and in the early 2000s (in other words, they are not weighed down by bad loans),” and (3) “the percentage of commodities or services, of which the prices are falling, are much lower than they were in Japan when the country was suffering from deflation.” However, caution is necessary in connection with point (2). The Japanese deflation became established after the household and corporate sector balance sheets adjustments were already complete. In fact, even though the private sector (households and businesses) had managed to clean up their balance sheets, their waning appetite for consumption and investment gave rise to deflationary pressures. The key, therefore, is not the present state of the balance sheets but the extent of personal consumption and capital investment that can be drummed up going forward. Also, Mr. Draghi explained the suppression of prices in the case of the Euro zone as taking place against the background of the global factor of the fall in energy prices combined with the impact of EUR strength. As opposed to this, he did not mention the factors that caused prices to fall in Japan, so in that sense, his response to the reporter’s question (about the difference in transmission mechanism) was not straightforward. At the very least, taking into account that JPY appreciation strengthened the tendency toward deflation in Japan, one would like to know the extent to which the ECB sees the buoyancy of EUR to be an experience it shares in common with Japan. Note also that the sovereign debt ownership of banks is increasing even as loans continue to decrease, resulting in the establishment of low interest rates, and that the household sector is experiencing sluggish wage growth – this state of affairs is definitely reminiscent of the Japanese experience. At any rate, this is probably a topic too large to be treated satisfactorily at the press conference following a General Council Meeting.
Euro zone economy now and going forward – Deflation analysis by the European Commission Strengthening of disinflationary pressures worth special mention At the end of February, the European Commission (EC) published its Winter Forecast. For 2014/2015, the real GDP growth rate is forecast to accelerate to 1.2%/1.8%, a slight upgrade from the 1.1%/1.7% projection in the Autumn Forecast, 2013. However, the HICP forecast for 2014/2015 is 1.0%/1.3%, which is a significant downgrade compared with the Autumn Forecast (1.5%/1.4%). It reflects the fact that the fall in prices over the past
Medium-term Forex Outlook Mizuho Bank Ltd. 14
three months has been larger than the EC’s assumptions. The subtitle of the forecast is “Recovery gaining ground” – a tone emphasizing that the economy has finally overcome its negative growth of the past two years. On this point, there is almost no change from the Autumn Forecast last year, which had the subtitle “A slow recovery has set in.” In the final analysis, the point worth special mention is the strengthening of disinflationary pressures.
Euro zone disinflationary tendency explained through three factors The BOX column has focused on the strengthening of disinflationary pressures in an essay titled “Analysing current disinflationary trends in the euro area.” The essay “sheds light on the driving forces behind the current disinflation in the euro area and inquires whether it appears to be a temporary or a more persistent phenomenon.” The essay points out that the recent disinflationary tendency is not simply due to temporary or cyclical factors, but also due to structural factors. It concludes that, even so, the risk of falling into a Japanese-style deflation is low. However, the essay does not show the extent of contribution from each of temporary, cyclical and structural factors, and lacks in argumentative force. First, what are the temporary factors? These are pointed out to be reactions to the increase in indirect taxes and past commodity-price hikes, which are expected to fade away in the coming months. The fact that the increase in indirect taxes implemented in 2013 did not get reflected to the extent assumed is also mentioned as a temporary factor. Note also that the 1.4% HICP for 2013 excluding the impact of the change in tax rates will be downgraded to 1.0%, which means that a HICP rate of under 1.0% for a typical year will soon be a reality in the region.
Cyclical factors - Downward pressure from ULC will continue for some time to come Next I would like to take a look at the downward pressure on prices from cyclical factors, which is said to be almost completely explainable using the unit labor cost (ULC, which is nominal employee wages ÷ real GDP). During the initial stages of economic recovery, cost reduction is prioritized and companies attempt to maintain production (added value, real GDP) levels with lower labor input, so labor productivity (real GDP ÷ total employment) increases, while remuneration per employee (nominal employee wages ÷ total employment) decreases. For as long as this phase continues, downward pressure on prices due to cyclical factors will remain. Based on the analysis, some scope for further improvement in labor productivity remains in the Euro zone at the present time, so this initial stage of economic recovery is very likely to continue for some time to come. After this stage ends, if the economy continues to recover, businesses will increase their employment and employee remuneration will also increase, which will begin to suppress any further increase in labor productivity. As a result, the ULC will increase and the downward pressure on prices from cyclical factors will begin to recede. If one assumes that the economy will steadily recover in the coming months, this cyclical factor can be taken in the broad sense to be a temporary factor, and will be at best a transient risk factor for Euro zone deflation. Structural factors: An increase in the impact from the supply-demand gap and inflation expectations Apart from the aforementioned temporary factors, it has been pointed out that the downward pressure on prices is also due to the structural reforms in peripheral states. For instance, the southern European countries, where the wage adjustment process had become ossified, were forced to implement labor market reforms as a condition for receiving international aid. This made their prices and/or wages more flexibly adjustable compared with the past. However, the essay also contains a hedge clause in the footnotes saying, “It seems, however, too early to draw clear conclusions about the precise impact of these structural reforms on price and wage dynamics,” which leaves one feeling that the discussion on this topic is rather vague (no quantitative data is presented in the form of graphs, either). Rather, the essay focuses on the structural factor of the shrinking supply-demand gap and its effect on prices. As in the April 2013 IMF World Economic Report, which asked in the title of one of its chapters, “The Dog That Didn’t Bark: Has Inflation Been Muzzled or Was it Just Sleeping?”, this essay mentions that the relationship between inflation and unemployment (the Philips curve) was unstable (flat) before the crisis. It also pointed out, however, that if the supply-demand gap becomes a pervasive and persistent phenomenon, the inflation rate will tend to become more sensitive to it. To put it vaguely, the essay points out that prices tend to rise with economic recovery.

Medium-term Forex Outlook Mizuho Bank Ltd. 15
This is likely due to the fact that economies that receive severe shocks are forced to implement structural reforms, which make price and wage adjustment processes more flexible. Specifically, such conclusions (estimates) have been arrived at using explanatory variables such as the Euro zone HICP (inflation rate), crude oil prices (adjusted for forex rate fluctuations), supply-demand gap (derived from the EC’s production function), past inflation rates, and inflation expectations (derived from inflation swaps). In the past two years, in particular, the HICP is thought to have been more sensitive to the supply-demand gap trends, especially in the peripheral states, which can be seen as a sign of the success of structural reforms. What is more, in addition to the supply-demand gap, the essay points out that the impact of inflation expectations also strengthened. In this regard, the essay’s logic resembles that of the ECB in that it maintains that inflation expectations are anchored and that the inflation rate is stable based on the five-year forward break-even rate in five years as derived from inflation swaps. It says, “as the Japanese experience with a long-lasting period of mostly mild deflation since the mid-1990s shows, long-term inflation expectations do not necessarily provide full assurance on future inflation developments.” Specifically, “Most available measures suggest that long-term inflation expectations in Japan (six to ten years ahead) declined only gradually in the early 1990s and remained positive throughout the last two decades, despite a prolonged period of negative or very low inflation.” This is an argument I discussed in the February 14, 2014 issue of Mizuho Market Topic titled “What do inflation expectations mean to the Euro zone? Euro zone inflation expectations as seen from various indicators.” It is not true that Japan’s inflation expectations, unlike the Euro zone’s, had been extremely indicative of deflation. It is true, of course, that in the case of Japan, inflation expectations fluctuated significantly, but this could be because of the difference between the ECB, which has long held a 2% inflation rate to be its target, and the BOJ, which only recently introduced that target. At any rate, it is dangerous to use stable inflation expectations to argue that Euro zone prices are stable. In this regard, I feel that the EC’s analysis is more objective than that of the ECB.
The important point is not whether the HICP is negative or positive The conclusion is that “at least during the current forecasting period, a low inflation rate reflecting low economic growth will continue,” but risk of deflation is being denied based on the argument that, “for deflation to spread through the entire Euro zone and for prices to fall in the manner of a self-fulfilling prophecy, a major shock to the assumptions on which the forecast is based will be necessary.” However, it has also been pointed out that “even if deflation does not take place, an inflation rate consistently below the 2% target of the ECB is not without risks for member states,” and this is an extremely important point. Any suggestion about “Japan-ization” of the Euro zone or “JPY-ization” of EUR is met with the counterargument that “the Euro zone HICP is still positive and does not seem poised to turn negative any time soon,” but the really important point is not whether the HICP is positive or negative. In an economic situation where prices refuse to rise, the actual burden will continue to fall on government and/or private-sector debts, and real interest rates will not fall as expected. If this trend gets preserved for a long period by negative economic growth, it could become a serious drag on the economy during its recovery (as in the case of Japan). Also, in considering the “JPY-ization” of EUR, the main question will be whether the Euro zone inflation rate is high or low relative to other countries. For instance, if the Euro zone inflation rate continues lower than U.S. inflation rates for any length of time, the “JPY-ization” scenario could continue for EUR. The BOX column also attempted a fundamental analysis of the Euro zone current account balance, which increasingly tends toward surpluses, in an essay titled “The cyclical component of current-account balances.” The conclusion of the essay was that the recent current-account surpluses are not a temporary phenomenon but show signs of permanence – peripheral states are not expected to return to the kind of deficits they saw before the crisis. This is important material for any analysis of the “Japan-ization” of the Euro zone.
Daisuke Karakama Market Economist Forex Division Mizuho Bank, Ltd. Tel: +81-3-3242-7065 [email protected]

Medium-term Forex Outlook Mizuho Bank Ltd. 16
These materials and the content of any related presentation are confidential and proprietary and may not be passed on to any third party and are provided for informational purposes only. Assumptions have been made in the preparation of these materials and any such presentation and Mizuho Bank, Ltd. (“Mizuho”) does not guarantee completeness or accuracy of, and no reliance should be placed on, the contents of these materials or such presentation. Nothing in these materials or any related presentation constitutes an offer to buy or sell or trade and the terms of any transaction which may be finally agreed will be contained in the legal documentation for any such transaction, with such transaction being priced at market rates at the relevant time (the rates herein or in any related presentation being purely illustrative). (As a general rule you will not have a right to terminate early any transaction entered into – if you wish to do so, losses may be incurred by you.) These materials and any related presentation should not be considered an assertion by Mizuho of suitability for you of any transaction, scheme or product herein or therein. Mizuho has no duty to advise you on such suitability, nor to update these materials or contents of any related presentation. You must determine in your own judgment the potential risks involved in the transactions outlined herein or in any related presentation (taking professional financial, legal and tax and other advice) and whether or not you will enter into any transaction that may arise from these materials or related presentation. Nothing herein or in any related presentation should be construed as providing any projection, prediction or guarantee of performance or any financial, legal, tax, accounting or other advice. Mizuho shall have no liability for any losses you may incur as a result of relying on the information herein or in any related presentation.