Foreword by the Mayor, Ms. L. Oliphantnc.spisys.gov.za/SIYANCUMA IDP 2015-16 FINAL.docx · Web...
154
0
-
Upload
nguyenthuan -
Category
Documents
-
view
216 -
download
4
Transcript of Foreword by the Mayor, Ms. L. Oliphantnc.spisys.gov.za/SIYANCUMA IDP 2015-16 FINAL.docx · Web...

SIYANCUMA INTEGRATED DEVELOPMENT PLAN (IDP)
FINAL
2015/2016
0

ContentsForeword by the Mayor, Ms. L. Oliphant..............................................................................................9EXECUTIVE SUMMARY....................................................................................................................10Purpose of the IDP............................................................................................................................101. Chapter 1: Background.........................................................................................................111.1. The Legislative Framework and Integrated Development Planning...............................................111.1.1. Introduction...........................................................................................................................111.1.2. Purpose of the IDP’s...............................................................................................................111.1.3. The Legal Requirement for IDPs...............................................................................................111.2. Theoretical Perspective on Development Planning.....................................................................141.2.1. Introduction...........................................................................................................................141.2.2. Overview of the IDP Process: The Strategic Nature.....................................................................141.2.3. Methodology.........................................................................................................................151.2.4 The Process: Public Participation.............................................................................................171.3 CONCLUSION......................................................................................................................182. CHAPTER TWO: SITUATIONAL ANALYSIS............................................................................192.1. Geographical Description of Siyancuma Municipality..................................................................192.1.1 Demographic Overview...........................................................................................................192.2 Socio-Economic Perspective........................................................................................................282.2.1 Employment Status................................................................................................................282.2.2 Level of Education..................................................................................................................292.2.3 Individual Income...................................................................................................................302.3 Health Overview.........................................................................................................................312.4 Overview of the Housing Situation.................................................................................................312.4.1 Type of Dwelling....................................................................................................................312.4.2 Backlogs...............................................................................................................................312.5 Infrastructure and Social Amenities...............................................................................................342.5.1 Transport..............................................................................................................................342.5.2 Energy Supply.......................................................................................................................342.5.4 Refuse Removal....................................................................................................................372.5.5 Water................................................................................................................................... 382.5.6 Sanitation.............................................................................................................................392.5.7 Challenges for Growth and Development...................................................................................402.5.8 Opportunities for Growth and Development................................................................................402.6 Spatial Overview of the Towns in the Siyancuma Local Municipality...................................................41
1

3. CHAPTER THREE: PRIORITIES, VISION & MISSION...............................................................453.1. SIYANCUMA OUTLINES ITS FUTURE AS ENVISIONED BELOW TO BE AS FOLLOWS...................453.1.1. Vision..................................................................................................................................453.1.2. Mission................................................................................................................................453.1.3. Values.................................................................................................................................45The Siyancuma Municipality is anchored in the following fundamental values:............................................453.2. SWOT ANALYSIS......................................................................................................................463.2.1. Strengths.............................................................................................................................463.2.2. Weaknesses.........................................................................................................................473.2.3. Opportunities.......................................................................................................................473.2.4. Threats................................................................................................................................473.4 Strategic Objectives....................................................................................................................493.4.1 Governance..........................................................................................................................493.4.2 Finances...............................................................................................................................493.4.3 Institutional Transformation and Administration...........................................................................503.4.4 Basic Service Delivery and Infrastructure Development...............................................................503.4.5 Local Economic Development..................................................................................................513.5 STRATEGIC OBJECTIVES WITH KEY PERFORMANCE INDICATORS, TIME FRAMES AND RESPONSIBILITIES.........................................................................................................................523.5.1 Basic service delivery and infrastructure development.................................................................523.5.2 Municipal Transformation and Institutional Development..............................................................533.5.3 Local Economic Development..................................................................................................553.5.4 Municipal financial viability and management..............................................................................573.5.5 Good governance and public participation..................................................................................583.6 FEEDBACK FROM THE COMMUNITIES.......................................................................................604. CHAPTER FOUR: INSTITUTIONAL FRAMEWORK...................................................................644.1. Institutional Arrangements........................................................................................................644.2. Committees..............................................................................................................................644.2.1. Council Committees...............................................................................................................644.2.2. Ward Committees..................................................................................................................655. CHAPTER FIVE: PROJECTS.................................................................................................785.1. Municipality’s Development Projects.........................................................................................785.2. DETAILED PROJECT DESIGN....................................................................................................785.2.1. Funded Project List................................................................................................................795.2.2. Unfunded Project List.............................................................................................................80Provision of a mobile ablution block at Riverside School..........................................................................86Construction of a large ablution block at Bongani Primary School.............................................................86
2

Construction of Ablution Block at Plooysburg Primary School...................................................................86Construction of 10 Classrooms, Hall and Nutrition Centre at Bongani Secondary School..............................86Double ECD at VaaL-Oranje Primary School.........................................................................................86Double ECD at Anderson Primary School.............................................................................................86Construction of 10 Classrooms, Hall and Nutrition centre at Bongani Primary School...................................866. CHAPTER SIX: ALIGNMENT AND INTEGRATION....................................................................906.1. Integrated Sector Programmes..................................................................................................906.2. Internal Planning Programmes..................................................................................................916.3. External Policy Guideline Requirements.....................................................................................916.4. Northern Cape Growth and Development Strategy......................................................................916.5. Pixley Ka Seme District Growth and Development Strategy.........................................................926.6. Medium Term Strategic Framework............................................................................................946.7. Institutional Development Plan (IDP).........................................................................................956.7.1. Mandate...............................................................................................................................956.7.2. Powers and Functions............................................................................................................956.8. Water Service Development Plan...............................................................................................966.9. Spatial Development Framework...............................................................................................976.9.1. The Mandate.........................................................................................................................996.9.2. The Role and Purpose of a SDF...............................................................................................996.9.3. Key Spatial Issues in the Municipal Area..................................................................................1006.9.4. Access to land.....................................................................................................................1006.9.5. Land development................................................................................................................1006.9.6. Spatial integration................................................................................................................1006.9.7. Sustainable land management...............................................................................................1006.9.8. Proper distribution network....................................................................................................1006.9.9. Water resource challenges....................................................................................................1016.10. Integrated Disaster Management Plan.................................................................................1016.10.1. Introduction.........................................................................................................................1016.10.2. Purpose..............................................................................................................................1016.10.3. Planning assumptions...........................................................................................................1026.10.4. The effects of disaster...........................................................................................................1026.10.5. Response...........................................................................................................................1036.10.6. The District Municipal Disaster Management Framework............................................................1046.10.7. Disaster Notification..............................................................................................................1056.10.8. Declaration of State Disaster..................................................................................................1066.11. INTEGRATED HIV/AIDS PLAN.............................................................................................107
3

6.12. GENDER EQUITY PLAN......................................................................................................1086.13. THE FINANCIAL MANAGEMENT PLAN................................................................................1096.14. THE INTEGRATED PERFORMANCE MANAGEMENT SYSTEM...............................................1106.15. Integrated Environmental Management Plan........................................................................111CHAPTER SEVEN: CLOSURE.........................................................................................................1127.1 Introduction............................................................................................................................1127.2 Invitation for Comments..........................................................................................................1127.3 Adoption................................................................................................................................112Appendixes:..................................................................................................................................113
List of TablesTABLE 1: PROPOSED MEETINGS............................................................................................................................................18TABLE 2: SETTLEMENT CLASSIFICATION...............................................................................................................................22TABLE 3: LOCAL MUNICIPAL AREAS......................................................................................................................................22TABLE 4: POPULATION BY GROUP.........................................................................................................................................23TABLE 5: DISTRIBUTION OF LAND USE IN SIYANCUMA MUNICIPALITY.................................................................................24TABLE 6: DEVELOPMENT CLUSTERS AND THEIR CHARACTERISTICS......................................................................................25TABLE 7: POPULATION AND AGE STRUCTURE PER TOWN....................................................................................................26TABLE 8: GENDER PER TOWN...............................................................................................................................................26TABLE 9: POPULATION DENSITY OF SIYANCUMA..................................................................................................................27TABLE 10: POPULATION AND HOUSEHOLDS.........................................................................................................................28TABLE 11: UNEMPLOYMENT RATE........................................................................................................................................29TABLE 12: EDUCATION LEVEL................................................................................................................................................30TABLE 13: INDIVIDUAL INCOME 2011...................................................................................................................................30TABLE 14: MUNICIPAL HEALTH INFRASTRUCTURES..............................................................................................................31TABLE 15: TYPE OF DWELLINGS IN SIYANCUMA...................................................................................................................31TABLE 16: SOURCE OF ENERGY FOR COOKING.....................................................................................................................35TABLE 17: ENERGY SOURCE FOR LIGHTING...........................................................................................................................35TABLE 18: ENERGY SOURCE FOR HEATING............................................................................................................................36TABLE 19: REFUSE REMOVAL...............................................................................................................................................37TABLE 20: PIPED WATER INSIDE DWELLINGS.......................................................................................................................38TABLE 21: WATER BY SOURCE...............................................................................................................................................38TABLE 22: SANITATION LEVELS.............................................................................................................................................39TABLE 23: COMMUNITY HALLS.............................................................................................................................................42TABLE 24: CEMETERIES.........................................................................................................................................................43TABLE 25: STRATEGIC ISSUES................................................................................................................................................48TABLE 26: THE COUNCILLORS PROFILE IS AS FOLLOWS:.......................................................................................................64
List of FiguresFIGURE 1: A DIAGRAMMATIC PRESENTATION OF THE IDP PROCESS....................................................................................15FIGURE 2: POPULATION DISTRIBUTION IN MUNICIPAL CONTENTS......................................................................................28
4

FIGURE 3: UNEMPLOYMENT LEVELS.....................................................................................................................................29FIGURE 4: MODE OF TRANSPORT.........................................................................................................................................34FIGURE 5: ENERGY SOURCE FOR COOKING...........................................................................................................................35FIGURE 6: SOURCE OF ENERGY FOR LIGHTING.....................................................................................................................36FIGURE 7: ENERGY SOURCE FOR HEATING............................................................................................................................36FIGURE 8: REFUSE REMOVAL................................................................................................................................................37FIGURE 9: PIPED WATER.......................................................................................................................................................38FIGURE 10: TOILET FACILITIES PER WARD.............................................................................................................................40
LIST OF ABBREVIATIONSABET Adult Basic Education and Training
AGOA Africa Growth and Development Act
AIDS Acquired Immune Deficiency Syndrome
ARC Agricultural Research Council
BEE Black Economic Empowerment
CASP Comprehensive Agricultural Support Program
CIC Creative Industrial Chamber
CMA Catchment Management Agency
CMIP Consolidated Municipal Infrastructure Program
CMS Catchment Management Strategies
CSIR Council for Scientific Investigation and Research
DBSA Development Bank of Southern Africa
DCAS Provincial Department of Cultural Affairs and Sport
DEAT National Department of Environmental Affairs and Tourism
DFEA Department of Finance and Economic Affairs
DFI Development Finance Institutions
DME National Department of Mineral and Energy
DoA Provincial Department of Agriculture
DSDF District Spatial Development Framework
DTI Department of Trade and Industry
DTPW Provincial Department of Transport and Public Works
DWAF National Department of Water Affairs and Forestry
DWAF Department of Water Affairs and Forestry
ECD Early Childhood Development
EPWP Extended Public Works Program
EXCO Executive Committee
FET Further Education and Training
FET Further Education and Training
GDP Gross Domestic Product
GDPR Gross Domestic Product of the Region
GGP Gross Geographical Product
5

GHG Green House Gases, especially carbon dioxide (CO2), also nitrogen oxide (NOs), ozone (O3), methane, water vapour, chlorofluorocarbons (CFCs)
HDI Human Development Index
HDSA Historically Disadvantaged South Africans
HET Higher Education and Training
HIV Human Immune Virus
HOD Head of Department
ICT Information and Communication Technology
IDC Industrial Development Corporation
IDP Integrated Development Plan
IDZ Industrial Development Zone
ISPs Internal Strategic Perspectives
ISRDP Integrated Sustainable Rural Development Program
ITDF Integrated Tourism Development Framework
IWMP Integrated Waste Management Plan
ITP Integrated Transport Plan
IZS Integrated Zoning Scheme
KPIs Key Performance Indicators
LED Local Economic Development
LRAD Land Redistribution for Agricultural Development
LSDF Local Spatial Development Framework
LUPO Land Use Planning Ordinance
MEDS Micro-Economic Development Strategy
MFMA Municipal Financial Management Act
MIG Municipal Infrastructure Grant
MSA Municipal Systems Act
MSP Municipal Support Program
MTEC Medium Term Expenditure Committee
MTEF Medium-Term Expenditure Framework
MTI Municipal Training Institute
MTSF Medium-Term Strategic Framework
MTSF Medium Term Strategic Framework
NAFU National African Farmers Union
NCPGDS Northern Cape Provincial Growth and Development Strategy
NCPIC Northern Cape Provincial Intergovernmental Council
NEPAD New Partnership for Africa’s Development
NHS National Health System
NIHE National Institute of Higher Education
NSDP National Spatial Development Perspective
PC Project Consolidate
PCAS Policy Co-ordination and Advisory Services
6

PDC Provincial Development Council
PDI Previously Disadvantaged Individual
PERO Provincial Economic Review & Outlook
PGDP Provincial Growth and Development Plan
PGDS Provincial Growth and Development Strategy
PHC Primary Health Care
PIC Public Investment Corporation
PIG Provincial Infrastructure Grant
PIMS Planning and Implementation Management Support Centre
PIMSS Planning Implementation Management Support Service
POA Program of Action
PPP Public Private Partnership
PSDS Provincial Spatial Development Strategy
RIFSA Roads Infrastructure Framework for South Africa
SADC Southern African Development Community
SAHRA South African Heritage Resource Agency
SALGA South African Local Government Association
SANBI South African National Botanical Institute
SDF Spatial Development Framework
SDIP Sustainable Development Implementation Plan
SDP Spatial Development Plan – must be consistent with SDF but the decision for approval lies with the municipality
SEA Strategic Environmental Assessment
SIDA Swedish International Development Agency
SIP Strategic Infrastructure Plan
SKEP Succulent Karoo Ecosystem Plan
SMEDP Small Medium Enterprise Development Program
SMME Small, Medium and Micro Enterprises
SMMEs Small Medium and Micro Enterprises
SoER State of the Environment Report
SoEs State Owned Enterprises
STATSSA Statistics South Africa
TISA Trade and Investment South Africa
TLC Transitional Local Council
TRANCAA Transformation of Certain Rural Areas Act (94 of 1998)
SM Siyancuma Municipality
URD Urban and Rural Development
URP Urban Renewal programme
URS Urban Renewal Strategy
VIA Visual Impact Assessment
7

WMA Water Management Area
WSSD World Summit on Sustainable Development – Johannesburg 2002
WWTW Waste Water Treatment Works
8

FOREWORD BY THE MAYOR, MS. L. OLIPHANT It is our pleasure to present to you yet again another Integrated Development Plan (IDP) review. In this regard, I wish to pause and highlight what we were to focus on, in the financial year that was. Specifically we welcomed the fact that the municipality was chosen as a CRDP site in the province. In this regard, the benefits for the Schmidtsdrift community are coming and once more we remain confident that together, we are moving that community forward, and so we do with the rest of the Siyancuma communities.
In the last year we also decided to strengthen our capacity to manage disasters, this because the municipality is located centrally within the district and within the province and thus prone to disasters. We are pleased with this focus, as we have reported fewer disasters compared to the previous years and we highlight that this is due to a partnership approach with government, private sector and communities.
Ladies and Gentlemen of Siyancuma our municipality is rich with agriculture, tourism and mineral resources. This is an advantage we need to maximise in order for us to achieve the aspirations of the people of Siyancuma in full. We committed amongst others to engage more with the mines with a view of getting better cooperation and benefit from the mineral resources. In this instance we are pleased to report that this interaction is continuous and the first fruits of this process can be seen with the upgraded look of our the Douglas town, we hope to expand this effort to other areas. It is our intention to engage stakeholders and resource persons from other sectors.
We convened at our mid-year planning session and agreed on a vision, which is:
“A municipality focused on effective service delivery ‘underpinned’ by economic sustainability” The critical elements of this vision statement are the need to deliver basic services to our communities and at the same time to provide reliable services on the basis of economic development. It is our view that indeed this vision is empowering to all citizens of Siyancuma. We believe that the mere pursuit of this vision, will seek to foster social cohesion on geographical, racial and social lines.
We are close to the terminus of this term of local government and are confident that indeed our communities and specifically our citizens enjoyed the benefits of our focus as a council and municipality. We collectively, as council cherish the ideal of effective service delivery and shall spare no effort in this financial year to make sure that our communities benefit from that.
This IDP, is therefore a tool for your development, own it, embrace it and champion it. In your ward meetings talk about it, ask questions about progress with regards to its implementation and make a noise of its successes.
Thank you, Dankie, Enkosi, Re a leboga.
9

EXECUTIVE SUMMARY
The Siyancuma Municipality forms part of the Pixley Ka Seme District Municipality which is located in the south-eastern part of the Northern Cape Province. The Municipality is made up of three main entities, namely incorporating three urban settlements (Douglas, Griekwastad and Campbell) two restitution areas (Schmidtsdrift and Bucklands), rural areas (Plooysburg, Salt Lake, Witput, Belmont, Graspan, Heuningskloof, Volop), commercial farming areas, small farming areas, the Ghaap Mountain and small private game parks.
The Municipality is characterised by incorporating the confluence of South Africa’s largest rivers, the Orange and Vaal Rivers, with rich mineral deposits (diamonds, tiger’s eye, zink, lead and copper). The municipality has relatively high levels of basic services, partially integrated society, medical facilities in Douglas and Griekwastad, one of the biggest correctional services in the province and is the neighbour to Kimberley, the provincial and legislative capital of the province. It still has major inequalities to overcome and in common with the rest of the country, a skew and sluggish economy to transform and speed up. The themes of this IDP are increasing economic growth, improving community self-reliance, achieving service excellence and sustainability led by strengthened leadership and good governance and a common approach between stakeholders.
Within the municipal boundaries unemployment has increased from 2001 to 2007, 62% of the residents are still unemployed or not economically active. The detailed document outlines a complete overview of the Siyancuma Local Municipality. Its chapters present every aspect as stipulated according to the IDP guide pack. It will inform, guide and asses social, economic, institutional, financial, technical and environmental issues associated with services provision by the municipality.
Purpose of the IDP The IDP has to ensure that departments within National and Provincial Governments, as well as Municipalities, function in concert in the execution of their tasks and delivery of services to communities. The IDP therefore exists to assist the Municipality to fulfil its developmental responsibilities, as it is the aim of every Municipality to improve the quality of life of its citizens. Through the IDP the Municipality can easily identify the problems, issues and needs affecting its municipal area, so as to develop and implement appropriate strategies and projects towards addressing the public’s expectations and problems. The IDP also provides specific benefits for all the stakeholders that are involved in the process.
2015/16 IDP REVIEWThis executive summary for Siyancuma Local Municipality 2015/16 financial year summarizes the comprehensive IDP review document that consists of seven (7) different but interrelated chapters.
10

The chapters are as follows: Chapter 1: The Background Chapter 2: Situation Analysis Chapter 3: Priorities, Vision and Mission Chapter 4: Institutional Framework Chapter 5: Projects Chapter 6: Alignment and Integration Chapter 7: Closure
It is clear that the main thrust of the IDP is, amongst others, to improve governance and accountability within the public sector, improve planning processes by involving communities in the formulation of projects and ensuring that relevant legislation is implemented with a view to improving the living conditions of communities.
11

1.CHAPTER 1: BACKGROUND
1.1. THE LEGISLATIVE FRAMEWORK AND INTEGRATED DEVELOPMENT PLANNING
1.1.1.Introduction
The introduction of democratic rule in 1994 has challenged the local government in South Africa to provide services to the majority of the black population, denied access to social and economic amenities in the past. The national constitution has given rise to a myriad of legislation that is intended to redress the socio-economic disparities created by the apartheid system of government.
With the acceptance of Developmental Local Government in the White Paper on Local Government (1998), Integrated Development Planning was institutionalised through the Municipal Systems Act (2000) as the planning tool to be used by municipalities in furthering their responsibility of service delivery to communities. There are several sector plans that constitute the Integrated Development Plan, a programme which can easily be termed “a business plan of local municipalities”. The main aim of these sector plans is to ensure that delivery and management is undertaken in an orderly and coherent fashion. These include an infrastructure plan; a transport plan; a spatial development framework, to mention just a few.
1.1.2. Purpose of the IDP’s
The IDPs have to ensure that departments within national and provincial governments, as well as municipalities, function in concert in the execution of their tasks and delivery of services to communities. The IDPs therefore exist to assist the municipalities to fulfil their developmental responsibilities, as it is the aim of every municipality to improve the quality of life of its citizens. Through the IDPs the municipalities can easily identify the problems, issues and needs affecting its municipal areas, so as to develop and implement appropriate strategies and projects towards addressing the public’s expectations and problems. The IDP also provides specific benefits for all the stakeholders that are involved in the process.
1.1.3. The Legal Requirement for IDPs
The Constitution of the Republic of South Africa (Act 108 of 1996) has given municipalities a number of developmental responsibilities. The Municipal Systems Act (Act no 32 of 2000) requires all municipalities to compile Integrated Development Plans (IDPs) that will guide all their planning, budgeting and management decisions. Apart from the legislative requirements to compile IDPs, municipalities are also expected to compile sector plans, which should form part of the IDPs. In addition to sector plans, municipalities are also required to
11
incorporate the following aspects into their planning frameworks:
Housing strategies and targets (Housing Sector Plans). Integrated Energy Plans. Integrated infrastructure planning and compliance with guiding principles of
the National Environmental Management Act (NEMA). Environmental Implementation Plans (EIPs) and Environmental
Management Plans (EMPs).
All these legislative requirements are aimed at ensuring that clear and workable plans, reinforcing each other, are in place. The sole purpose is to achieve meaningful development and improvement of the living conditions of citizens.
12

Map 1: Locality Map of Siyancuma Local Municipality
13

1.2.THEORETICAL PERSPECTIVE ON DEVELOPMENT PLANNING
1.2.1.Introduction
Integrated development planning is a result of a world-wide change in the 1980s to concepts such as Urban Management and District Development Planning. This concept of development gained popularity as it became clear that national states were not achieving meaningful developmental results, despite the fact that funds were being spent on projects on a yearly basis.
This was due to the fact that there were no concrete strategies in place which could be used to formulate and quantify projects; identify sources of funding for projects; put in place monitoring programmes on projects; unlock blockages on projects; ensure that projects are completed on time; ensure that projects attain the intended objectives, as well as providing ambiguous account of activities in projects. Development efforts were not coherent and, as a result, meagre resources were being wasted, and so National States and developing countries in particular, were becoming poorer despite huge expenditure on projects.
Integrated Development Planning is directly linked to the concepts of strategic and action planning, which are essentially a reaction to master planning and spatial planning which could not trigger the desired development within the national states.
1.2.2.Overview of the IDP Process: The Strategic Nature
The IDP process is a strategic planning process. Strategic planning itself is not unfamiliar or totally new. Large institutions in the corporate environment, as well as government institutions, often make use of it. It provides those institutions with the opportunity to plan ahead within the framework of available recourses. Municipalities need to go through a similar process to ensure continued provision of necessary services to their communities; deal with poverty, and enhance investment into these areas. At municipal level this process is known as Integrated Development Planning. In South Africa, this has to be done in terms of the Municipal Systems Act, 32 of 2000. The diagram below provides us with an overview of the process.
14

Figure 1: A diagrammatic presentation of the IDP process
1.2.3. Methodology
Policies adopted by the National Government, stipulate that the IDP process consists of 5 phases. Each phase can be broken down into the various steps shown below. The different steps or events that need to be followed in the IDP process are shown below:
Phase 1: Analysis
Session one of the Steering Committee will entail a desk top assessment of the area’s Current Realities (institutional and sectoral realities) including a detail study and research. Problems and issues identified during the assessment of the current realities will be weighed according to their urgency and importance. Consequently, the Priority Issues also focusing on various sector and institutional programmes will be analysed and agreed upon.
Phase 2: Strategies
Session two of the Steering Committee will entail the formulation of a Vision and mission statement indicating the ideal situation the Siyancuma Municipality would like to achieve over the long term. Following the vision statement, Development Objectives will be formulated for each priority issue. The development objectives will indicate what the Municipality would like to achieve in the medium term to address the priority issues and to contribute to the realisation of the vision.
15
During session three, Development Strategies will be identified for each development objective. The strategies will provide the answers on how the Municipality will reach each of these objectives. Should it be necessary, the development priorities will also be revised during the session. Subsequent to the third session of the Steering Committee, general support will be obtained and consensus regarding the priority issues, vision, development objectives and strategies reached via the first feedback session to the IDP Representative Forum.
Phase 3: Projects
Session four of the Steering Committee will include the identification of projects. The projects will have a direct link to the priority issues, objectives and strategies identified in the previous sessions. At the same time preliminary budget allocations per project will be done to ensure a transparent and rational distribution of available resources between priority projects and the routine expenditure of the Council.
Session five of the Steering Committee will include the screening, adjusting and agreeing on projects after which the draft project proposals will be finalised. Subsequent to the fourth session of the Steering Committee, general support will again be obtained and consensus regarding the draft project proposals reached via the second feedback session to the IDP Representative Forum.
Phase 4: Integration
Following the adoption of the draft project proposals, the individual project proposals will be harmonised and integrated in terms of contents, location and timing in order to arrive at consolidated and integrated programmes and plans as required during the sixth and final session of the IDP Steering Committee. Since institutional and sectoral issues will be addressed throughout the process, the documented programmes and plans will only be finalised and adopted during this session.
Phase 5: IDP Summit & Approval
To give notice of the Draft adopted IDP, an advertisement will be published to provide opportunity for comment by the broad public. The Draft IDP will also be circulated to the Governmental Organisations and service providers for comment. An IDP summit will be held that will ensure inter-Municipal co-ordination of the relevant IDP’s. Once all comments received have been evaluated and amendments made accordingly, the Final IDP will be adopted by the Council. The approved IDP will then be submitted to the MEC for Local Government and Housing together with the approved Process Plan for monitoring purposes. A Summary document will be prepared.
Conflict Resolution
If an agreement cannot be reached within the IDP Steering Committee regarding certain planning issues, conflict will have to be resolved by means of a decision within the formal Council. The Council decision regarding the outcome will be conveyed to the Steering Committee for implementation.
16

In severe conflict situations, irrespective of the structure (Council, Steering Committee or Representative Forum) special mediation measures will have to be implemented, utilising an external person or body as a mediator. The proper legitimisation of the public participation process by professional facilitators, as explained in the above Public Participation Plan, is envisaged to reduce conflict.
Monitoring
The Provincial Government (Spatial Planning Directorate) will monitor compliance with the Process Plan.
1.2.4 The Process: Public Participation
Chapter 4 of the Municipal Systems Act stipulates that all municipalities must develop a culture of participatory governance. This implies that municipalities need to ensure that all their residents are at all times well informed about the affairs of the municipality. Opportunities should therefore be created for the general public to take part in the decision making of the council. Since the IDP is the strategic plan of a municipality, indicating the distribution of limited resources, it makes sense to plan with residents in order to ensure that their needs are addressed with a sole purpose of improving their living conditions. Mechanisms must therefore be created to allow residents within a municipality to participate in the planning process of development projects.
In order to comply with the provisions of chapter 4 of the Municipal Systems Act, public participation meetings were held as listed below :
Table 1 : Towns Wards Dates Time Type of Meeting
17

Douglas - 06 May 2015 09H00 Steering Committee
Douglas - 06 May 2015 11H00 Rep Forum
Griekwastad (Matlhomola)
06 11 May 2015 16H00 Community Consultation
Griekwastad (Rainbow valley)
01 12 May 2015 16H00 Community Consultation
Breipaal (Church of Christ)
04 13 May 2015 16H00 Community Consultation
Breipaal (Community Hall)
05 14 May 2015 16H00 Community Consultation
Bongani 03 18 May 2015 16H00 Community Consultation
Schmidtsdrift 02 19 May 2015 11H00 Community Consultation
Campbell 06 19 May 2015 15H00 Community Consultation
Douglas 05 26 May 2015 17H00 Community Consultation
1.3 CONCLUSION
It becomes clear from the above that the main thrust of the IDP is, amongst others, to improve governance and accountability within the public sector, improve planning processes by involving communities in the formulation of projects and ensuring that relevant legislation is implemented with a view to improving the living conditions of communities.
18

2. CHAPTER TWO: SITUATIONAL ANALYSIS
2.1. GEOGRAPHICAL DESCRIPTION OF SIYANCUMA MUNICIPALITY
2.1.1 Demographic Overview
Siyancuma Municipality is a municipality in the Northern Cape Province incorporating three urban settlements (Douglas, Griekwastad and Campbell) two restitution areas (Schmidtsdrift and Bucklands), rural areas (Plooysburg, Salt Lake, Witput, Belmont, Graspan, Heuningskloof, Volop), commercial farming areas, small farming areas, the Ghaap Mountain and small private game parks.
The Municipality is characterised by incorporating the confluence of South Africa’s largest rivers, the Orange and Vaal Rivers, with rich mineral deposits (diamonds, tiger’s eye, zinc, lead and copper). The municipality has relatively high levels of basic services, partially integrated society, medical facilities in Douglas and Griekwastad, one of the biggest prisons in the province and is the neighbour to Kimberley, the provincial and legal capital of the province. It still has major inequalities to overcome and in common with the rest of the country, a skew and sluggish economy to transform and speed up.
The themes of this IDP are increasing economic growth, improving community self-reliance, achieving service excellence and sustainability led by strengthened leadership and good governance and a common approach between stakeholders. The Northern Cape is bordered by the Atlantic Ocean on the west, Namibia on the northwest and Botswana on the north, the Western Cape on the southwest and the Free State on the east. The demarcation process of 2000 resulted in five district municipalities (Frances Baard, Pixley Ka Seme, Namaqua, Siyanda and John Taolo Gaetsewe), twenty-six Category B municipalities and five district management areas.
The Northern Cape is geographically the largest province in South Africa having a land mass increased from 361,830 km² to 373,239 km² with the introduction of the new provincial boundaries and covers approximately one third of the country’s surface area. The population for Siyancuma Local Municipality is 37 076 (StatsSA 2011). The population has decreased by -0.58% (StatsSA 2011) amongst the five districts in the Northern Cape, Frances Baard has the largest population of 382,086. The other districts and their respective populations are Siyanda (236 783), Pixley Ka Seme (186 351), Kgalagadi (224 799) and Namaqua (115 842). The Siyancuma Municipality consists of three urban settlements, namely Douglas, Griekwastad and Campbell, two restitution settlements namely Schmidtsdrift and Bucklands and vast rural areas with family clusters in Salt Lake, Plooysburg, Witput, Belmont, etc. The spatial frameworks of all areas were shaped by their very different histories and this framework will continue to impact on the economic and social lives of the residents for a long time to come. The maps which will
19

follow show the location of Siyancuma in the Northern Cape, and the relative positions of the main towns.
DouglasThis town is situated 100km west of Kimberley on the R375 road that connects Prieska (Siyathemba Municipality) and Kimberley. It has three main residential areas and they are Bongani, Breipaal and the Douglas CBD. The town is also known because of the confluence of the Vaal and Orange rivers. It has summer rainfalls with an annual rainfall average of 315mm per annum. The area’s temperatures vary between 1, 7 degrees Celsius in winter and 34,8 degrees in summer. Douglas is the economic hub of the municipality. It is divided along racial lines by industrial areas and the Vaal River.
Since 1996 the local municipality has spent most of its budget to provide basic infrastructure in the poor areas to catch up with service backlogs, with excellent and visible results. However the influx of unskilled people from farms has and is still continuing. The agriculture sector, community, social and personal service sector is the strongest economic sector and biggest job provider in this town. Key service sector employers include agricultural entities, provincial and local government, education and health facilities, the local prison, services to the agricultural sector and financial services.
The town began as a Mission Station in 1848 on the farm Backhouse, by the Reverend Isaac Hughes. In 1867, a group of Europeans from Griekwastad signed an agreement giving them the right to establish a town. The town was named after General Sir Percy Douglas, Lieutenant Governor of the Cape Colony. The town is near the confluence of the Orange River and its main tributary, the Vaal River and surrounded by a wealth of agricultural and stock farming ventures.
Douglas is identified as the Urban Centre within Siyancuma municipal area and should be further developed as an agriculture centre. The town is located in the centre of the Municipal area, close to the confluence of the Orange and Vaal Rivers. Residential areas include Bongani, Breipaal and Douglas CBD. Recreational facilities include a golf club, holiday resort, Private Holiday resort and several other sport facilities. Community services include 2 community hall, a hospital, 2 clinics, 8 primary schools, 1 intermediate school and 3 high schools. Government is also well represented with a post office, police station, prison, magistrate’s court, home affairs offices, agriculture field office as well as population development service offices. The commercial sector is well represented with 3 banks and businesses like GWK and Sidi Parani. Accommodation is available in a hotel and several guest houses.
GriekwastadGriekwastad is situated 150km west of Kimberley on the main route between Kimberley and Upington. It is also ideally situated on the route to Witsand and the Siyanda District, thus making it ideal for the development of the town into a tourist stopover in future. There are four main residential areas in the town and they are Matlhomola, Rainbow Valley, Charlesbeespark and Griekwastad CBD.
20
Griekwastad is the most racially integrated town in the municipality with very low economic activity.
As in the case of Douglas, the local municipality, since 1996, spent most of its budget to provide basic infrastructure in the poor areas to catch up with service backlogs, with excellent and visible results. However the influx of unskilled people from farms has, and is still continuing. The agriculture sector, community, social and personal service sector is the strongest economic sector and biggest job provider in this town. Key service sector employers include agricultural entities, provincial and local government, education and health facilities, services to the agricultural sector.
In 1803, the London Missionary Society extended its mission north of the Orange River and the place called Klaarwater became Griekwastad. The town had to accommodate a mixed community consisting of members of a Chaguriqua tribe and a mixed group from Piketberg, and local tribes like the Koranna and Tswana. The two leaders were Adam Kok II and Andries Waterboer. In 1813 they became known as Griqua at the instigation of Rev. John Campbell.
Because of disputes between the two leaders, the Kok faction left Griquatown for Philippolis and Kokstad. When diamonds were discovered the Griqua were one of the parties claiming that the Diamond Fields lay within their territory. The area was awarded to Waterboer by the Keate arbitration who immediately sought Crown protection. This led to the establishment of the colony of Griqualand West, which was later annexed to the Cape Colony. The first council chamber of the Griqua, and the execution tree where Waterboer hanged criminals, can be visited in Water Street. Griquatown is known for its semiprecious stones, tiger’s eye and jasper and is also a centre for stockbreeding.
Griekwastad is located in the northern corner of Siyancuma Municipality and on the main route between Kimberley and Upington. The town is classified as a Rural Service Centre and serves the surrounding rural area. Residential areas of Griekwastad include Matlhomola, Rainbow Valley, vaalblock, Griekwastad CBD and newly established area residential area between Mathlomola and vaal block and Griekwastad CBD. The town is a popular as a tourist stopover, and the most racially integrated town within the municipality.
Griekwastad is lacking recreational facilities and community services in the town include 2 libraries, a day hospital, 1 primary school, 1 intermediate school and 1 high school. Government is presented by a post office, police station, magistrate court and social development office. The commercial sector is represented by guest houses, restaurant and shops
CampbellCampbell is situated 104km west of Kimberley between Kimberley and Griekwastad on the route to Upington. The surface area is about 900ha and the majority of the people in the area are the Griekwas. As in the case of Douglas and Griekwastad, the local municipality, since 1996, spent most of its budget to provide basic infrastructure in the poor areas to catch up with service backlogs.
21

The agricultural sector, community, social and personal service sector are the strongest economic sector and biggest job provider in this town. Key service sector employers include agricultural entities, provincial and local government, education facilities. Douglas which is 30 km from Campbell, is the business centre for the people of Campbell. Children attend secondary school in Douglas. People have to travel to Douglas for doctors and other personal services at great costs.
According to a study done (Socio-economic profile) by the Pixley Ka Seme District Municipality, Campbell is the poorest community in the Municipality and one of the poorest in the country. Campbell has a strong rural character and is mainly a dormitory town for workers in Douglas and elsewhere. Campbell (a village, on the edge of the Ghaap Plateau), was one of the earliest centres of Christianity north of the Orange River. Original names were Grootfontein or Knoffelvallei, but the town was renamed to honour the Reverend John Campbell, a traveller and missionary who visited the Cape stations of the London Missionary Society in 1813. The town is known for its spectacular dolomite rock formations, many springs and Karee and Wild Olive trees. Campbell has been home to San, Koranna and, later Griqua settlers drawn by the springs.
Table 2: Settlement Classification Settlement Populati
onHousing backlog
Municipal Classificati
on
Economic Base
Potential and Need
Investment type
DOUGLAS Large 2550 Urban centre
Agriculture High development & high need
Infrastructure & Social
GRIEKWASTAD Medium 513 Rural Service Centre
Service Centre
Transition Infrastructure & Social
CAMPBELL Low 190 Rural Service Centre
Mining High development & high need
Social
Source: PKS SDF 2014
2.1.2 Local Municipality Land Coverage
Table 3: Local Municipal AreasMUNICIPALITY KM² %
OF DM
% OF NORTHERN CAPE
PERSONS/ KM²
HOUSEHOLDS/ KM²
Pixley Ka Seme
103 410 28% 28% 1.8 3.7
Siyancuma 16.753 16.2 3% 2.2 3.8
StatsSA Census 2011
22

The table above shows the land cover of Siyancuma Municipality and in relation to the District Municipality. Siyancuma Local Municipality covers (16.2%) of the land within the District (28%) and of the Northern Cape (3%)
2.1.3 Population by Group
Table 4: Population by Group
StatsSA Census 2011
Table above represents population by group in Siyancuma Local Municipality. Ward 4 has the most residents whilst ward 5 has the least. Furthermore the table shows that the dominant race is coloured (21 301) followed by black Africans (12 221).
Smaller Settlements on Privately-owned Land (Rural Villages)The smaller settlements in the municipal area are: Plooysburg, Belmont, Witput, Volop and Salt Lake. The total population in these towns is estimated to be below 1,000 people. The settlements have poor linkages with the rest of the towns in the municipal area and the province. Plooysburg is situated on a private land which belongs to the Dutch Reformed Church. Water services in Plooysburg have been and are still administered and provided by the church council.
Witput, Belmont and Graspan are small railway towns where most of the land and water services infrastructure are owned by Spoornet, the rail parastatal. Spoornet stopped the provision of water services since alienation of the smaller railway stations some years ago. The remaining households in Belmont, Witput, Graspan and a portion in Salt Lake presently depend on private landowners in the area to obtain water supplies.
The municipality, however as the water services authority (WSA) engaged on this matter and started negotiations with Transnet Housing on the transfer of ownership of houses and infrastructure. Although these negotiations are still ongoing the municipality is proving basic service like water service to the area.
Salt Lake is a privately owned farm with a salt manufacturing plant. The community resides on two farms, Saratoga and Sunnydale. Both owners of the
23
Ward Black African
Coloured Indian/Asian White Other Total
Ward 1 948 4373 41 466 134 5962Ward 2 2697 1663 21 400 32 4813Ward 3 4768 2182 18 3 28 6999Ward 4 1330 6602 108 35 98 8173Ward 5 487 3358 26 794 85 4750Ward 6 1991 3123 36 1079 150 6379
Siyancuma 12221 21301 250 2777 528 37076

farms presently provide water services and housing to residents that have been living in the area for years.
Proposals were also made and negotiations started on the transfer of ownership of the houses to residents. The matter is currently taken up with the provincial Department of Cooperative Governance, Human Settlements and Traditional Affairs (CoGHSTA).
Farm Settlements (Other Privately-Held Farmland)Farm settlements are comprised of very small settlements scattered over the Hay and Herbert Magisterial districts and Vaal River areas. Households are made up of mostly farmers, farm workers and their families. Landowners are providing water services to the households. It is also believed that some farm worker families get water from the river. Table below gives a rough indication of the land uses in the municipal area.
Table 5: Distribution of Land Use in Siyancuma MunicipalityDescription Percentage
Towns and Settlements Less than 5%
Farm and Agricultural land Plus 90%
Other (mining, resorts etc.) Less than 5%
StatsSA Census 2011
Restitution Settlements (Rural Villages)There are two restitution settlements in Siyancuma, namely, Schmidtsdrift and Bucklands. The title deeds for both Schmidtsdrift and Bucklands were recently handed over to the community by the Department of Land Affairs. Households in Schmidtsdrift occupy formalised sites in the area. The Municipality presently provides water services to more than 800 households in Schmidtsdrift.
The process of town establishment is finalized and was driven and funded by the Department of Land Affairs through the Land Claims Commission. The community participated successfully through workshops and influenced the whole process positively to their satisfaction.
The Bucklands restitution consists of 21 farms of which 9 belonged to the state have been finalised the process to the claimants are still ongoing. The majority of the claimants relocated themselves on an informal area on part of the land. Water services are currently provided partly by the municipality and landowners. However there are no basic sanitation services in the area.
The claimants through their communal property association (CPA) excluded the municipality from development and planning in this restitution and very little progress, if any, has been made. The Land Claims Commission (LCC) applied for administration of the restitution since claimants could not agree on a plan of action and developed different factions.
24
2.1.4 ClustersThe Siyancuma Municipality has been grouped into 5 clusters for the purpose of development. These are shown in table below.
Table 6: Development Clusters and their CharacteristicsCluster No of
wardsWards covered
Area Settlement type
A 3 3,4,5 Breipaal, Bongani
Douglas CBD, Erwe,
Bucklands
High densityHigh DensityLow density
B 2 1,6 Griekwastad CBD
Matlhomola, Rainbow Valley,
Vaal Block
High densityHigh densityHigh density
C 2 2,6 Schmidtsdrift,
Campbell
Medium DensityMedium density
D 1 2 Salt Lake,
Witput, Belmont, Graspan, heuningneskloof, plooysburg, Olierivir, vaalas, Rietrivier, Research Station
RuralRuralRuralRural
E 4 1,3,4,5 Farms Low density
StatsSA Census 2011
2.1.5 The Siyancuma PopulationMunicipality 2001 2011
Siyancuma Municipality 39275 37076
StatsSA Census 2011
The population of Siyancuma Municipality decreased from (39275) in 2001 to (37 076) in 2011. Below are some key information relating to the population within the municipal areas.
25

Table 7: Population and Age Structure per town Age Ward 1 Ward 2 Ward 3 Ward 4 Ward 5 Ward6 Siyancuma
Total Total Total Total Total Total Total0 - 4 655 591 823 999 443 645 41565-9 586 518 724 949 467 632 387710-14 637 473 678 940 491 550 377015 - 19 581 369 723 834 448 588 354320 - 24 448 388 632 677 354 543 304125 - 29 486 382 682 663 365 566 314430 - 34 369 343 485 531 297 524 254935 - 39 352 311 435 511 339 429 237740 - 44 383 277 426 478 308 372 224445 - 49 318 270 363 432 263 364 201050 - 54 293 229 290 319 210 319 166155 - 59 239 195 244 275 230 261 144460 - 64 170 147 177 195 175 181 104565 - 69 143 118 108 148 142 138 79770 - 74 92 75 85 109 91 96 54875 - 79 82 55 71 65 57 77 40680 - 84 68 35 23 23 32 57 23885 + 58 38 27 25 38 39 225
StatsSA Census 2011
2.1.6 Gender
The percentage of males in relation to females in the municipal area stayed more or less the same with 100.2% males to females in 2001 and 100.4% in 2011
Table 8: Gender per townWards Male Female Total Ward 1 3030 2932 5962 Ward 2 2457 2356 4813 Ward 3 3445 3554 6999 Ward 4 3998 4175 8173 Ward 5 2319 2431 4750 Ward 6 3322 3057 6379Siyancuma 18570 18505 37076
StatsSA Census 2011
From the table above, it is very clear that Siyancuma Local Municipality has more males than females, but the margin is very small.
2.1.7 Major components of population change
The preparation of population estimates is a comprehensive demographic enterprise involving the consideration of the three major components of population change, being: - fertility, mortality and migration. A number of demographic components can, and have proved to influence the size and structure of a region’s population. The following are the most important:
o Natural increase (or decrease): The surplus (or deficit) of births over deaths in a population in a given time period.
26
o Fertility refers to the actual reproductive performance of a population. It differs from fecundity, the physiological capability of couples to reproduce. Fertility, the number of live births occurring in a population, is affected by fecundity and also by the age at marriage, or cohabitation; the availability and use of contraception; economic development; the status of women, and the age-sex structure.
o Mortality refers to deaths that occur within a population. While death is inevitable, the probability of dying is linked to many factors, such as age, sex, race, occupation, and social class, and the incidence of death can reveal much about a population ‘s standard of living and health care.
o Migration is the movement of population, - the movement of a people across a specified boundary, for the purpose of establishing a new residence. Along with fertility and mortality, migration is a component of population change. The terms immigration and emigration are used to refer to moves between countries (international migration). The parallel terms in-migration and out-migration are used for internal movement between different areas within a country (internal migration).
2.1.8 Population Density
Census 2011 classifies settlements according to the characteristics of a residential population in terms of urban and rural, degree of planned and unplanned (in the case of urban) and jurisdiction (in the case of rural). The four broad settlement types found in South Africa are:
Formal urban areas;
Informal urban areas;
Commercial farms;
Tribal areas and rural informal settlements.
Population density is a key factor in determining the provision of infrastructure and services.
Table 9: Population Density of Siyancuma Type of Dwelling Schmidtsdrift Campbell Griekwastad Douglas Riet River Belmont
Formal residential 387 546 1374 3921 - 6Informal residential - - 123 564 - -
Total 387 546 1497 4488 - 6 StatsSA Census 2011
2.1.9 Population and Households
27

Table 10: Population and householdsType of Dwelling Campbell Griekwastad DouglasPopulation 2181 6420 20085
Households 546 1497 4485
Total 2727 7917 24570 StatsSA Census 2011
2.1.9 Population Distribution in Municipal Contents
Figure 2: Population Distribution in Municipal Contents
[Less than 15 years 32%
[15-64 years]62%
[65+ years]6%
Population Distribution in 2011 in Siyancuma Municipality
StatsSA Census 2011The population of Siyancuma Municipality is dominated by people aged 15>64 by 62%, people less than 15 years by 32% and 65+ people by 6%. The major contribution of the decline or decrease on the population is mortality rate. The death rate has increased more because of HIV AIDS, TB and other diseases.
2.2 SOCIO-ECONOMIC PERSPECTIVE
2.2.1 Employment Status
Employment status refers to whether a person is employed, unemployed or not economically active. The two categories of employment and unemployment together constitute the economically active category. The category of not economically active constitutes all those who are currently not regarded as part of the labour force e.g. scholars, housewives, pensioners, disabled, those not wishing to work, etc.
Table 11: Unemployment Rate
Ward Employed Unemployed Not economically active Unemploy
ment rate
28

Male Female Total Mal
eFemale
Total Male Female Total %
Ward 1 866 536 1401 239 241 480 725 1033 1758 25.5
Ward 2 893 397 1290 155 201 356 446 819 1265 21.6
Ward 3 777 495 1272 387 430 817 987 1383 2370 39.1
Ward 4 799 462 1261 270 298 568 1324 1762 3086 31.1
Ward 5 750 519 1269 132 153 285 609 826 1435 18.3
Ward 6 933 520 1453 283 328 611 972 1110 2082 29.6
Siyancuma 5018 2928 7946 1467 1652 3118 5063 6932 11995 28.2
StatsSA Census 2011
Figure 3: Unemployment Levels
Employed Unemployed Not economically active 0
2000
4000
6000
8000
10000
12000
14000
Employment Status
Ward 1 Ward 2 Ward 3 Ward 4 Ward 5 Ward 6 Siyancuma
StatsSA Census 2011
The official unemployment rate has increased from 25.3% in 2001 to 28% in 2011. The unemployment rate is the highest in ward 3 and the lowest in ward 5.
2.2.2 Level of Education
The table below presents the level of education of Siyancuma Municipality’s labour force; the level of primary schooling is overall higher, Secondary education completed is overall lower than both the province and national level of education. The tertiary levels of education are the lowest, with 3% in the rural areas the highest for the municipality.
The table below illustrates the level of education within the Siyancuma Municipality:
Table 12: Education level Ward No Some Completed Some Grade Higher
29

Schooling Schooling
Primary Secondary 12
Ward 1 717 1670 408 1411 539 205 Ward 2 691 1633 335 1059 339 160 Ward 3 768 2202 502 1918 689 94 Ward 4 918 2702 635 2093 753 68 Ward 5 385 1353 259 1148 826 333 Ward 6 571 1810 387 1630 720 293 Siyancuma
4050 11370 2527 9259 3867 1153
StatsSA Census 2011The levels of primary education of pupils in grades 0-7 and 8-12 are dominant in all towns. The levels of tertiary education are the lowest and the major contributing factor is poverty and lack of tertiary institutions within the Municipality.
2.2.3 Individual Income
Individual income is a parameter which is, amongst others, also indicative of poverty levels within a community. A financially healthy community’s household income usually displays a so-called “normal” income distribution pattern where the income is spread over a fairly wide range of income categories, and the income of the bulk of the community is situated more or less within the first half to two thirds of the income category range. Poor communities are sometimes highly dependent on the environment for coping and survival purposes and, in this regard, almost always over-exploits the environment.
Table 13: Individual Income 2011Individual monthly income Ward 1 Ward 2 Ward 3 Ward 4 Ward 5 Ward 6
SiyancumaNo income 1915 1606 3285 4408 2131 2304 15649R 1 - R 400 1432 1113 1199 1260 384 1080 6469R 401 - R 800 262 241 207 304 144 281 1438R 801 - R 1 600 1210 949 1320 1188 828 982 6477R 1 601 - R 3 200 258 325 299 357 246 297 1782R 3 201 - R 6 400 178 162 173 141 165 222 1042R 6 401 - R 12 800 114 74 128 93 230 233 872R 12 801 - R 25 600 111 63 42 52 182 148 599
R 25 601 - R 51 200 22 25 5 12 58 49 171
R 51 201 - R 102 400 8 1 - 5 9 8 31
R 102 401 - R 204 800 - 4 - 3 6 5 18
R 204 801 or more 1 4 1 1 6 7 20StatsSA Census 2011
2.3 HEALTH OVERVIEW
30

The sectoral approach that was adopted to analyse the present health facilities of the Pixley Ka Seme district revealed that the National Government has adopted a primary health care strategy that includes making such services available within walking distance of communities. The strategy also includes improvement in sanitation and drinking water supply, etc. Thus the health care systems that presently exist in the District consist of:
Provincial Hospitals Community Health Care Centres
Table 14: Municipal Health Infrastructures
Towns Hospitals/ CHC ClinicsSchimidsdrift - 1 (Mobile)
Campbell - 1
Griekwastad 1 1
Douglas 1 2
Total 2 5Source: Siyancuma Municipality
2.4 OVERVIEW OF THE HOUSING SITUATION
2.4.1 Type of Dwelling
Table 15: Type of Dwellings in Siyancuma
WardType of dwelling Type of dwelling %
Formal dwelling
Informal dwelling
Traditional dwelling
Other Total Formal
dwellingInformal dwelling
Traditional dwelling
Other Total
Ward 1 1408 159 5 5 1578 89.3 10.1 0.3 0.3 100
Ward 2 1027 448 40 33 1547 66.4 28.9 2.6 2.1 100
Ward 3 992 612 1 40 1645 60.3 37.2 0.1 2.5 100
Ward 4 1023 784 - 14 1821 56.2 43.1 - 0.8 100
Ward 5 1174 59 2 10 1244 94.4 4.7 0.1 0.8 100
Ward 6 1366 318 23 36 1743 78.4 18.2 1.3 2.1 100
Siyancuma
6990 2379 71 138 9578 73 24.8 0.7 1.4 100
StatsSA Census 2011
31

2.4.2 BacklogsBACKLOGS (HOUSING, WATER, SANITATION AND ELECTRICITY) AS IN MAY 2015
TOWN WARD LOCALITYNUMBER OF UNITS
HOUSING PROGRAM
LAND PREPARATION AND
PLANNING
ENGINEERING SERVICES (WATER &
SANITATION)
KEYISSUES
ELECTRICITY[JURISDICTION]
DOUGLAS 4 Breipaal : Dalton Plakkers
177 TOPSTRUCTURES
Planning, land surveying and pegging completed.
Internal services completed.
Ready for top structures.
YES[Municipality]
DOUGLAS 4Breipaal :
Akkerlaan Plakkers 86TOP
STRUCTURESSG Plan of 1991 to be recalled first, and new layout plan be approved.
Internal services completed.
Title deeds recalled.Geotech done.Busy with layout plan.EIA exemption submitted to DENC.
YES[Municipality]
BONGANI 3 Bongani :Infills
200 TOPSTRUCTURES
Planning, land surveying and pegging completed.
Internal services completed.
Building of top structures on-going.
YES[Municipality]
GRIEKWASTAD
1 Rainbow Valley 34 TOPSTRUCTURES
Planning, land surveying and pegging completed.
Internal services completed.
Ready for top structures.
NO[Escom]
6 Mathlomola 23TOP
STRUCTURESPlanning, land surveying and pegging completed.Unoccupied.Beneficiaries identified.Re-pegging needed.
Internal services completed.
Ready for top structures.
NO[Escom]
1 Rainbow Valley 13 TOPSTRUCTURES
Planning, land surveying and pegging completed.
Internal services completed.
Ready for top structures.
NO[Escom]
SCHMIDTSDRIFT
2 Zone 4 539TOP
STRUCTURESPlanning, land surveying and pegging completed.
Sewer network completed.Water network to be completed by end of June 2015.
61 houses built in phase 1.Water connections a challenge.Extra funding needed.
322 stands electrified in 2006. 278 outstanding.Capacity should be enough once ESCOM commission the new sub-station.
2 Zone 5 161TOP
STRUCTURESPlanning, land surveying and pegging completed.
Water network completed.
39 houses built in phase 1.Challenge = grey water.Chemical pit toiletsare used.
Bulk line from Zone 5 completed.Installation of house connections will commence in 2015/16 FY.
31

CAMPBELL 6Area adjacent to
landfill site 190TOP
STRUCTURESPlanning, land surveying and pegging completed.
Internal services partially completed.
Ready for top structures once services are completed
YES[Escom]
TOWN WARDPROJECT
DESCRIPTION(LOCALITY)
NUMBER OF UNITS
HOUSING PROGRAM
LAND PREPARATION AND
PLANNING
ENGINEERING SERVICES (WATER &
SANITATION)
KEYISSUES
ELECTRICITY[JURISDICTION]
GRIEKWASTAD6
Area between Vaalblok and Mathlomola
457 INTERNALSERVICES
(Water & Sewer connections)
Planning, land surveying and pegging completed.
Installation of services part of bucket eradication program. To be completed end of June 2015.
Top structures to be built once internal services are completed.
214 stands completed.90 stands current.152 stands to be connected in 2015/16 FY.
DOUGLAS 4Breipaal :
New Dalton Plakkers
282INTERNALSERVICES
(Water & Sewer connections)
Planning, land surveying and pegging completed.
Installation of services part of bucket eradication program. To be completed end of June 2015.
Top structures to be built once internal services are completed.
YES[Municipality]
DOUGLAS 4Breipaal : MidblockPlakkers
320INTERNALSERVICES
(Water & Sewer connections)
Planning, land surveying and pegging completed.
Installation of services part of bucket eradication program. To commence in 2015/16 FY.
Top structures to be built once internal services are completed.
YES[Municipality]
DOUGLAS
4Breipaal : WeslaanPlakkers
49INTERNALSERVICES
(Water & Sewer connections)
Planning, land surveying and pegging completed.
Installation of services part of bucket eradication program. To commence in 2015/16 FY.
Top structures to be built once internal services are completed.
YES[Municipality]
5Breipaal :
Poppiestreet Plakkers
19INTERNALSERVICES
(Water & Sewer connections)
Planning, land surveying and pegging completed.
Installation of services part of bucket eradication program. To commence in 2015/16 FY.
Top structures to be built once internal services are completed.
YES[Municipality]
5Breipaal : AthertonPlakkers
65INTERNALSERVICES
(Water & Sewer connections)
Planning, land surveying and pegging completed.
Installation of services part of bucket eradication program. To commence in 2015/16 FY.
Top structures to be built once internal services are completed.
NO[Municipality]
32

4 Breipaal :MadibasPlakkers
18INTERNALSERVICES
(Water & Sewer connections)
Planning, land surveying and pegging completed.
Installation of services part of bucket eradication program. To commence in 2015/16 FY.
Top structures to be built once internal services are completed.
YES[Municipality]
DOUGLAS 3Bongani :
Riemvasmaak 405INTERNALSERVICES
(Water & Sewer connections)
Planning, land surveying and pegging completed.
Installation of services part of bucket eradication program. To commence in 2015/16 FY.
Top structures to be built once internal services are completed.
Partially[Municipality]
TOWN WARDPROJECT
DESCRIPTION(LOCALITY)
NUMBER OF UNITS
HOUSING PROGRAM
LAND PREPARATION AND
PLANNING
ENGINEERING SERVICES (WATER &
SANITATION)
KEYISSUES
ELECTRICITY[JURISDICTION]
DOUGLAS 3Bongani :
Area next to Bosman Canal
150INTERNALSERVICES
(Water & Sewer connections)
Planning, land surveying and pegging completed.
Installation of services part of bucket eradication program. To commence in 2015/16 FY.
Top structures to be built once internal services are completed.
NO[Municipality]
DOUGLAS 3Bongani :
PhomolongPlakkers
31INTERNALSERVICES
(Water & Sewer connections)
Planning, land surveying and pegging completed.
Installation of services part of bucket eradication program.COMPLETED.
Top structures to be built once internal services are completed.
YES[Municipality]
DOUGLAS 3Bongani :
Area next to reservoirs
50 INTERNALSERVICES
(Water & Sewer connections)
Planning, land surveying and pegging completed.
Installation of services part of bucket eradication program.COMPLETED.
Top structures to be built once internal services are completed.
YES[Escom]
TOTAL 3269
33

2.5 INFRASTRUCTURE AND SOCIAL AMENITIES
2.5.1 Transport
Transport includes activities such as, providing passenger or freight transport by rail, road, water or air, auxiliary activities such as terminal parking facilities, cargo handling and activities, and postal activities and telecommunication.
The people in town use micro-busses, private cars as well as walking to go to their places of employment.
As far as public taxis are concerned they operate mostly during the morning hours when the workers are going to work and in the afternoons when they are going back from work to their respective homes.
Figure 4: Mode of Transport
On foot; Series1; 12647; 75%
By bicycle; Se-ries1; 272; 2%
By car as a driver; Series1; 1259; 7%
By car as a passenger; Series1; 1425; 8%
By minibus/taxi; Series1; 238; 1%
By bus; Series1; 796; 5%
Other; Series1; 129; 1%
StatsSA Census 2011
2.5.2 Energy Supply
Electricity appears to be in good supply and widely available throughout the Municipal Area. However, electricity and electrical appliances, and their maintenance and usage, cost money which the poor cannot always afford. To them, wood as energy/fuel source for cooking and heating remains the best option
34

Table 16: Source of energy for cookingWard Electricit
yGas
Paraffin
Wood
Coal
Animal dung
Solar
Other
None
Total
Ward 1 1035 118 17 400 3 - 6 - - 1578
Ward 2 919 82 31 504 7 - - - 4 1547
Ward 3 1431 57 51 95 1 - - - 11 1645
Ward 4 1513 58 58 179 4 1 2 - 6 1821
Ward 5 1107 44 5 86 - - - - 3 1244
Ward 6 1176 110 44 407 - - - - 5 1743
Siyancuma
7180 470 206 1670 16 1 8 - 28 9578
StatsSA Census 2011
Figure 5: Energy source for cooking
Electricity
Gas
Paraffin
Wood
Coal
Animal dung
Solar
Other
None
Total
0 2000 4000 6000 8000 10000 12000
Energy Source for Cooking
Siyancuma Ward 6 Ward 5 Ward 4 Ward 3 Ward 2 Ward 1
Although relatively expensive, paraffin and gas are used on a limited scale for cooking and heating. Animal dung also features on a limited scale as energy/fuel source for cooking and heating in some rural areas, wood as well also feature in most areas. The use of wood as energy/fuel source for cooking and heating, to whatever scale, is of major concern. It is almost 100% certain that all the wood used in the municipal area for these purposes comes from the indigenous, and in some cases also protected vegetation, i.e. Camel Thorn (Acacia erioloba) trees, and that harvesting is not done in a sustainable way.
Table 17: Energy source for lighting Ward Electricity Gas Paraffi
nCandles Solar None Total
Ward 1 1201 3 5 316 50 3 1578 Ward 2 1135 - 15 385 7 5 1547 Ward 3 1485 2 2 149 3 5 1645 Ward 4 1550 1 7 248 4 10 1821 Ward 5 1179 - - 60 - 5 1244 Ward 6 1322 1 7 394 10 9 1743 Siyancuma
7872 7 36 1552 74 37 9578
StatsSA Census 2011
35

Figure 6: Source of energy for lighting
Wa r d 1
Wa r d 2
Wa r d 3
Wa r d 4
Wa r d 5
Wa r d 6
Si y
an c u ma
0
2000
4000
6000
8000
10000
12000
Electricity Gas Paraffin Candles Solar None Total
StatsSA Census 2011
Table 18: Energy Source for heatingWard Electricit
y Gas Paraffin Wood Coal Animal
dung Solar Other None Tota
l Ward 1 619 27 7 823 19 - 6 - 78 1578
Ward 2 504 30 12 907 10 2 5 - 78 1547
Ward 3 1147 16 14 217 20 1 1 - 229 1645
Ward 4 1164 12 6 528 21 1 4 - 85 1821
Ward 5 852 15 3 309 1 - 2 - 63 1244
Ward 6 826 28 14 696 21 - 3 - 155 1743 Siyancuma
5112 127 56 3479 92 4 21 - 688 9578
StatsSA Census 2011
Figure 7: Energy Source for heating
Electric-ity
Gas Paraffin Wood Coal Animal dung
Solar Other None Total 0
2000
4000
6000
8000
10000
12000
Energy Source for Heating
Ward 1 Ward 2 Ward 3 Ward 4 Ward 5 Ward 6 Siyancuma
36

2.5.3 Rainfall
The combination of low rainfall, relatively high population densities and the fact that most of the indigenous vegetation in the area is slow growing, have already resulted in over-utilization of this renewable natural resource in certain places. Of major concern in this respect is wood harvesting and usage in the rural areas.
2.5.4 Refuse Removal
Table 19: Refuse removal
Ward
Removed by local
authority/private
company at least once a
week
Removed by local
authority/private
company less often
Communal refuse
dump
refuse dump
No rubbish disposal
Other Total
Ward 1 1009 5 16 472 71 6 1578 Ward 2 35 41 49 1073 306 43 1547 Ward 3 1421 15 3 199 7 1 1645 Ward 4 1728 2 8 68 14 2 1821 Ward 5 885 6 2 226 115 9 1244 Ward 6 885 40 33 534 226 24 1743 Siyancuma
5963 109 111 2571 740 85 9578
StatsSA Census 2011
Figure 8: Refuse Removal
0400800
120016002000
Refuse Removal in Wards
Ward 1 Ward 2 Ward 3 Ward 4 Ward 5 Ward 6
37
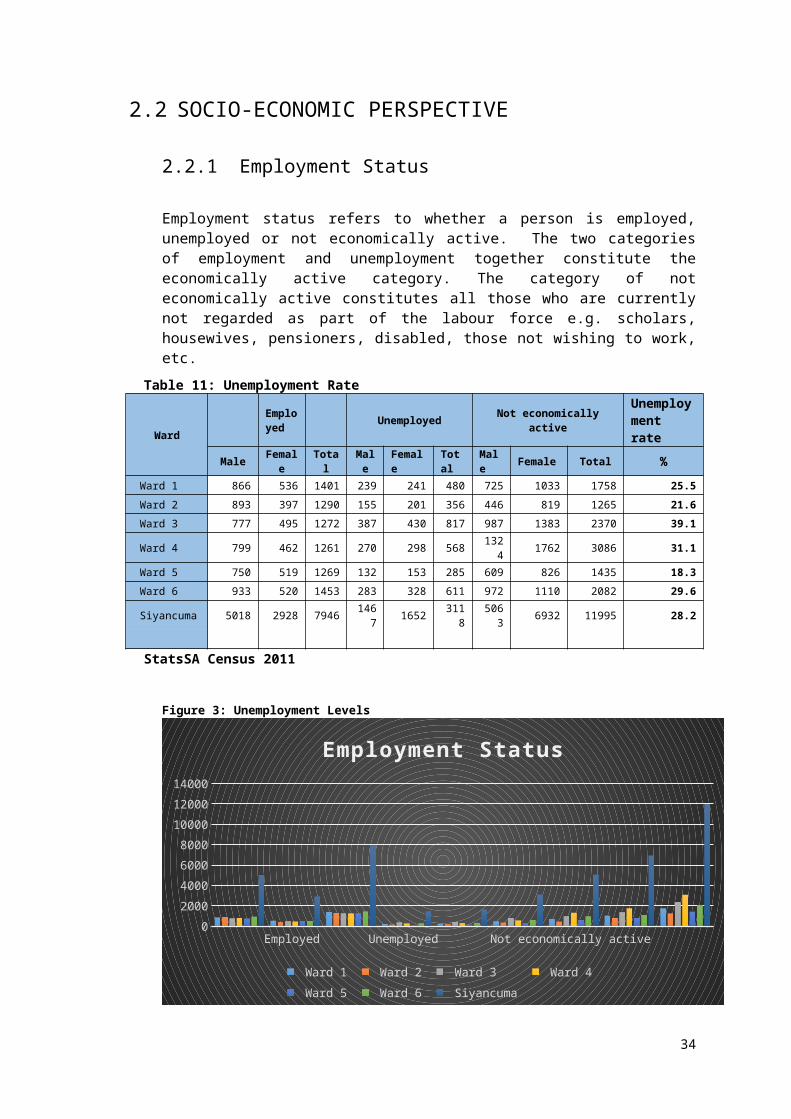
2.5.5 Water
Siyancuma Municipality has a generally well-developed infrastructure, both public and personal. From the 9578 households, 7314 households have water inside the dwelling yard, 1939 households make use of piped water from community stands while 326 households do not have access to piped water.
Table 20: Piped Water inside DwellingsWard Piped water
inside dwelling yard
Piped water on
community stand
No access to piped water
Total
Ward 1 1429 136 14 1578 Ward 2 940 486 122 1547 Ward 3 1413 227 6 1645 Ward 4 1130 673 18 1821 Ward 5 1134 65 45 1244 Ward 6 1269 352 121 1743 Siyancuma 7314 1939 326 9578
StatsSA Census 2011
Figure 9: Piped water
Ward 1 Ward 2 Ward 3 Ward 4 Ward 5 Ward 6 Siyancuma 0
2000
4000
6000
8000
10000
12000
Piped Water in Siyancuma Wards
Piped water inside dwelling yard Piped water on community stand No access to piped water Total
StatsSA: Census 2011
Table 21: Water by source
Source of water Ward 1 Ward 2 Ward 3 Ward 4 Ward 5 Ward 6 Siyancuma
Regional/local water scheme (operated by municipality or other water services provider)
1067 144 1614 1742 899 883 6349
Borehole 402 788 - 39 131 318 1678
Spring 3 21 - 3 - 44 70
Rain water tank 3 10 1 1 2 3 20
38

Source of water Ward 1 Ward 2 Ward 3 Ward 4 Ward 5 Ward 6 Siyancuma
Dam/pool/stagnant water 27 74 - 3 11 19 134
River/stream 53 348 1 - 178 200 780
Water vendor 2 3 13 1 - 27 46
Water tanker 11 116 5 21 21 237 410
Other 11 44 11 12 3 11 92
Total 1578 1547 1645 1821 1244 1743 9578
StatsSA: Census 2011
Borehole source of water is featuring in all the towns meaning the use of ground water in Siyancuma Local Municipality is dominant; spring water is also featuring in Douglas and Campbell. Water tanker is also featuring in most of the towns.
2.5.6 Sanitation
Sewerage and sanitation are basic needs of communities which can pose serious health and hygiene risks for communities and the environment at large if not properly managed and monitored. According to the White Paper on Basic Household Sanitation, 2001, basic sanitation is defined as: “The minimum acceptable basic level of sanitation is:
a.) Appropriate health and hygiene awareness and behaviour
b.) A system for disposing of human excreta, household waste water ad refuse, which is acceptable and affordable to the users, safe, hygienic and easily accessible and which does not have an unacceptable impact on the environmental and
c.) A toilet facility for each household”
Table 22: Sanitation LevelsWard None Flush
ToiletsChemical
toiletPit toilet Bucket
toiletOther Total
Ward 1 221 1134 - 125 72 26 1578
Ward 2 364 372 16 743 27 25 1547
Ward 3 66 1354 2 8 216 - 1645
Ward 4 58 1098 5 22 636 2 1821
Ward 5 156 968 - 98 16 8 1244
Ward 6 304 841 2 398 186 12 1743
Siyancuma 1169 5767 25 1394 1152 73 9578
StatsSA: Census 2011
39

Figure 10: Toilet facilities per ward
Ward 1 Ward 2 Ward 3 Ward 4 Ward 5 Ward 6 0
200
400
600
800
1000
1200
1400
1600
Toilet Facilities per ward
None FlushToilets Chemical toilet Pit toilet Bucket toilet Other
StatsSA Census 2011
2.5.7 Challenges for Growth and Development
The examination and analysis of the socio-economic indicators listed above indicate without any doubt that the most critical challenge facing the Municipality is the reduction of poverty. Other challenges that the Municipality must confront, but which in themselves will also address poverty, includes the following:
Ensuring that all citizens have access to basic services such as water, sanitation, electricity and housing.
Increasing access to services in education, health and social services. Stabilizing and decreasing the rate of HIV and AIDS infection, tuberculosis,
FAS etc. Reduction in the rate of crime. Economic empowerment The shortage of critical skills – development of an attraction and retention
strategy; improving skills of the labour force etc. Targeting special groups e.g. women, disabled and youth; and Sustainable job creation.
2.5.8 Opportunities for Growth and Development
Analyses of the economic indicators indicate opportunities for economic growth in the following:
Agriculture and agro-processing Manufacturing Tourism Transport and infrastructure Wholesale and retail; and Mining and value adding – beneficiation.
40

The analysis is necessary to show what the current infrastructure is available and, where there are opportunities for development and exactly what the needs of the local community are. When planning for future development, it is not only necessary to know what is needed, but also what resources such as land, buildings and other facilities are available to address these needs.
2.6 SPATIAL OVERVIEW OF THE TOWNS IN THE SIYANCUMA LOCAL MUNICIPALITY
Apart from regional understanding of the composition of the District and Local Municipality, a clear understanding of the local spatial dynamics and issues is dependent on at least a brief overview of each town at local level. The section below provides a brief summary of the main spatial issues of each town within the local municipal context. This section will be sustained with maps, indicating the various nodes, centres and corridors.
The following criteria were used to determine the different type of settlements structures:
The geographical location of the towns. The level of services and infrastructure and Social and economic activities such as:
Administrative centre for government Retail centre Provision of basic education and health facilities Resource centres for farming communities
41

2.6.12.6.22.6.32.6.4 Retail Centres
Retail Centres represent a classification of localities according to specific and specialized services of regional or provincial importance. Different types of centres were distinguished:
Those urban nodes not identified as Economic Nodes (Economic Hub, Collective Economic Nodes, and Specialised Economic Nodes) or NSDP Category of Potential Specific Nodes will exist as services centres to their surroundings.
These are centres that will complement the satellite towns in the remote areas for the purpose of the even distribution of services and to promote the creation of employment opportunities. These towns should be
42
NNodes
These are areas where development (facilities, services and economic opportunities) tends to concentrate. Different types of nodes can be distinguished such as urban nodes, development nodes, social nodes, rural nodes (villages) and transportation distribution hubs.
Corridors
Development corridors are characterized by higher order ribbon-like development along routes that would otherwise be classified as movement corridors. These occur on various levels, from local development corridors along the main streets of the towns or even along rivers to regional and provincial corridors. Different types of corridors can be distinguished such as development corridors, movement corridors and activity corridors.
DDistricts
Districts are areas with common identifying characteristics and usually have a homogeneous land use associated with it. Different kinds of districts have been identified for the purpose of the SDF, namely: Mixed land use districts, neighbourhood districts, industrial districts, agricultural districts, institutional districts, corporate districts and historical Precinct District
Open Spaces
A rationalized network of interconnected open spaces providing the urban environment with variety, character, a sense of visual relief, open space enjoyment, recreation and general amenity. In some case there will be “no-go areas” where development are not encouraged due to its particular and intrinsic natural-, ecological-, aesthetical-, cultural-, sport- or historical value and may also include areas that serve as discerning landmarks.

developed with social services in support of those areas where growth will be experienced.
It is therefore proposed that attention should be paid to education, health and social infrastructure in these services centres so that the quality of life of people staying there can be improved, and necessary skills be obtained.
Public FacilitiesTable 23: Community halls
Towns Multipurpose Centres
Town halls
Schimidsdrift - 1
Campbell - 1
Griekwastad - 2
Douglas - 2
Total - 6
Source: Siyancuma Municipality
2.6.5 Cemeteries Table 24: Cemeteries
Towns CemeteriesSchimidsdrift 1
Campbell 1
Griekwastad 1
Douglas 3
Saltlake 1
Total 6
Source: Siyancuma Municipality
2.6.6 Development Nodes
Development nodes are localities where economic growth will be promoted. A variety of activities will tend to cluster in and around these nodes. The nodes offer development potential and needs to be stimulated in order to concentrate growth. The potential for growth and development is informed by the strengths and
43

opportunities presented by each of these nodes. These nodes should therefore be developed in order to draw investment to regions.
Specialisation nodes are areas where specific products or services are available and these nodes will tend to specialize on capitalising on these region-specific products. A range of specialisation nodes have been identified in terms of the products the region offer.
2.6.7 Development Corridors
Development corridors are characterized by higher order ribbon-like development along routes that can be classified as transport (movement) axes. These corridors promote economic activity at specific locations along these distribution routes. It thus however does not necessarily imply that development will be continuous for the full length of the corridor.
It is foreseen that the presence of economic activity along these routes will require special attention in terms of the planning of ingress and exits to and from commercial activities in order not to interfere with the mobility of the corridor itself. Economic development should thus be promoted along development corridors, but care should be taken not to impact negatively on the mobility of the corridor.
2.6.5 Transport Axis
Transport axes are routes of high mobility (movement) that establish a linking between areas of significance, with an optimal travel time. The potential is provided for development to locate itself in relation to these movement routes. District transport axes are routes of high mobility (movement) on a district level that establish a linking between areas of significance, with an optimal travel time. The potential is provided for development to locate itself in relation to these movement routes.
2.6.8 Public Transport Network
In the longer term and from a land use point of view the fundamental principle pertaining to the development of a public transport network and system should be to create the environment and thereby promoting as best as possible the development of high density, mixed uses around the public transport network in the Municipality. The objective is to increase the number of people within functional reach of the public transport service, and to provide as diverse as possible a range of land uses around the public transport network. Four main categories can be identified within the public transport service:
The main public transport corridor represents the corridor that should enjoy the highest priority, both with regard to the level of service and the time of implementation
The secondary services will have a lower priority to the corridor service. These routes will either feed into the corridor routes, but may also terminate at the main destination, depending on the expected passenger volumes
44

The feeder services will feed into the corridor service and/or the secondary services.
The weekly services will essentially be services to outlying areas affording access to health and social services
3.CHAPTER THREE: PRIORITIES, VISION & MISSION
The next biggest challenge facing the Municipality was to develop a set of strategies that will address the key development issues identified in the strategies phase. To be able to do that, it was important to first agree on a common vision that will guide the development process, a vision that all the various stakeholders will subscribe to. It was therefore critical to begin with an agreement on a common development vision and then a mission. Consequently, the development of the vision and mission was a very consultative process in which the community played a critical role. The outcomes of the deliberations and interactions are listed below.
3.1. SIYANCUMA OUTLINES ITS FUTURE AS ENVISIONED BELOW TO BE AS FOLLOWS.
3.1.1. Vision
45
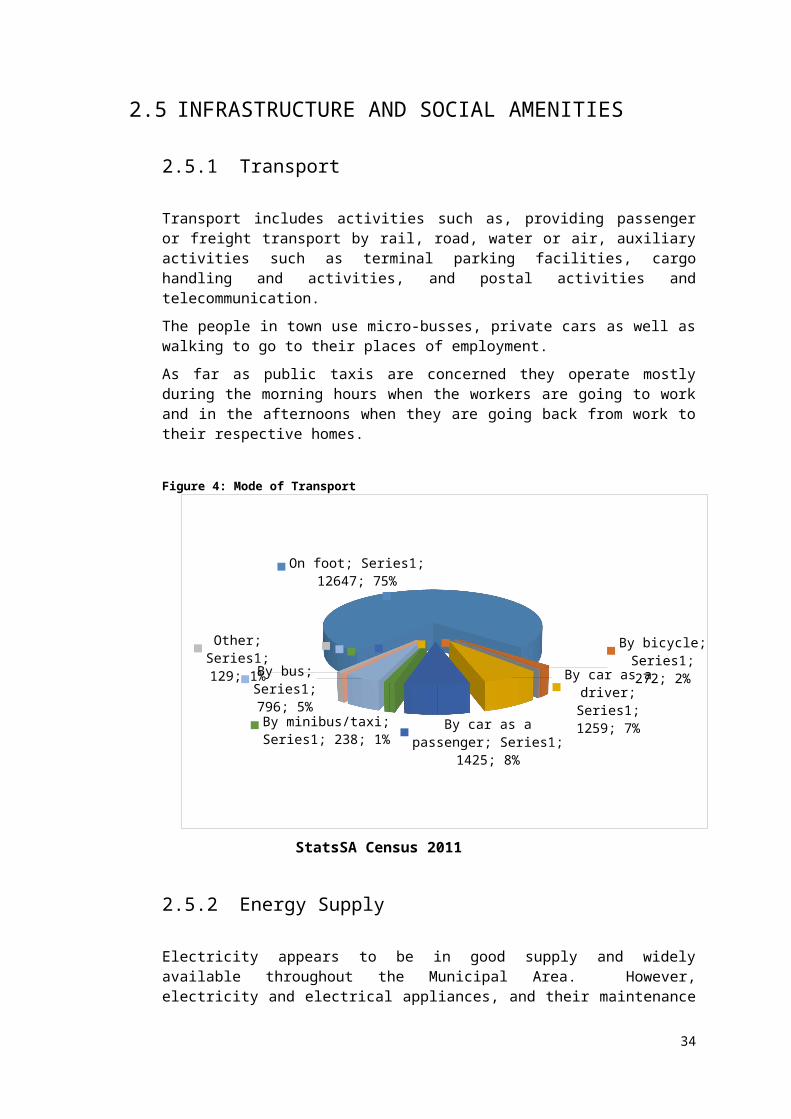
“A municipality focused on effective service delivery ‘underpinned’ by economic sustainability”
3.1.2. Mission
“We will strive to put the community’s needs first by optimizing all available resources and human skills to:-
Develop/ Improve our Infrastructure; Develop and enable the economy; Improve the social conditions of our community; Create accountable and democratic governance; and Create a sound financial management system
3.1.3. Values
The Siyancuma Municipality is anchored in the following fundamental values:
Honesty: We shall at all times ensure that we handle all matters like
they are, without creating unrealistic expectations and at all times
communicating the truth
Responsibility: We shall at all times take personal charge of our
dealings and make sure that we are accountable for all our actions and
deeds.
Accessibility: We are all accessible in appearance and in structure
and as such will assist everyone regardless of our own job load.
Corruption Free: Our organisation will be viewed by those, both within
and without, as honest and upstanding and thus deal with all forms of
corruptions
High work ethic: We shall at all times and in all situations work to the
highest level of diligence and productivity
Rule of law: we are founded on the basis of the law and as a legal
entity, will be directed and guided by the law at all times
Integrity: We will communicate realness in our dealings with colleagues and clients and shall be upstanding at all times
3.2. SWOT ANALYSISStrengths, Weaknesses, Opportunities and Threats (SWOT) Analysis
46

Following the scan of our environment, we honed in on the environment and declare the following to be our SWOT Analysis:
3.2.1.Strengths
Low staff turnover Electronic payment system Bylaws and policies in place Land available in Griekwastad Great resources e.g. Water Improved employment Functional infrastructure Siyancuma economically viable e.g. mining and agriculture Informal area formalised
3.2.2. Weaknesses
Lack of office space Lack of office resources Lack of finances Lack of communication Lack of oversight roles No team building/ work apart Low skills levels Grant dependent communities SDF not in place
3.2.3.Opportunities
Activation of local labour forum Motivation of labour force Regular staff meetings Constant training Appointment of more skilled staff Acceptance of responsibility for Council Office space Public image Broadening of income sources Supervisors’ work programme Meter readings have to be done physically each month
47

Alternative sources of income Minerals in the municipality
3.2.4.Threats Limited community understanding of finances Problem solving not an urgent matter Increase in poverty and unemployment Drugs Low levels of education Infectious diseases Lack of continuity in community leadership Diminishing sources of revenue Increasing bad debts
48

3.3 STRATEGIC ISSUES
Table 25: Strategic IssuesISSUES IMPLICATION STRATEGY Low skills level of staff Non-performance & low level of service delivery Training
Capacity building programmes Functional & improved SD plan
Lack of office space (Head of & Schmidtsdrift)
Lack of privacy Lowering of moral of staff Leads to ineffectiveness
Planning & budgeting for new expansions
Construction of new offices Negotiate with CPA for new premises
Lack of team building Working in silos Lack of coherency & unity In-fights
Wellness programmes Team building exercises Appraisals/incentives
Inadequate budget Low service delivery Better credit control mechanisms Grievances Strike action LLF & department
meetings/agreements Lack of office space No privacy
Improper filing system Look for more offices Minimal sharing in the same department
Lack of communications Leads to grievances and misunderstandings Regular management meetings SDF not in place Leads to racist behaviour Develop an integrated SDF Staff shortages Poor services delivery Recruit properly skill staff
Source: Siyancuma Municipality Strategic Plan
49

3.4 STRATEGIC OBJECTIVES
The following have been identified as the strategic objectives:
3.4.1 Governance
To improve the oversight role of council and ensure legislative compliance by strengthening the role of the MPAC and other related committees of council.
To ensure an increased level of success of council resolutions and council effectiveness through the accelerated implementation of an issue management system within the municipality.
3.4.2 Finances
To improve the municipality’s cash flow and decrease the over dependence on government and related grants by developing and implementing better debt collection mechanisms and as such increase the payment culture to over 90%
To increase the municipal revenue base and as such its capacity to implement a broader range of projects by exploring and implementing alternative revenue sources such as loans for service delivery, mining proceeds etc.
Improve the business process of the municipality by particularly implementing the electronic payment system and thereby yield value for money for the municipality
50

3.4.3 Institutional Transformation and Administration
Improve the municipality’s labour relations climate by revisiting all decisions and their currency and in the process ensure an effective and functional Local Labour Forum (LLF)
Improve organisational effectiveness by developing a communication strategy addressing both internal and external communications and in the process ensure more staff and management meetings.
Improve poor service delivery and lack of municipal capacity by developing and implementing to the latter, a recruitment and selection processes.
Increase the capacity of the municipality by developing and implementing a proper skills development strategy for the municipality
Introduce and sustain a quality employee wellness programme in an effort to avoid staff demotivation and a disintegrated work effort within the various departments
3.4.4 Basic Service Delivery and Infrastructure Development
Ensure that the municipal infrastructure is geared for service delivery and as such is in a good condition by effecting a focused operations and maintenance programme for the municipality
Ensure that the municipality meets its service delivery focus by developing and implementing all the infrastructure related master plans
51

Create an environment conducive for service delivery by providing municipal offices in all municipal towns and integrating all departments into sensible and synergised work packages
3.4.5 Local Economic Development
Ensure economic growth in the area and the reduction of unemployment by implementing the LED Anchor Projects as prioritised by council
Ensure that the municipality increases and improves its tourism potential by increasing the capacity and strength of the LED and in the process support tourism related industries.
Ensure the spatial growth of the municipality and economic integration by the development and implementation of the municipal Spatial Development Framework.
52

3.5 STRATEGIC OBJECTIVES WITH KEY PERFORMANCE INDICATORS, TIME FRAMES AND RESPONSIBILITIES
3.5.1 BASIC SERVICE DELIVERY AND INFRASTRUCTURE DEVELOPMENT
Strategic Objective Key Performance Indicator Target Responsibilityensure that the municipality meets its service delivery focus by developing and implementing all the infrastructure related master plans
to compile a list of all the master plans the municipality will need
30-09-2015 technical
to develop 1 master plan for one of the services 31-03-2016 technical
create an environment conducive for service delivery by providing municipal offices in all municipal towns and integrating all departments into sensible and synergised work packages
to appoint service providers to investigate and develop an implementation plan for synergised office and work space for municipal workers in all service points of the municipality
31-12-2015 municipal manager
council approved report and commissioning of the implementation thereof
28-02-2016 municipal manager
ensure that the municipal infrastructure is geared for service delivery and as such is in a good condition by effecting a focused operations and maintenance programme for the municipality
provide 9000 households with potable water. 30-06-2016 technical
provide sanitation to 9000 households. 30-06-2016 technical
supply electricity to 4000 households. 30-06-2016 technical
percentage of identified water reticulation projects completed.
100% technical
53

Strategic Objective Key Performance Indicator Target Responsibilitypercentage of identified electricity reticulation project completed.
100% technical
percentage of identified community facility projects completed
100% technical
provide project management support to 200 housing units 100% technical
provide identified maintenance of municipal infrastructure 100% technical
3.5.2 Municipal Transformation and Institutional Development
Strategic Objectives Key Performance Indicator Targets ResponsibilityImprove the municipality’s labour relations climate by revisiting all decisions and their currency and in the process ensure an effective and functional Local Labour Forum (LLF)
To have a workshop with all members of the LLF to clearly identify the roles and responsibilities of both union and council in the dealing with labour related matters
30-12-2015 Administration
To have quarterly LLF meetings 4 Meetings AdministrationTo deal with Labour related matters within 30 days of officially received.
30 days of official receipt
Administration
To have 4 General staff Meeting per annum Quarterly Municipal Manager
Appointment of a Labour Relations Officer at Middle Management level
30-06-2016 Administration
54

Strategic Objectives Key Performance Indicator Targets ResponsibilityImprove organisational effectiveness by developing a communication strategy addressing both internal and external communications and in the process ensure more staff and management meetings.
To develop a Communication Strategy by end of next financial year and implement the strategy by June 2016
30-06-2016 Administration
Improve poor service delivery and lack of municipal capacity by developing and implementing to the latter, a recruitment and selection processes.
To review and implement the Recruitment & Selection Policy
30-06-2016 Administration
To introduce monthly departmental staff meetings to inform staff on progress with departmental goals
4 Meetings All
Increase the capacity of the municipality by developing and implementing a proper skills development strategy for the municipality
To do a proper skills audit of all personnel 30-06-2016 Administration
To develop training & capacity building career paths for each individual employee
30-12-2015 Administration
Reporting on the progress with the skills audit and career patting
Quarterly Administration
Introduce and sustain a quality employee wellness programme in an effort to avoid staff demotivation and a disintegrated work effort within the various departments
Develop and implement an employee programme before December 2015
30-12-2015 Administration
To hold 4 Wellness-days per annum Quarterly Reports Administration
Provide operational support to the line departments and divisions to improve the services to the municipality
Ensure that all approved IT/ MIS projects are implemented and maintained
Quarterly Reports All
Implement and improve the Performance Management System (PMS). aligned to the Integrated Development Plan (lDP) of the municipality
4 Monitoring and Evaluation Reports
All
Implement an Electronic PMS System 30-06-2016 Administration
Amend and operationalize an organisational structure aligned to the Integrated Development Plan (IDP) of the municipality.
30-12-2015 Municipal Manager
Amend and implement effective administrative and institutional systems, structures and procedures: (HR,
4 Policies developed and 3
Administration
55
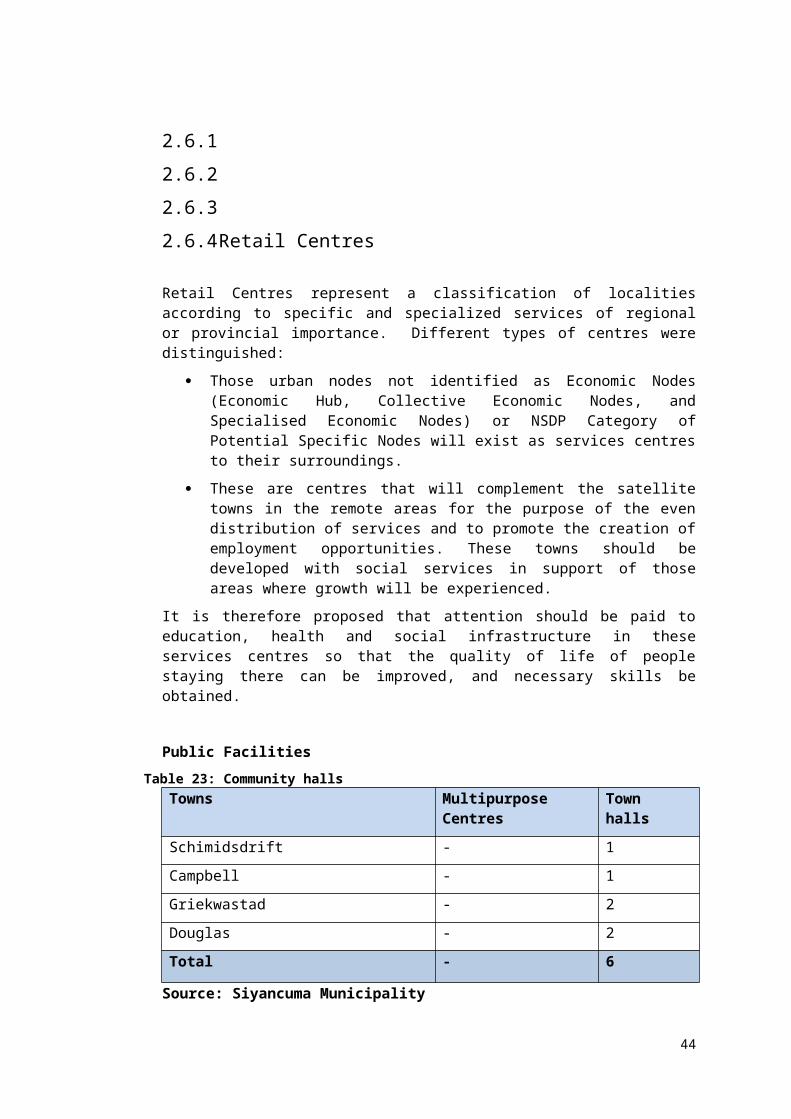
Strategic Objectives Key Performance Indicator Targets ResponsibilityFinancial Policies. By-laws) By-laws
promulgatedRevise and operationalize integrated human resource management systems
Investigate the current system and report on that by June 2016
Administration
Implement the approved Customer Services Systems In Department: Administration
Develop an Institutional Customer Care Procedure and Implement by 30 December 2015
All
Ensure the implementation of the approved Disaster Management Plan In compliance with the Disaster Management Act.
30-06-2016 Administration
Ensure the implementation of land-use policies and legislation.
30-06-2016 Administration
Ensure the promotion, support and implementation of approved Environmental Health programmes
Quarterly Administration
Ensure the provision of administrative support services to all committees of Council (Portfolio Committees etc.)
Quarterly Administration
3.5.3 Local Economic Development
STRATEGIC OBJECTIVE KEY PERFORMANCE INDICATOR TARGET RESPONSIBILITY
Ensure economic growth in the area and the reduction of unemployment by implementing the LED Anchor Projects as prioritised by council
Develop feasibility studies for 3 anchor projects of the LED Strategy
30-03-2016 Administration
56

STRATEGIC OBJECTIVE KEY PERFORMANCE INDICATOR TARGET RESPONSIBILITY
Ensure that the municipality increases and improves its tourism potential by increasing the capacity and strength of the LED and in the process support tourism related industries.
Develop a Tourism Strategy 30-06-2016 Administration
Establish a Siyancuma LED/Tourism Forum 30-03-2016 Administration
Develop a Terms of Reference for the Established Tourism Forum
30-12-2015 Administration
Have 3 LED/Tourism Forum meetings 3 Meetings Administration
Ensure the spatial growth of the municipality and economic integration by the development and implementation of the municipal Spatial Development Framework.
To solicit funds for the compilation of a Spatial Development Framework
30-06-2016 All
Ensure Implementation of the approved LED and Tourism Master Plan.
30-06-2016 Administration
Ensure the performance of a detailed analysis of local economic development in the municipality (LED)
30-06-2016 Administration
Ensure the implementation of approved projects informed by credible business plans within the parameters of the LED Strategy and programme
30-06-2016 Administration
Develop an investor attraction and retention policy 30-06-2016 Administration
Develop an SMME database in order to track their development
30-06-2016 Administration
57

STRATEGIC OBJECTIVE KEY PERFORMANCE INDICATOR TARGET RESPONSIBILITY
Report on the development initiatives of the SMME's Quarterly Administration
Ensure the provision of institutional capacity to implement approved LED programmes and to create a conducive environment for shared growth in the municipality
30-03-2016 Administration
3.5.4 Municipal financial viability and managementStrategic Objective Key Performance Indicator Targets ResponsibilityTo improve the municipality’s cash flow and decrease the over dependence on government and related grants by developing and implementing better debt collection mechanisms and as such increase the payment culture to over 90%
To review the Municipality's debt collection policy and by-law
30-06-2016 Finance
To implement and report on the measure taken in terms of the Debt Collection
Quarterly Reports Finance
To increase the municipal revenue base and as such its capacity to implement a broader range of projects by exploring and implementing alternative revenue sources such as loans for service delivery, mining proceeds etc.
To investigate the possible additional sources of income for municipality
Report by 30 June 2016
Finance
Preparation for taking up a loan, with business plans on how the funds taken up be spent
30-06-2016 Municipal Manager
Improve the business process of the municipality by particularly implementing the electronic payment system and thereby yield value for money for the municipality
To introduce an electronic payment system where both the debtors and creditors of the municipality can be captured
30-06-2016 Finance
To adhere to the Budget Reforms Implementation Process of the
Ensure implementation of budget reforms prescribed in the MFMA as per categorisation of the municipality.
Monthly Finance
58

Strategic Objective Key Performance Indicator Targets ResponsibilityMunicipality Ensure timeously reporting in the prescribed formal to
Council, National and Provincial Treasury, Auditor General, DPLG, Department Housing and Local Government and other stakeholders. on prescribed dates
Monthly Finance
Reporting Process in terms of the MFMA
Ensure the drafting and submission of a mid-year report to Council
31-12-2015 Finance
Ensure the timeously compilation of the Annual Financial Statements in the prescribed format.
30-06-2016 Finance
Expenditure and Supply Chain Management
Ensure the implementation and management of the expenditure and supply chain management system.
Quarterly Reports Finance
Revenue and debt collection. Ensure the collection and receipt In terms of all grant funding promulgated per DORA allocation.
Monthly Finance
Asset and Risk Management. Ensure the implementation of effective asset and risk management
30-06-2016 Municipal Manager
3.5.5 Good governance and public participation
Strategic Objective Key Performance Indicator Target ResponsibilityTo improve the oversight role of council and ensure legislative compliance by strengthening the role of the MPAC and other related committees of council.
Implement the Council's Portfolio System 30-06-2016 Municipal Manager
To have 4 MPAC meeting per annum Quarterly Municipal Managerto have 4 Training Workshops for Councillors on policy development and other council related activities
Quarterly Municipal Manager
To ensure an increased level of success of council resolutions and
To develop and implement an action plan and procedure to monitor the implementation of the Council Resolutions
30-06-2016 Administration
59

Strategic Objective Key Performance Indicator Target Responsibilitycouncil effectiveness through the accelerated implementation of an issue management system within the municipality.
Ensure the promotion, support and implementation of approved social development programmes
Quarterly reports Municipal Manager
Ensure capacity' building of community-based organisations to enhance effective community participation
2 workshop on community-based organisation training
Municipal Manager
Support the building of relationships with organised business, labour and civil society through transparent and accountable actions
Establish a Local business- municipal forum
Municipal Manager
Implement and monitor the approved anti-corruption strategy for the municipality in Department: Administration in terms of the National Strategy
30-06-2016 Municipal Manager
60
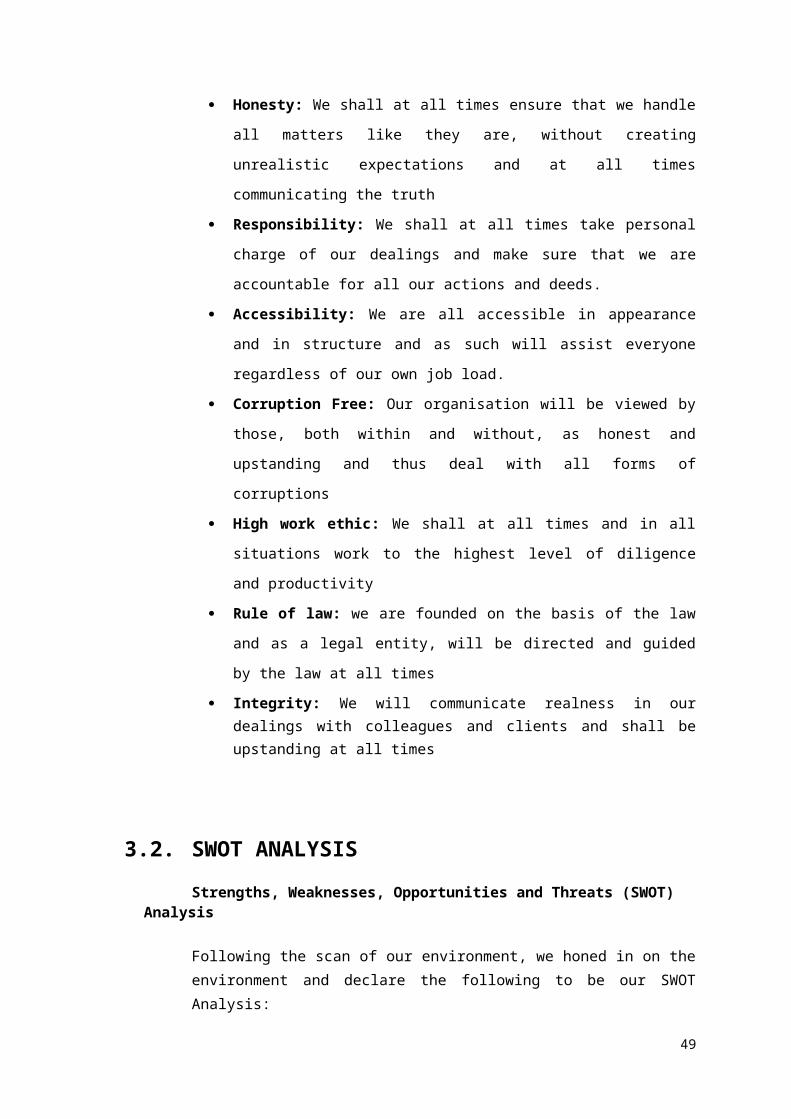
3.6 FEEDBACK FROM THE COMMUNITIES
GRIEKWASTAD : MATLHOMOLA (WARD 6) 11 May 2015 @ 16H00
1 Building of top structures (houses) in areas where internal services are installed.2 Moving of beneficiaries to 22 sites3 Construction of internal services in formalized areas4 Planning and land surveying of middle/ higher income sites5 Installation of street lighting in main road6 Installation of a storm-water drainage system7 Procurement and availing of solar panels and geysers8 Removal of asbestos roofs8 Creation of projects such as cleaning, clearing of shrubs and trees, greening, etc.9 Upgrading of sports facilities and playgrounds, as well as providing security
10 Erection of speed bumps11 Erection of refuse drums - dumping of garden waste12 Establishment of a new cemetery13 Establishment of a new clinic14 Establishment of a new library15 Establishment of a wellness and fitness centre for the elderly.16 Development of industrial sites for recycling purposes17 Establishment of a pound for stray animal18 Establishment of a FET centre for artisans19 Appointment of a permanent doctor20 Reopening of Youth Agency Centre21 Establishment of a Permanent Home Affairs Office22 Extension of school grounds23 Establishment of a community radio station
GRIEKWASTAD : RAINBOW + VAALBLOK (Ward 1) 12 May 2015 @ 16H00
1 Building of top structures (houses) in areas where internal services are installed.2 Electrification of formal sites3 Planning and land surveying of middle and higher income, as well as church sites4 Establishment of a Water Purification Plant5 Upgrading of sewer system6 Installation of a storm-water drainage system7 Upgrading of street lighting8 Creation of projects such as cleaning, clearing of shrubs and trees, greening, etc.9 Paving of streets
10 Replacement of asbestos roofs11 Erection of speed bumps12 Naming/ re-naming of streets13 Provisioning of water tanks for rain harvesting14 Erection of road signs in residential areas

15 Upgrading of sports facilities and parks16 Appointment of a permanent doctor17 Appointment of local people e.g. water meter readers18 Establishment of a Permanent Home Affairs Office19 Beefing-up of administration at Municipal Offices20 Writing off of bad debt21 Building of a crèche22 Building of a Shopping Centre23 Establishing of an entertainment centre for the youth24 Upgrading of golf course25 Establishment of permanent banking facilities26 Erection of refuse drums - dumping of garden waste27 Supply of refuse bags for every house hold on a monthly basis28 Providing transport for children to school29 Providing transport for out-patients to the clinic
CAMPBELL (WARD 6) :19 May 2015 @ 15H00
1 Building of houses in formalized area (190)2 Relocation of landfill site3 Installation of street lighting / high mass lighting4 Planning and land surveying of residential and church sites5 Upgrading of UDS toilet system with a full water-borne system6 Provisioning of chemicals for the UDS toilets7 Creation of projects such as cleaning, clearing of shrubs and trees, greening, etc.8 Naming of streets in formalized area (190)9 Upgrading of sports facilities and parks
10 Erection of speed bumps12 Upgrading of clinic13 Extension of school grounds14 Building of a new High School15 Tarring of road to Douglas16 Paving of internal roads17 Construction of a Shopping Centre18 Construction of a Bakery19 Establishment of a Social Service Centre with own officials (local)20 Procurement and availing of solar panels and geysers21 Establishment of a stock-theft and organized crime prevention unit22 Deforestation of areas between residential areas23 Erection of devils fork fencing at Municipal Offices24 Appointment of a Commonage Manager25 Construction of a swimming pool26 Provisioning of swimming, lifesaving and diving lessons27 Provisioning of Jo-Jo tanks for rain harvesting28 Establishment of a new oxidation pond29 Enforcement of municipal by-laws30 Establishment of a satellite Drivers License Testing Centre (DLTC)
62

BONGANI (Ward 3): 18 May 2015 @ 16H00
1 Electrification of rest of Riemvasmaak and other formalized areas2 Building of top structures (houses) in areas where internal services are installed3 Developing/ availing of business sites4 Construction of internal services in formalized areas5 Upgrading of sewer network6 Installation of a storm-water drainage system7 Planning and land surveying of low, middle, higher income, and church sites8 Accelerate economic development9 Upgrading of sports facilities and parks
10 Procurement and availing of solar panels and geysers11 Erection of speed bumps12 Creation of projects such as cleaning, clearing of shrubs and trees, greening, etc.13 Prioritizing SMME’s development and capacity building14 Optimizing local Tourism opportunities15 Establishment of a new library16 Establishment of a FET centre for artisans17 Construction of a swimming pool at sports facilities18 Provisioning of swimming, lifesaving and diving lessons19 Building of a mortuary20 Establishment of a centre for children/ people with disabilities21 Upgrading of RDP houses22 Establishment of a community radio station23 Replacing of asbestos roofs with corrugated iron roofs24 Assistance to NGO’s with regards to soup kitchens
BREIPAAL : Ward 4 : 13 May 2015 @ 16H00BREIPAAL : Ward 5 : 14 May 2015 @ 16H00TOWN : Ward 5 : 26 May 2015 @ 17H00
1 Building of top structures (houses) in areas where internal services are installed2 Construction of internal services in formalized areas3 Procurement of new land for housing purposes4 Planning and land surveying of low, middle, higher income, and church sites5 Electrification of newly formalized areas6 Upgrading of street lighting / high mass lighting7 Purchasing and storing of electricity and water meters in bulk8 Installation of a storm-water drainage system9 Maintenance/ Upgrading of sewer main linking Daltons Squatters and Dahliastreet.
10 Upgrading of sewer network in town11 Upgrading and registering of landfill site12 Rectification of 515 houses (Ward 4)13 Maintenance of RDP houses14 Creation of projects such as cleaning, clearing of shrubs and trees, greening, etc.15 Establishment of a new Drivers License Testing Centre (DLTC)16 Establishment of a new Vehicle Testing Station17 Erection of speed bumps
63

18 Maintenance and repairs of tarred roads19 Replacement of vandalized road-signs and painting of road marks20 Provisioning of Dustbins (wheely bins) to curb illegal dumping21 Procurement and availing of solar panels and geysers22 Upgrading of the Clinic in Ward 523 Building of a new Clinic in Ward 424 Building of a new Community Hall in Ward 425 Upgrading of hospital26 Naming/ renaming of streets27 Beefing up of community safety (Establishment of a mobile police station)28 Implementation and Enforcement of all bylaws29 Developing of industrial sites for recycling purposes30 Establishment of a FET centre for artisans31 Prioritizing SMME’s development and capacity building32 Establishment of a centre for children/ people with disabilities33 Establishment of a centre for destitute/ street children34 Writing off of bad debts35 Establishment of a Multi-Purpose Centre36 Establishment of a Soup Kitchen
SCHMIDTSDRIFT (WARD 2) : 19 May 2015 @ 11H00
1 Building of houses / top structures2 Establishment of a new electricity substation3 Electrification of sites4 Erection of a water-borne toilet system in No.55 Erection of street lighting / high mass lighting6 Establishment of a landfill site7 Installation of a storm-water drainage system8 Creation of projects such as cleaning, clearing of shrubs and trees, greening, etc.9 Procurement and availing of solar panels and geysers
10 Tarring of road to Douglas11 Naming of streets12 Establishment of a driving school13 Paving of entrance road to No.514 Establishment/ upgrading of medical facilities15 Instituting a permanent ambulance service16 Upgrading the library (permanent)17 Building of a crèche in No.518 Building of a new high school19 Establishment of a bursary fund for students20 Establishment of a pound for stray animal21 Upgrading of Municipal Offices22 Erection of a petrol station23 Developing a shopping centre24 Building of a Community Hall25 Establishment of an auction facility
64

26 Management/ Removal of alien vegetation27 Instituting a Disaster Management facility28 SMME development and empowerment29 Establishment of sports facilities30 Maintenance of existing sports grounds
4. CHAPTER FOUR: INSTITUTIONAL FRAMEWORK
4.1. INSTITUTIONAL ARRANGEMENTS
Table 26: The Councillors profile is as follows:COUNCILOR Party
L Oliphant [Mayor] ANCJ Mosetlhe ANCA Olifant ANCJ George ANCM Selebogo ANC
D Koopman ANCP Mc Klein ANCM Eland COPEL van Niekerk COPER Booysen DAV Adams DA
Siyancuma Municipality consists of the office of the Municipal Manager and three departments which are accountable to him namely:
Department of Administration & Community Services
Department of Finance
Department of Infrastructural Development and Technical Services
4.2. COMMITTEES
4.2.1.Council CommitteesCouncil Committees provide the opportunity for councillors to be more involved in the active governance of the municipality.
The municipality makes use of a plenary system with wards and have 6 ward councillors and 5 proportionally elected councillors. The councillors elected from themselves one of the councillors and the Mayor/ Speaker of the Municipality. The
65

councillors organised themselves into the following portfolio committees [Section 79 of the Municipal Structures Act, 1998, Act 117 of 1998]. The Municipality has 11 councillors of which 6 is elected as ward councillors and 5 is proportionally elected. The Councillors are divided into portfolio committees as mentioned below. - Commonage, Infrastructure & Development Committee- Finance - Housing, Social Development & Administration Committee-Social Economic Development - Local Labour Forum- Municipal Public AccountsThese committees have bi-monthly meetings, the committees does not have delegated powers and only makes recommendations to Council. Appendix B of the document also contains more information of the Committees of Council
4.2.2.Ward CommitteesAs noted earlier, the Constitution requires of Local Government to provide democratic and accountable government, to ensure sustainable service provision, to promote social and economic development, and to encourage community involvement in its affairs. Furthermore the White Paper on Local Government (1998) defines Developmental Local Government as “local government committed to working with citizens and groups within the community to find sustainable ways to meet their social, economic and material needs to improve the quality of their lives.”
The primary objective for the establishment of ward committees is to enhance participatory democracy in local government.
The Local Government Municipal Structures Act (Act 117 of 1998) makes provision for the establishment of wards determined by the Demarcation Board in metropolitan and Category B municipalities. Ward Councillors are elected in terms of the Municipal Electoral Act to represent each of the wards within a municipality. A Ward Committee is established consisting of a Ward Councillors as the Chairperson, and not more than 10 other persons.
The Ward Committee members must represent a diversity of interests in the ward with an equitable representation of women. No remuneration is to be paid to Ward Committee members.
The functions and powers of ward Committees are limited to making recommendations to the Ward Councillors, the metro or local council, the Executive Committee and/or the Executive Mayor. However a Municipal Council may delegate appropriate powers to maximize administrative and operational efficiency and may instruct committees to perform any of council’s functions and powers in terms of Chapter 5 of the MSA as amended.
The Municipal Council may also make administrative arrangements to enable Ward committees to perform their functions and powers.
The principles of developmental local government are further expanded upon in the Municipal Systems Act (Act 32 of 2000) and strongly endorse the purpose and functions of Ward Committees, allowing for representative government to be complemented with a system of participatory government. The municipality is to
66

encourage and create the conditions and enable the local community to participate in its affairs. Members of the local community have the right to contribute to the decision-making processes of the municipality, and the duty to observe the mechanisms, processes and procedures of the municipality.
The Municipality already established ward committees in all ward, but some of these ward committees are not functioning due to the following reasons:
No proper training has been provided
Many municipalities do not provide resources such as transport, human resources and facilities
There are no monitoring mechanisms
The Municipality have a Ward Committee Policy in place and this policy makes provision for stipends to members of the ward committees
67

Political Structure

Office of the Municipal Manager
69

Department of Finance
70

Department of Finance
71

72

Department Administration and Community Services
Department Administration & Community Services
73
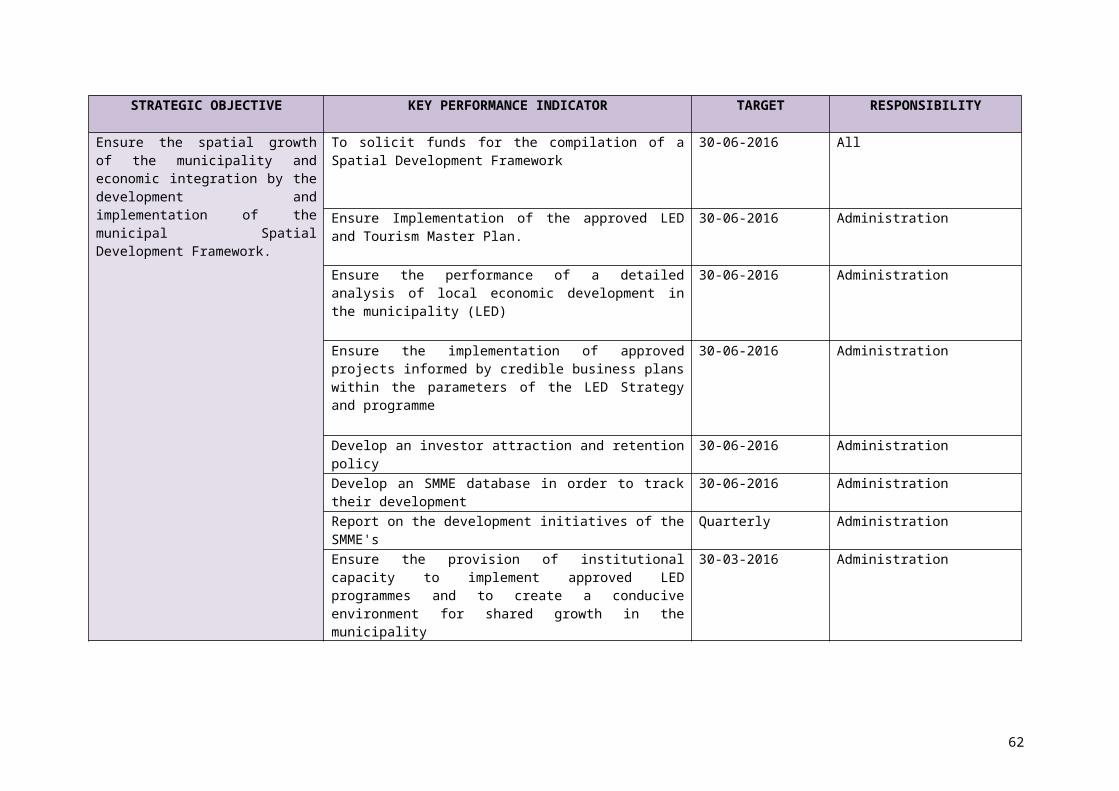
Department Infrastructure Development and Technical Services
74

75

Department Infrastructure Development and Technical Services
76

Department Infrastructure Development and Technical Services
77

Department Infrastructure Development and Technical Services
78

Department Infrastructure Development and Technical Services
79

5.CHAPTER FIVE: PROJECTS
5.1. MUNICIPALITY’S DEVELOPMENT PROJECTS
Derived from the identified development strategies and projects in the previous chapter, it was necessary to formulate sufficiently detailed project proposals in order to ensure an executive direction for the implementation of the projects.
This phase therefore focused on the technical and financial decisions and formed the detailed project designs needed to ensure the link between planning and physical delivery of projects.
5.2. DETAILED PROJECT DESIGN
In order to ensure the smooth implementation of a project proposal, it is imperative to first check that such a project complies with the principles, objectives and strategies set earlier in the IDP process.
The different projects are therefore listed under the heading of its related development priority and numbered in accordance with the preferred objectives and strategies, as indicated below.

5.2.1.Funded Project List DEPARTMENT ITEM FIN SOURCE 2015/2016 2016/2017 2017/2018
COUNCIL MAYORAL CAR LOAN 1 200 000
CORPORATE AND HUMAN RESOURCES TROLLIES – CLEANERS OWN FUNDS 7 000PA SOUND SYSTEM OWN FUNDS 10 000LOUDHALER OWN FUNDS 10 000SAFETY DOORS OWN FUNDS 100 000VACUUM CLEANER OWN FUNDS 5 000FURNITURE/COMPUTERS OWN FUNDS 28 000 168 000 175 000
160 000 168 000 175 000
FINANCE INTERNET FILTER OWN FUNDS 20 000LAPTOPS OWN FUNDS 100 000FURNITURE & EQUIPMENT OWN FUNDS 40 000 168 000 175 000
160 000 168 000 175 000
PUBLIC WORKS - ROADS SECURITY GATE & ROOM OWN FUNDS 200 000ROADS PROJECT MIG 9 487 000 9 970 000 10 693 000ROLL OVER 2013/2014 MIG 7 100 000
16 787 000 9 970 000 10 693 000
ELECTRICITY ELECTRICITY CONNECTIONS INEP 3 400 000 2 000 000 1 000 000INEP ROLL OVER INEP 1 607 808TRANSFORMERS OWN FUNDS 374 000 392 700 420 189
5 381 808 2 392 700 1 420 189
WATER WATER SCHMIDTSDRIFT MIG 6 700 000 6 700 000 6 700 000WATER PUMPS OWN FUNDS 500 000 525 000 561 750
7 200 000 7 225 000 7 261 750

WASTE WATER MANAGEMENT UPGRADING WWTW ACIP 4 000 000 4 280 000 4 579 600BAKKIE (SANITATION) LOAN 300 000STANDBY SEWER PUMPS OWN FUNDS 150 000 691 500 889 705SUBMERSIBLE PUMP OWN FUNDS 80 000 341 500 811 060
4 530 000 5 313 000 6 280 365
TRAFFIC LDV LOAN 300 000
35 718 808 25 236 700 26 005 304
82

5.2.2.Unfunded Project List
Municipal Transformation and Organizational Development
IDP No PROJECT FUNDINGAMOUNT SOURCE
MT1 Organizational redesign R500,000 MunicipalityProvince
MT2 Skills audit Included in total funding of R500,000
MT3 Design and implement HR systems Included in total funding of R500,000
MT4 Marketing and branding Included in total funding of R500,000
MT5 Information Technology Included in total funding of R500,000
MT6 Training and capacity building Included in total funding of R500,000
MT7 Review and develop all sector plans including infrastructure plans
R 1 000 000.00
MT8 Beefing up of administration at Griekwastad Municipal Office
MT9 Beefing up of community safetyMT10 Assisting NGO’s with regards to
soup kitchens
Governance
IDP No PROJECT FUNDINGAMOUNT SOURCE
G1 Capacity Building on institutional arrangements
G2 Enforcement of By-laws 300.000.00 CoGHSTA Admin Dept
G3 Naming/ Re-naming of streets in all affected areas within Siyancuma Municipality
G4 Writing off of bad debts
83

Sustainable Human Settlement Development (Top structures)
IDP No PROJECT FUNDINGAMOUNT SOURCE
SHS1 Provision of Civil Services in Siyancuma (Douglas, Griekwastad, Campbell and Schmidtsdrift).
R20 724 000.00 CoGHSTA
SHS2 Construction of Low Cost Housing in Siyancuma (Douglas, Griekwastad, Campbell and Schmidtsdrift).
R34,417 218.00 CoGHSTA
SHS3 Rehabilitation of Low Cost Housing in Siyancuma (Douglas, Griekwastad and Campbell).
R15 908 000.00 CoGHSTA
SHS4 Replacement of asbestof roofs in Douglas
SHS5 Replacement of asbestof roofs in Griekwastad
Sustainable Human Settlement Development (including land use management and building structures)
IDP No PROJECT FUNDINGAMOUNT SOURCE
SHS6 Procurement of new land for township establishment in Breipaal
CoGHSTA
SHS7 Procurement of new land for higher income erven in Griekwastad
CoGHSTA
SHS8 Planning and land surveying of residential and church sites in Breipaal
CoGHSTA
SHS9 Planning and land surveying of residential and church sites in Bongani
CoGHSTA
SHS10 Planning and land surveying of residential and church sites in Griekwastad
CoGHSTA
SHS11 Planning and land surveying of residential and church sites in Campbell
CoGHSTA
SHS12 Re-pegging of 22 sites in Matlhomola and settling of beneficiaries
SHS13 Extension of school grounds in Campbell
84
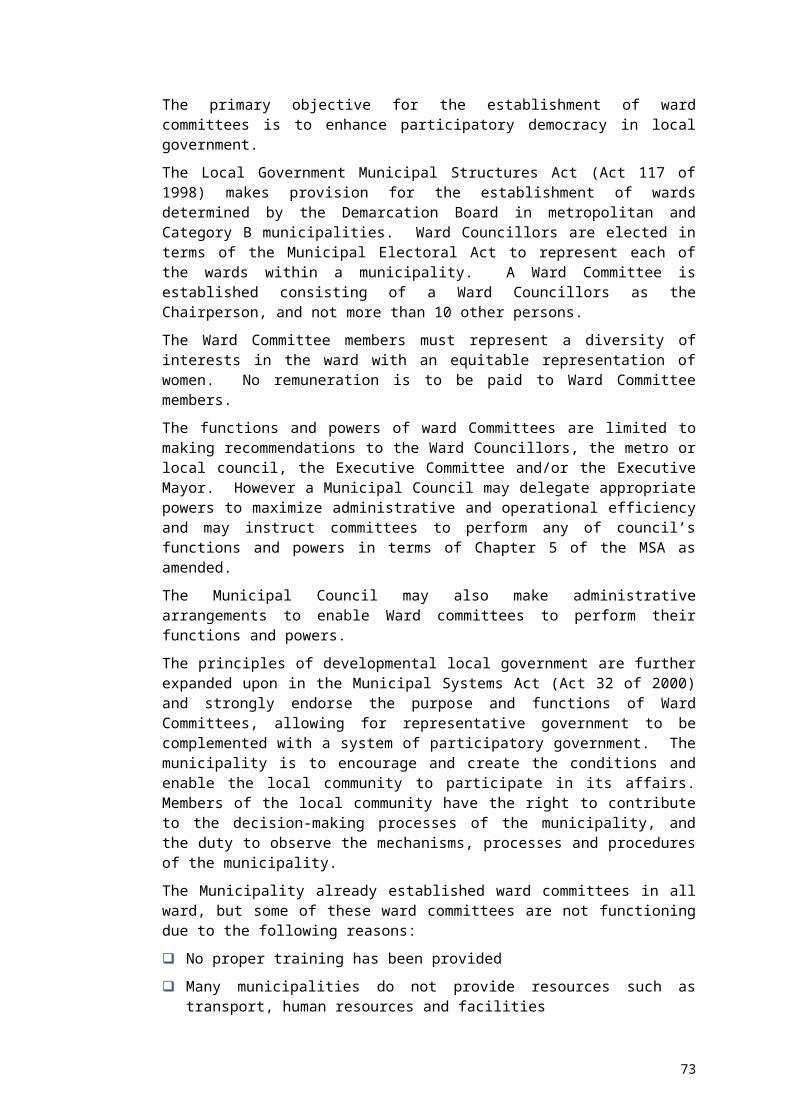
IDP No PROJECT FUNDINGAMOUNT SOURCE
SHS14 Extension of school grounds in Matlhomola, Griekwastad
SHS15 Township Establishment in Bucklands
CoGHSTA
SHS16 Township Establishment in Salt LakeSHS17 Transferring of Title Deeds to
beneficiaries on formalized sitesCoGHSTA
SHS18 Establishment of a new Drivers Licence Testing Centre and Testing Station in Douglas
SHS Developing of industrial sites for recycling in Griekwastad
SHS19 Developing of industrial sites for recycling in Douglas
SHS20 Establishment of permanent banking facilities in Griekwastad
SHS21 Establishment of a pound for stray animals in Griekwastad
SHS22 Establishment of a pound for stray animals in Campbell
SHS23 Establishment of a pound for stray animals in Schmidtsdrift
SHS24 Establishment of a centre for children/ people with disabilities in Breipaal
SHS25 Establishment of a centre for destitute/ street children in Douglas
SHS26 Establishment of a wellness and fitness centre for the elderly in Griekwastad
SHS27 Construction of a mortuary in Bongani
SHS28 Construction of a Bakery in Campbell
SHS29 Construction of a Shopping Centre in Campbell
SHS30 Construction of a satellite police station in Breipaal
85
Local Economic Development
IDP No PROJECT FUNDINGAMOUNT SOURCE
LED1 Creation of projects such as cleaning, clearing of shrubs and trees greening
LED2 Reviving of Tiger Eye Mining R2 000 000.00 Community and Municipality, Agricultural Dept, Private Companies( banks, IDC)
LED3 Establishment of a Peanut Butter Plant
R 1 500 000.00 District LED, Dept. Agric, GWK
LED4 Crop Farming(Pixley Farmers)
R 800 000.00 Dept. Agric, SEDA, District LED
LED5 Chicken Poultry Project: Griekwastad
R 540 000.00 Dept. Agric, SEDA,
LED6 Training of Small Scale farmers R 280 000.00 GWK, Dept. Agri and SEDA
LED7 Upgrading of Commonage Infrastructure
R 1 000 000.00 Dept. of Agric and Land Affairs
LED8 Establishment of Tourism Information Centre
R 1 200 000.00 Dept. Tourism, District LED, SEDA
LED9 Establishment of a FET centre for artisans
LED10 Production of Window and Door Frames
R 1 300 000.00 Mac Steel, Economic Affairs, District LED
LED11 Production of Building and Paving Bricks
R 850 000.00 District LED, Dept. Economic Affairs
LED12 Recycling of Paper, Cans, Bottles and Iron
R 550 000.00 SEDA, District LED, Economic Affairs
LED 13 Investigate the various uses (feasibility) for the Douglas Resort
R 90 000.00 Treasury, Dept. Tourism, NCEDA
LED 14 Establishment of a Stone Crasher R 2 500 000.00 DME, SEDA, Econ Affairs
LED 15 Upgrading and Reparations of glacial pavements
Dept. Tourism , SEDA
LED 16 SMME Trading Centre upgrading and extension
R 350 000.00 Dept. Economic Affairs, DBSA
LED 17 Planting of trees (greening) Community, Municipality,
86

IDP No PROJECT FUNDINGAMOUNT SOURCE
Agricultural Dept and Private Companies( banks, IDC)
LED 18 Establishing of Heritage site Griekwastad and Campbell
R 500 000.00 Dept. of Tourism
LED 19 Manufacturing of Toilet Roll and Cleaning & Laundry
R 850 000.00 Dept. Economic Affairs, DBSA, SEDA
LED 20 Provisioning of water tanks for rain harvesting
LED 21 Development of an Incentive and Investment Attraction Policy
R 50 000.00
LED 22 Launching of the LED Forum R 50 000.00
Sports and Recreation
IDP No PROJECT FUNDINGAMOUNT SOURCE
SR1 Rehabilitation of Douglas Sports Grounds and Tennis Court
R5 678 000.00 Department of SACLotto
SR2 Upgrading of Siyancuma Sports Facilities
R20 105 431.00 Department of SACLotto
SR3 Upgrading of Parks in Siyancuma R5 000 000.00SR4 Establishment of new Multipurpose
sports facilities in SiyancumaR119 000 000.00
SR5 Maintenance of existing sports grounds in Schmidtsdrift
Health
IDP No PROJECT FUNDINGAMOUNT SOURCE
H1 Building of a new clinic in Ward 4, Breipaal
Dept of Health, Public Works
H2 Building of a new clinic in Matlhomola, Griekwastad
H3 Upgrading of clinic in Ward 5 Breipaal
H4 Upgrading of clinic in CampbellH5 Upgrading of hospital in DouglasH6 Upgrading of hospital in GriekwastadH7 Appointment of a permanent doctor
87

IDP No PROJECT FUNDINGAMOUNT SOURCE
in GriekwastadH8 Establishment of medical services in
SchmidtsdriftH9 Instituting a permanent ambulance
service in SchmidtsdriftH10 Establishment of a wellness and
fitness centre for the elderlyH11 Training on emergency servicesH12 Providing transport to our patientsH13 Home Care based (HIV- and AIDS)H14 Re-engineering of Primary health
care (NHI)DoH(Equitable Share)
H15 HIV Counselling and testingMale medical circumcision(MMC)Outreach activities also to farming areas
DoH(Equitable Share)
H16 Upgrading and Fencing of Breipaal Clinic
DoH
H17 Upgrading of the Griekwastard CHC and Nurses Home
DoH
H18 Upgrading of the Douglas CHC and Nurses Home
DoH
Education and Development
IDP No PROJECT FUNDINGAMOUNT SOURCE
ED1 Establishment of a FET College Education, DBSA, private companies
ED2 Building of a High School in Schmidtsdrift
ED3 Building of a crèche in SchmidtsdriftED4 Building of a crèche in GriekwastadED5 Establishment of a centre for
children/ people with disabilities in Breipaal
ED6 Establishment of a centre for destitute/ street children in Douglas
ED7 Provisioning of transport for learnersED8 Construction of a new library in
BonganiDept. Sports, Arts & Culture
ED9 Upgrading of the mobile Library in Schmidtsdrift to a permanent
R1 000 000.00 Dept. Sports, Arts & Culture
88

IDP No PROJECT FUNDINGAMOUNT SOURCE
structureED10 Upgrading of all Public Libraries in
SiyancumaR80 000.00 Dept. Sports, Arts
& CultureED11 Maintenance of all Public Libraries in
SiyancumaR60 000.00 Dept. Sports, Arts
& CultureED12 Provision of a mobile ablution block
at Riverside SchoolR150 000.00 DoE
ED13 Construction of a large ablution block at Bongani Primary School
R800 000.00 DoE
ED14 Construction of Ablution Block at Plooysburg Primary School
R1 739 000.00 DoE
ED15 Construction of 10 Classrooms, Hall and Nutrition Centre at Bongani Secondary School
On-going DoE
ED16 Double ECD at VaaL-Oranje Primary School
R369 000.00 DoE
ED17 Double ECD at Anderson Primary School
R1 500 000.00 DoE
ED18 Construction of 10 Classrooms, Hall and Nutrition centre at Bongani Primary School
R513 000.00 DoE
Disaster Management
IDP No PROJECT FUNDINGAMOUNT SOURCE
DM1 Development of a Disaster management Plan
R1 800 000.00 PkS DM
DM2 Training the residents on Fire fighting skills
DM3 Provision of swimming, lifesaving and diving skills to residents
Water and Sanitation
IDP No PROJECT FUNDINGAMOUNT SOURCE
WS1 Upgrading of the Water Treatment Works in Douglas
R23 610 546.00 MIG
WS2 Rehabilitation and Upgrading of Douglas Oxidation Ponds
R22 679 567.00 MIG
WS3 Rehabilitation and Upgrading of R10 679 567.00 MIG
89

IDP No PROJECT FUNDINGAMOUNT SOURCE
Douglas Pump StationWS4 Upgrading of sewer network in
Douglas TownWS5 Establishment of an Oxidation Pond
in CampbellR44 000 000.00 MIG
WS6 Installation of internal services in formalized areas of Breipaal
R50 000 000.00 MIG
WS7 Installation of Communal Stand Pipes in Riemvasmaak (Bongani)
R150 000.00 DPW
WS8 Griekwastad Bulk Water Supply Augmentation
R14 532 890.00 MIG
WS9 Campbell full Water borne Sanitation R63 000 000.00 MIGWS10 Establishment of a Water Treatment
Works in GriekwastadR23 000 000.00 MIG
WS11 Water Supply in Salt Lake R20 000 000.00 MIGWS12 Bucklands Bulk Water Supply R16 987 000.00 MIGWS13 Upgrading of Douglas Reservoir
ComplexR15 610 546.00 RBIG
WS14 Schmidtsdrift Zone 5 Sewer Reticulation and Oxidation Ponds
R17 611 000.00 MIG
WS15 Construction of New Bongani Outfall Sewer to increase capacity
R19 960 000.00 MIG
WS16 Updating of Siyancuma Water Services Development Plan
R4 990 000.00 DWS
Roads and Storm water
IDP No PROJECT FUNDINGAMOUNT SOURCE
RS1 Rehabilitation of tarred roads in Siyancuma
R32 781 000.00 MIG
RS2 Development of Roads and Storm water Master Plan
R4 990 000.00 MIG
Electricity
IDP No PROJECT FUNDINGAMOUNT SOURCE
E1 Provision High Mast lighting in Douglas and Griekwastad
R 5 450 000.0 MIG
E2 Provision of High Mast Lighting in Campbell and Schmidtsdrift.
R5 450 000.00 MIG
90
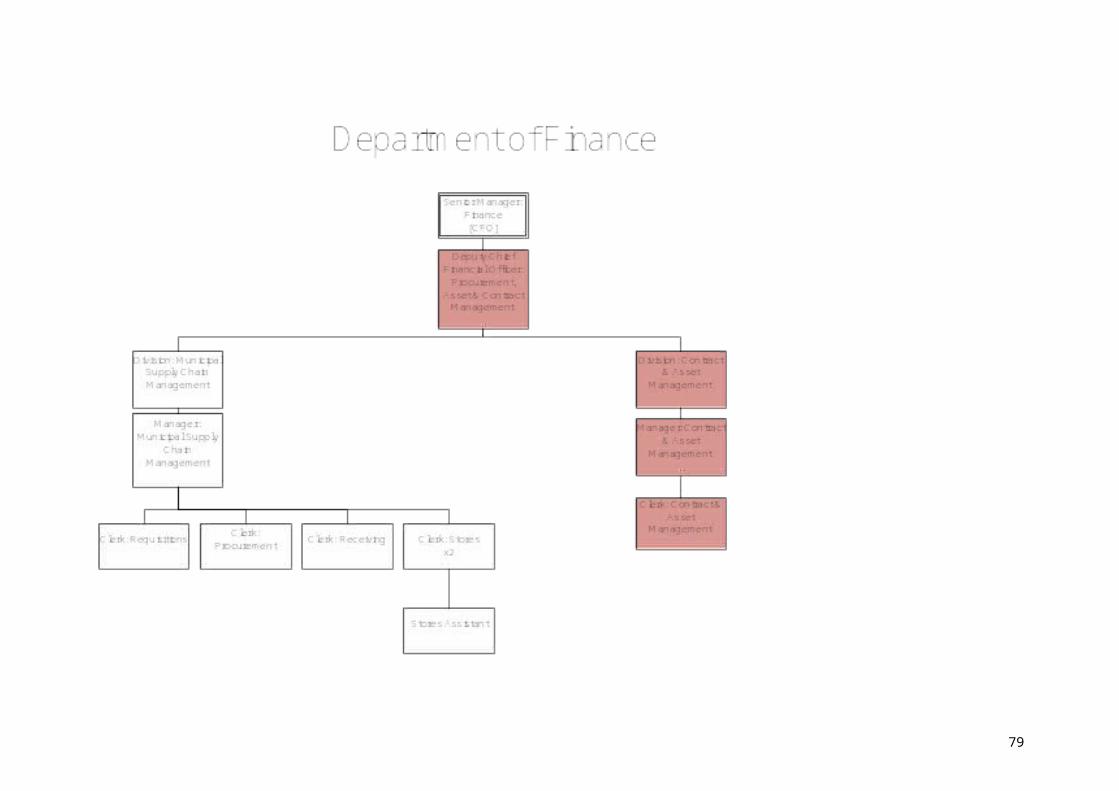
E3 Installation of street lighting in affected areas in Siyancuma
R10 000 000.00 DPW
E4 Electrification of 350 sites in Schmidtsdrift
R 3 500 000.00 Dept of Energy
E5 Electrification of 147 stands in Griekwastad (Turnkey Appointment)
R 2 499 000.00 INEP
E6 Bucklands Electrification: 200 connections
R 3 400 000.00 Eskom
E7 Provision of Bulk supply line to Schmidtsdrift Zone 5
R1 100 000.00 Eskom
E7 Upgrading of Bongani Bulk Supply R2 450 000.00 INEPE8 Installation of Solar Panels and
Geysers.R63 087 636.00 Eskom
E10 Development of Siyancuma Energy/ Electricity Master Plan
R4 990 000.00 Dept of Energy
Transport
IDP No PROJECT FUNDINGAMOUNT SOURCE
T1 Establishing a taxi rank: Schmidtsdrift
R5 000 000.00 Dept of Transport
T2 Upgrading of taxi rank: Griekwastad R4 000 000.00 Dept of TransportT3 Establishing a taxi rank: Campbell R5 000 000.00 Dept of TransportT4 Establishing a taxi rank: Douglas R9 000 000.00 Dept of TransportT5 Coordinating transport permits for
communityCommunity, -M.M, - Dept of Transport
T5 Establishment of a new Drivers License Testing Centre (DLTC) in Douglas
T6 Establishment of a satellite Drivers License Testing Centre (DLTC) in Campbell
T7 Establishment of a new Vehicle Testing Station (VTS) in Douglas
T8 Replacement of stolen and vandalized road signs and painting of road marks
91
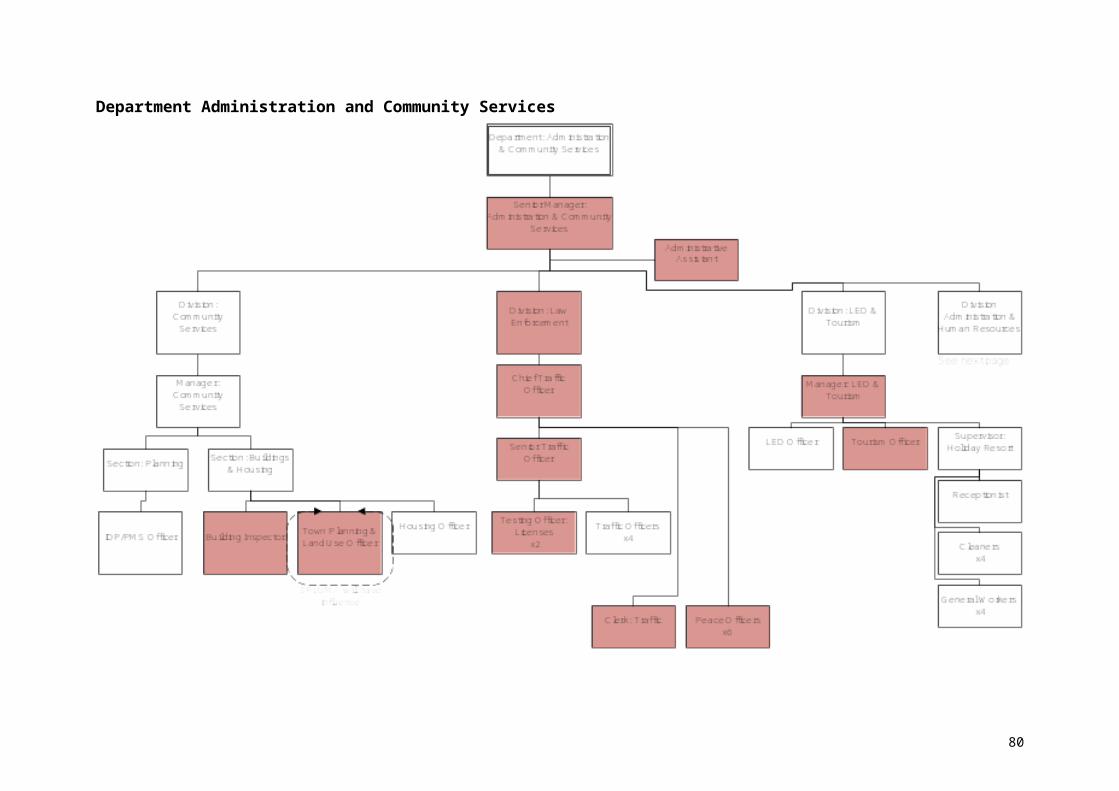
Waste Management
IDP No PROJECT FUNDINGAMOUNT SOURCE
WM1 Provision of new Waste Management sites in Douglas and Campbell
R25 750 000.00 MIG
WM2 Provision of new Waste Management sites in Schmidtsdrift Griekwastad
R25 750 000.00 MIG
WM3 Provisioning of wheely bins to curb illegal dumping
Public Facilities
IDP No PROJECT FUNDINGAMOUNT SOURCE
PF1 Rehabilitation of Community Halls in Campbell, and Griekwastad
R2 500 000.00 Public Works
PF2 Establishment of new Cemeteries in Campbell and Griekwastad
R10 640 000.00 MIG
PF3 Establishment of new Cemeteries in Schmidtsdrift and Douglas
R10 640 000.00 MIG
PF4 Construction of a Disaster Management Centre in Douglas
R9 741 000.00 MIG
PF5 Upgrading of Community Halls in all Wards
R6 000 000.00
PF6 Building of a new Community Hall in Ward 4, Breipaal
R8 000 000.00
92
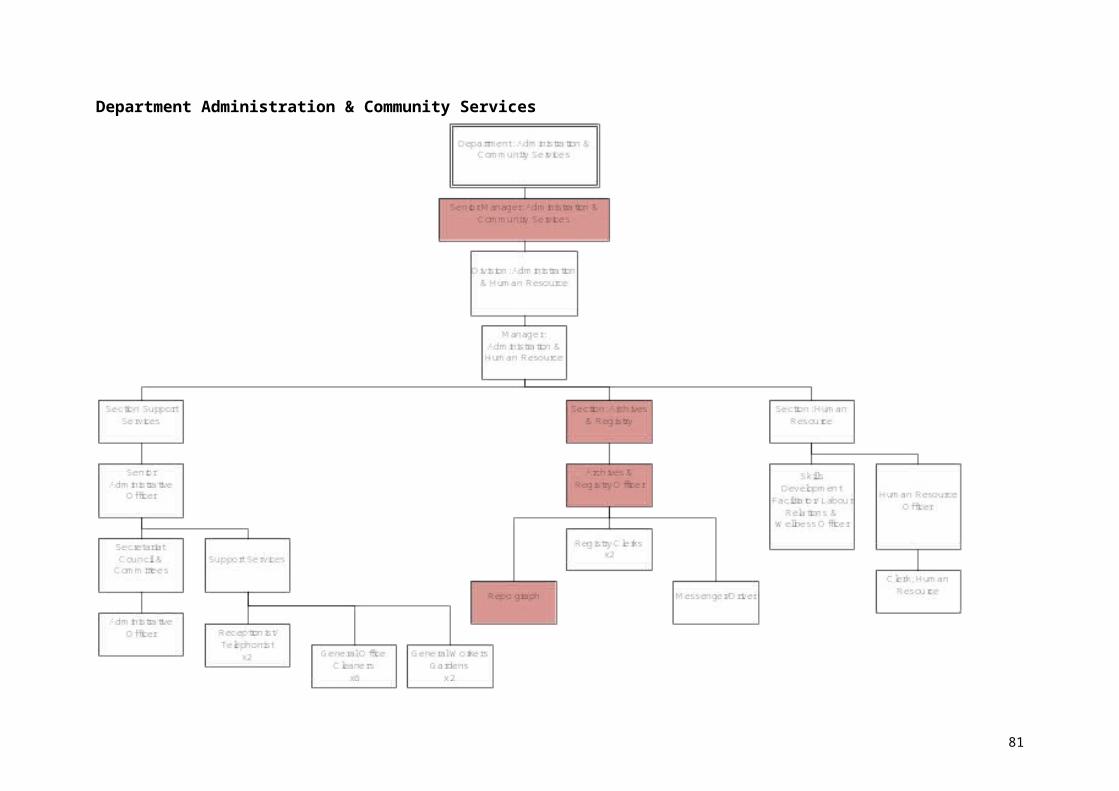
6. CHAPTER SIX : ALIGNMENT AND INTEGRATION
During this phase of the IDP, true meaning is given to the process of integrated development planning. With the designed projects for implementation in mind, the integration phase aims to align these different project proposals firstly with specific deliverables from the IDP and secondly with certain legal requirements.
More specifically, the projects have to be aligned with the agreed objectives and strategies to ensure transparency as well as with the available financial and institutional resources to ensure implementation.
Furthermore, the projects also need to be aligned with national and provincial legal requirements to ensure uniformity and compatibility with government strategies and programmes.
Instead of arriving at a simplified “to do” list for the next five years, the aim is to formulate a set of consolidated and integrated programmes for implementation, specifically focusing on contents, location, timing and responsibilities of key activities.
The integration requirements are divided into three broad categories namely:
Integrated sector programmes;
Internal planning programmes; and
External policy guideline requirements.
6.1. INTEGRATED SECTOR PROGRAMMES
Integrated sector programmes forms the basis for preparing budgets and future sectoral business plans. There are currently three sectors that require special sector plans, as indicated below, the outputs of which are not applicable to the Local Municipality at present. Consequently, the following three special sector plans do not form part of the IDP:
Water Services Development Plan (“WSDP”);
Integrated Transport Plan (“ITP”); and
Integrated Waste Management Plan (“IWMP”).
From the project planning and design sheets it was possible to compile a list of sector specific projects from the multi-sectoral IDP projects. The sectoral programmes are indicated overleaf and relate to projects representing both sector components as well as the following sector departments within the Municipality:
Municipal Manager
Technical services
Housing and Land Affairs
Human Resources and Administration
Financial Services
Economic Development Task Team
93
It is important to note that these programmes do not only make provision for IDP related projects but also other project costs and activities in order to create a comprehensive picture for budgeting purposes. Summary of the sectoral plans and programmes are included at the end of this chapter.
6.2. INTERNAL PLANNING PROGRAMMES
In order to set up close links between planning and budgeting as well as between planning and implementation, a number of internal planning programmes are required. These plans, however, do not only serve as a framework for managing finances, but it also sets the groundwork for regular management information in respect of monitoring progress and performance.
Finally, it also demonstrates compliance of the IDP with spatial principles and strategies and which serves as a basis for spatial co-ordination of activities and for land use management decisions.
The status of the relevant internal planning programmes is indicated in the table below.
6.3. EXTERNAL POLICY GUIDELINE REQUIREMENTS
In order to complete the integration phase of the IDP, it is necessary to check consistency with policy guidelines of certain cross-cutting dimensions. This requires the formulation of several programmes which assess the effect or impact of project proposals in relation to poverty reduction and gender equity, environmental practices, economic development and employment generation as well as the prevention and spreading of HIV / AIDS.
The status of the relevant external policy and guideline programmes is indicated in the table below. Those that are available were included as Annexure to this document.
6.4. NORTHERN CAPE GROWTH AND DEVELOPMENT
STRATEGY
The PGDS is a strategic and integrated provincial development plan providing direction and scope for province-wide development programmes and projects within the context of a long term perspective and taking into consideration the resources and constraints. The PGDS provides a spatially referenced framework for both public and private sector investment, indicating areas of opportunities and developmental priorities and enabling intergovernmental alignment. It guides the activities of all agencies and role-players by linking and deepening the application of the NSDP and of the MTSF in areas of shared impact.
94

The Northern Cape Provincial Growth and Development Strategy (NCPGDS) evolved after an extensive consultative process with all spheres of government, organized labour, all formations of organized business and civil society. This process culminated in a stakeholder summit that was held on the 27 and 28 October 2004. This was, thereafter, followed with the adoption of the strategy in mid-January 2005 by the Executive Council. The PGDS was publicly launched at the end of January 2005.
The strategy realizes the hope of sustainable and integrated development that seeks to promote economic growth and social development, improve the quality of life of all its citizens, improve the institutional efficiency of government, attain regional integration and enhance innovation. The PGDS is a further elaboration of an adopted policy framework that attempts to provide a clear vision for growth and development. The strategy identifies both opportunities and challenges and provides for strategic interventions in dealing with them.
The PGDS identifies the comparative advantages and opportunities that emanate from an analysis of the mining, agriculture, manufacturing, fishing and mariculture, and tourism sectors that can turn the economy of the province around. The industrial value chain becomes the catalyst towards building local economies in these competitive sectors. This approach forms the basis of ensuring that the resources of the province are geared towards having the greatest impact for meaningful local economic growth and development – bridging the divide between the first and second economies.
The PGDS also focuses on issues around social development and has developed targets and strategies that that address the challenges that are faced in health, education, housing, water, sanitation, electricity, crime reduction and social services to name but a few. It further provides for interventions that promote human and capital development.
The PGDS asserts that it is only through the proper institutional arrangements, and, in particular, strong partnerships among all stakeholders in development that the province can realize its vision of effectively reducing poverty. The development targets as espoused in the PGDS and the realisation of the potential of the province will be achieved through the collaboration of all stakeholders.
And finally, the PGDS makes adequate provisions for the incorporation of all the national planning instruments, including the National Spatial Development Perspective and the Medium Term Strategic Framework, inter alia, as well as the District and Local Municipal IDP’s with the provincial development imperatives.
6.5. PIXLEY KA SEME DISTRICT GROWTH AND DEVELOPMENT STRATEGY
In 2006, the District and Local Municipalities compiled their District Growth and Development Strategy (DGDS). The strategy is a living document that should help the district achieves its development goals which are;
To stimulate economic development
To develop and enhance infrastructure for economic growth and social development
95

To reduce poverty through human and social development
To ensure a safe and secure environment for all people of the district and
To promote effective and efficient governance and administration
The strategy covers 6 sectors that are critical for unlocking the economic potential within the district. These sectors are:
Agriculture and agro-processing
Mining and mineral processing
Tourism
Manufacturing
Wholesale and retail; and
Local economic development
The following basic guiding principles, taken together as a whole structure the philosophy that underpins the District Growth and Development Strategy:
An Integrated developmental approach that brings together the strategies and programmes of the three spheres government for sustainable growth and development
The utilization of resources – human, financial and natural – that ensures that the capacity and efficiency are enhanced in order to meet the challenges of growth and development
Facilitating growth and development through effective partnerships between the state, private sector, organized labour and civil society and to meet the socio-economic challenges confronting the district
Ensuring transparency and accountability in shaping the future of the Pixley ka Seme District through participatory democracy and good governance
Contributing to national and international commitments such as the WSSD, the Millennium Development Goals and the objectives of the RDP
The specific and complementary role that each sphere of government and each sector of society has to play in ensuring socio-economic development and transformation
The Constitutional obligation to provide for the rights and needs of all citizens of the district
Striving at all times to advance the needs of the historically disadvantaged, including all vulnerable groups, whilst ensuring at the same time that all persons are treated equitably
The promotion of spatially coherent district and local economic development and improved service delivery systems
In order to position the entire district, the District Council will be adopting the strategy to make it a legal document that will guide development in the region.
96

6.6. MEDIUM TERM STRATEGIC FRAMEWORK
The Medium Term Strategic Framework is a reflection of government’s assessment of, and perspective on, key developmental challenges at a particular point in time, as well as a statement of intent - with strategic objectives and targets - as to the way it envisages addressing the challenges over the medium term, that is, five years. It serves as a backdrop to guide planning and budgeting across the three spheres of government.
Government is currently implementing the electoral mandate based on the core objectives of increasing employment and reducing poverty. This mandate is premised on a people’s contract that defines the strategic objectives and targets for a five year period.
The MTSF also takes into account the fact that global and domestic conditions may change over time. Although it is recognized that there are many things government does and should continue to do, it should also define a new trajectory of growth and development, identify the key things to attain it and make strategic choices in expending effort and allocating resources. Arising out of this, the logical path of development can be summarized as follows:
The central intervention that is required is to grow the economy:
State intervention in promoting the involvement of the marginalized in economic activity, including sustainable livelihoods
Welfare grants should be seen as a temporary intervention which should diminish at the same rate that economic interventions succeed
The performance of the state, the campaign against crime and international relations should improve mainly to promote economic growth and social inclusion.
The strategic priorities that have been identified include economic and fiscal policy trade-offs, increasing the rate of investment, both private sector and public sector investment, facilitating economic activity within the second economy (the Expanded Public Works programme, development of small and micro-enterprises, direct facilitation of job creation, skills development and work experience and land reform and agricultural support programmes), preserving and developing human resources for and through economic growth.
The central tenet of the MTSF recognizes that government has to pursue higher economic growth through all its programmes, while using the space that higher growth affords to put the country on a higher development trajectory which ensures all-round improvement in the quality of people’s lives.
In localities with low development potential, government spending beyond basic services should focus on social investment, such as human resource development, labour market intelligence and social transfers, so as to give people in these areas better information and opportunities. This will enable people to become more mobile and migrate, if they choose to, to localities that are more likely to provide sustainable employment or other economic opportunities. The further concentration of people in need in areas of low potential should therefore not be encouraged.
97

6.7. INSTITUTIONAL DEVELOPMENT PLAN (IDP)
6.7.1.Mandate
The constitution assigns the developmental mandate to local government this implies that all municipalities must strive to achieve the goals of local government within its financial and institutional capacity, namely:
To promote democratic and accountable government for local communities
To ensure the provision of services to communities in a sustainable manner
To promote social and economic development
To promote a safe and healthy environment
To encourage the involvement of communities and community organizations in the matter of local government.
It further requires municipalities to structure and manage their administration and budgeting and planning process to give priority to the basic needs of the community and to promote the social and economic development of the community whilst participating in national and provincial development programmes.
6.7.2.Powers and Functions
The Local Government Municipal Structures Act (Act 117 of 1998) sets out the basis for the establishment of new municipalities. This legislation divides municipalities into the following categories: Category A is metro council’s; Category B is local councils and Category C is District Municipalities. The Act also defines the institutional and political systems of municipalities and determines the division of powers and functions between the categories.
According to Chapter 5 (Section 83 (1)) of the Act, a local municipality (Category B) has the functions and powers assigned to it in terms of Sections 156 and 229 of the Constitution. Section 156 deals with the powers and functions of municipalities, while Section 229 deals with fiscal powers and functions.
The division of functions and powers between district and local municipalities are described in Section 84 of the Act and the adjustment of division of functions and powers between district and local municipalities by the Provincial MEC for local government is described in Section 85 of the Act.
98

The passing of by-laws is one of the tasks of municipalities. The Local Government Municipal Structures Act (Act 117 of 1998) directs that after amalgamation, all existing by-laws had to be reviewed and rationalized. An analysis of the status quo of Northern Cape local governance found that in the year after amalgamation, the most common by-law passed was credit control by-law. (DH&LG, 2002)
In general, the Minister of Provincial and Local Government had authority to assign certain functions to local and district municipalities. According to Provincial Gazette of June 2003, the local and district municipalities have been authorized to perform the following functions.
The Water Services Act (Act 108 of 1997) transfers the responsibility for the provision and management of existing water supply and sanitation from national to local government. The two key areas of responsibility in terms of water services provision are the governance functions and the provision functions. Governance functions are legally the responsibility of the Water Services Authority (WSA) and include the planning and regulatory functions, as well as ensuring water services provision, which includes monitoring, finances, governance, contracts, and reporting. According to the Constitution and the Water Services Act, local government is responsible for ensuring water services provision to its constituency.
Local authorities may be constituted as Water Services Authorities, and would have the role of selecting and appointing a Water Services Provider (WSP) for their area. The WSA may however not delegate the authority and responsibility for providing services of adequate standard to all residents within their areas of jurisdiction. In some cases a WSA can simultaneously be the WSP.
6.8. WATER SERVICE DEVELOPMENT PLAN
Siyancuma Municipality completed and adopted its Water Services Development Plan as a Business Plan in the year 2001. The plan was funded by the Department of Water and Sanitation (DWS) and was done in two fold.
The first part includes the identification of Water Services and Sanitation backlogs as well as areas for infrastructure development. A complete plan was drawn up and twenty four (24) projects were identified to ensure better services for all residents of Siyancuma Municipality as well as other users.
The second part includes Water Services Development (The Human side). This refers to skills development to ensure better and quality service by both the Water Services Authority (WSA) and water Services Provider (WSP).
VisionThe Siyancuma Municipality’s vision is: “Better and Quality Water Services to all”.
MissionIt is the mission of this Municipality to ensure clean potable water to all its residents and other users and a safe and healthy environment to all through
99

awareness campaigns and continuous training and strategies to get all parties involved.
Development objectivesTo ensure the Municipality accomplish its vision the municipality came up with a strategic plan developed in the form of the Water Services Business Plan.
The goals: To identify all Water Services (Water and Sanitation) backlogs
To reduce Water Service Backlogs
To list projects regarding the identified backlogs.
The objectives: Quality services for all
At least basic water and sanitation services to RDP standards by 2006
Eradication of bucket system
Potable clean for all
Improve water quality where it’s below standard.
Ensure sustainable and affordable Water Services.
StrategiesProgrammes and activities to ensure “Better and quality service to all” include:
Embark on National Governments Programme of awareness and training
Training and development of staff
Community awareness through workshops and voluntary workers.
Infrastructure development
Strategies as identified in the Water Services Business Plan (WSBP)
The above programmes and activities are to be adopted and executed by all involved in Water Services. Non-governmental Organisations like the Campbell Sanitation Committee are to be continuously used and trained and attempting community participation.
Water Boards, like the smaller Plooysburg Water Board are to be pulled in as to ensure quality services to all.
6.9. SPATIAL DEVELOPMENT FRAMEWORK
The Siyancuma Council have embarked on an Integrated Land-use and Spatial Development Framework to ensure previously disadvantaged communities are well integrated with other communities and also to try and minimise the travelling distance to the Central Business District (CBD).
The Land-use and Spatial Development Plan includes the urban areas as described under the introduction and history of Siyancuma Municipality. These
100

include Douglas, Griekwastad and Campbell. The rural settlements and restitutions are excluded because they are mainly private land and or title deeds for restitutions have not been clarified yet.
Furthermore, it is not clear what the role of council is in the development of restitutions.
As for the private land council still negotiate with the owners regarding services. It is also not clear what the responsibilities of the Local Authorities and the District Municipality regarding services on farms are, especially with reference to Water Services Authorities and Water Services Providers.
VisionTo provide and integrate land and space for the different use as needed by all residents of Siyancuma Municipality and other stakeholders from the different spheres of society.
MissionTo ensure there is enough and suitable land for use and development by all stakeholders living and operating in the Siyancuma Municipality through land and spatial development, ensuring that proper identification, planning and development of land was made for future use.
Development ObjectivesThe Land-use and Spatial development plan of the Siyancuma Municipality was developed taking the following goals and objectives into account:
The goals: Identification of land through community participation improved with 50%
by 2016
Identification of land for the different use finalised by 2016
Ensuring land identified are sufficient for the specified use by 2016
The objectives:
Reduce housing backlogs of Municipality and land needed (See Spatial Framework)
Determine sufficiency of land for current and future use
Ensuring identified land is suitably located
Reduce disordered and illegal squatters with 50% by 2016.
StrategiesAs a strategy to minimise disordered and illegal squattering Council embark on a programme of land identification. The activities include the following:
Determination of housing backlogs for Douglas, Griekwastad and Campbell.
Determination of Total land and sites needed to address backlog
Determination of space needed for other land-use
Identification of suitable land by Ward Councillors and their committees
101

Search for funds to do Town planning and Land Survey
Town planning and Land Survey
Development of identified land for use.
Pricing and advertising of proclaimed and developed sites.
The calculations for land-use and spatial development were made for short to medium term (1-5 years) and long term (10-15 years). This gives Council the opportunity to look at the current and future situation. Council will than come up with resolutions for integrated development and decide whether it needs to purchase private land for suitability.
6.9.1.The Mandate
Municipalities are required to compile Spatial Development Frameworks (SDFs) as core components of their IDPs as prescribed by the Local Government: Municipal Systems Act, 200 (Act 32 of 2000). According to the Draft Land Use Management Bill (July 2001) all local municipalities within the area of the district municipality must align their SDF’s in accordance with the framework of integrated development planning referred to in Section 27 of the Municipal Systems Act.
6.9.2.The Role and Purpose of a SDF
The role and purpose of a SDF are:
1. To guide spatial planning, land development and land use management in the local municipal area, and
2. To give strategic direction in terms of investment in the local municipal area.
The purpose of this document is:
To translate the SDF into a more detailed and geographically specific land use management tool.
To consolidate, update and review existing spatial planning and development management mechanisms.
To guide the preparation of more detailed local area plans, precinct plans and land use schemes.
To provide a more concrete spatial and land use guideline policy for use by municipal and other infrastructure service providers in planning and delivering their services.
To provide direction and guidance to private sector and community investors with respect to the levels, locations, types and forms of investment that need to be made, and that will be supported by the Local Municipality.
102

6.9.3.Key Spatial Issues in the Municipal Area
From the above spatial overview and identified local spatial issues, the following key regional spatial issues were identified as the basis to be address by the spatial development framework.
6.9.4.Access to land
The issue of access to land relates both to the local authorities as well as individuals and groups. As far as individuals and groups are concerned, the burning issues are access to residential land in urban areas and to agricultural land for emerging farmers.
6.9.5.Land development
Land Development relates to the availability, preparation and funding of certain key land uses such as sites for housing developments, land for needed social amenities and economic activities. The key issues requiring attention in this regard include: the generation of proper information of projected land development needs, funding, co-operation and local capacity to evaluate development applications.
6.9.6.Spatial integration
Spatial integration has to focus on both a macro and a micro level. On a macro level there is a need for a more focused development at key nodal points to develop the region strategically within current resource constraints. On a micro level, most town areas are still geographically segregated and direct intervention within former buffer strip areas will be required to integrate communities.
6.9.7.Sustainable land management
The long-term sustainability of all land development practices will be the key factor in the environmental and economic future of this predominantly agricultural region. Specific attention will have to be given to the building of capacity amongst especially emerging land users and the provision of a management framework to all land users within the district.
6.9.8.Proper distribution network
The vast distances between the various towns in the district make all communities dependent on the regional distribution roads for social as well as economic functioning. Most of these roads are however in a state of disrepair and especially
103
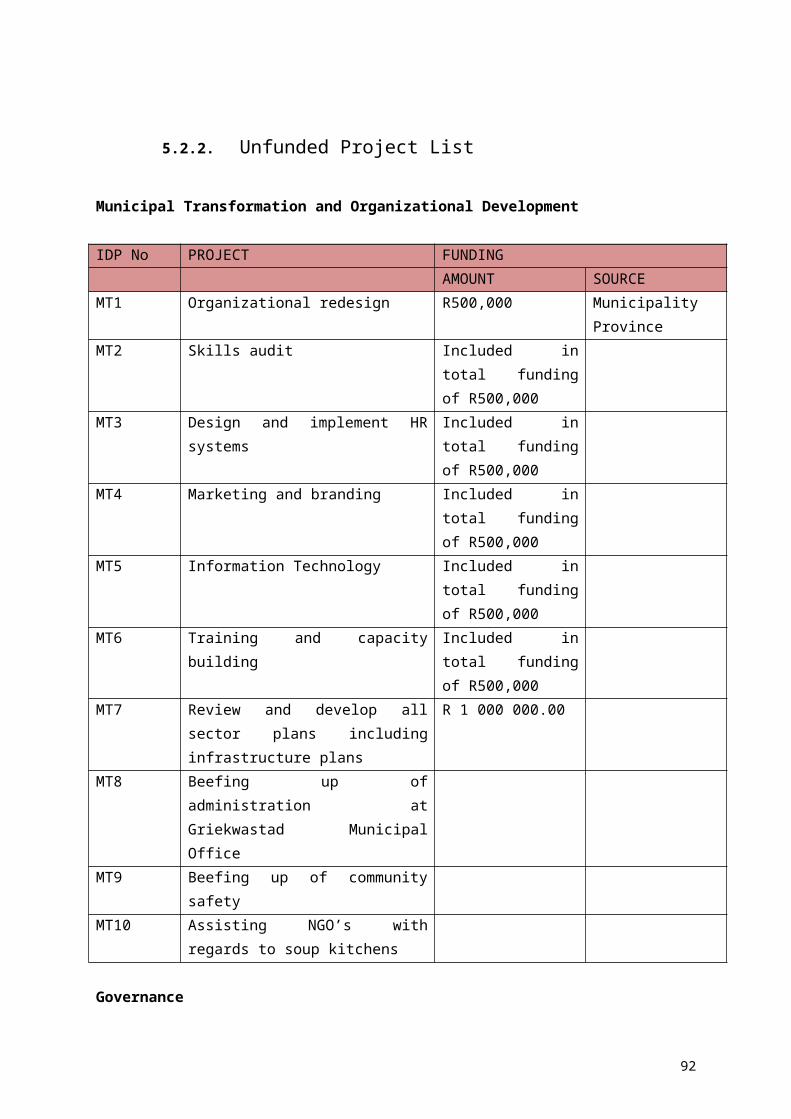
the routes falling within the corridor areas will have to be upgraded and maintained as a matter of urgency.
6.9.9.Water resource challenges
One of the major challenges facing government is to promote economic growth and job creation, while at the same time providing for social development as a means to addressing the needs of the poor. Economic development requires sustainable bulk water supply. In several communities are experiencing water problems. Most of these towns rely on groundwater.
6.10. INTEGRATED DISASTER MANAGEMENT PLAN
6.10.1. Introduction
A disaster is an event, which disrupts the daily life of the population, a community, or country and can result in substantial loss of life and social upheaval, leading to many persons becoming homeless, helpless and hungry. The situation is further aggravated by the disruption, dislocation or loss of vital economic production and national infrastructure including water and power supplies, communications and transportation.
Disasters occur when hazards affect a community to the extent that available resources cannot cope with the problem effectively. The community itself needs support and assistance, to prevent and cope with disasters and their effects.
Like many Municipalities, the Northern Cape is at risk from a wide range of natural, technological and environmental hazards that can lead to disaster such as droughts, foods, major fires and even earthquakes.
In the past, the District Municipality has pursued various strategies to counter the effects of these disasters. However, it has now been recognized that these strategies were not adequate. There is a need for a clear policy on risk reduction and Disaster Management that is pro-active and not re-active.
6.10.2. Purpose
The overall purpose of the Disaster Plan is:
to promote an integrated coordinated approach to Disaster Management
to identify key role – players and their responsibility
to identify the population at risk
to put effective risk reduction, preventative and mitigation strategies in place
to develop, improve and maintain disaster preparedness and response capabilities
104

to provide a foundation the effective utilization of resources
to promote training and education programmes that are focus at the public, private sectors, volunteers and government
to encourage community self sufficiency
6.10.3. Planning assumptions
1. The Municipality will continue to be exposed to the hazards.
2. Implementation of this plan will reduce disaster – related losses.
3. Comprehensive Disaster Management includes activities to mitigate, prepare for, respond to and recover from the effects of a disaster.
4. Municipality officials recognize their responsibilities with regard to public safety and accept them in the implementation of this plan.
5. In responding to a disaster, the Municipality is prepared to implement policies regarding utilization of public and private resources.
6. There may be a delay in activating the Disaster Management Plan.
7. Initial response by the Municipality will be to take actions that have the greatest lifesaving potential under the circumstances.
8. Assets and system may be overwhelmed, especially during the few days of a disaster. Accordingly, citizens will most likely be on their own and self – sufficient for 24 – hours.
9. In situations not specifically addressed in this plan, the Municipality will improve and carry out their responsibilities to the best of their abilities under the circumstances
6.10.4. The effects of disaster
Disasters are resulting in environmental degradation and increased poverty. Several areas near rivers are occupied by informal settlements without any or with only inadequate essential services. This resulted in high level of pollution of the rivers and the immediate environment. On farms, poor farming practices have increased the degradation of the land thus increase the risk of drought.
Development projects in the District Municipality are hampered by recent disasters: finances are been needed to address the consequences of floods, fires, droughts, and this reduced the funds available for development.
From a developmental perspective, disasters are not seen as isolated random acts of nature. Rather, disasters are increasingly viewed as an expected consequence of poor risk management over the long – term. They are the outcome of interconnected social and physical processes that increase risk and vulnerability to even modest threats.
From this perspective, both reduction and Disaster Management are clearly multi – disciplinary processes, engaging a wide range of stakeholders. In the broadest
105

sense, risk reduction is a developmental imperative for achieving sustainable growth, as well as a strategy that protects the lives and livelihoods for those most vulnerable.
In the view of Disaster Management – the expanded – contract model – Disaster Management is seen as a continuous process. Disasters are managed in a parallel series of activities rather than in a sequence of actions. The different strands of activities or continues side-by-side, expanding or contracting as needed.
If the local authority cannot cope with the situation it must request assistance/support from the District level;
If the District cannot cope, it must likewise request support from the PDM.
6.10.5. Response
Response consists of activities designed to address the short – term effects of a disaster. This includes departmental response, resources coordination, organizational structure, warning systems, and communication.
Response Partners: A number of partners may be involved in responding to a disaster. The most common first responders are SAPS, Municipal officials, fire and rescue, emergency medical services, community volunteers and public work personnel. Disaster Management teams must work closely with these partners to determine the type of response required for each hazard identified and the capacities and resources needed by responders.
Resource coordination: During a disaster, most communities and organizations will not have enough resources. A number of gaps in resources will be identified during the planning process. The department should consider how extra resources could be accessed in case of a disaster. Private industry and other nearby Municipalities may be able to provide assistance. Resources based outside your District Municipality may not be immediately available after a disaster, so it may be necessary to have interim plans.
Organizational Structure: The organizational structure during a disaster is usually different from day-to-day management. The joint Operation Centre (JOC) is the structure used in the District Municipality in case of a disaster. To prepare people to successfully fulfil their roles, the structure needs to be practiced through training and exercises.
Warning System: A warning system is needed in case of a disaster. Based on their hazard analyses, the District Municipality has already implemented warning systems, which are linked to the communication system.
The District utilizes the following means of communication:
Telephones and Cell phones
NEAR
Radio and news media
Recovery from a disaster consists of a whole range of activities designed to restore community life and services to normal levels. Recovery also reduces the future vulnerability of the community and improves planning for future events.
106

Short – term recovery from a disaster returns vital life support systems to minimum operating standards. Long – term recovery may continue for years.
The community should be involved in recovery, including certain levels of government, the business sector, families and individuals. Ideally, disaster recovery processes will improve the community and make it a better, safer place for citizens.
6.10.6. The District Municipal Disaster Management Framework
The aim of the framework is to provide for an integrated and uniformed approach to matters pertaining to DM.
The District Disaster Management Framework comprises six key performance areas (KPA’s). Each KPA is informed by specified objectives and, as required by the Act, key performance indicators (KPI’s) to guide and monitor its implementation.
The relevant funding and financial arrangements for the implementation of the Act are described in KPA 1 and incorporated into each respective key performance area.
Key performance area 1 focuses on establishing the necessary institutional arrangements for implementing Disaster Management within the District and Municipal spheres of government and describes some of the mechanisms for funding Disaster Management.
It specifically addresses the application of the principles of cooperative governance for the purposes of Disaster Management. It also emphasizes the involvement of all stakeholders in strengthening the capabilities of District and Municipal organs of state to reduce the likelihood and severity of disasters.
KPA 1 describes with inter-district role – players. It also outlines the institutional arrangements for establishing the disaster management information system required by the Act.
Key performance area 2 addresses the need for disaster risk assessment and monitoring to set priorities, guide risk reduction action and monitor the effectiveness of our efforts.
Although the Pixley ka Seme District Municipality faces many different types of risk, disaster risk specifically refers to the likelihood of harm or loss due to the action of hazards or other external threats on vulnerable structures, services, areas, communities and households.
KPA 2 outlines the requirements for implementing disaster risk assessment and monitoring by organs of state within all spheres of government.
Key performance area 3 introduces Disaster Management Planning and implementation to inform developmentally – oriented approaches, plans, programmes and projects that reduce disaster risks.
KPA 3 addresses requirements for the alignment of Disaster Management Framework and planning within all spheres of government.
107

It also gives particular attention to the planning for and integration of the core risk reduction principles of prevention and mitigation into ongoing programmes and initiatives.
Key performance area 4 presents implementing priorities concerned with disaster response and recovery and rehabilitation.
KPA 4 also addresses requirements in the Act for an integrated and coordinated policy that focuses on rapid and effective response to disasters and post – disaster recovery.
When a significant event or disaster occurs or is threatening to occur, it is imperative that there must be no confusion as to roles and responsibilities and the procedures to be followed.
The KPA further describes measures to ensure effective disaster response, recovery and rehabilitation planning.
Key performance area 5 addresses Disaster Management priorities in public awareness, education, training and research.
It addresses requirements to promote and support a broad – based culture of risk avoidance through strengthened public awareness and responsibility.
KPA 5 describes mechanisms for the development of both non – accredited and accredited education and training for Disaster Management and associated professions and the incorporation of relevant aspects of Disaster Management in primary and secondary school curricula. It also addresses priorities and mechanisms for supporting and developing a coherent and collaborative disaster risk research agenda.
Key performance area 6 presents processes for evaluation, monitoring and improvement of Disaster Management as envisaged in the implementation of the Act. It introduces a range of mechanisms for measuring and evaluating compliance with the National Disaster Management Framework and the Act.
These include performance audits, self – assessments, peer reviews, reviews of significant events and disasters and rehearsals, simulations, exercises and drills.
6.10.7. Disaster NotificationNotification of a disaster might reach key role players via the following modes:
word of month
radio
telephone
newspaper
NEAR Communication
The report will be forwarded to the district disaster centre and then to the Provincial disaster centre. The report might also come through the Provincial centre but will be forwarded to the relevant centres and role players.
The following information will be conveyed:
108

1) Date and time of event
2) Location
3) Number of people affected
4) Organizations / departments who responded
5) Immediate needs
6) Other relevant information
Disaster Centres will reflect receipt of notification of all Role – players. Follow up call will be made to parties from the relevant centre to ensure receipt of information.
6.10.8. Declaration of State Disaster
In terms of section 55 of the Act, the Council of the District Municipality will declare a disaster.
In order to do this
the District Council must consult with Local Municipalities
after consultation declare the disaster
The following systems must be considered
current legislation
contingency arrangement
ability / capacity to deal with the disaster
special circumstances that warrant declaration
After the declaration of a District Disasters, regulations or direction must be issue with regard to:
mobilizing of available resources
evacuation of temporary shelters
regulation of traffic and movement of goods
communication systems
information management
facilitation of response and post – disaster recovery
The above powers are exercised in order to protect property, lives of people, prevention of destruction, and minimize the effects of the disaster
109
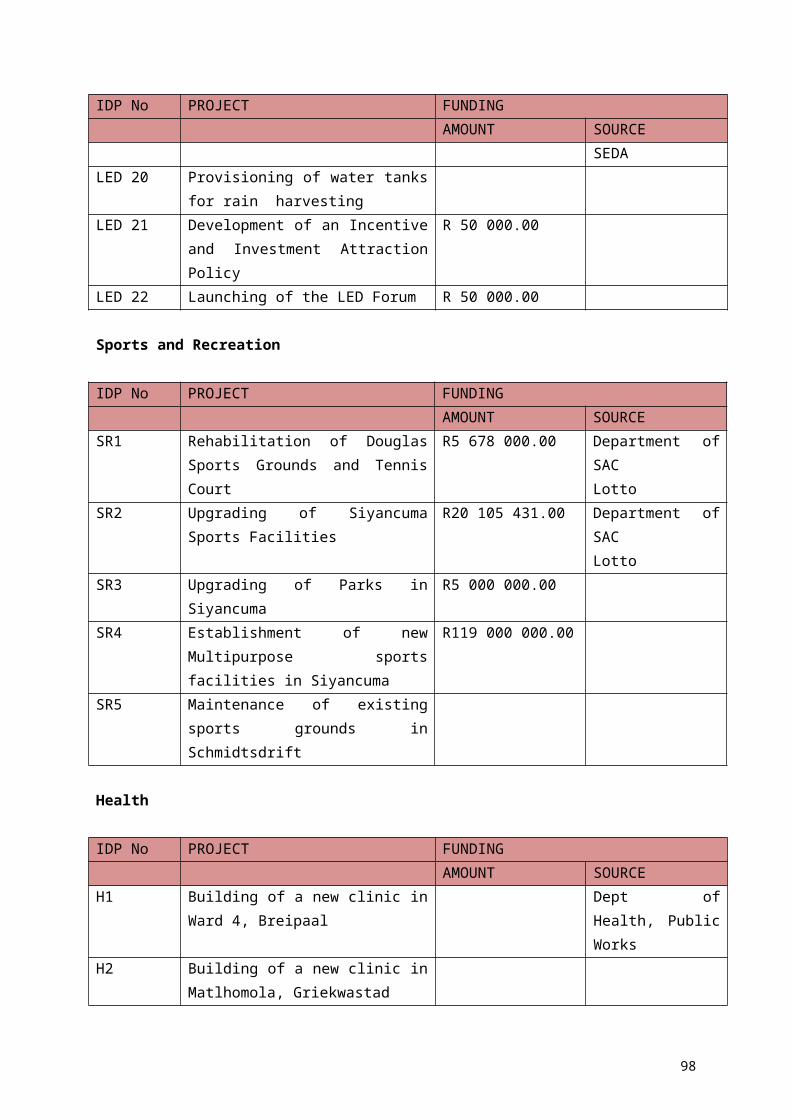
6.11. INTEGRATED HIV/AIDS PLAN
The Siyancuma Council and community realise and face the consequences and impact of HIV/AIDS on both the community and council and therefore, not only because of its legal obligations, but also due to the impact of HIV/AIDS on the economy, labour force, youth and future of our Municipality designed a strategy in collaboration and partnership with the community and NGO’s against HIV/AIDS.
Council embark on a strategy that includes execution of the HIV/AIDS Programme by NGO’s. The Organisation in charge (but not the only organisation) to drive and co-ordinate action and the Local Campaign against HIV/AIDS is the Douglas Aids Action Group (DAAG). Refer to the annexure 3 of this document.
VisionOur vision is to reduce the spread of HIV/AIDS amongst the youth and our communities as a whole.
Mission To promote community involvement in the struggle against HIV/AIDS through the promotion of abstinence and safe sex and by improving STD management and control through voluntary testing and counselling and also to create acceptance and a non-discriminatory society against HIV/AIDS patients.
Development objectivesThe goals and objectives of the Siyancuma Municipality regarding HIV/AIDS include the following:
The goals: Reduce the Spread of HIV/AIDS amongst the youth and the communities
as a whole by 20% in 2011
Demote promiscuous sexual behaviour amongst the youth
Promote community involvement against the struggle against
HIV/AIDS
The objectives:
Promote safe and healthy sexual behaviour
Reduce the spread of mother to child transmission (MTCT) by 20% by 2011
Improve access to voluntary HIV testing and counselling by 20% by 2011.
StrategiesThe Municipality established a HIV/AIDS task team in partnership with the Swedish government and the Municipal Training institute (MTI) to address the youth and communities in Siyancuma Municipality, regarding the dangers of HIV/AIDS and the impact thereof on South Africa and the rest of the world. Accordingly, they arranged a number of programmes and activities that include workshops and other programmes as set out by themselves in alignment with the National government as well as media and publicity table, talk shows and debate groups. Refer to the HIV/AIDS plan for further information. With this programmes
110

adopted by the DAAG we believe we will curb the spread of this pandemic in our society at large.
6.12. GENDER EQUITY PLAN
The Gender Equity Plan includes basically the documents that have been integrated with the amalgamation of the Douglas, Griekwastad and Campbell Municipalities. The integrated documents are the Equity Plan for Douglas and Griekwastad. No Plan exists for Campbell.
The purpose of the plan is to reduce inequality from previous dispensations and also to promote empowerment of the previously disadvantaged, both men and women. The Gender Equity Plan can, at this stage, not be fully implemented as the placement of staff is still outstanding. Hence, the first phase for implementation of the Gender equity plan will be during the placement of staff.
VisionEnsuring equality of the work force serving the communities of the Siyancuma Municipality
MissionEnsuring that all officials working for the Siyancuma Municipality enjoy equality before Council and that no discrimination on the basis of race gender and or (dis) ability are allowed during appointment of staff taking into consideration previously disadvantaged individuals.
Development objectivesThe goals and objectives of the Gender Equity Plan is the following:
Ensuring no discrimination during appointments and or placement of staff
Ensuring equality of all workers
Ensuring no discrimination on the basis of race or sex
StrategiesProgrammes and activities regarding Gender Equity include the following:
Amalgamation and Centralisation of Top management and some equipment
All officials into one pool
Appointment of Senior Management (Municipal Manager and his/her HOD’s)
Drafting and adoption of organogram and placement policy
Placement of staff from pool
Advertising and appointment of staff in vacant posts.
Due to outstanding placements the last two activities have not been executed yet.
111

6.13. THE FINANCIAL MANAGEMENT PLAN
The Financial Management Plan of the Municipality is also segmented into different parts: The Budget, the Indigent Policy and the Credit and Debt Control Policy. These documents address different aspects of the Financial Plan.
The budget is drawn up annually and guides the total income and expenditure of the institution. It compares the expenditure of the Municipality with its income in order to evaluate and monitor the financial situation.
The budget is breakdown per department and also per division for monitoring and evaluation purposes. Each Head of Department is responsible for his budget evaluation, monitoring and control and will be held accountable. As per Council decision a monthly report on the financial status must be taken to Council. This will help with the budgetary control. An income and expenditure statement is then to be evaluated by Council who will make recommendations and or resolutions.
The Indigent Policy is adopted by council and discussed with communities. This policy guides the handling of accounts by the indigent. It gives clear guidelines on how much is allowed for consumption by a household and what will happen if a household uses more of any service than its suppose to.
It also mentions that money for payment of services for the indigent is taken from the Equitable Share. This is a grant given by the National Government as subsidy for the poorest of the poor. The Equitable Share is then booked as Income in the Budget.
The Credit and Debt Control Policy is also adopted by Council to ensure there is debt recovery by officials according to guidelines laid down in the policy. It allows officials to act on behalf of Council.
The policy guides officials on the payment of Council’s debt. If the policy is disrespected by either an official or councillor steps would be taken against the offender. Refer to Credit and Debt Control Policy.
VisionEnsuring the Municipality is in good standing financial position
MissionThe mission of the financial plan is to ensure through proper financial control accounting methods that the municipality become financially sound and independent.
Development objectivesThe goals and objectives of the Financial Management plan is to:
Evaluate, monitor and control expenditure
Ensure billing and timeous payment of accounts by consumers
Ensure timeous payment of Municipal accounts
Ensure consumers are paying for service rendered.
Control arrears and debts
Ensure indigents do not exceed their limit
112

StrategiesStrategies for arranging the Financial Management Plan are summarised below:
Budget
Indigent Policy and the
Credit and Debt Control Policy
6.14. THE INTEGRATED PERFORMANCE MANAGEMENT SYSTEM
Some work has been done on the performance management for the Senior Management, the Municipal Manager and his direct subordinates, the heads of departments (HODs). Because the PMS are to be linked to the IDP and key performance indicators (KPI’s) as well as input, output and outcome indicators are to be linked to both Councillors and officials it was decided to complete this part after completion of the IDP.
In 2004 a decision was taken to assign Councillors to certain portfolios and to be held responsible for performance.
VisionThe vision of the integrated PMS is to create a performance based institution.
Mission To create through specific, measurable, achievable, real, time (SMART) indicators whereby the performance of both Councillor and official can be measured.
Development objectivesThe goals and objectives of the PMS would be summarised as follows:
To create SMART indicators for performance management
To link the PMS with the IDP
Monitor the performance of both councillor and official
Monitor progress and development of IDP
Monitor institutional performance.
StrategiesStrategies for arranging the PMS are listed below:
Completion of the IDP
Assigning of councillors to specific portfolio’s
Determination of SMART indicators
Link PMS to IDP
Monitoring and evaluation
113

6.15. INTEGRATED ENVIRONMENTAL MANAGEMENT PLAN
The Integrated Environmental Programme (IEP) consists of two segments: Integrated Environmental Management (IEM) and the Strategic Tourism Plan (STP). The IEM aims to ensure environmental management and conservation for future whilst the latter (STP) aims to attract tourists to a certain area with the attention to create jobs and stimulate the local economy.
The IEM for the Siyancuma Municipality is not in place although progress has been made regarding infrastructure for waste and sewerage treatment. Up to standard sewerage treatment plants have been built for both Douglas and Griekwastad but needs upgrading due to higher demand.
Griekwastad and Campbell are also equipped with incinerators. However plans are underway to relocate the landfill site in Campbell. The establishment of a new landfill site is underway in Schmidtsdrift.
The Strategic Tourism Plan includes a tour route through the Municipal area starting at Bellmont/ Witput, or Schmidtsdrift when driving to either Douglas or Griekwastad depending on which route you take; the N8 or N12. These are major Provincial routes linking Kimberley with Upington and Namibia.
There are different sites to visit in each of the following towns; Douglas, Griekwastad, Campbell, Schmidtsdrift and Plooysburg. The Municipal area is reach with natural sources, like the confluence of the country’s two largest rivers, game, glacial stones and history of both the Griekwas and Anglo Boer War.
VisionTo become one of the largest and most hospitable tourist attractions in the Northern Cape Province.
MissionThrough integrated planning and community development and participation to become one of the largest tourist attractions in the Northern Cape and by so doing create jobs and fight poverty.
Development objectivesThe objectives and goals for the Integrated Environmental Management Programme are:
Integrated environmental management
Healthy and safe environment
Utilising of natural tourist attractions
Job creation
Capacity building through community involvement
StrategiesStrategies for arranging the Integrated Environmental Management Programme include:
Integrated environmental management
Strategic Tourism plan
Community development and participation.
114

CHAPTER SEVEN: CLOSURE
7.1 INTRODUCTION
This document contains the final Integrated Development Plan of the Municipality and was formulated over a period of one year, taking into consideration the views and aspirations of the entire community.
The IDP provides the foundation for development for the next financial year, which is 2015/16.
7.2 INVITATION FOR COMMENTS
In order to ensure transparency of the IDP process everybody is given the chance to raise concerns regarding the contents of the IDP.
Selected national and provincial departments are firstly given a chance to assess the viability and feasibility of project proposals from a technical perspective. More specifically, the spheres of government are responsible for checking the compliance of the IDP in relation to legal and policy requirements, as well as to ensure vertical coordination and sector alignment.
Since the operational activities of the Local Municipality will have a certain effect and possible impact on surrounding areas, adjacent local and district municipalities are also given the opportunity to raise any concerns in respect of possible contradicting types of development and to ensure the alignment of IDPs.
Finally, all residents and stakeholders are also given the opportunity to comment on the contents of the IDP, should they be directly affected.
7.3 ADOPTION
After all the comments are incorporated in the IDP document, the Council will approve/ adopt it on 30 June 2015. The approved document will be submitted to the MEC: Local Government and Housing, as required by the Municipal Systems Act, 2000 (32 of 2000).
115

APPENDIXES:Appendix A 1: Pixley ka Seme District Municipal Spatial Development Framework Appendix B: Service Delivery Budget Implementation Plan 2015/6Appendix C: Performance Management Framework 2009Appendix D: Siyancuma LED StrategyAppendix E: Final Budget 2015/16Appendix F: Ward Committee PolicyAppendix G: EPWP PolicyAppendix H: Strategic Plan with Organisational Scorecard
116