Forever young? An analysis of the factors influencing ...
25
ARTICLE Forever young? An analysis of the factors influencing perceptions of ageing Valeria Bordone 1 *, Bruno Arpino 2 and Alessandro Rosina 3 1 Department of Sociology, University of Munich (LMU), Munich, Germany, 2 Department of Political and Social Sciences, Pompeu Fabra University, Barcelona, Spain and 3 Center for Applied Statistics in Business and Economics, Catholic University, Milan, Italy *Corresponding author. Email: [email protected] (Accepted 8 January 2019; first published online 26 February 2019) Abstract Drawing on the revived literature on the subjective dimension of ageing, this paper in- vestigates whether people aged 65+, usually defined as old, do actually feel old and which events they associate with feeling old. Logistic models are used on unique data from the 2013 survey called ‘I Do Not Want to Be Inactive’, conducted on individuals aged 65–74 in Italy (N = 828). It is found that a large proportion of respondents do not feel old at all. The analyses show that women are more likely than men to feel old and to think that society considers them old. While men feel old mainly when they retire, women associate this feeling with loneliness, loss of independence and death of loved ones. Higher-educated people are less likely to associate feeling old with loneliness and boredom than their lower-educated counterparts. The findings have important implica- tions for the conceptualisation of ageing. Most people who are old according to the stand- ard threshold of 65 do not consider reaching this age as a distinctive marker of old age in their lifecourse. This suggests that absolute thresholds for setting the start of old age are questionable. Feeling old seems to be mainly influenced by events, such as retirement and death of loved ones, hinting to the importance of the social construction of ageing in addition to its biological dimension. Researchers and policy makers are encouraged to give more attention to layperson views on ageing. Keywords: ageing; perceptions of ageing; feeling old; gender; education; Italy Introduction With improvements in living conditions and better access to health care, an increasing proportion of the population is living longer around the world. However, living longer does not necessarily mean living better, e.g. in better health or happier (Solé-Auró and Alcañiz, 2015). In ageing societies, it becomes crucial to identify the conditions that guarantee that people age well. Against this background, our paper aims to better understand whether people who are conventionally considered old, according to a traditional definition of © Cambridge University Press 2019 Ageing & Society (2020), 40, 1669–1693 doi:10.1017/S0144686X19000084 of use, available at https://www.cambridge.org/core/terms. https://doi.org/10.1017/S0144686X19000084 Downloaded from https://www.cambridge.org/core. IP address: 65.21.228.167, on 18 Mar 2022 at 06:07:05, subject to the Cambridge Core terms
Transcript of Forever young? An analysis of the factors influencing ...

ARTICLE
Forever young? An analysis of the factorsinfluencing perceptions of ageing
Valeria Bordone1*, Bruno Arpino2 and Alessandro Rosina3
1Department of Sociology, University of Munich (LMU), Munich, Germany, 2Department of Political andSocial Sciences, Pompeu Fabra University, Barcelona, Spain and 3Center for Applied Statistics in Businessand Economics, Catholic University, Milan, Italy*Corresponding author. Email: [email protected]
(Accepted 8 January 2019; first published online 26 February 2019)
AbstractDrawing on the revived literature on the subjective dimension of ageing, this paper in-vestigates whether people aged 65+, usually defined as old, do actually feel old andwhich events they associate with feeling old. Logistic models are used on unique datafrom the 2013 survey called ‘I Do Not Want to Be Inactive’, conducted on individualsaged 65–74 in Italy (N = 828). It is found that a large proportion of respondents do notfeel old at all. The analyses show that women are more likely than men to feel old andto think that society considers them old. While men feel old mainly when they retire,women associate this feeling with loneliness, loss of independence and death of lovedones. Higher-educated people are less likely to associate feeling old with loneliness andboredom than their lower-educated counterparts. The findings have important implica-tions for the conceptualisation of ageing. Most people who are old according to the stand-ard threshold of 65 do not consider reaching this age as a distinctive marker of old age intheir lifecourse. This suggests that absolute thresholds for setting the start of old age arequestionable. Feeling old seems to be mainly influenced by events, such as retirement anddeath of loved ones, hinting to the importance of the social construction of ageing inaddition to its biological dimension. Researchers and policy makers are encouraged togive more attention to layperson views on ageing.
Keywords: ageing; perceptions of ageing; feeling old; gender; education; Italy
IntroductionWith improvements in living conditions and better access to health care, anincreasing proportion of the population is living longer around the world.However, living longer does not necessarily mean living better, e.g. in better healthor happier (Solé-Auró and Alcañiz, 2015). In ageing societies, it becomes crucial toidentify the conditions that guarantee that people age well.
Against this background, our paper aims to better understand whether peoplewho are conventionally considered old, according to a traditional definition of
© Cambridge University Press 2019
Ageing & Society (2020), 40, 1669–1693doi:10.1017/S0144686X19000084
of use, available at https://www.cambridge.org/core/terms. https://doi.org/10.1017/S0144686X19000084Downloaded from https://www.cambridge.org/core. IP address: 65.21.228.167, on 18 Mar 2022 at 06:07:05, subject to the Cambridge Core terms

old age set at age 65 (United Nations, 2001), actually feel old and if so which eventsor statuses they associate with such a feeling.
Today’s ageing population is increasingly heterogeneous in terms of personalexperiences of health and economic conditions (Robert et al., 2009; Lowskyet al., 2014). Progresses in terms of longevity, healthy ageing and technologicalinnovation have shaped today’s older people as a generation that actively contri-butes to both society and family. Defining old age in a static and homogeneousway may therefore be meaningless. Alternative measures such as prospective age(Sanderson and Scherbov, 2008; Scherbov and Sanderson, 2016) allow ‘conceptual-izing the paradox that ageing societies … may nevertheless grow younger at thesame time, if residual life expectancy at median age rises despite a simultaneousincrease in the median age’ (Marin and Zaidi, 2007: 69).
In this respect, subjective measures based on individual perceptions of ageingand old age like those that we examine in this paper (e.g. Barak and Gould,1985) become fundamental in the reframing of old age. Indeed, they describe amore personal point of view on ageing that incorporates an individual’s psycho-logical sense of ageing within the immediate socio-cultural context (Westerhofand Wurm, 2015).
The importance of considering subjective measures of ageing is also testified bystudies that showed their impact on subsequent health outcomes and survival, evenafter accounting for chronological age and past health conditions and behaviours.Despite the limited empirical analysis about ways in which subjective perceptions ofage and ageing impact on individuals’ ability to age actively, works setting out theRisks of Ageism Model (e.g. Swift et al., 2017) hint at a central role of attitudestowards age in affecting the recognised determinants of active ageing. In particular,it has been found that subjective evaluations of the own ageing process have directimplications for wellbeing (Westerhof and Barrett, 2005) and survival (Levy et al.,2002): not feeling old may lead to better health and quality of life (e.g. Penninxet al., 2000), which in turn affect older people’s involvement in society, familyand the labour market. Thus, examining if people traditionally considered as olddo feel old and when they do so is of crucial importance.
In this paper we therefore investigate feeling old among people aged 65–74(i.e. whether they feel old). We have the opportunity, for the first time to our knowl-edge, to additionally study the aspects, events or roles that a person relates to feelingold. We also consider whether individuals perceive that they are considered old bysociety, independently of whether they report feeling old. We do so using a uniquedataset, representative of the Italian population aged 65–74. This age group sets atthe ‘turning point’ after which people are usually defined as old. The focus on Italyis of particular interest because the rapid and intense decline in fertility, togetherwith the achievements in extending survival especially at older ages, have contributedto making Italy one of the countries with the highest median age in Europe.
This article adds to the literature in three ways: (a) by focusing on a quite homo-geneous sample in terms of age which is likely to have similar life experiences and isstill representative of the Italian population in that age group; (b) by using directinformation about which events people associate with feeling old; and (c) by con-sidering gender and educational differences in both the likelihood to feel old and itsassociated aspects.
1670 V Bordone et al.
of use, available at https://www.cambridge.org/core/terms. https://doi.org/10.1017/S0144686X19000084Downloaded from https://www.cambridge.org/core. IP address: 65.21.228.167, on 18 Mar 2022 at 06:07:05, subject to the Cambridge Core terms

In the next section, we review the relevant literature on age identity and describethe Italian context. The following section presents data and methods of analysis.We then show the results and discuss them in the concluding section.
BackgroundAgeing and age identity
The traditional understanding of old age as defined by the chronological age of 60 or65 has been so much socialised that the individual perceived beginning of old ageresembles it and does not even vary much across Europe, ranging from 59 in theUnited Kingdom (UK) to 68 in Greece (Ayalon et al., 2014). However, chronologicalage is a too crude measure of ageing as it is an ascriptive characteristic (Barak andRahtz, 1999) that, as such, does not account for time and place. Thus, it ignoresimprovements in health and life expectancy that influence how people age (Lutzet al. 2008; Christensen et al. 2009; Sanderson and Scherbov 2008, 2013).
In the effort to define what ageing well means without drawing merely onchronological age, and at the same time allowing for inter-individual variation, ithas been advocated that augmenting objective components with subjective oneswould provide a more holistic conceptualisation of ageing (see e.g. Pruchnoet al., 2010). Individual perceptions of ageing and ageing-related expectations,goals and actions may differ across individuals, even at the same chronologicalage (see e.g. Diehl et al., 2015).
Research on the subjective dimension of ageing employed a series of notions thatcan be grouped under the umbrella concept of age identity (see e.g. Levy et al., 2002;Ayalon et al., 2014; Diehl et al., 2015; Kotter-Grühn, 2015; Stephan et al., 2016;Bodner et al., 2017), such as feeling old – whether a person feels old; subjectiveage – how old a person feels to be; perceived old age – at which age a person thinksold age starts; and self-perception of ageing, which measures individuals’ assess-ment of their own ageing (e.g. Levy et al., 2002; Kaufman and Elder, 2003).
Since the first conceptualisations of age identity, the single item on subjective agehas mainly been the focus of analysis (Barak and Stern, 1986; Barak, 1987;Westerhof and Wurm, 2015). This was possibly because most of the available sur-veys on older people did not collect direct information on whether and when peo-ple feel old. Yet, all these concepts have been found to represent the unidimensionalself-evaluation of how a person perceives their own ageing process. One’s evalu-ation of their own present status against one’s representations of age and ageingforms one’s personal ageing model (Demakakos et al., 2007). Therefore, althoughthis paper focuses on feeling old and on the events that might have made peoplefeel old, in the following we draw on insights also from the related literature onother measures of age identity for which more empirical evidence is available. Aspointed out by Barak and Rahtz (1999), research on the subjective dimension ofageing has rarely sought to determine how ‘youthful’ or how ‘old’ people feel.
Research has found that after early adulthood most people feel younger thantheir chronological age (Barak and Stern, 1986; Montepare and Lachman, 1989;Rubin and Berntsen, 2006), in a sense distinguishing their psychological agefrom the age associated with one’s physical appearance (i.e. when looking in themirror). Barak and Stern (1986) indicated four groups of potential correlates of
Ageing & Society 1671
of use, available at https://www.cambridge.org/core/terms. https://doi.org/10.1017/S0144686X19000084Downloaded from https://www.cambridge.org/core. IP address: 65.21.228.167, on 18 Mar 2022 at 06:07:05, subject to the Cambridge Core terms

subjective age: (a) biological and physiological correlates (i.e. objective health statusor self-perceived health); (b) demographic correlates (i.e. gender, marital status,socio-economic status); (c) social psychological correlates (i.e. life satisfaction, emo-tional health, morale); and (d) behavioural correlates (i.e. consumer behaviour,leisure-time activities). Indeed, subjective perceptions of age and ageing are likelyinfluenced by age-related social categorisations that exist in society (Diehl et al.,2015), but are also grounded in individuals’ experience of age-symbolic events,such as retirement and widowhood (Kleinspehn-Ammerlahn et al., 2008;Settersten et al., 2015) as well as grandparenthood and provision of grandparentalchild care (Bordone and Arpino, 2016).
We should note that subjective age is different from feeling old in that the firstconcept informs us about the specific age with which a person identifies. This mayactually reflect identification with a specific cohort. The feeling old concept rather‘relates to the notion that one sees oneself as either closer to, or more distant from,the fountain of youth’ (Barak and Rahtz, 1999: 233). However, the ‘ageless self’notion (Kaufman, 1986), suggesting that the discrepancy between subjective age(i.e. how old a person feels) and chronological age may be a byproduct of denialof ageing and the stigma associated with being an old person (Montepare andLachman, 1989), could be extended to the (not) feeling old concept.
It is also important to recognise the clear intuitive appeal of the concept of feel-ing old that allows individuals to judge themselves ‘on a true internal psychologicalassessment while at the same time using their evaluations of a full range of exter-nalities to temper that judgment’ (Barak and Rahtz, 1999: 249).
Gender, education and feeling old
Kornadt et al. (2013) referred to different life domains as being related to agestereotypes of men and women. Empirical evidence on the role of gender in affect-ing the subjective perception of age and ageing is, however, mixed. Barak and Rahtz(1999) found that neither subjective age nor likelihood of feeling older differed sig-nificantly between men and women. Other studies found gender differences in theassociation between life events and subjective age (on grandparenthood, see e.g.Bordone and Arpino, 2016) and indicated that women hold more youthful ageidentities than men (Barrett, 2005). A study on unequal perceived quality of lifeamong older people in Italy suggested that gender, more than any other variable,differentiates individuals’ approaches to old age (Aureli and Baldazzi, 2002).
Socio-economic status may also play a significant role in affecting individuals’perceptions of ageing. When education has been used as a proxy for it, largeinequalities have been found in terms of objective measures of ageing, such ashealth (Eikemo et al., 2008; Arenas et al., 2017). It is therefore our goal to explorewhether these discrepancies might also be found in terms of subjective perceptionsof ageing. The literature so far shows mixed evidence also in this respect. WhereasBergland et al. (2014) found that lower-educated individuals tend to feel moreyouthful than their higher-educated counterparts, other studies showed thatrespondents who felt older had significantly fewer years of education (Barrett,2003; Rubin and Berntsen, 2006). Moreover, Kaufman and Elder (2003) reportedno significant effect of education on subjective age. Yet, Aureli and Baldazzi
1672 V Bordone et al.
of use, available at https://www.cambridge.org/core/terms. https://doi.org/10.1017/S0144686X19000084Downloaded from https://www.cambridge.org/core. IP address: 65.21.228.167, on 18 Mar 2022 at 06:07:05, subject to the Cambridge Core terms

(2002) found that education is also an important factor in the approach to old agein Italy.
In light of this, we explore differences in whether people feel old and in theevents associated with such a feeling, by gender and educational attainment.Identifying gaps in perceptions of old age and understanding the reasons behindthem is crucial for the implementation of policies tailored at guaranteeing wellbeingin later life for all sub-groups of the population.
Ageing in Italy
Italy is nowadays an ageing country, like most of the world’s areas. However, itsageing process differs from that of, for example, other European countries. Whilein Sweden and in the UK the proportion of people aged 65+ was already above10 per cent in 1951, at that time only 8 per cent of the Italian population was‘old’. Yet now, 60 years later, Italy is among the ‘oldest’ areas in the world(Tomassini and Lamura, 2009). The challenges of such a rapid population ageingare therefore unique in this country and the investigation of self-perceptions of age-ing gains a special meaning there. Improved health status, increased economicspending and greater expectations on the part of the older people have given riseto the need to redefine ageing in Italy (Aureli and Baldazzi, 2002).
Most of the studies on age identity so far have investigated the United States ofAmerica context (e.g. Logan et al., 1992; Barrett, 2003; Bordone and Arpino, 2016).However, as this is likely to have a high impact at the cultural level as well as onpolicy making in Italy, detailed studies accounting for socio-demographic struc-tures and focusing on this country are needed.
In terms of the variables of interest in this study, we note that Italian womenbelonging to the cohorts considered are less educated and more likely to havebeen out of the labour market during their life than men. Thus, some changes inroles usually associated with age, such as retirement, may be less or not at all trau-matic among women. Moreover, Aureli and Baldazzi (2002) have shown that atime-lag exists between men and women in terms of passive acceptance of oldage: Italian women seem to delay it until age 75; while for men it occurs earlier.However, men tend to maintain interests and commitments outside the familythroughout old age, which women reduce or give up earlier. The same study hasalso pointed out that both higher- and lower-educated people in Italy react againsta passive acceptance of old age. Yet, while higher-educated people opt for newinterests and commitments, their lower-educated counterparts tend to engagemore within the family. For example, Italian grandmothers report one of the high-est European shares of grandchild care on a regular basis, especially among thosewith lower educational attainment (Bordone et al., 2017). This is reflected in thetop score of Italy in the Active Ageing Index’s dimension of social participation:Italian older adults remain active in society mainly by engaging in family activities,especially as grandchild care providers (Zaidi et al., 2017). With Italy being a famil-ialistic context where family roles are particularly valued and are found to be a maincomponent of happiness in later life (Sotgiu et al., 2011), one might wonderwhether old age there would be considered more as an achievement rather thanin pejorative terms. A qualitative study looking at how older people are described
Ageing & Society 1673
of use, available at https://www.cambridge.org/core/terms. https://doi.org/10.1017/S0144686X19000084Downloaded from https://www.cambridge.org/core. IP address: 65.21.228.167, on 18 Mar 2022 at 06:07:05, subject to the Cambridge Core terms
in the press in Poland showed that they are portrayed as respected and appreciatedfor their involvement with grandchildren. However, only in the family sphere didthe word ‘grandma’ evoke positive emotions. Older people were often discussedas burdens and, from the market perspective, they were mainly seen as pensioners,i.e. in a post-productive age (Wilińska and Cedersund, 2010). We argue that theseresults could be cautiously extended to the case of Italy because the two countriesare similar in terms of provision of intensive grandchild care (Bordone et al., 2017)and also share numerous similarities that might affect the value of the family andintergenerational relationships, such as attachment to Catholic values (Matysiakand Vignoli, 2013) and (scarce) availability of public child care for children aged0–2. They also resemble each other in the family policy- and labour market-relatedcontexts (Matysiak and Vignoli, 2010).
Evidence from a number of countries has instead shown that, although differ-ently across types of programmes, older people are still heavily under-representedin television programmes (Kessler et al., 2004). Moreover, most of the older char-acters are portrayed as affluent, powerful and (physically, mentally and socially, butnot sexually) active (Bell, 1992). Researchers in this field who have focused on Italyargue that such a mystification of old age shows that old age in Italian society todayis mainly linked to a negative meaning (Termini et al., 2011).
Data and methodsData
We use secondary data collected in 2013 through a survey carried out within theproject entitled ‘“Non mi ritiro”: l’allungamento della vita, una sfida per le gener-azioni, un’opportunità per la società’ (‘“I Don’t Want to Be Inactive”: A LongerLife, a Generational Challenge, an Opportunity for Society’). Both Italian and inter-national researchers were involved in this project funded by the Catholic Universityof Milan. Given that the main publication describing this survey is in Italian(Lanzetti, 2016), we report here the most important details about the samplingmethod and the questionnaire.
The target population are persons aged 65–74 who were residing in Italy on 1January 2013. This survey uses the same sampling scheme as the fourth wave ofthe European Value Survey, i.e. a two-stage stratified random sampling design. Inthe first stage, within strata defined by the Italian regions and municipalities’ popu-lation size, 90 municipalities were selected with a probability proportional to theirpopulation. Within the selected municipalities, individuals were then randomlydrawn from electoral lists. It should be noted that Italian electoral lists, availableat municipal offices for research purposes and in other cases described by law,other than electoral information also include demographic data (e.g. gender,place and date of birth) of the individuals.
The survey designers established 900 as the sample size necessary to be reached,following a rigorous research design that minimises non-response and samplingerrors. The maximum margin of error for a proportion was calculated to be 3 per-centage points. As in the European Value Survey, there was no substitution of thenon-respondents in order to incentivise the interviewers, who were paid on the
1674 V Bordone et al.
of use, available at https://www.cambridge.org/core/terms. https://doi.org/10.1017/S0144686X19000084Downloaded from https://www.cambridge.org/core. IP address: 65.21.228.167, on 18 Mar 2022 at 06:07:05, subject to the Cambridge Core terms

basis of the completed interviews they carried out (each being assigned no morethan 20 interviewees). They contacted 1,600 units. This implies a response rateof 56.3 per cent which is in line with usual response rates of surveys on older people(e.g. the Italian Wave 1 of the Survey of Health, Ageing and Retirement in Europehad a household response rate of 54.5 per cent, see http://www.share-project.org/data-documentation/sample.html).
Concerning the main structural variables (gender, age and marital status), thesample is statistically representative without introducing any adjustment.However, as in all social surveys, people with higher education are more likely toagree to participate. This may create some representativeness issues as it may resultin an over-estimation of higher educational levels. In order to reduce such distor-tion, weights have been used for education only, in a way that would not affect theother structural variables (for more details about the sampling method and thequestionnaire, see Lanzetti, 2016). Face-to-face interviews were conducted betweenNovember 2013 and January 2014 by professional interviewers who received spe-cific training by the C.R.S. (Centro Ricerche Sociali [Social Research Centre]S.a.s., Milan), to whom the field work was commissioned. The total sample sizeincludes 900 respondents (437 men and 463 women). The questionnaire containsa rich set of information on characteristics, perceptions and conditions potentiallyrelated to active life, such as health, socio-economic status, employment, social andfamily networks, use of new technologies and attitudes.
The working sample in the following analyses is of 408 men and 420 women.We have excluded observations with missing values in any of the variablesdescribed below (two on whether the respondent thinks they are considered oldby society; four on importance of religion; 64 on visits and calls with childrenand/or grandchildren; two on physical limitations). In the descriptive analysisof when a person has felt old, respondents who declared to have never felt oldare also excluded.
Dependent variables
The questionnaire contains four questions relevant to our work, referring towhether the respondent feels old, whether they think that society considers themto be old, the occasions on which they felt old and the situations that make a personfeel old. Drawing on the answers to these questions, the dependent variables con-sidered in this study are the following:
• Self-perception as old: in answering the question ‘Do you feel old?’, respon-dents can mark one of the four answers offered (not at all, a bit, quite a bit,very much). We consider the four-item scale in descriptive analyses. Toavoid sample size issues, the original answers are collapsed into two categories,creating a dummy variable for the multivariate analyses with value 0 if ‘not atall or a bit’ and value 1 if ‘quite a bit or very much’.
• Society perception as old: we investigate descriptively the four-item scale (notat all, a bit, quite a bit, very much) in answer to the question ‘Do you thinkthat society considers you to be old?’ As for the first outcome, in the multi-variate analyses the original answers are collapsed into two categories, creating
Ageing & Society 1675
of use, available at https://www.cambridge.org/core/terms. https://doi.org/10.1017/S0144686X19000084Downloaded from https://www.cambridge.org/core. IP address: 65.21.228.167, on 18 Mar 2022 at 06:07:05, subject to the Cambridge Core terms

a dummy variable with value 0 if ‘not at all or a bit’ and value 1 if ‘quite a bitor very much’.
• Events when one has felt old: out of the original eight options offered to answerthe question ‘When did you feel old?’, we created seven dummy variables withvalue 1 if the respondent mentioned ‘never’, ‘at retirement’ (combining theoptions ‘at retirement’ and ‘when stopped working’), ‘when turning 65’, ‘withdeclining physical independence or with health worsening’, ‘when became agrandparent’, ‘with widowhood’, ‘at parents’ death’, respectively; value 0 other-wise. Only one answer could be marked by the respondent. These answers areanalysed descriptively for people that did feel old (i.e. did not answer ‘never’).
• Causes making a person feel old (in general): the questionnaire offers nineoptions to answer the question ‘What most makes a person feel old?’: ‘loneli-ness’, ‘not knowing how to kill time (i.e. boredom)’, ‘lack of projects for thefuture’, ‘(decrease in) physical health’, ‘economic difficulties’, ‘exclusionfrom technology’, ‘death of loved ones’, ‘decreasing social relationships’,‘retirement’. Respondents could mark up to three answers. For the multivari-ate analyses, we created a dummy variable for each possible answer, with value1 if the answer was selected and 0 otherwise. We acknowledge that some sub-categories, e.g. boredom and lack of projects for the future, might seem toreflect similar concepts. If this is the case, we might observe very similarresults in the analyses of these variables. However, as these were offered as dif-ferent options to the respondents, we decided to keep them separately.Moreover, the first (boredom) hints to a present situation while the latter(lack of projects) rather points to the future.
It is important to note that, differently from the third question, this last question isnot conditional on whether the respondent has ever felt old. That is, even respon-dents who reported having never felt old will answer about what they think, in gen-eral, makes a person feel old. Therefore, these latter answers may give us a moregeneral view about events that are associated with the idea of being old.
Independent variables
The main explanatory variables are gender and education. Concerning gender, 48.6per cent of respondents are men and 51.4 per cent are women. In terms of educa-tion, we distinguish three levels of attainment: lower (up to primary school), middle(lower secondary education, i.e. scuole medie) and higher education (at least highschool). In our sample, 35.8 per cent of respondents have up to primary education,30.9 per cent have lower secondary and 33.3 per cent have higher education.
Additionally, in the multivariate analyses the following independent variableswere included based on past evidence regarding the determinants of age identity.Descriptive statistics on the independent variables are presented, by gender, inTable 1.
In terms of socio-demographic characteristics of the respondent, we control forage by including a dummy variable (0 = 65–69; 1 = 70–74) because, as discussed byChoi et al. (2014), perceptions of ageing among older adults tend to differ by agegroup.
1676 V Bordone et al.
of use, available at https://www.cambridge.org/core/terms. https://doi.org/10.1017/S0144686X19000084Downloaded from https://www.cambridge.org/core. IP address: 65.21.228.167, on 18 Mar 2022 at 06:07:05, subject to the Cambridge Core terms

Being single may be a predictor of feeling young(er), especially for the youngeradults (Bergland et al., 2014), although not all studies found a significant relation-ship between marital status and subjective age (e.g. Henderson et al., 1995). Theliving arrangement variable indicates whether the respondent lives alone (refer-ence), with a partner or with other people only (i.e. excluding the partner).
Working status indicates whether the respondent is working or not working (ref-erence) at the time of the interview. The literature on retirement and perceptions ofageing shows mixed findings. Although the loss of a critical and economic role maycharacterise the image of old age (for a review, see Kaufman and Elder, 2003),Logan et al. (1992) found no significant effect of retirement on age identity onceage was controlled.
Recently, an association has been shown between providing grandchild care andfeeling younger among both grandfathers and grandmothers above 70 years old(Bordone and Arpino, 2016). Therefore, we control for whether the respondent
Table 1. Descriptive statistics of the independent variables, by gender
Men Women
Percentages
Education:
Lower 29.2 43.6
Middle 32.8 30.0
Higher 38.0 26.4
Age:
65–69 54.7 50.9
70–74 45.3 49.1
Importance of religion 66.9 81.4
Visit children at least once a week 68.4 70.2
Call children at least once a week 69.1 76.7
Working status:
Not working 79.7 93.3
Working 20.3 6.7
Has grandchild(ren) 10.3 19.3
Living arrangements:
Alone 11.2 22.4
With partner 81.4 65.0
With others 7.4 12.6
Satisfaction with health 84.8 74.8
Limiting chronic conditions 22.8 31.4
N 408 420
Ageing & Society 1677
of use, available at https://www.cambridge.org/core/terms. https://doi.org/10.1017/S0144686X19000084Downloaded from https://www.cambridge.org/core. IP address: 65.21.228.167, on 18 Mar 2022 at 06:07:05, subject to the Cambridge Core terms

has grandchildren (= 1 if they have at least one grandchild; = 0 otherwise). We alsocontrol for the frequency of face-to-face contact and calls with children and grand-children. Face-to-face contact accounts for both visits to and from the children.Additional analyses considered these as two separate variables, but results didnot differ (available on request). For both visits and calls variables, the original cat-egories have been collapsed into ‘at least once a week’ versus ‘less often’.
We additionally account for religious values by including a variable on howimportant religion is for the respondent. The original four-item scale has been col-lapsed into a dummy variable with value 1 if ‘quite important’ or ‘a lot’ and 0 if ‘notmuch important’ or ‘not at all’.
Concerning health, Knoll et al. (2004) showed that functional limitations maybe more important to the construction of subjective age than their underlyinghealth-related causes. We therefore control for whether the respondent haschronic conditions (since at least six months or expected to last at least sixmonths) causing some or severe limitations in activities. As Macia et al. (2012)found that self-rated health predicted felt age and feeling old, we also controlfor the subjective perception of health, considering a dummy variable which equals1 if the respondent is ‘quite’ or ‘a lot’ satisfied with their own health and 0 other-wise. This allows us also to account for the multi-dimensionality of the concept ofhealth. Robustness checks considering the sub-sample without disabilities showedsimilar results to those reported here.
Preliminary analyses have also controlled for the region of residence by includingthree dummy variables (North-East, Centre, and South or Islands, North-Westbeing the reference). However, little variation was shown, with the exception ofsouthern Italians being significantly less likely than their counterparts from theNorth-West to report feeling old and being considered old. Given the relativelysmall sample, we have decided not to include such a control in order to minimisethe number of variables included in the models.
Methods
Our analyses are carried out in two steps. First, we show descriptive associations con-sidering feeling old, being considered old, the occasions in which the respondent feltold and the events that they associate with being old, by gender and education.
Second, we carry out multivariate analyses using a set of logistic regression mod-els, where the dependent variables are feeling old, being considered old and each ofthe nine items indicated as general causes to feel old.
Our goal of examining differences by gender and education implies a practicalissue in terms of smaller sample sizes. This has an impact on standard errorsand p-values that should be taken into account when interpreting the findings.However, as now recognised by many scholars (see e.g. Nuzzo, 2014; Bernardiet al., 2017), statistical significance and p-values are neither as reliable nor as object-ive as usually assumed and more attention should be paid to the actual size ofeffects, differences, etc., rather than to p-values only. Therefore, in the interpretationof results we shall put more emphasis on their substantive relevance than on theirstatistical significance. Nonetheless, we report the p-values in all the tables for thesake of transparency and completeness.
1678 V Bordone et al.
of use, available at https://www.cambridge.org/core/terms. https://doi.org/10.1017/S0144686X19000084Downloaded from https://www.cambridge.org/core. IP address: 65.21.228.167, on 18 Mar 2022 at 06:07:05, subject to the Cambridge Core terms

ResultsDo people feel old?
Table 2(a) shows that among men, 43 per cent of respondents do not feel old at all,41 per cent report feeling ‘a bit’ old, 13 per cent feel ‘quite a bit’ old and about 3 percent feel old ‘very much’. The percentages among women are 37, 34, 24 and about5, respectively; p-values corresponding to z-tests of the differences between gendersare reported in the last column. As noticed above, we however discuss the resultsfocusing on substantive significance.
Interestingly, when looking at the answers to the question ‘Do you think thatsociety considers you to be old?’ (Table 2(b)), the gender differences for the twoextreme categories decrease, while they remain substantial for the two intermediatecategories (‘a bit’ and ‘quite a bit’). Indeed, about 30 per cent of respondents of bothgenders do not think they are considered old at all and only about 4–5 per centanswer ‘very much’. Yet, women report a higher tendency towards being perceivedold by society (36% answer ‘quite a bit’) than men (26%). It should be noted thatwomen in the sample are, on average, as old as men (69.4 versus 69.3).
We implemented the same analyses by educational attainment (Table 3(a) and(b)) and found only a few remarkable differences in terms of whether the respon-dents feel old. In particular, feeling old ‘very much’ is more common among lower-educated than among higher-educated respondents (5.6% versus 1.9%; p = 0.02).Concerning being considered old by society, descriptive statistics hint at a tendencyof the lower-educated to report more extreme answers than the higher-educatedrespondents (with the percentage of ‘not at all’ much higher among lower-educatedrespondents).
When do people feel old?
We then considered the answers to the question ‘When did you feel old?’ We firstcompared the answers by gender and then by educational attainment. In the malesample, 53.8 per cent said they have never felt old. The corresponding percentageamong women is considerably lower (39.2%; data not shown in the tables).Concerning the slightly different prevalence of men and women who currentlydo not feel old at all, as reported in the first row of Table 2(a), we should notethat about 80 per cent of the respondents answer the two questions consistently(i.e. people who report feeling old indicate what made them feel old and peoplewho report having never felt old also mention not feeling old). Yet, 7.3 per centof the male sample and 6.9 per cent of the female sample report having felt oldat some point in the past but their evaluation of their own ageing has changed, indi-cating that feeling old is not necessarily interpreted by individuals as an absorbingstatus. Moreover, about 12 per cent of respondents report having never felt old, butindicate that they currently feel ‘a bit’ old. These respondents are mainly men,slightly younger than the rest of the sample, still working and living with their part-ner in a higher proportion than in the other sub-groups. They are therefore lesslikely to have experienced feeling old as linked to the events that most commonlyrepresent old age. Indeed, they do not report having ever felt old and for the moregeneral question ‘Do you feel old?’ they answer ‘a bit’ (not ‘quite a bit’ and not ‘very
Ageing & Society 1679
of use, available at https://www.cambridge.org/core/terms. https://doi.org/10.1017/S0144686X19000084Downloaded from https://www.cambridge.org/core. IP address: 65.21.228.167, on 18 Mar 2022 at 06:07:05, subject to the Cambridge Core terms
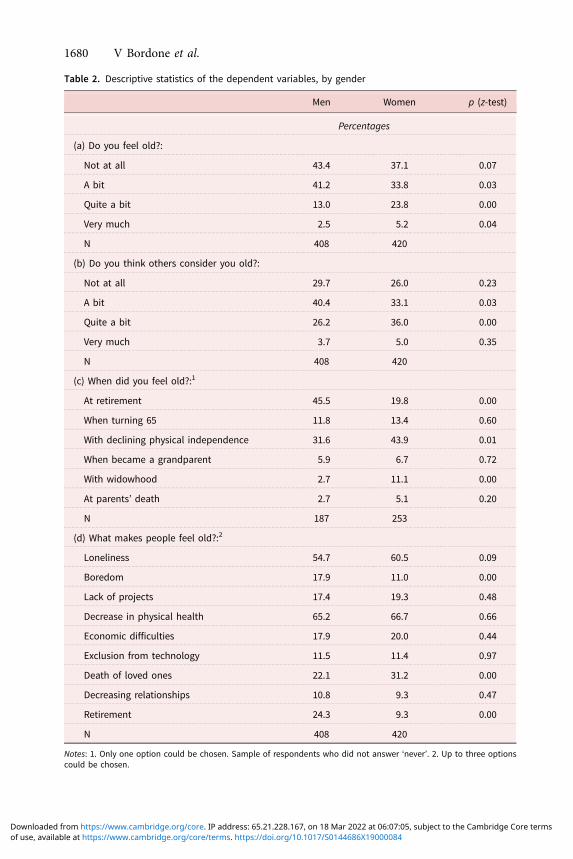
Table 2. Descriptive statistics of the dependent variables, by gender
Men Women p (z-test)
Percentages
(a) Do you feel old?:
Not at all 43.4 37.1 0.07
A bit 41.2 33.8 0.03
Quite a bit 13.0 23.8 0.00
Very much 2.5 5.2 0.04
N 408 420
(b) Do you think others consider you old?:
Not at all 29.7 26.0 0.23
A bit 40.4 33.1 0.03
Quite a bit 26.2 36.0 0.00
Very much 3.7 5.0 0.35
N 408 420
(c) When did you feel old?:1
At retirement 45.5 19.8 0.00
When turning 65 11.8 13.4 0.60
With declining physical independence 31.6 43.9 0.01
When became a grandparent 5.9 6.7 0.72
With widowhood 2.7 11.1 0.00
At parents’ death 2.7 5.1 0.20
N 187 253
(d) What makes people feel old?:2
Loneliness 54.7 60.5 0.09
Boredom 17.9 11.0 0.00
Lack of projects 17.4 19.3 0.48
Decrease in physical health 65.2 66.7 0.66
Economic difficulties 17.9 20.0 0.44
Exclusion from technology 11.5 11.4 0.97
Death of loved ones 22.1 31.2 0.00
Decreasing relationships 10.8 9.3 0.47
Retirement 24.3 9.3 0.00
N 408 420
Notes: 1. Only one option could be chosen. Sample of respondents who did not answer ‘never’. 2. Up to three optionscould be chosen.
1680 V Bordone et al.
of use, available at https://www.cambridge.org/core/terms. https://doi.org/10.1017/S0144686X19000084Downloaded from https://www.cambridge.org/core. IP address: 65.21.228.167, on 18 Mar 2022 at 06:07:05, subject to the Cambridge Core terms

Table 3. Descriptive statistics of the dependent variables, by education
Lower Middle Higher
Percentages (p1)
(a) Do you feel old?:
Not at all 40.4 43.5 (0.46) 36.8 (0.39)
A bit 37.4 33.5 (0.33) 41.4 (0.34)
Quite a bit 16.6 19.2 (0.41) 19.9 (0.30)
Very much 5.6 3.9 (0.32) 1.9 (0.02)
N 302 260 266
(b) Do you think others consider you old?:
Not at all 30.1 29.2 (0.82) 23.7 (0.09)
A bit 36.1 34.2 (0.65) 39.9 (0.36)
Quite a bit 28.2 32.7 (0.24) 33.1 (0.20)
Very much 5.6 3.9 (0.32) 3.4 (0.20)
N 302 260 266
(c) When did you feel old?:2
At retirement 25.0 35.8 (0.04) 32.2 (0.17)
When turning 65 10.6 16.8 (0.12) 11.2 (0.88)
With declining physical independence 41.3 32.9 (0.14) 41.3 (1.00)
When became a grandparent 8.1 5.1 (0.30) 5.6 (0.39)
With widowhood 10.6 5.1 (0.08) 6.3 (0.18)
At parents’ death 4.4 4.4 (1.00) 3.5 (0.70)
N 160 137 143
(d) What makes people feel old?:3
Loneliness 62.3 56.9 (0.20) 53.0 (0.03)
Boredom 17.2 14.6 (0.40) 10.3 (0.03)
Lack of projects 10.9 13.9 (0.29) 31.2 (0.00)
Decrease in physical health 65.9 65.0 (0.82) 66.9 (0.78)
Economic difficulties 20.5 16.2 (0.18) 19.9 (0.86)
Exclusion from technology 10.3 12.3 (0.44) 12.0 (0.50)
Death of loved ones 29.5 27.3 (0.57) 22.9 (0.08)
Decreasing relationships 10.6 9.2 (0.59) 10.2 (0.86)
Retirement 15.2 18.9 (0.25) 16.2 (0.76)
N 302 260 266
Notes: 1. p-values of z-tests with reference to lower education. 2. Only one option could be chosen. Sample ofrespondents who did not answer ‘never’. 3. Up to three options could be chosen.
Ageing & Society 1681
of use, available at https://www.cambridge.org/core/terms. https://doi.org/10.1017/S0144686X19000084Downloaded from https://www.cambridge.org/core. IP address: 65.21.228.167, on 18 Mar 2022 at 06:07:05, subject to the Cambridge Core terms

much’). We interpret this as a general feeling linked to a projection of theapproaching changes (retiring, losing a partner, etc.). However, it should also benoted that the two questions are of a different type (e.g. one relying on a scaleand the other on binary categories) and use a different time-frame (one uses averb in the past tense and the other refers to the present), preventing us from fur-ther speculation about their comparison.
Table 2(c) summarises, by gender, the events that people link to having felt old,among respondents who did not answer ‘never’. We start noting that men reportretirement as an event at which they felt old (45.5%) much more often thanwomen (19.8%; p < 0.01). Retirement is indeed the dominant event linked to feelingold among men. However, such a gender-specific answer may derive from the factthat fewer women in the cohort considered have worked compared to men. Since alarge number of the women in the sample have likely not experienced retirement,they will not report it as a reason for feeling old. Unfortunately, the survey does notprovide further information about working careers in order to better understandthis result. The status mainly linked to having felt old among women is declinein physical independence (43.9% versus 31.6% observed for men; p = 0.01).Women also report having felt old because of widowhood (11.1%) more oftenthan men (2.7%; p < 0.01).
Turning 65 and becoming a grandparent are reported as events at which respon-dents have felt old in similar proportions among men and women (11.8% of menand 13.4% of women mention turning 65; 5.9% of men and 6.7% of women men-tion grandparenthood). It is particularly interesting to note that the common cri-terion to define ageing and old age (i.e. crossing the threshold of age 65) is onlymarginally reported by older people as a relevant marker of old age. Life eventsseem to matter more than chronological age to define the entrance into old age.
The proportion of respondents who declared that they never felt old does notvary appreciably with education (the percentages being 46.5, 47.1 and 45.6 forlower-, middle- and higher-educated respondents, respectively; data not shown inthe tables). Table 3(c) describes the distribution of the events associated with havingfelt old, among respondents who did not answer ‘never’, by educational attainment.All three sub-groups report retirement and decline in physical independence as thetwo main occasions at which they felt old. The only noticeable differences are forthe lower-educated respondents reporting retirement and widowhood, respectively,less and more often than their counterparts with higher levels of education.
What makes a person feel old (in general)?
Table 2(d) shows the distribution of the answers for men and women to the question‘What most makes a person feel old?’ This is a more general question than the oneanalysed above as it does not directly depend on the respondents’ personal experi-ences. Therefore, it also allows us to better capture the factors that people associatewith perceptions of ageing. In this case, the percentages for the different categoriesdo not sum up to 100 because respondents could mention up to three motivationslinked to feeling old. Moreover, all respondents are included in these analyses, inde-pendently of whether they have ever felt old. The most frequently mentioned reasonfor feeling old is a decrease in physical health, reported with very similar percentages
1682 V Bordone et al.
of use, available at https://www.cambridge.org/core/terms. https://doi.org/10.1017/S0144686X19000084Downloaded from https://www.cambridge.org/core. IP address: 65.21.228.167, on 18 Mar 2022 at 06:07:05, subject to the Cambridge Core terms

among both men and women (about 65%). The second one is loneliness, especiallyfor women: the percentage of women mentioning that loneliness makes people feelold (60.5%) is slightly higher than that of men (54.7%; p = 0.09).
Among the other causes reported, retirement and boredom are more likely to beassociated with feeling old for men than for women. These latter, however, reportthe death of loved ones considerably more often (31%) than their male counterparts(22%; p < 0.01).
Comparing respondents by educational attainment (Table 3(d)), we find thatloneliness and decrease in physical health are reported as the main reasons for feel-ing old across all educational categories. However, there is a negative gradient inreporting loneliness as a main reason for feeling old over education. More specif-ically, among lower-educated respondents, 62 per cent mention loneliness versus53 per cent of the higher-educated respondents ( p = 0.03).
The proportion of those who mention ‘boredom’ as a reason for feeling old isalso higher among lower-educated respondents as compared to those with highereducation (17% versus 10%; p = 0.05). Similarly, death of loved ones is reportedto be associated with feeling old more frequently among respondents with lowereducational attainment than among higher-educated respondents (30% versus23%; p = 0.08). However, the lack of projects for the future is considerably morelikely to be associated with feeling old among the higher-educated as comparedto the lower-educated respondents (31% versus 11%; p < 0.01).
Regression results
In a second step, we carry out multivariate analyses (the results are reported inTable 4). First, we estimate two logistic models where we consider whether therespondents feel old (= 1 if very much or a bit; = 0 otherwise; Model 1) andthink they are considered old (= 1 if very much or a bit; = 0 otherwise; Model 2),respectively. Second, each of the answers to the question ‘What most makes a per-son feel old?’ is used in turn as a dependent variable in a set of logistic models(Models 3–11). Our explanatory variables of interest are gender and education.
Results show that, net of the other covariates included in our models, women aremore likely than men to feel old (Model 1) and to think that society considers themold (Model 2). Moreover, women are less likely than men to link feeling old withboredom (Model 4) and retirement (Model 11), but they more often associate itwith lack of projects for the future (Model 5) and death of loved ones (Model 9).These results generally confirm the descriptive findings.
In contrast to the descriptive results, where little variation was found by educa-tional attainment, the multivariate analysis shows that people with higher educationare more likely to feel old (Model 1) and to think they are considered old (Model 2)than their counterparts with up to primary education. The multivariate modelsconfirm that people with higher education are less likely to associate feeling oldwith loneliness and boredom (Models 3 and 4) and more likely to link it withlack of projects (Model 5) than their lower-educated counterparts.
While the associations between the other independent and the dependent vari-ables considered are in general in line with what one could expect, it is interesting
Ageing & Society 1683
of use, available at https://www.cambridge.org/core/terms. https://doi.org/10.1017/S0144686X19000084Downloaded from https://www.cambridge.org/core. IP address: 65.21.228.167, on 18 Mar 2022 at 06:07:05, subject to the Cambridge Core terms

Table 4. Odds ratios estimates (standard errors in parentheses) from logistic regressions
Covariates
Feelingold
(Model 1)
Consideredold
(Model 2)
Reasons to feel old
Loneliness(Model 3)
Boredom(Model 4)
Noprojects(Model 5)
Decreasein physicalhealth
(Model 6)
Economicdifficulties(Model 7)
Exclusionfrom
technology(Model 8)
Death oflovedones(Model
9)
Decreaserelations(Model 10)
Retirement(Model 11)
Odds ratios (p)
Female(Ref.: Male)
1.96 1.64 1.20 0.60 1.49 1.02 1.09 0.98 1.41 0.84 0.34
(0.00) (0.00) (0.22) (0.02) (0.05) (0.90) (0.65) (0.94) (0.05) (0.49) (0.00)
Education(Ref.: Lower):
Middle 1.28 1.30 0.81 0.70 1.24 1.01 0.73 1.29 1.07 0.85 1.07
(0.27) (0.17) (0.23) (0.15) (0.42) (0.96) (0.17) (0.37) (0.75) (0.57) (0.79)
Higher 1.54 1.53 0.63 0.47 3.40 1.22 0.92 1.23 0.90 1.03 0.82
(0.06) (0.03) (0.01) (0.01) (0.00) (0.32) (0.71) (0.48) (0.63) (0.92) (0.43)
Age 70–74(Ref.: 65–69)
1.25 1.45 0.80 1.05 0.86 1.26 0.86 0.88 1.12 0.90 0.82
(0.22) (0.02) (0.12) (0.80) (0.44) (0.13) (0.43) (0.59) (0.50) (0.67) (0.32)
Importance ofreligion
0.94 0.92 1.47 0.80 0.84 0.97 0.96 1.35 1.11 0.66 1.06
(0.77) (0.64) (0.02) (0.32) (0.41) (0.88) (0.84) (0.28) (0.60) (0.12) (0.80)
Visit children atleast once a
week
0.92 0.96 0.99 0.97 1.14 0.90 1.40 1.54 1.25 1.26 0.76
(0.70) (0.84) (0.93) (0.91) (0.55) (0.57) (0.13) (0.12) (0.25) (0.42) (0.21)
Call children atleast once a
week
0.61 0.71 1.25 0.75 1.34 1.18 1.33 1.51 0.88 0.89 0.88
(0.02) (0.06) (0.21) (0.23) (0.23) (0.37) (0.21) (0.16) (0.49) (0.67) (0.58)
Working (Ref.:Not working)
0.51 0.72 1.18 0.85 1.52 0.72 0.85 0.89 0.89 0.66 0.96
1684V
Bordone
etal.
of use, available at https://ww
w.cam
bridge.org/core/terms. https://doi.org/10.1017/S0144686X19000084
Dow
nloaded from https://w
ww
.cambridge.org/core. IP address: 65.21.228.167, on 18 M
ar 2022 at 06:07:05, subject to the Cambridge Core term
s

(0.05) (0.18) (0.46) (0.61) (0.10) (0.15) (0.56) (0.72) (0.66) (0.30) (0.90)
Has grandchild(ren)
0.99 0.87 1.01 0.57 0.74 1.07 0.68 0.99 1.31 1.18 0.99
(0.98) (0.54) (0.98) (0.10) (0.34) (0.75) (0.18) (0.99) (0.23) (0.61) (0.96)
Livingarrangements(Ref.: Alone):
With partner 0.62 1.27 0.84 1.13 1.00 1.80 0.70 1.36 0.78 1.15 2.22
(0.03) (0.26) (0.39) (0.68) (1.00) (0.00) (0.13) (0.36) (0.25) (0.67) (0.02)
With others 0.88 1.02 0.73 0.49 1.29 1.30 0.75 1.31 2.28 0.49 2.13
(0.70) (0.95) (0.27) (0.16) (0.49) (0.37) (0.41) (0.57) (0.01) (0.23) (0.09)
Satisfactionwith health
0.48 0.51 1.13 1.34 1.51 0.47 1.22 0.95 1.08 0.70 1.08
(0.00) (0.00) (0.53) (0.33) (0.14) (0.00) (0.44) (0.88) (0.72) (0.24) (0.79)
Limitingchronic
conditions
1.98 1.49 0.62 0.97 1.25 1.25 1.00 0.88 0.97 1.22 0.93
(0.00) (0.03) (0.01) (0.89) (0.35) (0.25) (0.98) (0.64) (0.88) (0.48) (0.77)
N 828 828 828 828 828 828 828 828 828 828 828
Note: Ref.: reference category.
Ageing
&Society
1685
of use, available at https://ww
w.cam
bridge.org/core/terms. https://doi.org/10.1017/S0144686X19000084
Dow
nloaded from https://w
ww
.cambridge.org/core. IP address: 65.21.228.167, on 18 M
ar 2022 at 06:07:05, subject to the Cambridge Core term
s

to note the results for frequent calls with (grand)children. People who have at leastone phone call per week with their children and/or grandchildren are less likely tofeel old and to think they are considered old as compared to their counterparts withless-frequent intergenerational contacts. Moreover, grandparents are less likely toreport boredom as a cause for feeling old than their grandchildless counterparts.
As a robustness check, we carried out all the models in Table 4 (except the firstone) only on those respondents who reported feeling at most ‘a bit’ old (i.e. we onlyretained respondents that felt ‘a bit’ or ‘not at all’ old, N = 643). This reduced thepossibility that their own experiences of feeling old affected the answers to themore general question about ageing. The results were very similar to thoseshown in the paper (available on request) and we therefore preferred to keep a lar-ger sample in the analyses.
Discussion and conclusionsDrawing on the recently revived literature on the importance of the subjectivedimension of ageing and making use of a unique data-set, this study focused ondifferences by gender and education with respect to whether people feel old andthink they are considered old by society, and on the reasons associated with percep-tions of ageing among Italians aged 65–74.
Our findings point to a high degree of heterogeneity in the prevalence of feelingold and its (perceived) determinants even within a relatively homogeneous agegroup living in the same country and observed at the same time. More specifically,our results show considerable variability both by gender and education.Understanding these gaps in perceptions of old age is crucial for the implementa-tion of policies tailored at guaranteeing a high quality of ageing for all sub-groups ofthe population. Indeed, previous evidence has shown that older individuals withmore positive self-perceptions of ageing, measured up to 23 years earlier, lived7.5 years longer than those with less-positive self-perceptions of ageing (Levyet al., 2002).
As for differences by gender, we found that women are more likely than men tofeel old and to think that society considers them to be old. Previous studies on sub-jective age focusing on the question ‘How old do you feel?’ found that on averagewomen feel younger than men and experience greater discrepancies between theiractual and subjective age than do their male counterparts (e.g. Montepare andLachman, 1989). In this respect, our analyses seem to differ from previous evidence.Yet, Aureli and Baldazzi (2002) also provided evidence of a gendered time-lag interms of passive acceptance of old age in Italy, with women accepting old age,on average, later than men. We should note that these concepts measure the com-plex age identity construct and they might also depend on the socio-cultural gen-dered meaning of ageing. In this respect, our study goes beyond the question ‘Doyou feel old?’ and digs into the reasons to have felt old, providing evidence on theindividual interpretation of ‘old’.
Among men who did feel old, the main event reported to be associated with hav-ing felt old was retirement; for women it was the loss of physical independence, butthey also frequently listed widowhood and death of parents. However, when askedto report the reasons why in general people feel old, both men and women
1686 V Bordone et al.
of use, available at https://www.cambridge.org/core/terms. https://doi.org/10.1017/S0144686X19000084Downloaded from https://www.cambridge.org/core. IP address: 65.21.228.167, on 18 Mar 2022 at 06:07:05, subject to the Cambridge Core terms

mentioned loneliness and worsening health. We should thus reflect on the image ofold age as promoted for example by the media, where (as mentioned in theBackground section) older people are mostly portrayed as relatively physically,mentally and socially active (Bell, 1992). This somehow mystifies old age(Termini et al., 2011) in the same way as a superstitious runner hypotheticallyasked at the 42nd kilometre, while having a significant advantage, would notadmit to believing they would win a marathon in order to keep far away the nega-tive events that might happen on the way to the finish line (i.e. the negative aspectsof ageing, as linked to its label).
Multivariate analyses used to explore the individual characteristics associatedwith the different reasons to feel old show that women tend to associate feelingold with lack of projects for the future more often than men, while men aremore likely to link it with boredom and retirement. Such heterogeneity across gen-der might derive from the gendered roles in society and from different personalexperiences by gender. Indeed, fewer Italian women in the cohort consideredhave entered and stayed in the labour market throughout their working age as com-pared to men. This might explain why women in the sample tend to link old age toretirement less. As housekeepers, these women have probably shouldered most ofthe housework and family care. It would therefore be interesting to investigate fur-ther whether in the female sample there are differences in the perception of feelingold, for example, between those who do grandparental child care and those who donot. In an analysis of the US American context, Bordone and Arpino (2016)reported that older women engaged in grandchild care tend to feel younger thantheir grandmother counterparts not engaged in grandchild care.
Feelings about old age were also found to be substantively heterogeneous withrespect to education. Respondents with higher education are, for example, less likelyto associate feeling old with loneliness and boredom as compared to their counter-parts with lower educational attainments. This might reflect the higher engagementin social activities among higher-educated people (Arpino and Bordone, 2017) that,in turn, is likely to also help them maintain larger social networks outside the fam-ily. This might be particularly true for the young older people considered in thisstudy (i.e. 65–74 years old).
However, our findings across gender and educational groups also reflect thecomplexity of the ageing process and of self-perceptions of ageing. By contributingto the understanding of whether and when sub-groups of the population feel old,we shed light on the mixed evidence provided by previous studies that focused onsubjective age (e.g. by education: Barrett, 2003; Kaufman and Elder, 2003; Rubinand Berntsen, 2006; Bergland et al., 2014). Yet, future studies, also through quali-tative investigations, will need to address these issues more in depth to improve ourknowledge of the changing meaning of ‘old age’.
In fact, the evidence we presented shows that, independent of gender and educa-tion, most people aged 65–74 do not feel old while they would be categorised as suchaccording to traditional measures of ageing based on chronological age. Declaringnot to feel old carries valuable information. On the one hand, it may for exampleindicate that people feel healthier than they would expect to be at their chronologicalage (Barrett, 2003; Westerhof and Barrett, 2005). This may have important direct andindependent consequences on subsequent engagement in social activities,
Ageing & Society 1687
of use, available at https://www.cambridge.org/core/terms. https://doi.org/10.1017/S0144686X19000084Downloaded from https://www.cambridge.org/core. IP address: 65.21.228.167, on 18 Mar 2022 at 06:07:05, subject to the Cambridge Core terms
health-related behaviours and future wellbeing outcomes (Sargent-Cox et al., 2012;Low et al., 2013; Yannick et al., 2013; Westerhof et al., 2014).
On the other hand, reporting not feeling old might reflect a form of self-preservation to maintain an identity consistent with that of one’s younger self(Montepare and Lachman, 1989). While the ageing process per se does not carrya negative connotation if referred to as a lifecourse process, a negative meaningemerges when there is a perception of entering the final stage of the lifespan.This is indeed the widespread correspondence assumed by the definition of oldage, even in sources that are expected to be neutral like dictionaries (see e.g. thedefinition given by https://www.britannica.com/science/old-age and http://www.collinsdictionary.com/dictionary/english/old-age). Such a ‘final stage’ of life is char-acterised not only by changes as in previous stages, but also by progressive irrevers-ible losses that reinforce the negative meaning attached to old age. Negative societalperception of old age can be found in most cultures across the world, mainly drivenby age stereotypes (Kotter-Grühn, 2015). Even in the context of Italy, a traditionallyfamilialistic country where older people are recognised and valued in their familyroles, e.g. as grandparents, culturally shared beliefs about older people view themas sick, dependent, weak or lonely (Hummert, 1999), all features that are charac-terised by low desirability.
Consistently, the data we analysed hint to a higher degree of feeling old amongthose people who lost physical independence, those who lost a partner, as well as inassociation with loss of incentives, projects and social relations.
‘Feeling old’ might be seen in antithesis with active ageing when asking ‘Do youfeel old?’ or ‘How old do you feel?’ The cultural interpretation of what it is to be oldin modern societies is in fact a result also of the extent to which the culture isoriented towards youth (Westerhof and Barrett, 2005). Recent studies suggestthat the subjective age variable presupposes a normative meaning of chronologicalage (with 65 being the common threshold), such that people tend to measure them-selves against this in order to answer whether they feel old (e.g. Gendron et al.,2018). The results of our study, however, challenge such a perspective, suggestingthat ‘young older people’ today do not use chronological age as the key parameterto define their ageing process. Acknowledging that discrepancies exist as to whatage in a society may be considered old and what members in that society considerold age to be (Gorman, 1999) makes it essential to overcome the traditional defini-tions of old age based on chronological age and go beyond objective criteria (e.g.remaining years of life) in order to account explicitly for the subjective dimensionof ageing.
A central finding of the current study regards the specific criterion commonlyused to define old age, i.e. the threshold of turning 65 years old. For both menand women, it is not relevant for the self-perception of ageing as people givemore importance to life events than to chronological age when recalling whatmade them feel old. The fact that the respondents aged 65–74 do not associateturning 65 with feeling old confirms that the threshold of 65 does not correspondany longer with entering ‘old age’. There is no longer a specific and universallyaccepted chronological age that determines the entrance into ‘old age’ and thismay also not necessarily mean simply prolonging the phase of life in which an indi-vidual is a (mature) ‘adult’. Rather, a shift is required in reading this change away
1688 V Bordone et al.
of use, available at https://www.cambridge.org/core/terms. https://doi.org/10.1017/S0144686X19000084Downloaded from https://www.cambridge.org/core. IP address: 65.21.228.167, on 18 Mar 2022 at 06:07:05, subject to the Cambridge Core terms

from traditional thinking in terms of chronological age to emphasise the lifecourseperspective. We were able to describe the prevalence of people in the age range 65–74who feel old and to identify the main events that made them feel old. Future studiesare required to improve our understanding of the subjective dimension of ‘old age’further.
In light of this, our account of the opinion of the ageing population about theirown ageing process is extremely important. Policies that offer opportunities foractive participation in society across all strata of the population should aim at redu-cing the perception of feeling old among older people. This may, also, reduce gen-der and education differences in the quality of ageing (see e.g. Lifshitz-Vahav et al.,2017). Moreover, activities that bring together different generations may not onlyincrease participation of older people but also reduce ageism among the youngergenerations (e.g. Gaggioli et al., 2014; Chen et al., 2017). Therefore, in order to pro-mote wellbeing in later life, social activities should be encouraged and a culturalchange should be promoted. In this way, the ageing population will be helped tobe active, but also to not feel old.
We acknowledge some limitations of our study. In particular, the question onthe reasons that make people feel old may still partly reflect personal experiences.Moreover, while previous findings indicated that subjective age may be associatedwith changes in general health, cognitive functioning (Demakakos et al., 2007;Stephan et al., 2011) and wellbeing (Keyes and Westerhof, 2012), and may bealso affected by daily events (Kotter-Grühn et al., 2015), the list of reasons tofeel old included in the survey was limited to a few of these conditions.Furthermore, constructs such as attitudes towards own ageing, awareness ofage-related change and subjective nearness/distance to death may mediate subject-ive perceptions of ageing (Brothers et al., 2017; Siebert et al., 2018). Therefore, it ispossible that they also play a role in attributing significance to the specific experi-ences people associate with their ageing process. Finally, we recognise that as theanalysis focuses on an Italian sample of men and women aged 65–74, it doesnot allow us to generalise the results beyond this sub-population. As the subjectivemeaning of ageing may also reflect different cultural values and cultural changeslinked, for example, to the portrayal of older people in the media (Kessler et al.,2004; Termini et al., 2011), future studies should investigate this topic by compar-ing perceptions of the ageing of men and women across different countries/culturesand different cohorts. Due to the cross-sectional nature of the data available, wecould only establish associations between various events and the perception ofbeing old. The use of longitudinal data in future studies may allow better explor-ation of the causal importance of life events in defining the subjective dimensionof ageing.
Despite these limitations, we believe that our analyses significantly add to previ-ous studies on the subjective meaning of ageing. As advocated, for example, byChoi et al. (2014: 470), ‘older adults should be asked to elaborate on the reasonsthey felt younger, the same, or older than their chronological age’. Althoughsome previous studies analysed factors associated with perceptions about feelingold, they could not exploit direct information on what respondents think to bethe reasons for feeling old in general or in their personal experience. The uniquedata we used in this paper allowed us to deepen the understanding of lifecourse
Ageing & Society 1689
of use, available at https://www.cambridge.org/core/terms. https://doi.org/10.1017/S0144686X19000084Downloaded from https://www.cambridge.org/core. IP address: 65.21.228.167, on 18 Mar 2022 at 06:07:05, subject to the Cambridge Core terms

events and individual conditions that may define the concept of ‘old age’. More datacollection efforts should continue along the lines of the project that generated thedata used in this paper. Collecting detailed longitudinal data on perceptions of age-ing of different cohorts of people may be a valuable way to contribute to thisincreasingly important field of literature.
Data. The data used were collected within the project ‘“Non mi ritiro”: l’allungamento della vita, una sfidaper le generazioni, un’opportunità per la società’ (‘“I Don’t Want to Be Inactive”: A Longer Life, aGenerational Challenge, an Opportunity for Society’), funded by the Catholic University of Milan (D3.2funds).
Acknowledgments. Bruno Arpino acknowledges funding from the Spanish Ministry of Economy,Industry and Competitiveness (PCIN-2016-005; PI: B. Arpino) for the project “Care, Retirement &Wellbeing of Older People Across Different Welfare Regimes” (CREW) within the second JointProgramming Initiative “More Years Better Lives”.
ReferencesArenas E, Kye B, Teruel G and Rubalcava L (2017) The impact of education and health heterogeneity on
Generational Support Ratios: a cross-national comparison between Mexico and Korea. Ageing & Society37, 1924–1961.
Arpino B and Bordone V (2017) Regular provision of grandchild care and participation in social activities.Review of Economics of the Household 15, 135–174.
Aureli E and Baldazzi B (2002) Unequal perceived quality of life among elderly Italians: different satisfac-tion levels in selected spheres of life. Social Indicators Research 60, 309–334.
Ayalon L, Doron I, Bodner E and Inbar N (2014) Macro- and micro-level predictors of age categorization:results from the European Social Survey. European Journal of Ageing 11, 5–18.
Barak B (1987) Cognitive age: a new multidimensional approach to measuring age identity. InternationalJournal of Aging & Human Development 25, 109–128.
Barak B and Gould S (1985) Alternative age measures: a research agenda. Advances in Consumer Research12, 53–58.
Barak B and Rahtz DR (1999) Perceived youth: appraisal and characterization. International Journal ofAging and Human Development 49, 231–257.
Barak B and Stern B (1986) Subjective age correlates: a research note. The Gerontologist 26, 571–578.Barrett AE (2003) Socioeconomic status and age identity: the role of dimensions of health in the subjective
construction of age. Journals of Gerontology: Psychological Sciences and Social Sciences 58B, S101–S109.Barrett AE (2005) Gendered experiences in midlife: implications for age identity. Journal of Aging Studies
19, 163–183.Bell J (1992) In search of a discourse on aging: the elderly on television. The Gerontologist 32, 305–311.Bergland A, Nicolaisen M and Thorsen K (2014) Predictors of subjective age in people aged 40–79 years:
a five-year follow-up study. The impact of mastery, mental and physical health. Aging and Mental Health18, 653–661.
Bernardi F, Chakhaia L and Leopold L (2017) ‘Sing me a song with social significance’: the (mis) use ofstatistical significance testing in European Sociological Research. European Sociological Review 33, 1–15.
Bodner E, Ayalon L, Avidor S and Palgi Y (2017) Accelerated increase and relative decrease in subjectiveage and changes in attitudes toward own aging over a 4-year period: results from the Health andRetirement Study. European Journal of Ageing 14, 17–27.
Bordone V and Arpino B (2016) Do grandchildren influence how old you feel? Journal of Aging andHealth 28, 1055–1072.
Bordone V, Arpino B and Aassve A (2017) Patterns of grandparental child care across Europe: the role ofthe policy context and working mothers’ need. Ageing & Society 37, 845–873.
Brothers A, Miche M, Wahl H-W and Diehl M (2017) Examination of associations among three distinctsubjective aging constructs and their relevance for predicting developmental correlates. Journals ofGerontology: Psychological Sciences and Social Sciences 72B, 547–560.
1690 V Bordone et al.
of use, available at https://www.cambridge.org/core/terms. https://doi.org/10.1017/S0144686X19000084Downloaded from https://www.cambridge.org/core. IP address: 65.21.228.167, on 18 Mar 2022 at 06:07:05, subject to the Cambridge Core terms

Chen CY, Joyce N, Harwood J and Xiang J (2017) Stereotype reduction through humor and accommo-dation during imagined communication with older adults. Communication Monographs 84, 94–109.
Choi NG, DiNitto DM and Kim J (2014) Discrepancy between chronological age and felt age: age groupdifference in objective and subjective health as correlates. Journal of Aging and Health 26, 458–473.
Christensen K, Doblhammer G, Rau R and Vaupel JW (2009) Ageing populations: the challenges ahead.The Lancet 374, 1196–1208.
Demakakos P, Gjonca E and Nazroo J (2007) Age identity, age perceptions, and health. Annals of theNew York Academy of Sciences 1114, 279–287.
Diehl M, Wahl H-W, Brothers AF and Miche M (2015) Subjective aging and awareness of aging: toward anew understanding of the aging self. Annual Review of Gerontology and Geriatrics 35, 1–28.
Eikemo TA, Huisman M, Bambra C and Kunst AE (2008) Health inequalities according to educationallevel in different welfare regimes: a comparison of 23 European countries. Sociology of Health and Illness30, 565–582.
Gaggioli A, Morganti L, Bonfiglio S, Scaratti C, Cipresso P, Serino S and Riva G (2014)Intergenerational group reminiscence: a potentially effective intervention to enhance elderly psycho-social wellbeing and to improve children’s perception of aging. Educational Gerontology 40, 486–498.
Gendron TL, Inker J and Welleford A (2018) ‘How old do you feel?’ The difficulties and ethics of oper-ationalizing subjective age. The Gerontologist 58, 618–624.
Gorman M (1999) Development and the rights of older people. In Randel J, German T and Ewing D (eds),The Ageing and Development Report. Poverty, Independence and the World’s Older People. London:Earthscan Publications, pp. 3–21.
Henderson KV, Goldsmith RE and Flynn LR (1995) Demographic characteristics of subjective age.Journal of Social Psychology 135, 447–457.
Hummert ML (1999) A social cognitive perspective on age stereotypes. In Hess T and Blanchard-Fields F(eds), Social Cognition and Aging. New York, NY: New York Academic Press, pp. 175–196.
Kaufman G and Elder J (2003) Grandparenting and age identity. Journal of Aging Studies 17, 269–282.Kaufman SR (1986) The Ageless Self. Sources of Meaning in Late Life. Madison, WI: University of
Wisconsin Press.Kessler E-M, Rakoczy K and Staudinger UM (2004) The portrayal of older people in prime time television
series: the match with gerontological evidence. Ageing & Society 24, 531–552.Keyes CLM and Westerhof GJ (2012) Chronological and subjective age differences in flourishing mental
health and major depressive episode. Aging and Mental Health 16, 67–74.Kleinspehn-Ammerlahn A, Kotter-Grühn D and Smith J (2008) Self-perceptions of aging: do subjective
age and satisfaction with aging change during old age? Journals of Gerontology: Psychological Sciencesand Social Sciences 63B, P377–P385.
Knoll N, Rieckmann N, Scholz U and Schwarzer R (2004) Predictors of subjective age before and aftercataract surgery: conscientiousness makes a difference. Psychology and Aging 19, 676–688.
Kornadt AE, Voss P and Rothermund K (2013) Multiple standards of aging: gender-specific age stereo-types in different life domains. European Journal of Ageing 10, 335–344.
Kotter-Grühn D (2015) Changing negative views of aging. Implications for intervention and translationalresearch. Annual Review of Gerontology and Geriatrics 35, 167–186.
Kotter-Grühn D, Neupert SD and Stephan Y (2015) Feeling old today? Daily health, stressors, and affectexplain day-to-day variability in subjective age. Psychology and Health 30, 1470–1485.
Lanzetti C (2016) Nota metodologica relativa alla ricerca ‘Non mi ritiro’. Campionamento e variabili gen-erate. In Scabini E and Rossi G (eds), L’Allungamento della Vita. Una Risorsa per la Famiglia,un’Opportunità per la Società. Milan: Vita e Pensiero, pp. 263–314.
Levy BR, Slade MD, Kunkel SR and Kasl SV (2002) Longevity increased by positive self-perceptions ofaging. Journal of Personality and Social Psychology 83, 261–270.
Lifshitz-Vahav H, Shrira A and Bodner E (2017) The reciprocal relationship between participation in leis-ure activities and cognitive functioning: the moderating effect of self-rated literacy level. Aging andMental Health 21, 524-531.
Logan JR, Ward R and Spitze G (1992) As old as you feel: age identity in middle and later life. SocialForces 71, 451–467.
Low G, Molzahn AE and Schopflocher D (2013) Attitudes to aging mediate the relationship between olderpeoples’ subjective health and quality of life in 20 countries. Health and Quality of Life Outcomes 11, 146.
Ageing & Society 1691
of use, available at https://www.cambridge.org/core/terms. https://doi.org/10.1017/S0144686X19000084Downloaded from https://www.cambridge.org/core. IP address: 65.21.228.167, on 18 Mar 2022 at 06:07:05, subject to the Cambridge Core terms

Lowsky DJ, Olshansky SJ, Bhattacharya J and Goldman DP (2014) Heterogeneity in healthy aging.Journals of Gerontology: Biological Sciences and Medical Sciences 69A, 640–649.
Lutz W, Goujon A and Wils A (2008) The population dynamics of human capital accumulation. InFürnkranz-Prskawetz A, Bloom DE and Lutz W (eds), Population Aging, Human CapitalAccumulation, and Productivity Growth. Supplement to Volume 34, 2008, Population andDevelopment Review. New York, NY: The Population Council, pp. 149–188.
Macia E, Duboz P, Montepare JM and Gueye L (2012) Age identity, self-rated health, and life satisfactionamong older adults in Dakar, Senegal. European Journal of Ageing 9, 243–253.
Marin B and Zaidi A (2007) Trends and priorities of ageing policies in the UN-European region. InMarin B and Zaidi A (eds), Mainstreaming Ageing. Aldershot, UK: Ashgate, pp. 61–105.
Matysiak A and Vignoli D (2010) Employment around first birth in two adverse institutional settings: evi-dence from Italy and Poland. Zeitschrift für Familienforschung 22, 331–349.
Matysiak A and Vignoli D (2013) Diverse effects of women’s employment on fertility: insights from Italyand Poland. European Journal of Population/Revue européenne de Démographie 29, 273–302.
Montepare JM and Lachman ME (1989) ‘You’re only as old as you feel’: self-perceptions of age, fears ofaging, and life satisfaction from adolescence to old age. Psychology and Aging 4, 73–78.
Nuzzo R (2014) Statistical errors. Nature 506, 150–152.Penninx BWJH, Guralnik JM, Bandeen-Roche K, Kasper JD, Simonsick EM, Ferrucci L and Fried LP
(2000) The protective effect of emotional vitality on adverse health outcomes in disabled older women.Journal of the American Geriatrics Society 48, 1359–1366.
Pruchno RA, Wilson-Genderson M, Rose M and Cartwright F (2010) Successful aging: early influencesand contemporary characteristics. The Gerontologist 50, 821–833.
Robert SA, Cherepanov D, Palta M, Dunham NC, Feeny D and Fryback DG (2009) Socioeconomic sta-tus and age variations in health-related quality of life: results from the national health measurementstudy. Journals of Gerontology: Psychological Sciences and Social Sciences 64B, 378–389.
Rubin DC and Berntsen D (2006) People over forty feel 20% younger than their age: subjective age acrossthe lifespan. Psychonomic Bulletin and Review 13, 776–780.
Sanderson WC and Scherbov S (2008) Rethinking age and aging. Population Bulletin 63, 3–16.Sanderson WC and Scherbov S (2013) The characteristics approach to the measurement of population
aging. Population and Development Review 39, 673–685.Sargent-Cox KA, Anstey KJ and Luszcz MA (2012) The relationship between change in self-perceptions of
aging and physical functioning in older adults. Psychology and Aging 27, 750–760.Scherbov S and Sanderson WC (2016) New approaches to the conceptualization and measurement of age
and aging. Journal of Aging and Health 28, 1159–1177.Settersten J, Richard A and Hagestad GO (2015) Subjective aging and new complexities of the life course.
Annual Review of Gerontology and Geriatrics 35, 29–53.Siebert JS, Wahl H-W and Schröder J (2018) The role of attitude toward own aging for fluid and crystal-
lized functioning: 12-year evidence from the ILSE study. Journals of Gerontology: Psychological Sciencesand Social Sciences 73B, 836–845.
Solé-Auró A and Alcañiz M (2015) Are we living longer but less healthy? Trends in mortality and mor-bidity in Catalonia (Spain), 1994–2011. European Journal of Ageing 12, 61–70.
Sotgiu I, Galati D, Manzano M and Rognoni E (2011) Happiness components and their attainment in oldage: a cross-cultural comparison between Italy and Cuba. Journal of Happiness Studies 12, 353–371.
Stephan Y, Caudroit J and Chalabaev A (2011) Subjective health and memory self-efficacy as mediators inthe relation between subjective age and life satisfaction among older adults. Aging and Mental Health 15,428–436.
Stephan Y, Sutin AR, Caudroit J and Terracciano A (2016) Subjective age and changes in memory inolder adults. Journals of Gerontology: Psychological Sciences and Social Sciences 71B, 675–683.
Swift HJ, Abrams D, Lamont RA and Drury L (2017) The risks of ageism model: how ageism and nega-tive attitudes toward age can be a barrier to active aging. Social Issues and Policy Review 11, 195–231.
Termini R, Burrascano M and Pagano M (2011) Television e anziani. Geriatria XXIII, 189–192.Tomassini C and Lamura G (2009) Population ageing in Italy and Southern Europe. In Uhlenberg P (ed.),
International Handbook of Population Aging. Dordrecht, The Netherlands: Springer, pp. 69–89.United Nations (2001) World Population Ageing: 1950–2050. New York, NY: United Nations. Available at
http://www.un.org/esa/population/publications/worldageing19502050/.
1692 V Bordone et al.
of use, available at https://www.cambridge.org/core/terms. https://doi.org/10.1017/S0144686X19000084Downloaded from https://www.cambridge.org/core. IP address: 65.21.228.167, on 18 Mar 2022 at 06:07:05, subject to the Cambridge Core terms

Westerhof GJ and Barrett AE (2005) Age identity and subjective well-being: a comparison of theUnited States and Germany. Journals of Gerontology: Psychological Sciences and Social Sciences 60B,S129–S136.
Westerhof GJ, Miche M, Brothers AF, Barrett AE, Diehl M, Montepare JM, Wahl H-W and Wurm S(2014) The influence of subjective aging on health and longevity: a meta-analysis of longitudinal data.Psychology and Aging 29, 793–802.
Westerhof GJ and Wurm S (2015) Longitudinal research on subjective aging, health, and longevity: cur-rent evidence and new directions for research. Annual Review of Gerontology and Geriatrics 35, 145–165.
Wilińska M and Cedersund E (2010) ‘Classic ageism’ or ‘brutal economy’? Old age and older people in thePolish media. Journal of Aging Studies 24, 335–343.
Yannick S, Chalabaev A, Kotter-Grühn D and Jaconelli A (2013) ‘Feeling younger, being stronger’: anexperimental study of subjective age and physical functioning among older adults. Journals ofGerontology: Psychological Sciences and Social Sciences 68B, 1–7.
Zaidi A, Gasior K, Zolyomi E, Schmidt A, Rodrigues R and Marin B (2017) Measuring active andhealthy ageing in Europe. Journal of European Social Policy 27, 138–157.
Cite this article: Bordone V, Arpino B, Rosina A (2020). Forever young? An analysis of the factors influ-encing perceptions of ageing. Ageing & Society 40, 1669–1693. https://doi.org/10.1017/S0144686X19000084
Ageing & Society 1693
of use, available at https://www.cambridge.org/core/terms. https://doi.org/10.1017/S0144686X19000084Downloaded from https://www.cambridge.org/core. IP address: 65.21.228.167, on 18 Mar 2022 at 06:07:05, subject to the Cambridge Core terms


![Factors influencing[1]](https://static.fdocuments.in/doc/165x107/54be1c8d4a795948378b4597/factors-influencing1.jpg)