New hope for the forests? REDD, biodiversity and poverty reduction
description

Final
September 3, 2007
Forests and Biodiversity in Latin America:
San Jose Solution Paper
By Roger A. Sedjo
Senior Fellow
Resources for the Future
Contents
I. Introduction 3
II. Forests and Biodiversity 5
III. Cost and Benefits of Biodiversity: Some Estimates 16
IV. Forests and Biodiversity in Latin America 26
V. Valuation of Benefits and Costs of Protection of Global 31
Ecosystems and Biodiversity
VI. Latin American Benefit and Cost Estimates 37
VII. Four Proposed Solutions: Benefits and Costs 44
VIII. Conclusions 54
References
Tables page
1: Forest by Major Region 5
2: Estimated Number of Species Globally 7
3: Estimates of WTP for Rare. Threatened or Endangered Species
in the U.S. 21
4: Estimates of the Value of Natural Habitat in the U.S. 23
5: Estimates of the Value of Selected Ecosystem Services in the U.S. 25

2
6: Number of Species Threatened with Extinction in Latin America 28
7: Value of Biodiversity for Pharmaceuticals 33
8: Estimates of the Value of Global Ecosystem and Biodiversity
Benefits 37
9: Estimates of the Value of Global Ecosystem and Biodiversity
Benefits 38
10: Estimates of the Cost of Protection for Latin American
Biodiversity 43
11: Benefit-Cost Ratios for Saving Latin American
Forest/Biodiversity 45
12: Solution One: Benefit-Cost Ratio for Saving Latin American
Forest/Biodiversity for the Biodiversity Values for Drugs 49
13: Solution Two: Benefit-Cost Ratio for Saving Latin American
Forest/Biodiversity Through Payments for Avoided Deforestation 50
14: Solution Three: Benefit-Cost Ratio for Ecosystem Services in
Latin American 51
15: Solution Four: Benefit-Cost Ratio for Saving Latin American
Forest/Biodiversity Through Payments for Carbon Sequestration 52
Figures
1: IUCN Biodiversity Hot Spots 29
2: Conservation International’s Biodiversity Hotspots & High
Biodiversity Wilderness Areas 30

3
September 3, 2007
Forests and Biodiversity in Latin America:
San Jose Solution Paper
By Roger A. Sedjo
I. Introduction
The purpose of this report is to provide an overview of the benefits of forests and
biodiversity in Latin America and to move toward the selection of cost-effective solutions
for the protection of these resources. It draws from the literature to describe the situation
with forests and biodiversity, both generally and within the context of Latin America.
The various techniques for estimating the value of biodiversity are particularly subtle and
are developed at some length. The value of the benefits of forests and biodiversity and the
costs of protection are identified and drawn from the literature. Utilizing these data, a
number of cost–benefit analyses are developed and some possible “solutions” are posited.
It is noted that the literature related to the costs and benefits of forests and biodiversity is
poorly developed for many values and much of the world. Despite these limitations, the
solutions are assessed, their strengths and weaknesses noted, and a preferred solution is
selected. Since some of the selections are built on contentious numbers from the literature
and for cost systems that are not fully developed, the choice of solution considers
questions of data reliability and completeness, as well as B/C ratio.
A rationale for the importance of Latin American biodiversity can be found in the Inter-
American Development Bank’s survey1 that found “environment” one of the
“challenges” facing Latin America. In the environment category, deforestation (81.5
percent) and loss of biodiversity (73.2 percent) were the top two concerns.
Forests and biodiversity often go hand-in-hand. Natural forests are the residence of much
of the world’s species and genetic biodiversity. The forest systems also provide a host of 1 http://www.iadb.org/res.ConsultaSanJose

4
other useful outputs in the form of ecosystem services. These include erosion control,
water management and purification, and wildlife and biodiversity habitats.
Biological diversity refers to all living things. Although biodiversity sometimes refers to
the number of species in a geographical area, biodiversity also occurs at a number of
levels of nature, including genetic variation among different individuals and populations
of the same species. The range of ecosystems such as forests, agricultural areas, wetlands,
mountains, lakes, and rivers and differences between and within geographical landscapes,
regions, countries, and continents also are important dimensions of biodiversity.
Many of the benefits of forest ecosystems and biodiversity are viewed as global public
goods. Public goods are those where the benefits are such that their consumption by one
individual does not diminish the amount available for others. This aspect makes
estimating the value of public goods difficult, since they are not transacted in markets.
The public good aspect is one reason that decisions with respect to these outputs usually
are determined using the political process. This paper discusses some methods for trying
to assess the monetary value of the goods and services produced by biodiversity. These
include various forms of contingent valuation. However, since estimates of value usually
are for a single output, such as preventing the extinction of the spotted owl, the values
usually do not represent the full array of biodiversity outputs.
Similar measurement problems hold for the goods and services produced by ecosystems.
Often a host of ecosystem services are produced, many of which are public goods or for
other reasons nonmarketed, such as flood and erosion control or water retention for dry
periods, as with mountain snows. Again, many of these outputs might be viewed as
public goods, while others involve difficulties in establishing viable markets for various
reasons. Thus, although estimates of the values of these ecosystem services have been
made, often they are quite crude.
Forests may be viewed as providers of ecosystem services. Traditionally, forests have
been viewed as providing both private goods, such as timber and private recreation, as

5
well as public services and externalities, such as water flow control and erosion
mitigation that may be largely local. Thus, it has been argued that the decisions
concerning these forests should be largely local. However, forest biodiversity often is
viewed as a global public good with substantial positive externalities that generate global
benefits, such as being a repository of global genetic information and of carbon, large
volumes of which are captured in the cells of tree and soils of the forests and if released
would contribute substantially to global warming. Therefore, forest biodiversity has been
taken as of global concern.
II. Forests and Biodiversity
Forests
The U.N. Food and Agricultural Organization’s (FAO) Global Forest Resources
Assessment (2005) indicates that the globe’s forest cover totaled 3.99 billion ha in 2000
or 29 percent of the land area (Table 1). Forests are distributed among tropical forests (47
percent); subtropical forests (9 percent); temperate forests (11 percent) and boreal forests
(33 percent). Forests are abundant on all continents except Antarctica.
In Latin America, forests cover about 1064 million ha; a large percentage of this area is
tropical. Recently the Global Forest Resources Assessment (FAO 2000) estimated the net
loss of forest area at 9.4 million ha, with the tropics experiencing a decrease and the
temperate regional experiencing a modest increase in forest area.
Table 1: Forests by Major Region: 2005 (million ha)
Region Forest Area Africa 655.6 Asia 566.6 Europe 988.1 North and Central America 707.5 Oceania 208.0 South America 852.8 World Total 3988.6 Source: Global Forest Resources Assessment 2005.

6
Biodiversity2
Biological diversity refers to all living things; however, often biodiversity refers to the
number of species in a geographical area. One estimate is that the total number of species
globally is about 14 million, while the approximate number of identified (described)
species is less than 2 million. Note that only somewhat more than 10 percent of the
estimated species have been described. The species described for plants are more than
one-half of the estimated global totals, while those described for bacteria and fungi are
only a small fraction of the estimated total species (Table 2).
Biodiversity Definitions
Biodiversity typically is considered at three levels: species diversity, genetic diversity,
and ecosystem diversity. Species diversity is the variety and abundance of species in a
geographical area. Species are the central unit in biodiversity studies and conservation, at
least in part because ecosystems are hard to delimit and genes until recently have been
difficult to count and identify (Wilson 1999). However, each species consists of
subspecies (i.e., geographical races), populations, and individuals that possess their own
varying levels of genetic distinctiveness. A population is a geographically distinct group
of individuals of a particular species. A biological community is defined as the collection
of species populations that exist and interact in a particular location. An evolutionarily
significant unit (ESU) is a population or group of populations that is substantially
reproductively isolated and is genetically unique from other populations, making it an
important evolutionary component of the species. Since a major goal of biodiversity
conservation is to maintain the evolutionary potential of unique lines of descent, practical
species management and conservation efforts often target ESUs rather than entire
species.3
2 This section draws heavily for its discussion of biodiversity from “Biodiversity in the United States” by Juha Siikamäki and Jeffrey Chow, forthcoming. 3 For example, Pacific salmon have more than 50 distinct ESUs, which are basis for their management and conservation.

7
Table 2. Estimated Number of Species Globally
Described Worldwide Estimated Total Kingdoms Worldwide Bacteria 4,000 1,000,000
Protoctista (algae, protozoa,
etc.)
80,000 600,000
Animals 1,320,000 10,600,000
Fungi 72,000 1,500,000
Plants 270,000 320,000
Total 1,746,000 Ca. 14,000,000
Source: UNEP 1995, Global Biodiversity Assessment, Table 3.1–2, page 118.
Genetic diversity refers to genetic variation within species, both among distinct
populations and among the individuals within a population. Genes are the chromosomal
units that code for specific proteins that generate the unique morphological and
biochemical characteristics of an organism and are passed down along generations of
organisms. Variation arises from mutations in genes, and natural selection of these
characteristics within a population is the primary mechanism of biological evolution. In
sexually reproducing species, genetic diversity also comes from recombination that
occurs when genes are exchanged. Genetic diversity within species populations helps to
maintain reproductive vitality, disease resistance, and the ability of populations to adapt
to changing environmental conditions. Biodiversity conservation methods sometimes
include in situ efforts such as crossbreeding and translocation that help maintain the
genetic diversity of wild populations. Germplasm repositories also have been established
to store genetic diversity in the form of semen, embryos, and seeds ex situ.
Ecosystem diversity refers to the variation within and between communities and their
associations with the physical environment. The richness of ecological systems within an
area also is sometimes called systems diversity. Species play different functions within

8
their communities; some species are functionally substitutable, whereas others (keystone
species) play determinant roles in the food web and cannot be removed from the system
without fundamentally affecting the species composition of the community. Ecosystem
diversity also relates to landscape diversity, which denotes the diversity and connectivity
of ecosystems within large geographical areas.
Biodiversity and Ecosystem Processes
Ecologists generally consider that species diversity increases ecosystem productivity,
stability, and resiliency (McCann 2000). The relationship between diversity and stability
has intrigued ecologists. In the early 1970s, rigorous mathematical analyses of
community dynamics suggested that diversity may not necessarily support stability (May
1973). Instead, these analyses suggested that in artificially constructed communities with
random interspecies interactions, species richness could destabilize community dynamics.
During the last decade or so, experimental studies have helped to resolve the diversity–
stability debate. Results from long-term field experiments, particularly those by David
Tilman and his colleagues (e.g., Tilman 1996, 2004; Tilman and Downing 1994; Tilman
et al. 2001) indicate that although species richness and the resulting internal competition
may cause fluctuations in individual species populations, diversity tends to increase the
productive stability of an ecosystem as a whole. It is now generally believed that
differential responses by different species and functional groups, not simply the number
of species, give rise to ecosystem stability (McCann 2000). Changes in the biomass
production by some species, for example, are associated with dissimilar changes in the
biomass production by other species. Consequently, aggregate variation in biomass
production generally is more stable in systems with more species.
Diverse ecosystems generally have high rates of ecosystem processes, meaning that they
produce more biomass than less diverse systems. However, increases in the rates of
ecosystem processes seem to plateau at relatively low levels of species richness.
Experimental analyses also have shown that what matters most is the diversity of
functional groups, whereas species richness within functional groups may be less
important (e.g., Knops et al. 1998; Holling et al. 1995).
9
Ecosystem resilience in ecology can be defined as the magnitude of disturbance that can
be absorbed by the ecosystem before it changes to another equilibrium state. Robustness
is the speed of return to equilibrium after a disturbance. Species, some of which may
seem ecologically unimportant under current conditions, may play important roles to the
resiliency and robustness of ecosystems to disturbances. For example, recent research
suggests that diverse communities may have a greater capacity to resist invasions by
exotic, nonnative species, which are major threat to biodiversity4 (e.g., Kennedy et al.
2002; Tilman 2004).
Several components of species diversity determine its effects within actual ecosystems,
including the number of species, the relative abundances of species, the particular species
present, the interactions among the species present, and the spatial and temporal
variations of these components. However, current knowledge about the consequences of
biodiversity loss in actual ecosystems is limited, especially when considering large
ecosystems and changes in biodiversity. Present information about how ecosystem
functions relate to diversity comes mostly from simple ecosystems with only few species.
In addition, most scientific evidence relates to only small variations in species
composition and relative abundance. Critics point out that real ecosystems may be
structured quite differently and operate under different processes than those in
experimental studies (e.g., Grime 1997); hence, the role of biodiversity within natural
ecosystems remains problematic.
Measuring Biodiversity
Biodiversity typically is characterized as the number of species, ecosystems, and genes.
Ecological systems have three primary attributes—composition, structure, and function—
that constitute biodiversity. Composition denotes the identity and variability of different
elements such as species, genes, and ecosystems. Structure is the physical organization,
pattern, and complexity of elements at different organizational scales (habitat, ecosystem,
4 Exotic species that establish themselves in nonnative habitats may displace native species through competition for natural resources, predate upon native species to extinction, or alter habitat to the point that native species can no longer persist.

10
landscape). Function consists of ecological and evolutionary processes of elements, such
as nutrient recycling, disturbance, or gene flow. Although each primary attribute of
biodiversity potentially is important, interest in biodiversity concentrates around
composition, especially species diversity (Franklin 1981; Noss 1990).
Two major approaches to the quantification of biodiversity have emerged. Economics
literature has focused on measures of biodiversity that are based on joint dissimilarity
among a set of species, whereas ecological literature emphasizes measures of biodiversity
that are based on the relative abundance of species within ecological communities
(Polasky et al. 2005).
Economics tradition of measuring biodiversity using the joint dissimilarity of species has
its origins in Weitzman’s (1992) work. A phylogenetic tree describes the evolutionary
interrelationships among various organisms and their common ancestors. The
phylogenetic tree can be used to determine joint dissimilarity of species from the branch
lengths between different species on the tree. However, joint dissimilarity of species does
not necessarily indicate the value of biodiversity. For example, Brock and Xepapadeas
(2003) show that a slightly more diverse ecosystem can be much more valuable although
the increase in dissimilarity is almost zero.
Most conservation efforts, however, deal with habitat rather than species. Habitat-based
measures of biodiversity are needed for assessing and designing alternative conservation
strategies. In the ecological literature, the most common characterizations of biodiversity
are based on the relative abundance of species within ecological communities.
Mathematical indices of biodiversity quantify species diversity at three different
geographical scales. Alpha diversity is the number of species in a certain community and
can be used to compare the diversity of different locales or ecosystem types. Gamma
diversity is the species richness of a wide geographical area that encompasses multiple
ecosystems, such as a country or continent. Beta diversity measures the variability of
species composition over an environmental or geographical gradient and is sometimes
calculated as the ratio of gamma diversity to alpha diversity.

11
Diversity indices also are based on relative abundance in order to provide information
about the rarity or commonness of species in a community. The Simpson index (Simpson
1949) and the Shannon–Weaver index (Shannon and Weaver 1949) are the most common
indices based on the relative abundance of species. Simpson’s index represents the
probability that two randomly chosen individuals in a community belong to different
species.5 The Shannon–Weaver index measures the order or disorder of species
composition.6 In a more ordered system, the abundances of different species are similar
and biodiversity is lower; in a less ordered system, the opposite is true.
Practical measurements of biodiversity often are based on a collection of biodiversity
indicators. Biodiversity indicators are measures of ecological endpoints that are selected
based on their perceived importance to biodiversity. Examples of such endpoints include
species richness and the number of extinct, endangered, and threatened species within an
ecological community or geographical area. Repeated measurements of different
endpoints help evaluate how biodiversity is changing over time and how this relates to
human activities.
Different indicators must be specified for particular ecosystems to reflect their unique
characteristics. In the United States, the National Report on Sustainable Forests (USDA
Forest Service 2004) develops nine indicators for the conservation of biodiversity in
forest ecosystems. Ecosystem diversity is addressed by five indicators, which measure
the extent of forest fragmentation, different forest types, successional stages, and age
classes in forests and protected areas. Other biodiversity indicators adopted by the U.S.
Forest Service include the number of forest-dependent species, the percent of forest-
dependent species at risk of not maintaining viable populations, the number of forest-
dependent species that occupy a small portion of their original range, and the population
levels of representative species from diverse habitats monitored across their range. 5 Simpson’s diversity index is calculated by taking the proportion of each species relative to the total number of species and then squaring and summing the proportions for all the species. 6The Shannon–Weaver diversity index is calculated from the proportion of each species relative to the total number of species, multiplied by the natural logarithm of this proportion. It is also known as the Shannon index and the Shannon–Weiner index.
12
However, even in the United States, several of these indicators currently cannot be
monitored due to insufficient data.
Status of Biodiversity
Generally, biodiversity tends to be higher in southern areas and to decrease gradually
toward the north. This pattern is especially true for flowering plants but it also emerges
with the diversity of vertebrates. A similar longitudinal gradient is observed in global
biodiversity (Gaston 2000). However, many basic questions related to the current status
of biodiversity remain unanswered. For instance, the total number of species in the world
is unknown. Estimates vary from a few million species to more than 100 million species,
with the current consensus around 14 million species (Table 1). The species counts and
their precision vary considerably across different taxonomic groups. Plant species are
among the most completed inventories. It generally is accepted that approximately
300,000 to 500,000 plant species exist (Hammond 1995). For many groups of organisms,
however, the precision of the estimated species counts is considered poor or moderate.
The number of actually recognized and described species is fewer than 2 million.
The taxonomic group with the largest number of known species—about 1.3 million—is
animals. Out of all known animal species, the vast majority, almost 1.1 million are insects
and other arthropods. In addition, animal species include about 45,000 known chordates
and about 70,000 thousand mollusks. Sponges, jellyfish, corals, hydras, and other aquatic
animals comprise approximately 20,000 known species. The rest of known animal
species mostly are worms of different kinds, such as flatworms, roundworms, or
segmented worms (Hammond 1995).
Vertebrates and plants have been catalogued quite comprehensively, and their estimated
numbers are not expected to change dramatically as more information is gathered over
time. Viruses, bacteria, and fungi are the major groups of organisms with the largest
estimated number of nondescribed species. New species are identified in all taxonomic
groups; every year, more than 10,000 completely new species are identified. This rate of

13
more than 300 new species per day has stayed somewhat constant (Purvis and Hector
2000; UNEP 1995).7
Extinctions
A species becomes extinct when the last existing member of that species dies. However,
extinction designations often are regionally specific; that is, applying to a state, region, or
country. Global extinction, of course, refers to the species disappearance from the entire
globe. When only a few individuals of species exist, a species may become functionally
extinct, meaning that the reproduction and the survival of that species is not possible. A
species becomes extinct in the wild when the only living individuals belonging to that
species are maintained in unnatural environments, such as zoos.
Although extinctions are difficult to observe and verify, the World Conservation Union
(IUCN) is widely recognized as the world’s leading conservation network.8 The IUCN
provides an estimate of threatened species based on its assessment of less than three
percent of the world’s 1.9 million described species (IUCN Red Book 2004). The IUCN
list contains 784 species worldwide that are documented to have gone extinct in the wild
since 1500. Over the past 20 years, 27 documented extensions have occurred.
Extinctions can occur naturally. A key question, therefore, is how the current extinction
rate compares to the natural or background extinction rate. Background extinction rates
are determined by examining fossil records. Using these data, geologists have estimated
that around 0.1 to 1 species per million species per year have gone extinct globally.
During the last 400,000 years, approximately 400 invertebrate and 300–350 vertebrate
species are known to have gone extinct globally. The number of plant extinctions is not
well known, but it is believed to be several hundred. Among birds, mammals, and
amphibians, the taxa for which extinction records are most reliable, the current average 7 Regardless of what the exact number of current species may be, scientists believe that it is more than at any other point in the Earth’s history. The current species represent only a fraction of all species that have ever existed, which is estimated at around 5 billion species. 8 IUCN stands for the International Union for the Conservation of Nature and Natural Resources, the full name of the World Conservation Union. The IUCN involves 82 States, 111 government agencies, and more than 800 nongovernmental organizations, and some 10,000 scientists and experts from 181 countries.

14
extinction rates are about 50 to 500 times the background extinction rate. If possible
extinctions are included; the current extinction rates are about 100 to 1,000 times the
geological extinction rates. These estimates generally are considered conservative.
Consequently, the recent extinction rates seem to be at least one or two orders of
magnitude higher than the background extinction rates (IUCN Red List 2004).
Although extinctions have become more common due to human activities, considerably
fewer species have gone extinct than was predicted in some widely publicized—and
criticized (e.g., Simon and Wildawsky 1984)—scenarios about 20 years ago. At the time,
it was predicted that as many as 15–20 percent of all species on Earth would go extinct
within the next 20 years (Global Report to the President 2000). This would have meant a
loss of tens of thousands or even hundreds of thousands of species every year. As noted,
now that more than 20 years have passed since these predictions, the IUCN Red List
reports that worldwide 27 species are known to have gone extinct during the last 20
years. So we have not witnessed the apocalyptic extinction rates that were once predicted.
Nevertheless, even though extinction rates have remained relatively low, in many species
groups 10–20 percent of all known species are endangered or threatened by extinction
(IUCN 2004).
Species Endangerment
The IUCN characterizes endangered species as critically endangered, endangered, or
vulnerable depending on the estimated risk of extinction. Critically endangered,
endangered, or vulnerable species are determined by the IUCN to be under extremely
high, very high, or high risk of extinction, respectively. All species in these three threat
categories depend on conservation measures for their continued existence. The degree of
species endangerment is determined by using multiple criteria, including population size,
population range, and the rates at which they are being decreased.
Threats to Biodiversity
Major threats to biodiversity include habitat change, invasive alien species, pollution, and
climate change (CBD 2007). Almost certainly the primary cause of contemporary

15
biodiversity decline is habitat destruction and the degradation that results from the
expansion of human populations and activities. Habitat loss takes several forms: habitat
can be completely lost (e.g., urban development), can be degraded (e.g., forest
management, pollution of wetlands), or can become fragmented (e.g., urban sprawl).
Species loss due to habitat loss relates to the species–area relationship, which is a
fundamental concept in ecology. Typically, smaller areas have fewer species than the
larger ones. Ecologists view distinct areas of nature as islands. These islands come in all
sizes and differ in their connectivity with other islands. These islands are not necessary
literal islands of land in an ocean or a lake; they refer to any relatively disconnected and
distinct areas of habitat. So for instance, parks within a city are islands, as are lakes
within a continuum of land. The basic idea of island biogeography (MacArthur and
Wilson 1967) is that the number of species in area balances departures (extinctions) and
arrivals of species. For example, the future number of species in a certain area will be
determined by how many of its current species will persist and how many new species
will immigrate there. Smaller islands tend to have fewer species than the bigger ones, and
the less connected these islands are, the fewer species they generally contain. Habitat loss
tends both to create smaller islands and to decrease their connectivity.
After habitat loss, nonnative species are the second leading cause of endangerment.
Nonnative species, which also are called invasive or alien species, are broadly
distributed; their numbers vary and follow roughly the patterns of population density and
transportation routes. The introduction of nonnative species has important effects.
Estimates of the economic losses due to nonnative species are tentative, but Pimentel et
al. (2000) suggest that the losses from invasive species may be more than $100 billion
annually, although this estimate generally is considered speculative (Polasky, Costello et
al. 2005).
In addition to habitat loss and nonnative species, pollution, overexploitation of species,
and illnesses are among the causes of endangerment of several species.
16
Some researchers believe that in addition to current threats of extinction, climate change
may become one of the greatest drivers of biodiversity loss in the long run. Although
nature has a notable capacity to adapt to changes, the relatively rapid climatic changes
that have been predicted may leave species without adequate opportunity to adjust their
ranges, especially if combined with increased fragmentation and decreased connectivity
of habitats that create additional barriers to adjustment (Thomas et al. 2004; Millennium
Ecosystem Assessment 2005.
III. Costs and Benefits of Biodiversity: Some Estimates
Biodiversity Losses
Extinctions are irreversible events that permanently remove a unique constituent of
current biodiversity. How much of the evolutionary information passed on to the future is
lost through extinctions? Since much of the evolutionary information (evolutionary
history) is shared by other species, there is no one-to-one relationship between
extinctions and the loss of evolutionary information. For example, if one in every ten
species goes extinct, typically less than one tenth of the total evolutionary information in
all species is lost. Even in extreme mass extinctions, in which nearly all species would
disappear, the majority of evolutionary information would be maintained by the surviving
species (Nee and May 1997). This does not suggest that extinctions are somehow
insignificant events; the idea is simply that species share significant amount of
evolutionary information and different species substitute as carriers of this information.
Alternative conservation strategies may be evaluated not only based on the number of
species they protect but also how effectively they preserve evolutionary history (e.g.,
Mace et al. 2003; Brooks et al. 1992). For example, each species in the phylogenetic tree
has some unique and some shared evolutionary history. Extinction of any one species
leads to the loss of some unique evolutionary history, but not every species has the same
amount of unique history.

17
Using preservation of evolutionary history for assessments of alternative conservation
plans is intuitively appealing but difficult in practice because it requires currently lacking
information on the evolutionary history of different species. Also, human ability to
determine ex ante what evolutionary information is most valuable for preservation is
problematic.
Values for Biodiversity
The values of biodiversity can be divided into three types: biodiversity as a global public
good (i.e., biodiversity that provides global public benefits); biodiversity that provides
national or regional benefits, but involves externalities; and biodiversity that provides
private goods absence externalities. The typical approach of economists is to argue that
the private goods need no special policies outside that of the provision of appropriate and
enforced property rights. For local and regional public goods, appropriate policies, such
as tax or subsidy policies usually are recommended. For global public good, some
mechanism to provide global policies and perhaps global funding usually are deemed
appropriate. Specific values from biodiversity stem from different beneficial uses,
functions, and purposes of biodiversity, ecosystems, and their different components.
Biological commodities, such as food, feed, wood, and other fiber materials, that are
largely traded in markets provide valuable good and services. Biodiversity in breeding
stocks adds to the long-term sustainability of the production of these commodities.
Additionally, medicinal and pharmaceutical products and sources for biological control
and remediation found in biodiversity are valuable assets to society. While the final
products are traded in markets, the biological resources that are inputs are usually viewed
as public goods (Sedjo 1992a).
Environmental Services
Ecosystems, and especially forest ecosystems, provide a host of valuable environmental
services. Many are largely nonmarket services, such as protection of water resources,
nutrient storage and cycling, pollution breakdown and absorption, soil fertility and

18
protection, climate stability, and recovery from disturbances of natural systems. In
addition, forests and forest biodiversity generates benefits that are related to recreation
and tourism, research and education, and culture and tradition. Many of these benefits are
local or regional. Also, ecosystems provide a residence for unique plants and other
organisms that have pharmaceutical potential.
Importantly, forests ecosystems also provide the ecological service of carbon
sequestration. In the process of biological growth, carbon dioxide is taken into the plant
and the carbon is captured into the cells of the plant and the oxygen released back into the
atmosphere. Forest, unlike many plants, accumulate large amounts of biomass over long
periods of time. Within this biomass, huge volumes of carbon are held captive in forest
ecosystems, including in the trees, litter, and forest soils. Unlike many ecosystem
services, which are local in their benefits, the climate benefits of forests are not restricted
to one locale but are truly global in nature.
Use and Existence Values of Species: Contingent Valuation
The value of biodiversity, especially endangered and threatened species, often is not
related to direct uses of those species but rather to the intrinsic worth of their existence.
Such non-use values are difficult to estimate because they are not captured in market
transactions. This has given rise to the development of a variety of nonmarket valuation
methods that use surveys to elicit preferences for public goods, such as protection of
threatened and endangered species. Because these methods are based on eliciting and
examining stated rather than actual preferences, they also are broadly categorized as
stated preference (SP) methods (e.g., Louviere et al. 2000). The contingent valuation
(CV) method is the most commonly applied SP method for valuing biodiversity. The CV
method requests people to state their approval or disapproval of specific policy programs
for the protection of certain species or habitat. Because the proposed scenarios have
specified costs that are varied across survey respondents, researchers can examine survey
responses and estimate how much people are willing to pay for the protection of certain
species. For a review of CV, see Carson and Hanemann (2005).

19
Not all economists agree that expressions of stated preferences are useful for economic
valuation. For example, Diamond et al. argue that people simply do not have preferences
for the types of goods CV studies deal with, and they note that the lack of experience in
markets for environmental commodities make answering CV questions difficult.
Hanemann (1994) is more optimistic about CV and argues that despite its challenges, the
ability to place an economic value on environmental quality is essential for
environmental policy and a cornerstone of the economic approach to the environment.
Stated preference methods are widely applied in other fields of research, such as
marketing and transportation research and decision analysis (McFadden 1974; Ben-
Akiwa 1985; Louviere et al. 2000; Train 2003; Frances and Montgomery 2002). In these
fields, SP methods regularly are used for eliciting consumer preferences for new
products, product alternatives, and transportation options and to help their design and
marketing.
Individual Species
Although wild species are no longer essential for human survival, their direct uses
continue through hunting, fishing, and gathering. Methods for the valuation of such
benefits are quite well established; they are explained and reviewed by Phaneuf and
Smith (2005). Values from recreational uses of nature can be substantial. For example,
salmon fishing has been estimated to be worth from around $14 to more than $110 per
day per angler, depending on where and which type of salmon is fished. A day of hunting
has been estimated to be worth between approximately $30 and $45 per hunter,
depending on what game is targeted (Phaneuf and Smith 2005.)
Willingness to Pay (WTP) estimates suggest substantial variation in the WTP of the
public for protection of rare, threatened, and endangered species. Bell et al. (2003)
estimate that the WTP for the protection of Coho salmon can surpass $100 per year per
household. Giraud et al. (2002) and Giraud and Valdic (2004) predict that U.S.
households are willing to pay $69–99 for the protection of the Steller sea lion in Alaska,

20
whereas the WTP of Wisconsin households for the protection of striped shiner (Boyle
and Bishop 1987) and that of Massachusetts households for the protection of Atlantic
salmon (Stevens et al. 1991) both are roughly $10. The finding that WTP varies between
different species is not new. It is widely known that both the preferences of public and
public officials vary across different species, often favoring charismatic megafauna over
less magnificent yet equally or more vulnerable species.
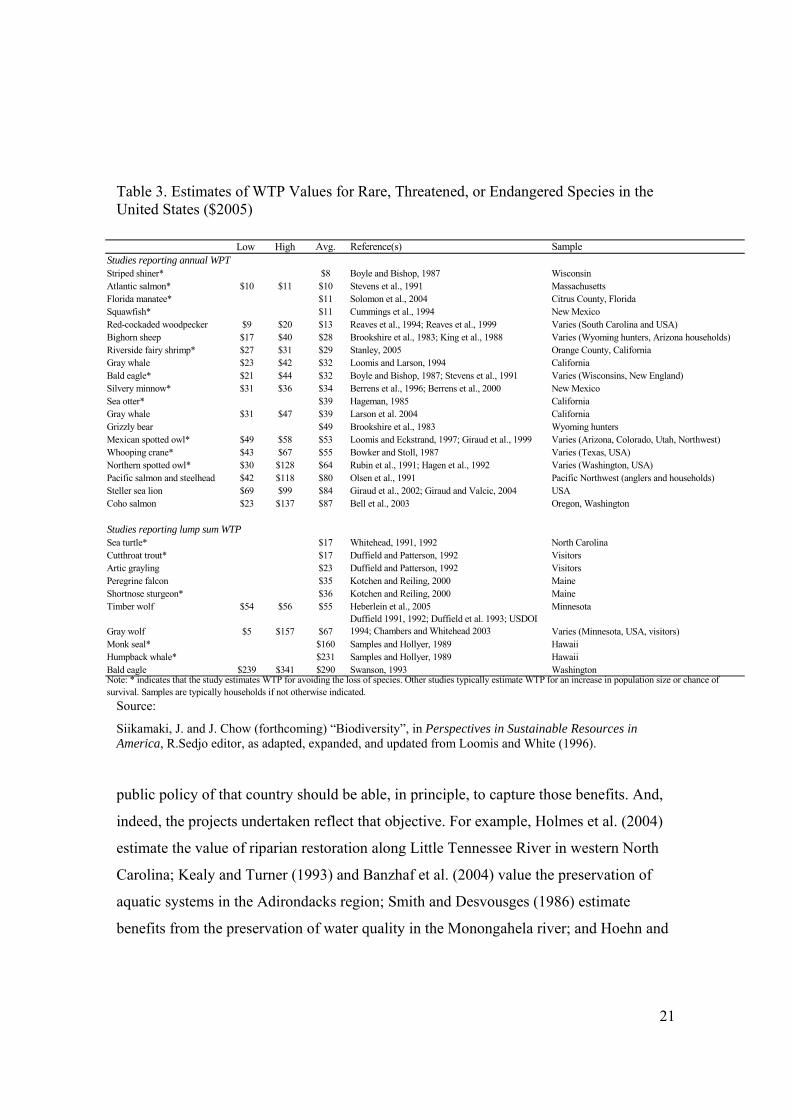
Table 3 summarizes values for 29 species for which values have been estimated by one or
more CV studies. These studies estimate WTP for avoiding loss of a species studies or for
an increase in population size or viability.
Four caveats should be kept in mind when interpreting these WTP results. First, they are
for the United States and so are unlikely to be representative for many Latin American
countries. Second, since many animals are game animals, they are not representative for
rare, threatened, or endangered species in general, where recreational values would be
absence or quite different. Furthermore, most valuation efforts have focused on species of
significant publicity, such as the bald eagle, spotted owl, pacific salmon, or whooping
crane, and many less-publicized yet susceptible species have not been valued by any
studies. Third, sampled populations vary remarkably across different studies. Fourth,
survey and estimation methods advance quite rapidly and not every study uses methods
that are now considered state-of–the-art. While not necessarily representative, however,
the table suggests significant economic value is given to many very different individual
species.
Natural Habitat
Several studies, again largely in the United States, have estimated benefits from different
types of natural habitat. The results of these analyses are summarized in Table 5. Most of
the benefits studied relate to water, and other ecosystem benefits are not considered.
Also, most of these studies have estimated the value of specific resources in a specific
geographic area. Thus, although many of the benefits are external to markets, they are
largely confined to certain geographic areas. Where these areas are within one country,
21
Table 3. Estimates of WTP Values for Rare, Threatened, or Endangered Species in the United States ($2005)
Source:
Siikamaki, J. and J. Chow (forthcoming) “Biodiversity”, in Perspectives in Sustainable Resources in America, R.Sedjo editor, as adapted, expanded, and updated from Loomis and White (1996).
public policy of that country should be able, in principle, to capture those benefits. And,
indeed, the projects undertaken reflect that objective. For example, Holmes et al. (2004)
estimate the value of riparian restoration along Little Tennessee River in western North
Carolina; Kealy and Turner (1993) and Banzhaf et al. (2004) value the preservation of
aquatic systems in the Adirondacks region; Smith and Desvousges (1986) estimate
benefits from the preservation of water quality in the Monongahela river; and Hoehn and
Low High Avg. Reference(s) SampleStudies reporting annual WPTStriped shiner* $8 Boyle and Bishop, 1987 WisconsinAtlantic salmon* $10 $11 $10 Stevens et al., 1991 MassachusettsFlorida manatee* $11 Solomon et al., 2004 Citrus County, FloridaSquawfish* $11 Cummings et al., 1994 New MexicoRed-cockaded woodpecker $9 $20 $13 Reaves et al., 1994; Reaves et al., 1999 Varies (South Carolina and USA)Bighorn sheep $17 $40 $28 Brookshire et al., 1983; King et al., 1988 Varies (Wyoming hunters, Arizona households)Riverside fairy shrimp* $27 $31 $29 Stanley, 2005 Orange County, CaliforniaGray whale $23 $42 $32 Loomis and Larson, 1994 CaliforniaBald eagle* $21 $44 $32 Boyle and Bishop, 1987; Stevens et al., 1991 Varies (Wisconsins, New England)Silvery minnow* $31 $36 $34 Berrens et al., 1996; Berrens et al., 2000 New MexicoSea otter* $39 Hageman, 1985 CaliforniaGray whale $31 $47 $39 Larson et al. 2004 CaliforniaGrizzly bear $49 Brookshire et al., 1983 Wyoming huntersMexican spotted owl* $49 $58 $53 Loomis and Eckstrand, 1997; Giraud et al., 1999 Varies (Arizona, Colorado, Utah, Northwest) Whooping crane* $43 $67 $55 Bowker and Stoll, 1987 Varies (Texas, USA)Northern spotted owl* $30 $128 $64 Rubin et al., 1991; Hagen et al., 1992 Varies (Washington, USA)Pacific salmon and steelhead $42 $118 $80 Olsen et al., 1991 Pacific Northwest (anglers and households)Steller sea lion $69 $99 $84 Giraud et al., 2002; Giraud and Valcic, 2004 USACoho salmon $23 $137 $87 Bell et al., 2003 Oregon, Washington
Studies reporting lump sum WTPSea turtle* $17 Whitehead, 1991, 1992 North Carolina Cutthroat trout* $17 Duffield and Patterson, 1992 VisitorsArtic grayling $23 Duffield and Patterson, 1992 VisitorsPeregrine falcon $35 Kotchen and Reiling, 2000 MaineShortnose sturgeon* $36 Kotchen and Reiling, 2000 MaineTimber wolf $54 $56 $55 Heberlein et al., 2005 Minnesota
Gray wolf $5 $157 $67Duffield 1991, 1992; Duffield et al. 1993; USDOI 1994; Chambers and Whitehead 2003 Varies (Minnesota, USA, visitors)
Monk seal* $160 Samples and Hollyer, 1989 HawaiiHumpback whale* $231 Samples and Hollyer, 1989 HawaiiBald eagle $239 $341 $290 Swanson, 1993 WashingtonNote: * indicates that the study estimates WTP for avoiding the loss of species. Other studies typically estimate WTP for an increase in population size or chance of survival. Samples are typically households if not otherwise indicated.

22
Loomis (1993) estimate the value of wetland and habitat in the San Joaquin Valley in
California.
As an alternative to scrutinizing finely defined natural habitats, some studies have
estimated values of broadly specified resources. For example, in a widely known study,
Mitchell and Carson (1984) estimate the benefits from preserving water quality in all
rivers and lakes of the United States. In another geographically broad study, Larson and
Siikamäki (2006) estimate the WTP of California households for regional and state
programs designed to improve surface water quality and remove the impairments of
water quality that limit beneficial uses of surface water bodies. Although breaking down
the value estimates of broadly defined resources, such as all water bodies in an entire
region or state, can be difficult, using a broadly defined resource as the basis of valuation
may help to estimate a WTP that better reflects actual WTP for an aggregate resource
than can be estimated by summing up WTP estimates for its sub-components.

23
Table 4. Estimates of the Value of Natural Habitat in the United States
Source: Siikamaki and Chow (forthcoming) as adapted from Nunes and van den Bergh (2001).
Adding up results from separate studies, each of which is focused on valuing a single
species or localized habitat, can lead to ignoring relevant substitutes, improper rescaling,
and unrealistically high aggregate value estimates. For example, Brown and Shogren
(1998) note that aggregating the estimates summarized in Loomis and White (1996)
implies that the total WTP for less than two percent of endangered species exceeds one
percent of GDP, which they consider suspiciously high.
Ecosystem Services
A literature review of valuation of ecosystem services is provided by Nunes and van den
Bergh (2001). Ecosystem services are the economically valuable functions that
ecosystems provide to humans. More broadly, natural capital consists not only of specific
biophysical natural resources, such as minerals, energy, animals and trees, but their
Author(s) StudyMean WTP estimates (per household)
Holmes et al. (2004) Riparian restoration along the Little Tennessee River in western NC
$0.69-40.89 per year
Loomis (1989) Preservation of the Mono Lake, CA $4-11Silberman et al. (1992) Protection of beach systems, NJ $9.26-15.1Kealy and Turner (1993) Preservation of the aquatic system in the Adirondack
region, US$12-18
Smith and Desvousges (1986)
Preservation of water quality in the Monongahela River Basin
$21-58 (for users), $14-53 (for non users)
Walsh et al. (1984) Protection of wilderness areas in CO $32 Diamond et al. (1993) Protection of wilderness areas in Colorado, Idaho,
Montana, and Wyoming, US$29-66
Boyle (1990) Preservation of the Illinois Beach State Nature Reserve $37-41
Loomis and Gonzales-Caban (1998)
Fire management plan to reduce burning of old growth forests in CA and OR
$56 per year
Larson and Siikamaki (2006) Removal of surface water quality impairment in California
$67-133 per year
Loomis et al. (1994) Fire management plan to reduce burning of old growth forests in OR
$90 per year
Hoehn and Loomis (1993) Enhancing wetlands and habitat in San Joaquin valley in California, US
$96-284 (single program)
Richer (1995) Desert protection in CA $101 Mitchell and Carson (1984) Preservation of water quality for all rivers and lakes $242

24
interaction within ecosystems (Heal et al. 2005). These functions can generate both
marketed and nonmarketed benefits. As discussed earlier, examples include water
purification, oxygen creation, maintenance of soil productivity, waste decomposition,
nutrient cycling, pest control, flood control, climatic control (climate moderation, carbon
sequestration), pollination of crops and native vegetation, and provision of recreation
opportunities. Valuation of ecosystem services can view the natural environment as a
type of capital asset, natural capital, which generates returns in the form of ecosystem
services. Biodiversity is considered an element of the natural capital and ecosystems are
productive systems in which different elements serve different functions in the
production of ecosystem services.
An example of ecosystem services is wetlands, which serve as flood barriers, soaking up
excess water and slowing and preventing floodwaters from spreading uncontrollably.
Wetlands help replenish groundwater and improve both groundwater and surface water
quality, slowing down the flow of water, and absorbing and filtering out sediment and
contaminants. Wetlands also provide spawning habitat for fish, supporting the
regeneration of fisheries. Also, wetlands provide habitat for many species and support
fishing, hunting, and recreation.
The National Academy of Sciences established a Committee on the Valuation of
Ecosystem Services, which was given the task of evaluating methods for assessing
ecosystem services and their associated economic value. The committee prepared a
report, “Valuation of Ecosystem Services” (Heal et al. 2005), which highlights the central
issues in valuing ecosystem services, especially those relating to aquatic ecosystems. The
report notes that the key challenge in the valuation of ecosystem services is the successful
integration of economic and ecology. It is required for “providing an explicit description
and adequate assessment of the links between the structures and functions of natural
systems, the benefits (i.e., goods and services), derived by humanity, and their subsequent
values.” The complexity of ecosystems makes the translation of ecosystem structure and
function to ecosystem goods and services and their value especially difficult.

25
Table 5 summarizes a number of studies that have estimated values for ecosystem
services that are related to water supplies, water quality, and soil-erosion control. These
analyses have used a variety of methods, including CV (McClelland et al. 1992;
Heberlein et al. 2005), averting expenditures (Laughland et al. 1996; Abdalla et al. 1992;
Ribaudo 1989a, 1989b), replacement cost (Holmes 1988; Huszar 1989), and production
function (Walker and Young 1986; Torell et al. 1990). For different techniques of valuing
the environment as a factor of production, including averting cost, replacement costs, and
production function methods, see McConnell and Bockstael (2005).
Table 5. Estimates of the Value of Selected Ecosystem Services in the United States
Source: Siikamaki and Chow (forthcoming) as adapted from Nunes and van den Bergh (2001).
An interesting example of ecosystem services valuation, not found in Table 5, has to do
with the Catskills Mountains, from where New York City obtains its water supply. For
years, the Catskills watershed has provided New York City with water that is usable
without additional filtering. By the end of the 1980s, changing land use patterns,
urbanization, and agricultural practices in the Catskills degraded the quality of
groundwater and left New York City evaluating different alternatives for securing the
quality of its drinking water. Constructing and operating a filtration plant was estimated
to cost approximately $8–10 billion. Rather than making this expensive investment, New
York City decided to invest in the preservation of the Catskills rural environment that had
for so long provided the city with a high-quality water supply. The Catskills preservation
program cost the city about $1.5 billion, generating considerable cost savings relative to
constructing and operating a filtration plant. In this example, the cost savings from not
having to construct and operate a filtration plant can be used as a value of ecosystem
Author(s) Study Measurement method EstimatesWalker and Young (1986) Value soil erosion on (loss) agriculture revenue in the
Palouse regionProduction function $4 and 6 per acre
McClelland et al. (1992) Protection of groundwater program, US Contigent valuation $7-22Torell et al. (1990) Water in-storage on the high plains aquifer, US Production function $9.5-1.09 per acre-footLaughland et al. (1996) Value of a water supply in Milesburg, PA Averting expenditures $14 and $36 per householdHeberlein et al. (2005) Water quality in lakes of northern WI Contigent valuation $107-260 per householdAbdalla et al. (1992) Groundwater ecosystem in Perkasie, PA Averting expenditures $61,313-131,334Holmes (1988) Value of the impact of water turbidity due to soil
erosion on the water treatment, USReplacement cost $35-661 million per year
Huszar (1989) Value of wind erosion costs to households in NM Replacement cost $454 million per yearRibaudo (1989a,b) Water quality benefits in ten regions in US Averting expenditures $4.4 billion per year
26
services of water filtration by the Catskills (Chichilnisky and Heal 1998). Using a
replacement cost approach to the measurement of ecosystem services, however, requires
the following three conditions to hold: 1) the replacement service is equivalent in quality
and magnitude to the ecosystem service; 2) the replacement is the least-cost approach to
replacing the service; and 3) people are willing to pay the replacement cost to obtain the
services (Shabman and Batie 1987).
IV. Forests and Biodiversity in Latin America
Much of the work on biodiversity has been done either in a global context or, for studies
of specific species or outputs, in North America. This section focuses on the very
considerable biodiversity that is found largely in the tropical forests of Latin America.
Latin America biodiversity is tied closely to its vast expanses of relatively undisturbed
forests. However, this forest area is among the most threatened in the world. Brazil, for
example, which has the world’s largest area of tropical forests, is experiencing very rapid
rates and absolute levels of deforestation (Kauppi et al. 2006). Similarly, fairly high rates
of deforestation are being experienced in Venezuela, Argentina, and elsewhere in Latin
America.
Forest Losses
The FAO Global Forest Resource Assessment 2005 estimates total world forested area at
3.95 million ha. It gives a global deforestation estimate of 13 million ha per year on
average for 2000–2005. Although the FAO does not give deforestation figures at the
national level for all countries, it does note that Brazil leads the countries with a net
annual loss of -3,103,000 ha and Venezuela is tenth with net losses of -288,000 ha. South
America has the largest continental net loss of forests, estimated at -7.3 million ha per
year, but down from -8.9 million has per years in the period 1990–2000. Central America
also experienced substantial losses.
An important ecosystem function of forests is the holding of large volumes of carbon in
the tree cells, the dead wood and litter, and in the forest soils. South American forests

27
hold roughly 90 billion tons of carbon directly in the forest biomass (about 32 percent)
and another 70 billion tons (22 percent) in the dead wood, litter and forest soils (FAO
2006).
Latin America Biodiversity
Although Latin America constitutes only 16 percent of the land area of the planet, it is
home to 27 percent of the world’s mammal species, 42 percent of known reptile species,
43 percent of know bird species, 47 percent of known amphibians, and 34 percent of
know flowering plants (IUCN 1996, 1997).
Another measure of biodiversity and biodiversity challenges is that of biodiversity “hot
spots”; IUCN estimates of conservation “hot spots” are given in Figure 1. Latin America
biodiversity “hot spots” run geographically from northern Mexico along the Pacific coast
of Columbia to parts of Chile and include forested areas along the Atlantic coast of
Brazil. Although none of these areas are in the Amazon, parts of the Amazon often also
are considered hot spots. For example, high levels of unique biodiversity are found in the
foothills of the Andes, which have a combination of wet tropical climatic conditions and
large variations in elevation.
A second estimate of biodiversity hot spots is that of Conservation International.
Conservation International identifies seven regions in Latin America as biodiversity hot
spots (Figure 2). Again, these run geographically from northern Mexico to parts of Chile
and include forested areas along most of the Pacific coast, from Mexico to Chile, and
many of the forested regions along the Atlantic coastal regions of southern Brazil to parts
of Argentina.
Threats to Biodiversity in Latin America
The 2004 IUCN Red List contains 15,589 species threatened with extinction. Of these,
some 10,823 are found in South America and 3,946 in Brazil. Roughly 60 percent of
these are species that reside in forests. Mesoamerica accounts for 4,117 of the threatened
species, with about one-half forest species. Of these, Mexico accounts for 2,732

28
threatened species, more than 40 percent of which are forest species. While these lists
may not be mutually exclusive, it is clear that Latin America (South America and
Mesoamerica) account for a very large portion of the world’s total threatened species
(Table 6).
Table 6: Number of Species Threatened with Extinction in Latin America9
Habitat South
America
Brazil Mesoamerica Mexico Caribbean World
Total 10,823 3,946 4,117 2,732 2072 15,589
Forest 6,065 2,157 1,913 1,151 Source: IUCN Redlist 2004 (accessed February 6, 2007).
9 Note that there is a great deal of overlap in species across areas. While total species threatened globally is 15,589, the sum of the threatened species by major region is almost 50,000.

29
Figure 1. IUCN Biodiversity Hot Spots

30
Figure 2.
Conservation International’s Biodiversity Hotspots & High Biodiversity Wilderness Areas

31
V. Valuation of Benefits and Costs of Protection of Global Ecosystems and Biodiversity
As demonstrated above, although there are a very large number of valuations of
biodiversity and ecosystem services, most are quite specific to a region and an output.
Typically biodiversity has been addressed in a piecemeal and fragmented manner and
there are a number of attempts to value various aspects of biodiversity and other
nonmarket environmental services (Tables 4 and 5). However, it is difficult to generalize
these results more broadly. In this section, we look at the few attempts to examine the
benefits associated with forest ecosystems and the costs associated with protecting forests
for ecosystem outputs, including biodiversity and carbon sequestration functions and
services.
The conception and technical problems in estimating the benefits and costs of forest and
biodiversity are quite different. In many cases, the benefits are nonmarket final
consumption goods. The question of what these are worth to consumers is not revealed in
markets but must be estimated by a CV approach such as a hypothetical WTP. This
question becomes increasingly difficult to answer as the outputs being evaluated expand
from the value of a spotted owl (species), to the value of a specific forest or habitat, to the
value of the global forest system.
Costs, by contrast, typically are less difficult to quantify, as they usually involve the
expenditure of resources that are valued in the market. Thus, land set-asides for
ecosystem purposes have an opportunity cost that the market recognizes and is relatively
easy to estimate.
Not surprisingly, then, analysts often avoid trying to quantify both benefits and costs and
focus on the least-cost way to achieve a desired (perhaps politically determined)
environmental goal, such as the protection of the spotted owl. This reality is reflected in
this study, which finds many more estimates of the costs of preserving global ecosystems
that estimates of the benefits. Nevertheless, some estimates of both global benefits and
costs exist.

32
Global Ecosystem Services
There have been a limited number of broad ecosystem valuation attempts. Perhaps the
grandest effort is that of Costanza et al. (1996) to evaluate the entire aggregate of global
ecosystem services. They attempted to estimate the total value of global ecosystem
services by deriving and summing up value estimates from the existing literature for a
wide range of ecosystem services. The study, which estimates that the likely range of the
total value of global ecosystem services as $16 to $54 trillion annually, was widely
criticized, especially on the grounds that estimating the total value of global ecosystem
services is not meaningful because the global ecosystem is a necessity without which life
would not be sustained. This argument is summed up by Taylor (1998), who notes that
the Costanza et al. estimate of the total value of global ecosystem services is “a serious
underestimate of infinity.” Although the Costanza et al. study has been influential and
widely quoted, especially among scientists and environmentalists, it is considered by
most economists fundamentally flawed both conceptually and methodologically. For a
critique of the Costanza study see Toman (1998) or Bockstael et al. (2000).
Bioprospecting: Pharmaceutical Products
A major justification for preserving biodiversity has been its value as an input to
medicinal and pharmaceutical products. Wilson (1992) argued that conserving species
preserved an option value for the future since species might contain valuable compounds
that would yield valuable pharmaceuticals in the future. The concept developed that
there might be large economic returns from bioprospecting, that is, collecting various
wild plants (and perhaps animals) and developing commercially valuable products from
these or the constituents of these. Newman et al. (2003) analyze the origins of new drugs
approved by the regulatory agencies over the period 1981–2002 and find that the majority
of them have origins in nature.
Early studies estimated the value of conserving a species for pharmaceuticals use from
$44 (Aylward et al. 1993) to $23.7 million (Principe 1989) per untested species. Besides

33
the huge differences in estimates, the approach used─multiplying the probability of a
successful product with its average revenue─was criticized in that it estimates the
average value rather than the marginal value of an untested species. Because multiple
species may contain the same compound and in this sense be redundant, marginal values
are likely to be far less than average values. Simpson et al. (1996) developed a sequential
search mode that takes redundancy into account. They demonstrate that when there is a
large volume of biological material to search for valuable new products, the incremental
value of one species likely is not very high. This is because when the total number of
species is large and biological redundancy is common, different species may be close
substitutes as sources of the useful biological constituent.
Nevertheless, in the 1990s bioprospecting was viewed as a vehicle by which developing
countries could capture some of the rents that would accrue to their biodiversity. A
famous project in the 1990s had Merck Pharmaceutical providing $1 million dollars to
Costa Rico in return for 1,000 plants collected its forest. A Costa Rican organization was
created to inventory and collect plants for possible use in the development of new
pharmaceuticals (Sittenfeld and Gamez 1993). Although the Merck project has been
successful in raising monies for Costa Rican biodiversity inventorying and research, few,
if any, drugs have been developed from the plants collected and the model has not been
transferred readily to other countries.
Table 7: Value of Biodiversity for Pharmaceuticals
Unit Value of Benefits Authors and Source
Biodiversity for pharmaceuticals
$23.7 million per untested species
($537 billion for 250,000 species)
Principe (1989)
Biodiversity for pharmaceuticals
$44.00 per untested species
($11 million)
Aylward et al. (1993)
Biodiversity for pharmaceuticals
As high as $9,431 for some species, or $20.63 per hectare, but much lower for other species and lands.
Simpson et al. (1996)
Biodiversity for pharmaceuticals
Land opportunity cost as bio-habitat as high as $9177 per hectare.
Rausser and Small (2000)

34
The reason for the lack of commercial success was suggested by the work of Simpson et
al. (1996). They solved for the probability that generates that maximum species values
using evidence to assign reasonable parameter values for revenues and costs. They found
that the expected marginal value of a species may be as high as $9,431 in some locations.
However, when estimating the economic returns from bioprospecting per hectare of land,
Simpson et al. find that the returns are modest—from $0.20 per hectare in the California
Floristic Province to $20.63 in Western Ecuador—even under assumptions likely to
overstate the benefits and in regions that are known as global biodiversity hotspots and
rich in endemic species. For this reason, Simpson et al. note that the potential for new
product development does not provide a compelling economic argument for protecting
biodiversity hot spots, and bioprospecting alone likely will not provide incentives for
private landowners or companies to protect land for its pharmaceutical biodiversity
values.10
This result was challenged. Using a similar conceptual approach as Simpson et al.,
Rausser and Small (2000) argued that if bioprospectors use prior information on the
likelihood of product discovery, bioprospecting may in some cases result in considerable
economic returns per hectare of land. They estimate that the value of richest biodiversity
hotspots land in Western Ecuador may be as high as $9,177 per hectare (compared to the
estimate of $20.63 per hectare by Simpson et al.).
Costello and Ward (2006) resolved the conflict by showing that the difference between
the results of Simpson et al. and Rausser and Small relate mostly to different underlying
assumptions regarding the relevant real-world parameter values, such as the number of
relevant species, development costs, and to forth. They show that using similar
parameters, the alternative approaches by Simpson et al. and Rausser and Small give
10 Using the estimate of $122 per ha as the annual opportunity cost of the biodiversity hot spots in Latin America would cost about 7.93 billion.

35
similar results. For example, the Rauser and Small value of a hectare in Western Ecuador
of $9,177 when conducting an optimal ordered search drops to $8,840 for a random
search such as used by Simpson et al. Thus, the differences are not a result of the
different search methods but reflect the choice of different parameters. Furthermore, upon
investigation, Costello and Ward conclude that the underlying assumptions of Simpson et
al. comport substantially more closely with the estimated empirical values than those of
Rauser and Small. An implication is that the marginal value of an average species or
hectare of land for bioprospecting usually is too small to cover the opportunity costs.
Regardless of the initial enthusiasm about benefit-sharing agreements and their use for
biodiversity conservation, their success has been limited. One likely reason is that the
economic returns from bioprospecting by themselves do not generate sufficient incentives
to preserve biodiversity (Simpson et al. 1996; Polasky et al. 2005).11 More relevant for
this study is that although global, the effort focused on only one use of biodiversity: as an
input for pharmaceutical products. The results suggested that the benefits rarely exceeded
the opportunity costs of the lands for other uses.
Carbon Storage as an Ecosystem Service
A different approach to the evaluation of the benefits provided by the forest ecosystem
has emerged from concerns about atmospheric carbon dioxide and climate change. The
Intergovernmental Panel on Climate Change Third Assessment Report on Climate
Change noted that forests contain huge amounts of carbon and that controlling
deforestation and establishing new forests could have a significant effect on net carbon
emissions (Kauppi, Sedjo et al. 2001).
It is possible to estimate the value of a forest for sequestrating carbon. Recent market
transactions in the European Climate Exchange have placed the value of carbon for 11 Benefit-sharing agreement application has occurred in the United States in Yellowstone, the nation’s oldest national park. Diversa Corporation, a biotech company, entered into a benefit-sharing contract in 1997 whereby Diversa compensates Yellowstone $175,000 for bioprospecting rights. In addition, the company pays to Yellowstone between 0.5– 10 percent in royalties for products developed from biological material obtained from the park (Siikamati and Chow forthcoming).

36
atmospheric carbon reduction within a wide range, from $10 to $100 per ton of carbon.12
While volatile, at least a market price is available.
The total Latin America forest covers about 1 billion ha. The amount of carbon captured
in a forest varies considerably, depending on the species, age, and density of the stand.
Old primary, tropical forest may have 300 tons of carbon while young forests may have
100 tons.
An early effort to quantify the benefits and costs of using the forest ecosystem for carbon
reduction was that of Pearce (1996). In quantifying the benefits, Pearce examine the
relationship between land conversion in the tropics and the amount of carbon released.
He related the carbon stored in the tropical forests to an estimate of the cost of carbon,
which is an estimate of the damages associated with its net emission into the atmosphere,
to obtain an estimate of the value of tropical forests in preventing a greater build-up of
carbon in the atmosphere. Pearce used an average of about 100 tons of carbon per ha of
forest and a price of $20 per ton of carbon. These figures provided estimated values for
the services of ecosystems and forests as about $12 trillion and are presented in Table 8.
This number is in the range estimated by Constanza.
Although these studies focus on the costs of the containment of carbon in the forest, the
market approach for the cost of carbon provides some information on the benefits of
containment. If a market for carbon credits is created, as in the European Union, the
demand for carbon credits is determined by the severity of the constraints on emissions
imposed by governments. One can infer from these constraints the value that
governments place on containing carbon, which is an assessment of the benefits. Thus,
the price per ton of carbon sequestered provides an estimate of the marginal damages
believed to be forgone and an estimate of the market price of carbon times the quantity of
carbon held captive as a result is an estimate of the benefits of this effort. 12 The literature uses both carbon and carbon dioxide in its estimates of carbon storage and emissions. One ton of carbon dioxide is equal to 12/11 tons of carbon. The costs in this paper are for carbon and range between $10 and $100 per ton. This is equivalent to $2.73 and $27.30 per ton carbon dioxide.

37
Table 8: Estimates of the Value of Global Ecosystem and Biodiversity Benefits
Unit Value of Benefits Authors and Sources
Global Ecosystem Services
Globally $16 to $54 trillion annually. Prorated to $3.2 to $11 trillion annually for Latin America13
Constanza et al. (1997)
Carbon Capture Globally for 4 billion ha
$12 trillion net benefits Extending Pearce’s (1996) approach globally
Pharmaceutical Values $0.20 to $20.63 per ha Simpson et al. (1996)
Costs of Protecting Forests
As noted, a number of studies have looked at the costs of protecting very large areas or
all tropical forests. These include Sedjo (1991, 1992); James et al. (2001); Brumer
(2001), Greig-Gran (2006) and Kindermann (forthcoming) and are discussed below and
their prorated results applied to Latin America.
VI. Latin America Benefit and Cost Estimates
Benefits from Latin America Forests and Biodiversity
What are the benefits of Latin American forests and biodiversity? As noted, the rationale
for the importance of Latin American biodiversity can be found in existing assessments
of the challenges facing Latin America. The question of the benefits that Latin America
receives from forests and biodiversity, however, is complex. There often is confusion
regarding biodiversity and ecosystem services and environmental damages.
13 Latin America was assumed to be one-fifth of the world system roughly based on land area. It would be smaller based on GDP or population. Based on threatened species, it might be as large as one-third.

38
Environmental damages can be large without any direct threat to biodiversity,14 while
biodiversity can be threatened with minimal other environmental damages.
Table 9 provides estimates of the benefit values of forest ecosystems derived from the
sources discussed above. In the absence of any Latin American-specific information, the
value of forest ecosystems is simply a prorated value from the global estimates provided
in Table 8. Note that there are only three estimates of the value of benefits provided in the
two tables: those derived from Constanza et al. and Pearce and Simpson et al.
Table 9: Estimates of the Value of Latin American Biodiversity Benefits
Unit Value of Benefits Authors and Source
Latin American Ecosystem Services
Prorated from global estimate to $3.2 to $11 trillion annually for Latin America 15
Constanza et al. (1997)
Carbon Captured in the Latin American Forest
$3.4 trillion net benefits (carbon valued at $20/ton.)
Derived from Pearce 1996
Latin American Ecosystem
Pharmaceutical value $20.63 per ha in western Ecuador
Simpson et al. 1996
As noted, Constanza estimates the total value of all of the earth’s ecosystem services.
When prorated to Latin America, this gives an estimate of the value of ecosystem
services as $3.2–11.0 trillion annually. This study has been heavily criticized for various
reasons. A different approach to estimating the value of forest/biodiversity systems in
14 A recent article discussed environmental damages in “some of the world’s most biodiverse rain forest.” Although the article describes various environmental damages, it provides no discussion about threatened species or genetic resources nor makes any mention of threats to biodiversity as defined in this paper. It does, however, imply concerns over future ecosystem services. See http://www.csmonitor.com/2007/0507/p04s01-woam.html. 15 Latin America was assumed to be one-fifth of the world system roughly based on roughly on land area. It would be smaller based on GDP or population. Based on threatened species, it might be as large as one-third.

39
Latin America is to consider its value for carbon sequestration services, as done by
Pearce (1994). This approach is straightforward in that the estimate is made from
components that, at least in concept, are easily measurable─that is the value of carbon
sequestered in forest systems. We have estimates of the value of sequestered carbon as
transacted in markets. However, the prices are quite variable.
Pearce examined the various regions separately and thus provides some information
specific to Latin America. He concludes that “avoiding deforestation becomes a
legitimate and potentially important means of reducing global warming rates” (1994, 31).
Using Pearce’s average of 100 tons of carbon per ha for 1 billion ha of forest in Latin
America provides an estimate that about 100 billion tons of carbon would be sequestered
by the forest. This estimate is consistent with that of the FAO (2006) for Latin America
forest carbon. Using a value of $20 per ton for sequestered carbon provides the estimate
that the value of the ecosystem services provided by the Latin American is about $2
trillion. If the value of the 70 billion tons of carbon in the dead wood, litter, and soils
noted by the FAO is included (FAO 2006), the additional value is $1.4 trillion for a total
value of $3.4 trillion.
Costs of Protecting Latin America Forests and Biodiversity
This section draws from the earlier sections estimating global or near-global benefits and
costs of forest ecosystems and adapting these to Latin America. The approach is to
prorate the global estimates to Latin America using a one-fifth factor, since Latin
America has roughly one-fifth the earth’s forest area
An early study proposed a tradable systems approach for international forest protection
(Sedjo 1991, 1992), with a major objective being to maintain biodiversity by preserving
and protecting forest habitat. The study estimated the opportunity costs of closed-canopy
forest land in other uses, that is the costs of preventing forest conversion, and used this
as an estimate of the cost necessary to keep the land in natural forest. The total
opportunity cost of the world’s 2.655 billion ha of closed-canopy forest was estimated at

40
about $26.4 billion annually.16 For South America, the average annual opportunity costs
used were those estimated by Browder (1988), which are $183/ha in 2005 dollars. At this
land price, South and Central America’s entire 670 million ha of closed forest was
estimated to have a total opportunity cost of $12.3 billion annually (adjusted to 2005
dollars).17
It is sometimes suggested that most biodiversity could be preserved in a protected area of
about 10 percent of the total ecosystem. In this case, the forest area to be preserved would
be reduced to 67 million ha at an annual cost of around $1.23 billion. This estimate of
land area necessary to preserve most biodiversity comports closely with Conservation
International’s estimate of Latin American biodiversity hot spots, where Conservation
International18 identifies seven regions and about 65 million hectares in Latin America.
In another recent global study of the costs of protecting global biodiversity, James et al.
(2001) estimate that between ten and fifteen percent of global biodiversity could be
protected for about $18 to $27.5 billion per year. If one-fifth of the global total is
prorated to Latin America, the amount would be roughly $3.5 to 5.5 billion annually.
Pearce also estimates the cost of preventing the forests from being converted to other uses
in a similar manner to the studies above. He asks what level of compensation would be
necessary to bid the land away from alternative uses and keep it in its current forested
state. Using Schneider’s (1992) estimate of the value of the cleared land at about $300
per hectare, Pierce suggests that an average, one-time payment of $500 per ha could keep
the land in forest. This provides a cost estimate of about $500 billion to provide for the
permanent protection of the entire 1 billion ha of Latin America forests with their carbon
sequestration services. Indeed, if Pearce had applied his approach to estimate the value of
the entire global forest of 4 billion ha, Table 8 summaries this discussion of the costs and
16 With the use of a 10% real discount rate. 17 Browder’s estimate, while dated, is similar to the much more recent estimates land opportunity cost estimates for Central America of $127 per ha and South America of $147 (cited in Chatham House Workshop, April 16-17, 2007 http://www.chathamhouse.org.uk/pdf/research/sdp/160407workshop.pdf 18 http://www.biodiversityhotspots.org/xp/Hotspots/

41
presents four very broad estimates of the costs of maintaining forest ecosystems to
provide biodiversity and carbon sequestration services.
In another paper, Brumer et al. (2001) argued that 70 percent of global biodiversity
(about two percent of the earth’s terrestrial surface) could be protected at an additional
cost of $19 billion above current expenditures, or about $29 billion annually. Prorating
one-fifth to Latin America provides an estimate of about $5.8 billion annually to protect
70 percent of Latin America’s biodiversity. For comparison, Simpson (2004) estimates
current worldwide expenditures on biodiversity conservation at about $10 billion
annually.
A recent study by Grieg-Gran (2006) focuses on avoiding deforestation. The approach
uses financial incentives to compensate owners for lost market value. The approach
focused on eight countries that accounted for 6.2 million ha or 46 percent of global net
deforestation from 2000–2005. The Latin America countries included are Brazil and
Bolivia. The goal of this study was not to protect the entire forest or even a fixed
percentage of it. Rather, the study was designed to estimate the cost of preventing
deforestation by compensating owners for keeping the land, which would have been
deforested, in forests. The target was to offset the expected 6.2 million ha of deforestation
each year, which has been the rate of deforestation in recent years. The causes of
deforestation varied by region, with most deforestation in Brazil and Bolivia generated by
conversion to pasturelands, while in Indonesia much of the conversion is driven by land
conversion to palm oil production. The study estimates the compensation costs at roughly
$5 billion to permanently secure the 6.2 million ha in forest. Unlike most other studies,
the study explicitly included administrative and monitoring costs, which are estimated at
$4–$15/ha per year and, thus, an additional $25–$93 million. However, this payment
would persist indefinitely and increase as additional lands were protected from
deforestation.

42
In concept, the program would add an additional 6.2 million ha in protected forest in year
two and subsequent years. If the program continued for 10 years, the administrative and
monitoring costs would be running at between $250 million and almost $1 billion per
year. Also, since the concept involves monitoring and protection indefinitely, those costs
of $250 million to $1 billion would continue indefinitely even if the basic program of
adding new areas of forest were discontinued. However, the study notes that the actual
costs are likely to be higher than programmed because of leakage19 and administrative
expenses.
Kindermann et al. (forthcoming) use three economic models of global land use and
management to analyze the potential contribution and cost of carbon credits to provide
incentives for avoided deforestation activities reduce greenhouse gas emissions. These
models estimate the costs associated with a reduction of deforestation below the trend for
2030. The study finds that an average of about $3 per ton CO2, or about $0.4– $1.2
billion per year in 2030, would generate a 10 percent reduction in deforestation rates.
The Present Value (PV) of the total costs using a 10 percent discount rate is roughly $4–
$12 billion for the 10 percent reduction case. They estimate that a $20 per ton CO2 credit
would reduce CO2 deforestation emissions by 50 percent, or 1.5–3.4 Gt CO2/year by
2030. This program would require $1.72 to $2.80 billion per year through 2030 or a PV
at 10 percent of $17.2 to $28.0 billion for the 50 percent reduction case. However, the
information cannot be used for the Solutions paper since the study does not provide
sufficient information to calculate the full costs of the project nor does it report on
deforestation avoided in the transitional 30 years.
Finally, Simpson et al., while not estimating costs specifically, find biodiversity values
that are considerably below the opportunity costs of the land as found in numerous other
studies (e.g., Browder 1988; Schneider 1992)
19 Leakage refers to the shifting of deforestation within the country; that is, the situation where preventing deforestation in one location only deflects the deforestation to another forest.

43
These models are applied to the various tropical regions separately, including Latin
America. South and Central America have marginal costs similar to those for the rest of
the globe, although the volume of carbon captured by avoided deforestation is a relatively
large proportion: about three-eights of the total, depending upon the price.
Table 10: Estimates of the Costs of Protection for Latin America’s Biodiversity
Estimate (year) Percent Protected Cost Sedjo (1992) Chathamhouse (2007)
10 percent of closed forest (67 million ha) area, e.g., hot spots
$1.23 billion annually (rental)
James (2001)* 10–15 percent forest land $3.5-5.5 billion annually (rental)
Brumer (2001)* 2 percent terrestrial area. $5.8 billion annually Pearce (1996) 100 percent forest are Latin
America $500 billion one time, or $25 billion annually discounted at 5%.
Grieg-Gran (2006) 6.2 million ha/yr (1.5%) each year for indefinite period or an accumulation of about 1.5% of the global forest annually
$5 billion purchase payment and $25–$100 million each year for administration
Kindermann et al. (unpublished )
Reduce rate of deforestation 10% to 50%
Cost is PV $4.0– $12.0 billion for the period through 2030; for a 10% reduction case PV of costs $17.2–$28.0 billion for the period through 2030 for the 50% reduction case
Simpson et al. (1996)
100% Costs equal opportunity costs of the land at roughly $150–200/ha
* Prorated from global estimates assuming Latin America has one-fifth of the area and costs.
Note that the first three studies focus on the costs of establishing permanent forest
reserves adequate to protect core biodiversity. The Grieg-Gran (2006) study, by contrast,
estimates the cost of halting all deforestation in high-incidence countries with targeted
(purchased) compensation each year for several years and with continuing monitoring.
This study assumes that the remainder of the forest will provide its values without
compensation. The Kindermann et al. study focuses on the costs of undertaking
substantial investments gradually to reduce the rate of deforestation compared to the

44
trend. The Pearce study focuses on the value of sequestered carbon and asks how much
compensation would be require to all forest owners for not releasing the carbon through
deforestation. Simpson et al. do not estimate explicitly the costs of protection. Rather
they implicitly use the market land price as an estimate of the cost. Table 10 summarizes
these cost estimates for Latin American biodiversity.
VII. Proposed Solutions: Benefits and Costs
Benefits and Costs
Four benefit-cost calculations are reported in Table 11. The first two use Constanza’s
high-benefit estimate with the low- and high-cost estimates from the literature. Although
Constanza’s estimates are criticized, they are prominent in the literature. Also, they do
provide the high boundary for benefits. The third benefit-cost calculation is that
implicated in Pearce’s work, where the benefits are all derived from sequestered carbon
conservatively valued. Finally, the fourth benefit-cost calculation uses Pearce’s benefits
approach, calculating the carbon-sequestration values of the forest protected in the Grieg-
Gran study and matching it with the cost estimates of the Grieg-Gran study.
The solutions using the Constanza benefits tend to generate massive benefit-cost ratios,
especially since these are placed against fairly modest cost estimates. The Pearce study
has the advantage that both benefits and costs were addressed by the same researcher in a
consistent manner. The Pearce estimate of values is large but so are his costs. The benefit
– cost ratio of calculation four appears reasonable, suggesting that forests provide a
useful and relatively low-cost mechanism for addressing the damages associated with
carbon emissions.
The final estimate focuses on the carbon benefits of preventing deforestation─a timely
issue. The emissions avoided by avoiding deforestation are substantial, as are the
associated damages that are avoided. The benefit - cost ratio of 2.4 is favorable.

45
However, the research acknowledges that the costs of controlling leakage and monitoring
are substantial and continue indefinitely.
Table 11. Benefit-Cost Ratios for Saving Latin America Forest/Biodiversity
Constanza’s benefits (all ecosystem services) and Sedjo’s (forest land costs)
Benefit - cost = 32,000–110,000/1.2 = 2,666 to 9,166 (Sedjo/ Chathamhouse’s low-cost estimate)
Constanza’s benefits (all ecosystem services) and Brumer’s (forest costs)
Benefit - cost = 32,000–110,000/5.8 = 572 to 1,896. (Brumer’s high-cost estimate)
Pearce benefits (carbon storage) and costs (forest land values)
benefit – cost = $2 trillion/$0.5 trillion = 4.0 (Pearce’s cost and benefit estimates)
Carbon storage benefits derived from Pearce and Grieg-Gran avoided deforestation costs
benefit – cost = $12.4 billion/$5.2 billion = 2.4 (carbon benefits and Grieg-Gran costs)
Benefits per hectare (biodiversity for drugs) Simpson et al.
benefit – cost per ha = $20.63/$150 = 0.134 Costs per ha from selected land value estimates (Browder, Schneider)
The Results
These results indicate a range of benefit - cost ratios from 0.134 to 9,166 using cost and
benefit estimates from the literature. Benefit estimates are substantially more difficult to
undertake and were done by only three researchers: Constanza, Pearce, and Simpson et
al. Few find Constanza’s estimates creditable, both due to the nature of the methodology
and the advocacy nature of the estimates. By contrast, Pearce’s methodology is clear and
sensible. Respectable estimates of benefits are obtained by looking at carbon capture─a
service where market prices exist and where estimates of physical values are fairly
straightforward. Although he only estimated the value for one output, carbon storage
services, this value appears to be large and important. Simpson et al. also provided useful
estimates, also for only for one output ─biodiversity for pharmaceuticals use. This value,
while potentially large in the aggregate, is small compared to its cost, which is the
opportunity cost of the land.
On the cost side Grieg-Gran does the most comprehensive job of assessing costs. Details
are included that examine the alternative uses of the forestland and develop opportunity

46
costs accordingly. However, because the approach attempts to differentiate between lands
that will be compensated and those that will not be, substantial monitoring costs would be
necessary and leakage is likely to be great and difficult to control.
A weakness of these aggregate results is that in all of these cases but one the costs and
benefits were estimated independently by different groups of researchers. By far the most
creditable estimates are those of Pearce since one researcher estimated both the costs and
benefits in a consistent and creditable manner. However, combining Pearce’s benefits
approach with the cost estimates of Grieg-Gran provides both a sensible combination of
literature approaches and sensible results.
Proposed Solutions: Overview of Approach
The approach of this study is to examine the broad literature and several estimates of
benefits and costs from these various sources and determine which of the studies have a
scope and information that can be useful in the solutions analysis.
The benefit side typically is more difficult to measure and the estimates more suspect.
This is because benefits typically are not transacted in markets and, hence, difficult to
quantify. Approaches often use various CV techniques, typically survey approaches such
as WTP. These approaches and their application with specific examples are discussed in
some detail in this study. The benefit estimates of this approach remain somewhat
controversial. Where the benefit outputs can be transacted in markets, however, as in the
carbon-sequestration services of forests, the benefit estimates may be less controversial.
It should be noted that much of the existing literature deals with estimating the value of
specific species, such as Alaskan salmon or the northern spotted owl, found in specific
ecosystems or at specific locations. Typically, these studies are done on small and unique
areas. For species, the focus usually is on a single activity, such as hunting or bird
watching. For ecosystem outputs, the focus also usually is on one output, such as an
aspect of water for a limited region. Upon investigation, these studies have been
determined to be of limited usefulness for the current project of identifying solutions

47
because of their limited focus.
After reviewing the literature, this investigation moves to the identification of the few
larger studies that take a continental or global perspective. First, regarding the value of
biodiversity, only two studies were found that estimate the benefits value specifically of
species biodiversity at the continental or global level (Simpson et al. 1996 and Rausser
and Small 2000). These studies, which look at bioprospecting and estimate the value of
the benefits of biodiversity as an input into pharmaceutical product production, take a
global perspective. However, they are limited to examining only one output, that of the
value of biodiversity in the production of pharmaceuticals. Other values are not
addressed. The Simpson et al. study is used for some of the cost–benefit ratios.
Two other studies, Constanza et al. 1997 and Pearce 1994, estimate the values of the
benefits of ecosystems and are used in our analysis. Constanza develops an estimate of
the aggregate value of global ecosystem services. Pearce derives an estimate of the value
of the services of the forest in sequestering carbon. Although Pearce’s study does not
include all the outputs in its evaluation of benefits, it does demonstrate that the value of
ecosystem services is quite large. In fact, Pearce’s paper argues that the other values of
ecosystem services are fairly modest. In the solutions, we adapt his carbon-sequestration
estimate, although admittedly conservative due to the absence of other outputs, as a
component of our solutions analysis. These two estimates, those of Constanza and
Pearce, are utilized in our solutions-assessment process.
The cost-side estimates generally are less difficult to obtain and are viewed as more
reliable. The approach often involves estimates of the opportunity costs of maintaining
the land in habitat for environmental and ecosystem uses rather than converting the land
to development or agricultural uses. Markets tend to provide information on opportunity
costs of the land in the form of land market prices or land rents.
The costs are examined in seven cited studies. Three studies (Sedjo, James, and Brumer)
examine the costs associated with preserving existing ecosystems and forests globally

48
and provide information at the global or continental level. These studies are oriented to
estimating the costs of protecting the ecosystem, and they provide estimates of the
portion of the global ecosystem that needs to be protected, such as 10 percent of the
forests. Pearce’s study is the only one that provides estimates of benefits and costs. His
cost estimates are derived in a manner similar to Sedjo in that he estimates the
opportunity costs of the land by reference to average markets prices. However, since his
focus is on sequestration and not on simply protecting a representative sample of species
biodiversity, he incurred the costs of protecting the entire forest, not just some fraction of
it. Additionally, the studies of Grieg-Gran and Kindermann et al. provide estimates of the
costs of preventing deforestation in large areas of the world that currently are
experiencing large-scale deforestation. However, Kindermann’s estimates are incomplete
and not used in the Solutions analysis. In these, as with the aforementioned studies, costs
are derived using land prices as a measure of opportunity costs. Although none of these
studies provide estimates of the values of the benefits, their estimates of the costs are
viewed as sensible, and these estimates are used in our solutions-assessment process.
Finally, the Simpson et al. study provides estimates of the values of biodiversity for drug
production as well as the basis for estimating the costs.
Some Solutions
Four possible solutions are developed using the aforementioned set of three benefit
estimates and six cost estimates. The solutions use three of the benefit estimates and
relate these to an appropriate cost estimate. Four possible solutions are proposed using
several estimates of benefits and costs chosen selectively from these various sources.
Benefit - cost ratios for each solution are developed. A discussion of each is presented
and a preferred solution is chosen based on the benefit – cost ratio and other
considerations.
Solution One: Protecting Biodiversity for Its Value in Drugs
For solution one, the value of the land as a repository for biodiversity was estimated by
Simpson et al. The costs of protection are the opportunity costs of the land for other uses.
The stated benefit - cost ratio of 0.134 suggests that even the lands most rich in

49
biodiversity are unlikely to justify the repository status solely on the basis of the
probability that the biodiversity may someday be useful for drugs and medicines.
Table 12: Solution One: Benefit -Cost Ratio for Saving Latin America Forest/Biodiversity for the Biodiversity Values for Drugs Benefits per ha (biodiversity for drugs)
Simpson et al.
Benefit – cost ratio per ha = $20.63/$150 =
0.134
Costs per ha from selected land value
estimates (Browder, Schneider)
Solution Two: Protecting Forests to Prevent Carbon Emissions
Solution two combines Pearce’s estimates of benefits with the cost approach of Grieg-
Gran for restraining deforestation in regions with high recent rates of deforestation. This
approach has the advantage of using the strongest estimates of benefits and costs
available in the literature for large-scale projects of this type. The benefits side uses the
estimated values of the ecosystem for keeping forest carbon from being released into the
atmosphere─estimates that are based on the actual price experience in the European
Union carbon market. The cost approach is comprehensive with the objective to avoid
deforestation. The costs, as with most of the other studies, are based upon compensation
based on the opportunity costs of t keeping the land in forest. This cost approach also
included estimates of administration and monitoring costs, something that is absent from
all of the other cost estimates. A unique feature of this approach is that compensation is
not provided for all forestlands but only for those determined to be likely candidates for
deforestation. This reduces overall costs but is susceptible to leakage problems, which the
author acknowledges. The Benefit – Cost ratio of this solution is about 2.4.
For this estimate, the benefits are likely to be somewhat higher than listed because only
carbon-sequestration benefits were assessed; however, the carbon benefits may be
somewhat lower because complete success in avoiding all deforestation is unlikely.
However, the costs also are likely to be some higher because some additional

50
compensation may be required to prevent leakage. In addition, the likely administrative
and monitoring costs have only crudely entered the benefit – cost calculation.
Table 13: Solution Two: Benefit - Cost Ratio for Saving Latin America Forest/Biodiversity Through Payments for Avoided Deforestation Carbon benefits derived from Pearce
and Grieg-Gran costs
Benefit- Cost ratio = $12.4 billion/$5.2 billion =
2.4 (carbon benefits and Grieg-Gran costs)
Solution Three: Protecting Ecosystems for Ecosystem Services
Solution three justifies protecting forest and biodiversity on the basis of ecosystem
services provided. The benefits are drawn from those estimated by Constanza for the
globe. Although these have been highly criticized, they are the only ecosystem benefit
estimates available for very large, continental-size regions and are estimated at $11
trillion for Latin America. Note that this estimate has been criticized both for being too
high and for being to low (Toman 1999). However, the value of the ecosystem for carbon
storage is $3.4 trillion, so even without other values, Constanza’s estimate is within an
order of magnitude. Furthermore, if carbon prices escalate as expected, thereby raising
Pearce’s estimate, and other ecosystem service values are large, which seems reasonable,
Constanza’s estimate becomes even more within the range of being comparable. It may
be that Constanza is right for the wrong reason.
One reason why the costs tend to be low in the avoided deforestation at the marginal
solutions is that there are some lands in which the forests would be the highest value use
and thus no payments would be necessary. Thus the average opportunity cost per hectare
would be drawn down by lands submarginal for nonforest use.

51
Table 14: Solution Three: Benefit- Cost Ratio for Ecosystem Services in Latin America Constanza’s benefits and Sedjo’s costs Benefit- Cost ratio = 32,000–110,000/1.2 =
2,666 to 9,166 (Sedjo/ Chathamhouse’s low-
cost estimate)
Constanza’s benefits and Brumer’s
costs
Benefit- Cost ratio = 32,000–110,000/5.8 = 572
to 1,896 (Brumer’s high-cost estimate)
Solution Four: Protecting Forests for Carbon Values
Solution four is a different approach to estimating the value of forest/biodiversity systems
in Latin America: considering its value for carbon-sequestration services, as was done by
Pearce (1994). This approach is the most straightforward in that the estimate is made
from components that, at least in concept, are easily measurable and include the carbon
sequestered in forest systems and the value of sequestered carbon as transacted in
markets.
With the advent of concern about global warming and the role of carbon and carbon
dioxide in that warming, it is possible to estimate the value of a forest for sequestrating
carbon. Recent market transactions in the European Climate Exchange have placed the
value of carbon for atmospheric carbon reduction within a wide range: from $10 to $100
per ton of carbon.20 While volatile, at least a market price is available. The total Latin
America forest covers about 1 billion ha. The amount of carbon captured in a forest
varies considerably, depending on the species, age, and density of the stand. Old, primary
tropical forest may have 300 tons of carbon, while younger forests may have 100 tons.
Using Pearce’s average of 100 tons of carbon per ha for 1 billion ha of forest in Latin
America provide an estimate that about 100 billion tons of carbon would be sequestered
by the forest. This estimate is consistent with that of the FAO (2006) for Latin America
forest carbon. Using a value of $20 per ton for sequester carbon provides the estimate that
the value of the ecosystem services provided by the Latin American forest is about $2
20 This is equivalent to $2.73 and $27.30 per ton carbon dioxide

52
trillion. If the value of the 70 billion tons of carbon in the dead wood, litter, and soils of
the forest noted by the FAO (FAO 2006) are included, the additional value is $1.4
trillion, for a total value of $3.4 trillion. Estimated global values for the services of
ecosystems and forests are presented in Table 7.
Extending Pearce’s approach globally would result in global benefits valued at about $12
billion. This number is not vastly different than that of Constanza. Pearce also estimates
the costs of preventing the forests from being converted to other uses in a similar manner
to the above studies. He asks what level of compensation would be necessary to bid the
land away from alternative uses and keep it in its current forested state. Using
Schneider’s (1992) estimate of the value of the cleared land at about $300 per ha, Pierce
suggests that an average, one-time payment of $500 per ha could keep the land in forest.
This provides a cost estimate of about $500 billion to provide for the permanent
protection of the entire 1 billion ha of Latin America forests with their carbon
sequestration services. Indeed, if Pearce had applied his approach to estimate the value of
the entire global forest of 4 billion ha, Table 8 summaries this discussion of the costs and
presents four very broad estimates of the costs of maintaining forest ecosystems to
provide biodiversity and carbon-sequestration services.
Table 15: Solution Four: Benefit- Cost Ratio for Saving Latin America Forest/Biodiversity Through Payments for Carbon Sequestration
Pearce benefits and costs Benefit-Cost ratio = $2 trillion/$0.5 trillion =
4.0 (Pearce’s cost and benefit estimates)
Choice of Solution
Solution one, which addresses the protection of biodiversity for the purpose of
maintaining biodiversity values for drugs and medicines, does not give a favorable
Benefit- Cost ratio (only 0.134). A problem with this solution is that the benefits capture
only the value of biodiversity as inputs to drugs and ignores other values.

53
Solution three has the highest apparent Benefit-Cost ratio at the mid-hundreds to close to
10,000. However, as noted, the estimate of benefits has been highly criticized. Also,
while all of the cost estimates cover forests, none of them appear to cover completely the
full costs of maintaining the entire range of ecosystems. Instead, they are focused only on
forest systems.
Solutions two and four seen the most reasonable and provide sensible and acceptable
Benefit- Cost ratios. Solution two has a Benefit- Cost ratio of 2.4, while solution four has
a Benefit- Cost ratio of 4.0. These two solutions focus on the benefits from carbon
storage associated with avoiding deforestation. Solution two focuses on avoiding
deforestation at the margin, while solution four examines avoiding deforestation in the
entire system. Solution two is more realistic in that it includes monitoring costs and
recognizes that some benefits will be provided without costs to the project.
I maintain that solution two is the desired solution. That project has the advantage of
working on the margin, where deforestation is high. Forests that are not about to be
harvested need not receive compensation. Although in concept this is desirable, leakage
will be a problem. However, the benefits are sufficiently large that some slippage can
occur and the project still will be economically viable by the cost–benefit calculus.
In the context of Latin America, areas of high deforestation would be identifiable given
the high rates of deforestation in several Latin American countries and the compensation
package would be applied there The above discussion provides a range of general of
average cost estimates that might be needed to protect Latin America biodiversity. The
costs are generic and are unrelated to any particular approach to protection. Rather, the
costs reflect the market opportunity costs of the habitat to be protected and do not
account for the costs of administering such a program. Of course, if the biodiversity
values were private goods transacted in markets, a nonmarket administered program
would not be necessary. However, it is the externality aspect of biodiversity that makes
an essentially nonmarket–oriented approach necessary.

54
VIII. Conclusions
The empirical evidence on the costs and benefits of protecting forest ecosystems and
biodiversity is limited, particularly for large global or continental systems. Most of the
considerable research on biodiversity benefits has focused on the value of individual
species for a specific purpose or a confined ecosystem, often for only one of its multiple
outputs.
There is more evidence for the costs of protecting species and ecosystems than for the
benefits. However, the data on the costs of protecting individual species is very specific
and narrow in focus. The information on protection of individual ecosystems is slightly
more robust. However, most studies apply to the United States and deal with only one
aspect of ecosystem services. Even in the United States, there are a few studies that look
at forest ecosystems or biodiversity broadly and most of those focus on a signal aspect,
such as water or recreation.
Globally, there are a very few studies that look at the benefits of global or large regional
ecosystems or that look at the costs. Only two studies, Pearce and Simpson et al., have
looked at both benefits and costs. Additionally, although no studies have been directed
specifically at Latin America, several of the studies have looked at this issue from a
global perspective and have some regionally specific information or estimates.
This paper estimated forest or ecosystem service benefits using information from
Constanza et al. (1997), Pearce (1994), and Simpson et al. (1996). The range of costs
used was found in six studies: Sedjo (1992), James (2001), Brumer (2001), Pearce
(1994), Kindermann (forthcoming), and Grieg-Gram (2006). A preferred “solution” is
suggested based on an estimate of the value of avoided deforestation for carbon
sequestration derived from Pearce and a program to retard deforestation through
compensation for retaining forests. A cost component of this approach involved that of
monitoring the condition of the forest.

55
References
Aylward, B.A. 1993. A case study of pharmaceutical prospecting. In The Economic Value of Species Information and Its Role in Biodiversity Conservation: Case Studies of Costa Rica’s National Biodiversity Institute and Pharmaceutical Prospecting, edited by B.A. Alyward, J. Echeverria, L. Fendt, and E.B. Barbier. London: Environmental Economics Centre,
Abdalla, C.A., B.A. Roach, and D.J. Epp. 1992. Valuing environmental groundwater
changes using averting expenditures: An application to groundwater contamination. Land Economics 68:163–169.
Baillie, J.E.M., C. Hilton-Taylor, and S.N. Stuart (eds.). 2004. 2004 IUCN Red List of
Threatened Species. A Global Species Assessment. Gland, Switzerland and Cambridge, UK: IUCN.
Balmford, A., K. Gaston, S. Blyth, A. James and V. Kapos. 2003. Global variation in
terrestrial conservation costs, conservation benefits, and unmet conservation needs. Proceedings of the National Academy of Sciences 100: 1046–1050.
Bockstael, N., A.M. Freeman, R.J. Kopp, P.R. Portney and V.K. Smith. 2000. On
measuring economic values for nature. Environmental Science and Technology 34: 1384–1389.
Bell, K. P., D. Huppert, and R. L. Johnson. 2003. Willingness to pay for local Coho
Salmon enhancement in coastal communities. Marine Resource Economics 18: 15–31.
Boyle, K.J., and R.C. Bishop. 1987. Valuing wildlife in benefit-cost analyses: A case
study involving endangered species. Water Resources Research (23): 943–950. Brock W.A., and A. Xepapadeas. 2003. Valuing Biodiversity from an Economic
Perspective: A Unified Economic, Ecological, and Genetic Approach. The American Economic Review 93(5): 1597–1614.
Brooks, D. R., R.L. Mayden, and D.A. McLennan. 1992. Phylogeny and biodiversity:
Conserving our evolutionary legacy. Trends in Ecology & Evolution 7(2): 55–59. Brookshire, D., L. Eubanks, and A. Randall. 1983. Estimating option prices and existence
values for wildlife resources. Land Economics 59: 1–15. Brown, G. M., Jr., and J. F. Shogren. 1998 "The Economics of the Endangered Species
Act." Journal of Economic Perspectives 12(3): 3–20. Browder, John O. 1988. Public Policy and Deforestation in the Brazilian Amazon. In
Public Policies and the Misuse of Forest Resources, edited by R. Repetto and M. Gillis. New York: Cambridge University Press,

56
Brumer, Aaron, Richard E. Rice, and Gustavo da Fonseca. 2001. Beyond Fences:
Seeking Social Sustainability in Conservation. Gland, Switzerland: IUCN. Carson, R. T., and Hanemann, M. W. 2005. Contingent valuation. In Handbook of
Environmental Economics (vol. 2), edited by K.-G. Mäler and J. R. Vincent. Amsterdam: Elsevier,
Chichilnisky, G., and G. Heal. 1998. Economic returns from the biosphere. Nature 391:
629–630. Convention on Biodiversity. 2007. www.biodiv.org/2010-target/focal.shtml (accessed
February 2, 2007).
Costanza, Robert, Ralph d'Arge, Rudolf de Groot, Stephen Farber, Monica Grasso, Bruce Hannon, Karin Limburg, Shahid Naeem*, Robert V. O'Neill, Jose Paruelo, Robert G. Raskin, Paul Sutton & Marjan van den Belt. 1997. The Value of the World’s Ecosystem Services and Natural Capital. Nature 387: 253–260.
Costello, C., and M. Ward. 2006. Search, bioprospecting, and biodiversity conservation. Journal of Environmental Economics and Management Vol 52, Issue 3: 615-626.
Council on Environmental Quality. 1980. Global 2000 Report to the President (vol. 2). Washington, DC: Council on Environmental Quality.
Daily, G.C. (ed.). 1997. Nature’s Services: Societal Dependence on Natural Ecosystems.
Washington, DC: Island Press. Dalton, R. 2004. Bioprospects less than golden. Nature 249:598–600. Diamond, P.A., J. A. Hausman, G. L. Leonard, and M. A. Denning. 1993. Does
contingent valuation measure preferences? Experimental evidence. In Contingent valuation: a critical assessment, contributions to economic analysis, edited by J.A. Hausman. New York: North-Holland, XX–XX.
Gaston, K. G. 2000. Global patterns in biodiversity. Nature 405: 220–227. Giraud, K., B. Turcin, J. Loomis, and J. Cooper. 2002. Economic benefit of the protection
program for the Steller sea lion. Marine Policy 26: 451–458. Giraud, K., and B. Valcic. 2004. Willingness-to-pay estimates and geographic embedded
samples: case study of Alaskan Steller sea lion. Journal of International Wildlife Law and Policy 7: 57–72.
Global Crop Diversity Trust. 2007. Regional Strategies: Americas: 2007.
http://www.croptrust.org/main/regional.php?itemid=83(accessed March 2007

57
Grime, J. P. 1997. Biodiversity and ecosystem function: the debate deepens. Science
277:1260–1261. Hammond, P. 1995. The current magnitude of biodiversity. In Global Biodiversity
Assessment, edited by V.H. Heywood and R.T. Watson. Cambridge, U.K: Cambridge University Press, 113–138.
Hahnemann, W.M. 1994. Valuing the Environment Through Contingent Valuation.
Journal of Economics Perspectives 8(4) 19–43. Hanley, N., A. Konstantinos, D. Tinch, A. Davies, F. Watson, and E.B. Barbier. 2007.
What Drives Long-term Biodiversity Change. Discussion paper 07-23. Washington, DC: Resources for the Future.
Heal, G.M., E.B. Barbier, K.J. Boyle, A.P. Covich, S.P. Gloss, C.H. Hershner, J.P.
Hoehn, C.M. Pringle, S. Polasky, K. Segerson, and K. Shrader-Frechette. 2005. Valuing Ecosystem Services: Toward Better Environmental Decision Making. Washington, DC: The National Academies Press.
Heberlein, T.A., M.A. Wilson, R.C. Bishop, and N.C. Schaeffer. 2005. Rethinking the
scope test as a criterion for validity in contingent valuation. Journal of Environmental Economics and Management 50: 1–22.
Hoehn, J. P., and J. B. Loomis. 1993. Substitution effects in the valuation of multiple
environmental programs. Journal of Environmental Economics and Management 25: 56–75.
Holling, C.S., D.W. Shindler, B.W. Walker, and J. Roughgarden. 1995. Biodiversity in
the functioning of ecosystems: an ecological synthesis. Biodiversity Loss: Economic and Ecological Issues, edited by C. Perrings, K.-G. Mäler, C. Folke, C. S. Holing, and B.-O. Jansson. Cambridge: Cambridge University Press,
International Union for the Conservation of Nature (IUCN), U.N. Environmental
Program, and World Wildlife Fund.1991. World Conservation Strategy: Living Resource Conservation for Sustainable Development. Gland, Switzerland: IUCN.
IUCN. 2004. 2004 IUCN Red List of Threatened Species.
www.iucn.org/themes/ssc/red_list_2004/gsaEXECSUMM_en.HTM (accessed February 7, 2007).
James, Alexander N., Kevin J. Gaston, and Andrew Balmford. 2001. Can We Afford to
Conserve Biodiversity? BioScience 51: 43–52.

58
Kauppi, P.E., J.H. Assubel, J. Fang, A. Mather, R.A. Sedjo, and P.E. Waggoner. 2006. Returning Forests Analyzed with the Forest Identity. Proceedings of the National Academy of Science 103 (46): 17574–17579.
Kauppi, P., Sedjo, R., et al. 2001. Technological and economic potential of options to
enhance, maintain, and manage biological carbon reservoirs and geo-engineering. In Climate Change 2001: Mitigation, edited by B. Metz et al. New York: Cambridge University Press, 303–353.
Kealy, M.J., and R.W. Turner. 1993. A test of the equality of the close-ended and the
open-ended contingent valuation. American Journal of Agricultural Economics 75: 311–331.
Kennedy, T.A., S. Naeem, K.M. Howe, J.M.H. Knops, D. Tilman, and P. Reich. 2002.
Biodiversity as a barrier to ecological invasion. Nature 417: 636–638. Kindermann, G., M. Obersteiner, B. Sohngen, J.Sathaye, K. Andrasko, E.Rametsteiner,
B.Schlamadinger, S. Wunder, R. Beach.. “On the Economics of Avoiding Deforestation.” Unpublished paper.
Knops, J.M.H et al. Effects of plant species richness on invasion dynamics, disease
outbreaks, insect abundance and diversity. Ecological Letters 2: 286–294. Larson, D., and Siikamäki, J. 2006. Valuing Surface Water Quality in California: A
Mixed Panel Logit Model Using a 2½-Bounded CVM. Paper contributed to the 3rd World Congress of Environmental and Resource Economics, July 3–7, Kyoto, Japan.
Laughland, A.S., W.N. Musser, J.S. Shortle, and L.M. Musser. 1996. Construct validity
of averting cost measures of environmental benefits. Land Economics 72: 100–112.
Loomis, J.B., A. Gonzales-Caban, and R. Gregory. 1994. Do reminders of substitutes and
budget constraints influence contingent valuation estimates? Land Economics 70: 499–506.
Loomis, J.B., and D.S. White. 1996. Economic benefits of rare and endangered species:
summary and meta-analysis. Ecological Economics 18: 197–206.
MacArthur, R.H., and Wilson, E.O. 1967. The Theory of Island Biogeography. Princeton, NJ: Princeton University Press.
Mace, G.M., J.L. Gittleman, and A. Purvis. 2003. Preserving the Tree of Life. Science 300:1707–1709.
May, R.M. 1972. Will a large complex system be stable? Nature 238: 413–414.

59
May, R.M., J.H. Lawton, and N.E. Stork. 1995. Assessing extinction rates. In Extinction Rates, edited by J.H. Lawton and R.M. May. Oxford: Oxford University Press, 1–24.
McCann, K.S. 2000. The diversity-stability debate. Nature 405: 228–233.
McConnell, K.E., and Bockstael, N.E. 2005. Valuing the Environment as a Factor of Production. In Handbook of Environmental Economics (vol. 2), edited by K.-G. Mäler and J.R. Vincent. Amsterdam Elsevier,
McClelland, G.H., W.D. Schultze, J.K. Lazo, D.M. Waldman, J.K. Doyle, S.R. Elliot, and J.R. Irwin. 1992. Methods for measuring the non-use values: a contingent valuation study of the groundwater cleanup. Boulder, CO: Center for Economic Analysis, University of Colorado.
Millennium Ecosystem Assessment. 2005. Ecosystems and Human Well-being:
Synthesis. Washington, DC: Island Press. Mitchell, R.C. and R.T. Carson. 1984. Willingness to pay for national freshwater
improvements. Washington, DC: Resources for the Future. National Oceanic and Atmospheric Administration. 2005. Endangered and Threatened
Species; Designation of Critical Habitat for Seven Evolutionarily Significant Units of Pacific Salmon and Steelhead in California; Final Rule. Federal Register 70(170): 52488–52586.
NatureServe. 2003. Ecological Systems Database, version 1.02. Arlington, VA: NatureServe.
Nee, S., and May, R.M. 1997. Extinction and the Loss of Evolutionary History. Science 278: 692–694.
Newman, D.J., G.M. Cragg, and K.M. Snader. 2003. Natural Products as Sources of New Drugs Over the Period 1981–2002. Journal of Natural Products 66(7): 1022–1037.
Noss, R. F. 1990. Indicators for Monitoring Biodiversity: A Hierarchical Approach. Conservation Biology 4: 355–364.
Nunes, P. A. L. D., & van den Bergh, J. C. J. M. 2001. Economic valuation of biodiversity:. Sense or nonsense? Ecological Economics, 39: 203-222.
Phaneuf, D.J., and V.K. Smith. 2005. Recreation demand models. In Handbook of Environmental Economics (vol. 2), edited by K.-G. Mäler and J.R. Vincent. Amsterdam: Elsevier,
Pimentel, D., C. Wilson, C. McCullum, R. Huang, P. Dwen, J. Flack, Q. Tran, T. Saltman, and B. Cliff 1997. Economic and Environmental Benefits of Biodiversity. BioScience 47(11): 747–757.

60
Pimentel, D., L. Lach, R. Zuniga, and D. Morrison. 2000. Environmental and economic costs of nonindigenous species in the United States. BioScience 50(1): 53–67.
Polasky, S., C. Costello, and A. Solow. 2005. The Economics of Biodiversity. In Handbook of Environmental Economics (vol. 3), edited by K.-G. Mäler and J.R. Vincent. Amsterdam, Elsevier,
Polasky, S., E. Nelson, E. Lonsdorf, P. Fackler, and A. Starfield. 2005. Conserving species in a working landscape: land use with biological and economic objectives. Ecological Applications 15(4): 1387–1401.
Principe, P. 1989. The Economic Value of Biodiversity Among Medicinal Plants. Paris: OECD.
Rausser, G., and A. Small. 2000. Valuing research leads: bioprospecting and the conservation of genetic resources. Journal of Political Economy 108(1): 173–206.
Redwood III, John. 2002. World Bank Approaches to the Brazilian Amazon. LCR Sustainable Development working paper #13. Washington World Bank.
Ribaudo, M.O. 1989a. Water quality benefits from the conservation reserve program, agricultural economics report. Washington, DC: Economic Research Service.
Ribaudo, M.O. 1989b. Targeting the conservation reserve program to maximize water quality benefits. Land Economics 65: 320–332.
Sedjo, R.A. 1991. Toward a Worldwide System of Tradable Forest Protection and Management Obligations. Discussion paper ENR91-16. Washington, DC: Resources for the Future.
Sedjo, R.A. 1992a. Implications of a Tradable Obligations Approach to International
Forest Protection (revised February 10, 1992). Washington. Report, Resources for the Future.
Sedjo, Roger A. 1992b. Property Rights, Genetic Resources, and Biotechnological
Change. Journal of Law and Economics 35(1): Sedjo, Roger A. (n.d.). An Emerging Market for Forest Ecosystem Services in the U.S.
Management of Environmental Quality forthcoming.
Shabman, L., and S. Batie. 1978. The Economic Value of Natural Coastal Wetlands: A Critique. Coastal Zone Management Journal 4(3): 231–247.
Shannon C.E., and W. Weaver. 1949. The Mathematical Theory of Communication. Urbana, IL: The University of Illinois Press.
Siikamaki. J., and J. Chow. (n.d.). “Biodiversity”, in Perspectives in Sustainable Resources in America, R.Sedjo editor, forthcoming. Washington, DC: Resources for the Future.

61
Siikamäki, Juha, and David F. Layton. 2007. Potential Cost-Effectiveness of Incentive Payment Programs for the Protection of Non-Industrial Private Forests. Land Economics forthcoming.
Simon, J.L., and A. Wildawsky. 1984. On Species Loss, the Absence of Data, and Risks
to Humanity. In The Resourceful Earth. A Response to “Global 2000,” edited by J.L. Simon and H. Kahn. NY: Blackwell, 171 – 183.
Simpson, R. D. 2000. Economic perspectives on preservation of biodiversity. In Conserving Nature’s Diversity. Insights from biology, ethics, and economics, Edited by G.C. van Kooten, E.H. Bulte, and A.R.E. Sinclair. Aldershot, UK.: Ashgate, 88-105.
Simpson, R. David. 2004. Conserving Biodiversity through Markets: A Better Approach. PERC Special Issue 32, July.
Simpson, R.D., and R.A. Sedjo. 1996. Commercialization of Indigenous Genetic Resources. Contemporary Economic Policy 12(4): 34–44.
Simpson, R.D., R.A. Sedjo, and J. Reid. 1996. Valuing biodiversity for use in pharmaceutical research. Journal of Political Economy 104(1): 163–185.
Simpson E.H. 1949. Measurement of diversity. Nature 163: 688.
Smith, V.K. and W.H. Desvousges. 1986. Measuring Water Quality Benefits. Dordrecht, Netherlands: Kluwer Nijhoff Publishing.
Sittenfeld, Ana, and Rodrigo Gamez. 1993. Biodiversity Prospecting by INbio. In Biodiversity prospecting: Using Genetic Resources for Sustainable Development, edited by Walter V. Reid et al. Washington, DC: World Resource Institute.
Stevens, T., J. Echeverria, R. Glass, T. Hager, and T. More. 1991. Measuring the existence value of wildlife: what do CVM estimates really show? Land Economics 67: 390–400.
Southgate, Douglas. 1998. Tropical Forest Conservation: An Economic Assessment of the Alternatives for Latin America. Oxford: Oxford University Press.
Svalbard International Seed Vault. 2007, http://www.croptrust.org/main/articles.php (accessed February 2007).
Terborgh, John. 2002. Overcoming Impediments to Conservation. In Making Parks
Work: Strategies for Preserving Tropical Nature, edited by John Terborgh, Carel van Schaik, Lisa Davenport, and Madhu Rao. Washington, DC: Island Press, 243–249.
Thomas, C.D., A. Cameron, R.E. Green, et al. 2004. Extinction risk from climate change.
Nature 427: 145–148. Tilman, D. 1996. Biodiversity: Population versus ecosystem stability. Ecology
77(3):350–363.

62
Tilman, D. 2004. Niche tradeoffs, neutrality, and community structure: A stochastic theory of resource competition, invasion, and community assembly. Proceedings of the National Academy of Sciences 101:10854–10861.
Tilman, D., and J.A. Downing. 1994. Biodiversity and stability in grasslands. Nature 367:363–365.
Tilman, D., P. B. Reich, J. Knops, D. Wedin, T. Mielke, and C. Lehman. 2001. Diversity and productivity in a long-term grassland experiment. Science 294:843–845.
Toman, Michael. 1998. Why Not to Calculate the Value of the World’s Ecosystem Services and Natural Capital. Ecological Economics 25: 61–65.
Torell, L. A., J. D. Libbin, and M. D. Miller. 1990. The market value of water in the Ogalla Aquifer. Land Economics 66: 163-175.
U.S. Department of Agriculture Forest Service. 2004. National Report on Sustainable Forests–2003. Washington DC: United States Department of Agriculture, Forest Service.
U.S. Department of Energy. 2007. Natural and Accelerated Bioremedation Research, http://www.lbl.gov/NABIR/index.html (accessed March 2007) U.S. Fish and Wildlife Service. 2002. Candidate Conservation Agreements With Assurances For Non-Federal Property Owners. Washington, DC: Department of the Interior, U.S. Fish and Wildlife Service.
U.N. Environmental Program. 1995. Global Biodiversity Assessment UNEP.
U.N. Food and Agriculture Organization. 2006. Global Forest Resources Assessment 2005, FAO Forestry Paper 147. Rome. FAO.
Walker, D.J., and D.L. Young. 1986. The effect of technical progress erosion damage and economic incentives for soil conservation. Land Economics 62: 83–93.
Weitzman, M. 1992. On diversity. Quarterly Journal of Economics 107(2): 363–405.
Weitzman, M. 2000. Economic profit versus ecological entropy. Quarterly Journal of Economics 115(1): 237–263.
Wells, M., and K.E. Brandon. 1992. People and Parks: Linking Protected Area
Management With Local Communities. Washington, DC: The World Bank. Western, D., and R.M. Wright (eds). 1994. Natural Connections: Perspectives in
Community-based Conservation. Washington, DC: Island Press. Wilcove, D., D. Rothstein, J. Dubow, A. Phillips and E. Losos. 1998. Quantifying threats
to imperiled species in the United States. BioScience 48: 607–615. Wilson, C., and C. Graham. 1983. Exotic Plant Pests and North American Agriculture.:
Academic Press. Wilson, E.O. (ed.). 1988. BioDiversity. Washington, DC: National Academy Press.

63
Wilson, E.O. 1992. The Diversity of Life. New York: W.W. Norton & Co. World Conservation Monitoring Centre. 1992. Global Biodiversity: Status of the Earth’s
Living Resources. London: Chapman & Hall. World Resources Institute, United Nations Development Programme, U.N. Environment
Program, and the World Bank. 1998. World Resources 1998-99. New York: Oxford University Press.
Wu, J., and W.G. Boggess. 1999. The optimal allocation of conservation funds. Journal
of Environmental Economics and Management 38: 320–321.