Operations Management in the Travel Industry - CABI Bookshop
MPRAMunich Personal RePEc Archive
SPACs with focus on China
Yochanan Shachmurove and Milos Vulanovic
City College, The Graduate Center and The City University of NewYork, City University of Hong Kong
9. February 2014
Online at http://mpra.ub.uni-muenchen.de/53550/MPRA Paper No. 53550, posted 10. February 2014 15:07 UTC
SPACs with focus on China
Yochanan Shachmurove
City College, The Graduate Center and The City University of New York
Milos Vulanovic1 City University of Hong Kong
February 8th, 2014
Abstract
In this study, we examine characteristics of Specified Purpose Acquisition Companies (SPACs) used as a financing tool for companies from China in period 2004-2011. We offer the evidence that, similarly to evidence from studies on reverse mergers focusing on China, SPACs that focus on China are not different in their characteristics from other SPACs. We test for the performance of the SPACs focused on China and show that their performance is not inferior to the performance of other SPACs. On the contrary, an investment in the equally weighted portfolio of SPACs with focus on China provides higher absolute return than an investment in the equally weighted portfolio of other SPACs. This evidence establishes that, on average, SPACs focused on China are as equally a valid investment choice as any other SPAC.
Keywords: SPAC, Specified Purpose Acquisition Companies, China, M&A, Blank Checks
JEL Codes: G12, G14, G24, G30, G32, G34
1 Corresponding author Email: [email protected] We are grateful for comments and research assistance to Romulo Armas Monje by City College of the City University of New York
1
SPACs with focus on China
1. Introduction
“Origin is formed by special purpose acquisition
company, not RTO (reverse takeover)” Irving Kau, CFO of
Origin Agritech, June 10th, 2011, in response to the alert of
the Security and Exchange Commission to investors on
June 8th 20112
This paper studies a subset of Specified Purpose Acquisition Companies (SPACs) that
focused their merger activities on China. First, examining how SPACs, new class of financial
assets and advanced form of reverse merger companies perform and enable private companies
from China to access the US financial markets is interesting endeavor. Second, the continuous
delisting of Chinese companies that entered the U.S. capital market through reverse mergers
during 2011 and ruling of the Security and Exchange Commission (SEC)3 on the imposition of
stricter listing requirements for these companies creates additional reasons to explore the
behavior of SPACs with merging focus on private companies from China. Finally, it is also
worthwhile to distinguish between practices and institutional structure of standard reverse
merger companies and SPACs.
2 http://www.sec.gov/investor/alerts/reversemergers.pdf 3 In November 2011 , the SEC issued , the following release notes http://www.sec.gov/rules/sro/nasdaq/2011/34-65708.pdf http://www.sec.gov/rules/sro/nyse/2011/34-65709.pdf http://www.sec.gov/rules/sro/nyseamex/2011/34-65710.pdf
2
Documenting the characteristics of this new financial asset is important especially since
existing evidence questions that SPACs are successful alternative methods of obtaining listings
in the US capital markets.
This study shows the evidence that SPACs with focus on China have the same
characteristics as the rest of the SPACs entering the U.S. capital markets. In addition, trading
securities of SPACs focused on China do not exhibit underperformance over the observation
period compared to the returns of SPACs' securities for the rest of the sample. This evidence
establishes that, on average, SPACs focused on China are as equally a valid investment choice as
any other SPAC.
The SEC distinguishes “shell companies” used in reverse merger transactions and
governed by Rule 405 and Rule 12b-2 and “blank checks” 4 of which SPACs are a subgroup by
SEC classification. 5 However, investors have hard time distinguishing reverse mergers and
SPACs. For example, the executive of Origin Agritech used the media to emphasize that his
company is a SPAC, not a reverse merger to avoid the pressure on the Origin Agritech price
caused by the SEC’s announcements on improper behavior of Chinese reverse mergers.
Consequently, the CFO of Origin Agritech announced that the company would buy back shares
in the market to fend the impact of the SEC announcement and relieve sellers’ pressure.
SPACs, in essence, mimic Rule 419 of the Securities Act of 1933. However, because
SPACs issue shares at the price higher than $5 in the IPO, they are not required to comply with
the rules that govern other “blank checks” and penny stock companies.
4 http://www.sec.gov/answers/blankcheck.htm A blank check company is a development stage company that has no specific business plan or purpose or has indicated its business plan is to engage in a merger or acquisition with an unidentified company or companies, other entity, or person. These companies typically involve speculative investments and often fall within the SEC’s definition of "penny stocks" or are considered "microcap stocks." 5 http://www.gpo.gov/fdsys/pkg/FR-2005-07-21/pdf/05-14311.pdf
3
SPACs are types of blank check companies.6 According to the SEC, “A SPAC is created
specifically to pool funds in order to finance a merger or acquisition opportunity within a set
timeframe. The opportunity usually has yet to be identified.”7 To make a SPAC viable asset for
investors, SPAC sponsors make them subject to additional requirements for the protection of
investors other than ones imposed by the SEC. The requirements include depositing most of the
raised funds in an escrow account until the acquisition is agreed to and requiring shareholder
approval of any identified acquisition.
SPACs, in the current form, entered financial markets in August 2003 when Millstream
Acquisition conducted the Initial Public Offering (IPO) and raised approximately $ 24 million to
be used with the solely purpose to acquire another company within the defined time. Millstream
focused on merging and acquiring companies in the healthcare sector. The second SPAC to enter
the US capital markets was CEA Acquisition in February 2004. Chardan China is the third SPAC
to enter the US financial market and conducted its IPO on March 12, 2004. It became the first
SPAC interested in merging with companies in China.8 By 2011, 184 SPACs entered the U.S.
capital markets, 41 of them focused on China.
This paper examines SPACs formed with the purpose of acquiring and merging with
companies in China. This analysis will help to answer the following questions: are they different
6 SPACs can operate as blank check companies, which the SEC defines as companies that either have no specific business plan or purpose, or have indicated that their business plan is to engage in a merger or acquisition with an unidentified company or companies, and are issuing "penny stock" as defined in Exchange Act Rule 3a51-1. If a SPAC meets the definition of a blank check company, it would be required to comply with Rule 419 under the Securities Act of 1933, which requires investors' funds to be held in escrow, filing of a post-effective amendment upon execution of an acquisition agreement, and the return of the escrowed funds if an acquisition has not occurred within 18 months of the effective date of the initial registration statement. Most SPACs, however, are not required to comply with Rule 419 because they are structured so that they can rely on an exception from the definition of "penny stock" or they meet other exceptions for listed companies 7 http://www.sec.gov/answers/blankcheck.htm 8 The description of intentions in prospectuses form filed on behalf of Chardan China to the SEC states “We are a blank check company organized under the laws of the State of Delaware on December 5, 2003. We were formed to effect a merger, capital stock exchange, asset acquisition or other similar business combination with an operating business that has its primary operating facilities located in China. To date, our efforts have been limited to organizational activities”.
4

companies than other SPACs focusing their mergers elsewhere?; what are the main features of
SPACs that focus on China?; what is the performance of China focused SPACs compared to
others.
The paper is structured as follows: Part two provides an overview of the current literature
on SPACs and reverse mergers that focus on China. In part three, we explain the data collection
process. In section four, we explain in detail the characteristics of SPACs across the sample and
conduct a comparison between SPACs that focus their operations on China and the remaining
SPACs from 2003 to 2012. Part five documents the performance characteristics of SPACs.
Finally, part six provides the conclusion.
2. Review of Literature
Two related streams of literature are important for our study. The first stream includes
recent studies on reverse mergers with a focus on China triggered by SEC actions during 2011.
The second stream includes literature on SPACs.
To answer if Chinese reverse mergers are institutionally and performance-wise different
from other reverse mergers Jindra et al. (2012) analyzes the characteristics of Chinese focused
reverse mergers. He compares those characteristics to characteristics of Chinese firms that
attained U.S. exchange listing through traditional IPO. They find that Chinese reverse mergers
are significantly smaller, more levered, with lower analysts and institutional following. Chinese
reverse mergers face higher lawsuit probability than traditional IPO’s of Chinese companies in
the U.S. markets.
Darrough (2012) evaluates how recent reports about fraud on Chinese reverse mergers
influences Chinese companies that previously entered US capital markets as well as Chinese
companies that entered the U.S. capital markets through standard IPO. They report that not only
5
the value of suspicious Chinese reverse mergers decreases, but also the value of non-fraudulent
Chinese reverse merger companies. The degree of impact depends on the quality and reputation
of the auditor and its location. They find that negative news reporting does not affect the value of
non-Chinese reverse mergers.
Lee (2013) examines performance and characteristics of reverse merger companies that
went public between 2001 and 2010, with a special focus on reverse mergers that involved
companies from China. According to their findings, reverse mergers focused on China are not
inferior to the rest of categories of reverse mergers. Chinese reverse mergers are more mature
and outperform the rest of reverse merger companies over the observation period. Lee (2013)
concluded that the presence of Chinese reverse mergers does not diminish the quality of capital
markets in the US and that some negative publicity emerges from activities of the short sellers to
bash these companies.
Chen (2012) studies the quality of financial reporting of Chinese reverse mergers and
finds that their reporting quality is lower than any other benchmarked set of companies.
Research on SPACs up-to-date focuses on few dimensions. Literature explained
institutional characteristics of SPACs and their changes through time, performance of their
securities at different points of their corporate life, mergers characteristics, and post-merger
performance.
Jog and Sun (2007), Boyer and Baigent (2008) discuss the institutional characteristics of
SPACs. These studies were the first papers on finance literature that explored SPACs.9 Both
papers explain the structure of SPAC deals and outline the potential reasons why investors are
subscribing to these companies. For the available sample, Jog and Sun (2007) report that SPACs
9 Papers in law literature discuss SPACs prior to finance literature such as : Davidoff (2007) Hale (2007), Heyman (2007), Reimer (2007), Sjostrom (2007).
6
investors exhibit negative 3% return on initial investments while SPACs founders exhibit up to
1900% return in the case they were able to execute the merger successfully. Their conclusion is
that investors in essence write a blank check to SPAC management.
The Boyer and Baigent (2008) study looks beyond simple returns as a motivation of
interest of investors in SPACs. They offer at least two good reasons why SPACs are attractive
investment vehicles. First, due to their reverse merger structure, SPACs enable target companies
to enter U.S. public financial markets and receive complementary cash raised at the IPO. Second,
investing in SPACs enables small investors an entrance into private equity.
Lewellen (2009) studies performance of SPAC’s shares at different stages of their
corporate life. He provides evidence that investors in SPACs that announced mergers exhibit
positive 2% return. The paper also reports that SPAC’s post-merger performance is value
destroying to investors.
Thompson (2010) expands on previous studies adding information on SPAC founders
which include their background, underwriting characteristics, and performance of SPACs around
different announcements and over time. The paper concludes that, overall, SPACs’ investors
attain positive returns, and that some SPAC deals are approved despite the fact that they are
value destroying for common shareholders. Jenkinson and Sousa (2011) similarly conclude that
half of the mergers with SPAC are value destroying.
Lakicevic and Vulanovic (2013), arguing that documenting performance of SPAC shares,
around the important announcements and through time, does not provide complete picture study
performance of all SPACs issuing securities: shares, warrants and units. They report that
underperformance of SPAC shares reported in previous studies around important announcements
7

is compensated by the increase in price of warrants and that in overall SPAC investors who
purchase units at the IPO do not exhibit negative returns at least until the merger event.
Recently, Cumming et al. (2012) and Lakicevic et al. (2013) examine underlying market
or SPAC characteristics that influence the success of the merger for SPACs. Cumming et al.
(2012) finds that one of the most decisive factors of the merger success is trading patterns of
institutional investors in SPACs prior to the merger, while Lakicevic et al. (2013) points towards
the proper selection of underwriter, geographical concerns, and the speed at which SPAC
managers are able to announce the finding of target.
Our paper extends the literature in various ways. First, we offer evidence that similarly to
evidence from studies on reverse mergers focusing on China, SPACs that focus on China are no
different in their characteristics from other SPACs. We test for the performance of SPACs
focused on China and show that their performance is not inferior to the performance of the other
SPACs. On the contrary, an investment in the equally weighted portfolio of SPACs with focus
on China provides higher absolute returns than an investment in the equally weighted portfolio of
remaining SPACs.
3. Data
The data covers the period from August 2003 to January 2012 and includes every SPAC
that conducted an IPO within that time. We compile the data in the following manner. All
institutional characteristics of SPACs emerge from The Electronic Data Gathering, Analysis and
Retrieval (EDGAR) database maintained by The Security and Exchange Commission (SEC). We
collect the latest pre-IPO prospectuses (424 Forms) for all SPACs in the sample. From these
forms, we extract the relevant information on the deal structure, underwriting characteristics and
managerial characteristics. We are able to obtain all relevant pre-IPO information for every
8
SPAC in the sample. We also look into EDGAR 8-K forms filed after the IPO in order to extract
the information after the IPO date on the total gross proceeds considering the overallotment
option given to underwriters.
Factiva database is used to locate relevant company announcements such as the letter of
intent to merge and final merger date. The dates obtained from news sources compiled by
Factiva are cross checked with the information from the EDGAR database obtained either from
8-K forms or 10-K forms where SPACs report prior developments. If discrepancy in reporting on
the date exists, we keep the information from EDGAR.
To collect data on merger characteristics, we first check 424 prospectuses filed by the SEC
prior to the merger and extract information on deal size and structure. We update that
information by checking Forms DEF 14A filed on behalf of SPACs with the SEC prior to
shareholders meetings where they vote on the proposed deal. Finally, we check post-merger
filings of 8K Forms for the new company where they report deal information. In parallel, we use
Thompson One database on mergers and acquisitions to extract merger information. If
discrepancy between the reported information on merger size exists, we look into additional
information in Factiva. The Renaissance Capital web-site provides data on the IPO activity.10
We collect daily pricing data on all three types of the SPAC securities for the two weeks in the
middle of October 2011. When available, we collect pricing data from The Center for Research
in Security Prices (CRSP). In the case that CRSP does not record prices, we look into
Bloomberg. Warrant data is primarily coming from Bloomberg. We cross check all collected
prices with the data reported by investment banks and one of the major SPAC underwriters
Joseph Morgan in their daily SPAC updates.11
10 http://www.renaissancecapital.com/ipohome/press/ipopricings.aspx 11 http://mjta.com/i/SPAC_Weekly.pdf
9
4. Summary Statistics and SPAC Characteristics at the IPO
This section presents various statistics on SPACs. That enables us to document the
dynamics of the market and institutional characteristics of modern SPACs overall and across our
subsamples.
Table 1 reports statistics on the state of the SPAC market in the period 2003 – 2012 and
compares it to the overall IPO market in the USA. Two characteristics emerge, IPO volume and
IPO size. In addition, table 1 reports the relative number of SPACs that focused their business on
China in respect to the overall SPAC market. Table 1 shows that activity of SPACs was
increasing year by year in period 2003-2008, with one SPAC going public in 2003 and 66 in
2008. It also shows that the total amount of money raised by SPACs increased significantly over
the same period and peaked at $ 12.093 billion in 2008. Comparing the activity in the SPAC IPO
market with the activity in the overall market, Table 1 reports that SPACs were important in the
issuance market from 2005 to 2008 and had significant representation in the market, with the
peak in 2008. In 2008, SPACs represented 35 percent of the total US IPO market deal wise and
19.9 percent size wise and at the beginning of the year NASDAQ exchange asked for permission
to list SPACs and be a part of the market,12 joining AMEX exchange.
4.1 Overall SPAC characteristics
In this section, we document institutional characteristics for all SPACs that entered US
capital markets in 2003-2011. Panel A in Table 2 reports overall characteristic of SPACs at the
IPO date. The panel explains the deal structure of the SPAC, underwriting characteristics and
managerial characteristics. We have complete information for all 184 SPACs in the sample.
12 http://ir.nasdaq.com/releasedetail.cfm?releaseid=295473
10
The prospectuses filed by SPACs with the SEC are governing their behavior prior to the
IPO. The prospectuses include all relevant information that governs the IPO process. In addition,
the prospectuses explain how the SPAC managers and underwriters comply with the SEC rules
governing the blank check market. In these prospectuses, SPAC founders explain shareholders’
rights during the merger process and define the timeframe for the merger’s execution.
SPACs access the US capital markets by issuing units. Units are composite security
consisting of a combination of shares and warrants and used mostly in risky issuance deals.13
Panel A, Table 2 reports that an overall SPAC issues 14.9 million of units at the IPO date and
prices them at $8.08. An average SPAC has gross proceeds of $127.83 million, with the range of
gross proceeds between $9.06 million to $1,035 million. Panel B in Table 2 reports that SPACs
size was monotonically increasing from the beginning of 2004 to 2008; where in 2008 the
average SPAC raised $226.03 million.
On average, 97% of gross proceeds are deposited in escrow accounts14 with credible
financial institutions for two reasons: to comply with SEC regulations regarding blank check
issuance and to ensure that investors’ money goes to future acquisition financing. This prevents
the misuse of investors’ money by shell companies conducting IPO and reverse mergers. In
addition, new SPAC investors experience significant share dilution by investing in SPACs. As
reported in previous studies15 SPAC managers on average commit $25000 to purchase complete
equity of SPACs’ prior to the IPO and retain 20% of the equity at the IPO. New investors
13 Jain (1994), Chemmanur and Fulghieri (1997). 14 Excerpts from Chardan China 424B3 form explaining the use of the funds in escrow accounts “$32,378,000, or $37,418,000 if the underwriters' over-allotment option is exercised in full, of net proceeds will be placed in a trust account at JPMorgan Chase NY Bank maintained by Continental Stock Transfer & Trust Company, New York, New York, as trustee. The proceeds will not be released from the trust account until the earlier of the completion of a business combination or our liquidation. The proceeds held in the trust account may be used as consideration to pay the sellers of a target business with which we complete a business combination. Excess working capital will be sufficient to cover miscellaneous expenses based upon our extensive experience of doing business in Asia”. 15 Thompson (2011), Lakicevic and Vulanovic (2013).
11
provide all the cash for SPACs but hold approximately 80% of the equity. On average, new
investors experience 34.13% dilution across the board.
Panel B reports the dynamics of the percentage of gross proceeds that are deposited in the
escrow accounts. SPACs in the period of 2008-2001 deposit at least 100% of gross proceeds in
the trust account, and in the last year even more than 100%. In the first few years of existence,
only 85% and 87% of the funds went to trust accounts. It is the case that investors in earlier deals
held more warrants, which compensated the share dilution.
On average, SPAC units are a combination of 1 common share and 1.3 warrants. The
range of warrants in unit is between 0.5 and 2. SPACs prior to 2006 usually had 2 warrants in
units. The average exercise price of these warrants is $6.30 while the average unit issuance price
is $8.08. Therefore, the majority of these warrants are in money. In Panel B the number of
warrants decreased monotonically from 2003 to 2011. The strategy of SPAC managers and
underwriters to decrease the number of warrants in the unit through time can be explained in
three ways.
First, the decrease in number of warrants diminishes the power of some hedge fund
investors whose strategy involves playing the “yield game”16 and generating short-term profits
instead of focusing on the success of the merger and long-term outcomes.
Second, the decrease of number of warrants in a unit minimize warrant overhang as a
potential issue even if the merger is approved and when new company often has to issue
undervalued shares when warrant holders exercise them. For example, China Gerui Advanced
16 Yield game is a strategy of hedge funds to sell in the money warrants soon after the IPO of SPAC, and then at the shareholders meeting vote against the merger and ask for a redemption of money from the escrow accounts at pro-rata basis. Given threshold approval requirements this behavior of hedge funds was harming pro-merger investors as well as the SPAC founders and underwriters. As response to yield game, the SPACs decreased the number of warrants through time or increased the exercise price. Vulanovic (2010) explains the yield game and returns to leveraged hedge funds playing that strategy. Cumming et.al (2013) explains how this behavior impacts merger outcomes of SPACs
12
Materials Group Limited, a high value-added steel processing company, went public through a
SPAC China Opportunity Acquisition Corp in March 2009. About 41 million of shares had also
16 million in the money warrants with a maturity date in March 2011.17
An additional support for the warrant overhang theory is the behavior of the exercise price
of the warrants. While the average exercise price for the warrants issued is $6.30, across the
sample through time, the exercise price is increasing in both absolute and relative value in terms
of the unit issuance price. The SPACs in the first few years were selling in the money warrants
within the unit, while in the later years the warrants are always outside of the money.
Finally, the SPAC managers and underwriters decreased the number of warrants in a unit
because post 2005 investors’ interest measured by the number of IPO’s increased significantly.
SPAC founders are the most important stakeholders. They bring their expertise and the
ability to increase their wealth and the well-being of investors. Berger (2008) distinguish four
categories of SPAC founders: accomplished operating executives who want to execute SPAC
transaction in their industry, unfunded financial sponsors with the vast network of contacts,
alternative asset managers and corporations that want to capitalize on the deal flow outside their
core business.18
For 48 SPACs in the sample, or 26% of total SPAC deals, the founders had previous
experience in promoting SPACs. At least one of the SPAC founders in the team, for every
company in the sample, has previous experience in mergers and acquisitions. On average, there
are 5.91 founders per SPAC, and they are 50.69 years old at the time of filling prospectuses. For
the period of 2003-2007, there is a pattern of increase in the number of founders of SPACs from
17 http://www.sec.gov/Archives/edgar/data/1449801/000114420409057739/v165478_424b1.htm 18 S-1 Forms and 424B prospectuses reveal the names of founders and in the first wave of SPACs some well-known are former Apple executives Steve Wozniak, Gilbert Amelio and Ellen Hancock, former undersecretary for federal Department of Homeland Security Asa Hutchinson , CEO of Apollo Investment Corp. Michael Gross, etc.
13
4 in 2003 to 6.52 in 2007. This may add to the argument that SPACs were becoming more
complex through time and they needed more resources to execute mergers.
In a typical SPAC founders purchase all the units at approximately $0.047 on average or
for a $25000 in total. Later, they sell 80% of the units through the IPO, at the average price of
$8.08.
In the first few years of modern SPACs, investors were willing to accept the fact that
founders contribute only the minimum amount of money to the company, in addition to their
expertise. Later, investors asked for more “skin in the game” on behalf of founders. Since 2006,
the majority of SPACs require founders to purchase warrants before the IPO. The proceeds from
these warrants were deposited in the escrow accounts in addition to the IPO proceeds. The
property of these warrants is similar to warrants for all other investors. If the SPAC is unable to
execute the merger the warrant’s proceeds are distributed to investors in addition to the
remaining money in the escrow accounts. Therefore, structuring SPACs in this manner increases
founders’ commitment to the success of the deal and decreases dilution to the investors
experienced at the IPO.
On average, SPAC founders purchased 2.67 million of warrants prior to the IPO at the
average price of $0.57. In addition to warrant purchases for some SPACs, (mostly when the
founders are related to or part of investment companies and in order to show full commitment to
the success of the SPAC), founders purchased units at the IPO and deposited them in the escrow
account. For example, the chairman of the board of China Fortune purchased 250,000 units at the
same price as other investors and deposited them in the escrow accounts. 19 On average,
19 From China Fortune 424B3 form “Our chairman of the board and chief executive officer, has committed to purchase from us 250,000 units at $8.00 per unit (for an aggregate purchase price of $2,000,000). This purchase will take place on a private placement basis simultaneously with the consummation of this offering. All of the proceeds we receive from the purchase will be placed in the trust fund described below. The “insider units” to be
14

combining warrant purchases and unit purchases, SPAC founders commit 3% of the IPO
proceeds in the escrow accounts. Panel B shows that in the first three years, the average
contribution by SPAC founders was 0% of total proceeds. In the last three years, the average
contribution is 5%.
Underwriters play an important role in the SPAC market. They promote SPACs prior to
the IPO and make the market for SPACs’ securities after the IPO. In most cases, they are market
makers for securities until the final resolution of the SPACs fate through merger or liquidation.
EarlyBirdCapital (the underwriter of the first SPAC in 2003) is the investment bank that created
the modern SPACs. They applied experience from prior involvement in blank check markets
during the 1990’s and structured SPACs in compliance with the SEC rules (and with additional
guarantees to investors). Until 2006, the SPAC market was characterized by lower tier investing
banks as underwriters. After 2006, more bulge-bracket investment banks such as Citigroup, JP
Morgan, Deutsche Bank and Lazard participate in the SPAC market. Their involvement validates
SPACs structure as a legitimate public investment vehicle.
On average, total underwriters’ compensation agreed at the IPO date is 6.89% of the IPO
proceeds. The reported level of compensation is similar to other regular IPO’s.20 In the period of
2003-2005 underwriters charge SPACs full compensation at the IPO, and total compensation
was higher than the average, being 10% of gross proceeds in 2003 and 9.17% in 2004. Later, in
order to appease investors and to lower their dilution, underwriters agreed to defer part of their
compensation and receive that compensation after the merger, conditional on merger success.
purchased by our chairman will be identical to the units being offered by this prospectus except that if we call the warrants for redemption, the warrants underlying the insider units may be exercisable on a cashless basis so long as such warrants are held by our chairman or his affiliates. Additionally, our chairman has waived his right to receive distributions upon our liquidation prior to a business combination with respect to the ordinary shares underlying the insider units. The insider units have been registered for resale under the registration statement of which this prospectus forms a part, but our chairman agreed that the insider units and underlying securities will not be sold or transferred by him until after we have completed a business combination. 20 Chen and Ritter (2000)
15

Across the sample, 2.3% of IPO proceeds (or 33% of total underwriters’ compensation) is
deferred on behalf of underwriters and deposited in the escrow accounts. In 2008, for example,
the deferred part of compensation was higher than the compensation collected at the IPO date.
Underwriters form a syndicate to support SPACs’ IPO. In our sample, the average
syndicate consists of 3.47 underwriters. Although Panel B does not report a clear pattern in
dynamics of the number of underwriters in syndicate for the first two years, the number is
significantly higher than the average with 7 underwriters in 2003 and 4.92 underwriters in 2004.
Considering that SPACs in such period were smaller and with less units issued, it seems that
selling SPACs required more effort in the first few years of existence.
In every SPAC deal, the underwriters receive an overallotment option and the average
allotment size is 13.75% of the number of units issued. The most frequent arraignment is one in
which overallotment size is 15% of the total units issued at the IPO. Typically, the underwriters
have two weeks to exercise the overallotment option. They receive compensation in the same
manner for overallotment shares as for the rest of the issuing shares. On average, SPAC investors
oversubscribe the IPO and underwriters are able to sell 7.7% more shares than planned. The level
of oversubscription is slightly lower than 9.5% for regular IPOs reported by Ellis et.al (2000).
4.2 Subsamples analysis
Table 3 reports SPACs’ characteristics when our sample is divided into two subsamples.
The first subsample presents the characteristics of all SPACs that focused their merger intentions
on China as geographical region. The second subsample presents characteristics of SPACs that
focused their merger intentions elsewhere. The comparison of Chinese focused SPACs with the
rest of SPACs enables us to determine whether their institutional characteristics differ and
indirectly evaluate SEC’s decision on reverse mergers in 2011.
16
In 2003-2011, 41 SPACs announced their intention to execute merger or acquisition with
companies from China. That represents approximately 22% of all SPACs that conducted the IPO
in the U.S. markets. In terms of gross proceeds, Chinese focused SPACs raised $2.5 billion.
Merging SPACs with Chinese companies is beneficial for different reasons. First, SPAC
investors through SPAC become owners of Chinese companies and reap the potential benefits in
the future. Second, SPAC offers Chinese companies a pile of cash and public listing in the U.S.
capital markets. Third, merging of Chinese companies and SPACs (or reverse mergers) include
Chinese government regulations regarding listing on non-Chinese foreign exchanges. 21
Table 3 reports that SPACs focused on China are 2.4 times smaller than the rest of SPACs
($62.04 million vs. 146.70 million). This result shows that SPACs focused on China have similar
unit price as the rest ($7.76 vs. $8.17) but with fewer units on average (7.77 million vs. 16.95).
There may be strategic reasons why the size is different. EarlyBirdCapital, one of the main
promoters and major underwriter of SPACs, states “absence of a true market for small IPOs
deprives growth-oriented and emerging market investors of new supply of public companies.”22
There is no significant difference in the average percentage of IPO proceeds deposited in
the escrow accounts between samples. For China focused SPACs, 96% of the proceeds went to
the escrow accounts while 97% went to the remaining ones. In a similar manner, reported
dilution to investors is not different across subsamples (34.46% vs. 34.42%). This evidence
points that investors in SPACs focused on China at the IPO date are buying into similar
companies as investors of the remaining SPACs, at least in respect to the “cut” that SPAC
founders are taking for themselves.
21 http://www.tmx.com/en/pdf/TSX_SPAC_Presentation.pdf 22 http://www.foley.com/files/Event/ea8a93d0-d309-463c-835d-ff17925dee2f/Presentation/EventAttachment/0dc9699a-163a-492f-9f6e-037dbe215f26/EarlyBirdPresentation.pdf
17
The structure of units for both subsamples is very similar. A unit consists of one share and
1.30 warrants. This evidence points that underwriters do not distinguish at the IPO date what is
the geography focus of SPACs and do not assign higher risk levels to SPACs focusing on China.
The only difference is that, on average, warrants issued on Chinese focused SPACs have slightly
lower exercise price ($6.12 vs. $6.36).
Founders of SPACs focused on China are 3.5 years younger (48.05 years vs. 51.45 years)
at the IPO and fewer managers are sponsoring Chinese focused SPAC (5.34 vs. 6.07) on average.
In the subsample with focus on China, managers buy upfront 2.04 million warrants at average
price of $0.59 per warrant. Managers of the remaining SPACs have higher absolute number of
warrants purchased at 2.85 million. However, given the difference in the size of the IPO in the
percentage terms total commitment of Chinese focused managers is higher than for the SPACs in
the other subsample (3% of IPO proceeds vs. 2% of IPO proceeds). In addition, on average,
founders of Chinese SPAC are twice more likely to participate in founding a SPAC previously
than for the rest of sample (44% vs. 21%). In SPACs’ literature Kim (2009) suggests that
previous experience of managers in the industry increases success of SPACs to execute merger.
For example, all SPACs in their prospectuses before the IPO highlight successful prior
involvement of founders in wide blank check markets and SPACs particularly.23 Following that
reasoning it is rational that investors in Chinese SPACs would subscribe more to SPACs whose
managers were already successful in doing the IPO and executing the merger.
23 Here is a typical excerpt on prior managers’ involvement from B424 form of China Growth Equity Investment Ltd “Our management team, including our executive officers and the majority of our directors, has already been involved in the initial public offerings and the subsequent consummation of business combinations for two U.S. listed prior blank check companies focused on acquisition targets with operations in China as well as having acted as advisor to two companies which each completed transactions with blank check companies. Our management team played a key role throughout both of these business combination transactions, including identifying the acquisition targets, structuring and negotiating the transactions and assisting in obtaining the shareholder approval for such transactions”.
18
In both subsamples, underwriting characteristics at the IPO are similar. The underwriters’
of Chinese focused SPACs tend to charge higher total underwriting fee ( 7.04% of IPO proceeds
vs. 6.84%) but they also tend to defer the higher portion of their compensation until the merger
outcome ( 2.45% of IPO proceeds vs. 2.25%). There is no statistically significant difference in
the number of underwriters that are involved in the SPACs’ IPO where China focused SPACs
have slightly lower number of syndicate members (3.27 vs. 3.52).
SPACs in both subsamples are oversubscribed at the IPO, but in comparison China
focused SPACs have lower level of oversubscription than the rest of SPACs in the sample
(7.15% of IPO proceeds vs. 15.64%).
Reported statistics shows also that the threshold for approval of merger is not statistically
different across the subsamples.
4.3 Subsample analysis by the merger outcomes
Table 4 in Panel A reports the characteristics of SPACs that successfully merged both for
SPAC with focus on China and with focus elsewhere. Reported statistics resembles differences
in subsamples reported earlier. Chinese focused SPACs that merged are of smaller size than the
rest of the SPACs (53.59 million vs. 149.73) and with overall lower percentage of total
commitment toward IPO proceeds by SPAC founders (1.62% vs. 4.25%). Similarly, Chinese
SPACs that merged exhibit lower oversubscription than the rest of the SPACs in the sample (6.3
% of IPO proceeds vs. 15.97%)
Table 4 in Panel B reports characteristics of liquidated SPACs divided into ones that
focused their merger toward China and the rest of the SPACs.
19

4.4 Timeline from the IPO to Merger and some Merger Characteristics
Table 5 in Panel A reports some of the characteristics of SPACs in the interval between
the IPO and merger and explains the action of involved parties in that period. At the IPO SPAC
determines the period allowed for finding and acquiring a company. In general, such period is
two years. Within that period, SPAC founders use their expertise and search for a proper
company to merge.
Panel A shows that SPACs on average needed 468 days to announce the merger. For
Chinese SPACs the average was 492 days, for the rest of SPACs was 462 days. It is realistic to
assume that Chinese focused SPACs take longer to announce mergers because additional
complications in the procedure. In some cases, SPACs focused on China asked for extended
period to prepare the voting on merger.
After the merger announcement, SPAC managers work on merger details and in the final
meeting shareholders have to approve the merger. It is specified at the IPO what is the minimum
percentage of shareholders that have to approve the deal. If the minimum percentage of
shareholders supports the deal, the SPAC founders execute the merger. Otherwise, the SPAC
liquidates and the shareholders receive the IPO proceeds. On average, it took 213 days after the
merger announcement for a SPAC to execute the merger. In the case of Chinese focused SPACs
that number was 203 days while for the remaining SPACs is 216 days.
Panel B of Table 5 reports that out of 184 SPACs conducting an IPO by November 2011,
111 of them executed the merger. We collect the information on the merger size of the SPACs.
On average, the SPAC merger deal is 1.8 times the size of SPAC IPO or $233 million. For
SPACs that focused on China the ratio of merger size and IPO size is 2.36 times and for the rest
of SPACs in the sample 1.79 times.
20
5. Returns to Chinese Focused SPACs vs. the Rest
This section calculates returns to SPAC stakeholders for both subsamples around SEC’s
decision to impose the stricter listing rules on reverse mergers of Chinese origin. Calculating
returns enables us to provide additional evidence on performance of SPACs for both subsamples.
SPAC investors at the time of IPO purchase units. Units are composite securities and in
our sample, on average, one unit consists of 1 share and 1.3 warrants for both subsamples.
Usually, two weeks after the IPO units are disbanded and separate trading of shares and warrants
commences on the exchanges where SPACs are listed. In order to make a proper comparison
while calculating returns, we aggregate the value of all these securities at the time in which the
SEC announces its decision to impose stricter listing rules on reverse mergers of Chinese origin.
To make the comparison we form two SPAC portfolios in the following manner. First
portfolio consists of SPACs that focus their acquisition outside of China. Second portfolio
consists of SPACs that have Chinese companies as the merger focus or merged with companies
from China. We assume that at the IPO date an investor purchases one unit of each SPAC and
hold that unit until the evaluation date which in our case is the mid of October 2011. The
decision to evaluate the SPAC portfolios around that time is primarily driven by the actions of
the SEC that finalized in the first week of November. The SEC delisted the number of Chinese
reverse mergers and imposed stricter rules for them.
From 184 SPACs conducting the IPO, 93 have available data on units’ value. In some
cases, we input the value of unit if both share price and warrant price is available. From the
remaining 91 SPACs on which we do not have trading data, 65 of them liquidated. In this case,
investors receive the pro-rata proceeds after resolving the trust accounts. On average, aside of the
21
opportunity cost, the investors in these SPACs do not lose money. For the remaining 26 SPACs
the data is unavailable, mainly because they either turned private companies again or other
companies acquired them after the initial merger with SPAC.
Table 5, Panel A, reports overall performance of all SPACs with trading data until the
cutoff period and performance for the two subsamples. The average SPAC trading in the October
2011 has 9.5% negative return, where the worst performing SPAC lost 99.63% and the best
performing SPAC returned $4.125 for each dollar invested. Looking in the subsamples, Chinese
SPACs at that time were outperforming the rest of SPACs (4.1% vs. -14.8%).
If SPACs with units trading below $1 are trimmed from the sample, Panel B reports the
unit price information on 84 SPACs. Overall, aside of the opportunity cost, an investor buying 1
unit of each SPAC at the IPO and holding it until October 2011 has zero return. In this
subsample, Chinese SPACs are also outperforming the rest of SPACs in the sample (12% vs. -
5.3%). Our results are in agreement with findings in reverse merger literature.
6. Conclusion
This paper examines SPACs formed with the purpose of acquiring and merging with
companies in China in period 2004-2011. This analysis will help to answer the following
questions. First, whether they are different companies than their counterparts focusing their
merger somewhere else. Second, what are the main features of SPACs that focus on China?
Finally, this study helps us to answer what is the performance of China focused SPACs
compared with the rest.
We offer evidence that similarly to evidence from studies on reverse mergers focusing on
China, SPACs focused on China are not different in their characteristics from other SPACs. We
test for the performance of the SPACs focused on China and show that their performance is not
22

inferior to the performance of the other SPACs. On the contrary, an investment in the equally
weighted portfolio of SPACs with focus on China provides higher absolute return than an
investment in the equally weighted portfolio of remaining SPACs.
23
References
Berger, R. (2008). “SPACs: An Alternative Way to Access the Public Markets.” Journal of Applied Corporate Finance, Vol.20, pp. 68-75.
Boyer, C. M., & Baigent, G. G. (2008). SPACs as Alternative Investments. The Journal of Private Equity, 11(3), 8-15.
Chen, K. C., Cheng, Q., Lin, Y. C., Lin, Y. C., & Xiao, X. (2012). Does Foreign Firms’ Shortcut to Wall Street Cut Short Their Financial Reporting Quality? Evidence from Chinese Reverse Mergers. (April 22, 2012). Available at SSRN 2043899
Chen, H. C., & Ritter, J. R. (2000). The seven percent solution. The Journal of Finance, 55(3), 1105-1131.
Chemmanur, T. J., & Fulghieri, P. (1997). Why include warrants in new equity issues? A theory of unit IPOs. Journal of Financial and Quantitative Analysis, 32(1).
Cumming, D., Haß, L. H., & Schweizer, D. (2012). The Fast Track IPO–Success Factors for Taking Firms Public with SPACs. Available at SSRN: http://ssrn.com/abstract=2144892 or http://dx.doi.org/10.2139/ssrn.2144892
Floros, I. V., & Sapp, T. R. (2011). Shell Games: On the Value of Shell Companies. Journal of Corporate Finance, 17(4), 850-867.
Darrough, M., Huang, R., & Zhao, S. (2012). The Spillover Effect of Chinese Reverse Merger Frauds: Chinese or Reverse Merger? Available at SSRN: http://ssrn.com/abstract=2144483 or http://dx.doi.org/10.2139/ssrn.2144483
Ellis, K., Michaely, R., & O'hara, M. (2000). When the underwriter is the market maker: An examination of trading in the IPO aftermarket. The Journal of Finance, 55(3), 1039-1074.
Hale, L. M. (2007). SPAC: A Financing Tool with Something for everyone. Journal of Corporate Accounting & Finance, 18(2), 67-74.
Heyman, D. K. (2007). From Blank Check to SPAC: The Regulator's Response to the Market, and the Market's Response to the Regulation. Entrepreneurial Bus. LJ, 2, 531.
Howe, J. S., & O’Brien, S. W. (2012). SPAC Performance, Ownership and Corporate Governance. Advances in Financial Economics, 15, 1-14.
Jain, B. A. (1994). The underpricing of ‘unit’initial public offerings. The Quarterly Review of Economics and Finance, 34(3), 309-325.
Jenkinson, T., & Sousa, M. (2011). Why SPAC Investors Should Listen to the Market. Journal of Applied Finance, 21(2), 38-57.
Jindra, J., Voetmann, T., & Walkling, R. (2012). Reverse Mergers: The Chinese Experience. Available at SSRN: http://ssrn.com/abstract=2105814 or http://dx.doi.org/10.2139/ssrn.2105814
Jog, V., and Sun, C. (2007). Blank Check IPOs: A Home Run for Management. Available at SSRN: http://ssrn.com/abstract=1018242 or http://dx.doi.org/10.2139/ssrn.1018242
24
Kim, H. (2009). Essays on Management Quality, IPO Characteristics and the Success of Business Combinations (Doctoral dissertation, Louisiana State University).
Lakicevic, M., & Vulanovic, M. (2013). A Story on SPACs. Managerial Finance, 39(4), 384-403. http://dx.doi.org/10.1108/03074351311306201
Lakicevic, M., Shachmurove, Y., & Vulanovic, M. (2013). On Mergers, Acquisitions and Liquidation Using Specified Purpose Acquisition Companies (SPACs). Available at SSRN: http://ssrn.com/abstract=2221349 or http://dx.doi.org/10.2139/ssrn.2221349
Lee, C., Li, K., & Zhang, R. (2012). Shell Games: Are Chinese Reverse Merger Firms Inherently Toxic?. Available at SSRN 2155425.
Lewellen, S. (2009). SPACs as an Asset Class. Available at SSRN 1284999 http://ssrn.com/abstract=1284999 or http://dx.doi.org/10.2139/ssrn.1284999
Miller, D. A. (2008). SPAC IPOs in 2008. Financier Worldwide.
Riemer, D.S., 2007, Special Purpose Acquisition Companies: SPAC and SPAN, or Blank Check Redux? Washington University Law Review 85, 931-967.
Ritter, J. (2008) “Some Factoids about the 2008 IPO Market “Working Paper, University of Florida.
Sjostrom Jr, W. K. (2007). Truth about Reverse Mergers, The. Entrepreneurial Bus. LJ, 2, 743.
Thompson, A. (2010). Organizational Form and Investment Decisions: The Case of Special Purpose Acquisition Companies. Diss. Purdue University.
Tran, A. (2012). Blank Check Acquisitions. Available at SSRN2070274. http://ssrn.com/abstract=2070274 or http://dx.doi.org/10.2139/ssrn.2070274 Vulanovic, M. (2010). Essays in Corporate Finance (Doctoral dissertation, City University of
New York).
25
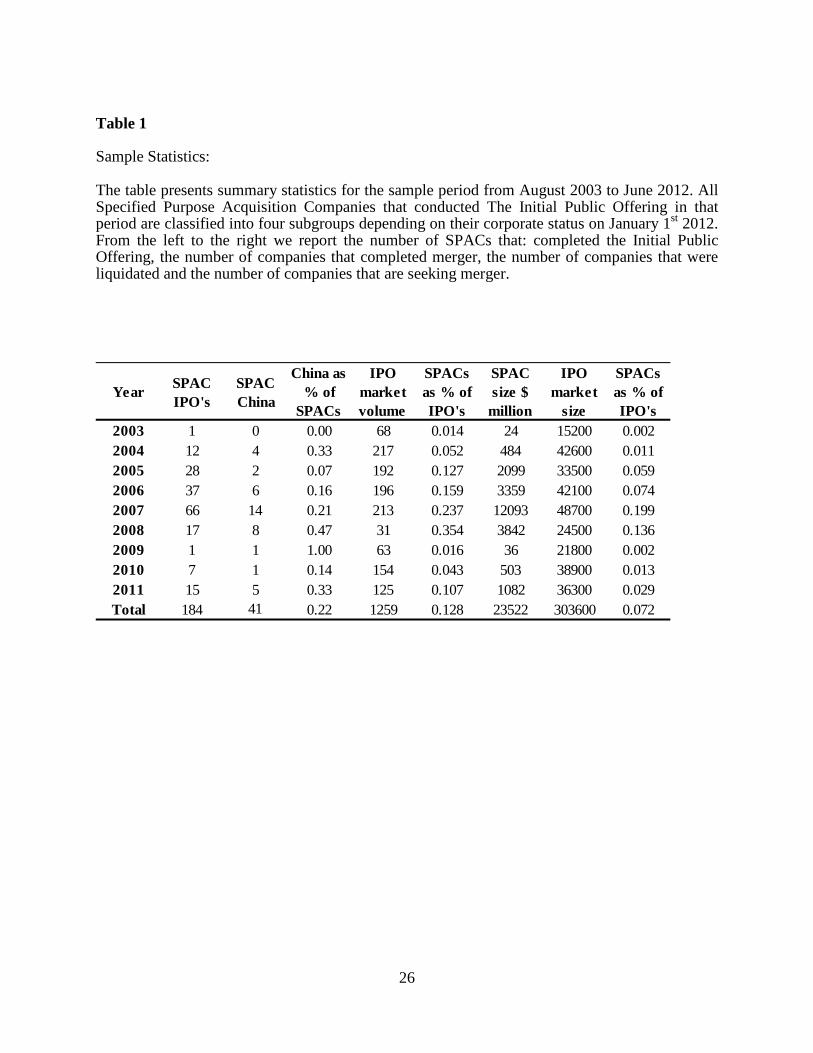
Table 1 Sample Statistics: The table presents summary statistics for the sample period from August 2003 to June 2012. All Specified Purpose Acquisition Companies that conducted The Initial Public Offering in that period are classified into four subgroups depending on their corporate status on January 1st 2012. From the left to the right we report the number of SPACs that: completed the Initial Public Offering, the number of companies that completed merger, the number of companies that were liquidated and the number of companies that are seeking merger.
Year SPAC IPO's
SPAC China
China as % of
SPACs
IPO market volume
SPACs as % of IPO's
SPAC size $
million
IPO market
size
SPACs as % of IPO's
2003 1 0 0.00 68 0.014 24 15200 0.0022004 12 4 0.33 217 0.052 484 42600 0.0112005 28 2 0.07 192 0.127 2099 33500 0.0592006 37 6 0.16 196 0.159 3359 42100 0.0742007 66 14 0.21 213 0.237 12093 48700 0.1992008 17 8 0.47 31 0.354 3842 24500 0.1362009 1 1 1.00 63 0.016 36 21800 0.0022010 7 1 0.14 154 0.043 503 38900 0.0132011 15 5 0.33 125 0.107 1082 36300 0.029Total 184 41 0.22 1259 0.128 23522 303600 0.072
26
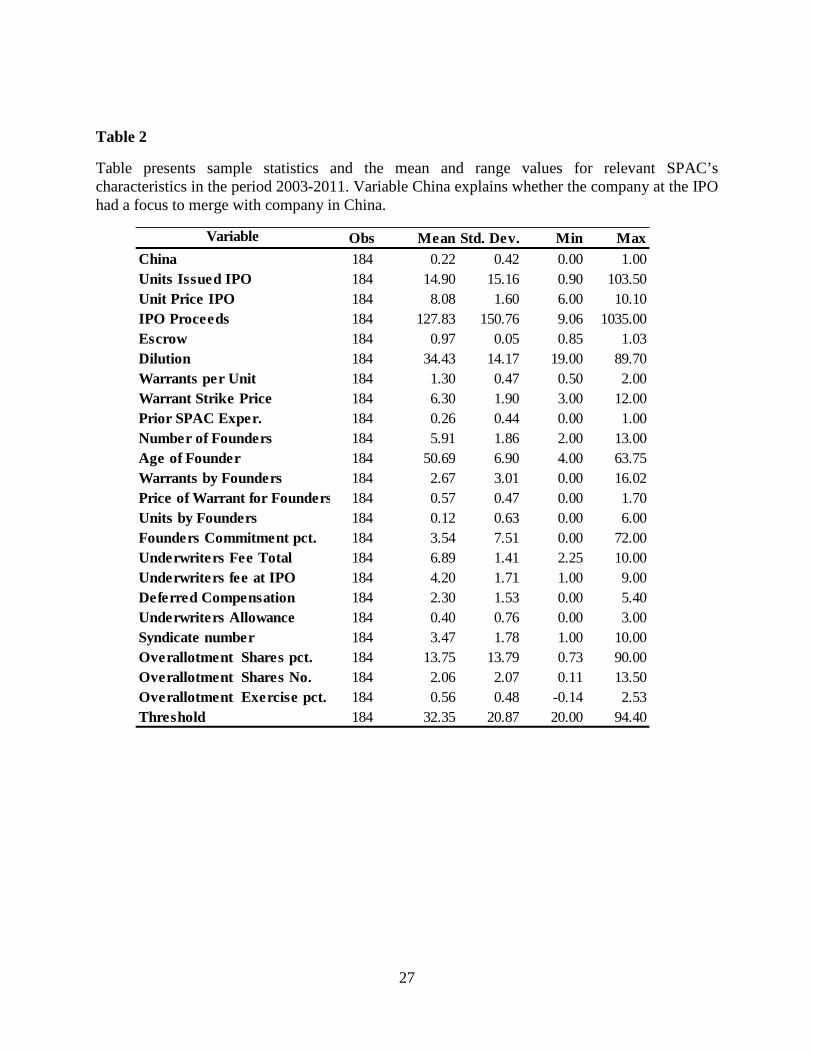
Table 2
Table presents sample statistics and the mean and range values for relevant SPAC’s characteristics in the period 2003-2011. Variable China explains whether the company at the IPO had a focus to merge with company in China.
Variable Obs Mean Std. Dev. Min MaxChina 184 0.22 0.42 0.00 1.00Units Issued IPO 184 14.90 15.16 0.90 103.50Unit Price IPO 184 8.08 1.60 6.00 10.10IPO Proceeds 184 127.83 150.76 9.06 1035.00Escrow 184 0.97 0.05 0.85 1.03Dilution 184 34.43 14.17 19.00 89.70Warrants per Unit 184 1.30 0.47 0.50 2.00Warrant Strike Price 184 6.30 1.90 3.00 12.00Prior SPAC Exper. 184 0.26 0.44 0.00 1.00Number of Founders 184 5.91 1.86 2.00 13.00Age of Founder 184 50.69 6.90 4.00 63.75Warrants by Founders 184 2.67 3.01 0.00 16.02Price of Warrant for Founders 184 0.57 0.47 0.00 1.70Units by Founders 184 0.12 0.63 0.00 6.00Founders Commitment pct. 184 3.54 7.51 0.00 72.00Underwriters Fee Total 184 6.89 1.41 2.25 10.00Underwriters fee at IPO 184 4.20 1.71 1.00 9.00Deferred Compensation 184 2.30 1.53 0.00 5.40Underwriters Allowance 184 0.40 0.76 0.00 3.00Syndicate number 184 3.47 1.78 1.00 10.00Overallotment Shares pct. 184 13.75 13.79 0.73 90.00Overallotment Shares No. 184 2.06 2.07 0.11 13.50Overallotment Exercise pct. 184 0.56 0.48 -0.14 2.53Threshold 184 32.35 20.87 20.00 94.40
27
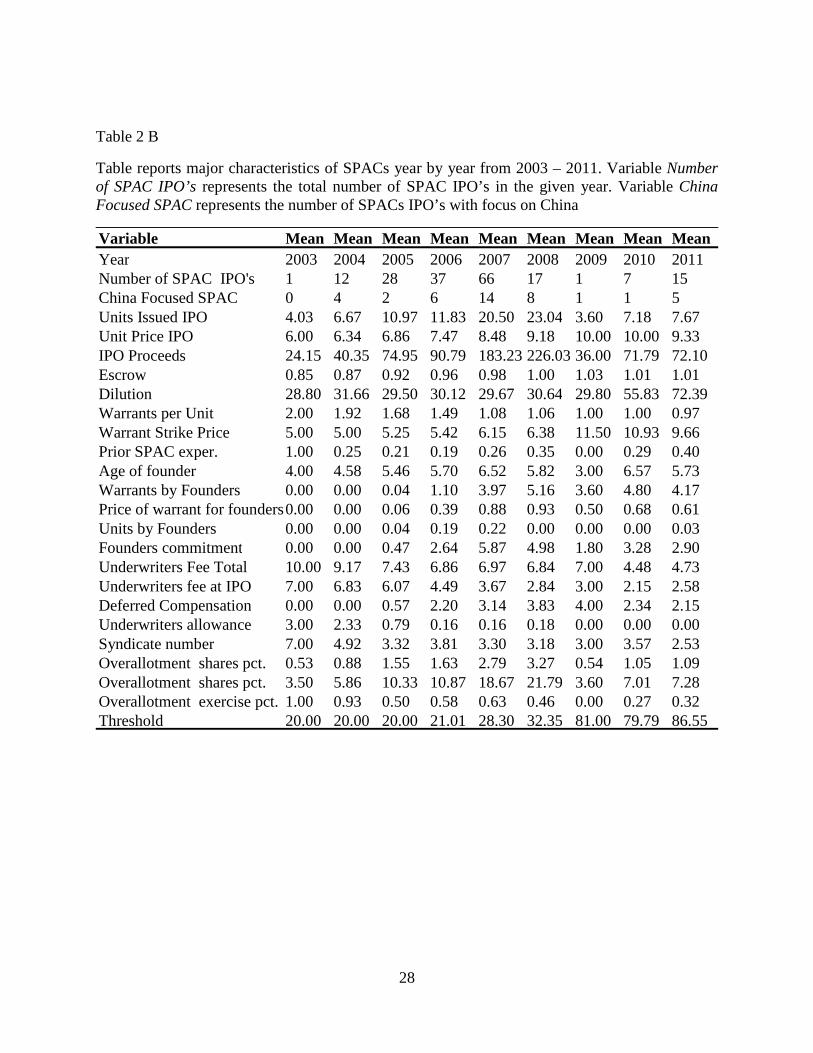
Table 2 B
Table reports major characteristics of SPACs year by year from 2003 – 2011. Variable Number of SPAC IPO’s represents the total number of SPAC IPO’s in the given year. Variable China Focused SPAC represents the number of SPACs IPO’s with focus on China
Variable Mean Mean Mean Mean Mean Mean Mean Mean Mean Year 2003 2004 2005 2006 2007 2008 2009 2010 2011 Number of SPAC IPO's 1 12 28 37 66 17 1 7 15 China Focused SPAC 0 4 2 6 14 8 1 1 5 Units Issued IPO 4.03 6.67 10.97 11.83 20.50 23.04 3.60 7.18 7.67 Unit Price IPO 6.00 6.34 6.86 7.47 8.48 9.18 10.00 10.00 9.33 IPO Proceeds 24.15 40.35 74.95 90.79 183.23 226.03 36.00 71.79 72.10 Escrow 0.85 0.87 0.92 0.96 0.98 1.00 1.03 1.01 1.01 Dilution 28.80 31.66 29.50 30.12 29.67 30.64 29.80 55.83 72.39 Warrants per Unit 2.00 1.92 1.68 1.49 1.08 1.06 1.00 1.00 0.97 Warrant Strike Price 5.00 5.00 5.25 5.42 6.15 6.38 11.50 10.93 9.66 Prior SPAC exper. 1.00 0.25 0.21 0.19 0.26 0.35 0.00 0.29 0.40 Age of founder 4.00 4.58 5.46 5.70 6.52 5.82 3.00 6.57 5.73 Warrants by Founders 0.00 0.00 0.04 1.10 3.97 5.16 3.60 4.80 4.17 Price of warrant for founders 0.00 0.00 0.06 0.39 0.88 0.93 0.50 0.68 0.61 Units by Founders 0.00 0.00 0.04 0.19 0.22 0.00 0.00 0.00 0.03 Founders commitment 0.00 0.00 0.47 2.64 5.87 4.98 1.80 3.28 2.90 Underwriters Fee Total 10.00 9.17 7.43 6.86 6.97 6.84 7.00 4.48 4.73 Underwriters fee at IPO 7.00 6.83 6.07 4.49 3.67 2.84 3.00 2.15 2.58 Deferred Compensation 0.00 0.00 0.57 2.20 3.14 3.83 4.00 2.34 2.15 Underwriters allowance 3.00 2.33 0.79 0.16 0.16 0.18 0.00 0.00 0.00 Syndicate number 7.00 4.92 3.32 3.81 3.30 3.18 3.00 3.57 2.53 Overallotment shares pct. 0.53 0.88 1.55 1.63 2.79 3.27 0.54 1.05 1.09 Overallotment shares pct. 3.50 5.86 10.33 10.87 18.67 21.79 3.60 7.01 7.28 Overallotment exercise pct. 1.00 0.93 0.50 0.58 0.63 0.46 0.00 0.27 0.32 Threshold 20.00 20.00 20.00 21.01 28.30 32.35 81.00 79.79 86.55
28
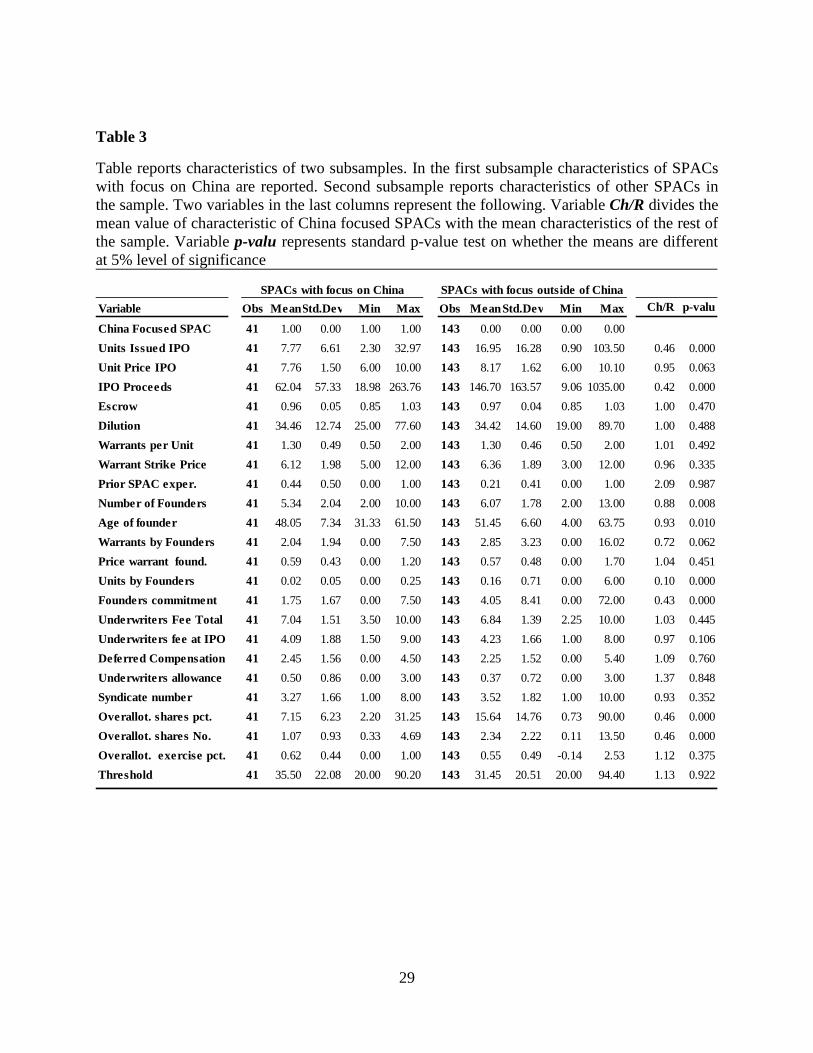
Table 3
Table reports characteristics of two subsamples. In the first subsample characteristics of SPACs with focus on China are reported. Second subsample reports characteristics of other SPACs in the sample. Two variables in the last columns represent the following. Variable Ch/R divides the mean value of characteristic of China focused SPACs with the mean characteristics of the rest of the sample. Variable p-valu represents standard p-value test on whether the means are different at 5% level of significance
Variable Obs MeanStd.Dev Min Max Obs MeanStd.Dev Min Max Ch/R p-valu
China Focused SPAC 41 1.00 0.00 1.00 1.00 143 0.00 0.00 0.00 0.00Units Issued IPO 41 7.77 6.61 2.30 32.97 143 16.95 16.28 0.90 103.50 0.46 0.000Unit Price IPO 41 7.76 1.50 6.00 10.00 143 8.17 1.62 6.00 10.10 0.95 0.063IPO Proceeds 41 62.04 57.33 18.98 263.76 143 146.70 163.57 9.06 1035.00 0.42 0.000Escrow 41 0.96 0.05 0.85 1.03 143 0.97 0.04 0.85 1.03 1.00 0.470Dilution 41 34.46 12.74 25.00 77.60 143 34.42 14.60 19.00 89.70 1.00 0.488Warrants per Unit 41 1.30 0.49 0.50 2.00 143 1.30 0.46 0.50 2.00 1.01 0.492Warrant Strike Price 41 6.12 1.98 5.00 12.00 143 6.36 1.89 3.00 12.00 0.96 0.335Prior SPAC exper. 41 0.44 0.50 0.00 1.00 143 0.21 0.41 0.00 1.00 2.09 0.987Number of Founders 41 5.34 2.04 2.00 10.00 143 6.07 1.78 2.00 13.00 0.88 0.008Age of founder 41 48.05 7.34 31.33 61.50 143 51.45 6.60 4.00 63.75 0.93 0.010Warrants by Founders 41 2.04 1.94 0.00 7.50 143 2.85 3.23 0.00 16.02 0.72 0.062Price warrant found. 41 0.59 0.43 0.00 1.20 143 0.57 0.48 0.00 1.70 1.04 0.451Units by Founders 41 0.02 0.05 0.00 0.25 143 0.16 0.71 0.00 6.00 0.10 0.000Founders commitment 41 1.75 1.67 0.00 7.50 143 4.05 8.41 0.00 72.00 0.43 0.000Underwriters Fee Total 41 7.04 1.51 3.50 10.00 143 6.84 1.39 2.25 10.00 1.03 0.445Underwriters fee at IPO 41 4.09 1.88 1.50 9.00 143 4.23 1.66 1.00 8.00 0.97 0.106Deferred Compensation 41 2.45 1.56 0.00 4.50 143 2.25 1.52 0.00 5.40 1.09 0.760Underwriters allowance 41 0.50 0.86 0.00 3.00 143 0.37 0.72 0.00 3.00 1.37 0.848Syndicate number 41 3.27 1.66 1.00 8.00 143 3.52 1.82 1.00 10.00 0.93 0.352Overallot. shares pct. 41 7.15 6.23 2.20 31.25 143 15.64 14.76 0.73 90.00 0.46 0.000Overallot. shares No. 41 1.07 0.93 0.33 4.69 143 2.34 2.22 0.11 13.50 0.46 0.000Overallot. exercise pct. 41 0.62 0.44 0.00 1.00 143 0.55 0.49 -0.14 2.53 1.12 0.375Threshold 41 35.50 22.08 20.00 90.20 143 31.45 20.51 20.00 94.40 1.13 0.922
SPACs with focus on China SPACs with focus outside of China
29
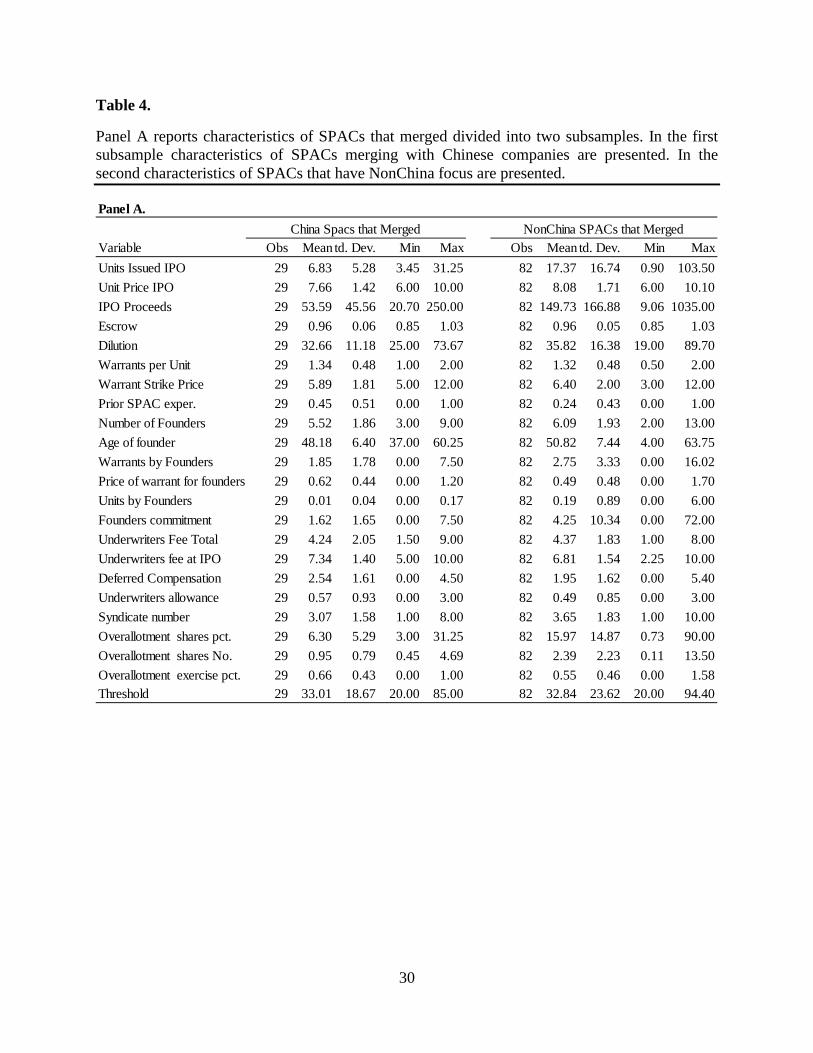
Table 4.
Panel A reports characteristics of SPACs that merged divided into two subsamples. In the first subsample characteristics of SPACs merging with Chinese companies are presented. In the second characteristics of SPACs that have NonChina focus are presented.
Panel A.
Variable Obs Mean td. Dev. Min Max Obs MeanStd. Dev. Min MaxUnits Issued IPO 29 6.83 5.28 3.45 31.25 82 17.37 16.74 0.90 103.50Unit Price IPO 29 7.66 1.42 6.00 10.00 82 8.08 1.71 6.00 10.10IPO Proceeds 29 53.59 45.56 20.70 250.00 82 149.73 166.88 9.06 1035.00Escrow 29 0.96 0.06 0.85 1.03 82 0.96 0.05 0.85 1.03Dilution 29 32.66 11.18 25.00 73.67 82 35.82 16.38 19.00 89.70Warrants per Unit 29 1.34 0.48 1.00 2.00 82 1.32 0.48 0.50 2.00Warrant Strike Price 29 5.89 1.81 5.00 12.00 82 6.40 2.00 3.00 12.00Prior SPAC exper. 29 0.45 0.51 0.00 1.00 82 0.24 0.43 0.00 1.00Number of Founders 29 5.52 1.86 3.00 9.00 82 6.09 1.93 2.00 13.00Age of founder 29 48.18 6.40 37.00 60.25 82 50.82 7.44 4.00 63.75Warrants by Founders 29 1.85 1.78 0.00 7.50 82 2.75 3.33 0.00 16.02Price of warrant for founders 29 0.62 0.44 0.00 1.20 82 0.49 0.48 0.00 1.70Units by Founders 29 0.01 0.04 0.00 0.17 82 0.19 0.89 0.00 6.00Founders commitment 29 1.62 1.65 0.00 7.50 82 4.25 10.34 0.00 72.00Underwriters Fee Total 29 4.24 2.05 1.50 9.00 82 4.37 1.83 1.00 8.00Underwriters fee at IPO 29 7.34 1.40 5.00 10.00 82 6.81 1.54 2.25 10.00Deferred Compensation 29 2.54 1.61 0.00 4.50 82 1.95 1.62 0.00 5.40Underwriters allowance 29 0.57 0.93 0.00 3.00 82 0.49 0.85 0.00 3.00Syndicate number 29 3.07 1.58 1.00 8.00 82 3.65 1.83 1.00 10.00Overallotment shares pct. 29 6.30 5.29 3.00 31.25 82 15.97 14.87 0.73 90.00Overallotment shares No. 29 0.95 0.79 0.45 4.69 82 2.39 2.23 0.11 13.50Overallotment exercise pct. 29 0.66 0.43 0.00 1.00 82 0.55 0.46 0.00 1.58Threshold 29 33.01 18.67 20.00 85.00 82 32.84 23.62 20.00 94.40
China Spacs that Merged NonChina SPACs that Merged
30
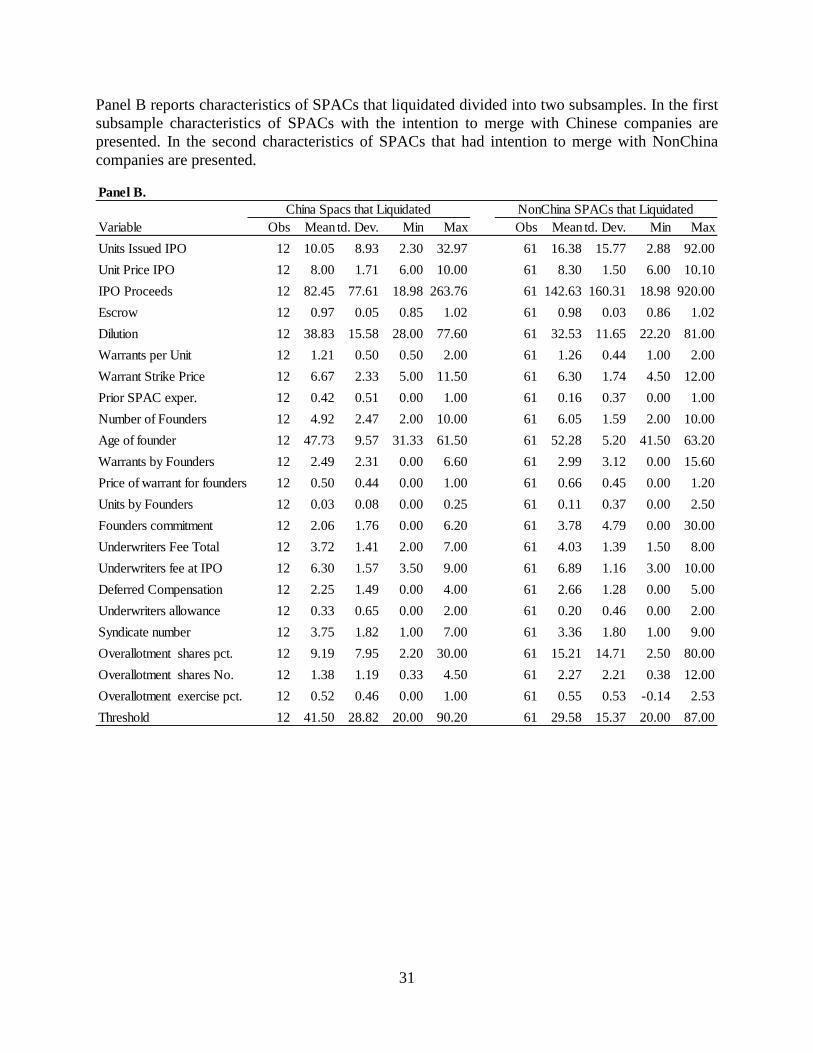
Panel B reports characteristics of SPACs that liquidated divided into two subsamples. In the first subsample characteristics of SPACs with the intention to merge with Chinese companies are presented. In the second characteristics of SPACs that had intention to merge with NonChina companies are presented.
Panel B.
Variable Obs Mean td. Dev. Min Max Obs MeanStd. Dev. Min MaxUnits Issued IPO 12 10.05 8.93 2.30 32.97 61 16.38 15.77 2.88 92.00Unit Price IPO 12 8.00 1.71 6.00 10.00 61 8.30 1.50 6.00 10.10IPO Proceeds 12 82.45 77.61 18.98 263.76 61 142.63 160.31 18.98 920.00Escrow 12 0.97 0.05 0.85 1.02 61 0.98 0.03 0.86 1.02Dilution 12 38.83 15.58 28.00 77.60 61 32.53 11.65 22.20 81.00Warrants per Unit 12 1.21 0.50 0.50 2.00 61 1.26 0.44 1.00 2.00Warrant Strike Price 12 6.67 2.33 5.00 11.50 61 6.30 1.74 4.50 12.00Prior SPAC exper. 12 0.42 0.51 0.00 1.00 61 0.16 0.37 0.00 1.00Number of Founders 12 4.92 2.47 2.00 10.00 61 6.05 1.59 2.00 10.00Age of founder 12 47.73 9.57 31.33 61.50 61 52.28 5.20 41.50 63.20Warrants by Founders 12 2.49 2.31 0.00 6.60 61 2.99 3.12 0.00 15.60Price of warrant for founders 12 0.50 0.44 0.00 1.00 61 0.66 0.45 0.00 1.20Units by Founders 12 0.03 0.08 0.00 0.25 61 0.11 0.37 0.00 2.50Founders commitment 12 2.06 1.76 0.00 6.20 61 3.78 4.79 0.00 30.00Underwriters Fee Total 12 3.72 1.41 2.00 7.00 61 4.03 1.39 1.50 8.00Underwriters fee at IPO 12 6.30 1.57 3.50 9.00 61 6.89 1.16 3.00 10.00Deferred Compensation 12 2.25 1.49 0.00 4.00 61 2.66 1.28 0.00 5.00Underwriters allowance 12 0.33 0.65 0.00 2.00 61 0.20 0.46 0.00 2.00Syndicate number 12 3.75 1.82 1.00 7.00 61 3.36 1.80 1.00 9.00Overallotment shares pct. 12 9.19 7.95 2.20 30.00 61 15.21 14.71 2.50 80.00Overallotment shares No. 12 1.38 1.19 0.33 4.50 61 2.27 2.21 0.38 12.00Overallotment exercise pct. 12 0.52 0.46 0.00 1.00 61 0.55 0.53 -0.14 2.53Threshold 12 41.50 28.82 20.00 90.20 61 29.58 15.37 20.00 87.00
China Spacs that Liquidated NonChina SPACs that Liquidated
31
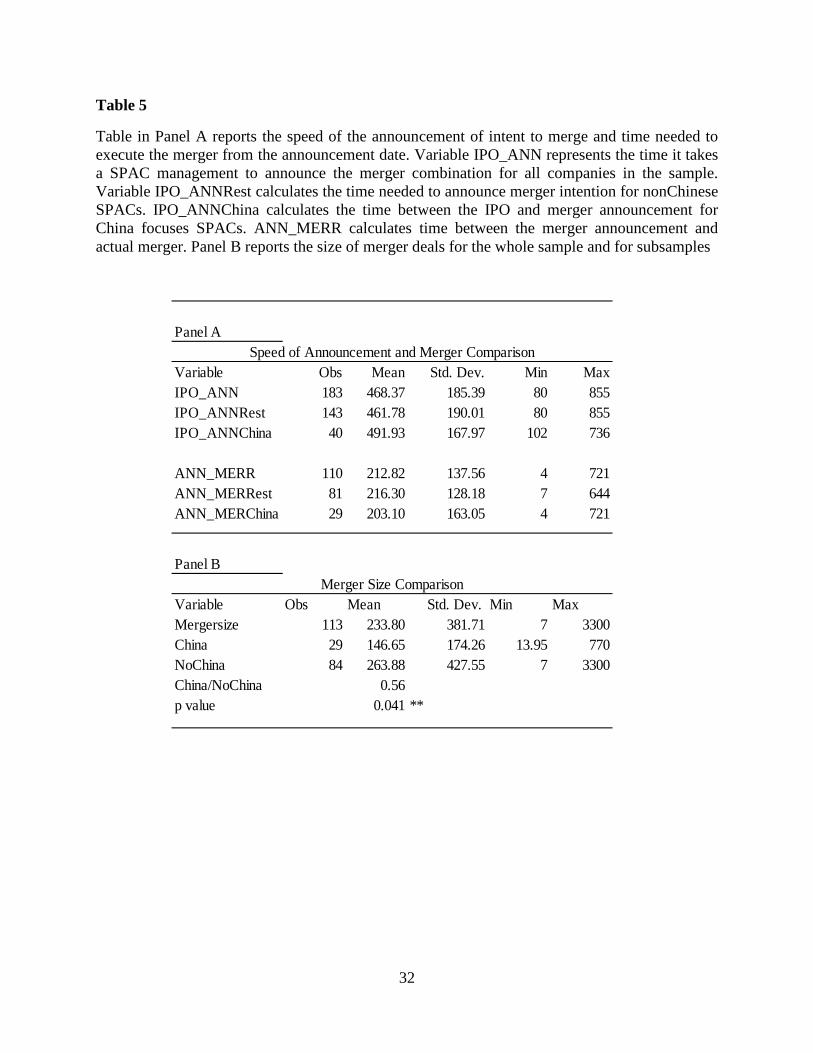
Table 5
Table in Panel A reports the speed of the announcement of intent to merge and time needed to execute the merger from the announcement date. Variable IPO_ANN represents the time it takes a SPAC management to announce the merger combination for all companies in the sample. Variable IPO_ANNRest calculates the time needed to announce merger intention for nonChinese SPACs. IPO_ANNChina calculates the time between the IPO and merger announcement for China focuses SPACs. ANN_MERR calculates time between the merger announcement and actual merger. Panel B reports the size of merger deals for the whole sample and for subsamples
Panel A
Variable Obs Mean Std. Dev. Min MaxIPO_ANN 183 468.37 185.39 80 855IPO_ANNRest 143 461.78 190.01 80 855IPO_ANNChina 40 491.93 167.97 102 736
ANN_MERR 110 212.82 137.56 4 721ANN_MERRest 81 216.30 128.18 7 644ANN_MERChina 29 203.10 163.05 4 721
Panel B
Variable Obs Mean Std. Dev. Min MaxMergersize 113 233.80 381.71 7 3300China 29 146.65 174.26 13.95 770NoChina 84 263.88 427.55 7 3300China/NoChina 0.56p value 0.041 **
Speed of Announcement and Merger Comparison
Merger Size Comparison
32

Table 6:
This table reports returns to SPAC investors. Panel A variables are the following: BHAR_T = absolute buy and hold return on the unit equaly weighted portfolio of SPACs from the day of the IPO until the cutoff date. BHAR_R = absolute buy and hold return on the unit equaly weighted portfolio of SPACs from the day of the IPO until the cutoff date for SPACs that focus outside of China. BHAR_C = absolute buy and hold return on the unit equaly weighted portfolio of SPACs from the day of the IPO until the cutoff date for SPACs that focus on China. BHAR_T = 0.905 means that an investor with investment of $1 would get back $0.905, similarly for other returns. Panel B calculates returns in the same manner but SPACs with the trading price of units lower than $1 are eliminated from the sample
Panel AVariable Obs Mean Std. Dev. Min Max
BHAR_T 93 0.905 0.827 0.004 4.125BHAR_R 67 0.853 0.729 0.004 3.070BHAR_C 26 1.041 1.041 0.011 4.125
Panel BVariable Obs Mean Std. Dev. Min Max
BHAR_T 84 0.999 0.816 0.113 4.125BHAR_R 60 0.948 0.712 0.113 3.000BHAR_C 24 1.126 1.040 0.120 4.125
33