Forest structure and carbon dynamics in Amazonian tropical rain forests Simone Vieira, Plinio B. De...
9
Forest structure and carbon dynamics in Amazonian tropical rain forests Simone Vieira , Plinio B. De Camargo, Diogo Selhorst, Lucy Hutyra, Roseane da Silva, Jeff Chambers, I. Foster Brown, Niro Higuchi, Joaquim dos Santos, Steven Wofsy, Susan Trumbore, Luiz Martinelli
-
Upload
lilliana-wires -
Category
Documents
-
view
229 -
download
1
Transcript of Forest structure and carbon dynamics in Amazonian tropical rain forests Simone Vieira, Plinio B. De...
Forest structure and carbon dynamics in Amazonian tropical
rain forests
Simone Vieira , Plinio B. De Camargo, Diogo Selhorst, Lucy Hutyra, Roseane da Silva, Jeff Chambers, I. Foster Brown, Niro Higuchi, Joaquim
dos Santos, Steven Wofsy, Susan Trumbore, Luiz Martinelli
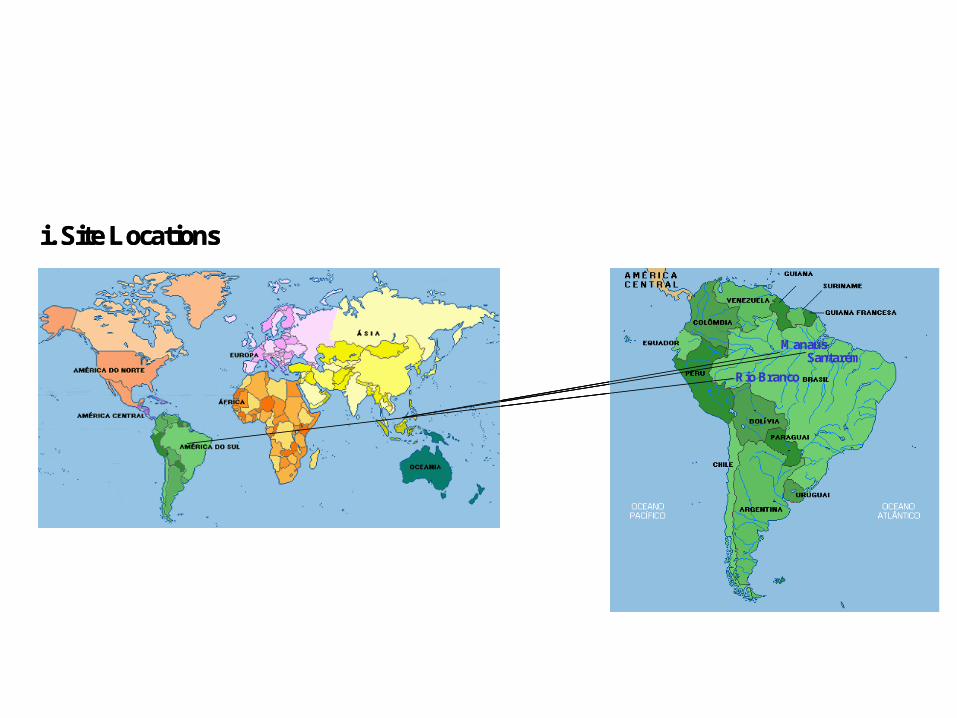
SantarémManaus
Rio Branco
i. Site Locations
SantarémManaus
Rio Branco
SantarémManaus
Rio Branco
i. Site Locations

Manaus = 570.84e-0.7344x
R2 = 0.9876
Rio Branco = 211.07e-0.5655x
R2 = 0.9027Santarem = 152.68e-0.4759x
R2 = 0.86490.1
1.0
10.0
100.0
1000.0
10-2020-30
30-4040-50
50-6060-70
70-8080-90
90-100
100-110> 110
DBH Class
Num
ber
of tr
ee (
tree
.ha-1
)
ManausRio BrancoSantarém
Size Class Distribution

Biomass Distribution
0
10
20
30
40
50
60
70
80
90
DBH Class
Abo
vegr
ound
Bio
mas
s
(Mg.
ha-1
)ManausRio BrancoSantarém
360262
280
0
10
20
30
40
50
60
70
80
90
DBH Class
Abo
vegr
ound
Bio
mas
s
(Mg.
ha-1
)ManausRio BrancoSantarém
360262
280
Man
aus
-4-202468
101214
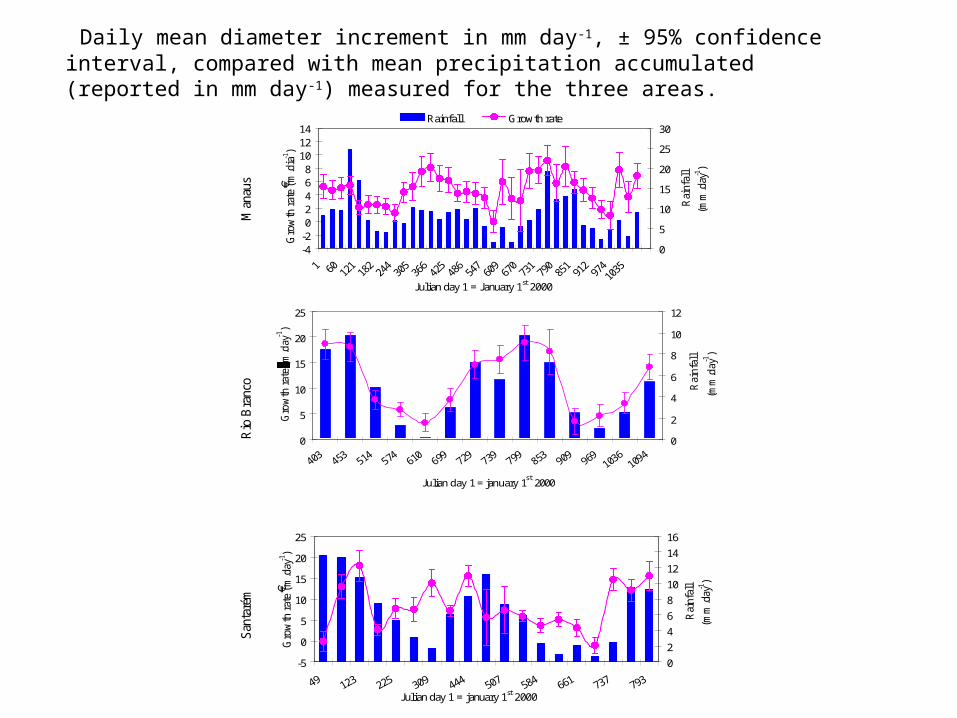
Julian day 1 = January 1st 2000G
row
th r
ate
( m.d
ia-1
)
0
5
10
15
20
25
30
Rai
nfal
l
(mm
.day
-1)
Rainfall Growth rate
Rio
Bra
nco
0
5
10
15
20
25
Julian day 1 = january 1st
2000
Gro
wth
rat
e (m
.day
-1)
0
2
4
6
8
10
12
Rai
nfa
ll
(mm
.day
-1)
San
taré
m
-5
0
5
10
15
20
25
Julian day 1 = january 1st 2000
Gro
wth
rat
e ( m
.day
-1)
0
2
4
6
8
10
12
14
16
Rai
nfal
l
(mm
.day
-1)
Daily mean diameter increment in mm day-1, ± 95% confidence interval, compared with mean precipitation accumulated (reported in mm day-1) measured for the three areas.
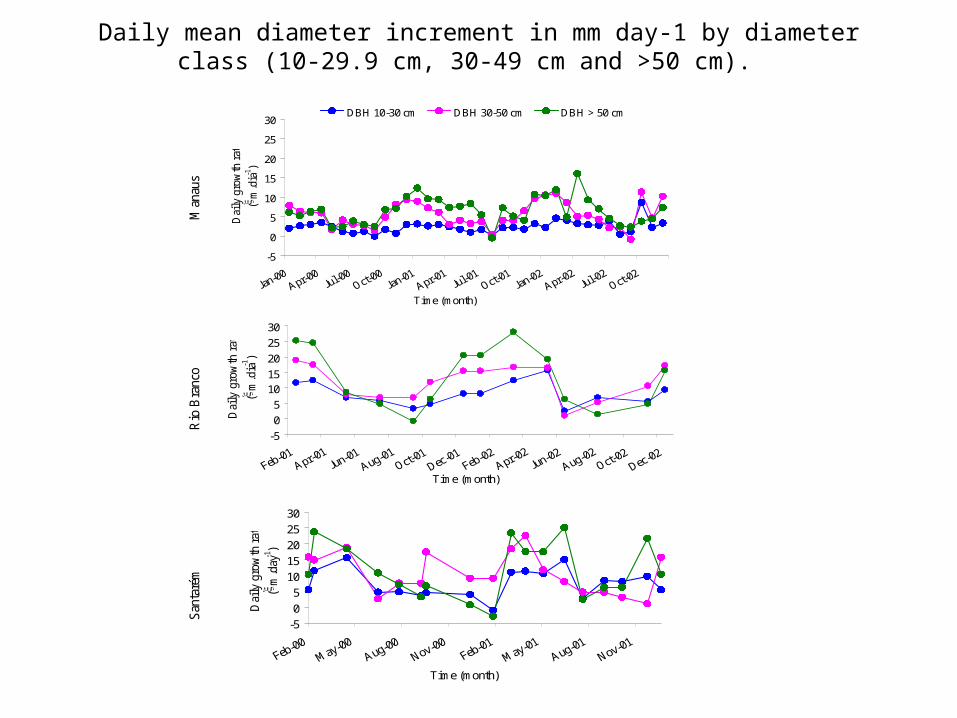
Daily mean diameter increment in mm day-1 by diameter class (10-29.9 cm, 30-49 cm and >50 cm).
Man
aus
-5
0
5
10
15
20
25
30
Time (month)
Dai
ly g
row
th r
ate
(m
.dia
-1)
DBH 10-30 cm DBH 30-50 cm DBH > 50 cm
Rio
Bra
nco
-5
0
5
1015
20
25
30
Time (month)
Dai
ly g
row
th r
ate
( m
.dia-1
)
San
taré
m
-5
0
5
10
15
20
25
30
Time (month)
Dai
ly g
row
th r
ate
(m
.day
-1)
1

Manaus Rio Branco Santarém 2000 2001 2002 2001 2002 2000 2001 Diameter growth rate
(mm yr-1) 1.48 ± 1.83
1.78 ± 2.14
1.99 ± 2.01
3.89 ± 5.48
3.77 ± 6.44
3.63 ± 4.72
2.54 ± 4.00
Minimum individual growth rate (mm yr-1)
-0.4 -0.7 -0.3 -5.0 -14.5 -2.0 -5.9
Maximum individual growth rate (mm yr-1)
8.6 9.8 8.6 49.6 44.4 19.3 36.2
Percentage of all individuals with
negative growth rates 22.8% 19.0% 10.4% 8.9% 11.2% 12.2% 22.4%
Annual total precipitation (mm)
3545.5 2383.3 3177.5 1899.5 1909.9 2594.2 1764.85
Number of dry season months (precipitation < 100 mm month-1)
0 2* 3* 4 4 5* 6
Total precipitation in the dry season (mm)
257.6 96.2 305.2 284.9 239.6 106.5 231.9
Minimum monthly precipitation (mm)
125.5 48.0 71.8 44.05 2.45 2.5 16.7
Maximum monthly precipitation (mm)
736.4 294.4 535.9 471.9 345.25 361.5 313.6
1
* Months not consecutive 2
Mean annual diameter growth increments observed using dendrometer bands in the three permanent plots. Negative growth rates indicate a decrease in tree diameters during the period of study.
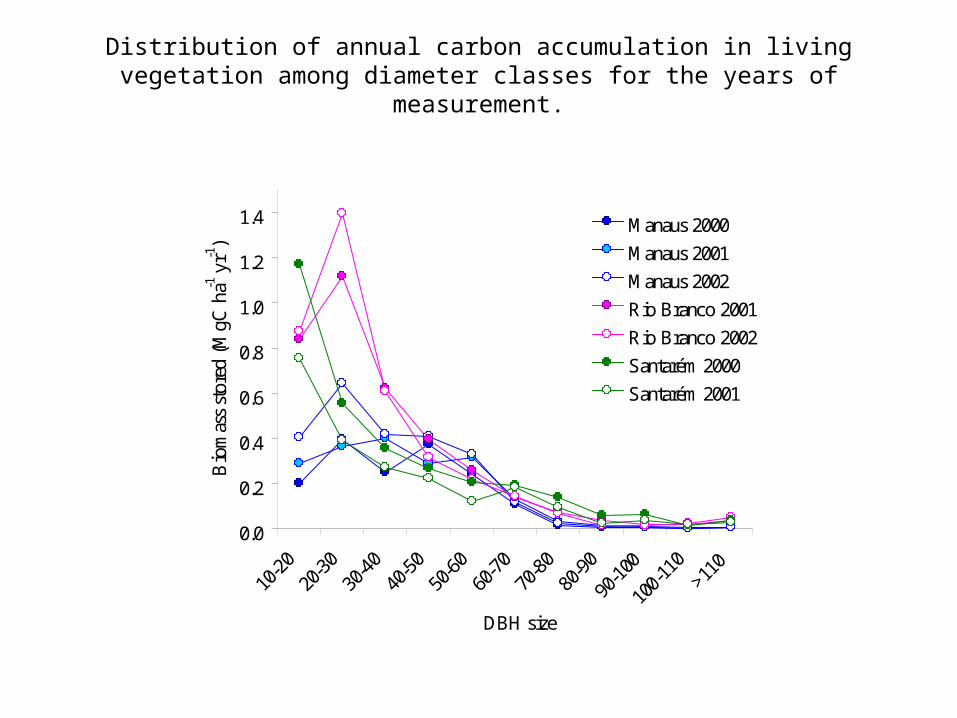
Distribution of annual carbon accumulation in living vegetation among diameter classes for the years of measurement.
0.0
0.2
0.4
0.6
0.8
1.0
1.2
1.4
10-2
020
-30
30-4
040
-50
50-6
060
-70
70-8
080
-90
90-1
00
100-
110
>110
DBH size
Bio
mas
s st
ored
(M
gC h
a-1 y
r-1)
Manaus 2000
Manaus 2001
Manaus 2002
Rio Branco 2001
Rio Branco 2002
Santarém 2000
Santarém 2001

Conclusion:
• marked seasonal growth • trees with diameter >50cm were more affected
by seasons. • the major accumulation C was in the smaller
trees in forests experiencing a longer dry season.
• forests experiencing a longer dry-season have larger annual diameter growth increments for individual trees.