Forest Inventory and Analysis Program of the U.S. Department of Agriculture
33
03/22/22 1 Forest Inventory and Analysis Program of the U.S. Department of Agriculture Michael Williams and Gretchen Moisen Intermountain West Forest Inventory and Analysis Ogden, Utah Ken Winterberger Pacific Northwest Forest Inventory and Analysis Anchorage, Alaska
-
Upload
brett-gould -
Category
Documents
-
view
37 -
download
0
description
Forest Inventory and Analysis Program of the U.S. Department of Agriculture. Michael Williams and Gretchen Moisen Intermountain West Forest Inventory and Analysis Ogden, Utah Ken Winterberger Pacific Northwest Forest Inventory and Analysis Anchorage, Alaska. What is FIA?. - PowerPoint PPT Presentation
Transcript of Forest Inventory and Analysis Program of the U.S. Department of Agriculture
04/19/23 1
Forest Inventory and Analysis Program of the U.S. Department of Agriculture
Michael Williams and Gretchen Moisen
Intermountain West Forest Inventory and Analysis
Ogden, Utah
Ken Winterberger
Pacific Northwest Forest Inventory and Analysis
Anchorage, Alaska
04/19/23 2
What is FIA? “The Census program for the Nation’s
Forest Lands” One of the oldest continuous natural
resource inventories (since 1928) One of the largest natural resource
inventories in the world (3,537,441 square miles=2.26 billion acres)
Ground-based data collection Collects information for all “forest” land
and ownerships
04/19/23 3
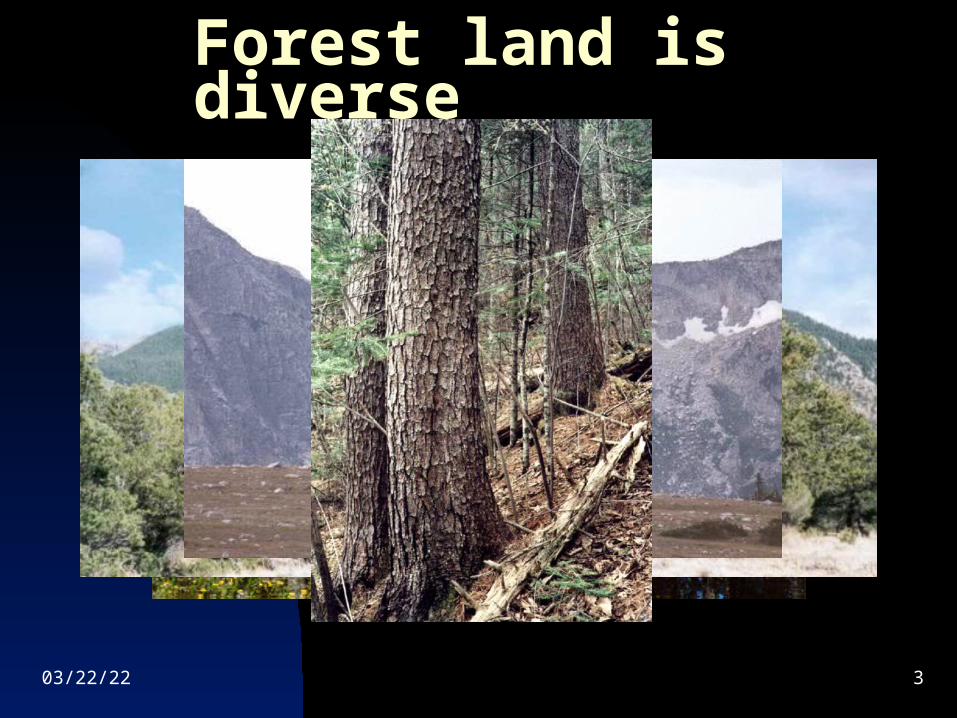
Forest land is diverse

04/19/23 4
Diverse Ownerships
04/19/23 5
04/19/23 6
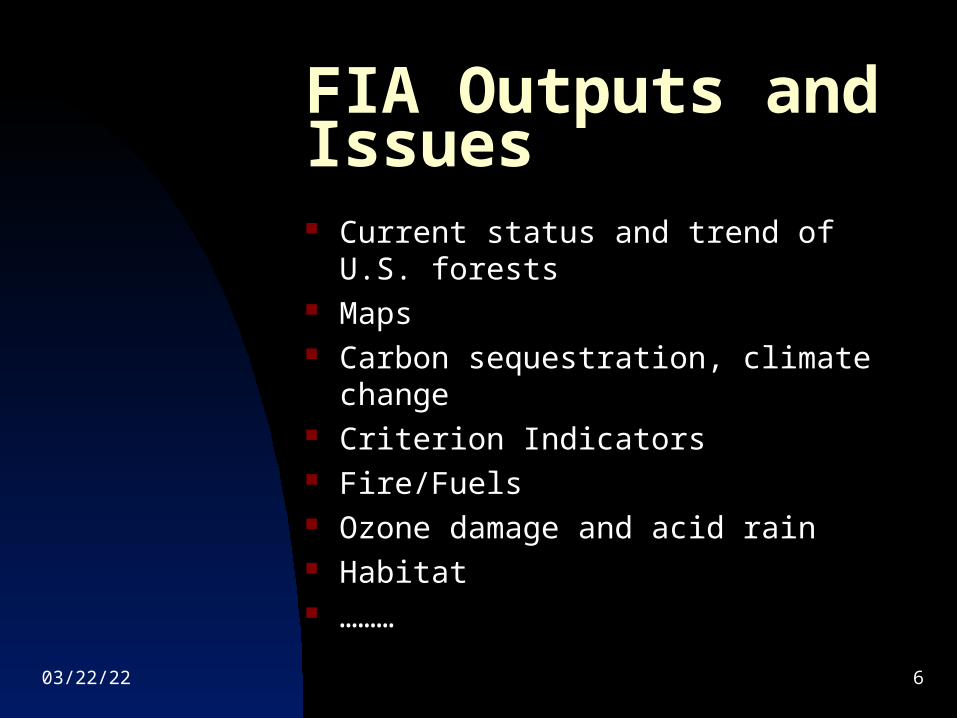
FIA Outputs and Issues
Current status and trend of U.S. forests Maps Carbon sequestration, climate change Criterion Indicators Fire/Fuels Ozone damage and acid rain Habitat ………

04/19/23 7
Topics for Discussion
How FIA has changed The “base” FIA program (P2) Integration of Forest Health
Monitoring (P3) Filling in the “base”
04/19/23 8
Part I: The base FIA
04/19/23 9
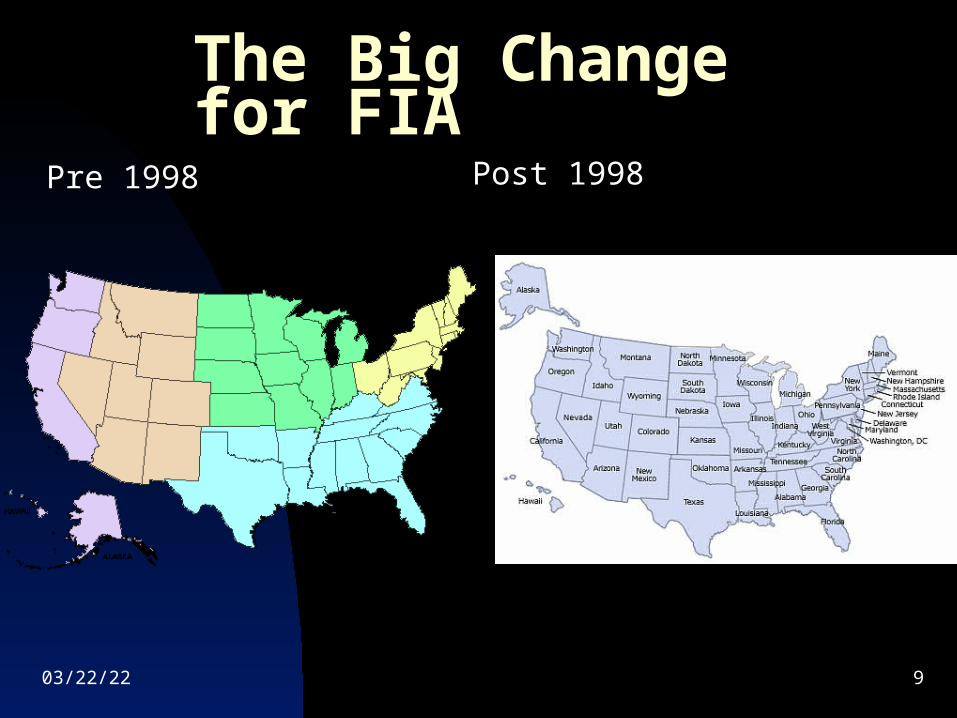
The Big Change for FIAPre 1998 Post 1998
04/19/23 10
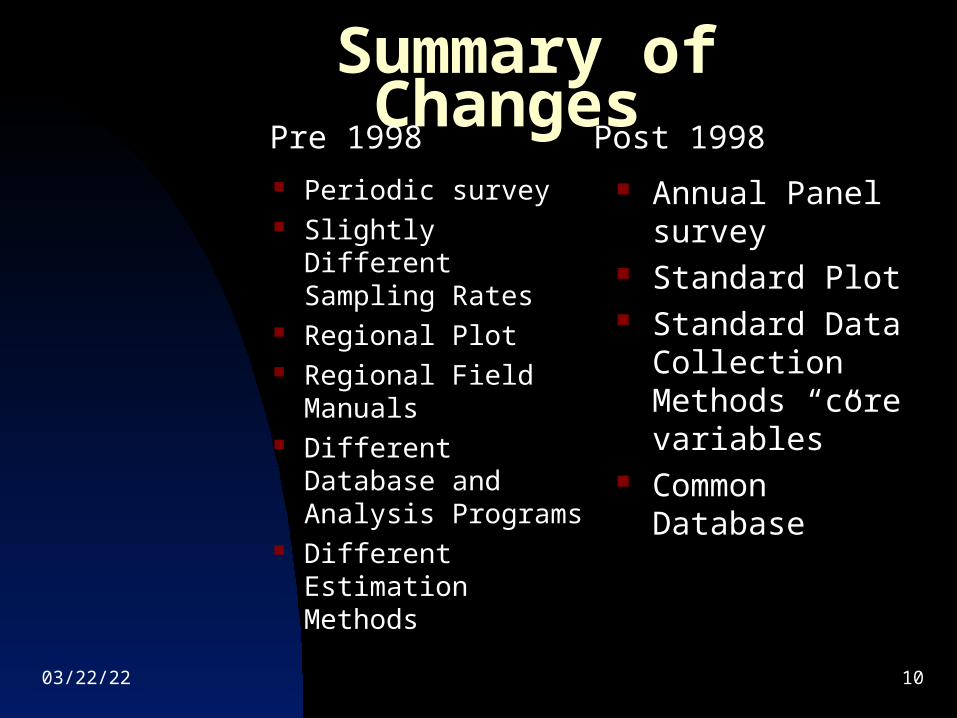
Summary of Changes
Periodic survey Slightly Different
Sampling Rates Regional Plot Regional Field
Manuals Different Database
and Analysis Programs
Different Estimation Methods
Annual Panel survey
Standard Plot Standard Data
Collection Methods “core variables”
Common Database
Post 1998Pre 1998
04/19/23 11
Goals of the New FIA Program
Create a Nationally Consistent Survey (spatial and temporal)
Improved timeliness of information Minimize disruptions (can’t start over) Integrate FIA with Forest Health Monitoring
(FHM) Meet data needs of our diverse group of
customers
04/19/23 12
Goal 1. Spatial Consistency
Consistent “base” sampling rate of ~ 1 plot / 6000 acres
Utilize as many existing sample locations as possible
Be able to change sampling intensity to meet regional goals
Integrate with existing Forest Health Monitoring program
04/19/23 13
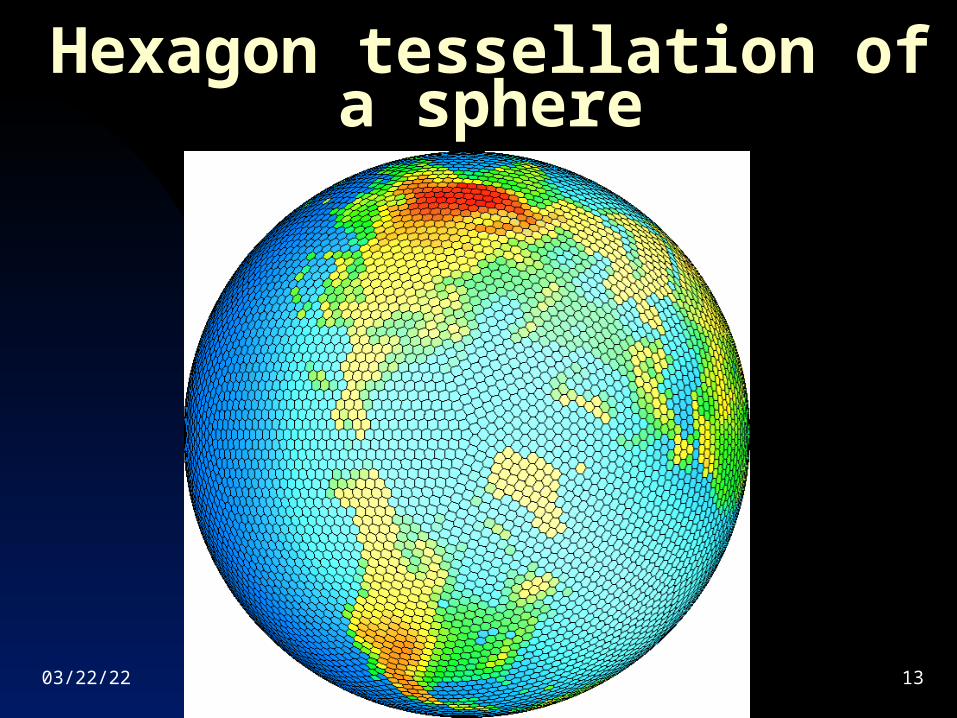
Hexagon tessellation of a sphere
04/19/23 14
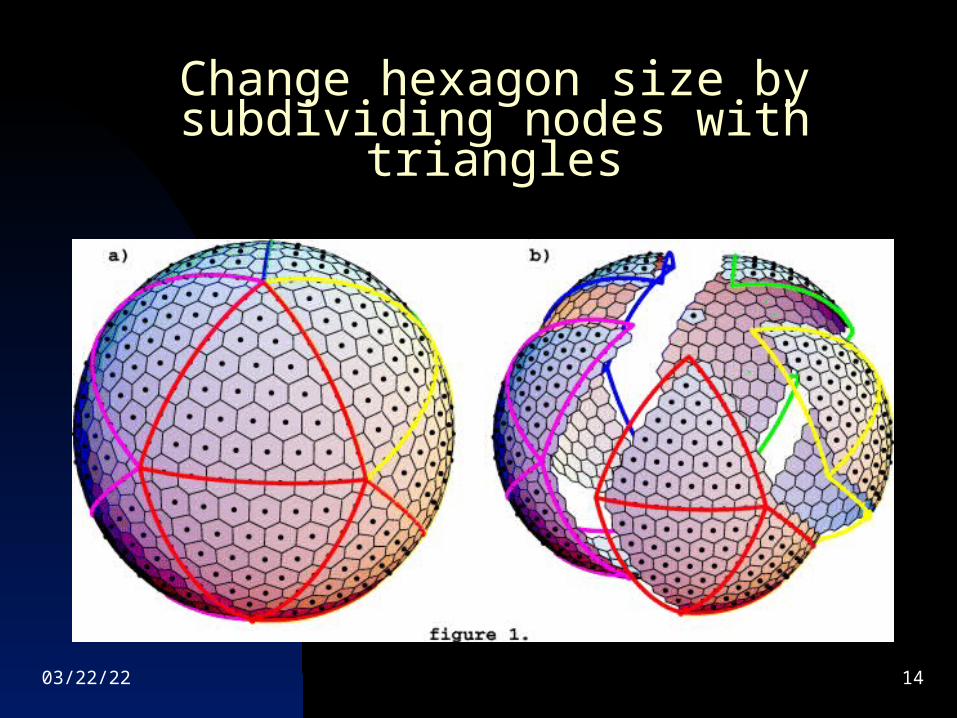
Change hexagon size by subdividing nodes with triangles
04/19/23 15
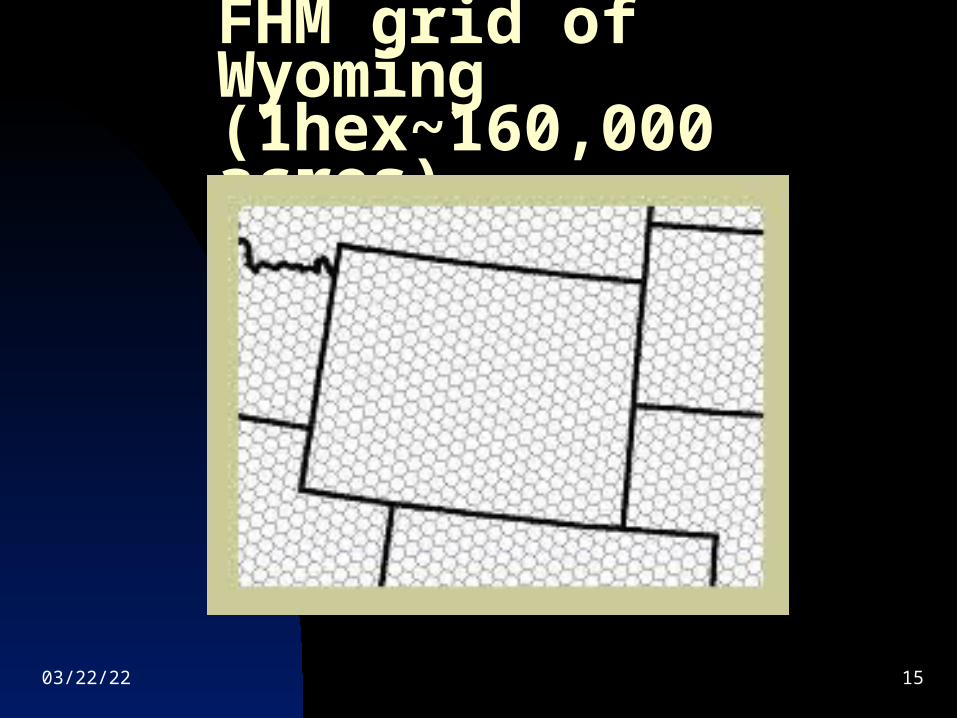
FHM grid of Wyoming (1hex~160,000 acres)
04/19/23 16
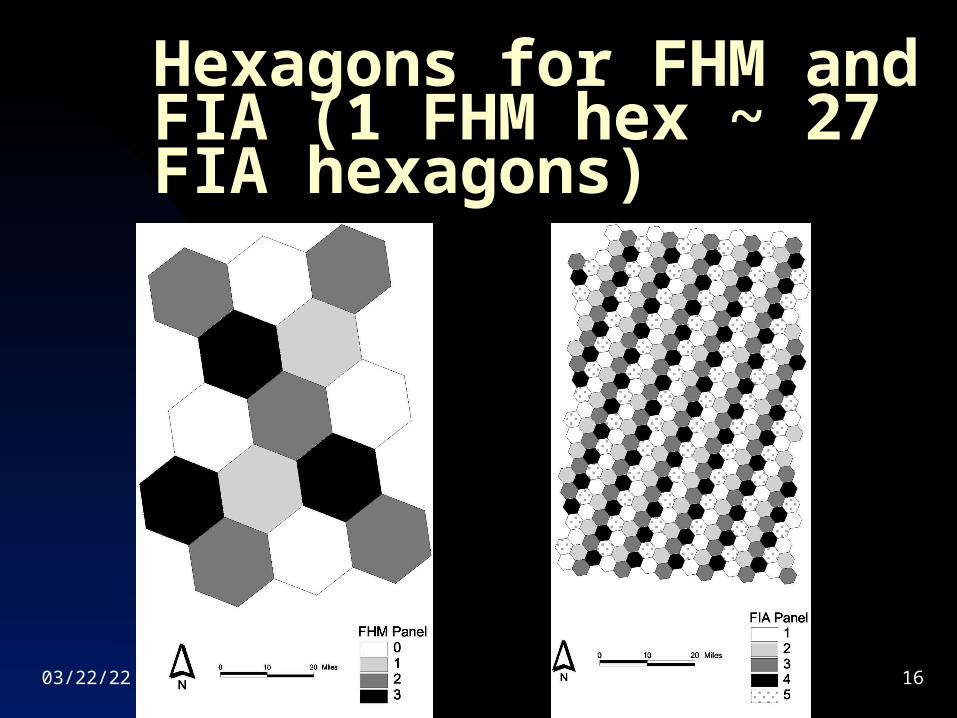
Hexagons for FHM and FIA (1 FHM hex ~ 27 FIA hexagons)
04/19/23 17
Plots selection rules 1. if the FIA hexagon contained an FHM
plot, the existing FHM plot was selected; 2. if not, then an existing FIA plot was
selected; 3. if there were multiple FIA plots in the
hexagon, the one closest to hexagon center was selected and the others were abandoned;
4. if there were no existing FHM or FIA plots in the hexagon, a new sample location was selected based on a random azimuth and distance from hexagon center.
04/19/23 18
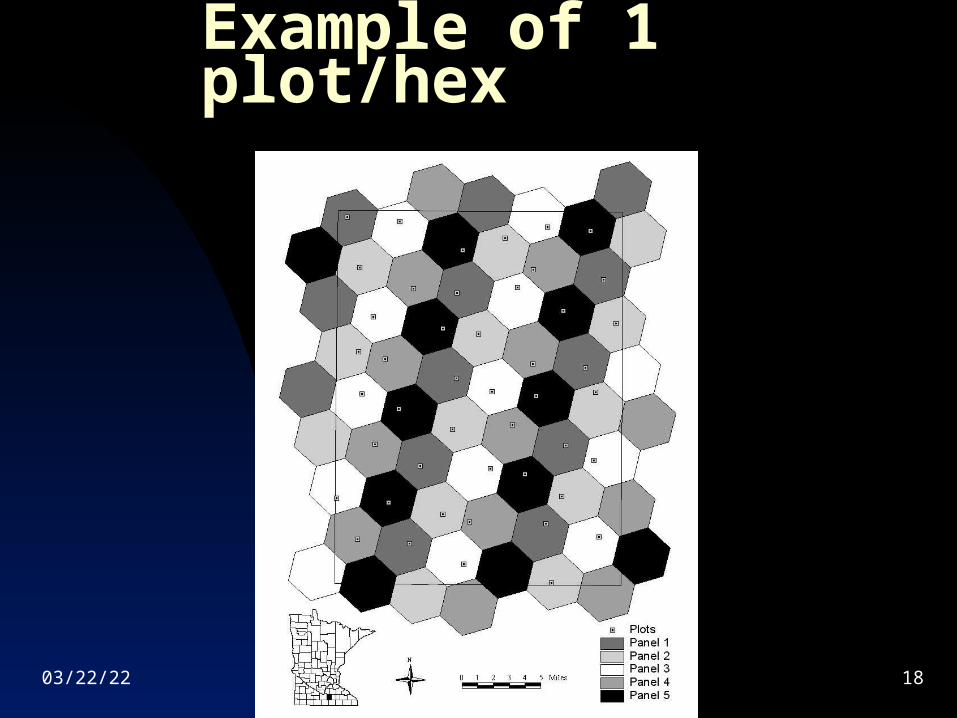
Example of 1 plot/hex
04/19/23 19
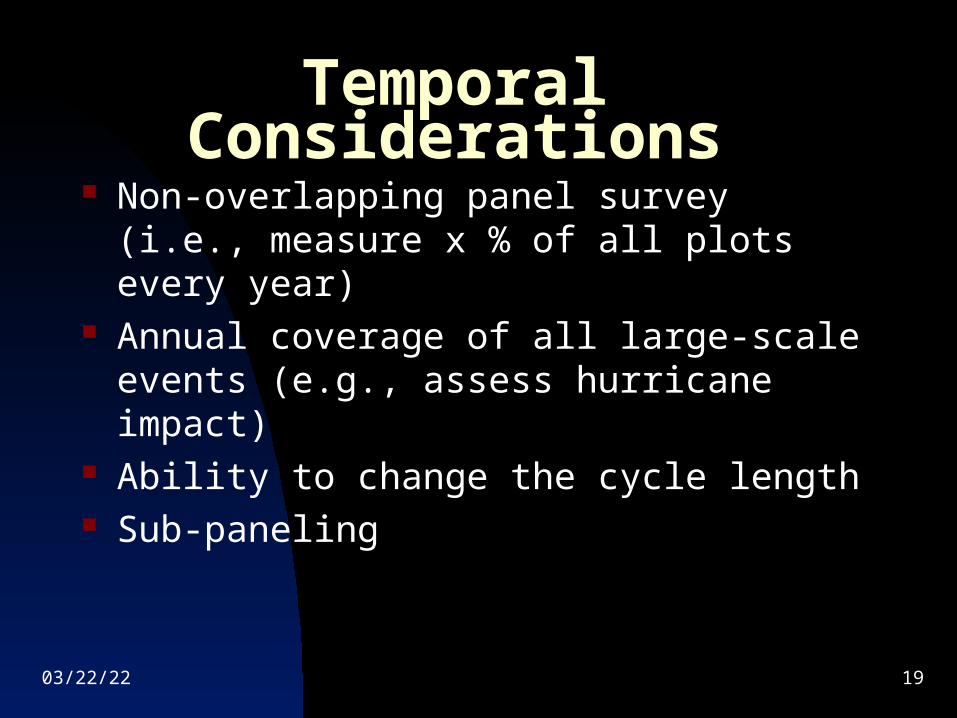
Temporal Considerations Non-overlapping panel survey (i.e., measure
x % of all plots every year) Annual coverage of all large-scale events
(e.g., assess hurricane impact) Ability to change the cycle length Sub-paneling
04/19/23 20
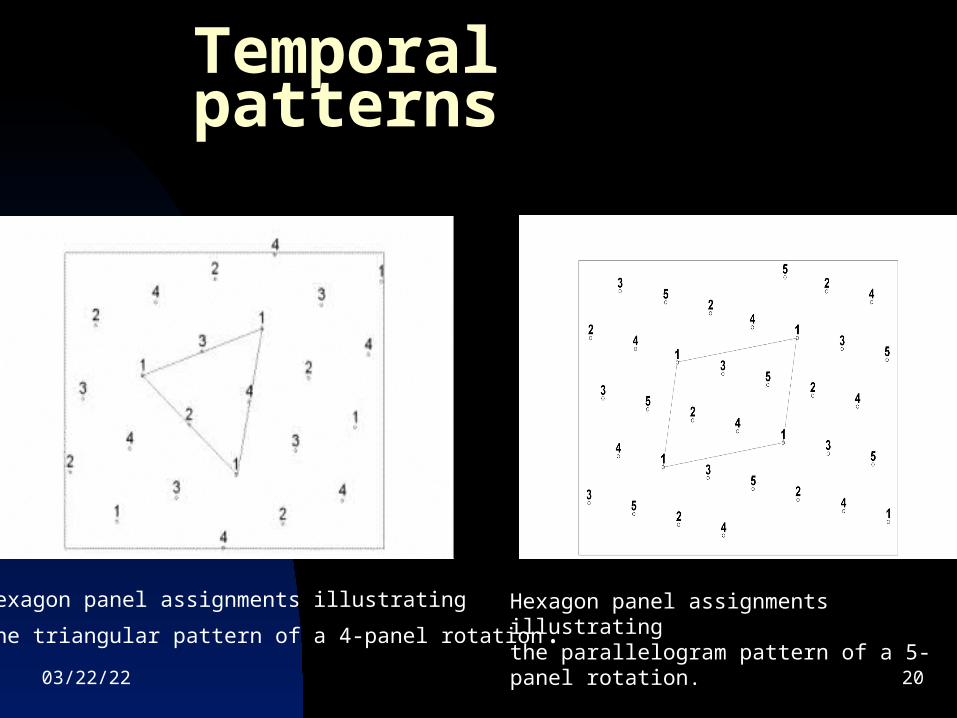
Temporal patterns
Hexagon panel assignments illustrating the parallelogram pattern of a 5-panel rotation.
Hexagon panel assignments illustrating
the triangular pattern of a 4-panel rotation.
04/19/23 21
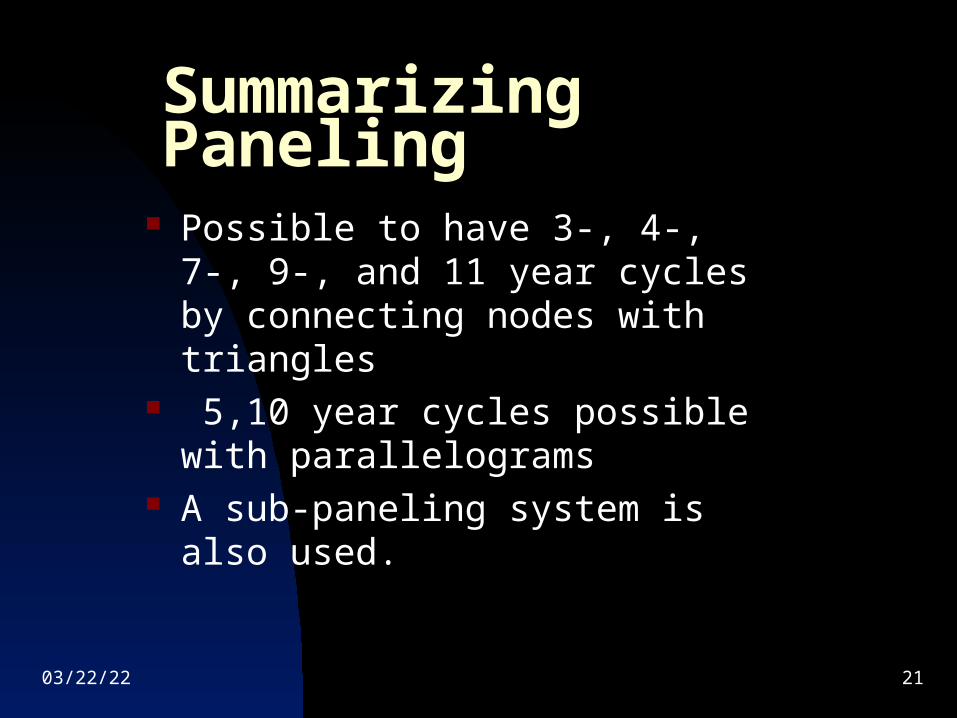
Summarizing Paneling
Possible to have 3-, 4-, 7-, 9-, and 11 year cycles by connecting nodes with triangles
5,10 year cycles possible with parallelograms
A sub-paneling system is also used.
04/19/23 22
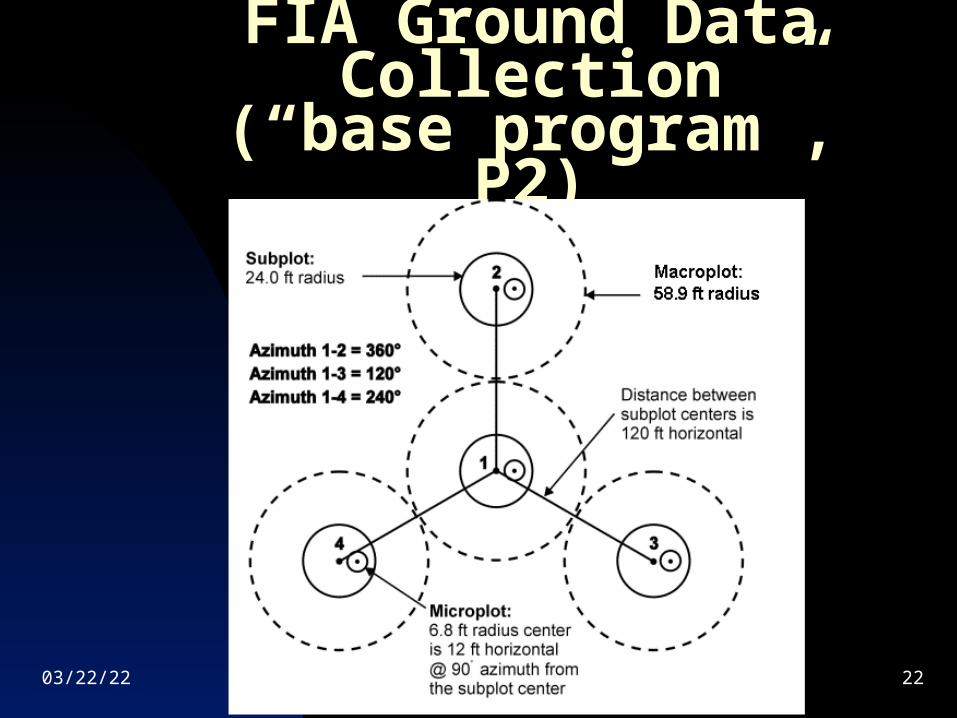
FIA Ground Data Collection(“base program”, P2)
04/19/23 23
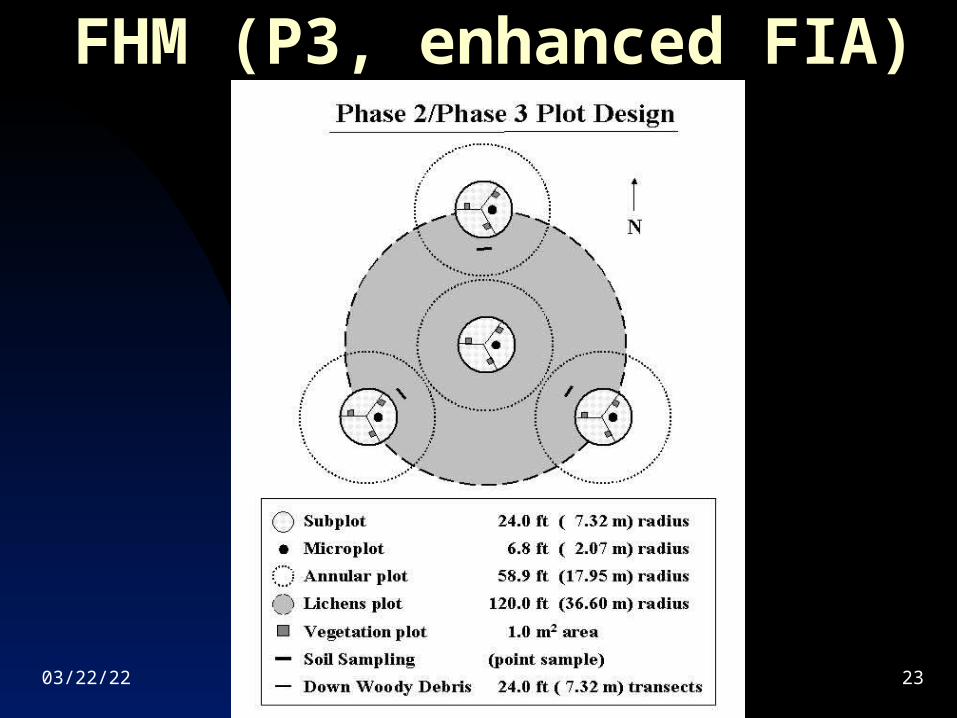
FHM (P3, enhanced FIA)
04/19/23 24
Summary of the sample design
Use auxiliary data (TM, photos,DEM…) for post-stratification of ground data.
Extensive use of FHM framework Provides National consistency Allows substantial flexibility for
regional issues through temporal and spatial intensification.

04/19/23 25
Part II. Beyond the Base

04/19/23 26
Marginal, Mean, and Inaccessible lands
04/19/23 27
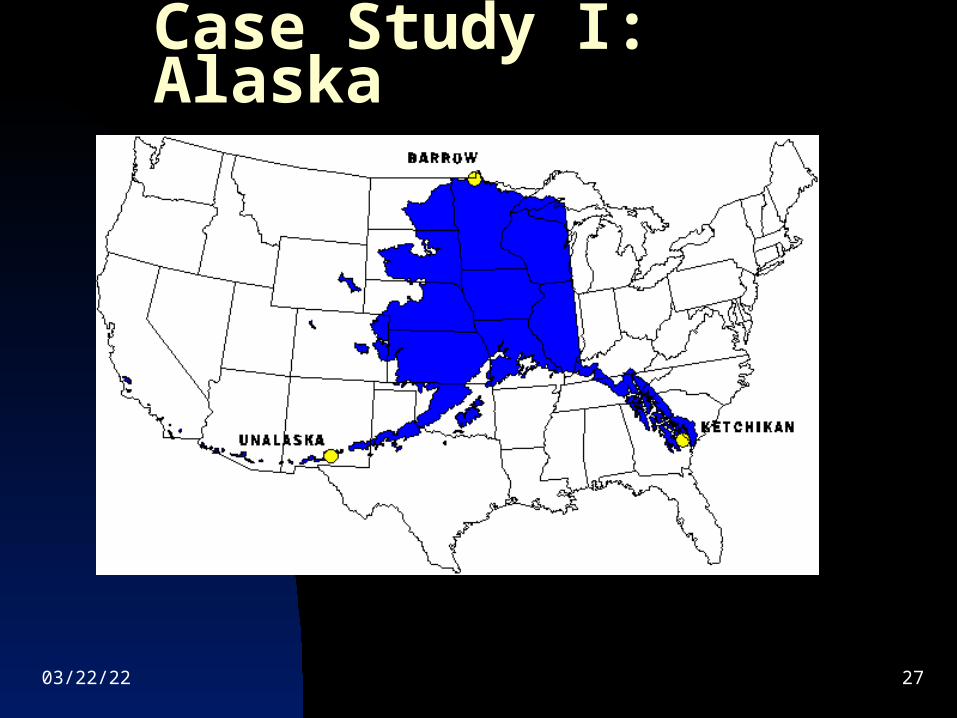
Case Study I: Alaska
04/19/23 28
Reality Check
656,425 square miles =421 million acres = 70,000 FIA plots.
Alaska has 1 mile of road for every 42 square mile (1-to-1 in lower 48)
70 helicopter crews working 90 days for 10 years
N.D. 1 crew,1 Winnebago, 90 days
04/19/23 29
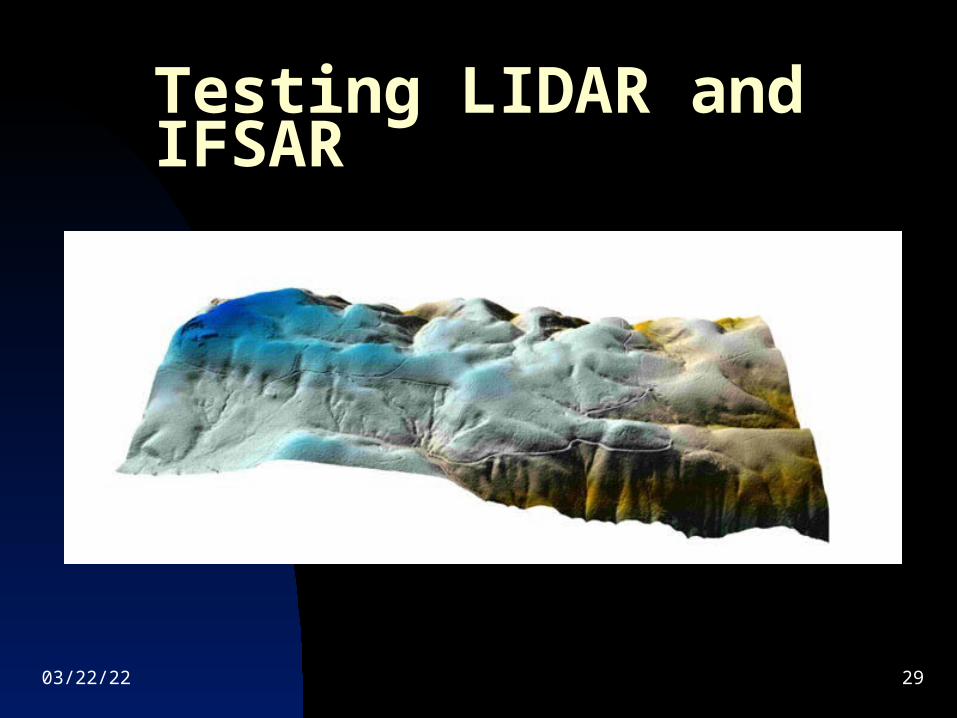
Testing LIDAR and IFSAR

04/19/23 30
Case Study II: Nevada
04/19/23 31
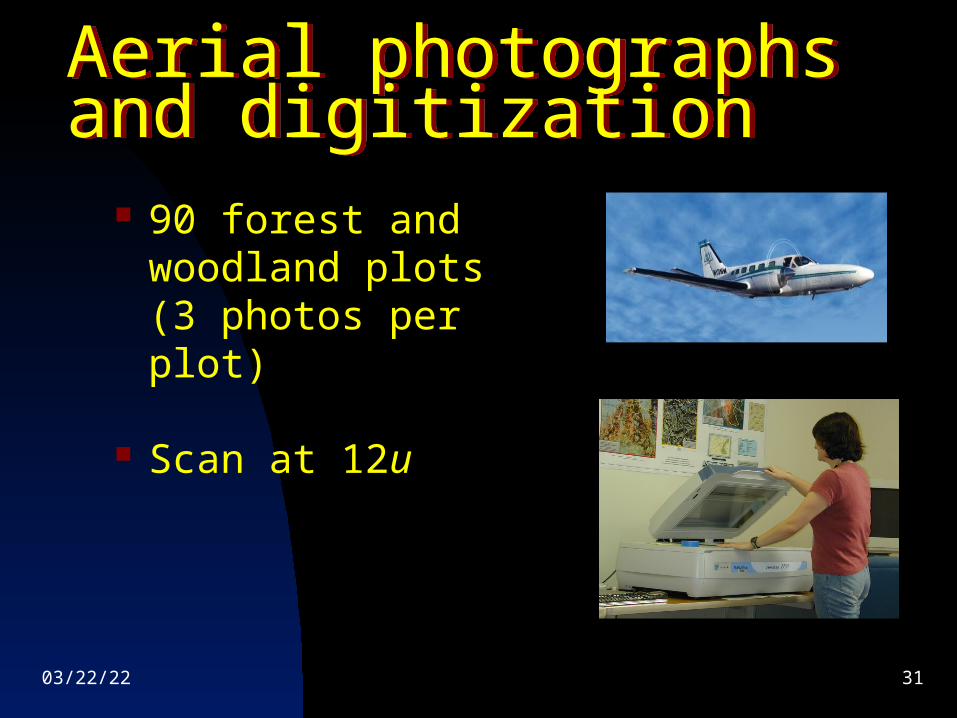
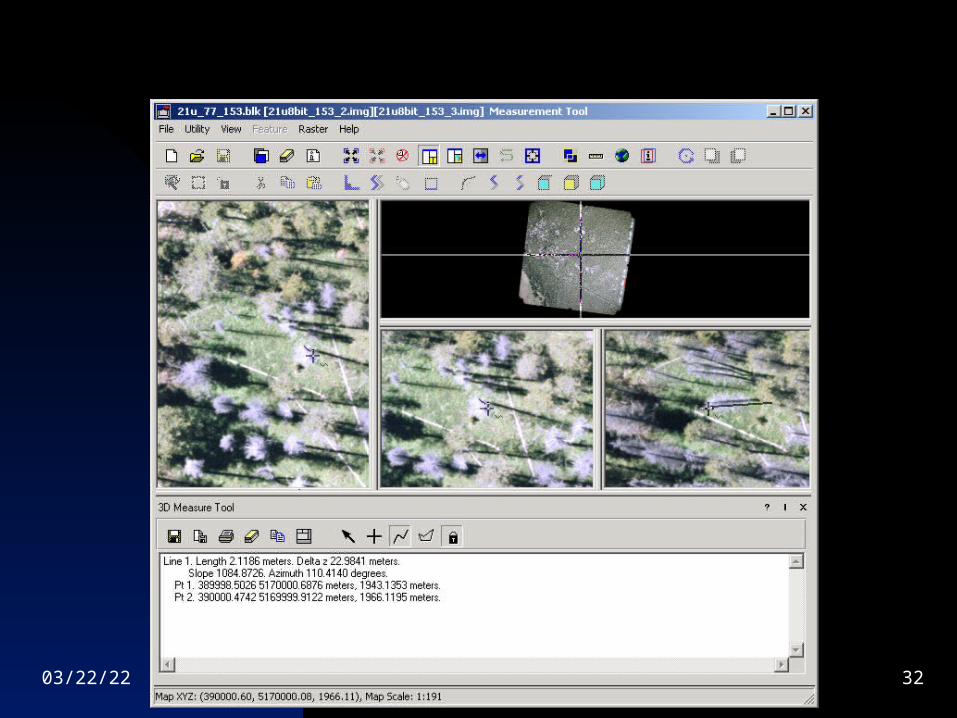
Aerial photographs and digitizationAerial photographs and digitization
90 forest and woodland plots (3 photos per plot)
Scan at 12u
04/19/23 32
04/19/23 33
Summary
FIA has been transformed from a group of regional inventories into a national program.
FIA data are have a multitude of applications
FIA is experimenting with a number of new technologies of expand and improve our products