FOREST ECOSYSTEM RESPONSES TO EDGE EFFECTS AND …orton.catie.ac.cr/repdoc/A1317i/A1317i.pdf ·...
108
FOREST ECOSYSTEM RESPONSES TO EDGE EFFECTS AND SECONDARY FOREST DEVELOPMENT IN NORTHEASTERN COSTA RICA: IMPLICATIONS FOR CONSERVATION A Dissertation Presented in Partial Fulfillment of the Requirements for the Degree of Doctor of Philosophy with a Major in Natural Resources in the College of Graduate Studies University of Idaho and with a Concentration in Tropical Forestry in the Graduate School Centro Agronómico Tropical de Investigación y Enseñanza by Jessica L. Schedlbauer January 2007 Major Professors: Kathleen Kavanagh, Ph.D. and Bryan Finegan, Ph.D.
Transcript of FOREST ECOSYSTEM RESPONSES TO EDGE EFFECTS AND …orton.catie.ac.cr/repdoc/A1317i/A1317i.pdf ·...

FOREST ECOSYSTEM RESPONSES TO EDGE EFFECTS AND SECONDARY
FOREST DEVELOPMENT IN NORTHEASTERN COSTA RICA:
IMPLICATIONS FOR CONSERVATION
A Dissertation
Presented in Partial Fulfillment of the Requirements for the
Degree of Doctor of Philosophy
with a Major in Natural Resources
in the College of Graduate Studies
University of Idaho
and with a Concentration in Tropical Forestry
in the Graduate School
Centro Agronómico Tropical de Investigación y Enseñanza
by
Jessica L. Schedlbauer
January 2007
Major Professors: Kathleen Kavanagh, Ph.D. and Bryan Finegan, Ph.D.

ii
AUTHORIZATION TO SUBMIT DISSERTATION
This dissertation of Jessica L. Schedlbauer submitted for the degree of Doctor of Philosophy
with a major in Natural Resources and titled “Forest ecosystem responses to edge effects and
secondary forest development in northeastern Costa Rica: implications for conservation,” has
been reviewed in final form. Permission, as indicated by the signatures and dates given
below, is now granted to submit final copies to the College of Graduate Studies at the
University of Idaho (UI), and to the Postgraduate School at Centro Agronómico Tropical de
Investigación y Enseñanza (CATIE) for approval.
Major Professor _________________________________ Date ________________ Kathleen Kavanagh (UI) Co-Advisor _________________________________ Date ________________ Bryan Finegan (CATIE) Committee Members _________________________________ Date ________________ John Marshall (UI)
_________________________________ Date ________________ Paul McDaniel (UI) Department Administrator (UI) _________________________________ Date ________________ Jo Ellen Force Discipline’s College Dean (UI) _________________________________ Date ________________ Steven Daley-Laursen Final Approval and Acceptance by the College of Graduate Studies (UI) _________________________________ Date ________________ Margrit von Braun And by the Postgraduate School (CATIE)
_________________________________ Date ________________ Glenn Galloway

iii
ABSTRACT
The landscape of northeastern Costa Rica is characterized by fragmented forests
interspersed with pasture and agricultural land. Knowledge of ecosystem responses to forest
edge effects and the recruitment of new secondary forests is critical to regional conservation
planning directed at increasing forest cover.
Forest structure was examined at 20+ year old forest-pasture edges to assess edge effects.
Stem density was significantly higher at forest edges than interiors due to an increase in
small diameter trees close to edges. These data show that forest edges seal with dense
vegetation in the 20+ years following edge creation, suggesting that edges are robust and
likely to promote high-value environmental services in these forests.
Measures of water-use efficiency (WUE) and stable carbon isotopes (δ13C) were used to
evaluate changes in forest function at edges. No changes in foliar δ13C and thus WUE were
detected in Pentaclethra macroloba, consistent with the theory that these forests develop
resilient edges. A significant depletion in the δ13C of soil respired CO2 was found at forest
edges, and may be linked to changes in species composition.
Forest recruitment and carbon dynamics were examined in a chronosequence of
secondary forests. Though aboveground carbon storage increased with site age, soil carbon
storage did not vary. δ13C data showed that soil carbon turned over within 10 years of
pasture abandonment. Rapid recovery of aboveground carbon storage and soil carbon
cycling highlights the conservation value of these secondary forests.
To evaluate Costa Rica’s 1996 Forestry Law initiating environmental service payments
(pago por servicios ambientales, PSA) and prohibiting deforestation, landcover data were
used to compare forest change before and after 1996. A decline in natural forest loss was
observed after 1996. This indicated that PSA helped to retain forest, a finding corroborated
by landowner data. Increased forest connectivity over time was related to recruitment of tree
plantations and secondary forests. Secondary forest carbon storage approached primary
forest levels after 25-30 years, but few landowners retained natural regeneration. As a result,
secondary forests will persist as minor landscape components without incentives. This case
study provides evidence that PSA can be effective in retaining natural forest.

iv
ACKNOWLEDGEMENTS
Thanks to my major professor, Katy Kavanagh, for providing me with the freedom to
find my own way, as promised during one of our first conversations. Thanks also to Bryan
Finegan, my co-advisor at CATIE, for his continued interest, enthusiasm, and dedication.
The support and encouragement of both Katy and Bryan has been invaluable in the
completion of this research. John Marshall and Paul McDaniel, as my other two committee
members, were always available to discuss various questions as the need arose. Their
feedback and suggestions have been an important part of this work.
Many people at CATIE were instrumental in providing logistical support and assistance
in the field, both on the ground and up in the trees, including Edwin Pereira, Diego Delgado,
Leonel Coto, and Gerardo Barquero. Others who assisted with fieldwork include Eduardo
Zamora, Marvin Zamora, Vicente Herra, José Manuel Ulate, Aki Koyama, and Ryan Toohey.
Thanks to those at FUNDECOR for their unwavering support of this research, particularly
Germán Obando and Andrés Sanchún. Without their extensive knowledge of the Sarapiquí
landscape, I would still be looking for field sites. I am grateful to many landowners in the
Sarapiquí region who provided me access to their farms and forests.
Many people helped me to stay on top of things by handling my samples while I was
busy getting my hands dirty in the field. Stacy Sesnie, Benjamin Jerabek Miller, Erika
Barrientos, and Bertha Gonzalez help process and analyze agonizingly small, but important
Pentaclethra macroloba foliage samples. Yaneth Sanchez assisted by processing many soil
samples. Bob Brander, formerly of the Idaho Stable Isotopes Laboratory, was a steady and
reliable presence in the lab, and I am grateful for his assistance. Kirsten Stephan and Becki
Saari helped process samples for isotopic analysis when I was either too busy or too far away
to do it myself. Jennifer Nalder’s fast fingers helped tremendously in packing many soil and
foliage samples.
Thanks to Robin Chazdon and Juan Pablo Arroyo for being generous enough to share
both data and their rare 20+ year old secondary forest field sites with me. Thanks also to
Paulo Olivas for providing LAI data from a study at the La Selva Biological Station. Nelson
Zamora and staff at INBio assisted in identifying the many uncommon woody species we
encountered in Sarapiquí’s secondary forests.

v
I am grateful to Manuel Guariguata, Jorge Meave, and one anonymous reviewer for their
insightful comments on earlier versions of Chapter 1. Steve Blecker provided a review of an
earlier version of Chapter 3, after being talked into it late one night in Memphis. I gratefully
acknowledge all co-authors on the integrated team paper that is Chapter 4. I would
particularly like to thank Celia Harvey, Bryan Finegan, and J.D. Wulfhorst for their
tremendous efforts to ensure the success of this research. This work could never have been
completed without the valuable contributions of my teammates, Steve Sesnie and Wayde
Morse. Efforts related to data collection described in Chapter 4 were aided by Oscar Quirós
and Jhonny Méndez, both of CODEFORSA, as well as Sandra Candela, Isabel Venegas,
Zayra Ramos, Hugo Brenes, and Pablo Acuna.
I’d like to extend thanks to many students with whom I’ve shared my tenure at the
University of Idaho and CATIE. In particular, I would like to thank Steve Sesnie, Amy
Pocewicz, Kirsten Stephan, Aki Koyama, Rob Pangle, and Nerea Ubierna. These individuals
have provided help and support, as well as many useful discussions over the past four years.
Finally, thanks to my family for their continued support of my choices to pursue research in
new and exciting places.
Support for the research described in this dissertation was provided by a fellowship from
the National Science Foundation’s Integrative Graduate Education and Research Traineeship
(IGERT) program; grant number 0014304 to the University of Idaho.

vi
TABLE OF CONTENTS
Authorization to submit dissertation......................................................................................... ii
Abstract .................................................................................................................................... iii
Acknowledgements.................................................................................................................. iv
Table of contents...................................................................................................................... vi
List of tables........................................................................................................................... viii
List of figures........................................................................................................................... ix
Introduction to the Dissertation ............................................................................................... xi
Chapter 1: Rainforest structure at forest – pasture edges in northeastern Costa Rica ............ 1
Abstract ............................................................................................................................... 1
Introduction......................................................................................................................... 1
Methods............................................................................................................................... 3
Results................................................................................................................................. 6
Discussion........................................................................................................................... 7
Acknowledgements........................................................................................................... 10
References......................................................................................................................... 11
Tables................................................................................................................................ 15
Figures............................................................................................................................... 17
Chapter 2: Water-use efficiency and δ13C as indicators of forest edge effects in
northeastern Costa Rica .......................................................................................................... 20
Abstract ............................................................................................................................. 20
Introduction....................................................................................................................... 20
Methods............................................................................................................................. 23
Results............................................................................................................................... 27
Discussion......................................................................................................................... 28
Acknowledgements........................................................................................................... 32
References......................................................................................................................... 32
Tables................................................................................................................................ 37
Figures............................................................................................................................... 39
Chapter 3: Soil carbon dynamics in a chronosequence of secondary forests in
northeastern Costa Rica .......................................................................................................... 42
vii
Abstract ............................................................................................................................. 42
Introduction....................................................................................................................... 42
Methods............................................................................................................................. 44
Results............................................................................................................................... 47
Discussion......................................................................................................................... 48
Conclusions....................................................................................................................... 53
Acknowledgements........................................................................................................... 54
References......................................................................................................................... 54
Tables................................................................................................................................ 59
Figures............................................................................................................................... 62
Chapter 4: Consequences of environmental service payments for forest retention and
recruitment in a Costa Rican biological corridor.................................................................... 67
Abstract ............................................................................................................................. 67
Introduction....................................................................................................................... 67
Study Area ........................................................................................................................ 69
Methods............................................................................................................................. 70
Results and Discussion ..................................................................................................... 75
Conclusions....................................................................................................................... 81
Acknowledgements........................................................................................................... 82
References......................................................................................................................... 82
Tables................................................................................................................................ 87
Figures............................................................................................................................... 90

viii
LIST OF TABLES
Chapter 1
Table 1. Site characteristics for the six study sites ........................................................... 15
Table 2. Mean ± one standard error of leaf area index, global site factor, and canopy openness relative to distance to the forest edge ................................................................ 16
Chapter 2
Table 1. Within-leaf variation in δ13C measured for eight individual trees...................... 37
Table 2. Mean LMA, Nmass, and Narea ± one standard error for canopy and understory foliage as a function of distance to the forest edge........................................................... 38
Chapter 3
Table 1. Site history information for all sites in the chronosequence of secondary succession ......................................................................................................................... 59
Table 2. Mean ± one standard error of mineral soil carbon storage for each study site and sampling depth ........................................................................................................... 60
Table 3. Parameter estimates and standard errors for the logistic growth model used to predict mineral soil δ13C over time at each soil depth ...................................................... 61
Chapter 4
Table 1. Forest change for T1 and T2 by forest type........................................................ 87
Table 2. Fragmentation indices for the Corridor landscape and individual forest classes ............................................................................................................................... 88
Table 3. Mean mineral soil carbon storage ± one standard error across all land use types and soil depths ......................................................................................................... 89

ix
LIST OF FIGURES
Chapter 1
Figure 1. Map of the study area within Costa Rica........................................................... 17
Figure 2. Mean ± one standard error of (a) stem density, (b) basal area, and (c) AGBM for trees and palms in relation to the distance of each plot from the forest edge.. ........... 18
Figure 3. Mean ± one standard error of (a) stem density, (b) basal area, and (c) AGBM for trees in five diameter classes in relation to the distance of each plot from the forest edge ................................................................................................................................... 19
Chapter 2
Figure 1. Mean δ13Cleaf ± one standard error of Pentaclethra macroloba canopy and understory foliage as a function of distance to the forest edge......................................... 39
Figure 2. Estimated WUE ± one standard error for Pentaclethra macroloba canopy and understory foliage as a function of distance to the forest edge.. ................................ 40
Figure 3. δ13Csoil and δ13CR-soil ± one standard error as a function of distance to the forest edge......................................................................................................................... 41
Chapter 3
Figure 1. Mineral soil carbon storage ± one standard error for charral and secondary forest sites at soil depths of (a) 0-10, (b) 10-20, and (c) 20-30 cm................................... 62
Figure 2. Mean mineral soil carbon storage at each of the three soil depths plotted against mean aboveground carbon storage in the nine secondary forest sites.. ................ 63
Figure 3. Mineral soil δ13C ± one standard error for charral and secondary forest sites at soil depths of (a) 0-10, (b) 10-20, and (c) 20-30 cm..................................................... 64
Figure 4. Mean δ13C of soil respired CO2 ± one standard error for all charral and secondary forest sites ........................................................................................................ 65
Figure 5. Mean mineral soil δ13C at depths of (a) 0-10, (b) 10-20, and (c) 20-30 cm vs. mean δ13C of soil respired CO2 for all pasture, charral, and secondary forest sites.. ...... 66
Chapter 4
Figure 1. Map of the San Juan – La Selva Biological Corridor, connecting national parks and protected areas, and the larger study area......................................................... 90
Figure 2. Area differences for each time interval for (a) the five forest categories and (b) two agricultural categories observed at the extent of the study area (6,349 km2) and the San Juan – La Selva Biological Corridor (2,425 km2).. ....................................... 91
Figure 3. Mapped forest cover in the San Juan – La Selva Biological Corridor depicting major landscape changes at each time interval ................................................. 92
Figure 4. Amount of pasture converted to another forest or landcover type in the San Juan – La Selva Biological Corridor during time periods T1 and T2............................... 93

x
Figure 5. Mean aboveground carbon storage ± one standard error for each secondary forest site.. ......................................................................................................................... 94

xi
INTRODUCTION TO THE DISSERTATION
The Sarapiquí region of Costa Rica, located in the country’s northeastern Atlantic
lowlands, has been the site of rapid land use change since its opening as a frontier in the
1950’s (Butterfield 1994). Forests were initially cleared to make way for cattle pastures,
though more recent changes have increased landscape heterogeneity as agricultural export
crops such as bananas and pineapple were introduced. These land use changes have created a
fragmented forest landscape, a situation that provides the opportunity to pose ecological
questions about how land use change affects forests on this landscape. The research
described in this dissertation was designed to address these issues.
Chapters 1 and 2 of the dissertation describe patterns of forest structural and functional
changes in relation to forest edge effects. Tropical forest fragmentation has led to the
development of heterogeneous landscapes with many boundaries between land use types. In
the Sarapiquí region, forest-pasture edges are a common type of boundary, and one that may
affect forest structure and function across the landscape. The responses of forests to edge
effects vary with time since edge creation as well as across ecosystems. Reported mid-term
edge effects range from severe loss of aboveground biomass and edge erosion (Ferreira and
Laurance 1997, Laurance et al. 1998) to edge stabilization and sealing by vegetation
(Williams-Linera 1990, Williams-Linera et al. 1998).
Chapter 1 evaluates changes in the forest structural parameters stem density, basal area,
and aboveground biomass along forest edge to interior transects. This chapter also includes
data derived from hemispherical photographs to examine understory light environments
along forest edge to interior gradients. Chapter 2 takes a different approach to edge effects
and examines forest functional changes through the use of stable carbon isotopes (δ13C).
Specifically, δ13C data were used to infer water-use efficiency in canopy and understory
trees. δ13C values were also measured in mineral soil and soil respired CO2 along forest edge
to interior transects to determine whether patterns in δ13C in the forest canopy were evident
belowground.
Chapter 3 addresses soil carbon storage and turnover in a chronosequence of secondary
forests developing on abandoned pasture. The evergreen tropics store approximately one-
fifth of the world’s soil carbon (Jobbágy and Jackson 2000), representing a significant carbon
pool. Land use change in the tropics from forest to agriculture often results in significant

xii
losses of soil carbon (Schlesinger 1997), a process that can have far-reaching global
consequences. When this pattern is reversed and secondary forests recover on abandoned
agricultural land, increases in soil carbon storage can occur (Rhoades et al. 2000, Feldpausch
et al. 2004) and may be accompanied by carbon cycle recovery (de Camargo et al. 1999).
However, this pattern has only been documented at a limited number of sites and many
region- and site-specific factors (e.g. topography, soil mineralogy) influence the distribution
and retention of carbon in soils (Post and Kwon 2000). As secondary forests become
increasingly common in the tropics following agricultural land abandonment (Wright 2005),
their potential to store and cycle carbon must be studied regionally. As such, mineral soil
carbon storage as well as mineral soil and soil respired CO2 δ13C values were measured in the
surface soils (0-30 cm) of sites in Sarapiquí with naturally regenerating secondary vegetation.
Chapter 4 is an interdisciplinary chapter that includes elements of land cover change,
social science, and ecosystem ecology. The focus of this chapter is on the influences of
Costa Rica’s 1996 Forestry Law and environmental service payment program (pago por
servicios ambientales, PSA) on forest retention and recruitment in a biological corridor. As
forest loss and fragmentation increase globally, threats to biodiversity, ecosystem processes,
and human welfare also rise (Millennium Ecosystem Assessment 2005). Environmental
service payments to landowners have recently emerged as a mechanism to protect forests and
associated resources on privately owned land (Pagiola et al. 2002). While this approach has
been promoted internationally, little information exists to evaluate the efficacy of payment
programs to protect and restore forests. As a case study, Costa Rica provides a prime
example of a country that has incorporated environmental service payments on >500,000 ha
of land with payments totaling more than US$124 million since 1996 (FONAFIFO 2006).
The country’s current PSA program was initiated with a 1996 Forestry Law that also
provided a legal definition of forest and prohibited the clearing of forest land. PSA is
available to landowners participating in forest protection and reforestation programs designed
to support biodiversity conservation, carbon sequestration, watershed protection, and
aesthetic values (Snider et al. 2003).
To examine the influence of PSA and the ban on forest clearing initiated by the 1996
Forestry Law, changes in forest cover within Costa Rica’s San Juan – La Selva Biological
Corridor were examined before and after implementation of the law. Retention of natural

xiii
forest as well as recruitment of forests via tree plantations and secondary forest development
were observed from classified Landsat TM images. Landowner surveys directed at both PSA
participants and non-participants were used to corroborate changes observed in the landcover
change analysis. Finally, aboveground and belowground carbon storage in secondary forests
was examined to provide baseline data for the region, given the potential of these forests to
meet PSA program objectives.
All chapters in this dissertation are formatted as manuscripts to be submitted for
publication. Chapter 1 was accepted for publication at the journal Biotropica with Drs.
Bryan Finegan and Kathleen Kavanagh as co-authors. Chapter 2 was submitted to the
journal Oecologia with Dr. Kathleen Kavanagh as a co-author. Chapter 3 has been submitted
to the journal Global Change Biology with Dr. Kathleen Kavanagh as a co-author. Chapter 4
will be submitted to the journal Landscape Ecology and is the result of a collaborative
interdisciplinary effort by three doctoral students in the University of Idaho/CATIE IGERT
Program, Steven Sesnie, Wayde Morse, and myself. This chapter will appear in each of our
dissertations. Other co-authors on this chapter include Drs. Bryan Finegan, Celia Harvey,
Steven Hollenhorst, Kathleen Kavanagh, Dietmar Stoian, and J.D. Wulfhorst.
REFERENCES
Butterfield, R.P. 1994. The regional context: land colonization and conservation in Sarapiquí.
Pages 299-306 in L.A. McDade, K.S. Bawa, H.A. Hespenheide, and G.S. Hartshorn, eds.
La Selva: Ecology and Natural History of a Neotropical Rain Forest. Chicago: The
University of Chicago Press.
de Camargo, P.B., S.E. Trumbore, L.A. Martinelli, E.A. Davidson, D.C. Nepstad, and R.L.
Victoria. 1999. Soil carbon dynamics in regrowing forests of eastern Amazonia. Global
Change Biology 5:693-702.
Feldpausch, T.R., M.A. Rondon, E.C.M. Fernandes, S.J. Riha, and E. Wandelli. 2004.
Carbon and nutrient accumulation in secondary forests regenerating on pastures in central
Amazonia. Ecological Applications 14:S164-S176.
Ferreria, L.V. and W.F. Laurance. 1997. Effects of forest fragmentation on mortality and
damage of selected trees in central Amazonia. Conservation Biology 11:797-801.

xiv
FONAFIFO. 2006. Estadisticas PSA 1997-2005. http://www.fonafifo.com/paginas_espanol/
servicios_ambientales/sa_estadisticas.htm
Jobbágy, E.G. and R.B. Jackson. 2000. The vertical distribution of soil organic carbon and its
relation to climate and vegetation. Ecological Applications 10:423-436.
Laurance, W.F., L.V. Ferreira, J.M. Rankin-de Merona, and S.G. Laurance. 1998. Rain forest
fragmentation and dynamics of Amazonian tree communities. Ecology 79:2032-2040.
Millennium Ecosystem Assessment. 2005. Ecosystems and human well-being: synthesis.
Washington, D.C.: Island Press.
Pagiola, S., N. Landell-Mills, and J. Bishop. 2002. Market-based mechanisms for forest
conservation and development. Pages 1-13 in S. Pagiola, J. Bishop, and N. Landell-Mills,
eds. Selling Forest Environmental Services: Market-Based Mechanisms for Conservation
and Development. Sterling, VA: Earthscan Publications Ltd.
Post, W.M. and K.C. Kwon. 2000. Soil carbon sequestration and land-use change: processes
and potential. Global Change Biology 6:317-327.
Rhoades, C.C., G.E. Eckert, and D.C. Coleman. 2000. Soil carbon differences among forest,
agriculture, and secondary vegetation in lower montane Ecuador. Ecological Applications
10:497-505.
Schlesinger, W.H. 1997. Biogeochemistry. New York: Academic Press.
Snider, A.G., S.K. Pattanayak, E.O. Sills, and J.L. Schuler. 2003. Policy innovations for
private forest management and conservation in Costa Rica. Journal of Forestry 101:18-
23.
Williams-Linera, G. 1990. Vegetation structure and environmental conditions of forest edges
in Panama. Journal of Ecology 78:356-373.
Williams Linera, G., V. Domínguez-Gastelú, and M.E. García-Zurita. 1998.
Microenvironment and floristics of different edges in a fragmented tropical rainforest.
Conservation Biology 12:1091-1102.
Wright, S.J. 2005. Tropical forests in a changing environment. Trends in Ecology and
Evolution 20:553-560.
1
CHAPTER 1. RAINFOREST STRUCTURE AT FOREST - PASTURE EDGES IN NORTHEASTERN
COSTA RICA
Abstract
Land use change in the Sarapiquí region of Costa Rica has resulted in a fragmented forest
landscape with abrupt edges between forest and pasture. Forest responses to edge effects
vary widely and can significantly affect ecosystem integrity. Our objective was to examine
forest structure at 20+ yr old forest-pasture edges in Sarapiquí. Three transects with 0.095 ha
plots at seven distances from forest edges were established in each of six forest patches.
Stem density, basal area, and aboveground biomass in trees and palms ≥ 10 cm diameter at
breast height were measured in all plots. Additionally, hemispherical photographs were
taken to determine leaf area index, understory light availability, and percent canopy
openness. Linear mixed-effects models showed significantly higher tree stem density at
forest edges, relative to interiors, a pattern reflected by increased stem density, basal area,
and aboveground biomass in small diameter trees (≤ 20 cm) growing near edges. No
differences in total tree basal area, aboveground biomass, or hemispherical photograph-
derived parameters were detected across the forest edge to interior gradient. The recruitment
of small diameter trees following edge creation has contributed to the development of dense
vegetation at the forest edge and has aided in the maintenance of similar tree basal area and
aboveground biomass between edge and interior environments. These data reflect on the
robustness of forest edges in Sarapiquí, a characteristic that will likely minimize future
detrimental edge effects and promote a number of high-value environmental services in these
forests.
Introduction
Global patterns of land use change have significantly altered forested landscapes by
increasing fragmentation, a process that has been concurrent with a rise in the abundance of
forest edges on the landscape. Edge zones may have positive, negative, or neutral effects on
abiotic and biotic factors within a forest due to the complexity of interacting factors at these
boundaries (Murcia 1995, Ries et al. 2004). Further, edge effects may vary with time
following edge creation as newly created abiotic and biotic gradients at forest edges give rise
to further edge responses.

2
A common response at newly created edges is increased tree mortality (Williams-Linera
1990a, Chen et al. 1992, Ferreira & Laurance 1997, Laurance et al. 1998, Harper &
Macdonald 2002), a change that may lead to further structural changes and influence plant
and animal distributions, abundance, and diversity (Pearman 1997, Spies 1998, Beier et al.
2002). Newly created edges and new treefall gaps close to the forest edge increase
understory light availability and give rise to enhanced seedling and sapling growth (Fetcher
et al. 1983, Chen et al. 1992, Williams-Linera 1990b, Sizer & Tanner 1999). This widely
reported response to forest fragmentation is often short-lived, and longer-term structural
changes are more variable. A range of mid-term edge responses have been reported in
forests up to ~20 yr after edge creation, including severe aboveground biomass (AGBM) loss
(Ferreira & Laurance 1997; Laurance et al. 1997, 1998) and increased tree density and basal
area at the forest edge (Williams-Linera 1990a, Williams-Linera et al. 1998). These
responses vary by ecosystem, climatic condition, and natural disturbance regime, so detailed
regional studies of intermediate-aged forest edges will help to further clarify the mid-term
effects of edges on forest structure.
Within the Sarapiquí region of Costa Rica, a unique political and social context overlies a
history of deforestation, lending increased consequence to local ecological studies. Sarapiquí
has experienced widespread land use change since the 1950s, and steady conversion of land
from forest to pasture or agricultural use has led to annual deforestation rates of 2.8-3.6
percent over the last two decades (Butterfield 1994, Sánchez-Azofeifa et al. 1999). Costa
Rica has worked to reduce forest loss via the 1996 Forestry Law (no. 7575) that banned
deforestation and placed monetary value on forests through payments for environmental
services (PES). Sarapiquí is part of a regional biological corridor and is consequently a
target area for PES (García 1996, Méndez 2003). Knowledge of forest edge effects in this
highly fragmented landscape will help to define the quality of forest land benefiting from the
PES program.
It has been suggested that forests in Sarapiquí develop edges seal with vegetation as a
response to increased light available for growth at forest edges (Forero & Finegan 2002). If
this is the case, it is possible that some of the detrimental effects of forest fragmentation may
be attenuated in these forests, thus helping to preserve ecosystem integrity. The goal of this
study was to examine forest structure at 20+ year old forest-pasture edges in Sarapiquí, and

3
we developed predictions consistent with the hypothesis that these edges are dominated by
dense vegetation. We expected to find forest edges with higher stem density, increased
frequency of small diameter trees, and greater total basal area and AGBM relative to the
forest interior. We also anticipated that dense forest cover would result in edges with higher
leaf area index (LAI) and lower understory light availability and canopy openness than in the
forest interior.
Methods
Study region
This study was conducted in the Sarapiquí Canton, Heredia Province, Costa Rica, in an
area classified as tropical wet forest by the Holdridge life zone system (Tosi 1969). Annual
rainfall is approximately 4000 mm and annual temperatures average 26ºC with little monthly
variation (Sanford et al. 1994). The forests of the Sarapiquí region are highly fragmented
and the surrounding agricultural matrix is comprised primarily of pasture land and
agricultural plantations (Butterfield 1994).
The upland forests of Sarapiquí are dominated by a single leguminous tree species,
Pentaclethra macroloba (Willd.) Kuntze, that represents 32-35 percent of the total basal area
in these forests (Clark & Clark 2000). The dominance of P. macroloba decreases with
elevation and is not found at elevations > 250 m a.s.l. (Lieberman et al. 1996). These forests
are also characterized by the presence of mid-story palms, that account for 22-25 percent of
all stems > 10 cm diameter at breast height (dbh, 1.37 m) at elevations ≤ 100 m (Lieberman
et al. 1996). In addition to P. macroloba, the most abundant trees in these forests are
Tetragastris panamensis (Engl.) Kuntze, Carapa guianensis Aubl., and Licania affinis
Fritsch, and the dominant palms are Welfia regia Mast., Iriartea deltoidea Ruiz & Pav.,
Socratea exorrhiza (Mart.) H. Wendl., and Euterpe precatoria Mart.
Site selection
Six forest sites on privately owned land with a forest-pasture border 20-30 yr old were
selected for this study (Fig. 1). This age limit was chosen so that we could focus on the mid-
term effects of edge creation that occur following the initial reassortment and restabilization
of physical gradients at newly created edges (Matlack 1994). Individual landowners were
interviewed to establish the year in which pastures were created and point data were collected
with a GPS unit (GPS III, Garmin International, Kansas, USA) at each forest edge. To verify

4
that forest edges were at least 20 yr old, analog aerial photographs acquired in 1983 (Instituto
Geográfico Nacional, San José, Costa Rica) were visually compared to the GPS data overlaid
on a Landsat TM image acquired in 2001.
We studied forest edges adjacent to pasture rather than those adjacent to other common
land uses in the area (e.g. tree plantations, agriculture) because the strength of edge effects is
often greatest between land uses with abrupt changes in vegetation density and structure
(Ries et al. 2004). It should be noted that some structural heterogeneity existed in pastures
adjoining forest patches, as all had remnant trees and some also contained live fences. Study
sites were located between 50 and 200 m a.s.l. (Table 1) on gently rolling terrain. Sites 1 and
3 were located on acidic, highly weathered Ultisols derived from volcanic parent materials
and all other sites were situated on Inceptisols derived from Quaternary alluvial deposits
(ITCR 2004).
All study sites were located on land adjacent to other forested tracts; therefore the forest
area sampled at each site (Table 1) represents only the forest land area belonging to an
individual landowner. No attempt was made to quantify the extent of the forest area in which
study sites were imbedded because in some cases the adjoining forest was part of an
extensive national park (Fig. 1). All sites were either unmanaged primary forest (Sites 3 and
6) or had been selectively harvested for timber in the past under approved sustainable forest
management plans (Table 1).
Field sampling
Within study sites, areas with streams running parallel or perpendicular to the forest edge
were excluded as sampling sites to reduce variation introduced by riparian vegetation. A set
of three transects perpendicular to the forest edge were randomly situated at each site.
Within transects, plots were established at distances of 0, 25, 50, 100, 150, 200, and 300 m
from the forest edge. The numbers used to describe the plots represent the plot boundary
closest to the forest edge. Each plot consisted of three adjacent circular subplots laid out
parallel to the forest edge. The radius of each circular subplot was 10 m, so the total plot
area sampled at each distance was 942.5 m2. In most cases, the distance between transects
(i.e., the distance from the end of one plot boundary to the beginning of the next plot
boundary in the adjacent transect) was at least 100 m. However, short forest-pasture edges
led us to reduce this distance to 22 m at Site 2 and 50 m at Site 6.

5
In each plot the dbh of all trees and palms ≥ 10 cm dbh was measured with a fabric
diameter tape. Diameter measurements were made above stilt roots or buttresses when
present, and when physical measurements were not possible tree diameters were estimated
visually. These measurements were used to calculate the stem density (number of stems/ha)
and basal area for both trees and palms. These data were also used to estimate tree AGBM
using Brown and Iverson’s (1992) equation for wet tropical forests,
Y = 21.297 – 6.953(D) + 0.740(D2)
where Y is biomass per tree in kg and D is dbh in cm. Biomass estimates derived from this
equation represent the biomass of the bole as well as that of all leaves, twigs, branches, and
bark. Estimates of palm AGBM were not made because accurate prediction equations do not
exist for the palm species common in Sarapiquí. Tree data were divided into five diameter
classes (10-15, 15.1-20, 20.1-30, 30.1-60, ≥ 60.1 cm dbh) to examine the contribution of each
class to total tree stem density, basal area, and AGBM.
Hemispherical photographs were taken with a digital camera fitted with a fisheye lens
(Coolpix 4500, Fisheye Converter FC-E8, Nikon Corporation, Tokyo, Japan) at each plot
center. Photographs were taken with the top of the camera oriented toward north under
uniformly overcast sky conditions at a height of 1 m above the forest floor. Camera aperture
and shutter speed were allowed to vary with lighting conditions to obtain the most balanced
image possible. Hemispherical photographs were analyzed by a single operator using
HemiView Canopy Analysis Software (version 2.1, Delta-T Devices Ltd., Cambridge, UK).
Variables derived from image analysis included LAI, global site factor (GSF), and
canopy openness. LAI is defined as half the total leaf area per unit ground area, but in this
study we effectively measured plant area index (PAI) because hemispherical photographs
include woody elements in the canopy (e.g. tree boles, branches) (Weiss et al. 2004). For the
sake of consistency, we use the term LAI in lieu of PAI because most values of
hemispherical photograph-derived LAI in the literature represent PAI. GSF is a term that
combines direct and diffuse light in the understory and expresses it relative to total light
availability above-canopy. Weighting factors for direct and diffuse light in the understory
were used in the calculation of GSF (Rich et al. 1993). Canopy openness was calculated as a
percentage from the visible sky term generated from the analysis of each photograph.

6
Data analysis
The design of this study, in which three identical transects were nested within each study
site, lent itself to the use of linear mixed-effects models (Pinheiro & Bates 2000). These
models contain both fixed and random effects and, in circumstances like those in the present
study, are analogous to a blocked design. Fixed effects are parameters associated with a
population and the estimates of these parameters are of primary importance in mixed-effects
models. In contrast, estimates of random effects are not centrally important to questions
about a population, as they represent grouped covariates in the data. In this study, the fixed
effect was ‘distance to forest edge’, specified as a continuous variable, and the factors
‘transect’ nested within ‘site’ were specified as the random effects in all models.
The mixed-effects model configuration described above was used in analyses of the
following variables: palm stem density and basal area, tree stem density, basal area, and
AGBM for all diameter classes pooled and for each of the five diameter classes described
above, LAI, GSF, and canopy openness. Data transformations suggested by Box-Cox tests
(Box & Cox 1964) were used as needed to normalize data prior to analysis. Specifically, a
square root transform was used for all palm data, as well as for all tree data from the 10-15,
20.1-30, and 30.1-60 cm dbh classes. A log transform was used to normalize tree basal area
and AGBM data and a reciprocal square transform was used for LAI data.
Analysis of variance (ANOVA) was used to examine each of these variables in relation to
the fixed effect, distance to the forest edge. Significant differences detected along forest
edge to interior gradients with ANOVA were not further evaluated with multiple
comparisons because the fixed effect was analyzed as a continuous rather than a categorical
variable. All data processing, model fitting, and analyses were performed using the open-
source statistical language R (version 2.0.1, R Development Core Team 2004).
Results
Forest structural parameters
Among trees, stem density was significantly higher (ANOVA, F = 8.495, df = 104, P =
0.0044) in plots close to the forest edge and ranged from a maximum of 549 ± 27 stems/ha
(throughout the text, ± values represent one SE) at 0 m to a minimum of 415 ± 20 stems/ha at
300 m (Fig. 2a). The opposite pattern was observed for palms, with significantly higher stem
density (ANOVA, F = 33.9753, df = 104, P < 0.0001) observed in forest interior plots,

7
relative to edge plots (range: 42 ± 10 stems/ha at 0m to 94 ± 13 stems/ha at 300 m; Fig. 2a).
Palms also exhibited significantly greater basal area (ANOVA, F = 25.5230, df = 104, P <
0.0001) in the forest interior than at the edge (range: 0.9 ± 0.2 m2/ha at 0m to 1.6 ± 0.2 m2/ha
at 300 m; Fig. 2b). Neither basal area nor AGBM varied significantly for trees along the
forest edge to interior gradient (Fig. 2b and c). Among trees, mean basal area was 24.6 ± 0.6
m2/ha, while mean AGBM was 170.3 ± 4.5 Mg/ha. For all stems ≥ 10 cm dbh, palms
occupied between 7 and 18 percent of the total stem density and between 3 and 6 percent of
the total basal area.
Tree data were divided into five diameter classes to explore the contribution of different
diameter classes to total tree stem density, basal area, and AGBM. Within the class of stems
from 10-15 cm dbh, a trend toward higher stem density at the forest edge was observed (Fig.
3a), but was marginally non-significant (ANOVA, F = 3.6633, df = 104, P = 0.0584).
However, significantly greater basal area (ANOVA, F = 4.7347, df = 104, P = 0.0318) and
AGBM (ANOVA, F = 5.1587, df = 104, P = 0.0252) were found for this diameter class in
plots closest to the forest edge (Fig. 3b and c). Similarly, in the 15.1-20 cm dbh class,
significantly greater stem density (ANOVA, F = 6.1882, df = 104, P = 0.0144), basal area
(ANOVA, F = 5.9416, df = 104, P = 0.0165), and AGBM (ANOVA, F = 5.8183, df = 104, P
= 0.0176) were observed at forest edges (Fig. 3a–c). No significant differences in these
forest structural parameters were found in the remaining two diameter classes, 20.1-30 and
30.1-60 cm dbh (Fig. 3a–c). Statistical analyses could not be performed for stems ≥ 60.1 cm
dbh because these individuals were rare given the total land area sampled. Thirty-one
percent of plots contained no trees in this diameter class and 46 percent of plots contained
only one tree ≥ 60.1 cm dbh.
Leaf area index and understory light availability
LAI did not differ along the forest edge to interior gradient (Table 3). Mean LAI across
all sites and distance classes was 3.41 ± 0.08 m2/m2. Similarly, GSF and canopy openness
were invariant along the edge to interior gradient (Table 2).
Discussion
Forest structural parameters
Consistent with our overarching hypothesis, forests in the Sarapiquí region of Costa Rica
developed a dense wall of vegetation at forest edges in the 20+ yr following edge creation.

8
Specifically, we observed elevated tree stem density at forest edges, and this pattern was
reflected by higher stem density, basal area, and AGBM for trees in small diameter classes
growing close to forest edges. This indicates that the germination and growth of small
diameter trees following edge creation was instrumental in sealing forest edges with
vegetation. The presence of dense vegetation at forest edges has likely stabilized these
forests and contributed to the structural similarity between forest edge and interior
environments observed for both tree basal area and AGBM. The decline in palm stem
density and basal area detected at forest edges may be the result of human harvesting
pressures, given the gradual increase in both of these variables with increased distance from
the edge.
Measures of tree stem density, basal area, and AGBM compare favorably with those
made in undisturbed primary forests at the nearby La Selva Biological Station (10° 26' N, 83°
59' W, 35-137 m a.s.l., see Fig. 1). Mean tree stem density, basal area and AGBM data fell
within the range of values reported at La Selva, though the La Selva study included palms in
measures of these variables (Clark & Clark 2000). In relation to other studies of edge effects
in the Neotropics, these results are most consistent with findings in Panamanian premontane
wet forest and low-elevation tropical forest in Mexico (Williams-Linera 1990a, Williams-
Linera et al. 1998), indicating that similar processes of edge development may exist across
these ecosystems.
Shifts in species composition favoring early successional species at forest edges have
been reported in Sarapiquí and related to an increase in small diameter trees at forest edges
(Forero and Finegan 2002). A similar increase in early successional species at edges has also
been reported in the experimentally fragmented forests of the Biological Dynamics of Forest
Fragments Project (BDFFP) in the Brazilian Amazon (Laurance et al. 2006). However, the
long-term implications for forest structural responses to edge effects are likely to differ
between these two systems.
The observed increase in pioneer species abundance at edges in the BDFFP has been
related to chronic wind disturbance and AGBM loss at edges (Kapos 1989, Ferreira &
Laurance 1997, Laurance et al. 1997). These changes are expected to trigger additional
biotic and abiotic edge effects, leading to the degradation of these forest fragments over time
(Laurance et al. 2002). Although the present study does not focus on changes in edge
9
structure with time, the presence of dense vegetation at the forest edge and the similarity of
basal area and AGBM in edge and interior locations indicate that edges in Sarapiquí are not
subject to chronic disturbances or significant AGBM loss. It is likely that many edge effects,
including microclimatic changes and those influencing plant and animal distribution and
abundance, will be attenuated in these forests due to the presence of dense vegetation at
forest edges (Didham & Lawton 1999). Future investigation will be needed to further clarify
the role of successional vegetation in stabilizing forest edges in Sarapiquí over the long-term.
In general, drawing conclusions about long-term edge effects on forest structure is
difficult in most ecosystems because old forest fragments are rare. Most studies addressing
long-term edge effects have focused on gallery forests in the savanna ecosystems of Central
America thought to have been established at the beginning of the Holocene (MacDougall &
Kellman 1992, Meave & Kellman 1994, Kellman et al. 1996). Though isolated, these forest
fragments have persisted through time and are maintained by dense vegetation at the forest
edge (Kellman et al. 1996). This feature has been effective in stabilizing these extremely old
forest fragments, suggesting that Sarapiquí’s fragmented forests may also be protected by
this shared attribute.
Leaf area index and understory light availability
LAI, GSF, and canopy openness did not vary along the forest edge to interior gradient.
Although higher LAI was predicted at the forest edge relative to the interior, a lack of
significant variation along this gradient reflects the findings discussed above. Increased
understory light availability has been reported in other Neotropical forests with edges
dominated by dense vegetation, but this increase was always confined to the immediate edge
(~5-10 m from the edge) (Williams-Linera 1990a, MacDougall & Kellman 1992). In the
present study, hemispherical photographs in edge plots were taken at distance of 10 m from
the edge, and may not accurately represent the understory light environment at points closer
to the edge. Overall, our data indicate that understory light availability is not likely to
differentially influence future seedling development and sapling recruitment at the edge
relative to the forest interior.
Recent research indicates that LAI is typically underestimated by digital hemispherical
photographs relative to film-derived estimates of LAI, in part because GSF and canopy
openness are overestimated in digital photographs (Englund et al. 2000, Frazer et al. 2001).

10
Additionally, destructive sampling of canopy foliage for LAI determination has shown that
digital hemispherical photography considerably underestimates LAI in the forests of
Sarapiquí (P. Olivas, personal communication). Although the LAI values presented in this
paper may not reflect true LAI, it should be recognized that as a relative measure LAI was
invariant across the forest edge to interior gradient.
Conservation implications
The study region lies within the boundaries of the San Juan – La Selva portion of the
Mesoamerican Biological Corridor, a regional corridor designed to connect protected forests
in Costa Rica’s central mountains to those in southern Nicaragua. Corridor objectives
include protecting habitat for the endangered Great Green Macaw (Ara ambiguus), as well as
decreasing forest fragmentation, promoting biodiversity conservation, and contributing to
sustainable resource use (Chassot & Monge 2002). Because the Corridor has been a target
area for Costa Rica’s PES program (García 1996, Méndez 2003), a relatively high ecological
value has been placed on forests of the region.
Forest edge structure is of central importance in attenuating abiotic and biotic edge
effects in fragmented forest patches (Didham & Lawton 1999). As such, the structural
integrity of forest edges in Sarapiquí will be beneficial in maintaining forest productivity as
well as processes such as water and nutrient cycling (Landsberg & Gower 1997, Spies 1998).
Further, many organisms dependent upon remaining forest patches for survival will benefit
from the presence of robust edges, as forest structural parameters are often linked to the
maintenance of biodiversity (Bawa & Seidler 1998, Brokaw & Lent 1999). Given the
concentration of conservation efforts directed at the Sarapiquí region, data from the present
study confirm that these forests are valuable and worthy of this high level of attention.
Acknowledgements
This research was supported in part by NSF-IGERT grant no. 0114304. Thanks to
CATIE and FUNDECOR, particularly Germán Obando and Andrés Sanchún, for project
support. Edwin Pereira, Steven Sesnie, and Nerea Ubierna contributed logistical support
important to this research, Paulo Olivas provided data, and Eduardo Zamora assisted with
fieldwork. We are indebted to many landowners in the Sarapiquí region, without whom this
research would not have been possible. Thanks also to Manuel Guariguata, Jorge Meave,

11
and one anonymous reviewer for their insightful comments on earlier versions of this
manuscript.
References
Bawa, K. S., and R. Seidler. 1998. Natural forest management and conservation of
biodiversity in tropical forests. Conserv. Biol. 12: 46-55.
Beier, P., M. Van Drielen, and B. O. Kankam. 2002. Avifaunal collapse in West African
forest fragments. Conserv. Biol. 16: 1097-1111.
Box, G. E. P., and D. R. Cox. 1964. An analysis of transformations. J. Roy. Statist. Soc. Ser.
B 26: 211-252.
Brokaw, N. V. L., and R. A. Lent. 1999. Vertical structure. In M. L. Hunter, Jr. (Ed.).
Maintaining Biodiversity in Forest Ecosystems, pp. 373-399. Cambridge University
Press, Cambridge, England.
Brown, S., and L. R. Iverson. 1992. Biomass estimates for tropical forests. World Resour.
Rev. 4: 366-384.
Butterfield, R. P. 1994. The regional context: land colonization and conservation in
Sarapiquí. In L. A. McDade, K. S. Bawa, H. A. Hespenheide, and G. S. Hartshorn (Eds.).
La Selva: Ecology and Natural History of a Neotropical Rain Forest, pp. 299-306. The
University of Chicago Press, Chicago, Illinois.
Chassot, O., and G. Monge. 2002. Corredor Biológico San Juan - La Selva: Ficha Técnica.
Centro Científico Tropical, San José, Costa Rica.
Chen, J., J. F. Franklin, and T. A. Spies. 1992. Vegetation responses to edge environments in
old-growth Douglas-fir forests. Ecol. Appl. 2: 387-396.
Clark, D. B., and D. A. Clark. 2000. Landscape-scale variation in forest structure and
biomass in a tropical rain forest. Forest Ecol. Manag. 137: 185-198.
Didham, R. K., and J. H. Lawton. 1999. Edge structure determines the magnitude of changes
in microclimate and vegetation structure in tropical forest fragments. Biotropica 31: 17-
30.
Englund, S. R., J. J. O'Brien, and D. B. Clark. 2000. Evaluation of digital and film
hemispherical photography and spherical densiometry for measuring forest light
environments. Can. J. Forest Res. 30: 1999-2005.

12
Ferreria, L. V., and W. F. Laurance. 1997. Effects of forest fragmentation on mortality and
damage of selected trees in central Amazonia. Conserv. Biol. 11: 797-801.
Fetcher, N., B. R. Strain, and S. F. Oberbauer. 1983. Effects of light regime on the growth,
leaf morphology, and water relations of seedlings of two species of tropical trees.
Oecologia 58: 314-319.
Forero, A., and B. Finegan. 2002. Efectos de borde en la vegetación de remanentes de bosque
muy húmedo tropical en el norte de Costa Rica, y sus implicaciones para el manejo y la
conservación. Rev. For. Centroam. 38: 39-43.
Frazer, G. W., R. A. Fournier, J. A. Trofymow, and R. J. Hall. 2001. A comparison of digital
and film fisheye photography for analysis of forest canopy structure and gap light
transmission. Agricult. Forest Meteorol. 109: 249-263.
García, R. 1996. Propuesta técnica de ordenamiento territorial con fines de conservación de
biodiversidad en Costa Rica: Proyecto GRUAS. SINAC, MINAE, San José, Costa Rica.
Harper, K.A., and S. E. MacDonald. 2002. Structure and composition of edges next to
regenerating clear-cuts in mixed-wood boreal forest. J. Veg. Sci. 13: 535-546.
ITCR. 2004. Atlas Costa Rica 2004. Instituto Tecnológico de Costa Rica, Cartago, Costa
Rica.
Kapos, V. 1989. Effects of isolation of the water status of forest patches in the Brazilian
Amazon. J. Trop. Ecol. 5: 173-185.
Kellman, M., R. Tackaberry, and J. Meave. 1996. The consequences of prolonged
fragmentation: lessons from tropical gallery forests. In J. Schelhas and R. Greenberg
(Eds.). Forest Patches in Tropical Landscapes, pp. 37-58. Island Press, Washington, D.C.
Landsberg, J. J., and S. T. Gower. 1997. Applications of Physiological Ecology to Forest
Management. Academic Press, San Diego, California.
Laurance, W. F., L. V. Ferreira, J. M. Rankin-de Merona, and S. G. Laurance. 1998. Rain
forest fragmentation and dynamics of Amazonian tree communities. Ecology 79: 2032-
2040.
Laurance, W. F., S. G. Laurance, L. V. Ferreira, J. M. Rankin-de Merona, C. Gascon, and T.
E. Lovejoy. 1997. Biomass collapse in Amazonian forest fragments. Science 278: 1117-
1118.

13
Laurance, W. F., T. E. Lovejoy, H. L. Vasconcelos, E. M. Bruna, R. K. Didham, P. C.
Stouffer, C. Gascon, R. O. Bierregaard, S. G. Laurance, and E. Sampaio. 2002.
Ecosystem decay of Amazonian forest fragments: a 22-year investigation. Conserv. Biol.
16: 605-618.
Laurance, W. F., H. E. M. Nascimento, S. G. Laurance, A. C. Andrade, P. M. Fearnside, J. E.
L.Ribeiro, and R. L. Capretz. 2006. Rain forest fragmentation and the proliferation of
successional trees. Ecology 87: 467-482.
Lieberman, D., M. Lieberman, R. Peralta, and G. S. Hartshorn. 1996. Tropical forest
structure and composition on a large-scale altitudinal gradient in Costa Rica. J. Ecol. 84:
137-152.
MacDougall, A., and M. Kellman. 1992. The understory light regime and patterns of tree
seedlings in tropical riparian forest patches. J. Biogeogr. 19: 667-675.
Matlack, G. R. 1994. Vegetation dynamics of the forest edge - trends in space and
successional time. J. Ecol. 82: 113-123.
Meave, J., and M. Kellman. 1994. Maintenance of rain forest diversity in riparian forests of
tropical savannas: implications for species conservation during Pleistocene drought. J.
Biogeogr. 21: 121-135.
Méndez, J. 2003. Pagos por servicios ambientales en la región Huetar Norte. In G. S.
Jiménez and M. E. H. Ugalde (Eds.). Costa Rica Forestal: Boletín Informativo de la
Oficina Nacional Forestal, No. 1, pp. 2-3. Oficina Nacional Forestal, Belén, Costa Rica.
Murcia, C. 1995. Edge effects in fragmented forests: implications for conservation. Trends
Ecol. Evol. 10: 58-62.
Pearman, P. B. 1997. Correlates of amphibian diversity in an altered landscape of Amazonian
Ecuador. Conserv. Biol. 11: 1211-1225.
Pinheiro, J. C., and D. M. Bates. 2000. Mixed-Effects Models in S and S-Plus. Springer-
Verlag New York, Inc., New York, New York.
Rich, P. M., D. B. Clark, D. A. Clark, and S. F. Oberbauer. 1993. Long-term study of solar
radiation regimes in a tropical wet forest using quantum sensors and hemispherical
photography. Agricult. Forest Meteorol. 65: 107-127.

14
Ries, L., R. J. Fletcher, Jr., J. Battin, and T. D. Sisk. 2004. Ecological responses to habitat
edges: mechanisms, models, and variability explained. Annu. Rev. Ecol. Evol. Syst. 35:
491-522.
Sánchez-Azofeifa, G. A., C. Quesada-Mateo, P. Gonzalez-Quesada, S. Dayanandan, and K.
S. Bawa. 1999. Protected areas and conservation of biodiversity in the tropics. Conserv.
Biol. 13: 407-411.
Sanford, R.L., Jr., P. Paaby, J. C. Luball, and E. Phillips. 1994. Climate, geomorphology, and
aquatic systems. In L. A. McDade, K. S. Bawa, H. A. Hespenheide, and G. S. Hartshorn
(Eds.). La Selva: Ecology and Natural History of a Neotropical Rain Forest, pp. 19-33.
The University of Chicago Press, Chicago, Illinois.
Sizer, N., and E. V. J. Tanner. 1999. Responses of woody plant seedlings to edge formation
in a lowland tropical rainforest, Amazonia. Biol. Conserv. 91: 135-142.
Spies, T. A. 1998. Forest structure: a key to the ecosystem. Northwest Sci. 72: 34-39.
Tosi, J. A., Jr. 1969. Mapa ecológico, República de Costa Rica: Según la clasificación de
zonas de vida del mundo de L.R. Holdridge. Centro Científico Tropical, San José, Costa
Rica.
Weiss, M., F. Baret, G. J. Smith, I. Jonckheere, and P. Coppin. 2004. Review of methods for
in situ leaf area index (LAI) determination Part II. Estimation of LAI, errors and
sampling. Agricult. Forest Meteorol. 121: 37-53.
Williams-Linera, G. 1990a. Vegetation structure and environmental conditions of forest
edges in Panama. J. Ecol. 78: 356-373.
Williams-Linera, G. 1990b. Origin and early development of forest edge vegetation in
Panama. Biotropica 22: 235-241.
Williams-Linera, G., V. Domínguez-Gastelú, and M. E. García-Zurita. 1998.
Microenvironment and floristics of different edges in a fragmented tropical rainforest.
Conserv. Biol. 12: 1091-1102.

15
Table 1. Site characteristics for the six study sites. Name, elevation, size of sampled forest area, site history characteristics (SH = selectively harvested for timber, UH = unharvested) followed by date of last harvest, and summary statistics for tree stem density, basal area, and aboveground biomass (AGBM) (mean ± one SE) in each study site. Summary statistics were calculated based on measurements of all trees ≥ 10 cm dbh.
Site Elevation (m a.s.l.) Size (ha) Site
History Stem Density (# stems/ha)
Basal Area (m2/ha)
AGBM (Mg/ha)
1 58 375 SH, 1991 427 ± 14 21.5 ± 0.8 148.1 ± 6.2
2 62 120 SH, 2000 461 ± 26 25.4 ± 1.2 177.2 ± 9.0
3 116 196 UH 411 ± 22 25.4 ± 1.4 180.8 ± 10.9
4 66 111 SH, 1995 486 ± 25 27.6 ± 1.4 192.8 ± 10.1
5 176 139 SH, 2003 522 ± 28 23.4 ± 1.7 155.2 ± 12.3
6 200 80 UH 488 ± 33 24.2 ± 1.8 164.8 ± 13.7

16
Table 2. Mean ± one SE of leaf area index (LAI), global site factor (GSF), and canopy openness relative to distance to the forest edge. No significant differences were observed along the forest edge to interior gradient.
Distance Class (m) LAI (m2/m2) GSF (%) Canopy
Openness (%)
0 3.33 ± 0.21 9.2 ± 0.8 5.9 ± 0.5
25 3.50 ± 0.28 9.8 ± 0.9 6.0 ± 0.6
50 3.42 ± 0.21 9.7 ± 0.8 5.9 ± 0.5
100 3.25 ± 0.16 10.1 ± 0.6 6.2 ± 0.4
150 3.20 ± 0.15 8.4 ± 0.7 5.5 ± 0.5
200 3.91 ± 0.31 10.4 ± 0.6 6.0 ± 0.4
300 3.29 ± 0.15 8.9 ± 0.6 5.6 ± 0.4

17
Figure 1. Map of the study area within Costa Rica. Inlay of Costa Rica indicates the location of the Sarapiquí region with a star. The detailed map shows the location of all study sites as black dots. Grey shaded areas represent forest cover in 1997 and areas covered by hatching are national parks and protected areas (ITCR 2004).

18
Ste
m d
ensi
ty (#
ste
ms/
ha)
0
100
200
300
400
500
600
700 a TreesPalms
Bas
al a
rea
(m2 /h
a)
0
5
10
15
20
25
30 b
Distance to forest edge (m)
0 50 100 150 200 250 300 350
Abo
vegr
ound
bio
mas
s (M
g/ha
)
0
50
100
150
200
250 c
Figure 2. Mean ± one SE of (a) stem density, (b) basal area, and (c) aboveground biomass (AGBM) for trees and palms in relation to the distance of each plot from the forest edge. AGBM estimates for palms were not made because accurate prediction equations do not exist. Significant differences in tree and palm stem density (P = 0.0044, P < 0.0001, respectively) and palm basal area (P < 0.0001) were detected among distance classes.

19
S
tem
den
sity
(# tr
ees/
ha)
0
50
100
150
200
25010-15 cm15.1-20 cm20.1-30 cm30.1-60 cm60.1+ cm
Basa
l are
a (m
2 /ha)
0
2
4
6
8
10
12
14
16
Distance to forest edge (m)
0 25 50 100 150 200 300
Abov
egro
und
biom
ass
(Mg/
ha)
0
20
40
60
80
100
120
a
b
c
Figure 3. Mean ± one SE of (a) stem density, (b) basal area, and (c) aboveground biomass (AGBM) for trees in five diameter classes in relation to the distance of each plot from the forest edge. Significant differences along the forest edge to interior gradient were found for basal area (P = 0.0318) and AGBM (P = 0.0252) in the 10-15 cm diameter class and for stem density (P = 0.0144), basal area (P = 0.0165), and AGBM (P = 0.0176) in the 15.1-20 cm diameter class. Statistical analyses were not performed for the 60.1+ cm diameter class because of the small number of individuals in this category.

20
CHAPTER 2. WATER-USE EFFICIENCY AND δ13C AS INDICATORS OF FOREST EDGE EFFECTS
IN NORTHEASTERN COSTA RICA
Abstract
Functional responses of forests to edges created by disturbance are rarely studied, though
stable carbon isotope (δ13C) data can be effectively used in this capacity. Specifically,
changes in leaf level δ13C (δ13Cleaf) can reflect changes in canopy processes such as
photosynthesis and transpiration, the components of water-use efficiency (WUE).
Environmental conditions commonly observed at forest edges can decrease stomatal
conductance, thereby increasing δ13Cleaf and WUE. We tested the hypothesis that δ13Cleaf
would be enriched in 13C and WUE would be higher in trees growing close to forest edges.
We expected that these shifts would also be detectable belowground in the δ13C values of soil
organic matter (δ13Csoil) and soil respired CO2 (δ13CR-soil). To evaluate these hypotheses, a set
of three transects perpendicular to the forest edge were established in each of three tropical
rainforest fragments in northeastern Costa Rica. Canopy and understory foliage from
Pentaclethra macroloba trees, soil respired CO2, and mineral soil samples were collected
between 0 and 300 m from the forest edge. δ13Cleaf, δ13Csoil, and δ13CR-soil were determined
with mass spectroscopy, and foliar data were used to estimate WUE. Data were analyzed
using linear mixed-effects models. Contrary to our predictions, δ13Cleaf and WUE did not
differ along the edge to interior gradient, and this lack of variation was also apparent in
δ13Csoil. However, δ13CR-soil was significantly more depleted within 50 m of forest edges
relative to the forest interior (p = 0.0347). This change may be related to a shift in species
composition at the edge, but further research is needed to verify this hypothesis. The
predominant lack of functional responses to the presence of edges in northeastern Costa Rica
indicates that trees at these forests edges are robust and minimally influenced by edge effects.
Introduction
The structure, species composition, and dynamics of forest ecosystems are often studied
to describe forest responses to edge effects. However, few studies have focused on forest
functional responses to edges as a means of exploring why these variables may change at
forest edges. In shifting edge effects research toward forest functional responses, stable
carbon isotope analysis can be used to address questions about water-use efficiency (WUE)
in forest trees (Farquhar and Richards 1984). WUE, defined as the ratio of CO2 assimilation
21
to transpiration, describes the relationship between carbon gain and water loss at the leaf
level. Foliar stable carbon isotope values (δ13Cleaf) can be used to estimate WUE.
WUE can be used as an indicator of a tree’s functional response to environmental
gradients (e.g. Ehleringer et al. 1986), such as those present at forest edges. Modified
growing conditions at edges, including high light, temperature, and vapor pressure deficit
(VPD), are common across ecosystems (Kapos 1989; Chen et al. 1995; Williams-Linera et al.
1998; Newmark 2001) and may influence tree growth and survival (Laurance et al. 2002).
Specifically, these conditions can lead to more stomatal closure in response to factors such as
increased evaporative demand at the leaf level or decreased soil moisture. Reductions in
stomatal conductance decrease water loss and lead to an increase in δ13Cleaf.
In C3 plants, discrimination against the heavier carbon isotope, as 13CO2, occurs during
CO2 assimilation by a leaf. Diffusive fractionation and a strong biochemical fractionation by
ribulose-1,5-bisphosphate carboxylase/oxygenase (Rubisco) against 13CO2 molecules
constitute the strongest sources of discrimination during CO2 assimilation (Farquhar et al.
1989; Farquhar and Lloyd 1993). A third significant source of discrimination has been
documented as a process concurrent with CO2 transfer conductance from the substomatal
cavity of a leaf to the sites of carboxylation in the mesophyll (Lauteri et al. 1997; Warren et
al. 2003; Warren and Adams 2006). Net discrimination against 13CO2 molecules during
photosynthesis decreases the likelihood that 13CO2 will be assimilated when the intercellular
CO2 concentration of a leaf (ci) is high and 12CO2 molecules are readily available. However,
as ci declines following a reduction in stomatal conductance, 13CO2 is necessarily assimilated
with greater frequency. As such, foliage with a δ13Cleaf enriched in 13C is linked to low
discrimination, low ci, and high WUE (Farquhar and Richards 1984).
While variation in stomatal conductance is partially responsible for determining δ13Cleaf,
carbon available at the time of leaf formation, environmental conditions, and leaf-level
photosynthetic capacity are also influential. Once created, structural carbon compounds
within a leaf are relatively stable for the duration of the leaf’s life-span. Therefore, carbon
available at the time of leaf formation and the prevailing growing environment (e.g. low vs.
high moisture conditions) under which that carbon was fixed can influence the δ13Cleaf
(Leffler and Evans 2001; Keel et al. 2006). In terms of photosynthesis, leaves with high
photosynthetic capacity such as those growing in forest canopies under full sun tend to

22
maintain a low ci (Hanba et al. 1997; Duursma and Marshall 2006), a parameter influential in
determining δ13Cleaf (Farquhar and Richards 1984). Thus, for a given stomatal aperture,
leaves with higher photosynthetic capacity will assimilate more 13CO2 relative to leaves with
lower photosynthetic capacity. Photosynthetic capacity can be examined indirectly via leaf
nitrogen content and specific leaf area (SLA), as both parameters are well correlated with
maximum net photosynthesis (Field and Mooney 1986; Reich et al. 1992; Reich et al. 1997).
The components of WUE, photosynthesis and transpiration, are canopy processes that
have downstream effects on plant δ13C values. Specifically, as the products of
photosynthesis are translocated within a plant, some become substrates for root and
rhizosphere respiration. δ13C values of soil respired CO2 (δ13CR-soil) represent a mixed signal,
derived not only from sources that may rely on current photosynthate, but also from
heterotrophic respiration in which soil organic matter serves as the primary respiratory
substrate. Despite the variation in inputs to soil respired CO2, climatic and environmental
changes influencing the δ13C of carbon fixed in the canopy is detectable in δ13CR-soil one to
six days following initial carbon fixation (Ekblad and Högberg 2001; Ekblad et al. 2005).
These data indicate that both short-term climatic changes, such as seasonal increases in VPD,
and long-term changes, such as those resulting from forest edge creation, will produce δ13C
signals evident both above- and belowground.
We chose to examine δ13C values in the ecosystem components described above: foliage,
soil respired CO2, and soil organic matter. Our goal was to determine forest functional
responses to the presence of an edge in the Sarapiquí region of Costa Rica. Forests in this
area of Costa Rica’s Atlantic lowlands are primarily classified as tropical wet forest by the
Holdridge life zone system (Tosi 1969) and exhibit little annual variation in either rainfall or
temperature (Sanford et al. 1994). A shade-tolerant, leguminous tree species, Pentaclethra
macroloba (Willd.) Kuntze, occupies between 32 and 35% of the basal area in these high-
diversity forests (Clark and Clark 2000). P. macroloba is found frequently in both the
canopy and understory and was selected as a focal species for this study.
It has been suggested that P. macroloba originated as a swamp species that eventually
colonized upland areas with high rainfall (Hartshorn 1972). This theory is complemented by
physiological measurements that point toward a degree of water stress sensitivity in this
species (Oberbauer et al. 1987). Specifically, P. macroloba has been shown to exhibit

23
reduced stomatal conductance following extended exposure to full sun conditions in both
field and laboratory settings (Oberbauer 1983; Oberbauer et al. 1987). Because high light
conditions can increase both temperature and VPD, it is probable that P. macroloba’s
stomatal sensitivity under high light is linked to one or both of these factors. Therefore it is
likely that signs of water-related stress on trees growing near forest edges will be apparent in
P. macroloba.
We examined two primary hypotheses. First, δ13Cleaf will be more enriched and WUE
will be higher in canopy and understory trees growing close to the forest edge, relative to
those in the forest interior. Second, patterns in δ13Cleaf detected in canopy trees will also be
apparent in the mineral soil δ13C value (δ13Csoil) and δ13CR-soil. We also examined differences
in canopy and understory δ13Cleaf relative to leaf mass per unit area (LMA, the reciprocal of
SLA) and nitrogen content, with the expectation that canopy δ13Cleaf will reflect high
photosynthetic capacity.
Methods
Site description
This study was conducted in the Sarapiquí region of northeastern Costa Rica. Rainfall
averages approximately 4000 mm annually with a mean annual temperature of 26°C (Sanford
et al. 1994). The region is characterized by fragmented forests within an agricultural matrix
comprised of active pastures and crop land (Butterfield 1994).
Three sites with 20 to 30 year old forest-pasture borders were selected for this study, and
all sites were located between 50 and 120 m a.s.l. on gently rolling terrain. Two sites,
Rojomaca and Selva Verde, were located on highly weathered, acidic Ultisols derived from
volcanic parent material while the third site, Tosi, was located on an Inceptisol derived from
Quaternary alluvial deposits (ITCR 2004). Rojomaca and Tosi had been selectively
harvested within 15 years of the present study, but no harvesting is known to have occurred
at Selva Verde.
Foliar sampling
At each site, we established three transects perpendicular to the forest edge. Transects
were randomly located and spaced 22 to 100 m apart, depending on the length of the forest-
pasture edge at each site. Samples were collected in 0.1 ha plots located at distances of 0, 25,
50, 100, 200, and 300 m from the forest edge. Each plot extended 20 m into the forest,

24
parallel to the established transects. Two canopy and two understory P. macroloba trees
were sampled in each plot. If suitable trees could not be located within the plot, trees
immediately adjacent to the plot were substituted.
A tree-climber cut one small branch from the upper third of each P. macroloba tree
(diameter at breast height (dbh, 1.37 m) range: 19.1-82.0 cm) sampled in the forest canopy.
All leaves on these branches were in full sun and came from heights of 25 to 35 m above the
forest floor. From each branch, we collected 10 fully expanded leaves and avoided sampling
leaves with significant epiphytic growth. A similar procedure was used to collect foliage
from shaded understory P. macroloba trees (dbh range: 1.5-34.5 cm) at heights of 3 to 5 m
above the forest floor. As foliar samples were collected, temperature and relative humidity
measurements were made in the canopy and understory with a hand-held weather meter
(Kestrel 4000, Nielsen-Kellerman Company, Boothwyn, PA). These data were pooled by
site and plot distance and were used to calculate canopy and understory VPD.
A subset of the sampled trees, consisting of one canopy and one understory tree per plot,
was selected for measurements of LMA. These measurements were not made for all trees
because of the difficulty associated with processing foliage from P. macroloba, a species
with bipinnately compound leaves and very small sub-leaflets. LMA was determined
separately for three leaves per tree by selecting five leaflets per leaf for analysis. Sub-leaflets
were separated from the rachis of each leaflet, scanned, dried at 70°C for 48 hours, and
weighed to the nearest mg. The leaf area of scanned sub-leaflets was determined using
Image-J image analysis software (v. 1.34s, National Institutes of Health, Bethesda,
Maryland).
To determine δ13Cleaf and nitrogen content (Nmass), 10 leaflets per sample tree were
randomly selected for analysis. Sub-leaflets were removed from the leaflet rachis, dried at
70°C for 48 hours, and ground into a fine powder. δ13Cleaf and Nmass were determined at the
Idaho Stable Isotopes Laboratory (ISIL) using CE Instruments’ NC2500 elemental analyzer
coupled with the Finnigan MAT Delta-plus isotope ratio mass spectrometer (Thermo
Electron Corporation, Bremen, Germany). Stable carbon isotope data are expressed in
standard delta notation as,
δ13C = ((Rsample/Rstandard) -1) × 1000

25
where Rsample is the ratio of 13C to 12C in the sample of interest and Rstandard is the ratio of 13C
to 12C in a standard (PDB). Twenty-two randomly selected foliar samples (10% of all
samples) were analyzed in duplicate and analyses yielded a mean difference for δ13Cleaf of
0.25‰. The nitrogen content of each leaf, expressed as a fraction, was multiplied by LMA to
calculate the quantity of nitrogen per unit leaf area (Narea).
Within-leaf δ13C variability was examined in a small subset of leaves (n = 8). For this
analysis, leaflets were selected from the upper, middle, and lower third of leaves from five
canopy and three understory trees. Leaflets from the middle third of these leaves were also
divided into upper and lower sub-leaflets to examine within-leaflet variation in δ13C. Foliage
was processed and analyzed as described above.
Mineral soil and soil respired CO2 sampling
Within each plot, three mineral soil samples from 0-10 cm depth were homogenized to
form a single sample. All leaf litter was removed from the soil surface prior to sampling.
Soils were air-dried to constant mass, sieved through a 2 mm mesh, and a subsample was
homogenized for δ13C analysis. The mean difference in δ13Csoil for six duplicate soil samples
(11% of all samples) was 0.31‰.
Soil CO2 was also collected in each plot from chambers fitted with rubber septa on the
soil surface. Each chamber was inverted over a gently excavated circle in the soil, and all
living plant material was removed from the area beneath the chamber. Soil from outside the
study area was used to seal the edges of the chamber, and chambers were allowed to
equilibrate with soil CO2 for at least four days before an air sample was collected. Soil CO2
samples were drawn from the chamber with a syringe and injected into evacuated 12 ml
septum-capped Exetainers® (Labco Ltd., High Wycombe, UK). Samples were shipped to
the ISIL and analyzed 8 to 13 days after collection. The δ13C value of air samples was
determined using Finnigan MAT’s GasBench II coupled with the Finnigan MAT Delta-plus-
XP IRMS. δ13C values of soil CO2 samples were corrected by -4.4‰ to account for the
difference in diffusion rates between 12CO2 and 13CO2 in the soil pore space (Cerling et al.
1991). This corrected value is hereafter referred to as the δ13C value of soil respired CO2,
δ13CR-soil.

26
WUE estimation
Instantaneous WUE was estimated from δ13Cleaf as follows. First, discrimination (∆) was
estimated as,
∆ = (δ13Ca - δ13Cp) / (1 + δ13Cp / 1000)
where δ13Cp is the δ13C value of bulk foliar tissue or δ13Cleaf and δ13Ca is the atmospheric CO2
δ13C, estimated at -8‰, the mean tropospheric value. δ13Ca was assumed not to vary above a
height of 1 m in the forest (Buchmann et al. 2002). Next, ci was estimated as,
ci = ca (∆ – a) / (b – a)
where ca is atmospheric CO2 concentration (380 ppm), a is the diffusional fractionation
against 13CO2 (4.4‰), and b is the net fractionation against 13CO2 resulting from
carboxylation by Rubisco (estimated at 28‰). Instantaneous WUE, defined as the ratio of
carbon assimilation to transpiration (A/E), was estimated as,
A/E = (ca – ci) / (1.6 υ)
where υ is the vapor pressure difference between the leaf and atmosphere. VPD was used as
a surrogate for υ, assuming that the bipinnately compound leaves of P. macroloba were well
coupled to the atmosphere.
Statistical analyses
The statistical language R (version 2.0.1, R Development Core Team 2004) was used for
all data processing and analyses. One-way analysis of variance (ANOVA) was used to test
for differences in δ13C in leaflets and sub-leaflets from varying leaf positions. LMA, Nmass,
Narea, δ13Cleaf, WUE, δ13Csoil, and δ13CR-soil data were analyzed with linear mixed-effects
models (Pinheiro and Bates 2000). ‘Distance to forest edge’ was analyzed as a continuous
variable as each model’s fixed effect. Random effects for all models were ‘transect’ nested
within ‘fragment’. Prior to analysis, WUE data were log transformed and the LMA data for
understory foliage were reciprocal transformed to normalize data, as suggested by Box-Cox
tests (Box and Cox 1964). Individual ANOVAs were performed for each variable to test for
differences along the forest edge to interior gradient. Model quality was evaluated using
whole-model ANOVA comparisons (Pinheiro and Bates 2000) and by comparing the
standard deviation of the model’s residuals to the standard deviation of the variable of
interest.

27
Results
Within-leaf δ13C variation
No significant within-leaf variability was detected in the δ13C value of leaflets from the
bottom, middle, and top of P. macroloba leaves (p = 0.89) (Table 1). However, a small
difference in sub-leaflet δ13C values was detected (p = 0.03), with sub-leaflets at the base of
the leaflet more depleted than those at the tip (mean difference: -0.16‰) (Table 1). It should
be noted that this difference was below the level of precision in analyzed duplicate foliar
samples (0.25‰).
Forest edge to interior gradients
δ13Cleaf and WUE
δ13Cleaf was invariant along the forest edge to interior gradient for both canopy (p = 0.80)
and understory foliage (p = 0.28) (Fig. 1). The mean δ13Cleaf for canopy foliage was -29.65 ±
0.07‰ and was -32.51 ± 0.08‰ for understory foliage.
Given the influence of VPD, estimates of WUE were somewhat more variable than
δ13Cleaf, particularly for canopy foliage. However, no significant differences were detected
along the forest edge to interior gradient for either canopy (p = 0.16) or understory foliage (p
= 0.81) (Fig. 2). Mean WUE for canopy foliage was 19.7 ± 0.6 mmol mol-1 and was 10.8 ±
0.5 mmol mol-1 for understory foliage.
LMA and leaf nitrogen
No differences in LMA were detected for either canopy (p = 0.25) or understory (p =
0.43) foliage along the edge to interior gradient (Table 2). Similarly, no significant
differences in Nmass or Narea were observed along this gradient for either canopy (p = 0.44,
0.60) or understory foliage (p = 0.71, 0.25) (Table 2). LMA in canopy foliage averaged
66.65 ± 0.97 g m-2 and was nearly double the mean LMA of understory foliage, 35.25 ± 0.69
g m-2 (Table 2). Narea was consistently higher in canopy foliage, relative to understory
foliage, while the opposite was true of Nmass.
δ13Csoil and δ13CR-soil
δ13Csoil for samples collected from the top 10 cm of mineral soil did not vary along the
forest edge to interior gradient (p = 0.16) (Fig. 3), and the mean value across all distance
classes was -27.96 ± 0.05‰. However, δ13CR-soil did vary significantly across the edge to

28
interior gradient (p = 0.0347) (Fig. 3). Values were more depleted at the forest edge than in
the interior and ranged from -29.24 ± 0.39‰ at 0 m to -28.57 ± 0.28‰ at 300 m.
Discussion
Aboveground responses to forest edge effects
In contrast to our expectations, we did not observe enriched δ13Cleaf and increased WUE
in canopy or understory P. macroloba trees growing near forest edges (Fig. 1, 2). These data
indicate that water stress in the form of limited soil moisture or high evaporative demand was
not a factor affecting P. macroloba trees at the forest edge. Studies that have investigated
changes in δ13Cleaf and/or WUE over environmental gradients have found irradiance and
VPD to be significant factors in determining WUE (Ehleringer et al. 1986; Marshall and
Zhang 1994; Hanba et al. 1997). However, neither of these factors appears to be influential
along forest edge to interior gradients in these tropical forests.
A study of edge effects conducted five years after forest edge creation in the Brazilian
Amazon also failed to find variation in the δ13Cleaf of two canopy tree species along forest
edge to interior transects (Kapos et al. 1993). However, enrichment in δ13Cleaf was observed
in an understory species at these forest edges and this was linked to both increased canopy
openness at these young forest edges and enriched δ13C values in understory air (Kapos et al.
1993). Fragmented forests in Sarapiquí develop edges that seal with dense vegetation in the
20-30 years following edge creation, and no difference in canopy openness has been found
between edge and interior environments (Schedlbauer et al. 2007). The presence of a sealed
edge decreases the likelihood that well-mixed air from outside the forest will penetrate edges
and influence understory δ13Cleaf. Our understory δ13Cleaf data are consistent with this idea
(Fig. 1).
Although we did not detect evidence of edge effects in our measures of δ13Cleaf and
WUE, there exists the possibility that P. macroloba trees growing directly adjacent to forest
edges do exhibit increased WUE. Our sampling design was such that edge plots included
trees growing anywhere between 0 and 20 m from the forest edge. Trees at the immediate
edge of the forest are likely subject to a more extreme environment than trees growing close
to an edge. The influence of hotter, drier conditions in adjacent pastures, as well as increased
crown irradiance at edges could affect tree water relations on a scale smaller than that
measured in the present study. While this possibility exists, it is unlikely that it would have

29
any significant effect on the forest as a whole. The development of dense vegetation at forest
edges in Sarapiquí appears to stabilize edges (Schedlbauer et al. 2007), and the potential for
increased WUE in P. macroloba growing at immediate forest edges is unlikely to threaten
this stability.
The overall lack of variation in δ13Cleaf within both the canopy and understory suggests
that the δ13C value of carbon available when leaves were developing was relatively constant.
This is not surprising, given the relative aseasonality of temperature and precipitation in the
Sarapiquí region (Sanford et al. 1994). Studies in tropical regions with distinct seasonality
also report little to no change in δ13Cleaf in canopy species between wet and dry seasons
(Buchmann et al. 1997; Terwilliger et al. 1997).
Within individual P. macroloba leaves, only small variation in δ13C was detected (Table
1), indicating that a random sampling of leaflets sufficiently captures the overall bulk δ13Cleaf.
Further, these data show that leaflet and sub-leaflet position within P. macroloba leaves does
not reflect differential patterns of WUE. The whole leaf appears to function simultaneously,
regardless of the distance that water must travel through conducting tissue to reach different
parts of the leaf.
Comparison of canopy and understory foliage
Photosynthetic capacity may influence δ13Cleaf (Hanba et al. 1997; Duursma and Marshall
2006), and was assessed here indirectly via measures of LMA, Nmass, and Narea (Field and
Mooney 1986; Reich et al. 1992; Reich et al. 1997). None of these parameters exhibited
significant changes with increased distance to forest edges for either canopy or understory
foliage (Table 2), indicating that differences in photosynthetic capacity were not influential
in determining δ13Cleaf. However, the variation in these parameters between canopy and
understory P. macroloba trees was important in explaining the differences in δ13Cleaf from the
canopy to the understory.
A mean difference in δ13Cleaf of 2.86‰ was observed between canopy and understory P.
macroloba foliage, with canopy foliage exhibiting a more enriched δ13Cleaf than understory
foliage (Fig. 1). This difference is slightly lower than the range typically reported for
tropical forests (Medina and Minchin 1980; Sternberg et al. 1989; Buchmann et al. 1997),
perhaps because other studies introduce interspecies variation to measures of δ13Cleaf and we
report values for one species only. Buchmann et al. (2002), in a global analysis, determined

30
that approximately 70% of the variation in δ13Cleaf within forest canopies is related to
changes in discrimination, while the remaining 30% is attributed to variation in the δ13C of
source air available for photosynthesis. Of the variation related to discrimination, there is a
lack of consensus regarding the strongest drivers of the gradient in δ13Cleaf within forest
canopies. However, variation in light availability as well as differences in photosynthetic
capacity between canopy and understory foliage is often influential in determining δ13Cleaf
(Hanba et al. 1997; Duursma and Marshall 2006).
LMA, an index of leaf thickness, nearly doubled in canopy foliage, relative to understory
foliage (Table 2). This pattern is characteristic of sun and shade foliage (Lambers et al.
1998) and reflects the difference in light availability between the canopy and understory.
The high Narea observed in canopy foliage (Table 2) is also a manifestation of high light
availability in the forest canopy, as most leaf nitrogen is associated with the photosynthetic
apparatus of a leaf (Evans and Seemann 1989; Hanba et al. 1999). Although we detected
higher Nmass in understory foliage than canopy foliage (Table 2), this pattern is likely related
to the thinness of shade leaves. High WUE in canopy trees relative to understory trees is
partially the result of high light availability and photosynthetic capacity, both of which lead
to draw-downs in ci. However, differences in water conducting path length, boundary layer
conductance, leaf temperature, and leaf-to-air vapor pressure difference between foliage in
canopy and understory trees can also influence ci by inducing earlier or more frequent
stomatal closure in canopy foliage.
Ideally, estimation of WUE from δ13Cleaf should account for the transfer conductance of
CO2 from a leaf’s substomatal cavity to the chloroplasts and the associated discrimination
against 13C (Evans and von Caemmerer 1996). Because the CO2 concentration in
chloroplasts is reported to be ~30% lower than ci, transfer conductance has the potential to
decrease WUE by constraining photosynthesis (Evans and von Caemmerer 1996). Any
variation in transfer conductance has consequences for discrimination against 13CO2
molecules. Leaf thickness and photosynthetic capacity are often positively correlated with
transfer conductance (Evans and von Caemmerer 1996; Hanba et al. 1999; Warren et al.
2003), but neither variable was found to change along the forest edge to interior gradient in
the present study (Table 2). Consequently, it is unlikely that transfer conductance varied
within either canopy or understory foliage; however, variation in transfer conductance likely
31
influenced WUE between canopy and understory foliage. Because our estimates of WUE did
not account for transfer conductance, these WUE values are best viewed as a relative
measure within a canopy level, and should not be directly compared between canopy and
understory foliage.
Belowground responses to forest edge effects
Consistent with our hypothesis that canopy-level patterns in δ13Cleaf would be reflected
belowground, δ13Csoil was found not to vary with distance to forest edges (Fig. 3). However,
a significant depletion in δ13CR-soil was detected in plots close to the forest edge (Fig. 3). The
magnitude of this depletion was approximately 0.5‰ and, though small, was consistent for
all plots within 0-50 m of the forest edge. Evidence presented above decreases the likelihood
that alterations in canopy processes such as photosynthesis and transpiration are responsible
for these changes at the forest edge. Further, relatively constant δ13Csoil along the edge to
interior gradient makes it unlikely that differences in the δ13C of soil organic matter explain
these changes.
As described previously, the edges of forest fragments in Sarapiquí seal with vegetation
in the 20-30 years following edge creation (Schedlbauer et al. 2007), a process that is likely
related to an increase in pioneer species at edges (Forero and Finegan 2002). Pioneer species
and shade tolerant or late-successional species in tropical forests do not vary consistently in
δ13Cleaf (Huc et al. 1994; Bonal et al. 2000a), although the direction of isotopic shifts among
tree functional types often varies with the ecophysiological traits of individual species (Huc
et al. 1994; Bonal et al. 2000b). In the forests of Sarapiquí, it is possible that the carbon
available for root and rhizosphere respiration in pioneer species is more depleted than that of
late-successional species. This depleted signal would then be evident in δ13CR-soil in areas of
the forest dominated by early successional species, such as the forest edge. These possible
shifts in δ13Cleaf may not have been detected in δ13Csoil because these forest edges are not
occupied solely by early successional species. Further research is needed to assess whether
variation in δ13Cleaf among tree functional groups is a potential driver of patterns of δ13CR-soil
at forest edges in Sarapiquí.
Conclusions
Forest functional changes in response to the presence of an edge were generally not
detectable in the fragmented forests of Sarapiquí. Along edge to interior gradients, we did

32
not observe significant changes in δ13Cleaf, WUE, or any measured leaf characteristics in
either canopy or understory foliage. Therefore, we conclude that trees growing close to
forest edges are robust and functionally similar to trees in the forest interior. Variation in
δ13Cleaf, WUE, and other leaf characteristics between canopy and understory foliage was
typical of patterns commonly observed in forest canopies. Consistent with our aboveground
data, no differences in δ13Csoil were found along edge to interior gradients. However, we did
detect significantly greater depletion of δ13CR-soil at forest edges relative to interiors, but this
pattern may be tied to shifts in species composition at edges rather than physiological
responses to edge effects. Overall, these results are consistent with other edge effects
research in Sarapiquí reporting the development of a dense wall of vegetation at these forest
edges (Forero and Finegan 2002, Schedlbauer et al. 2007). This dense vegetation appears to
be effective in sealing the forest edge, as we detected few forest functional changes in edge
zones.
Acknowledgements
Thanks to Leonel Coto for assistance in climbing trees and also to Stacy Sesnie,
Benjamin Miller, Erika Barrientos, and Bertha Gonzalez for help processing and analyzing
foliage. Germán Obando and Andrés Sanchún from FUNDECOR provided logistical support
for fieldwork. Thanks to the landowners in Sarapiquí who graciously permitted access to
their land. Helpful reviews of an earlier version of this manuscript were provided by Bryan
Finegan, John Marshall, and Paul McDaniel. This research was supported in part by NSF-
IGERT grant no. 0114304. The research described in this paper complies with the current
laws of Costa Rica.
References
Bonal D, Sabatier D, Montpied P, Tremeaux D, Guehl JM (2000a) Interspecific variability of
δ13C among trees in rainforests of French Guiana: functional groups and canopy
integration. Oecologia 124:454-468
Bonal D, Barigah TS, Granier A, Guehl JM (2000b) Late-stage canopy tree species with
extremely low δ13C and high stomatal sensitivity to seasonal soil drought in the tropical
rainforest of French Guiana. Plant, Cell Environ 23:445-459
Box GEP, Cox DR (1964) An analysis of transformations. J Royal Stat Soc B 26:211-252

33
Buchmann N, Brooks JR, Ehleringer JR (2002) Predicting daytime carbon isotope ratios of
atmospheric CO2 within forest canopies. Funct Ecol 16:49-57
Buchmann N, Guehl J-M, Barigah TS, Ehleringer JR (1997) Interseasonal comparison of
CO2 concentrations, isotopic composition, and carbon dynamics in an Amazonian
rainforest (French Guiana). Oecologia 110:120-131
Butterfield RP (1994) The regional context: land colonization and conservation in Sarapiquí.
In: McDade LA, Bawa KS, Hespenheide HA, Hartshorn GS (eds) La Selva: ecology and
natural history of a neotropical rain forest. The University of Chicago Press, Chicago, pp
299-306
Cerling TE, Soloman DK, Quade J, Bowman JR (1991) On the isotopic composition of
carbon in soil carbon dioxide. Geochim Cosmochim Acta 55:3403-3405
Chen J, Franklin JF, Spies TA (1995) Growing-season microclimatic gradients from clearcut
edges into old-growth forests. Ecol Appl 5:74-86
Clark DB, Clark DA (2000) Landscape-scale variation in forest structure and biomass in a
tropical rain forest. For Ecol Manage 137:185-198
Duursma RA, Marshall JD (2006) Vertical canopy gradients in δ13C correspond with leaf
nitrogen content in a mixed-species conifer forest. Trees 20:496-506
Ehleringer JR, Field CB, Lin Z, Kuo C (1986) Leaf carbon isotope and mineral composition
in subtropical plants along an irradiance cline. Oecologia 70:520-526
Ekblad A, Boström B, Holm A, Comstedt D (2005) Forest soil respiration rate and δ13C is
regulated by recent above ground weather conditions. Oecologia 143:136-142
Ekblad A, Högberg P (2001) Natural abundance of 13C in CO2 respired from forest soils
reveals speed of link between tree photosynthesis and root respiration. Oecologia
127:305-308
Evans JR, Seemann JR (1989) The allocation of protein nitrogen in the photosynthetic
apparatus: costs, consequences, and control. In: Briggs WR (ed) Photosynthesis. Alan R.
Liss, Inc., New York, pp 183-205
Evans JR, von Caemmerer S (1996) Carbon dioxide diffusion inside leaves. Plant Physiol
110:339-346
Farquhar GD, Ehleringer JR, Hubick KT (1989) Carbon isotope discrimination and
photosynthesis. Annu Rev Plant Physiol Plant Mol Biol 40:503-537

34
Farquhar GD, Lloyd J (1993) Carbon and oxygen isotope effects in the exchange of carbon
dioxide between terrestrial plants and the atmosphere. In: Ehleringer JR, Hall AE,
Farquhar GD (eds) Stable isotopes and plant carbon - water relations. Academic Press,
Inc., San Diego, pp 47-70
Farquhar GD, Richards RA (1984) Isotopic composition of plant carbon correlates with
water-use efficiency of wheat genotypes. Aust J Plant Physiol 11:539-552
Field C, Mooney HA (1986) The photosynthesis - nitrogen relationship in wild plants. In:
Givnish TJ (ed) On the economy of plant form and function. Cambridge University Press,
New York, pp 25-55
Forero A, Finegan B (2002) Efectos de borde en la vegetación de remanentes de bosque muy
húmedo tropical en el norte de Costa Rica, y sus implicaciones para el manejo y la
conservación. Rev For Centroam 38:39-43
Hanba YT, Miyazawa S-I, Terashima I (1999) The influence of leaf thickness on the CO2
transfer conductance and leaf stable carbon isotope ratio for some evergreen tree species
in Japanese warm-temperate forests. Funct Ecol 13:632-639
Hanba YT, Mori S, Lei TT, Koike T, Wada E (1997) Variations in leaf δ13C along a vertical
profile of irradiance in a temperate Japanese forest. Oecologia 110:253-261
Hartshorn GS (1972) The ecological life history and population dynamics of Pentaclethra
macroloba, a tropical wet forest dominant and Stryphnodendron excelsum, an occasional
associate. Ph.D. dissertation, University of Washington, Seattle
Huc R, Ferhi A, Guehl JM (1994) Pioneer and late stage tropical rainforest tree species
(French Guiana) growing under common conditions differ in leaf gas exchange
regulation, carbon isotope discrimination and leaf water potential. Oecologia 99:297-305
ITCR (2004) Atlas Costa Rica 2004. Instituto Tecnológico de Costa Rica, Cartago, Costa
Rica
Kapos V (1989) Effects of isolation on the water status of forest patches in the Brazilian
Amazon. J Trop Ecol 5:173-185
Kapos V, Ganade G, Matsui E, Victoria RL (1993) δ13C as an indicator of edge effects in
tropical rainforest reserves. J Ecol 81:425-432
Keel SG, Siegwolf RT, Körner C (2006) Canopy CO2 enrichment permits tracing the fate of
recently assimilated carbon in a mature deciduous forest. New Phytol 172:319-329

35
Lambers H, Chapin FSI, Pons TL (1998) Plant physiological ecology. Springer-Verlag New
York, Inc., New York
Laurance WF, Lovejoy TE, Vasconcelos HL, Bruna EM, Didham RK, Stouffer PC, Gascon
C, Bierregaard RO, Laurance SG, Sampaio E (2002) Ecosystem decay of Amazonian
forest fragments: a 22-year investigation. Cons Biol 16:605-618
Lauteri M, Scartazza A, Guido MC, Brugnoli E (1997) Genetic variation in photosynthetic
capacity, carbon isotope discrimination and mesophyll conductance in provenances of
Castanea sativa adapted to different environments. Funct Ecol 11:675-683
Leffler AJ, Evans AS (2001) Physiological variation among Populus fremontii populations:
short- and long-term relationships between δ13C and water availability. Tree Physiol
21:1149-1155
Marshall JD, Zhang J (1994) Carbon isotope discrimination and water-use efficiency in the
native plants of the north-central Rockies. Ecology 75:1887-1895
Medina E, Minchin P (1980) Stratification of d13C values of leaves in Amazonian rain
forests. Oecologia 45:377-378
Newmark WD (2001) Tanzanian forest edge microclimatic gradients: dynamic patterns.
Biotropica 33:2-11
Oberbauer SF (1983) The ecophysiology of Pentaclethra macroloba, a canopy tree species in
the rainforests of Costa Rica. Ph.D. dissertation, Duke University, Durham
Oberbauer SF, Strain BR, Riechers GH (1987) Field water relations of a wet-tropical forest
tree species, Pentaclethra macroloba (Mimosaceae). Oecologia 71:369-374
Pinheiro JC, Bates DM (2000) Mixed-effects models in S and S-Plus, 1st edn. Springer-
Verlag New York, Inc., New York
Reich PB, Walters MB, Ellsworth DS (1997) From tropics to tundra: global convergence in
plant functioning. Proc Natl Acad Sci U S A 94:13730-13734
Reich PB, Walters MB, Ellsworth DS (1992) Leaf life-span in relation to leaf, plant, and
stand characteristics among diverse ecosystems. Ecol Monogr 62:365-392
Sanford RL Jr, Paaby P, Luball JC, Phillips E (1994) Climate, geomorphology, and aquatic
systems. In: McDade LA, Bawa KS, Hespenheide HA, Hartshorn GS (eds) La Selva:
ecology and natural history of a neotropical rain forest. The University of Chicago Press,
pp 19-33

36
Schedlbauer JL, Finegan B, Kavanagh KL (2007) Rainforest structure at forest – pasture
edges in northeastern Costa Rica. Biotropica (in press)
Sternberg LSL, Mulkey SS, Wright SJ (1989) Ecological interpretations of leaf carbon
isotope ratios: influence of respired carbon dioxide. Ecology 70:1317-1324
Terwilliger VJ (1997) Changes in the δ13C values of trees during a tropical rainy season:
some effects in addition to diffusion and carboxylation by Rubisco? Am J Bot 84:1693-
1700
Tosi JA Jr (1969) Mapa ecológico, República de Costa Rica: según la clasificación de zonas
de vida del mundo de L.R. Holdridge. Tropical Science Center, San José, Costa Rica
Warren CR, Adams MA (2006) Internal conductance does not scale with photosynthetic
capacity: implications for carbon isotope discrimination and the economics of water and
nitrogen use in photosynthesis. Plant, Cell Environ 29:192-201
Warren CR, Ethier GJ, Livingston NJ, Grant NJ, Turpin DH, Harrison DL, Black TA (2003)
Transfer conductance in second growth Douglas-fir (Pseudotsuga menziesii
(Mirb.)Franco) canopies. Plant, Cell Environ 26:1215-1227
Williams Linera G, Domínguez-Gastelú V, García-Zurita ME (1998) Microenvironment and
floristics of different edges in a fragmented tropical rainforest. Cons Biol 12:1091-1102

37
Table 1. Within-leaf variation in δ13C measured for eight individual trees. Trees are identified by their crown position as either canopy (C) or understory (U). Among-leaflet variation in δ13C was measured in leaflets from the bottom, middle, and top third of the leaf. Within-leaflet variation in δ13C was measured at the base and tip of leaflets from the middle third of each leaf.
Among-leaflet δ13C (‰) Within-leaflet δ13C (‰)
Tree Bottom Middle Top Base Tip
C-1 -29.46 -29.48 -29.66 -29.63 -29.35
C-2 -28.37 -28.24 -28.26 -28.56 -28.60
C-3 -28.76 -28.56 -28.44 -28.66 -28.61
C-4 -29.31 -29.05 -29.01 -29.29 -28.90
C-5 -31.16 -31.07 -31.10 -30.99 -30.88
U-1 -31.20 -31.30 -31.30 -31.32 -31.27
U-2 -31.55 -31.54 -31.65 -31.56 -31.55
U-3 -31.42 -31.57 -31.71 -32.09 -31.60

38
Table 2. Mean LMA, Nmass, and Narea ± one standard error for canopy and understory foliage as a function of distance to the forest edge.
Distance to forest edge (m) LMA (g m-2) Nmass (mg g-1) Narea (g m-2)
Canopy foliage
0 68.28 ± 0.82 26.20 ± 0.62 1.79 ± 0.06
25 62.26 ± 2.29 27.35 ± 0.59 1.72 ± 0.09
50 66.29 ± 1.48 26.83 ± 0.64 1.77 ± 0.05
100 65.43 ± 1.92 26.90 ± 0.60 1.76 ± 0.07
200 69.15 ± 1.65 26.68 ± 0.70 1.84 ± 0.05
300 68.08 ± 1.46 26.12 ± 0.51 1.78 ± 0.04
Understory foliage
0 36.67 ± 1.19 31.34 ± 0.66 1.15 ± 0.04
25 33.71 ± 0.89 31.91 ± 0.40 1.08 ± 0.03
50 35.27 ± 0.70 31.01 ± 0.71 1.10 ± 0.04
100 37.04 ± 2.07 31.95 ± 0.64 1.17 ± 0.05
200 34.72 ± 0.82 30.65 ± 0.59 1.06 ± 0.02
300 33.91 ± 0.82 31.80 ± 0.51 1.08 ± 0.03

39
Distance to forest edge (m)
0 25 50 100 200 300δ13
Cle
af (‰
)
-34
-32
-30
-28
-26
CanopyUnderstory
Figure 1. Mean δ13Cleaf ± one standard error of Pentaclethra macroloba canopy and understory foliage as a function of distance to the forest edge.

40
Distance to forest edge (m)
0 25 50 100 200 300
WU
E (m
mol
mol
-1)
0
5
10
15
20
25CanopyUnderstory
Figure 2. Estimated WUE ± one standard error for Pentaclethra macroloba canopy and understory foliage as a function of distance to the forest edge.

41
Distance to forest edge (m)
0 25 50 100 200 300δ13
C (‰
)
-30
-29
-28
-27
-26
-25
Mineral soilSoil respired CO2
Figure 3. δ13Csoil and δ13CR-soil ± one standard error as a function of distance to the forest edge.

42
CHAPTER 3. SOIL CARBON DYNAMICS IN A CHRONOSEQUENCE OF SECONDARY FORESTS IN
NORTHEASTERN COSTA RICA
Abstract
Secondary forests are becoming an increasingly important tropical landscape component
with the potential to provide environmental services such as soil carbon storage. Substantial
losses of soil carbon can occur with tropical forest conversion to pasture, but stocks can
sometimes be restored with the development of secondary forest. Few studies have taken
advantage of shifts in vegetation from C4 to C3 communities to determine soil carbon
turnover following secondary forest development on pasture. We expected to find evidence
of gradual soil carbon turnover and an increase in soil carbon storage following pasture
abandonment. Three early successional and nine late successional secondary sites ranging in
age from 2.6 to 33 years, as well as four pastures were used in this study. At each site,
mineral soil samples to 30 cm depth were collected from three plots to determine bulk
density, percent soil carbon, and stable carbon isotope values (δ13C). The δ13C of soil
respired CO2 was also determined at each site. Pastures stored 19% more carbon than early
and late successional sites in the top 10 cm of mineral soil, though successional sites stored
14-18% more carbon than pastures between 10 and 30 cm. Contrary to expectations, soil
carbon storage did not increase with secondary forest age and was unrelated to increases in
aboveground carbon storage. However, δ13C data showed that soil carbon in the top 30 cm
of soil turned over within ten years of pasture abandonment and subsequent colonization by
trees. Overall, these data indicate that soil carbon cycling can recover rapidly following
pasture abandonment, though total soil carbon storage may remain unchanged. The
conservation value of secondary forests within a highly fragmented landscape such as that in
northeastern Costa Rica is augmented by the recovery of soil carbon cycling in these forests.
Introduction
The tropics provide a significant carbon (C) reservoir, particularly belowground, where it
is estimated that the top three meters of soil beneath tropical evergreen forests store 474 Pg
of C globally (Jobbágy & Jackson, 2000). This represents approximately 20% of total global
soil C storage, so mobilization of soil C through land use transitions (e.g. forest to
agricultural conversions) may have wide ranging impacts. The recruitment of forest
following abandonment of intensively used land is often related to increased soil C storage

43
(Post & Kwon, 2000; Guo & Gifford, 2002), suggesting that secondary forest recruitment
may significantly increase soil C stores in landscapes with widespread land abandonment.
Studies of soil C storage in tropical secondary forests are increasingly common (e.g.
Hughes et al., 2002; Feldpausch et al., 2004), but have rarely taken advantage of stable C
isotope methods to examine soil C origin and turnover. The origin of soil C following land
use conversions between forests dominated by C3 vegetation and tropical pastures or
savannas with C4 grasses can be studied using stable C isotope values (δ13C) in mineral soil
(Ehleringer et al., 2000). Because the C3 and C4 photosynthetic pathways discriminate
differently against the heavier C isotope, 13C, it is possible to determine the vegetation type
from which soil organic matter is derived. Typically, studies employing these δ13C data have
focused on forest to pasture transitions (Trumbore et al., 1995; Powers & Veldkamp, 2005)
and historical ecotone dynamics (Mariotti & Peterschmidtt, 1994; Desjardins et al., 1996).
There have been few studies primarily concerned with secondary forest recruitment
following pasture abandonment (e.g. de Camargo et al., 1999; Rhoades et al., 2000).
Secondary forest development has proved an important element of landscape dynamics in
some tropical regions (Grau et al., 2003; Arroyo-Mora et al., 2005), and is likely to increase
in global prominence as a landscape feature (Wright, 2005). As such, it is critical to gain an
understanding of how C dynamics change in response to land abandonment and secondary
forest development. However, soil C storage varies with factors such as land use history and
intensity, soil mineralogy, and topography (Post & Kwon, 2000; Powers & Veldkamp, 2005),
necessitating regional studies of soil C storage. These data are used in global and regional
modeling of changes in C storage following land use transitions (Trumbore, 1997), but are
also of local interest as monetary valuation of environmental services such as C storage
becomes increasingly common (Pagiola et al., 2002).
In Costa Rica, a 1996 Forestry Law (No. 7575) introduced a novel program of payments
for environmental services (PES) directed toward private landowners who agree to protect
natural forests or establish tree plantations. Carbon sequestration is one of the environmental
services targeted by PES and was integrated into the program given its potential to raise
funds and support local livelihoods as global C markets develop (Miranda et al., 2004). PES
contracts for natural secondary regeneration were recently incorporated into the program, but
are currently confined to Guanacaste in northwestern Costa Rica, the site of large-scale

44
pasture abandonment (Arroyo-Mora et al., 2005; FONAFIFO, 2006). While regional studies
of soil C dynamics in Costa Rica’s secondary forests are uncommon, they are essential in
quantifying C services provided by these forests. Further, these data may be valuable in
guiding the future distribution of PES contracts.
Our objective was to examine mineral soil C storage and origin in secondary forests
following pasture abandonment. We investigated δ13C values of mineral soil (δ13Csoil) and
soil respired CO2 (δ13CR-soil) relative to secondary forest age. A chronosequence of naturally
regenerating secondary forest sites spanning 30+ years of development was used for this
purpose. We expected to find evidence of forest recovery toward primary forest conditions
by means of increased soil C storage and a gradual rise in C3-derived C as secondary forests
developed on abandoned pastures.
Methods
Study Region
This study was conducted in the Sarapiquí region of northeastern Costa Rica, an area
primarily classified as tropical wet forest by the Holdridge life zone system (Tosi, 1969).
Mean annual rainfall in the region is ~4000 mm and annual temperatures average 26°C with
little seasonal variation (Sanford et al., 1994). The landscape in Sarapiquí consists primarily
of fragmented forests with interspersed pasture and crop land.
Field Sites and Chronosequence Approach
A chronosequence of twelve secondary forest sites was used in this study, and all sites
had a previous land use history as pasture (Table 1). Sites ranged in age from 2.6 to 33 years,
with age 0 as the date of pasture abandonment. Three sites, C-2.6, C-2.8, and C-7, were in
the early-successional charral phase of development, characterized by shrubs, vines, grass,
ferns, and herbaceous cover. The nine older sites were all tree dominated and eligible for
legal classification as forest under Costa Rica’s 1996 Forestry Law. Four pastures ≥ 18 years
old with a grazing intensity of 1-2 cows per ha were also selected for sampling (Table 1).
Study sites ranged in elevation from 60 to 330 m a.s.l. and were characterized by low,
undulating hills. All sites but one were located on acidic, highly weathered Ultisols
(Tropohumult) derived from volcanic parent material (ITCR 2004). The oldest secondary
forest site, SF-33, was located on an acidic Inceptisol (Dystropept) with low fertility derived
from alluvial deposits of volcanic origin (ITCR 2004).

45
In employing a space-for-time substitution to study secondary forest C storage and
cycling, differences among sites may introduce variation unrelated to secondary development
(Yani et al., 2000; Yani et al., 2003). However, sites were carefully chosen from within a
224 km2 area to minimize differences among variables such as land use history and
topography. Chronosequence approaches are efficient in determining the potential of
secondary forests to recover biogeochemical cycles, relative to alternative approaches.
Several decades are necessary to complete repeated measures studies of naturally
regenerating forests, and while this approach may reduce variation, the expense and time
commitment is often prohibitive. Well-chosen sites within a chronosequence can yield
valuable data within a short period of time.
Soil Sampling
At each site we established three randomly located plot centers separated by at least 30
m. Within a 5 m radius of each plot center, soil samples were collected using a 6.35 cm
diameter soil core sampler and slide hammer (AMS Inc., American Falls, ID, USA). When
present, the litter layer was removed prior to sampling of mineral soil. Samples were taken
from four locations around the plot center at 0-10, 10-20, and 20-30 cm depths. Three
samples per depth were composited for δ13C and % soil C determination, and the fourth
sample was used for bulk density determination. All soil samples were air dried, and bulk
density samples were further oven dried for 48 hours at 70°C to remove residual moisture.
Bulk density samples were weighed to the nearest hundredth of a gram and no correction was
made for gravel because it was extremely rare in these soils. All soil samples tested negative
for the presence of carbonates using 1.0 M HCl.
Composited soil samples from each plot were sieved through a 2 mm mesh screen to
remove fine roots, and subsamples of the homogenized soils were crushed into a fine powder.
δ13Csoil and % C content were determined by continuous-flow isotope ratio mass
spectrometry (CF-IRMS) using a CE Instrument's NC2500 elemental analyzer coupled with
the Finnigan MAT Delta-plus IRMS (Thermo Electron Corporation, Bremen, Germany) at
the Idaho Stable Isotopes Laboratory (ISIL). Stable C isotope data are reported in delta
notation as follows,
δ13C = (Rsample / Rstandard -1) × 1000

46
where R is the ratio of 13C to 12C in the sample vs. a standard (PDB). Fifteen duplicate soil
samples were analyzed and showed a mean difference of 0.25‰.
For bulk density determination, volume corrections of 98.4% and 95.9% of the intended
sample volume were applied at the 10-20 and 20-30 cm depths, respectively, due to sampling
induced compaction. Corrected soil volumes were used to calculate bulk density at those
depths. No compaction occurred at the 0-10 cm depth. Soil C concentrations were
multiplied by bulk density, sampling depth, and an area conversion factor to express
measures of soil C content in Mg C ha-1.
Soil Respired CO2 Sampling
At each site, chambers used to sample soil respired CO2 were placed at the three plot
centers. Chambers were constructed from 9-L plastic pans with a hole drilled in the pan
bottom. A threaded brass coupling fitted with a compression nut and rubber septum was
screwed into the hole and sealed with silicone on the exterior side of the pan. To install
chambers, vegetation beneath the chamber was clipped to the ground to eliminate any
aboveground respiratory inputs. A shallow circle was gently excavated in the soil, over
which the chamber was inverted. Care was taken not to disturb any roots. Soil from outside
the study area was placed around the base of the chamber to minimize diffusion of
atmospheric air into the chamber.
Preliminary testing indicated that chambers equilibrated with soil air within four days of
placement on the soil surface (data not shown). Chambers were therefore left on the soil
surface for a minimum of five days, at which time a 15 ml air sample was drawn into a
syringe. Air samples were injected into evacuated 12 ml septum-capped glass vials (Labco®
Exetainer, Labco Limited, High Wycombe, UK) and sent to the ISIL for analysis of δ13C and
CO2 concentration ([CO2]). Samples were analyzed three to eight days after collection with
CF-IRMS, using Finnigan MAT’s GasBench II coupled with the Finnigan MAT Delta-plus-
XP IRMS.
It was expected that all samples contained a mixture of atmospheric and soil respired CO2
because a portion of the CO2 in soil profiles is of atmospheric origin (Cerling et al., 1991).
Therefore, a Keeling plot approach was used to estimate the δ13C values of pure respired CO2
(Steinmann et al., 2004). Individual Keeling plots for each chamber measurement were
generated by plotting δ13C vs. the inverse of [CO2] using two points; one from the sample

47
and the other from well-mixed atmospheric air with a δ13C value of -8‰ and [CO2] of 377
ppm (Keeling & Whorf, 2005). The linear relationship between these variables was used to
determine the true isotopic composition of the respired CO2. This value was derived from
each regression’s y-intercept and was further corrected by -4.4‰ to account for the
difference in diffusion rates between 13CO2 and 12CO2 molecules in the soil matrix (Cerling
et al., 1991) to yield δ13CR-soil.
Data Analyses
Statistical analyses were not performed to examine changes in soil C storage, δ13Csoil, or
δ13CR-soil relative to site age. Our measurements represent subsamples from one site per age
category, and this characteristic precludes the application of analysis of variance (ANOVA).
However, we modeled δ13Csoil at all three soil depths relative to increased site age with the
logistic growth model,
y = (β0 × β1) / (β0 + (β1 – β0) exp (−β2 × x))
where y is δ13Csoil, x is site age, β0 is the y-intercept, β1 is the asymptote, and β2 indicates the
maximum rate of change. Site means from each pasture, charral, and secondary forest site
were used to create these models. The statistical language R (version 2.0.1, R Core
Development Team 2004) was used for all modeling.
Results
Soil Carbon Storage
Between 0 and 10 cm, % soil C (Table 2) and mineral soil C storage (Fig. 1a) were
variable with no clear pattern of increased C storage coincident with successional
development. This was also true at depths of 10-20 and 20-30 cm, though within-site
variation declined with increased soil depth (Table 2, Fig. 1b, c). Relative to pasture, soils
under natural regeneration stored a slightly lower amount of soil C between 0 and 10 cm
(Fig. 1a). Increased soil C storage in regenerating stands, relative to pasture, was detected
between 10 and 30 cm depth (Fig. 1b, c). From 0-30 cm, charral and secondary forests
stored an average of 49% of total soil C in the top 10 cm, with decreased concentrations at
10-20 (30%) and 20-30 (21%) cm depths. Increases in aboveground C storage reported at the
nine secondary forest sites after ~25 years of development (Morse et al., unpublished
manuscript) were not related to any changes in mineral soil C storage (Fig. 2).

48
δ13Csoil
δ13Csoil in secondary sites decreased rapidly with time following pasture abandonment at
all soil depths (Fig. 3). Because the three youngest sites were charrals, they contained
transitional vegetation between pasture and secondary forest. As such, these sites had δ13Csoil
values similar to those found in pasture. Following establishment of tree cover on secondary
sites, the δ13Csoil between 0 and 10 cm depth became more depleted than values derived from
charral or pasture. However, these values did not change with increased secondary forest
age. At 10-20 and 20-30 cm soil depths, δ13Csoil from all sites began to converge, although
secondary forest sites had a consistently more depleted signal than pasture (Fig. 3 b, c).
Within-site variation in δ13Csoil was higher in charrals than in secondary forest sites (Fig. 3).
As observed in the soil C data, within-site variation declined with increased depth.
Logistic growth models showed a gradual enrichment in the value denoting the model’s
asymptote (β1) with increased soil depth (Table 3). The y-intercept (β0) was more depleted
with increased depth, while the maximum rate of change (β2) was similar and had large
standard errors for all soil depths (Table 3).
δ13CR-soil
δ13CR-soil values followed a similar pattern to those observed for mineral soil. Charral
sites had more enriched δ13CR-soil than secondary forest sites (Fig. 4). The value for C-7 in
particular was very close to the mean δ13CR-soil in pastures. This was likely because C-7
contained more grass than either of the other charral sites. As with the soils data, secondary
forest sites varied little in δ13CR-soil once trees were established, and these sites had a mean
δ13CR-soil of -30.08 ± 0.09‰ (± values indicate one standard error throughout the text). δ13CR-
soil was consistently more depleted than δ13Csoil at all depths in all secondary forest and most
charral sites (Fig. 5). The opposite tended to be true for pasture sites, with δ13CR-soil more
enriched than δ13Csoil (Fig. 5).
Discussion
Soil Carbon Storage
In contrast with our expectations, soil C storage in secondary forests from 0-30 cm did
not increase with age. Increased leaf litter inputs commonly associated with secondary forest
development (Brown & Lugo, 1990a, b; Guariguata & Ostertag, 2001) did not lead to an
increase in soil C stocks. Within each depth class, secondary forest soil C storage was

49
roughly the same through time (Fig. 1) and did not show any relationship with increased
aboveground C storage (Fig. 2). Although a lack of soil C accumulation with increased
forest age is not common in the tropics (Brown & Lugo, 1990a; Rhoades et al., 2000;
Feldpausch et al., 2004), it has been previously reported (Hughes et al., 1999).
Recent evidence from the Sarapiquí region suggests that changes in soil C storage
following forest to pasture conversions are not detectable in the top 30 cm of soil. Powers &
Veldkamp (2005) found that mean values of mineral soil C storage were similar in primary
forest (80.5 Mg C ha-1) and pasture (76.7 Mg C ha-1), though variation was high and best
explained by topographic features and soil mineralogy. In the present study, mineral soil C
content from 0-30 cm depth in pastures was 75.0 Mg C ha-1, while in charral and secondary
forest sites it was 72.5 Mg C ha-1. These small differences between land use types are
consistent with changes found following conversion of primary forest to pasture.
An additional study of forest to pasture conversion in Sarapiquí showed no change in
mineral soil C content at 0-30 cm depth in highly weathered soils derived from lava flows
(Veldkamp et al., 2003). As deforestation is reversed and natural regeneration begins, it
follows that a significant increase in mineral soil C may not occur in these soils. We
confined our study sites to old volcanic soils in Sarapiquí, so it is not surprising that our data
are consistent with the pattern observed by Veldkamp et al. (2003). While the top 30 cm of
volcanic mineral soils may stabilize a fairly consistent amount of C through land use
transitions, data from Sarapiquí that show that soil C losses of 20+% occur in the subsoil (>1
m depth) following forest to pasture conversion (Veldkamp et al., 2003). Further study will
be essential in quantifying the effects of secondary forest recovery on soil C dynamics in
deep soils.
Factors associated with soil mineralogy may be responsible for the relatively consistent
amount of C stored in surface soils under developing secondary forests. In Sarapiquí, Powers
& Schlesinger (2002) found soil C stabilization occurring at low elevation sites from
aluminum – humus linkages, while noncrystalline clays were active in C stabilization at sites
above 120 m. Both of these mineralogical properties are associated with high C storage
capacity and may reduce C losses in surface soils following land use transitions. Hughes et
al. (1999) suggested that the substantial soil C storage capacity of young volcanic soils was

50
responsible for a similar pattern of stable soil C storage in developing secondary forests of
Los Tuxtlas, Mexico.
Although the amount of C stored in surface mineral soils was relatively unvarying
following land use transitions, the distribution of C in the soil profile appeared to change
with the source of detrital inputs (i.e., leaf litter, shallow vs. deep roots) (Jackson et al., 1996;
Jobbágy & Jackson, 2000). Pastures stored 19% more soil C in the top 10 cm of mineral soil
than charrals or secondary forests, perhaps as a result of high fine root density in pasture,
relative to forest (Rhoades et al., 2000; Powers & Veldkamp, 2005). As natural regeneration
proceeded and pastures became colonized by more deeply rooted species with higher leaf
litter inputs, soil C storage at depths of 10-30 cm increased relative to pasture. Specifically,
charral and secondary forest sites stored 14 and 18% more soil C at depths of 10-20 and 20-
30 cm, respectively.
δ13Csoil
Recovery of soil C cycling in secondary forests occurs rapidly in the Sarapiquí region of
Costa Rica. Although we expected a gradual decline in secondary forest δ13Csoil as time since
pasture abandonment increased, this was not the case. Once naturally regenerating sites
became dominated by trees and C inputs to the system were predominantly from C3
vegetation, the C4 δ13C signal rapidly diminished (Fig. 3). In the top 10 cm of soil, the mean
δ13Csoil in secondary forests was -27.21 ± 0.07‰, while the modeled asymptote of δ13Csoil
was -27.87 ± 1.35‰ (Table 3). The agreement of these values and their similarity to the
mean δ13Csoil found in Sarapiquí’s primary forests, -27.96 ± 0.05‰ (J.L. Schedlbauer,
unpublished manuscript), indicate that most pasture-derived C rapidly turned over in the top
10 cm of secondary forest mineral soil. In the Brazilian Amazon, data from a study of C
turnover rates, rather than a chronosequence, also showed that secondary forests rapidly turn
over C in the top 10 cm of soil (de Camargo et al., 1999). However, these results are
contrary to those found in secondary forests of the Ecuadorian Amazon where δ13Csoil slowly
declined with increased secondary forest age (López-Ulloa et al., 2005). These differences
are suggestive of variable soil C dynamics following land use change across soil types and
ecosystems.
We did not observe any effects of land use history in the secondary forest δ13Csoil data.
Soils in secondary forest sites known to have been used as active pasture for 3-6 years (SF-28
51
and SF-33) had similar δ13Csoil values as sites that spent ~20 years as pasture (SF-22 and SF-
23) at all depths (Table 1, Fig. 3). As is the case in numerous tropical forest sites (de
Camargo et al., 1999; Rhoades et al., 2000; Telles et al., 2003), we observed the classical
pattern of mineral soil 13C enrichment with depth in all secondary forest sites. This pattern is
commonly attributed to some combination of the Suess effect, favored decomposition of
isotopically light C by microbes, microbial fractionation during decomposition, and mixing
of soil C in the profile through time (Ehleringer et al., 2000).
We anticipated gradual depletion in δ13Csoil with increased secondary forest age, relative
to pasture. This pattern was observed only in the early-successional charrals where δ13Csoil
declined with increased age since pasture abandonment (Fig. 3). However, δ13Csoil in the two
youngest charrals was consistently more enriched than the mean value for pasture sites at all
soil depths. This pattern cannot be explained by land use history effects, as both of these
charrals spent ~22 years as managed pasture, and pasture sites were 18-25 years old.
Instead, the enrichment in δ13Csoil at these charral sites may be due to variation in species
composition and the mix of C3 and C4 plants at these sites. Natural variation among sites
may influence δ13Csoil at the time of pasture abandonment. Overall, the pattern of charral
δ13Csoil observed with depth was most consistent with that found in pasture. This is not
surprising, given that charrals contain a heterogeneous mixture of C3 and C4 vegetation.
Further, it is likely that this heterogeneity contributed to the large standard errors associated
with δ13Csoil in the three charral sites, relative to secondary forest (Fig. 3).
The mean value of δ13Csoil reported for pastures from 0-10 cm depth is lower than would
be expected in a system with pure C4 vegetation. The δ13C value of leaf litter inputs from C4
vegetation typically ranges from -11 to -13‰ (Cerling et al., 1997). Pastures in Sarapiquí
contain a mixture of grasses, woody species, and remnant trees, resulting in a mixed δ13C
signal that reflects the vegetation composition (Powers & Veldkamp, 2005). Additionally,
the age of pastures in Sarapiquí has been positively related to δ13Csoil in sites between 3 and
60 years old (Powers and Veldkamp 2005). It is therefore likely that the 18-25 year old
pastures sampled in this study contained old forest-derived soil C that contributed to the
relatively depleted δ13Csoil signal. This conclusion is corroborated by the observed depletion
in pasture δ13Csoil with depth (Fig. 3), a pattern commonly observed in pastures and savannas

52
previously dominated by C3 vegetation (Martin et al., 1990; Rhoades et al., 2000). This
pattern has been related to the persistence of resistant C3 forest-derived C in the soil.
Additional data from pastures and secondary successional sites would advance our
understanding of soil C turnover with increased successional age in tropical forests. In
particular, the logistic growth models used to describe the relationship between δ13Csoil and
site age could be improved by the inclusion of old pasture sites, in which δ13Csoil had
stabilized. The addition of more sampling sites in early stages of secondary forest
succession, where the highest variation and fastest rate change in δ13Csoil were observed (Fig.
3), would contribute to a better understanding of how quickly soil C turns over in these
systems.
δ13CR-soil
Across sites, soil respired CO2 data showed a similar isotopic pattern to that detected in
the top 10 cm of mineral soil (Fig. 4). This was not unexpected because, while measures of
soil respired CO2 reflect a mixture of heterotrophic and autotrophic respiration, the transition
from a C4 to a C3 dominated system should be evident. Secondary forest sites had a mean
δ13CR-soil of -30.08 ± 0.09‰, consistent with expectations for sites dominated by C3
vegetation. The low variation in this value following tree establishment in regenerating sites
was consistent with the δ13Csoil data. δ13CR-soil in charrals was intermediate between those of
pasture and forest due to their mixed vegetation, and the δ13CR-soil in pasture reflected a
strong influence of C4 vegetation.
In comparison with δ13Csoil data from 0-10 cm in secondary forests, δ13CR-soil values were
nearly 3‰ more depleted (Fig. 3a, 4). This is a strong indication that the C being turned over
in these forests is of C3 origin and is consistent with data from mature forests in the Brazilian
Amazon (Trumbore et al., 2006). Soil respired CO2 in charrals tended to have a more
depleted δ13CR-soil than was observed in the top 10 cm of mineral soil. These data suggest
that root respiration by C3 plants or the decomposition of new C3 organic material strongly
influenced the respiratory signal. It was surprising that the signal from C4 organic material
decomposition was not more prominent in charral sites, in light of the rapid loss of a C4
mineral soil signal in developing secondary forests. The δ13CR-soil in pastures was ~1‰ more
enriched than of the top 10 cm of mineral soil, likely reflecting the influence of root
respiration from C4 plants.

53
In general, the δ13CR-soil was a poor predictor of δ13Csoil within and across land use types
(Fig. 5). It appears that root and rhizosphere respiration by the dominant vegetation type is
of central importance in determining δ13CR-soil. This observation is supported by data from
Trumbore et al. (2006) that show the δ13C values of soil CO2 and roots to be more similar
than those of soil CO2 and soil organic matter.
Chronosequence Approach
Variation among sites for reasons unrelated to site age can introduce error when using a
chronosequence approach to study dynamic processes (Yani et al., 2000; Yani et al., 2003).
In the present study, variation in land use history was likely the most significant factor
affecting the variables of interest. The length of time each site was used as pasture, as well
as grazing intensity and management practices may have long-term effects on mineral soil C
storage and δ13C data. Site factors such as landscape composition, aspect, slope, elevation,
and soil type may also locally influence mineral soil C storage, δ13Csoil, and δ13CR-soil. The
number and diversity of factors that may vary among sites within a chronosequence highlight
the need for detailed time series measurements within individual sites, as suggested by
Chazdon et al. (in press).
Conclusions
Mineral soil C storage beneath secondary forests was fairly consistent as forest
development progressed. The total amount of C in soils following pasture abandonment was
relatively unchanged, but the distribution of soil C shifted, with increased C accumulation at
10-30 cm in charral and secondary forest sites, relative to pasture. Pasture-derived C was
rapidly lost in naturally regenerating stands. After ~10 years, soil C cycling resembled that
of a C3-dominated forest, as evidenced by both δ13Csoil and δ13CR-soil values. The relatively
rapid recovery of the soil C cycle following pasture abandonment highlights one of the
values of secondary forest.
In a highly fragmented and heterogeneous landscape, such as that of Sarapiquí, secondary
forests have the potential to provide C services while contributing to other conservation
objectives such as biodiversity conservation and forest connectivity. These forests develop
naturally with little to no human intervention, and are protected by Costa Rican law once
established. Unfortunately few incentives exist to promote the establishment of secondary
forest in Sarapiquí while more profitable land uses exist. We suggest that further targeting of

54
Costa Rica’s PES program to support natural regeneration in Sarapiquí would have positive
benefits for C cycling and other environmental services across the landscape.
Acknowledgements
Thanks to Edwin Pereira, Marvin Zamora, Vicente Herra, and José Manuel Ulate for
assistance in the field. Germán Obando and Andrés Sanchún, both of FUNDECOR, helped
greatly to facilitate fieldwork. Laboratory assistance was provided by Bob Brander, Yaneth
Sanchez, and Jennifer Nalder. Thanks to Robin Chazdon and Juan Pablo Arroyo for
contributing data from their secondary forest plots and allowing us to share their field sites.
Bryan Finegan, John Marshall, Paul McDaniel, and Steve Blecker provided helpful reviews
of earlier versions of this manuscript. Thanks to numerous landowners in the study area for
providing access to their farms and forests. This research was supported in part by NSF-
IGERT grant no. 0114304.
References
Arroyo-Mora JP, Sánchez-Azofeifa GA, Rivard B , Calvo JC, Janzen DH (2005) Dynamics
in landscape structure and composition for the Chorotega region, Costa Rica from 1960
to 2000. Agriculture, Ecosystems and Environment, 106, 27-39.
Brown S, Lugo AE (1990a) Effects of forest clearing and succession on the carbon and
nitrogen content of soils in Puerto Rico and US Virgin Islands. Plant and Soil, 124, 53-
64.
Brown S, Lugo AE (1990b) Tropical secondary forests. Journal of Tropical Ecology, 6, 1-32.
Cerling TE, Harris JM, MacFadden BJ, Leakey MG, Quade J, Elsenmann V, Ehleringer JR
(1997) Global vegetation change through the Miocene/Pliocene boundary. Nature, 389,
153-158.
Cerling TE, Soloman DK, Quade J, Bowman JR (1991) On the isotopic composition of
carbon in soil carbon dioxide. Geochimica et Cosmochimica Acta, 55, 3403-3405.
Chave J, Andalo C, Brown S, Cairns MA, Chambers JQ, Eamus D, Fölster H, Fromard F,
Higuchi N, Kira T, Lescure J-P, Nelson BW, Ogawa H, Puig H, Riéra, Yamakura T
(2005) Tree allometry and improved estimation of carbon stocks and balance in tropical
forests. Oecologia, 145, 87-99.

55
Chazdon, RL, Letcher SG, van Breugel M, Martínez-Ramos M, Bongers F, Finegan B (in
press) Rates of change in tree communities of secondary Neotropical forests following
major disturbances. Philosophical Transactions of the Royal Society B.
de Camargo PB, Trumbore SE, Martinelli LA, Davidson EA, Nepstad DC, Victoria RL
(1999) Soil carbon dynamics in regrowing forests of eastern Amazonia. Global Change
Biology, 5, 693-702.
Desjardins T, Carneiro Filho A, Mariotti A, Chauvel A, Girardina C (1996) Changes of the
forest-savanna boundary in Brazilian Amazonia during the Holocene revealed by stable
isotope ratios of soil organic carbon. Oecologia, 108, 749-756.
Ehleringer JR, Buchmann N, Flanagan LB (2000) Carbon isotope ratios in belowground
carbon cycle processes. Ecological Applications, 10, 412-422.
Feldpausch TR, Rondon MA, Fernandes ECM, Riha SJ, Wandelli E (2004) Carbon and
nutrient accumulation in secondary forests regenerating on pastures in central Amazonia.
Ecological Applications, 14, S164-S176.
FONAFIFO (2006) http://www.fonafifo.com/paginas_espanol/servicios_ambientales/sa_
estadisticas.htm
Grau HR, Aide TM, Zimmerman JK, Thomlinson JR, Helmer E, Zou X (2003) The
ecological consequences of socioeconomic and land-use changes in postagriculture
Puerto Rico. BioScience, 53, 1159-1168.
Guariguata MR, Ostertag R (2001) Neotropical secondary forest succession: changes in
structural and functional characteristics. Forest Ecology and Management, 148, 185-206.
Guo LB, Gifford RM (2002) Soil carbon stocks and land use change: a meta analysis. Global
Change Biology, 8, 345-360.
Hughes RF, Kaufmann JB, Cummings DL (2002) Dynamics of aboveground and soil carbon
and nitrogen stocks and cycling of available nitrogen along a land-use gradient in
Rondônia, Brazil. Ecosystems, 5, 244-259.
Hughes RF, Kauffman JB, Jaramillo VJ (1999) Biomass, carbon, and nutrient dynamics of
secondary forests in a humid tropical region of México. Ecology, 80, 1892-1907.
ITCR (2004) Atlas Costa Rica 2004. Instituto Tecnológico de Costa Rica, Cartago, Costa
Rica.

56
Jackson RB, Canadell J, Ehleringer JR, Mooney HA, Sala OE, Schulze ED (1996) A global
analysis of root distributions for terrestrial biomes. Oecologia, 108, 389-411.
Jobbágy EG, Jackson RB (2000) The vertical distribution of soil organic carbon and its
relation to climate and vegetation. Ecological Applications, 10, 423-436.
Keeling CD, Whorf TP (2005) Atmospheric CO records from sites in the SIO air sampling
network. In: Trends: A Compendium of Data on Global Change. Carbon Dioxide
Information Analysis Center, Oak Ridge National Laboratory, Oak Ridge.
2
López-Ulloa M, Veldkamp E, de Koning GHJ (2005) Soil carbon stabilization in converted
tropical pastures and forests depends on soil type. Soil Science Society of America
Journal, 69, 1110-1117.
Mariotti A, Peterschmitt E (1994) Forest savanna ecotone dynamics in India as revealed by
carbon isotope ratios of soil organic matter. Oecologia, 97, 475-480.
Martin A, Mariotti A, Balesdent J, Lavelle P, Vuattoux R (1990) Estimate of organic matter
turnover rate in a savanna soil by 13C natural abundance measurements. Soil Biology and
Biochemistry, 22, 517-523.
Miranda M, Porras IT, Moreno ML (2004) The social impacts of carbon markets in Costa
Rica: a case study of the Huetar Norte region. International Institute for Environment and
Development, London, 39 pp.
Pagiola S, Landell-Mills N, Bishop J (2002) Market-based mechanisms for forest
conservation and development. In: Selling Forest Environmental Services: Market-Based
Mechanisms for Conservation and Development (eds Pagiola S, Bishop J, Landell-Mills
N), pp. 1-13. Earthscan Publications Ltd., London.
Post WM, Kwon KC (2000) Soil carbon sequestration and land-use change: processes and
potential. Global Change Biology, 6, 317-327.
Powers JS, Veldkamp E (2005) Regional variation in soil carbon and δ13C in forests and
pastures of northeastern Costa Rica. Biogeochemistry, 72, 315-336.
Powers JS, Schlesinger WH (2002) Relationship among soil carbon distributions and
biophysical factors at nested spatial scales in rain forests of northeastern Costa Rica.
Geoderma, 109, 165-190.

57
Rhoades CC, Eckert GE, Coleman DC (2000) Soil carbon differences among forest,
agriculture, and secondary vegetation in lower montane Ecuador. Ecological
Applications, 10, 497-505.
Sanford RL Jr., Paaby P, Luball JC, Phillips E (1994) Climate, geomorphology, and aquatic
systems. In: La Selva: Ecology and Natural History of a Neotropical Rain Forest (eds
McDade LA, Bawa KS, Hespenheide HA, Hartshorn GS), pp. 19-33. The University
of Chicago Press, Chicago.
Steinmann K, Siegwolf RTW, Saurer M, Körner C (2004) Carbon fluxes to the soil in a
mature temperate forest assessed by 13C isotope tracing. Oecologia, 141, 489-501.
Telles ECC, de Camargo PB, Martinelli LA, et al. (2003) Influence of soil texture on carbon
dynamics and storage potential in tropical forest soils of Amazonia. Global
Biogeochemical Cycles, 17, 1040.
Tosi, JA Jr. (1969) Mapa ecológico, República de Costa Rica: Según la clasificación de
zonas de vida del mundo de L.R. Holdridge. Centro Científico Tropical, San José.
Trumbore S, da Costa ES, Nepstad DC, et al. (2006) Dynamics of fine root carbon in
Amazonian tropical ecosystems and the contribution of roots to soil respiration. Global
Change Biology, 12, 217-229.
Trumbore SE (1997) Potential responses of soil organic carbon to global environmental
change. Proceedings of the National Academy of Sciences, 94, 8284-8291.
Trumbore SE, Davidson EA, de Camargo PB, Nepstad DC, Martinelli LA (1995)
Belowground cycling of carbon in forests and pastures of Eastern Amazonia. Global
Biogeochemical Cycles, 9, 515-528.
Veldkamp E, Becker A, Schwendenmann L, Clark DA, Schulte-Bisping H (2003) Substantial
labile carbon stocks and microbial activity in deeply weathered soils below a tropical wet
forest. Global Change Biology, 9, 1171-1184.
Wright SJ (2005) Tropical forests in a changing environment. Trends in Ecology and
Evolution, 20, 553-560.
Yani RD, Currie WS, Goodale, CL (2003) Soil carbon dynamics after forest harvest: an
ecosystem paradigm reconsidered. Ecosystems, 6, 197-212.

58
Yani RD, Arthur MA, Siccama TG, Federer CA (2000) Challenges of measuring forest floor
organic matter dynamics: repeated measures from a chronosequence. Forest Ecology and
Management, 138, 273-283.

59
Table 1. Site history information for all study sites in the chronosequence of secondary succession. Site names denoted by “P” are pasture sites, those denoted by “C” are in the charral successional phase and those denoted by “SF” are secondary forest sites. Site age refers to the number of years since pasture abandonment. Site age and estimated time as managed pasture were determined through informal interviews with landowners and examination of historical aerial photographs.
Site Name Site age (years)
Estimated time as managed pasture
(years) Location (Lat, Long)P1-0 0 18 10°42'N, 84°10'W
P2-0 0 25 10°43'N, 84°8'W
P3-0 0 >20 10°46'N, 84°6'W
P4-0 0 20 10°43'N, 84°9'W
C-2.6 2.6 22 10°36'N, 84°10'W
C-2.8 2.8 22 10°37'N, 84°11'W
C-7 7 >12 10°47'N, 84°6'W
SF-8 8 <5 10°47'N, 84°5'W
SF-11 11 9 10°46'N, 84°6'W
SF-15 15 12 10°46'N, 84°1'W
SF-17 17 5 10°45'N, 84°7'W
SF-20 20 2-3 10°41'N, 84°3'W
SF-22 22 ~20 10°46'N, 84°6'W
SF-23 23 ~20 10°40'N, 84°11'W
SF-28 28 4-6 10°43'N, 84°3'W
SF-33 33 3-5 10°39'N, 84°13'W

60
Table 2. Mean ± one standard error of mineral soil carbon storage (% C) for each study site and sampling depth.
% Soil C
Site Name 0-10 cm 10-20 cm 20-30 cm
P1-0 5.98 ± 0.69 3.40 ± 0.29 2.20 ± 0.20
P2-0 5.79 ± 0.39 2.66 ± 0.24 2.01 ± 0.22
P3-0 3.56 ± 0.24 1.82 ± 0.37 1.59 ± 0.21
P4-0 7.12 ± 0.88 3.69 ± 0.31 2.28 ± 0.14
C-2.6 5.98 ± 0.05 3.68 ± 0.28 2.40 ± 0.23
C-2.8 5.29 ± 0.87 3.08 ± 0.76 2.09 ± 0.33
C-7 5.39 ± 0.34 3.51 ± 0.39 2.76 ± 0.15
SF-8 5.54 ± 0.90 2.89 ± 0.42 1.97 ± 0.21
SF-11 4.70 ± 0.19 3.50 ± 0.26 2.48 ± 0.29
SF-15 6.19 ± 0.04 2.80 ± 0.05 2.12 ± 0.14
SF-17 6.67 ± 0.50 4.43 ± 0.48 3.70 ± 0.43
SF-20 4.60 ± 0.52 3.04 ± 0.44 2.18 ± 0.41
SF-22 5.78 ± 0.28 3.72 ± 0.13 2.90 ± 0.25
SF-23 6.62 ± 0.56 3.71 ± 0.15 2.89 ± 0.31
SF-28 6.05 ± 0.42 4.02 ± 0.25 2.86 ± 0.06
SF-33 5.55 ± 0.46 3.25 ± 0.21 2.48 ± 0.10
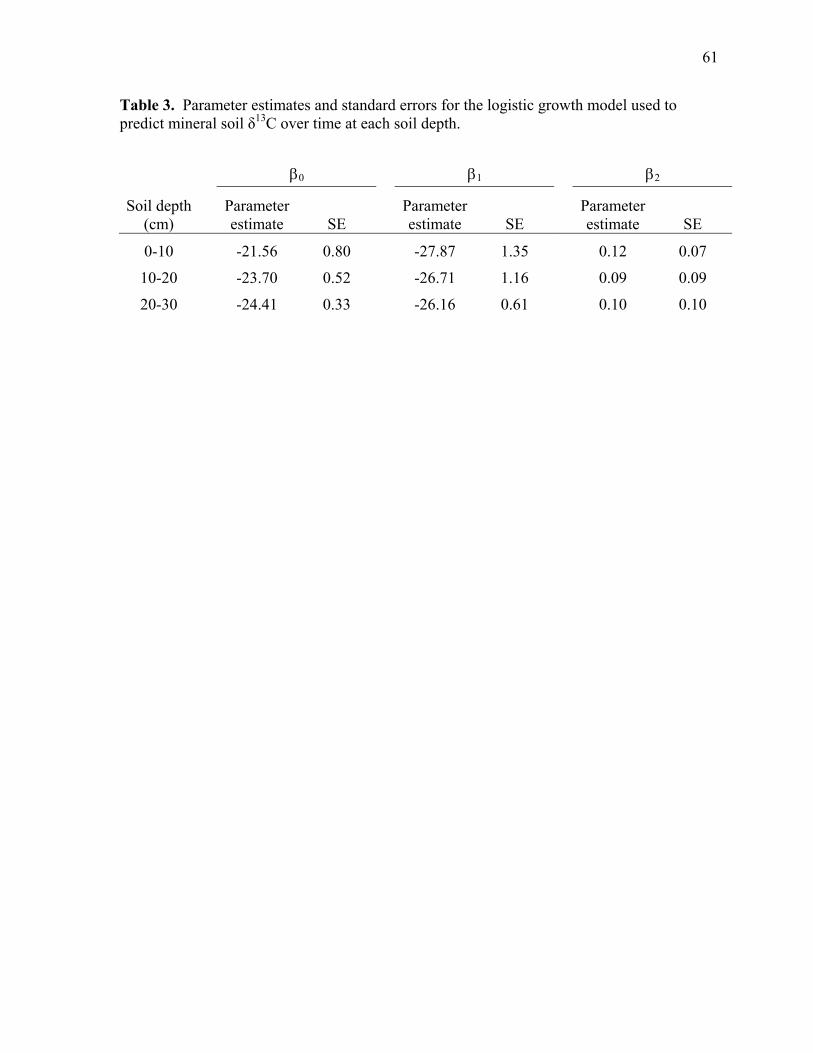
61
Table 3. Parameter estimates and standard errors for the logistic growth model used to predict mineral soil δ13C over time at each soil depth.
β0 β1 β2
Soil depth (cm)
Parameter estimate SE
Parameter estimate SE
Parameter estimate SE
0-10 -21.56 0.80 -27.87 1.35 0.12 0.07
10-20 -23.70 0.52 -26.71 1.16 0.09 0.09
20-30 -24.41 0.33 -26.16 0.61 0.10 0.10

62
aM
inea
ral s
oil C
(Mg
C h
a-1)
0
10
20
30
40
50
b
Min
eral
soi
l C (M
g C
ha-1
)
0
10
20
30
40
50
Site age (years)
0 5 10 15 20 25 30 35
Min
eral
soi
l C (M
g C
ha-1
)
0
10
20
30
40
50 c
Figure 1. Mean mineral soil carbon storage ± one standard error for charral and secondary forest sites at soil depths of (a) 0-10, (b) 10-20, and (c) 20-30 cm. The solid horizontal lines indicate mean soil carbon storage in pasture at the given depth with ± one standard error represented by dotted lines.

63
Aboveground C storage (Mg C ha-1)
0 20 40 60 80 100 120
Min
eral
soi
l C s
tora
ge (M
g C
ha-1
)
0
10
20
30
40
50
0-10 cm10-20 cm20-30 cm
Figure 2. Mean mineral soil carbon storage at each of the three soil depths (0-10, 10-20, and 20-30 cm) plotted against mean aboveground carbon storage in the nine secondary forest sites. Aboveground values were derived from the measurement of all stems ≥ 5 cm dbh in three 50×50 m plots per site. An allometric equation (Chave et al. 2005) was used to estimate aboveground biomass, a value that was halved to approximate aboveground carbon storage.

64
δ13C
soil (
‰)
-30
-28
-26
-24
-22
-20
-18δ13
Cso
il (‰
)
-30
-28
-26
-24
-22
-20
-18
Site age (years)
0 5 10 15 20 25 30
δ13C
soil (
‰)
-30
-28
-26
-24
-22
-20
-18
a
b
Figure 3. Mean mineral soil δ13C (δ13Csoil) ± oneforest sites at soil depths of (a) 0-10, (b) 10-20, anindicate mean δ13Csoil in pasture at the given depthdotted lines.
35
c
standard error for charral and secondary d (c) 20-30 cm. The solid horizontal lines with ± one standard error represented by

65
Site age (years)
0 5 10 15 20 25 30 35
δ13C
R-s
oil (
‰)
-32
-30
-28
-26
-24
-22
-20
-18
Figure 4. Mean δ13C of soil respired CO2 (δ13CR-soil) ± one standard error for all charral and secondary forest sites. The solid horizontal line indicates mean δ13CR-soil in pasture with ± one standard error represented by dotted lines.

66
δ13CR-soil (‰)
-35 -30 -25 -20 -15
δ13C
soil (
‰)
-35
-30
-25
-20
-15
CharralPastureSecondary Forest
δ13CR-soil (‰)
-35 -30 -25 -20 -15
δ13C
soil (
‰)
-35
-30
-25
-20
-15
δ13CR-soil (‰)
-35 -30 -25 -20 -15
δ13C
soil (
‰)
-35
-30
-25
-20
-15
a
b
c
Figure 5. Mean mineral soil δ13C (δ13Csoil) at depths of (a) 0-10, (b) 10-20, and (c) 20-30 cm vs. mean δ13C of soil respired CO2 (δ13CR-soil) for all pasture (○), charral (●), and secondary forest ( ) sites. The diagonal line through each plot is the 1:1 line.

67
CHAPTER 4. CONSEQUENCES OF ENVIRONMENTAL SERVICE PAYMENTS FOR FOREST
RETENTION AND RECRUITMENT IN A COSTA RICAN BIOLOGICAL CORRIDOR
Abstract
Compensation to landowners for forest-derived environmental services has gained
international recognition as a mechanism to combat forest loss and fragmentation. This
approach is widely promoted with little evidence demonstrating its prospects for encouraging
forest stewardship and conservation. Costa Rica provides a compelling case study where a
1996 Forestry Law initiated environmental service payments and prohibited forest
conversion to other land uses. We examined these novel policies to determine their influence
on landowner decisions that affect forest change, carbon services, and connectivity in a 2,400
km2 biological corridor. Landsat images were used to compare landcover changes before and
after 1996, and these data were linked to landowner surveys investigating land use decisions.
Carbon services provided by secondary forests were examined both above- and belowground.
Forest change observations were corroborated by landowner survey data, indicating that
environmental service payments contributed positively to forest retention and recruitment
following implementation of the 1996 Forestry Law. Rates of natural forest loss declined
from -1.43 to -0.20 % yr-1. Forest cover and connectivity increased through tree plantations
and secondary forest recruitment, but these forest types sometimes replaced natural forest
prior to 1996. Secondary forest carbon storage approached values found in primary forest
after 25-30 years of succession, though few landowners retained natural regeneration.
Secondary forests and attendant carbon services will persist as minor landscape components
without legal or financial incentives. The Costa Rican experience provides evidence that
environmental service payments can be effective in retaining natural forest and recruiting tree
cover when focused in biological corridors.
Introduction
Forest loss and fragmentation represent a global threat to biodiversity, ecosystem
processes, and human welfare (Millennium Ecosystem Assessment 2005). Demands on
forests and the environmental services they provide are projected to increase as development
pressures reduce remaining private forests lacking protected status (Defries and others 2005).
In response to these threats, incentive programs encouraging private forest stewardship have
emerged, offering compensation to landowners who retain forests and associated services

68
that might otherwise be lost to alternative land uses (Pagiola and others 2002). Direct
payments to landowners to plant or protect forests are promoted as an effective mechanism
for providing environmental services (Ferraro and Kiss 2002), consistent with the 1997
Kyoto Protocol and the 1992 Convention on Biological Diversity. However, the effects of
these payments on forest cover and targeted environmental services remain relatively
unknown.
Costa Rica presents a compelling case study to analyze an environmental service
payment program (pago por servicios ambientales, PSA) that provides direct payments to
landowners for reforestation, sustainable forest management, and natural forest protection.
Reforestation incentives for private landowners to establish tree plantations were first
initiated in Costa Rica following several decades of high deforestation (Watson and others
1998). During the mid-1980s, tradable bonds (CAF) and upfront payments (CAFA) became
available to cover costs associated with establishing and maintaining tree plantations
(Watson and others 1998). Additional incentives initiated in 1990 targeted sustainable forest
management (CAFMA) and were expanded in 1995 to include forest protection. Costa Rica
built on the legacy of these programs with the 1996 Forestry Law (no. 7575) that
implemented four novel features including: 1) a national definition of forest, 2) prohibition of
natural forest conversion to any other land use, 3) deregulation of tree plantation
management, and 4) a voluntary PSA program to compensate landowners for watershed
protection, biodiversity conservation, carbon sequestration, and aesthetic values.
Legal and institutional support for the PSA program is provided by the National Fund for
Forest Financing (FONAFIFO), an organization designed to promote sustainable rural
development among small and medium-sized landowners (Snider and others 2003). National
PSA priorities have concentrated efforts in biological corridors and poorly developed regions
of the country with more than US$124 million expended on >5000 km2 of land (FONAFIFO
2006). PSA contracts with landowners typically last for five years and payments range from
~$220 ha-1 for the forest protection program to $560 ha-1 for reforestation.
The objectives of 1996 Forestry Law and PSA are to provide environmental services
through forest stewardship; however their impacts on carbon storage, forest structure, and
connectivity in fragmented landscapes are unclear. Further, the relative influence of forest
policies and programs on landowner decisions to maintain or increase forest cover remains

69
poorly understood. Accordingly, we applied an integrated research approach to determine
the extent to which the 1996 Forestry Law and PSA incentives for landowners to maintain or
replant forests translate into enhanced forest conservation, carbon services, and connectivity.
We studied these processes in the San Juan ─ La Selva Biological Corridor, a PSA focal area
designed to retain linkages between protected areas in Costa Rica and southern Nicaragua
(Figure 1).
Studies of landcover change detection, ecosystem ecology, and rural sociology were
unified to address five specific questions: 1) Has the annual rate of forest loss declined
substantially for private forest land in the Corridor as expected under the 1996 Forestry Law?
2) To what extent are changes in forest cover attributable to the ban on forest clearing and/or
payments to protect forests? 3) Have incentives for reforestation been a major catalyst for
landowners to establish tree plantations? 4) What is the outlook for recruiting forest cover
via secondary succession as a potential source of valued carbon services under the 1996
Forestry Law? 5) Are PSA programs an effective conservation mechanism for retaining
habitat connectivity between protected areas?
Study Area
The present case study focuses on the San Juan – La Selva Biological Corridor (2,425
km2) in northern Costa Rica where PSA contracts occur on ~22% (538 km2) of the land area
(Rojas and Chaverría 2005). A larger surrounding study area (6,349 km2) was selected to
facilitate forest land change comparisons in areas bordering the Corridor (Figure 1). The
Corridor contains one of the largest aggregations of remnant forest in the region, and private
forests outside of protected areas represent an important connection between formerly
continuous montane and lowland forests (Butterfield 1994a). Diverse vegetation types in the
Corridor cross five Holdridge Life Zones and three transitional zones given the region’s
varied climatic conditions along altitudinal and longitudinal gradients (Holdridge 1967).
Costa Rica passed its first Forestry Law in 1969 (no. 4465) that has since undergone
several revisions. However, agricultural development and colonization programs have taken
precedent over forest stewardship, leading to forest cover reductions in the country’s
northern region since c. 1950 (Butterfield 1994b). Colonization programs expanded roads
and settlements during the 1970s to open territory to landless farmers (Butterfield 1994b),
while low interest loans for cattle production and high beef prices further enhanced land

70
colonization and conversion of forest to pasture (Schelhas 1996). Forests were used as an
open access resource by colonists, contributing to rapid deforestation and highly fragmented
landscape conditions (Butterfield 1994a).
A severe economic crisis at the end of the 1970s forced Costa Rica to accept monetary
assistance (Montanye and others 2000) tied to a series of structural adjustment loans that led
to the promotion of non-traditional export crops (e.g. pineapple, heart of palm) (De Camino
and others 2000). Cattle exports dropped significantly in the early 1980s and cattle herd
sizes declined after 1988 (Ibrahim and others 2000). This trend reduced pressure to clear
natural forest and led to temporary abandonment of some pastures. However, many pastures
were soon converted to crops or used for government land redistribution programs
(Butterfield 1994b). Costa Rica continued the promotion of export crops simultaneous with
conservation initiatives throughout the 1990s. Evolving development strategies continue to
raise questions about how forests will fare under new policies.
Methods
Several data integration efforts were used to address the research questions above. We
compared forest retention, recruitment, and other landcover changes derived from satellite
images before and after 1996 with landowner surveys to evaluate the influence of forest
policy and PSA incentives on observed forest patterns. We also examined secondary forest
carbon storage using plot-level data linked to landcover changes and landowner decisions
regarding secondary forest establishment. Finally, we employed forest connectivity metrics
as a unifying measure of forest retention and recruitment within the Corridor.
Forest and landcover change
We selected five Landsat Thematic Mapper (TM) satellite images (WRS Path 15 Row
53) with low cloud cover from years 1986, 1996/97, and 2001 to observe landcover changes
before and after implementation of the 1996 Forest Law. For simplicity, we refer to the time
period before the 1996 law (1986-1996) as T1 and the period afterward (1996-2001) as T2.
ENVI v.4.1 image processing software (RSI 2004) was used to prepare and classify images.
All images were individually co-registered to a 1996 TM image referenced to locations on
the ground for spatially accurate comparisons.
Forest and landcover categories were selected based on prior landcover information for
northern Costa Rica from 1996 (Pedroni 2003). Five forest categories were used for

71
landcover change detection analyses including: 1) natural forest (closed canopy or selectively
logged old-growth forest and natural palm swamps), 2) a charral phase (native shrub and
herbaceous regeneration), 3) secondary forest (native tree-dominated regrowth up to 15-20
years old), 4) tree plantations (mainly traditional single species exotic or native
reforestation), and 5) gallery forest (forest retained along watercourses comprised of remnant
trees and forest regrowth). Additionally, we identified two agricultural land use categories:
6) pastures and 7) annual or perennial crops (e.g. pineapple, sugarcane, bananas, heart of
palm).
A supervised image classification was implemented using the Rulegen extension in ENVI
v. 4.1 and the Quick, Unbiased, Efficient, Statistical Tree algorithm by Loh and Shih (1996).
Elevation, topographic moisture index, percent slope derived from a 90 m digital elevation
model (DEM), and the Normalized Difference Vegetation Index (NDVI) were used in
addition to TM bands 1-5 and 7 to enhance discrimination of forest and landcover types.
Training sites for each category were selected from aerial photos, forest inventory maps, and
ground reference points collected in the field between 2004 and 2005. The spatial grain of
each landcover category was set at a 1 ha minimum mapping unit for comparisons between
image dates.
A classification accuracy evaluation for landcover data obtained an average of 94%
overall accuracy with a difference of ±3% between dates and an average kappa score 0.93
scaled at -1 to 1 for all image dates (cf. Congalton and Green 1999). Forest categories
showed an acceptable degree of accuracy that averaged from 71% for gallery forests to 95%
for natural forests. Landscape complexity increased with time generating lower, but
acceptable class accuracy above 80% in later image dates for all classes but gallery forests.
We used area summaries for landcover categories from each image date to compare the
larger case study area and the Corridor where PSA programs are focused. Differences in
rates of change in forest categories were used to compare forest retention and recovery in T1
and T2 within the Corridor. An annual rate of change for each period and forest category
was estimated using a standardized rate formula by Puyravaud (2003),
r = (1/t2 – t1)) × ln(A2/A1)
where A1 is the forest area at the first time interval (t1) and A2 is the forest area at the second
time interval (t2). Additionally, Wilcoxon Signed Rank tests compared the size distribution

72
of patches ≥1 ha in size converted from a forest type to another land use category across T1
and T2. The FRAGSTATS spatial statistics package (v. 3.3 build 5; McGarigal and others
2002) calculated patch cohesion, percentage of like adjacencies, and mean Euclidean nearest
neighbor metrics as indicators of connectivity, aggregation, and isolation for the Corridor.
We compared fragmentation indices across the three image dates at the landscape level and
for each forest type.
Landowner decision making
To help explain landcover changes in T1 and T2 and identify whether forest policies and
PSA incentives positively influenced landowner decisions to retain natural forest and
participate in reforestation programs, we conducted a livelihoods analysis examining
household decisions in the context of national and international economic markets and
policies (Geist and Lambin 2001; DFID 2003). A household survey instrument was used to
collect data about historical on-farm tree management including natural forest, charral,
secondary forest, tree plantations, and gallery forest. The survey measured the five
livelihood assets (social, human, financial, physical, and natural) and explored the influence
of the 1996 Forestry Law and PSA on land use decisions, motivations to enroll land in PSA
programs, production options, and future plans for forest currently enlisted in PSA. As PSA
is a voluntary program, participants and non-participants were compared across livelihood
assets to identify variables likely to influence participation.
We used a FONOFIFO database of all PSA participants (n=510) to randomly select a
sample of 99 households within the Corridor. Those receiving reforestation incentives from
previous programs (e.g. CAF, CAFA) were included as participants because their payment
contracts were continued under the 1996 Forestry Law. A sample of 108 non-participants
was selected from the Ministry of Agriculture’s 2000 Costa Rican Cattle Census and paired
spatially with those in the participant sample. Sample sizes provided a sampling error of
±10% (Salant and Dillman 1994) with only 6 refusals. The unit of analysis was the
household, and a research team administered questionnaires via face-to-face survey
interviews averaging one hour per household.
Summary data were developed from specific questions regarding on-farm tree
management and motivations to participate in PSA programs. A decision tree analysis was
used to compare the livelihood assets of incentive program participants and non-participants.

73
Decision-tree thresholds provide the break point values used to identify boundary levels of
assets where incentives may induce landowner participation in a PSA program. Participants
with forest protection and management contracts were analyzed separately from those with
reforestation because ownership of ≥2 ha of forest land is required by the former two PSA
options.
Above- and belowground carbon storage in secondary forests
We selected a chronosequence of twelve secondary forest sites developing on former
pasture to examine secondary forest development and the potential of these forests to provide
environmental services via carbon storage. Secondary forest development as a mode of
forest recruitment was probed in landowner surveys, and the selected study sites represent
charral, secondary forest, and pasture landcover types identified in the land change
detection. Sites included: 1) three young sites in the charral phase of development,
characterized primarily by shrubs and herbaceous cover, 2) nine older secondary forest sites
eligible for legal classification as forest by 1996 Forestry Law standards, and 3) four active
pastures grazed for at least 18 years. Fifteen sites were located on acidic, highly weathered
Ultisols derived from volcanic parent material, and the remaining site was located on an
Inceptisol derived from alluvial deposits.
At each site, soil samples were collected from four locations in each of three plots at
depths of 0-10, 10-20, and 20-30 cm. Three samples per depth were composited for percent
soil carbon determination, and the fourth sample was used for bulk density determination.
We derived soil carbon content at the Idaho Stable Isotopes Laboratory, and data are reported
on a volume basis.
Within the nine secondary forest sites, three 50×50 m plots were established to determine
species and diameter at breast height (1.37 m, dbh) for all trees, palms, and lianas ≥5 cm dbh.
When present, dbh measurements were made above buttresses. Data were used to estimate
total aboveground biomass using the equation for wet forest stands by Chave and others
(2005) that accounts for differences in wood density among species. Estimates of
aboveground biomass were multiplied by 0.5 to determine aboveground carbon storage.
Remnant trees comprised of stems ≥60 cm dbh (<1% of all stems at these sites) were
removed from the dataset.

74
For soil carbon analyses, we employed the statistical language R (v. 2.0.1, R
Development Core Team 2004). Mean soil carbon storage was analyzed separately by depth
class, and linear mixed-effects models (Pinheiro and Bates 2000) were used to examine
changes across land use types. Significant differences detected with analysis of variance
(ANOVA) were further examined via multiple comparisons procedures.
Results and Discussion
Patterns of natural forest retention
Notable differences in the status of natural forest occurred between the larger study area
and Corridor over a relatively short time period (15 yrs). Land change estimates showed a
striking decrease in the annual rate of natural forest loss from -1.43% yr-1 in T1 to -0.20%
yr-1 during T2 inside the Corridor (Table 1). Natural forest loss in T2 occurred primarily
outside the Corridor in areas that became an increasingly heterogeneous mixture of pasture,
crops, and tree plantations (Fig. 2a; b). This pattern indicates that areas outside the Corridor
remained vulnerable to forest loss regardless of the 1996 Forestry Law's forest change
restrictions. Reduced forest loss in the Corridor, where a high density of forest protection
and management contracts were established during T2, was concurrent with implementation
of the 1996 Forestry Law and PSA. High rates of forest loss during T1 were consistent with
other forest change studies conducted in the region (Read and others 2001; Sánchez-Azofeifa
and others 2003). Significantly larger natural forest patches were converted to other land
uses in T1 relative to T2 (p <0.001). Large contiguous forest patches (>150 ha) were
removed prior to 1996 (67 in T1 vs. 5 in T2), creating highly fragmented forest conditions in
the northeastern portion of the Corridor (Figure 3).
Data from landowner surveys showed that 65% of the total sample population owned
natural forest and 59% of these individuals received payments for protection. Forty-four
percent of landowners receiving PSA did not intend to clear or harvest any forest. However,
33% of respondents with PSA indicated that they would convert some of their forest to
pasture or crops, while 19% would harvest some timber in the absence of PSA and the
Forestry Law’s legal restrictions on forest land use change. Therefore, PSA payments
provided protection against forest clearing and harvesting. This is in contrast to findings
from landowners interviews on Costa Rica’s Osa Peninsula where PSA was found to have
little to no immediate impact on forest protection (Sierra and Russman 2006).

75
A landowner’s dependence upon his or her farm as a primary source of income
constituted the principal livelihood variable differentiating PSA participants from non-
participants in the forest protection and management programs (p < 0.0001). Participants had
a lesser dependence on their farms for income than non-participants, suggesting that
individuals whose livelihoods depended less directly on farm income were more likely to
participate in PSA. Our observations confirm similar patterns found in this and other regions
of Costa Rica (Miranda and others 2003; Zbinden and Lee 2005). However, the PSA
program for forest protection effectively competed with other opportunity costs of forest
land, in that it was common for landowners with up to 73% of their income derived from the
farm to participate in PSA. Production options for private forest remain limited to timber
extraction because of the 1996 Forestry Law’s ban on forest clearing. Permits to harvest are
limited, so those unable to obtain permits have an opportunity cost of foregone production
near zero, and thus, can only gain by entering into a PSA contract. Pagiola and others (2002)
noted an excess national demand for the PSA protection program, implying that the same
amount of forest protection could likely be provided at lower payment rates (Rojas and
Aylward 2003).
Forest recruitment: reforestation
Results from landcover comparisons show that forest cover increased over both time
periods with positive consequences for environmental services, primarily during T2. A net
gain in forest cover of 0.5% yr-1 occurred in T1 and 0.6% yr-1 in T2 (Table 1), although gains
after 1996 were concurrent with greatly reduced natural forest loss. In general, land
withdrawn from forest cover may constitute a loss of environmental services such as
biodiversity and carbon sequestration (Snider and others 2003). Increased forest cover in the
Corridor for both time periods was mainly the result of a large increase in tree plantations
(Figure 2a) established in pastures. Tree plantations increased from 19 km2 in 1986 to 268
km2, representing 11% of the total land area in 2001 (Figure 3). These figures compared
favorably to the cumulative total of ~380 km2 reported to have been planted regionally up to
2001 (COSEFORMA 1995; Méndez 2003).
The rate of tree plantation establishment decreased from 24 to 4.6% yr-1 during T1 and
T2, respectively (Table 1), with significantly smaller pastures planted after 1996 (p < 0.05).
A number of tree plantations were either harvested or overtaken by natural regeneration by

76
2001 (data not shown). Although we detected substantial increases in forest cover under
plantations, regional figures show that on an area basis, PSA for forest protection (51%) and
management (33%) were favored over reforestation programs (17%) (Méndez 2003). These
statistics reflect national priorities to reduce forest loss via PSA for forest protection (Snider
and others 2003) rather than promote forest recruitment through reforestation. Because
forest plantation conversion to other land uses is permitted, their long-term contribution to
forest cover and environmental services in this landscape is uncertain.
The trends described above indicate that reforestation incentives fueled a rapid expansion
of tree plantations in the Corridor since 1986. Nearly one third of all landowners interviewed
(31%) maintained tree plantations on their farms, and the majority (60%) were established
through PSA reforestation contracts. Primary motivations for plantation establishment
included perceived value of the wood (40%), meeting conservation objectives such as
biodiversity protection (20%), and availability of payments (17%). Most reforested land was
converted from pasture (88%) while 12% was formerly crop land. Fifty-three percent of
landowners indicated satisfaction with the level of PSA payments, with remaining
landowners indicating that payments did not meet expected costs. Of those with PSA, a
majority (68%) would not have reforested without payments to cover establishment and
maintenance costs, demonstrating the importance of financial incentives to induce landowner
participation in reforestation activities.
Of those with reforestation under the PSA program, a majority (59%) intended to plant
another crop of trees after harvesting their current plantation while a quarter (24%) indicated
they would not replant, and 17% remained undecided until final harvests. Landowners
reforesting without PSA incentives showed similar patterns. The majority of landowners
have adopted forest plantations as a viable economic activity, competitive with other land use
options and economic opportunities.
Reforestation incentives were a critical factor in forest cover gained from tree plantations
during T1 and T2. A landowner’s dependence on his or her farm as a primary source of
income was the primary livelihood variable differentiating PSA reforestation participants
from non-participants (p <0.0001). However, a division between groups occurred at the
point where 16% of the household income was derived from the farm, with individuals more
likely to participate below this point. Results show that PSA for reforestation remains

77
uncommon for landowners moderately dependent upon their farms as a source of income,
indicating that payment rates are not adequate to motivate most farm-dependent individuals
to forgo current production systems.
Forest recruitment: secondary vegetation and gallery forest
Successional vegetation occupied between 8 and 10% of the Corridor area at any one
point in time, maintaining persistent areas of natural regeneration in the Corridor (Figure 3).
However, the total land area in the early successional charral phase declined during the study
period from 9% in 1986 to 4% in 2001 (Figure 2a), indicating that the outlook for recruiting
new secondary forest stands was lower after 1996. Although land area in secondary forest
increased slightly after 1996, the patch size of both secondary forest and charral areas
recruited significantly declined (p < 0.001). Additions to the area occupied by secondary
forest (Table 1) during T2 accounted for some of the losses in the charral phase as
succession proceeded.
Our landcover data show that forest recruitment via secondary succession may represent
only temporary gains in connectivity and short-lived opportunities for habitat restoration. An
overall decline in land area occupied by charral (Table 1) indicates that landowners
abandoned very little pasture land throughout the study period, as observed previously by
Read and others (2001). The low level of secondary forest establishment in the Corridor did
not follow patterns of agricultural abandonment conducive to forest recruitment encountered
elsewhere in Costa Rica (Arroyo-Mora and others 2005). The amount of pasture land
allowed to recover to the charral stage was offset by a greater amount being returned to
pasture in both T1 and T2. This observation is corroborated by data from landowner surveys
indicating that only 13% of respondents had charral on their property. Of these individuals,
56% maintained charral for economic reasons, while 20% cited conservation reasons. The
role of economics in decisions to maintain charral shows that natural forest regeneration in
the Corridor was likely limited by PSA incentives for reforestation, agricultural export
opportunities, and restrictions in the 1996 Forestry Law prohibiting land use change.
Survey data supports the observation that much of the land converted to charral (68%) or
secondary forest during our study period previously existed as pasture (Figure 2; 4).
Although charral and secondary forest occupy a small amount of land area relative to natural
forest, these forest types are ecologically important as sites for forest recruitment, carbon

78
sequestration, and habitat restoration (Holl and Kapelle 1999). Charral typically persists on
abandoned land for a short period of time before a tree canopy develops, but restrictions on
forest clearing provide incentives for landowners to inhibit the development of secondary
forest (Sierra and Russman 2006). Surveyed landowners planned to clear 43% of existing
charral for pasture or agricultural use in the future, thus limiting the potential for carbon
storage (Murty and others 2002).
Transitions from pasture to secondary forest reveal differences in carbon storage at
shallow soil depths. Pastures contained a greater amount of mineral soil carbon at 0-10 cm
relative to charral and secondary forest, but there was high variability within land use classes
(Table 3). Mineral soil carbon storage in pastures rapidly decreased with depth, and both
charral and secondary forests had significantly higher soil carbon storage than did pastures at
depths of 10-30 cm (Table 3). High levels of soil carbon storage in charral at 10-30 cm
depth likely occurs from shifts in rooting depth and subsequent alteration of organic carbon
inputs to the soil at an early successional phase (Jackson and others 1996; Jobbágy and
Jackson 2000). A decline in soil carbon storage at these depths in secondary forest relative to
charral was not unexpected, as these sites were dominated by more deeply rooted trees.
Managed crops remain a competitive land use with secondary forest on former pasture
(Figure 4), and agricultural transitions can decrease soil carbon stores up to 30% during the
first decades of cultivation (Murty and others 2002). Survey respondents also suggested
reforestation as another common land use option on former pasture land (Figure 4), and
although plantations often increase soil carbon storage in the tropics (Silver and others 2000),
this is not always the case (Powers 2004). In relation to competing land uses, secondary
forests may provide considerable carbon services.
Above- and belowground carbon storage rapidly increased toward values observed in
primary forest following secondary forest establishment. For 0-30 cm, soil carbon storage in
secondary forests was slightly lower (70.9 Mg C ha-1) than the regional mean of 82.2 Mg C
ha-1 in primary forests (Powers and Schlesinger 2002). Aboveground, secondary forest
stands appear to pass through a period of low biomass accumulation and reach the point of
stem exclusion after 20 to 25 years of development (Figure 5). Following this phase, 25 to
30 year old secondary forests had aboveground carbon stocks equivalent to those in primary
forests of the region (Figure 5; Clark and Clark 2000). The carbon services provided by

79
secondary forest rival those of natural forest and merit greater attention from forest
management and policy perspectives. Our data show that forest policies and incentives have
effectively influenced land-use decisions for tree plantations, and similar incentives for
natural regeneration could enhance carbon storage as a targeted PSA environmental service.
In addition to carbon storage, benefits accruing from secondary forest recovery include
forest structural connectivity, natural habitat development, and new timber resources
(Finegan 1992; Lamb and others 1997). Secondary forests provide a number of potential
economic and restoration opportunities that contribute positively to the goals of the San Juan-
La Selva Biological Corridor. The existence of competing land uses with greater financial
returns than secondary forest suggests that financial incentives and technical support may be
necessary to secure the environmental services provided by these forests. The recent
introduction of PSA for natural regeneration (FONAFIFO 2006) represents significant
progress in acknowledging the benefits of secondary forest, though the program remains
confined to western Costa Rica.
Gallery forests also have important consequences for recruiting forest cover in the
Corridor, increasing from 2 to 6% of the total land area during T1 and T2, respectively
(Table 1). Linear forest arrangements of remnant trees and secondary vegetation were
retained along waterways as surrounding forests were cleared in T1. We interpreted an
increase in post-1996 gallery forests as forest recruitment because few large patches of
natural forest were removed in T2. Forest land along perennial rivers and streams has
received protection by laws designed to conserve water resources since 1942. Eighty-five
percent of landowners sampled in the Corridor had land occupied by gallery forest.
Recruitment patterns in T2 reflect a social commitment to protecting water resources as 87%
of survey respondents gave conservation-oriented reasons for retaining tree cover in riparian
areas.
Forest and landscape connectivity
We analyzed the spatial and temporal arrangement of forests in the Corridor as an
indicator of physical connectivity among protected and privately owned forests.
Connectivity varied across T1 and T2 for total forest cover (landscape indices) and individual
forest types (class indices). Landscape indices in the Corridor showed a decline in
connectivity and aggregation among all forest patches during T1, and a maintenance of
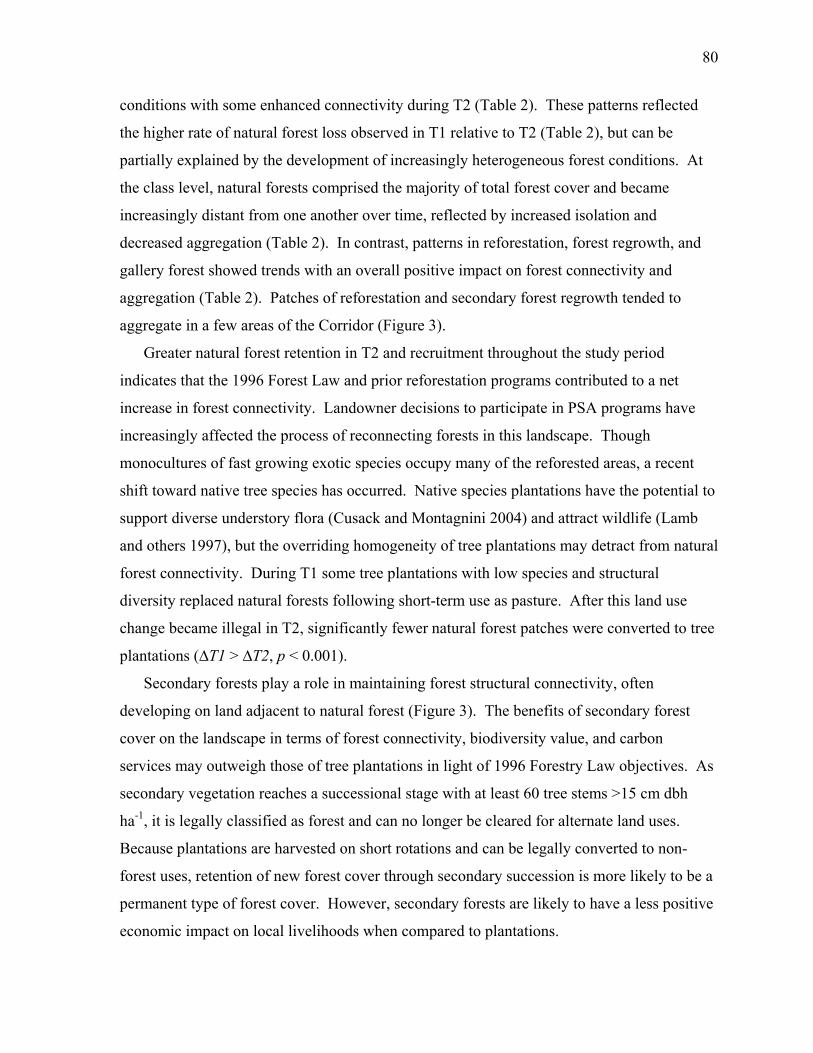
80
conditions with some enhanced connectivity during T2 (Table 2). These patterns reflected
the higher rate of natural forest loss observed in T1 relative to T2 (Table 2), but can be
partially explained by the development of increasingly heterogeneous forest conditions. At
the class level, natural forests comprised the majority of total forest cover and became
increasingly distant from one another over time, reflected by increased isolation and
decreased aggregation (Table 2). In contrast, patterns in reforestation, forest regrowth, and
gallery forest showed trends with an overall positive impact on forest connectivity and
aggregation (Table 2). Patches of reforestation and secondary forest regrowth tended to
aggregate in a few areas of the Corridor (Figure 3).
Greater natural forest retention in T2 and recruitment throughout the study period
indicates that the 1996 Forest Law and prior reforestation programs contributed to a net
increase in forest connectivity. Landowner decisions to participate in PSA programs have
increasingly affected the process of reconnecting forests in this landscape. Though
monocultures of fast growing exotic species occupy many of the reforested areas, a recent
shift toward native tree species has occurred. Native species plantations have the potential to
support diverse understory flora (Cusack and Montagnini 2004) and attract wildlife (Lamb
and others 1997), but the overriding homogeneity of tree plantations may detract from natural
forest connectivity. During T1 some tree plantations with low species and structural
diversity replaced natural forests following short-term use as pasture. After this land use
change became illegal in T2, significantly fewer natural forest patches were converted to tree
plantations (∆T1 > ∆T2, p < 0.001).
Secondary forests play a role in maintaining forest structural connectivity, often
developing on land adjacent to natural forest (Figure 3). The benefits of secondary forest
cover on the landscape in terms of forest connectivity, biodiversity value, and carbon
services may outweigh those of tree plantations in light of 1996 Forestry Law objectives. As
secondary vegetation reaches a successional stage with at least 60 tree stems >15 cm dbh
ha-1, it is legally classified as forest and can no longer be cleared for alternate land uses.
Because plantations are harvested on short rotations and can be legally converted to non-
forest uses, retention of new forest cover through secondary succession is more likely to be a
permanent type of forest cover. However, secondary forests are likely to have a less positive
economic impact on local livelihoods when compared to plantations.

81
Many of Costa Rica’s recognized corridor areas resemble stepping stones of forest habitat
within agriculturally-dominated landscapes because intensively managed crops typically
support little or no tree cover. The implications of the 1996 Forestry Law in conjunction
with the data reported here reflect on an emerging importance of forest recruitment via a
variety of pathways. As natural forests were replaced by reforestation and secondary forests,
a fundamental change in forest structural connectivity occurred. This highlights the need to
examine the functional role of these new forest connections where forest cover is best
characterized as a mosaic of habitats with variable economic and ecological potential.
Conclusions
Costa Rica’s innovative strategies to maintain private forest land and environmental
services showed notable progress toward these goals in the Corridor. The rate of natural
forest loss was substantially less after 1996 relative to the previous time period. Legal
restrictions in the 1996 Forest Law forbidding land use change reduced the opportunity cost
of forest land, influencing landowners moderately dependent on their farms for income to
participate in the PSA forest protection program. Continued high rates of natural forest loss
outside the Corridor after 1996 indicated that restrictions on forest clearing without the
benefit of PSA were not sufficient to induce forest retention in this region.
PSA directly influenced landowner decisions to substantially increase forest recruitment
during the study period. Specifically, reforestation incentives prior to PSA led to a dramatic
increase in plantation forests during T1, while a slower increase occurred following PSA
implementation in T2. Forest recruitment via secondary forest development occupied a
relatively constant amount of land area in the Corridor through time. However, disincentives
for secondary forest development existed in the form of lost land use opportunities once an
area returned to forest. Carbon services provided by 25-30 year old secondary forests were
similar to those in primary forest, suggesting that these forests deserve greater attention from
a land management perspective.
Positive outcomes of the 1996 Forestry Law were further illustrated by changes in forest
cover dynamics that enhanced forest structural connectivity in the Corridor in T2, relative to
T1. In the future, adaptations of the PSA program such as that recently implemented for
natural regeneration in western Costa Rica will continue to provide flexibility in tailoring the
program to diverse and changing landscapes. As a case study, the Costa Rican experience

82
with PSA provides evidence that environmental service payment programs in conjunction
with legal forest protection are effective in retaining natural forest and recruiting new forest
cover when focused in the Corridor as a priority conservation area. PSA has been tailored to
fit Costa Rica’s socioeconomic conditions, but shows promise as an effective conservation
approach with prospects for adaptation to other settings.
Acknowledgements
This research was supported in part by NSF-IGERT grant no. 0114304. Thanks for
assistance is due to Edwin Pereira, Marvin Zamora, Vicente Herra, José Manuel Ulate,
Sandra Candela, Isabel Venegas, Zayra Ramos, Hugo Brenes, Germán Obando, Andrés
Sanchún, Pablo Acuna, Oscar Quirós, Jhonny Méndez, Nelson Zamora, Robin Chazdon, and
Juan Pablo Arroyo. We are also indebted to the organizations FUNDECOR and
CODEFORSA, as well as numerous landowners in the study area.
References
Arroyo-Mora JP, Sánchez-Azofeifa G, Rivard B, Calvo JC, Janzen, DH. 2005. Dynamics in
landscape structure and composition for the Chorotega region, Costa Rica from 1960 to
2000. Agriculture, Ecosystems and Environment 106:27-39.
Butterfield RP. 1994a. Forestry in Costa Rica: status, research priorities, and the role of the
La Selva Biological Station. McDade LA, Bawa KS, Hespenheide HA, Hartshorn GS,
editors. La Selva: ecology and natural history of a neotropical rain forest. Chicago:
University of Chicago Press. p317-328.
Butterfield RP. 1994b. The regional context: land colonization and conservation in Sarapiquí.
McDade LA, Bawa KS, Hespenheide HA, Hartshorn GS, editors. La Selva: ecology and
natural history of a neotropical rain forest. Chicago: University of Chicago Press. p299-
306.
Chave J, Andalo C, Brown S, Cairns MA, Chambers JQ, Eamus D, Fölster H, Fromard F,
Higuchi N, Kira T, Lescure J-P, Nelson BW, Ogawa H, Puig H, Riéra B, Yamakura T.
2005. Tree allometry and improved estimation of carbon stocks and balance in tropical
forests. Oecologia 145:87-99.
Clark DB, Clark DA. 2000. Landscape-scale variation in forest structure and biomass in a
tropical rain forest. Forest Ecology and Management 137:185-198.

83
Congalton RG, Green K. 1999. Assessing the Accuracy of Remotely Sensed Data: Principles
and Practices. New York: Lewis Publishers.
COSEFORMA. 1995. Archivo de plantaciones forestales establecidas en la Región Huertar
Norte de Costa Rica del Período 1979-1995 de Incentivos CAF-CAFA Articulo 87
Renta-FDF. San José, Costa Rica: COSEFORMA.
Cusack D, Montagnini F. 2004. The role of native species plantations in recovery of
understory woody diversity in degraded pasturelands of Costa Rica. Forest Ecology and
Management 188:1-15.
De Camino R, Segura O, Arias LG, Pérez I. 2000. Costa Rica forest strategy and evolution of
land use: evaluation country case study series. Washington (DC): World Bank.
Defries R, Hansen A, Newton AC, Hansen MC. 2005. Increasing isolation of protected areas
in tropical forests over the past twenty years. Ecological Applications 15:19-26.
DFID. 2003. Sustainable livelihoods guidance sheets. London: Department for International
Development.
Ferraro PJ, Kiss A. 2002. Direct payments to conserve biodiversity. Science 298:1718-1719.
Finegan B. 1992. The management potential of neotropical secondary lowland rain forest.
Forest Ecology and Management 47:295-321.
FONAFIFO. 2006. Estadisticas PSA 1997-2005. http://www.fonafifo.com/paginas_espanol/
servicios_ambientales/sa_estadisticas.htm
Geist HJ, Lambin EF. 2001. What drives tropical deforestation? Louvain-la-Nueve, Belgium:
LUCC International Project Office.
Holdridge LR. 1967. Life zone ecology. San José, Costa Rica: Tropical Science Center.
Holl KD, Kappelle M. 1999. Tropical forest recovery and restoration. Trends in Ecology and
Evolution 14:378-379.
Ibrahim M, Abarca S, Flores O. 2000. Geographical synthesis of data on Costa Rican
pastures and their potential for improvement. Hall CAS, editor. Quantifying sustainable
development. San Diego: Academic Press. p423-448.
Jackson RB, Canadell J, Ehleringer JR, Mooney HA, Sala OE, Schulze ED. 1996. A global
analysis of root distributions for terrestrial biomes. Oecologia 108:389-411.
Jobbágy EG, Jackson RB. 2000. The vertical distribution of soil organic carbon and its
relation to climate and vegetation. Ecological Applications 10:423-436.

84
Lamb D, Parrotta J, Keenan R, Tucker N. 1997. Rejoining habitat remnants: restoring
degraded rainforest lands. Laurance WF, Bierregaard RO, editors. Tropical forest
remnants: ecology, management, and conservation of fragmented communities. Chicago:
University of Chicago Press. p366-385.
Loh W, Shih Y. 1996. Split selection methods for classification trees. Statistica Sinica 7:815-
840.
Méndez J. 2003. Pagos por servicios ambientales en la región Huetar Norte. Jiménez GS,
Ugalde MEH, editors. Costa Rica forestal: boletín informativo de la Oficina Nacional
Forestal, No.1, Belén, Costa Rica: Oficina Nacional Forestal. p2-3.
Millennium Ecosystem Assessment. 2005. Ecosystems and human well-being: synthesis.
Washington (DC): Island Press.
Miranda M, Porras IT, Moreno ML. 2003. The social impacts of payments for environmental
services in Costa Rica: a quantitative field survey and analysis of the Virilla watershed.
London: International Institute for Environmental Development.
Montanye DR, Vargas J-R, Hall CAS. 2000. The internationalization of the Costa Rican
economy: a two edged sword. Hall CAS, editor. Quantifying sustainable development.
San Diego: Academic Press. p647-694.
Murty D, Kirschbaum MUF, McMurtrie RE, McGilvray H. 2002. Does conversion of a
forest to agricultural land change soil carbon and nitrogen? A review of the literature.
Global Change Biology 8:105-123.
Pagiola S, Bishop J, Landell-Mills N, editors. 2002. Selling forest environmental services:
market-based mechanisms for conservation development. London: Earthscan
Publications.
Pedroni L. 2003. Improved classification of Landsat Thematic Mapper data using modified
prior probabilities in large and complex landscapes. International Journal of Remote
Sensing 24:91-113.
Pinheiro JC, Bates DM. 2000. Mixed-effects models in S and S-Plus. New York: Springer-
Verlag New York, Inc.
Powers JS. 2004. Changes in soil carbon and nitrogen after contrasting land-use transitions in
northeastern Costa Rica. Ecosystems 7:134-146.

85
Powers JS, Schlesinger WH. 2002. Relationship among soil carbon distributions and
biophysical factors at nested spatial scales in rain forests of northeastern Costa Rica.
Geoderma 109:165-190.
Puyravaud J-P. 2003. Standardizing the calculations of the annual rate of deforestation.
Forest Ecology and Management 177:593-6.
Read JM, Denslow JS, Guzman SM. 2001. Documenting land cover history of a humid
tropical environment in northeastern Costa Rica using time-series remotely sensed data.
Millington AC, Walsh SJ , Osborne PE, editors. GIS and remote sensing applications in
biogeography and ecology. Boston: Kluwer Academic Publishers. p69-89.
Rojas LA, Chaverría MI. 2005. Corredores biológicos de Costa Rica. http://www.sinaccr.net/
corrbilogico.php
Rojas M, Aylward B. 2003. What are we learning from experiences with markets for
environmental services in Costa Rica? London: International Institute for Environmental
Development.
Salant P, Dillman DA. 1994. How to conduct your own survey. New York: Wiley.
Sánchez-Azofeifa GA, Daily GC, Pfaff ASP, Busch C. 2003. Integrity and isolation of Costa
Rica’s national parks and biological reserves, examining dynamics of land-cover change.
Biological Conservation 109:123-35.
Schelhas J. 1996. Land use choice and change: intensification and diversification in the
lowland tropics of Costa Rica. Human Organization 55:298-306.
Sierra R, Russman E. 2006. On the efficiency of environmental service payments: a forest
conservation assessment in the Osa Peninsula, Costa Rica. Ecological Economics 59:131-
141.
Silver WL, Ostertag R, Lugo AE. 2000. The potential for carbon sequestration through
reforestation of abandoned tropical agricultural and pasture lands. Restoration Ecology
8:394-407.
Snider AG, Pattanayak SK, Sills EO, Schuler JL. 2003. Policy innovations for private forest
management and conservation in Costa Rica. Journal of Forestry 101:18-23.
Watson V, Cervantes S, Castro C, Mora L, Solis M, Porras IT, Cornejo B. 1998. Making
space for better forestry: policy that work for forest and people. San José, Costa Rica and

86
London: Centro Cientifico Tropical and the International Institute for Environment and
Development.
Zbinden S, Lee DR. 2005. Paying for environmental services: An analysis of participation in
Costa Rica's PSA program. World Development 33:255-272.

87
Table 1. Forest change for T1 and T2 by forest type. The amount of forest lost or gained during each time period was estimated by subtracting the total area for each forest category in the Corridor from the previous year’s land cover data (∆T1=1986-96, ∆T2=1996-01). The annual rates of forest cover change by type and net forest gain before and after 1996 were estimated using the formula by Puyravaud (2003) and expressed as percentages. Net forest cover includes all five forest types.
Forest cover type ∆T1 (km2) ∆T1 yr-1 (%) ∆T2 (km2) ∆T2 yr-1 (%)
Natural forest -179 -1.43 -12 -0.2
Reforestation 194 24.15 55 4.57
Charral -42 -2.25 -60 -8.93
Secondary forest 69 18.95 20 4.31
Gallery forest 36 5.21 48 8.66
Net forest cover 78 0.47 50 0.58

88
Table 2. Fragmentation indices for the Corridor landscape and individual forest classes indicating changes in physical connectivity at each landcover date. The level of isolation was determined using Euclidean nearest neighbor distance (ENN) to measure isolation, patch cohesion (PC) as an indicator for physical connectivity among like patches, and percentage of like adjacencies (PLA) as a measure of aggregation of similar patches.
Isolation: ENN (m) Connectivity: PC (%) Aggregation: PLA (%)
Category 1986 1996 2001 1986 1996 2001 1986 1996 2001 Landscape 256.2 241.8 249 99.3 99 98.9 89.8 88.1 88.3 Natural forest 130.6 135.4 142.7 99.76 99.68 99.68 94.83 94.02 93.91
Reforestation 337 202.3 187.9 86.59 97.06 97.91 71.34 81.81 81.36
Charral 164.3 191.1 250.9 93.28 93.33 93.82 74.14 75.2 77.28
Secondary forest 526.4 215.7 227.9 83.46 89.09 92.68 67.39 70.48 74.05
Gallery forest 238.5 216.9 188.1 87.57 89.2 92.19 67.66 71.78 74.57

89
Table 3. Mean mineral soil carbon storage ± one standard error across all land use types and soil depths. Reported p-values were derived from individual ANOVAs performed for each soil depth. Superscripted letters represent the result of means separation performed using pre-planned contrasts in the Multcomp package of R. Different superscripted letters represent significant differences among categories.
Soil depth Pasture soil carbon (Mg ha-1)
Charral soil carbon (Mg ha-1)
Secondary forest soil carbon (Mg ha-1)
p-value
0-10 cm 43.69 ± 3.09a 34.65 ± 2.31b 35.70 ± 1.13b 0.012
10-20 cm 18.71 ± 1.38a 25.00 ± 1.63b 20.65 ± 0.69c 0.0048
20-30 cm 12.60 ± 0.65a 17.53 ± 1.63b 14.57 ± 0.73c 0.0167

90
Figure 1. Map of the San Juan – La Selva Biological Corridor, connecting national parks and protected areas, and the larger study area. Depicted natural forest cover is for year 2000 (Atlas of Costa Rica 2004).

91
a
b
Figure 2. Area differences for each time interval for (a) the five forest categories and (b) two agricultural categories observed at the extent of the study area (6,349 km2) and the San Juan – La Selva Biological Corridor (2,425 km2). Dotted lines above the natural forest category show the top of the bar in year 2001, indicating that a greater percentage of natural forest loss occurred outside of the Corridor after 1996.

92
Figure 3. Mapped forest cover in the San Juan – La Selva Biological Corridor depicting major landscape changes at each time interval using the forest categories natural forest (dark green), forest regrowth (charral and secondary forest, bright green), and reforestation (orange).
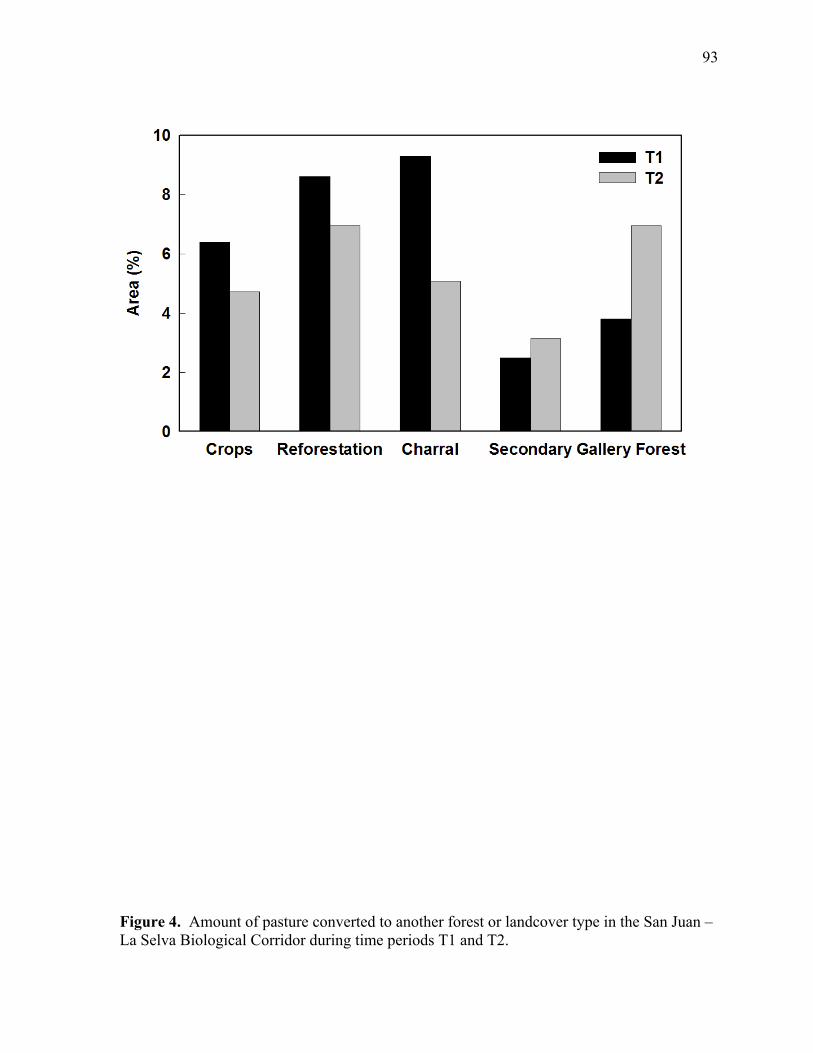
93
Figure 4. Amount of pasture converted to another forest or landcover type in the San Juan – La Selva Biological Corridor during time periods T1 and T2.
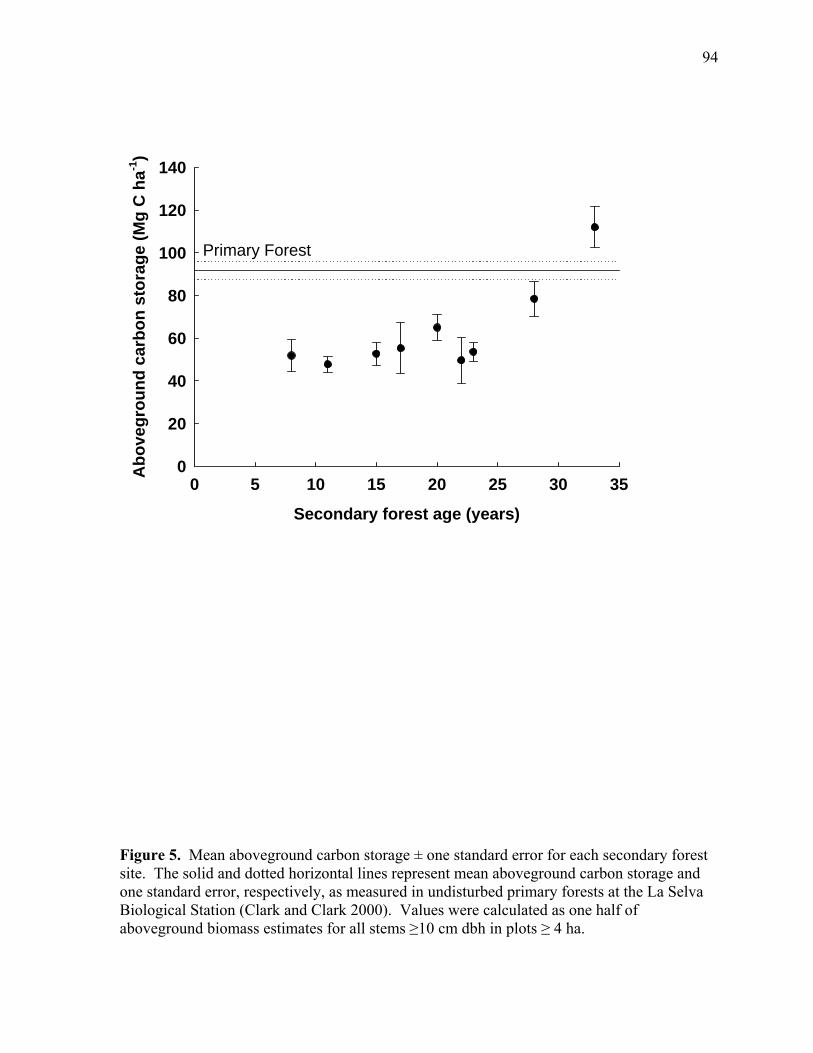
94
Secondary forest age (years)
0 5 10 15 20 25 30 35
Abo
vegr
ound
car
bon
stor
age
(Mg
C h
a-1)
0
20
40
60
80
100
120
140
Primary Forest
Figure 5. Mean aboveground carbon storage ± one standard error for each secondary forest site. The solid and dotted horizontal lines represent mean aboveground carbon storage and one standard error, respectively, as measured in undisturbed primary forests at the La Selva Biological Station (Clark and Clark 2000). Values were calculated as one half of aboveground biomass estimates for all stems ≥10 cm dbh in plots ≥ 4 ha.