1 | Page Republic of Indonesia Forest Carbon Partnership Facility ...
Forest Carbon Partnership Facility
Ken Andrasko
World Bank/Environment/Carbon Finance Unit and
FCPF Facility Management Team
At PMR Technical Workshop: Baseline-setting: Overview of Issues and Insights from Different Approaches and Registries: An Introduction
Cologne, Germany May 27, 2012
Baselines Based on Sector Policies and Extrapolation of Historical Trends:
Example of Reference Levels for REDD+
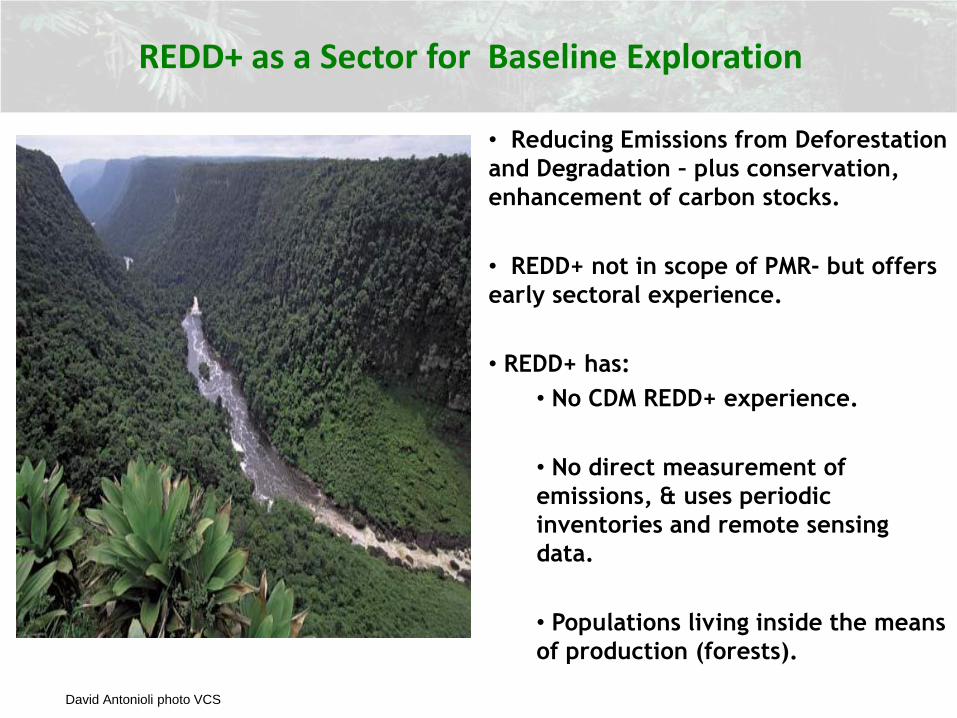
REDD+ as a Sector for Baseline Exploration
• Reducing Emissions from Deforestation
and Degradation – plus conservation,
enhancement of carbon stocks.
• REDD+ not in scope of PMR- but offers
early sectoral experience.
• REDD+ has:
• No CDM REDD+ experience.
• No direct measurement of
emissions, & uses periodic
inventories and remote sensing
data.
• Populations living inside the means
of production (forests).
David Antonioli photo VCS
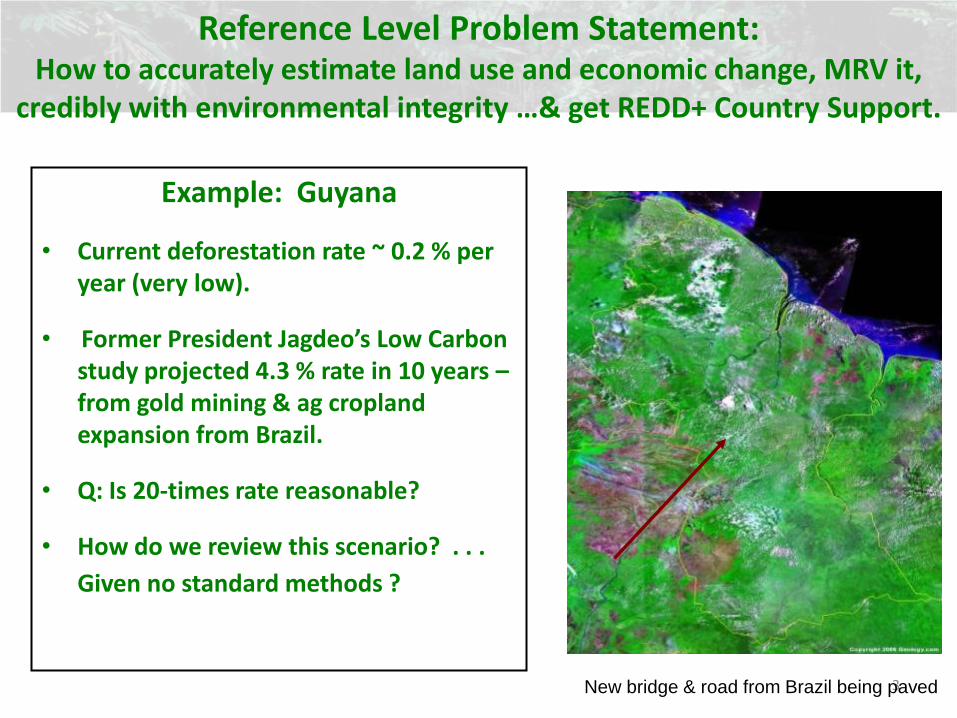
Example: Guyana
• Current deforestation rate ~ 0.2 % per year (very low).
• Former President Jagdeo’s Low Carbon study projected 4.3 % rate in 10 years – from gold mining & ag cropland expansion from Brazil.
• Q: Is 20-times rate reasonable?
• How do we review this scenario? . . .
Given no standard methods ?
3
Reference Level Problem Statement: How to accurately estimate land use and economic change, MRV it,
credibly with environmental integrity …& get REDD+ Country Support.
New bridge & road from Brazil being paved

4
Timber Concessions:
Reduced Impact
Logging / Certification
Oil Palm Plantations:
Land Swaps
Protection Forests:
Protected Area
Management,
Sustainable Funding
Spatial planning
Information for Decision-making
Governance & enforcement
REDD+ Activities Occur on Complex Land Use Mosaics Berau Forest Carbon Program, Berau District, East Kalimantan, Indonesia (2.2
million hectares) (The Nature Conservancy slide)
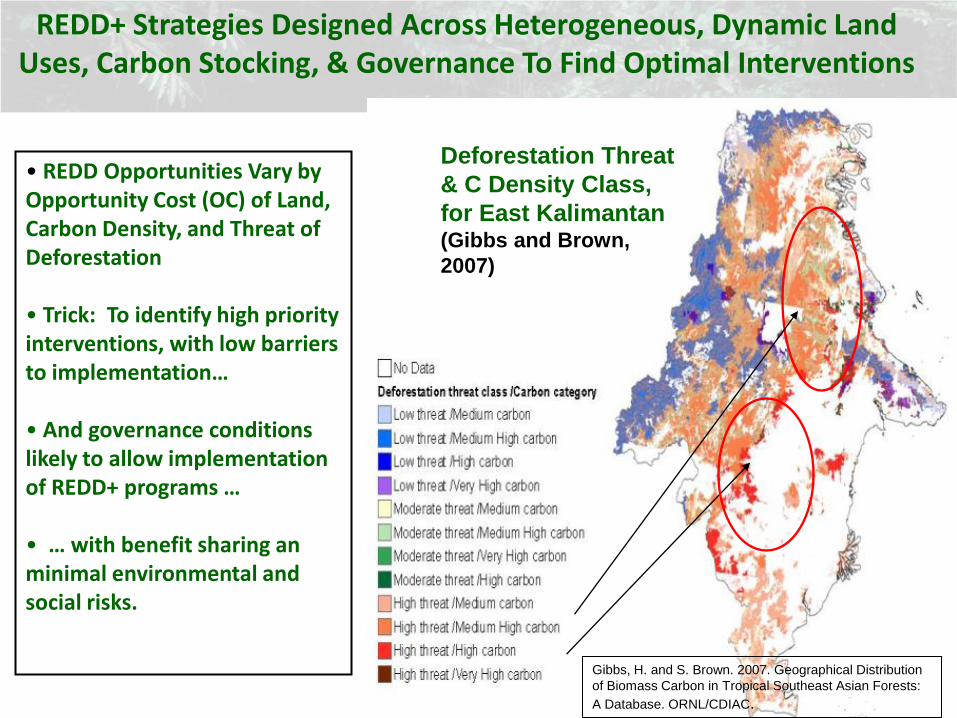
• REDD Opportunities Vary by Opportunity Cost (OC) of Land, Carbon Density, and Threat of Deforestation
• Trick: To identify high priority interventions, with low barriers to implementation…
• And governance conditions likely to allow implementation of REDD+ programs …
• … with benefit sharing an minimal environmental and social risks.
Gibbs, H. and S. Brown. 2007. Geographical Distribution
of Biomass Carbon in Tropical Southeast Asian Forests:
A Database. ORNL/CDIAC.
Deforestation Threat
& C Density Class,
for East Kalimantan (Gibbs and Brown,
2007)
REDD+ Strategies Designed Across Heterogeneous, Dynamic Land Uses, Carbon Stocking, & Governance To Find Optimal Interventions
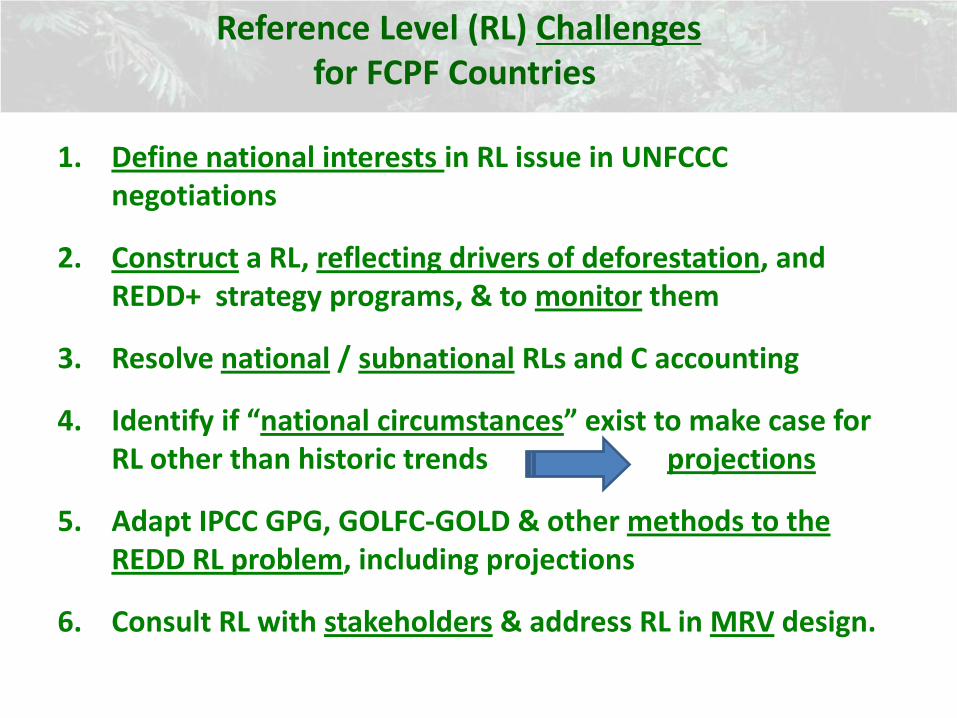
1. Define national interests in RL issue in UNFCCC negotiations
2. Construct a RL, reflecting drivers of deforestation, and REDD+ strategy programs, & to monitor them
3. Resolve national / subnational RLs and C accounting
4. Identify if “national circumstances” exist to make case for RL other than historic trends projections
5. Adapt IPCC GPG, GOLFC-GOLD & other methods to the REDD RL problem, including projections
6. Consult RL with stakeholders & address RL in MRV design.
Reference Level (RL) Challenges for FCPF Countries
7
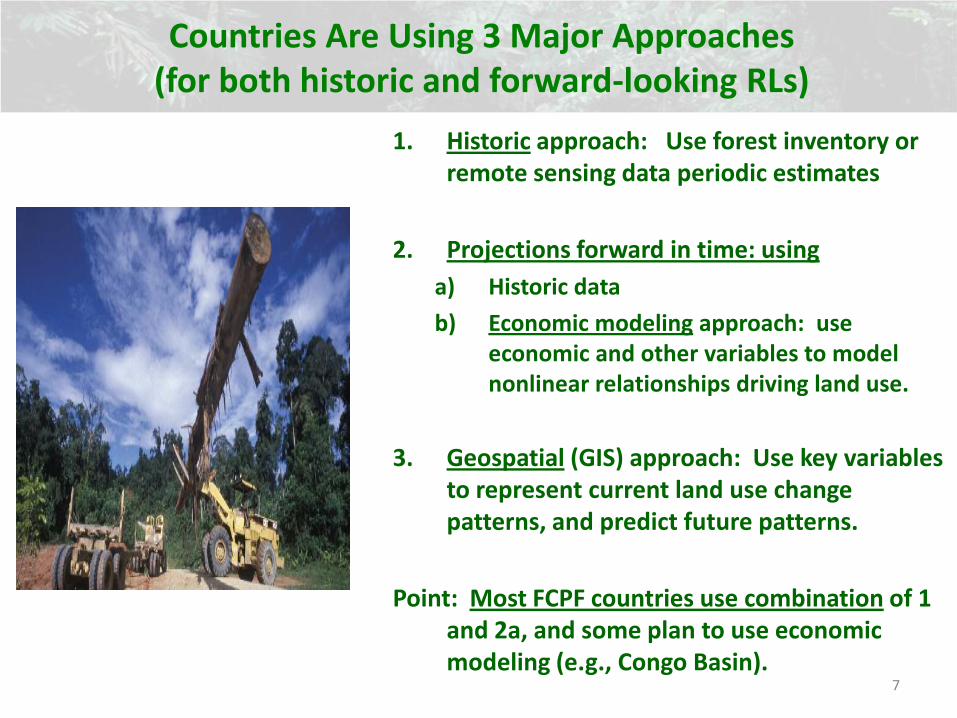
Countries Are Using 3 Major Approaches (for both historic and forward-looking RLs)
1. Historic approach: Use forest inventory or remote sensing data periodic estimates
2. Projections forward in time: using
a) Historic data
b) Economic modeling approach: use economic and other variables to model nonlinear relationships driving land use.
3. Geospatial (GIS) approach: Use key variables to represent current land use change patterns, and predict future patterns.
Point: Most FCPF countries use combination of 1 and 2a, and some plan to use economic modeling (e.g., Congo Basin).
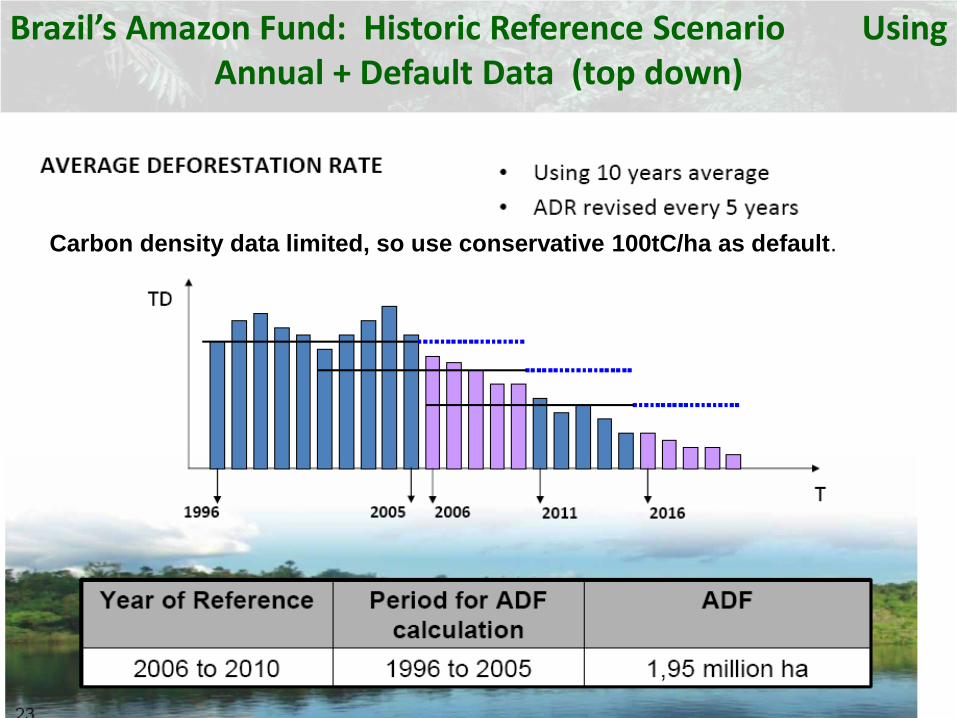
Brazil’s Amazon Fund: Historic Reference Scenario Using Annual + Default Data (top down)
Carbon density data limited, so use conservative 100tC/ha as default.
9
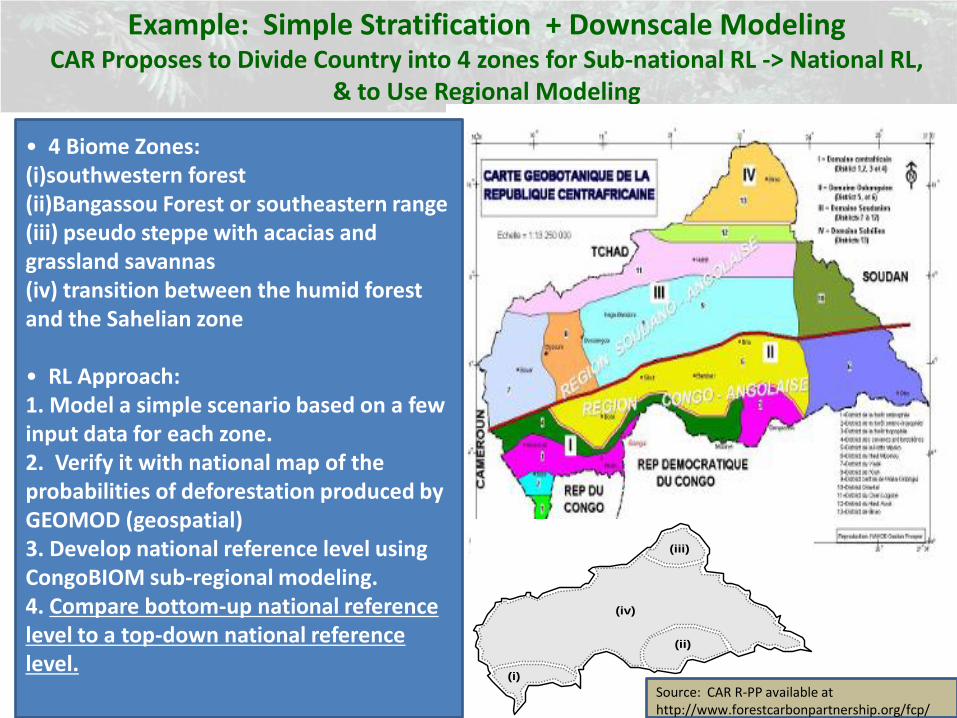
Example: Simple Stratification + Downscale Modeling CAR Proposes to Divide Country into 4 zones for Sub-national RL -> National RL,
& to Use Regional Modeling
(iii)
(i)
(ii)
(iv)
• 4 Biome Zones: (i)southwestern forest (ii)Bangassou Forest or southeastern range (iii) pseudo steppe with acacias and grassland savannas (iv) transition between the humid forest and the Sahelian zone • RL Approach: 1. Model a simple scenario based on a few input data for each zone. 2. Verify it with national map of the probabilities of deforestation produced by GEOMOD (geospatial) 3. Develop national reference level using CongoBIOM sub-regional modeling. 4. Compare bottom-up national reference level to a top-down national reference level.
Source: CAR R-PP available at http://www.forestcarbonpartnership.org/fcp/
10
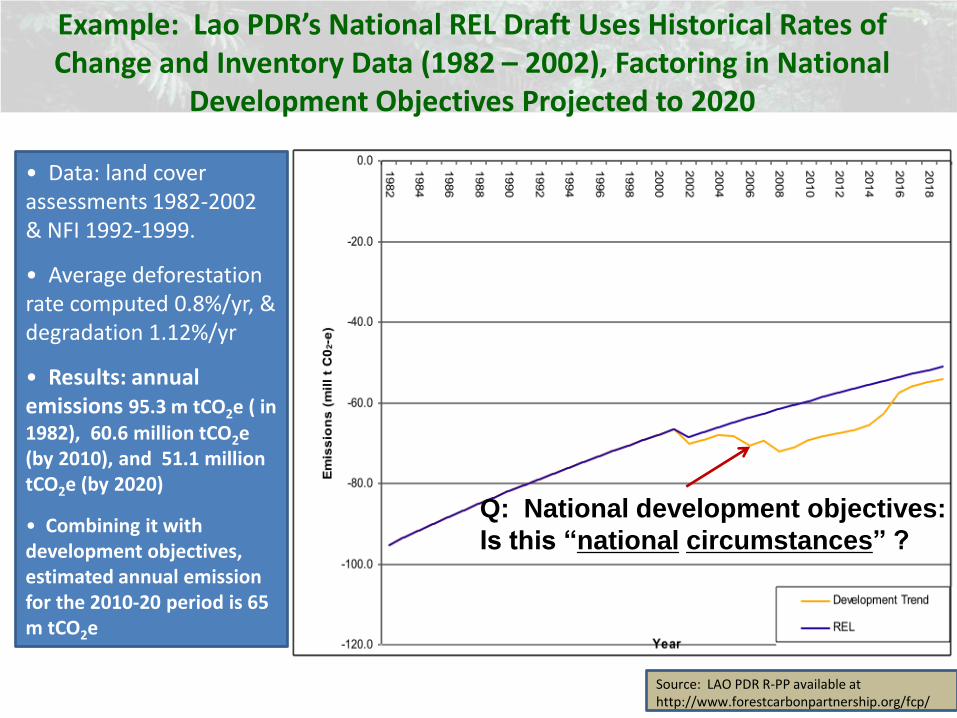
Example: Lao PDR’s National REL Draft Uses Historical Rates of Change and Inventory Data (1982 – 2002), Factoring in National
Development Objectives Projected to 2020
• Data: land cover assessments 1982-2002 & NFI 1992-1999.
• Average deforestation rate computed 0.8%/yr, & degradation 1.12%/yr
• Results: annual emissions 95.3 m tCO2e ( in 1982), 60.6 million tCO2e (by 2010), and 51.1 million tCO2e (by 2020)
• Combining it with development objectives, estimated annual emission for the 2010-20 period is 65 m tCO2e
Source: LAO PDR R-PP available at http://www.forestcarbonpartnership.org/fcp/
Q: National development objectives:
Is this “national circumstances” ?
Custo de oportunidade
R
RR
R
RRR
R
R
R
AMPA
MT
MA
TO
RR
RO
AC
AP
Belém
Macapá
Manaus
Palmas
Cuiabá
Santarém São Luís
Boa Vista
Rio Branco
Porto Velho 45°W
45°W
50°W
50°W
55°W
60°W
0°
5°S
10°S
15°S
0°
70°W 65°W
60°W
55°W
5°N5°N
65°W
5°S
10°S
15°S
70°W
deforested
Cerrado biome Paved road
Unpaved road
US$ 3-0 per ton
US$ 0 per ton
US$ 8-13 per ton
US$ 3-8 per ton
> US$ 13 per ton
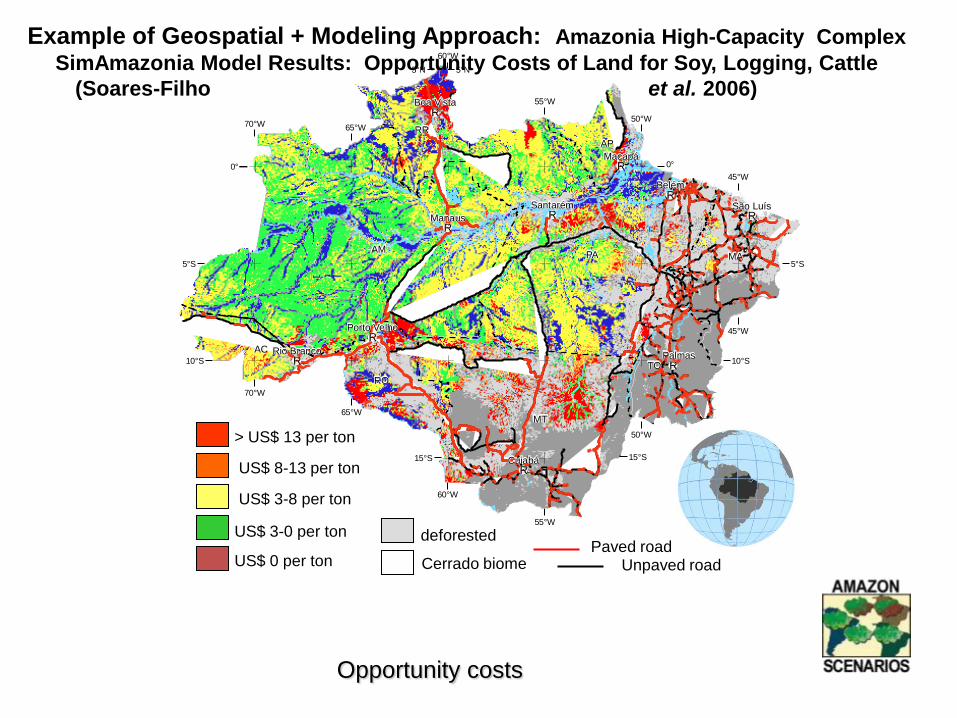
Opportunity costs
Example of Geospatial + Modeling Approach: Amazonia High-Capacity Complex
SimAmazonia Model Results: Opportunity Costs of Land for Soy, Logging, Cattle
(Soares-Filho et al. 2006)
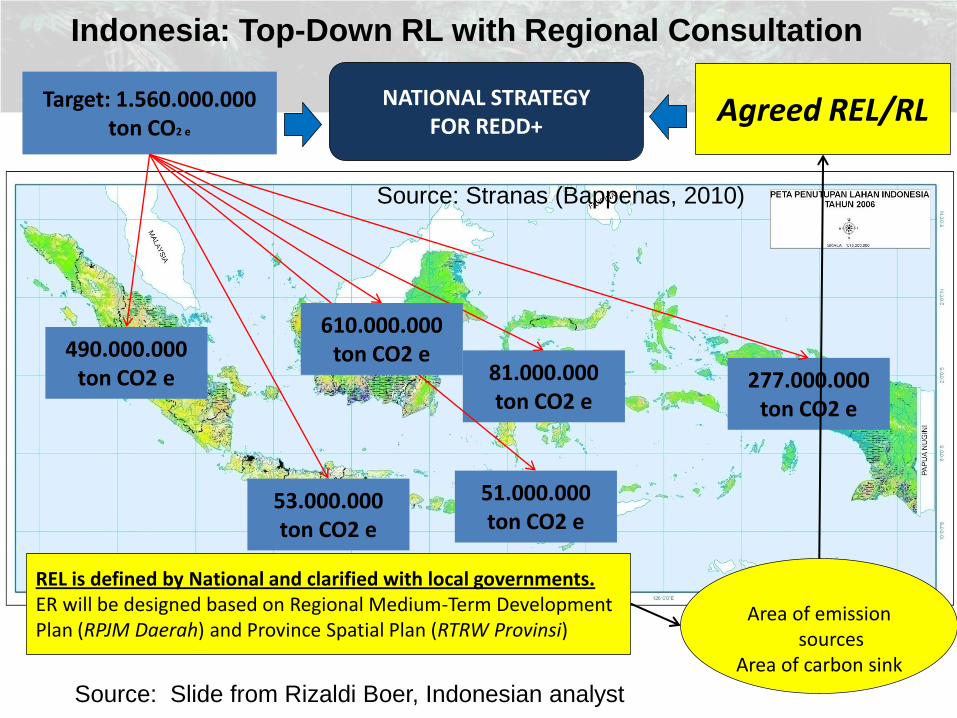
Indonesia: Top-Down RL with Regional Consultation
Target: 1.560.000.000 ton CO2 e
53.000.000 ton CO2 e
51.000.000 ton CO2 e
81.000.000 ton CO2 e
490.000.000 ton CO2 e 277.000.000
ton CO2 e
Sumber peta: Dirjen Planologi Kemenhut, 2009 Sumber data REL: Draft Stranas REDD Balitbang Kemenhut, 2010
REL is defined by National and clarified with local governments. ER will be designed based on Regional Medium-Term Development Plan (RPJM Daerah) and Province Spatial Plan (RTRW Provinsi)
Area of emission
sources Area of carbon sink
Agreed REL/RL NATIONAL STRATEGY FOR REDD+
610.000.000 ton CO2 e
Source: Stranas (Bappenas, 2010)
Source: Slide from Rizaldi Boer, Indonesian analyst
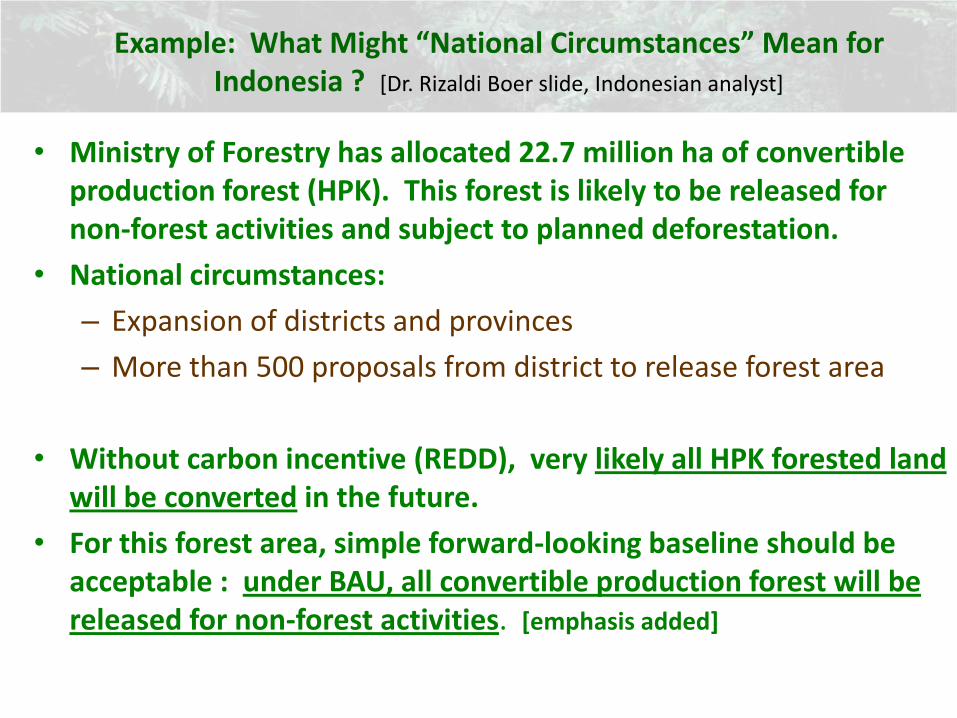
Example: What Might “National Circumstances” Mean for Indonesia ? [Dr. Rizaldi Boer slide, Indonesian analyst]
• Ministry of Forestry has allocated 22.7 million ha of convertible production forest (HPK). This forest is likely to be released for non-forest activities and subject to planned deforestation.
• National circumstances:
– Expansion of districts and provinces
– More than 500 proposals from district to release forest area
• Without carbon incentive (REDD), very likely all HPK forested land will be converted in the future.
• For this forest area, simple forward-looking baseline should be acceptable : under BAU, all convertible production forest will be released for non-forest activities. [emphasis added]
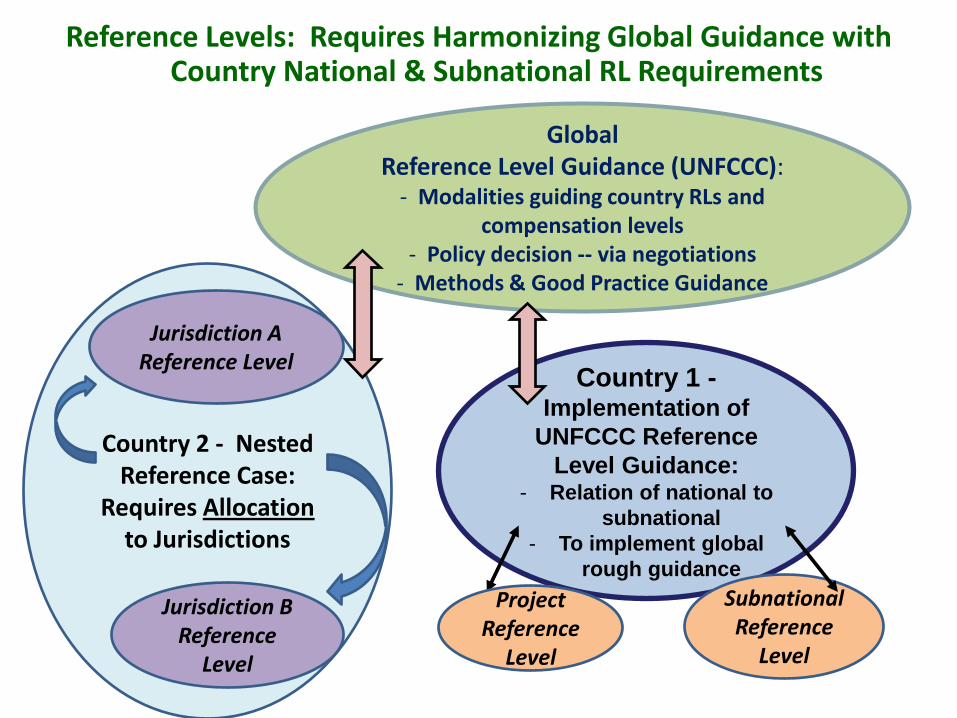
Reference Levels: Requires Harmonizing Global Guidance with Country National & Subnational RL Requirements
Country 1 -Implementation of
UNFCCC Reference
Level Guidance: - Relation of national to
subnational
- To implement global
rough guidance
Subnational Reference
Level
Global Reference Level Guidance (UNFCCC):
- Modalities guiding country RLs and compensation levels
- Policy decision -- via negotiations - Methods & Good Practice Guidance
Country 2 - Nested Reference Case:
Requires Allocation to Jurisdictions
Jurisdiction B Reference
Level
Project Reference
Level
Jurisdiction A Reference Level
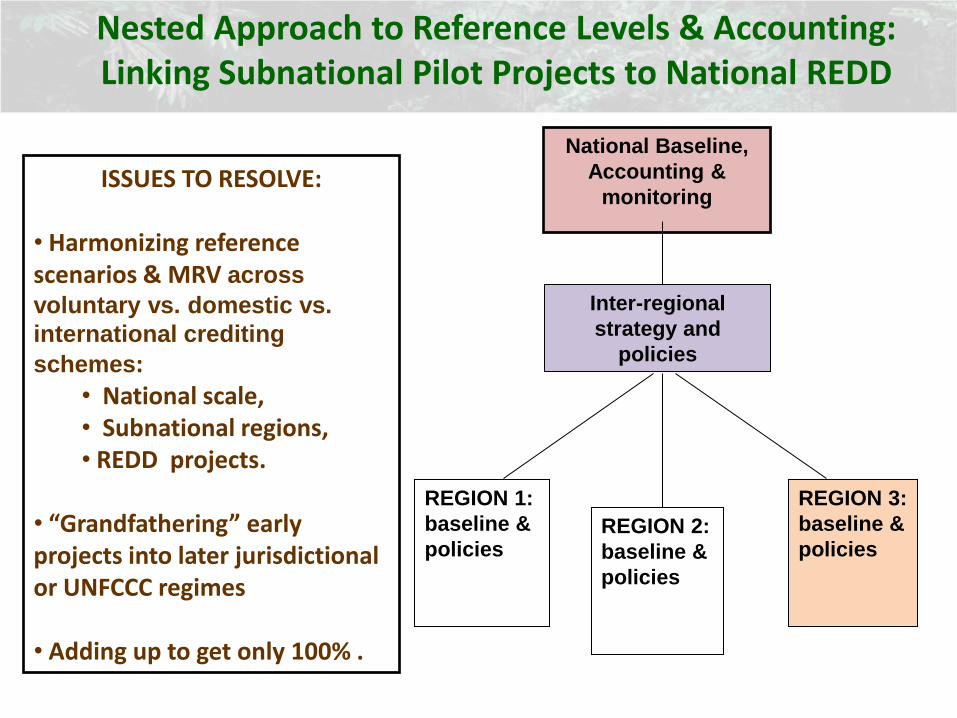
National Baseline,
Accounting &
monitoring
Inter-regional
strategy and
policies
REGION 1:
baseline &
policies REGION 2:
baseline &
policies
REGION 3:
baseline &
policies
ISSUES TO RESOLVE: • Harmonizing reference scenarios & MRV across
voluntary vs. domestic vs.
international crediting
schemes: • National scale, • Subnational regions, • REDD projects.
• “Grandfathering” early projects into later jurisdictional or UNFCCC regimes • Adding up to get only 100% .
Nested Approach to Reference Levels & Accounting: Linking Subnational Pilot Projects to National REDD
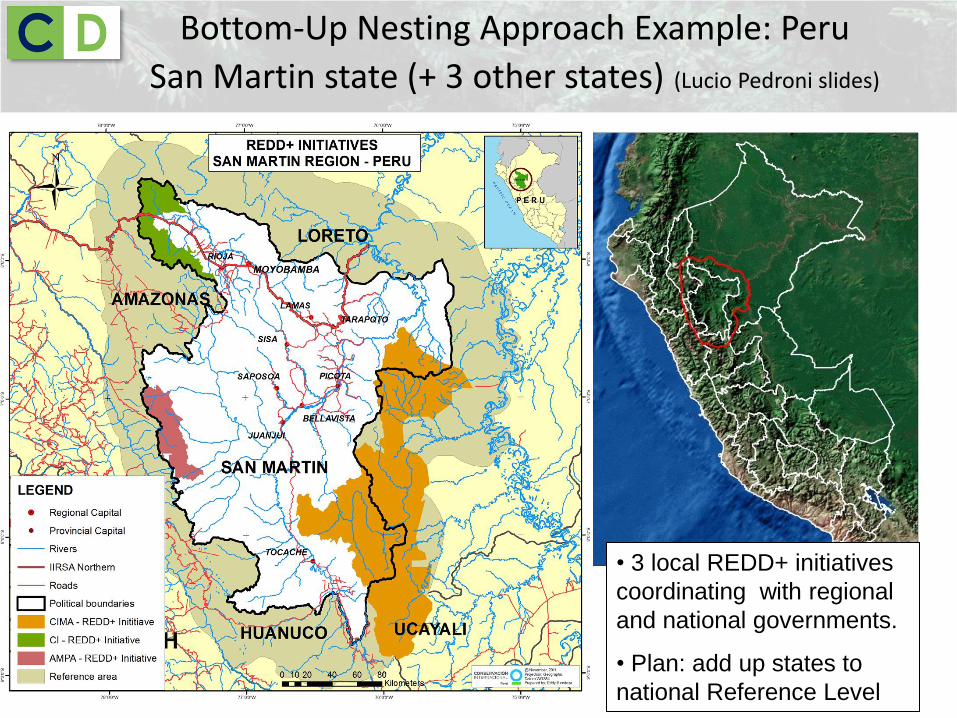
Bottom-Up Nesting Approach Example: Peru
San Martin state (+ 3 other states) (Lucio Pedroni slides)
• 3 local REDD+ initiatives
coordinating with regional
and national governments.
• Plan: add up states to
national Reference Level
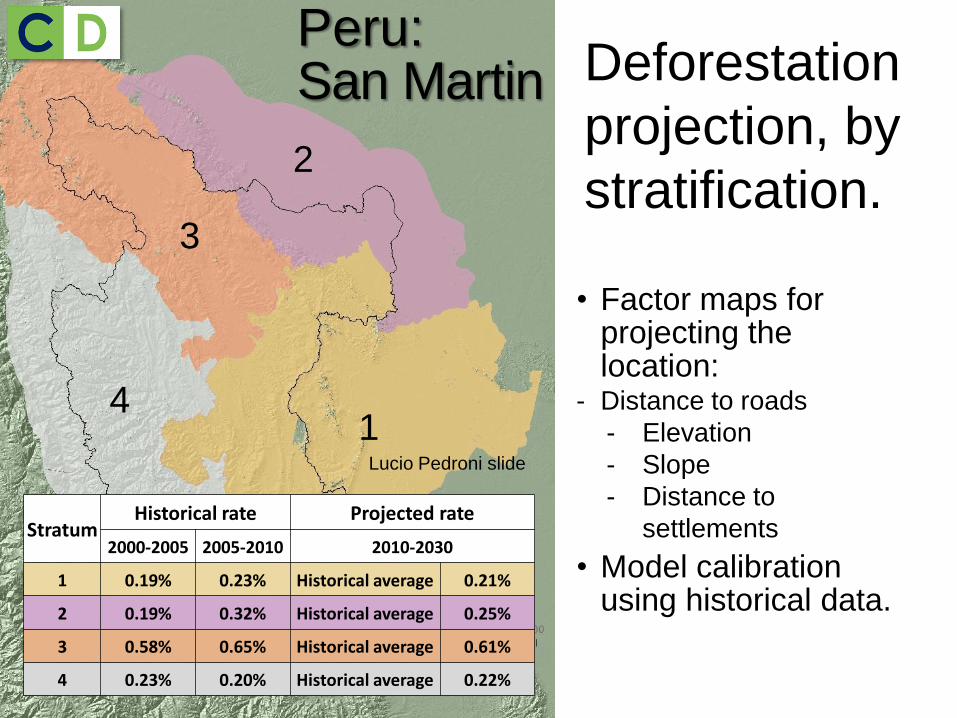
• Factor maps for projecting the location:
- Distance to roads
- Elevation
- Slope
- Distance to
settlements
• Model calibration using historical data.
Peru: San Martin Deforestation
projection, by
stratification.
Stratum Historical rate Projected rate
2000-2005 2005-2010 2010-2030
1 0.19% 0.23% Historical average 0.21%
2 0.19% 0.32% Historical average 0.25%
3 0.58% 0.65% Historical average 0.61%
4 0.23% 0.20% Historical average 0.22%
1
2
3
4
Lucio Pedroni slide
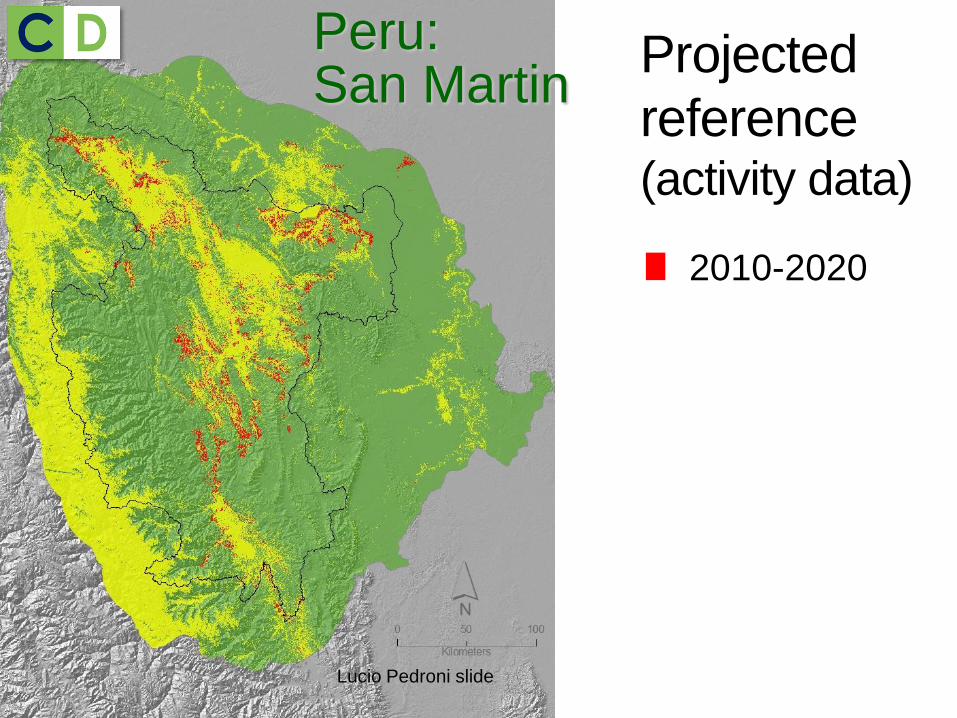
Peru: San Martin
2010-2020
Projected
reference (activity data)
Lucio Pedroni slide
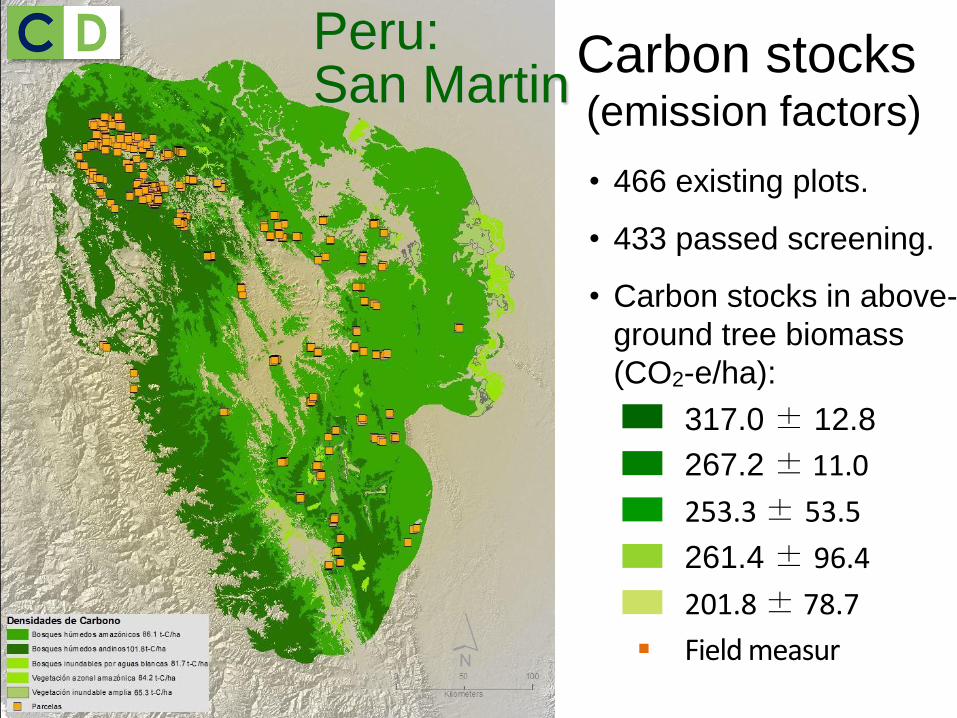
• 466 existing plots.
• 433 passed screening.
• Carbon stocks in above-
ground tree biomass
(CO2-e/ha):
317.0 ± 12.8
267.2 ± 11.0
253.3 ± 53.5
261.4 ± 96.4
201.8 ± 78.7
Field measured plot
Peru: San Martin
Carbon stocks (emission factors)
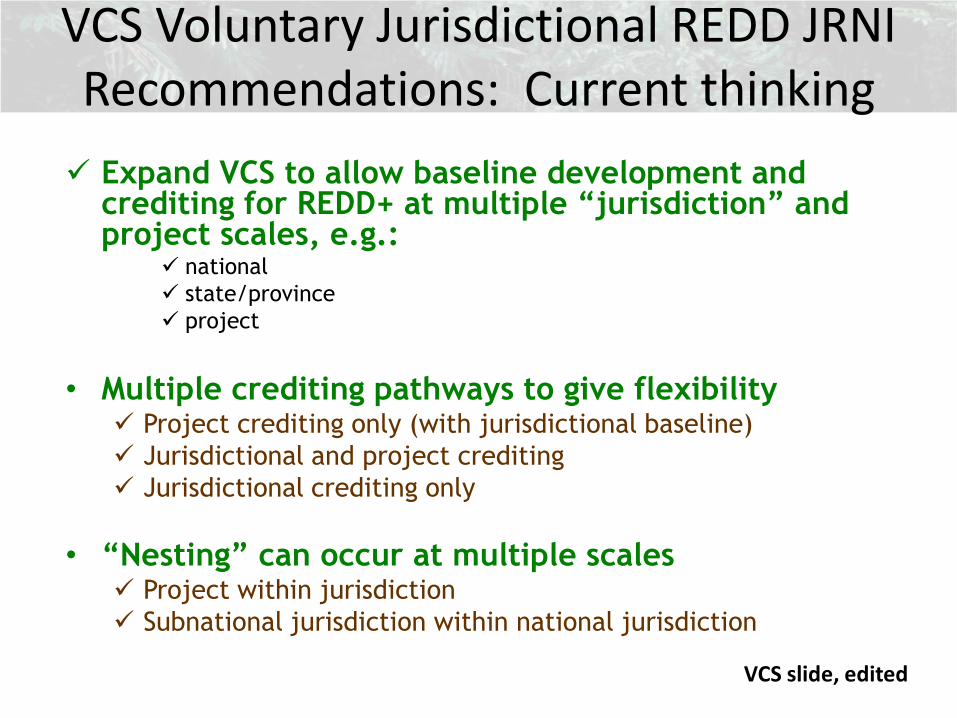
VCS Voluntary Jurisdictional REDD JRNI Recommendations: Current thinking
Expand VCS to allow baseline development and crediting for REDD+ at multiple “jurisdiction” and project scales, e.g.:
national
state/province
project
• Multiple crediting pathways to give flexibility Project crediting only (with jurisdictional baseline)
Jurisdictional and project crediting
Jurisdictional crediting only
• “Nesting” can occur at multiple scales Project within jurisdiction
Subnational jurisdiction within national jurisdiction
VCS slide, edited
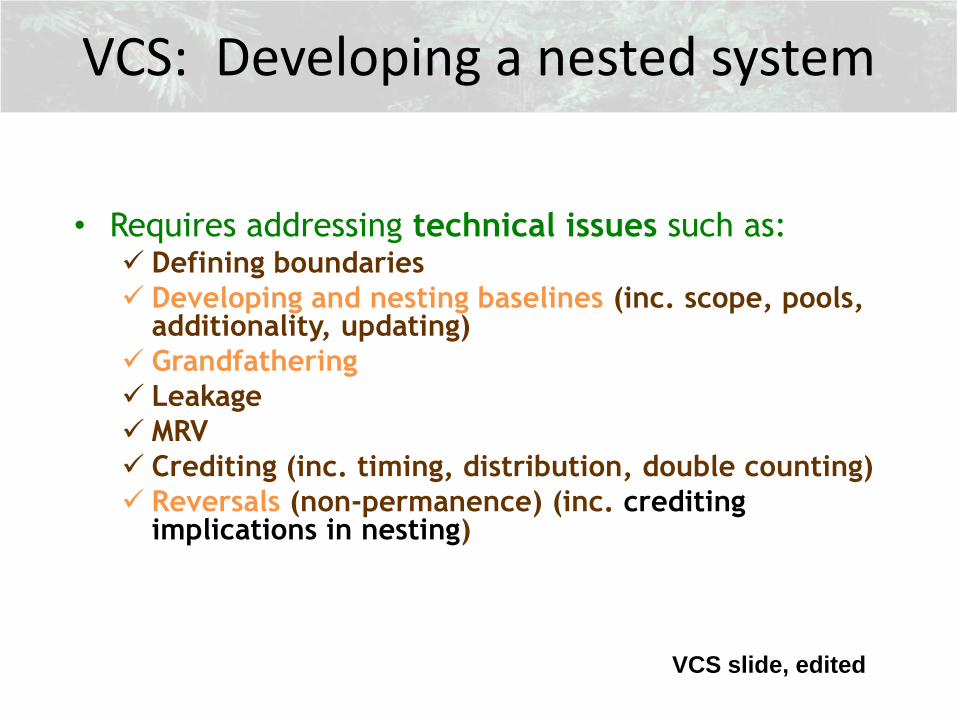
VCS: Developing a nested system
• Requires addressing technical issues such as: Defining boundaries
Developing and nesting baselines (inc. scope, pools, additionality, updating)
Grandfathering
Leakage
MRV
Crediting (inc. timing, distribution, double counting)
Reversals (non-permanence) (inc. crediting implications in nesting)
VCS slide, edited
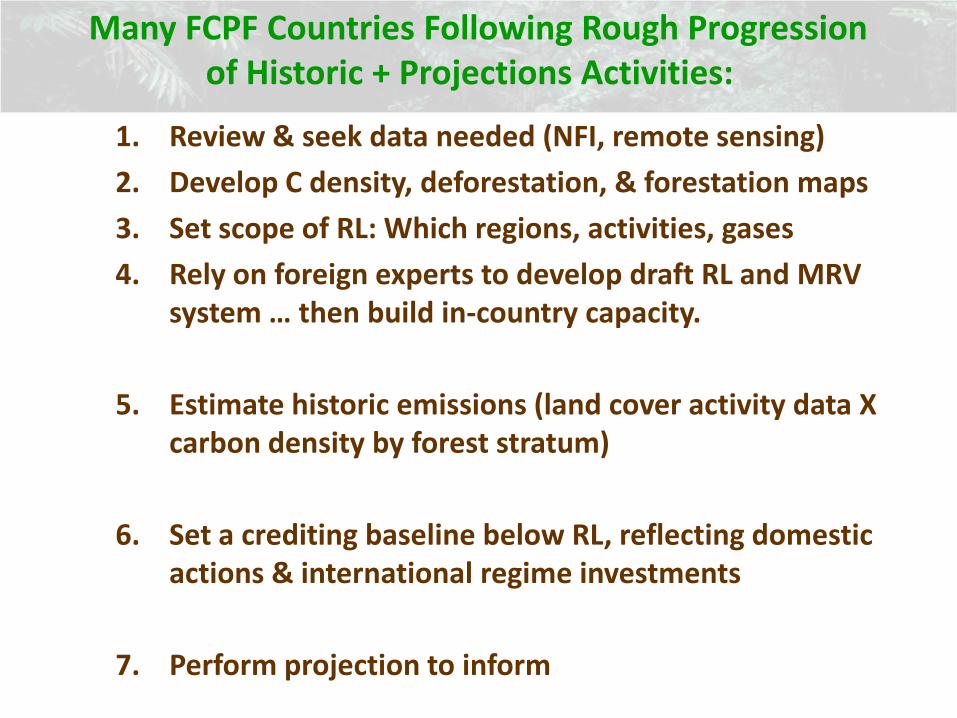
1. Review & seek data needed (NFI, remote sensing)
2. Develop C density, deforestation, & forestation maps
3. Set scope of RL: Which regions, activities, gases
4. Rely on foreign experts to develop draft RL and MRV system … then build in-country capacity.
5. Estimate historic emissions (land cover activity data X carbon density by forest stratum)
6. Set a crediting baseline below RL, reflecting domestic actions & international regime investments
7. Perform projection to inform
Many FCPF Countries Following Rough Progression of Historic + Projections Activities:
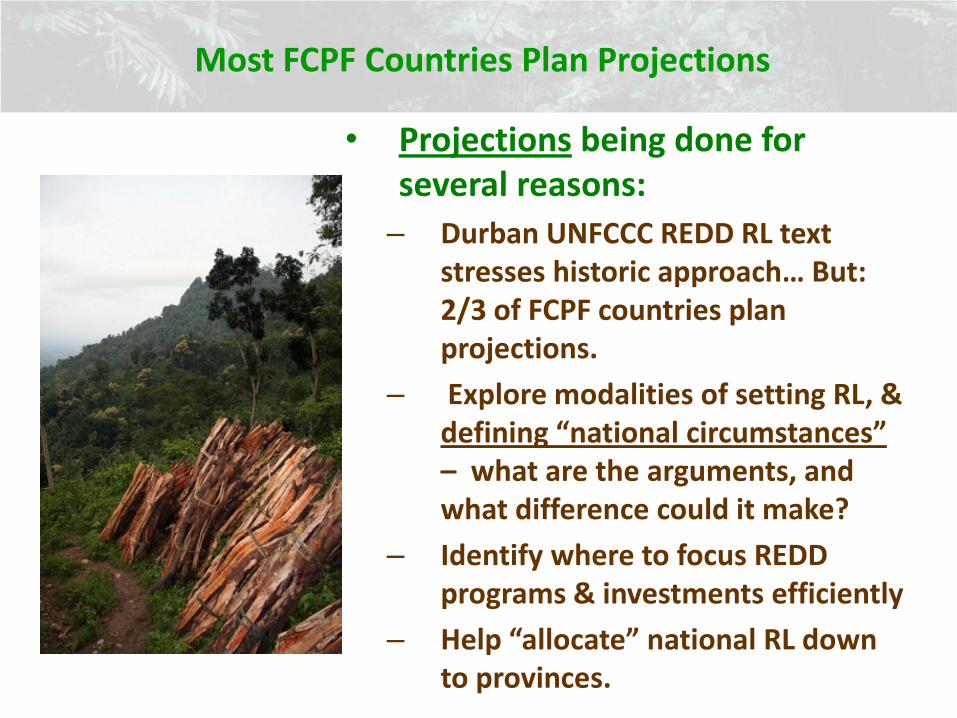
• Projections being done for several reasons:
– Durban UNFCCC REDD RL text stresses historic approach… But: 2/3 of FCPF countries plan projections.
– Explore modalities of setting RL, & defining “national circumstances” – what are the arguments, and what difference could it make?
– Identify where to focus REDD programs & investments efficiently
– Help “allocate” national RL down to provinces.
Most FCPF Countries Plan Projections
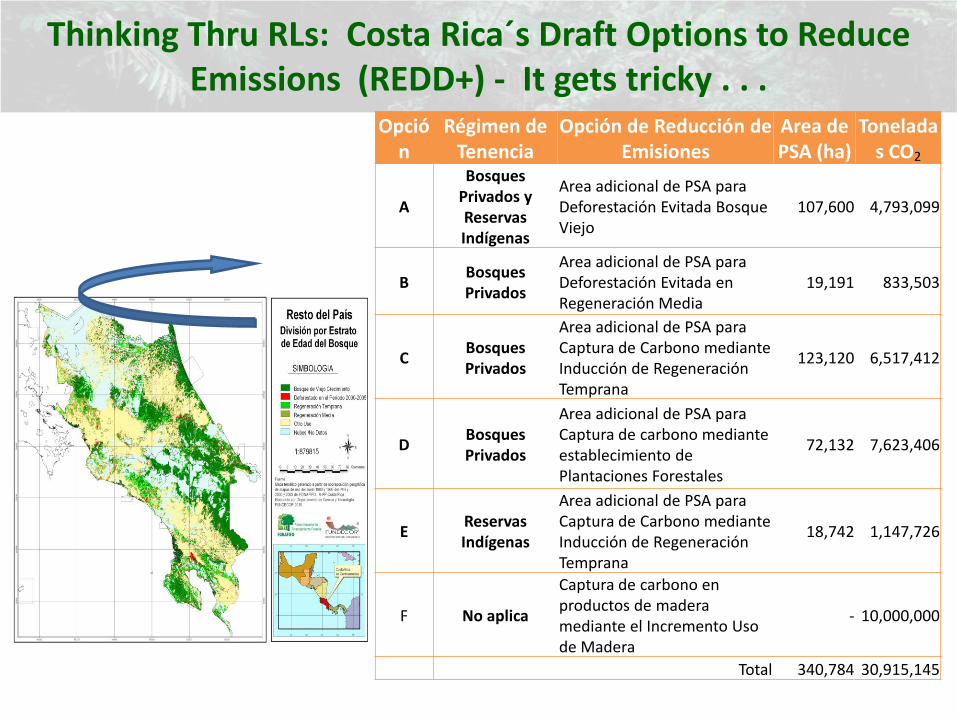
Thinking Thru RLs: Costa Rica´s Draft Options to Reduce Emissions (REDD+) - It gets tricky . . .
Opción
Régimen de Tenencia
Opción de Reducción de Emisiones
Area de PSA (ha)
Toneladas CO2
A
Bosques Privados y Reservas Indígenas
Area adicional de PSA para Deforestación Evitada Bosque Viejo
107,600 4,793,099
B Bosques Privados
Area adicional de PSA para Deforestación Evitada en Regeneración Media
19,191 833,503
C Bosques Privados
Area adicional de PSA para Captura de Carbono mediante Inducción de Regeneración Temprana
123,120 6,517,412
D Bosques Privados
Area adicional de PSA para Captura de carbono mediante establecimiento de Plantaciones Forestales
72,132 7,623,406
E Reservas Indígenas
Area adicional de PSA para Captura de Carbono mediante Inducción de Regeneración Temprana
18,742 1,147,726
F No aplica
Captura de carbono en productos de madera mediante el Incremento Uso de Madera
- 10,000,000
Total 340,784 30,915,145
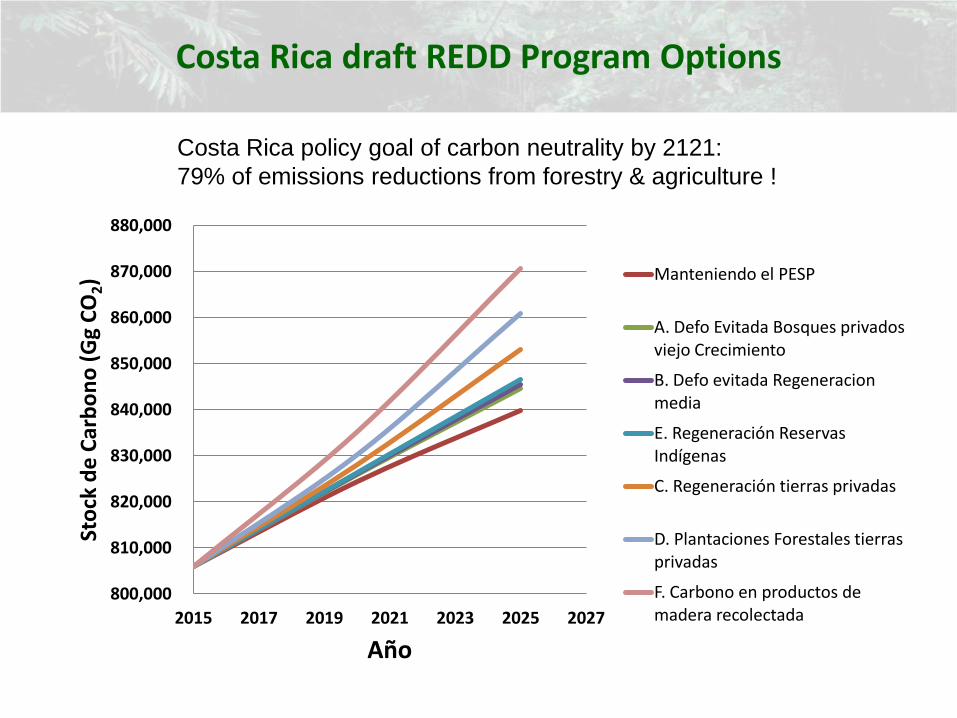
Costa Rica draft REDD Program Options
800,000
810,000
820,000
830,000
840,000
850,000
860,000
870,000
880,000
2015 2017 2019 2021 2023 2025 2027
Sto
ck d
e C
arb
on
o (
Gg
CO
2)
Año
Manteniendo el PESP
A. Defo Evitada Bosques privados viejo Crecimiento
B. Defo evitada Regeneracion media
E. Regeneración Reservas Indígenas
C. Regeneración tierras privadas
D. Plantaciones Forestales tierras privadas
F. Carbono en productos de madera recolectada
Costa Rica policy goal of carbon neutrality by 2121:
79% of emissions reductions from forestry & agriculture !
650,000
700,000
750,000
800,000
850,000
900,000
2000 2005 2010 2015 2020 2025
Sto
ck d
e C
arb
on
o (
Gg
CO
2)
Año
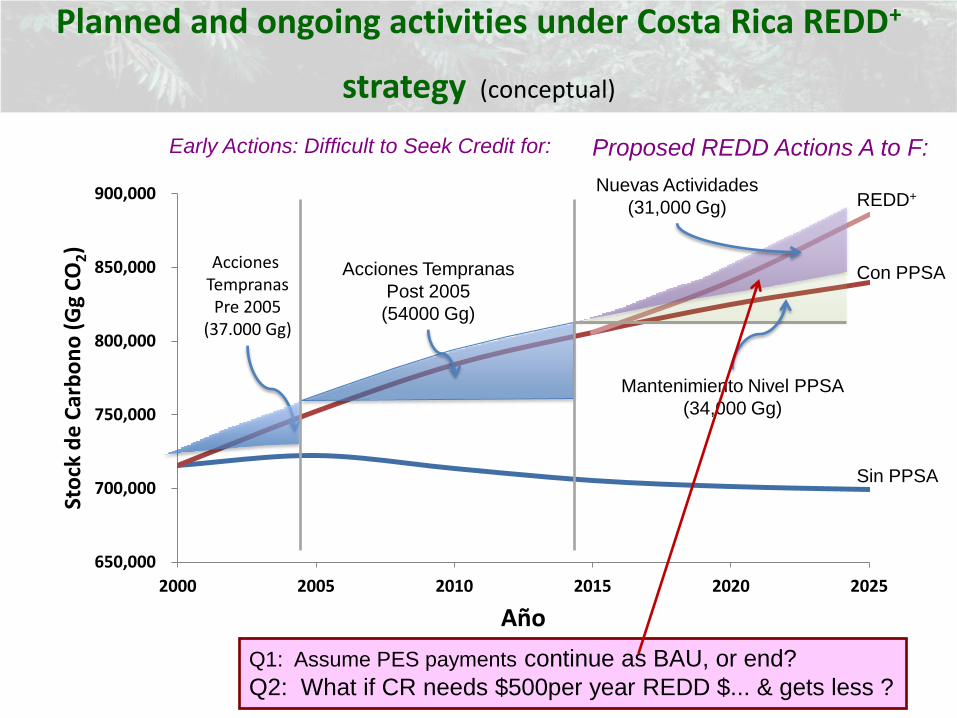
Acciones Tempranas Pre 2005
(37.000 Gg)
Planned and ongoing activities under Costa Rica REDD+
strategy (conceptual)
Acciones Tempranas
Post 2005
(54000 Gg)
Mantenimiento Nivel PPSA
(34,000 Gg)
Nuevas Actividades
(31,000 Gg)
Sin PPSA
Con PPSA
REDD+
Early Actions: Difficult to Seek Credit for: Proposed REDD Actions A to F:
Q1: Assume PES payments continue as BAU, or end?
Q2: What if CR needs $500per year REDD $... & gets less ?
650,000
700,000
750,000
800,000
850,000
900,000
2000 2005 2010 2015 2020 2025
Sto
ck d
e C
arb
on
o (
Gg
CO
2)
Año
Sin PPSA
Con PPSA
REDD+
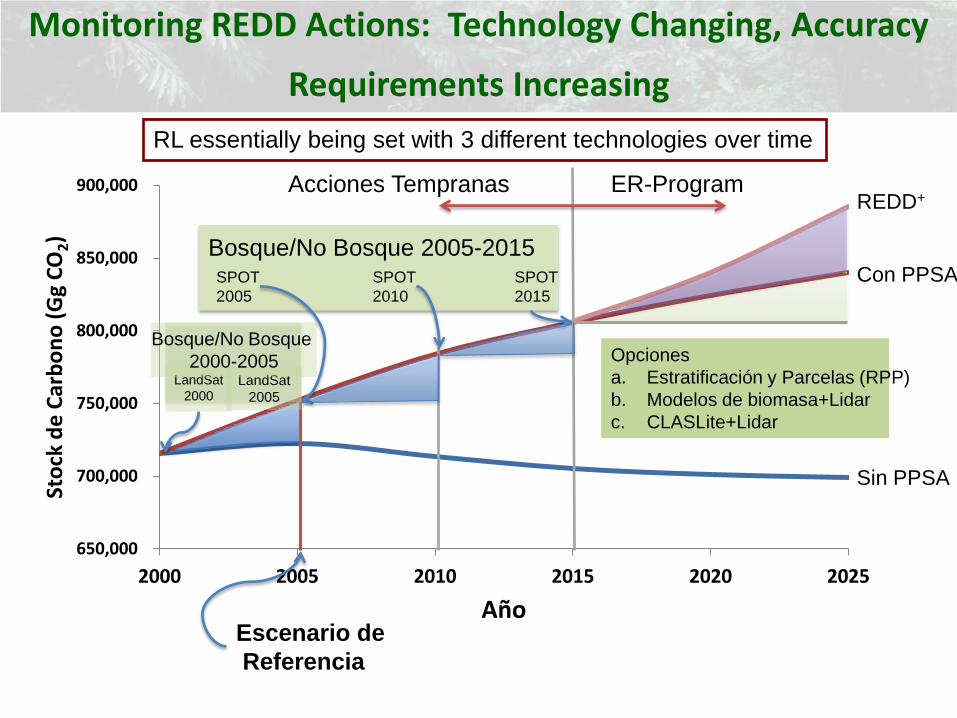
Monitoring REDD Actions: Technology Changing, Accuracy
Requirements Increasing
SPOT
2005
SPOT
2010
SPOT
2015
Bosque/No Bosque 2005-2015
LandSat
2005
LandSat
2000
Bosque/No Bosque
2000-2005
Escenario de
Referencia
Opciones
a. Estratificación y Parcelas (RPP)
b. Modelos de biomasa+Lidar
c. CLASLite+Lidar
Acciones Tempranas ER-Program
RL essentially being set with 3 different technologies over time
• Some countries appear to be using national RL.
• Most countries plan to use some kind of nested approach, starting subnationally - - and eventually upscaling to national.
• 64% countries (16 out of 24) propose developing RL by analyzing historic trends, and projecting into the future somehow.
• Data & capacity for even simple historic approach is challenging for most countries !
28
Summary of RL Trends from FCPF
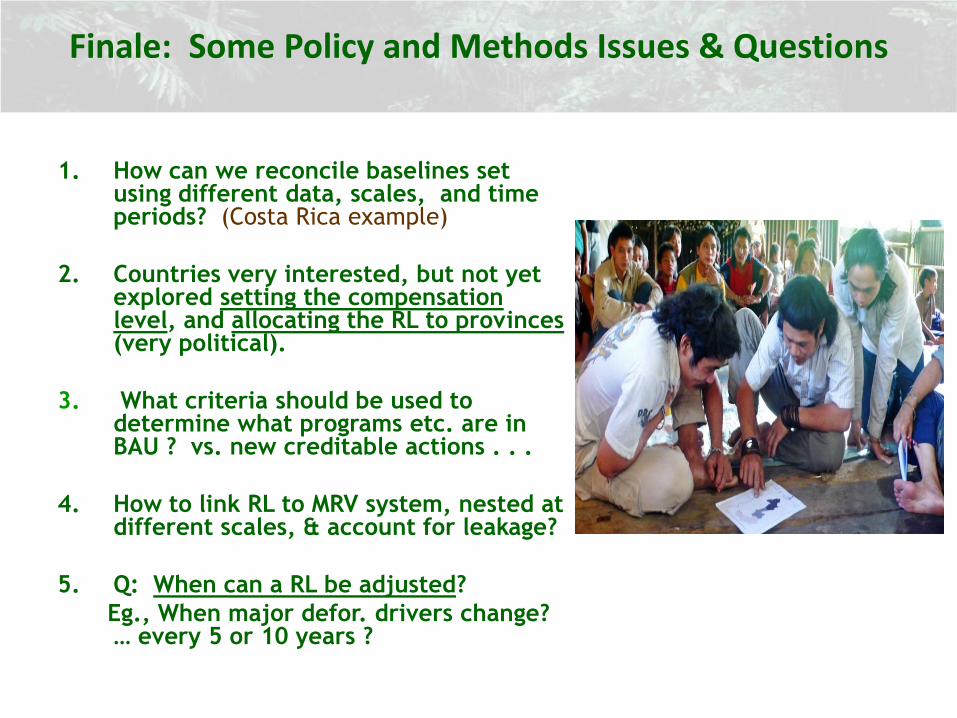
Finale: Some Policy and Methods Issues & Questions
1. How can we reconcile baselines set using different data, scales, and time periods? (Costa Rica example)
2. Countries very interested, but not yet explored setting the compensation level, and allocating the RL to provinces (very political).
3. What criteria should be used to determine what programs etc. are in BAU ? vs. new creditable actions . . .
4. How to link RL to MRV system, nested at different scales, & account for leakage?
5. Q: When can a RL be adjusted?
Eg., When major defor. drivers change? … every 5 or 10 years ?