Forensic Drug Identification by Gas Chromatography ... · PDF fileRobert Shipman, Trisha...
63
The author(s) shown below used Federal funds provided by the U.S. Department of Justice and prepared the following final report: Document Title: Forensic Drug Identification by Gas Chromatography – Infrared Spectroscopy Author(s): Robert Shipman, Trisha Conti, Tara Tighe, Eric Buel Document No.: 242698 Date Received: June 2013 Award Number: 2008-DN-BX-K161 This report has not been published by the U.S. Department of Justice. To provide better customer service, NCJRS has made this Federally- funded grant report available electronically. Opinions or points of view expressed are those of the author(s) and do not necessarily reflect the official position or policies of the U.S. Department of Justice.
Transcript of Forensic Drug Identification by Gas Chromatography ... · PDF fileRobert Shipman, Trisha...
The author(s) shown below used Federal funds provided by the U.S. Department of Justice and prepared the following final report: Document Title: Forensic Drug Identification by Gas
Chromatography – Infrared Spectroscopy
Author(s): Robert Shipman, Trisha Conti, Tara Tighe, Eric Buel
Document No.: 242698 Date Received: June 2013 Award Number: 2008-DN-BX-K161 This report has not been published by the U.S. Department of Justice. To provide better customer service, NCJRS has made this Federally-funded grant report available electronically.
Opinions or points of view expressed are those of the author(s) and do not necessarily reflect
the official position or policies of the U.S. Department of Justice.
1
Research and Development in the Area of Controlled Substances
Forensic Drug Identification by Gas Chromatography- Infrared Spectroscopy
Award Number: 2008-DN-BX-K161
Robert Shipman, Trisha Conti, PhD, Tara Tighe, MS and Eric Buel, PhD
ABSTRACT
The primary goal of the forensic drug examiner is the unequivocal identification of any
controlled substance present in a drug exhibit. Most forensic laboratories routinely employ Gas
Chromatography/ Mass Spectrometry (GC/MS) as the preferred method for this examination.
The technique provides a rapid, semi-automated analysis of the sample and typically yields
sufficient information to identify the compounds in question. However, the application of
GC/MS for drug analysis does have its limitations.
Certain drugs yield minimal mass spectral fragmentation patterns using electron impact MS,
while other compounds, such as some diastereomers and positional isomers, are not readily
differentiated by mass spectroscopy. Infrared spectroscopy (IR, meaning FTIR) provides an
alternate technique to mass spectroscopy for the identification of organic compounds. Recent
improvements in the hyphenated technique, Gas Chromatography/Infrared Spectroscopy
(GC/IR) may provide a simple alternative or supplemental approach to GC/MS for the
identification of certain compounds. A newly introduced instrument collects GC effluent on a
liquid nitrogen cooled, IR transparent window that allows the direct analysis of the deposited
solid material. This technique is superior to the IR light pipe in sensitivity, IR spectral quality,
and allows direct comparison of the collected spectra to existing IR databases. Our research
This document is a research report submitted to the U.S. Department of Justice. This report has not been published by the Department. Opinions or points of view expressed are those of the author(s)
and do not necessarily reflect the official position or policies of the U.S. Department of Justice.
2
developed procedures and protocols for the analysis of drugs and determined the benefits and
limitations of this technology. This research focused on the routine identification of commonly
encountered drugs, designer drugs, closely related drug isomers, as well as the fundamentals of
the gas chromatography and infrared systems. Statement of purpose: The research was
undertaken to develop this technology into a viable technique for the forensic community.
The instrument was studied for repeatability, sensitivity, and selectivity while optimizing for
analysis of a wide range of drug samples. Based upon this work the instrument proved to be a
powerful forensic tool providing complimentary data to GC/MS. Acceptable levels of
sensitivity, linearity, and reproducibility were achieved using the GC split-less injection mode.
Concern about cross contamination of samples on the collection disk were dispelled as the
deposited GC vapor produced solid “tracks” that were unique to each sample and appropriately
documented by the instrument. Analytical methods were developed for the routine analyses of
drugs and synthetic cannabinoids. Through these studies the instrument was verified for
casework analysis and is presently in operational use in our laboratory.
Software limitations hindered research progress, although software and hardware upgrades
were made by the vendor (Spectra Analysis) some of which were driven by feedback provided
by staff at the Vermont Forensic Laboratory (VFL).
This document is a research report submitted to the U.S. Department of Justice. This report has not been published by the Department. Opinions or points of view expressed are those of the author(s)
and do not necessarily reflect the official position or policies of the U.S. Department of Justice.
3
TABLE OF CONTENTS
ITEM PAGE(S)
ABSTRACT 1-2
EXECUTIVE SUMMARY 4-10
MAIN BODY 11-62
I. Introduction 11-18
II. Methods 19-25
III. Results 26-37
IV. Conclusions 38-40
V. References 41-42
VI. Dissemination of Research Findings 43-44
VII. Appendix 1 Tables 45-49
VIII. Appendix 2 Figures 50-62
This document is a research report submitted to the U.S. Department of Justice. This report has not been published by the Department. Opinions or points of view expressed are those of the author(s)
and do not necessarily reflect the official position or policies of the U.S. Department of Justice.
4
EXECUTIVE SUMMARY
Problem
Forensic Scientists are required to identify an ever increasing and more complex assortment of
drugs and related compounds. A particular problem is the increased submission of designer or
synthetic drugs. A variety of compounds appear “on the street” which are designed to avoid
existing laws by making slight modifications to the structure of the controlled substance. These
drugs were once an occasional problem, today they have become much more common. Due to
the structural similarity of the specimens encountered by the forensic laboratory, an array of
instruments is needed to correctly identify these substances. A new GC/IR instrument has been
developed which can aid in the forensic analysis of drug samples. An instrument that can
provide additional data to distinguish closely related compounds could be an asset to the
community.
Samples submitted to the lab may contain complex mixtures of drugs and other compounds. In
2011/2012, the Federal and Vermont State governments added many synthetic compounds to
temporary schedules or regulated lists (see 17, 18 for recent regulations). These included
cathinones (“bath-salts”), cannabinoids(“K2/Spice”), and additional 2C compounds (2,5-
dimethoxy phenethylamines) compounds. Identification of these chemicals in combination with
other compounds created unexpected demands on Forensic labs, including the Vermont Forensic
Lab. The final part of the research grant focused on these new synthetic compounds which were
being submitted to the lab as casework.
This document is a research report submitted to the U.S. Department of Justice. This report has not been published by the Department. Opinions or points of view expressed are those of the author(s)
and do not necessarily reflect the official position or policies of the U.S. Department of Justice.
5
Purpose
The purpose of this research was to determine the feasibility of a new type of GC/IR instrument
to aid in the analysis of samples for suspected drugs. Infrared analysis is already a powerful
analytic tool utilized in most forensic laboratories. Coupling IR detection with a separation
technique would provide a valuable instrument to forensic labs. This research was undertaken
by the VFL to access the assets and limitations of the Spectra Analysis DiscovIR-GC system.
Research design
Our laboratory received this grant to further study the limitations and benefits of this new
instrument for drug analysis. Feedback to the vendor helped create useful software and hardware
upgrades. The VFL developed protocols to enable successful testing by GC/IR of samples and
standards, and optimized the system for routine casework analysis. Several IR spectral libraries
were used: commercial (available through the vendor), vendor generated and in-house generated.
Findings
Preliminary work at the VFL on the GC/IR system (before obtaining the grant) revealed a tool
with a large potential. We examined several drug types which are hard to differentiate using
GC/MS. Diastereoisomers are challenging to analyze. Ephedrine and pseudoephedrine may be
resolved by GC (figure 1), but their mass spectra is not determinative (figure 2). The GC/IR
spectra for these two compounds are shown in figure 3. Differences in the infrared fingerprint
region allow identification of these diastereoisomers. This research was conducted to determine
if the GC/IR could be used as a cutting edge forensic tool to identify complex drug samples.
This document is a research report submitted to the U.S. Department of Justice. This report has not been published by the Department. Opinions or points of view expressed are those of the author(s)
and do not necessarily reflect the official position or policies of the U.S. Department of Justice.
6
The working concentration range was determined for two representative drugs, pseudoephedrine
and cocaine. The VFL desired the concentration range to be similar to that employed for GC/MS
analysis of drugs. This would allow the transfer of sample vials between instruments without
additional dilutions or extractions. The practical limit of detection (PLOD) for these compounds
by GC/IR was 25-50 parts per million (ppm) (weight/volume), which is similar in concentration
to what is routinely used for GC/MS work. Saturation and overloading of the GC/IR instrument
occurred near the 1000 ppm level for the two compounds. Our work did not include
determination of saturation or an overload point for the GC/MS. However from running the
same sample extracts on both systems, it is apparent that the GC/IR will show detector saturation
at lower concentration levels compared to that observed with the GC/MS. This may be due to a
wider linear range for the MS, a greater IR sensitivity for some compounds, and/or the use of
split injection by the GC/MS system.
A split/split-less injection study was undertaken for the GC/IR. The split-less mode was shown
to have an increase in sensitivity, and produce acceptable resolution and peak symmetry for the
test synthetic cannabinoid compound JWH-122. Other drugs (heroin, cocaine, and ethcathinone)
were shown to have acceptable resolution and peak symmetry using the normal drug scan
conditions.
Acceptable resolution of a JWH isomer mix (composed of a mix of ortho, meta and para
isomers) was demonstrated using the synthetic cannabinoid drug conditions.
Retention times were highly reproducible as ten injections of cocaine and pseudoephedrine had
low % relative standard deviation (RSD) values when comparing the retention times.
It is well known that different crystalline states of a compound will affect the IR spectra
obtained from that compound. We noticed differences between the IR spectra for a number of
This document is a research report submitted to the U.S. Department of Justice. This report has not been published by the Department. Opinions or points of view expressed are those of the author(s)
and do not necessarily reflect the official position or policies of the U.S. Department of Justice.
7
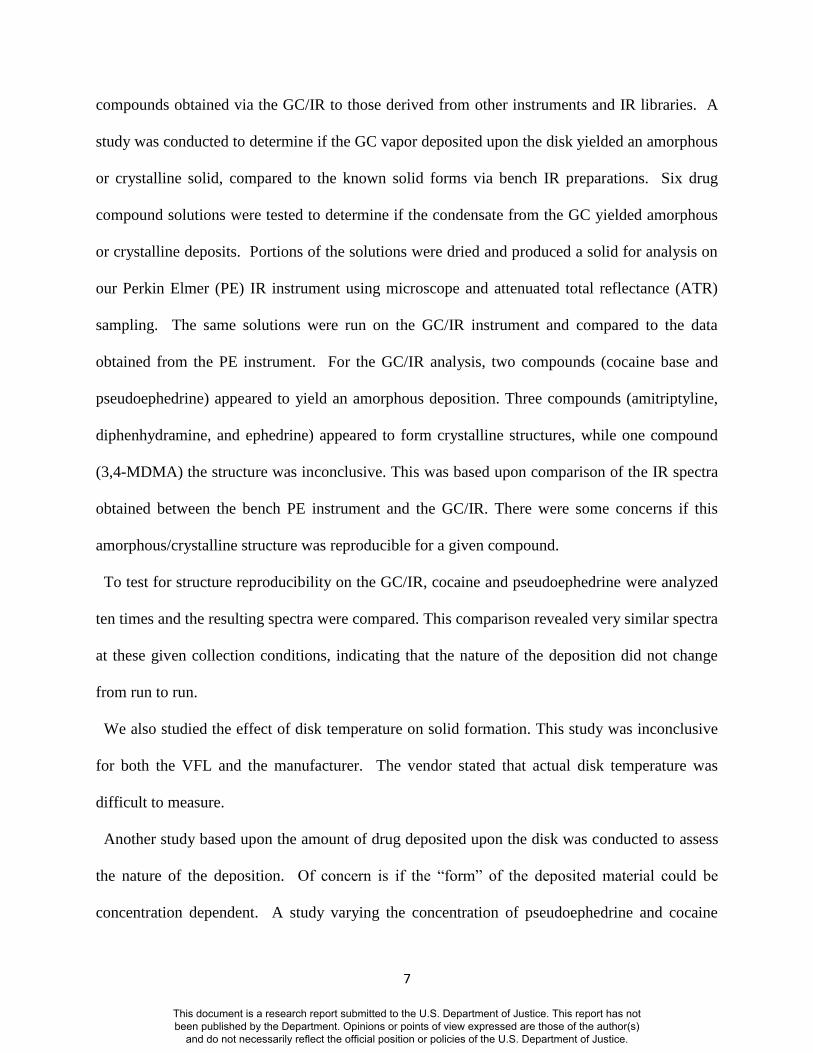
compounds obtained via the GC/IR to those derived from other instruments and IR libraries. A
study was conducted to determine if the GC vapor deposited upon the disk yielded an amorphous
or crystalline solid, compared to the known solid forms via bench IR preparations. Six drug
compound solutions were tested to determine if the condensate from the GC yielded amorphous
or crystalline deposits. Portions of the solutions were dried and produced a solid for analysis on
our Perkin Elmer (PE) IR instrument using microscope and attenuated total reflectance (ATR)
sampling. The same solutions were run on the GC/IR instrument and compared to the data
obtained from the PE instrument. For the GC/IR analysis, two compounds (cocaine base and
pseudoephedrine) appeared to yield an amorphous deposition. Three compounds (amitriptyline,
diphenhydramine, and ephedrine) appeared to form crystalline structures, while one compound
(3,4-MDMA) the structure was inconclusive. This was based upon comparison of the IR spectra
obtained between the bench PE instrument and the GC/IR. There were some concerns if this
amorphous/crystalline structure was reproducible for a given compound.
To test for structure reproducibility on the GC/IR, cocaine and pseudoephedrine were analyzed
ten times and the resulting spectra were compared. This comparison revealed very similar spectra
at these given collection conditions, indicating that the nature of the deposition did not change
from run to run.
We also studied the effect of disk temperature on solid formation. This study was inconclusive
for both the VFL and the manufacturer. The vendor stated that actual disk temperature was
difficult to measure.
Another study based upon the amount of drug deposited upon the disk was conducted to assess
the nature of the deposition. Of concern is if the “form” of the deposited material could be
concentration dependent. A study varying the concentration of pseudoephedrine and cocaine
This document is a research report submitted to the U.S. Department of Justice. This report has not been published by the Department. Opinions or points of view expressed are those of the author(s)
and do not necessarily reflect the official position or policies of the U.S. Department of Justice.
8
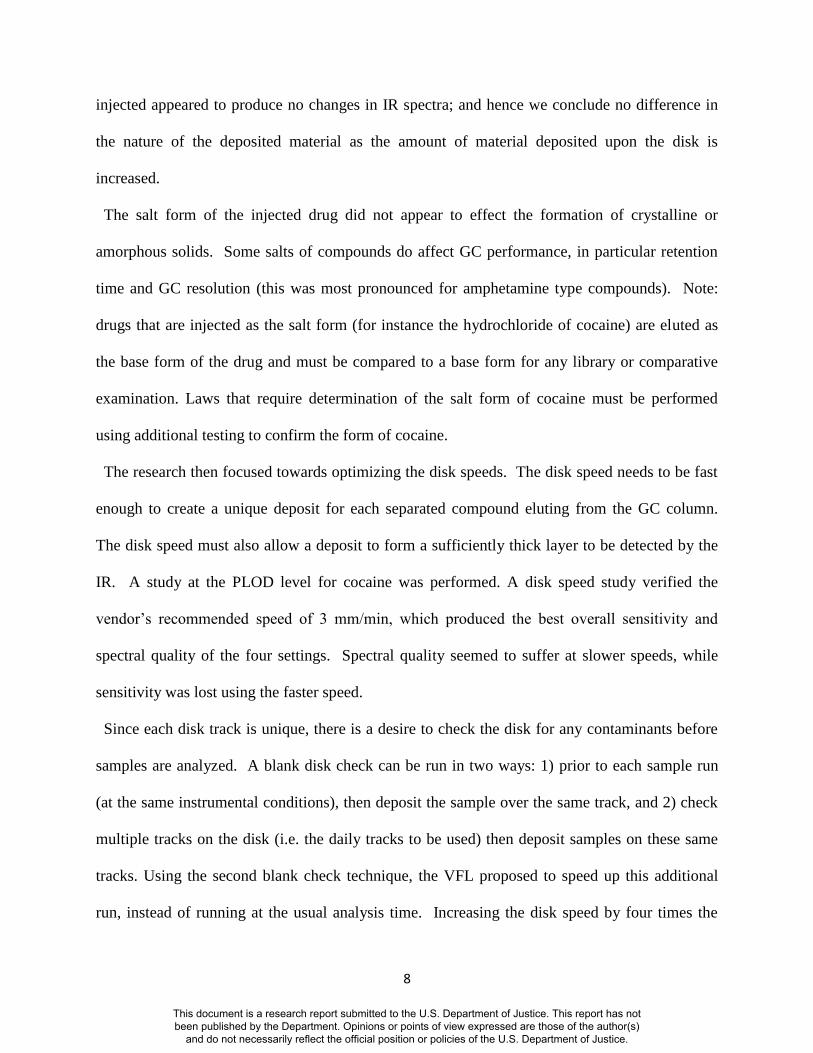
injected appeared to produce no changes in IR spectra; and hence we conclude no difference in
the nature of the deposited material as the amount of material deposited upon the disk is
increased.
The salt form of the injected drug did not appear to effect the formation of crystalline or
amorphous solids. Some salts of compounds do affect GC performance, in particular retention
time and GC resolution (this was most pronounced for amphetamine type compounds). Note:
drugs that are injected as the salt form (for instance the hydrochloride of cocaine) are eluted as
the base form of the drug and must be compared to a base form for any library or comparative
examination. Laws that require determination of the salt form of cocaine must be performed
using additional testing to confirm the form of cocaine.
The research then focused towards optimizing the disk speeds. The disk speed needs to be fast
enough to create a unique deposit for each separated compound eluting from the GC column.
The disk speed must also allow a deposit to form a sufficiently thick layer to be detected by the
IR. A study at the PLOD level for cocaine was performed. A disk speed study verified the
vendor’s recommended speed of 3 mm/min, which produced the best overall sensitivity and
spectral quality of the four settings. Spectral quality seemed to suffer at slower speeds, while
sensitivity was lost using the faster speed.
Since each disk track is unique, there is a desire to check the disk for any contaminants before
samples are analyzed. A blank disk check can be run in two ways: 1) prior to each sample run
(at the same instrumental conditions), then deposit the sample over the same track, and 2) check
multiple tracks on the disk (i.e. the daily tracks to be used) then deposit samples on these same
tracks. Using the second blank check technique, the VFL proposed to speed up this additional
run, instead of running at the usual analysis time. Increasing the disk speed by four times the
This document is a research report submitted to the U.S. Department of Justice. This report has not been published by the Department. Opinions or points of view expressed are those of the author(s)
and do not necessarily reflect the official position or policies of the U.S. Department of Justice.
9
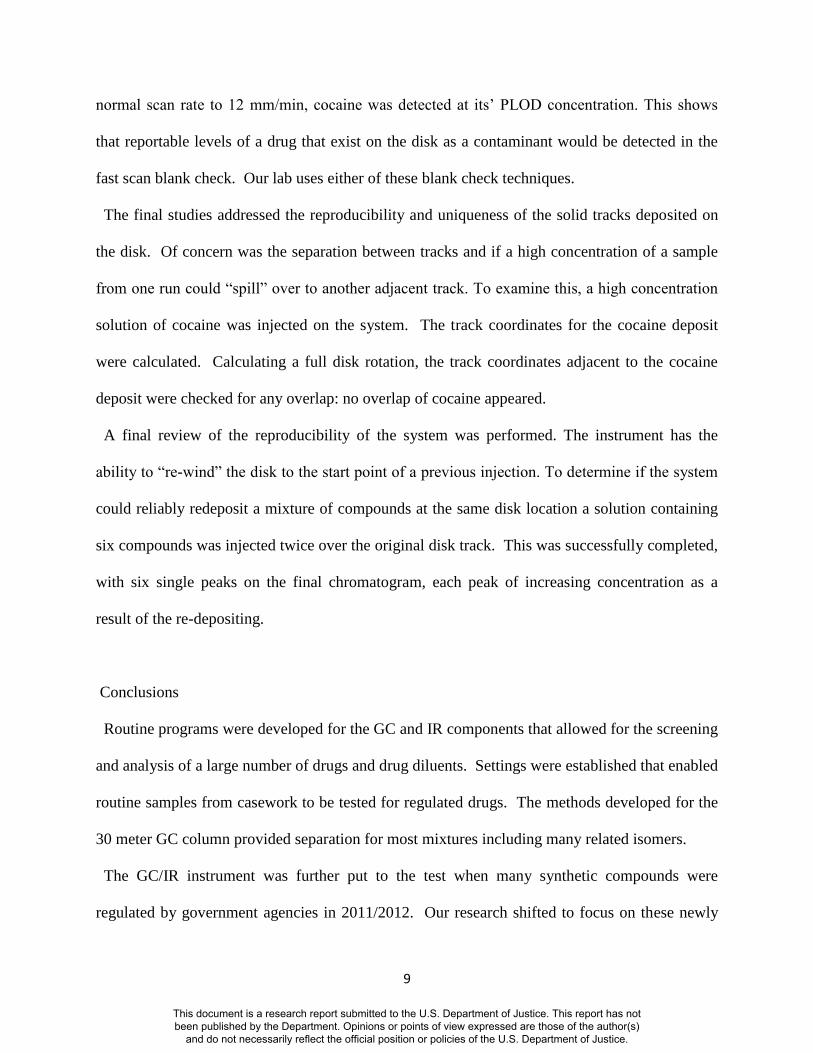
normal scan rate to 12 mm/min, cocaine was detected at its’ PLOD concentration. This shows
that reportable levels of a drug that exist on the disk as a contaminant would be detected in the
fast scan blank check. Our lab uses either of these blank check techniques.
The final studies addressed the reproducibility and uniqueness of the solid tracks deposited on
the disk. Of concern was the separation between tracks and if a high concentration of a sample
from one run could “spill” over to another adjacent track. To examine this, a high concentration
solution of cocaine was injected on the system. The track coordinates for the cocaine deposit
were calculated. Calculating a full disk rotation, the track coordinates adjacent to the cocaine
deposit were checked for any overlap: no overlap of cocaine appeared.
A final review of the reproducibility of the system was performed. The instrument has the
ability to “re-wind” the disk to the start point of a previous injection. To determine if the system
could reliably redeposit a mixture of compounds at the same disk location a solution containing
six compounds was injected twice over the original disk track. This was successfully completed,
with six single peaks on the final chromatogram, each peak of increasing concentration as a
result of the re-depositing.
Conclusions
Routine programs were developed for the GC and IR components that allowed for the screening
and analysis of a large number of drugs and drug diluents. Settings were established that enabled
routine samples from casework to be tested for regulated drugs. The methods developed for the
30 meter GC column provided separation for most mixtures including many related isomers.
The GC/IR instrument was further put to the test when many synthetic compounds were
regulated by government agencies in 2011/2012. Our research shifted to focus on these newly
This document is a research report submitted to the U.S. Department of Justice. This report has not been published by the Department. Opinions or points of view expressed are those of the author(s)
and do not necessarily reflect the official position or policies of the U.S. Department of Justice.
10
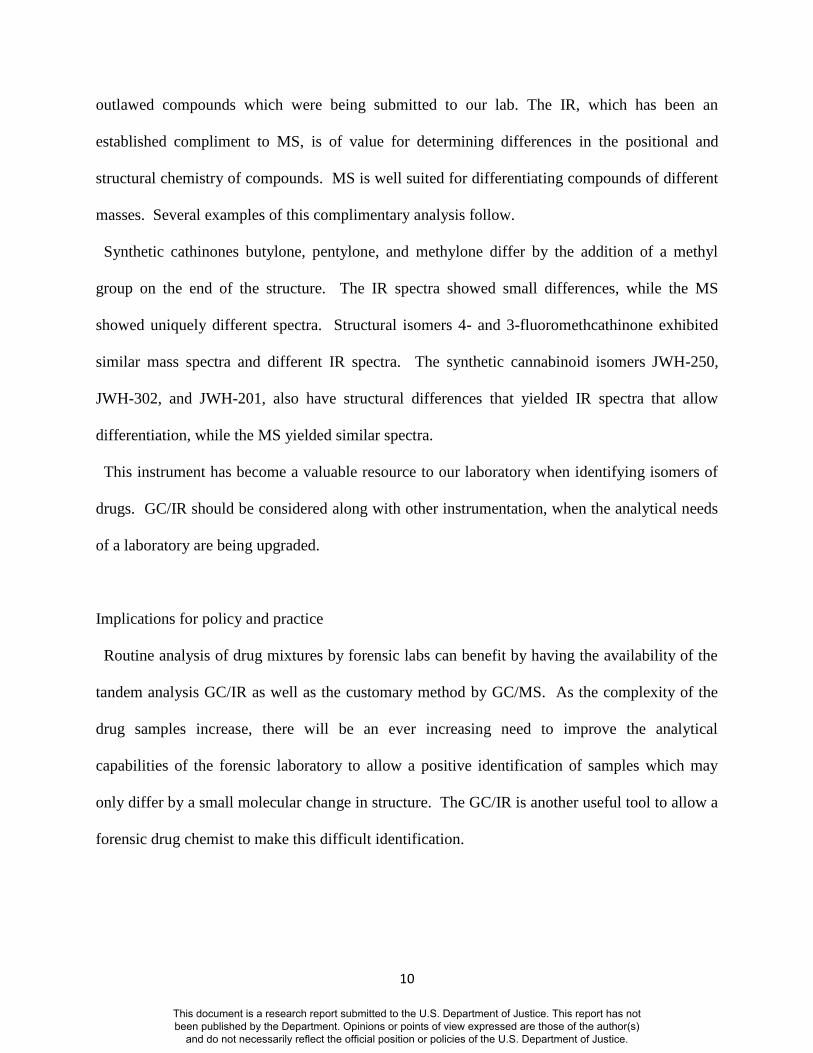
outlawed compounds which were being submitted to our lab. The IR, which has been an
established compliment to MS, is of value for determining differences in the positional and
structural chemistry of compounds. MS is well suited for differentiating compounds of different
masses. Several examples of this complimentary analysis follow.
Synthetic cathinones butylone, pentylone, and methylone differ by the addition of a methyl
group on the end of the structure. The IR spectra showed small differences, while the MS
showed uniquely different spectra. Structural isomers 4- and 3-fluoromethcathinone exhibited
similar mass spectra and different IR spectra. The synthetic cannabinoid isomers JWH-250,
JWH-302, and JWH-201, also have structural differences that yielded IR spectra that allow
differentiation, while the MS yielded similar spectra.
This instrument has become a valuable resource to our laboratory when identifying isomers of
drugs. GC/IR should be considered along with other instrumentation, when the analytical needs
of a laboratory are being upgraded.
Implications for policy and practice
Routine analysis of drug mixtures by forensic labs can benefit by having the availability of the
tandem analysis GC/IR as well as the customary method by GC/MS. As the complexity of the
drug samples increase, there will be an ever increasing need to improve the analytical
capabilities of the forensic laboratory to allow a positive identification of samples which may
only differ by a small molecular change in structure. The GC/IR is another useful tool to allow a
forensic drug chemist to make this difficult identification.
This document is a research report submitted to the U.S. Department of Justice. This report has not been published by the Department. Opinions or points of view expressed are those of the author(s)
and do not necessarily reflect the official position or policies of the U.S. Department of Justice.
11
MAIN BODY
I. Introduction
1. Statement of the Problem
Forensic scientists routinely rely upon GC/MS to differentiate individual compounds from
complex mixtures. However, GC/MS has limitations. Certain drugs yield minimal mass spectral
fragmentation patterns using electron impact MS, while other compounds, such as some
diastereomers and positional isomers, are not readily differentiated by mass spectroscopy. Salt
forms of a compound cannot be determined using the GC technique.
Additional instrumental techniques may be available to forensic analysts. If a sample can be
purified into separate compounds, other techniques such as IR and Nuclear Magnetic Resonance
(NMR) may be available in many forensic labs. Liquid Chromatography with tandem MS
(LC/MS/MS), and Time-of-Flight Mass Spectrometry (TOF-MS) techniques have recently been
introduced into some forensic laboratories which can afford them. A new tool which has been
developed is GC/IR using a cryogenic disk to capture the desublimated gas effluent from the GC.
Infrared spectroscopy provides an alternate technique to mass spectrometry for the
identification of organic compounds, and their salts. Many forensic laboratories have IR analysis
capabilities and analysts are familiar with IR data interpretation. In most labs sample mixtures
may require a bench cleanup or searches through a microscope for individual particle
determination by IR. A separation technique coupled to IR could prove useful for routine
samples incurred by forensic labs. Light-pipe technology has been around for many years and is
This document is a research report submitted to the U.S. Department of Justice. This report has not been published by the Department. Opinions or points of view expressed are those of the author(s)
and do not necessarily reflect the official position or policies of the U.S. Department of Justice.
12
still used today; this technology couples a GC to an IR, which detects compounds by applying IR
to the gas effluent.
Recent improvements in the hyphenated technique, GC/IR, may provide a simple alternative or
supplemental approach to GC/MS for the identification of certain compounds. A newly
introduced instrument collects GC effluent on a liquid nitrogen cooled, IR transparent window
that allows the direct analysis of the deposited solid material. This technique is superior to the IR
light pipe in sensitivity, IR spectral quality, and allows direct comparison of the collected spectra
to existing IR databases (figure 25). The research was designed to develop procedures and
protocols for the analysis of drugs yielding limited MS information via GC/IR and report to the
forensic community the benefits and limitations of this technology. This research focused on the
routine identification of commonly encountered drugs, designer drugs, closely related drug
isomers, as well as the fundamentals of the gas chromatography and infrared systems. Our
laboratory owns a GC/IR instrument, and this research was undertaken to further the work
started by our laboratory to develop this technology into a viable technique for the forensic
community.
2. Literature Citations and Review
A mass spectrum is often unique for a particular compound and has been used extensively by
the forensic community to identify controlled substances. This technique, especially when linked
to a gas chromatograph, has stood the test of time and court challenges. However, there are
various substances which may yield minimal mass spectral fragmentation patterns or patterns too
similar to allow one to distinguish between isomers or similar compounds bearing related
structures.
This document is a research report submitted to the U.S. Department of Justice. This report has not been published by the Department. Opinions or points of view expressed are those of the author(s)
and do not necessarily reflect the official position or policies of the U.S. Department of Justice.
13
Two forensically relevant phenethylamines, amphetamine and methamphetamine, can be
characterized as drugs that yield minimal electron-impact (EI) mass spectral patterns and have
been reviewed by Cody in Handbook of Forensic Drug Analysis (1). Cody describes the EI mass
spectra of amphetamine and methamphetamine as very simple since the spectrum of
amphetamine is “dominated by an ion at m/z 44”, and methamphetamine “characterized by an
ion as m/z 58”(p. 378). Cody describes derivatization procedures which alleviate the dearth of
mass fragments observed with the un-derivatized molecule. Derivatization, as noted by Cody,
will result in a greater molecular mass and “results in fragmentation, yielding several
characteristic ions” (p. 378). As a result, Cody notes, “… the identification is much easier and
more reliable, because the increased mass and number of fragments make the spectra more
unique” (p. 378). In addition to amphetamine, a number of other drugs yield very limited mass
spectral patterns. Amitriptyline and psilocyn are two such drugs, both yield a base peak of 58,
with all other peaks in the spectrum below the 10% relative abundance level (2).
In addition to compounds with limited mass spectral characteristics, some isomers may not lend
themselves to an unequivocal identification with mass spectrometry. Smyrl et al. (3) in their
1992 paper in Applied Spectroscopy, describe a limitation of GC/MS. As noted by the authors,
“One of the most important limitations of GC/MS is in distinguishing between similar (e.g.
positional) isomers.” Lang and Richwine (4) reinforce this thought in discussing that GC/MS has
some limitations in differentiating structural isomers. Kenneth Busch (personal communication
with Eric Buel) also states that EI usually will not differentiate diastereomers. Clark et al. (5)
states “For major drugs of abuse, such as the amphetamines and MDMAs, there are many
positional isomers (regioisomers) in the alkyl side chain or in the aromatic ring substitution
pattern that can yield nearly an identical mass spectrum” (p. 230). Further, Clark et al. (6) have
This document is a research report submitted to the U.S. Department of Justice. This report has not been published by the Department. Opinions or points of view expressed are those of the author(s)
and do not necessarily reflect the official position or policies of the U.S. Department of Justice.
14
synthesized and studied a number of regioisomeric compounds equivalent to 3,4-MDMA
(ecstasy) and state that electron impact mass spectroscopy alone would not yield sufficient data
to differentiate these isomers. (The article does provide additional information to assist in
identification of these isomers using GC separation and derivatization.) These statements should
be reviewed in context and not be taken as blanket statements since some positional isomers, and
occasionally diastereomers, may be identified by their mass spectrum (7). Dr Clark has
continued his research and published numerous articles using GC/IRD (Infrared Detection using
light pipe) along with GC/MS, derivatization and GC column resolution to differentiate many
regioisomeric MDMA and methamphetamine type compounds (13, 14).
When the mass spectrum of a compound is ambiguous, or provides insufficient structural
information to uniquely describe a particular compound, investigators have used other methods
in conjunction with MS to identify the compound. As noted above, derivatization has been
suggested to identify phenethylamines (1). This was shown to be effective by both increasing the
number of fragments in the mass spectrum (useful for compounds with minimal mass spectra),
and providing characteristic mass spectra for some positional isomers (5). However,
derivatization techniques require a time consuming extraction process in combination with the
additional manipulation of the sample with sometimes hazardous reagents.
Linking gas chromatography to mass spectrometry to obtain and compare retention times from
a standard to the unknown has also been used to provide compound identification. Hugel et al.
(7) notes that certain isomers of LSD give essentially the same mass spectra but can be identified
through a comparison of retention times to standards. Clark et al. (6) also describe a combination
of mass spectrometry and gas chromatography to resolve 10 regioisomers of ecstasy. However,
they note that at least one of the regioisomeric equivalents of 3, 4,-MDMA co-eluted, and that
This document is a research report submitted to the U.S. Department of Justice. This report has not been published by the Department. Opinions or points of view expressed are those of the author(s)
and do not necessarily reflect the official position or policies of the U.S. Department of Justice.
15
more polar stationary phases and specific temperature programs were required to resolve the
isomers (8). Another approach to improve upon the original mass spectrum of a compound is to
expand the abundance scale to make a secondary ion full scale while driving the base peak off
scale (7, 9). Hugel et al. (7) note that this approach can be used to identify structural isomers and
is sometimes successful in that regard.
Chemical ionization is another technique used in MS that may give supplementary information
for compound identification. This form of ionization may be either positive or negative, which
yield spectra with a high abundance of molecular ions (10). More expensive MS instruments
provide tandem mass spectrometers (MS/MS) which can yield additional fragments for
identification when “daughter ions” are created from ions produced during the initial
fragmentation. Both of these techniques are useful but not usually applied to routine forensic
casework analysis. Some New England Forensic labs have acquired LC/MS/MS capabilities, to
compliment their GC/MS techniques (personal communication to Robert Shipman with Raj
Rane, Restek, Corp).
Infrared spectroscopy (IR) has long been a powerful tool for the identification of organic
compounds and has been used extensively in the forensic community. IR is useful for the
identification of compounds with similar mass spectra, structurally related compounds, i.e.
positional isomers, and can be used to differentiate diastereomers (i.e.
pseudoephedrine/ephedrine). Skoog and West (11) describe infrared spectroscopy: “With the
exception of optical isomers, no two compounds have identical absorption curves” (p.131).
Hugel et al. (7) notes that small differences in a molecules structure, i.e. isomers, will yield
different IR spectra and the technique can be used to differentiate diastereomers.
This document is a research report submitted to the U.S. Department of Justice. This report has not been published by the Department. Opinions or points of view expressed are those of the author(s)
and do not necessarily reflect the official position or policies of the U.S. Department of Justice.
16
A demonstration of the power of IR is to examine the IR and MS spectra obtained from some
select compounds. Since our research is seeking to verify a supplemental tool to MS, the spectra
detailed here show the power of infrared spectroscopy in comparison to mass spectrometry with
respect to this select group.
Figure 1 shows the close GC elution of two diastereomers. Diastereomers are not mirror
images, but they have the same configuration at at least one asymmetric center and, at the same
time, different configurations at at least one asymmetric center. This creates physically different
molecules that have different physical and chemical properties (12). Figure 2 compares the mass
spectra of diastereomers pseudoephedrine and ephedrine. These compounds yield similar mass
spectra that also have a minimal fragmentation pattern. The IR spectra for these compounds,
shown in figure 3, was generated at the Vermont Forensic Laboratory using the Spectra Analysis
GC/IR instrument. Figure 3 shows the fingerprint range over laid, where differentiation of these
isomers can be made.
Many compounds (including psudoepherine and ephedrine) also yield minimal mass spectral
fragmentation patterns. At VFL, IR spectra of these types of compounds usually show a wealth
of information that allows the examiner to unequivocally identify the substance. Reviewing the
volumes by Mills and Roberson (2) to become aware of further examples such as
dimethyltryptamine, diphenhydramine, phentermine, propoxyphene, or evaluate the work of
Clark (5) concerning the regioisomers of MDMA to notice the number of compounds that fit into
this categorization. Theoretically, IR should be able to identify these compounds as well.
The collection of an infrared spectrum works best if the compound of interest is pure. This is
not the typical case with forensic drug samples. The hyphenated technique, GC/IR, allows for the
collection of IR spectra from discrete compounds within a mixture. This technique may be
This document is a research report submitted to the U.S. Department of Justice. This report has not been published by the Department. Opinions or points of view expressed are those of the author(s)
and do not necessarily reflect the official position or policies of the U.S. Department of Justice.
17
accomplished via different analytical strategies. A traditional approach transfers the GC effluent
to a light pipe containing windows transparent to IR radiation. The IR spectrum can be collected
while the compound is resident in the pipe. This technique allows the collection of an IR
spectrum but it is far less sensitive than GC/MS analysis and the collected spectra are different
than condensed phase IR spectra, which necessitates the use of vapor phase spectral libraries for
appropriate library searches (see figure 25).
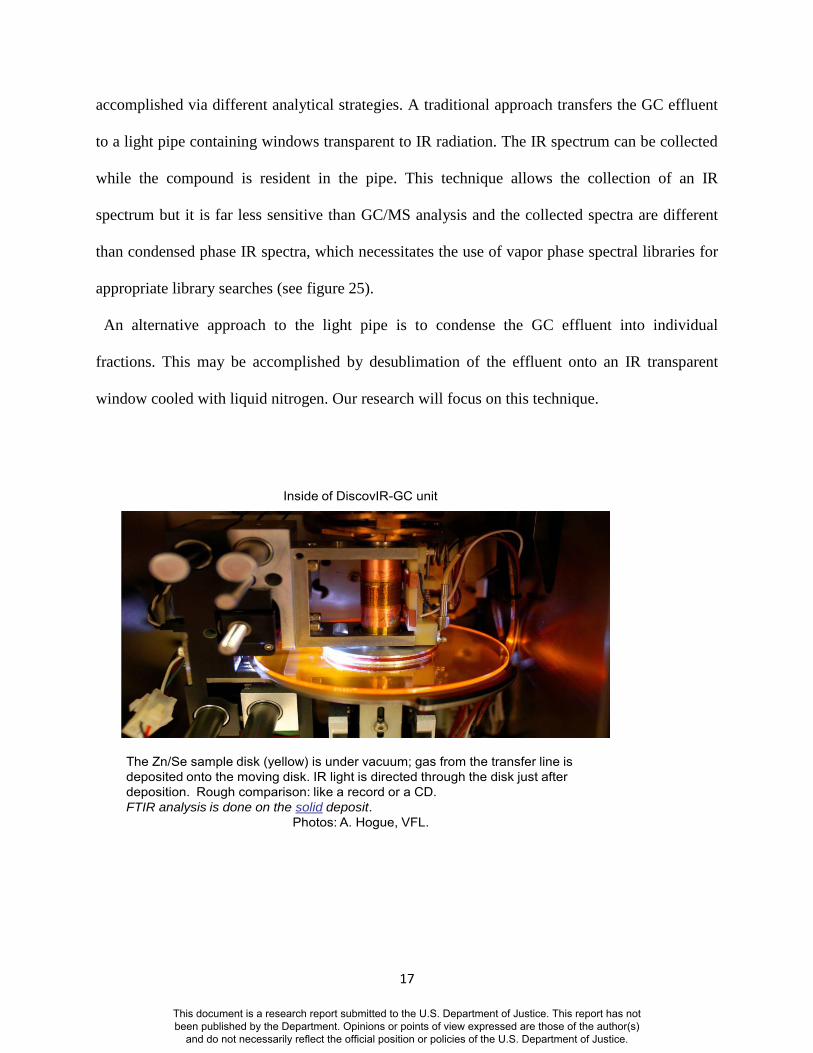
An alternative approach to the light pipe is to condense the GC effluent into individual
fractions. This may be accomplished by desublimation of the effluent onto an IR transparent
window cooled with liquid nitrogen. Our research will focus on this technique.
The Zn/Se sample disk (yellow) is under vacuum; gas from the transfer line is deposited onto the moving disk. IR light is directed through the disk just after deposition. Rough comparison: like a record or a CD.FTIR analysis is done on the solid deposit.
Photos: A. Hogue, VFL.
Inside of DiscovIR-GC unit
This document is a research report submitted to the U.S. Department of Justice. This report has not been published by the Department. Opinions or points of view expressed are those of the author(s)
and do not necessarily reflect the official position or policies of the U.S. Department of Justice.
18
3. Rationale for the Research
The proper identification of drug samples by the forensic drug examiner is of paramount
importance. As drug samples become more complex, and compounds with similar molecular
structures are submitted to the laboratory, it is imperative examiners have access to appropriate
techniques that allow an identification of the sample under examination. New designer drugs,
differing in structure by slight modifications, present new analysis challenges and creative
examination approaches of these substances must be explored.
The research we conducted examines an instrument that takes advantage of the power of IR
coupled to the separation potential of GC. The instrument collects solid phase IR spectra which
yield highly discriminating information, increasing the capability of the laboratory and
expanding the number and types of drugs that can be suitably examined.
Through a proper examination of this GC/IR instrument, we can report on the limitations,
benefits and potentials of this instrument to the forensic community. A tool that can provide
additional useful identification information to the forensic drug examiner would be of
tremendous value in the analysis of complex drug samples.
This document is a research report submitted to the U.S. Department of Justice. This report has not been published by the Department. Opinions or points of view expressed are those of the author(s)
and do not necessarily reflect the official position or policies of the U.S. Department of Justice.
19
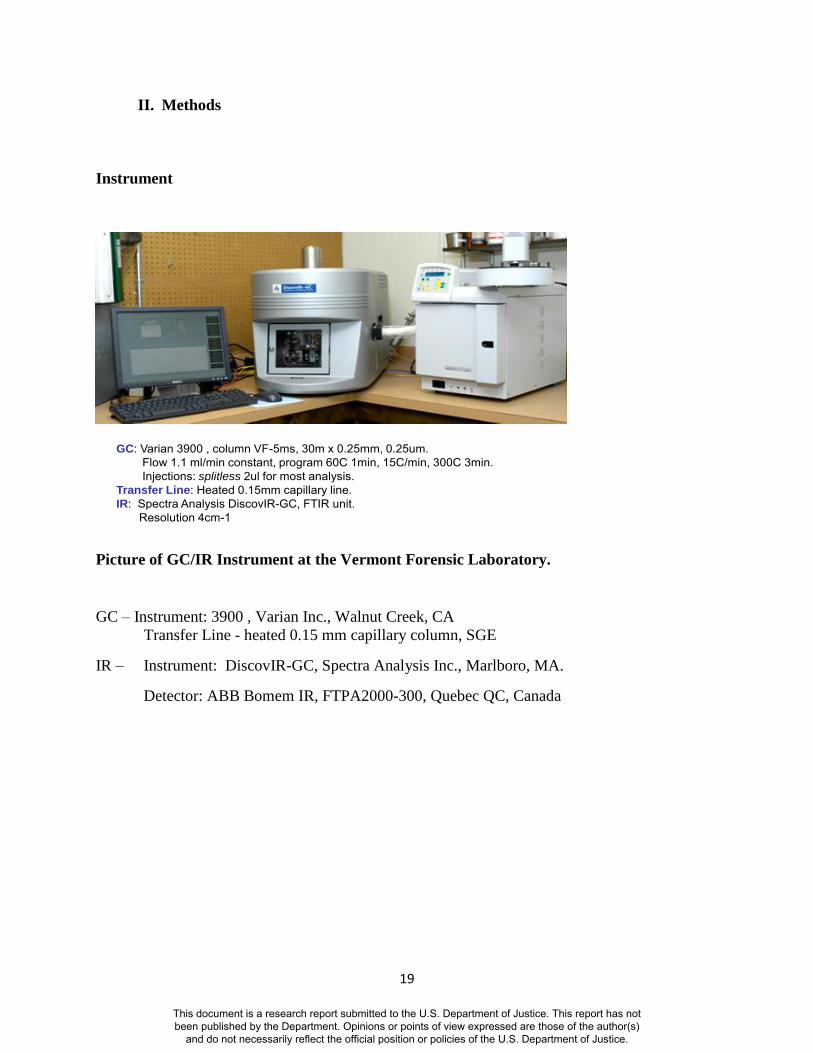
II. Methods
Instrument
GC: Varian 3900 , column VF-5ms, 30m x 0.25mm, 0.25um.Flow 1.1 ml/min constant, program 60C 1min, 15C/min, 300C 3min.Injections: splitless 2ul for most analysis.
Transfer Line: Heated 0.15mm capillary line.IR: Spectra Analysis DiscovIR-GC, FTIR unit.
Resolution 4cm-1
Picture of GC/IR Instrument at the Vermont Forensic Laboratory.
GC – Instrument: 3900 , Varian Inc., Walnut Creek, CA
Transfer Line - heated 0.15 mm capillary column, SGE
IR – Instrument: DiscovIR-GC, Spectra Analysis Inc., Marlboro, MA.
Detector: ABB Bomem IR, FTPA2000-300, Quebec QC, Canada
This document is a research report submitted to the U.S. Department of Justice. This report has not been published by the Department. Opinions or points of view expressed are those of the author(s)
and do not necessarily reflect the official position or policies of the U.S. Department of Justice.
20
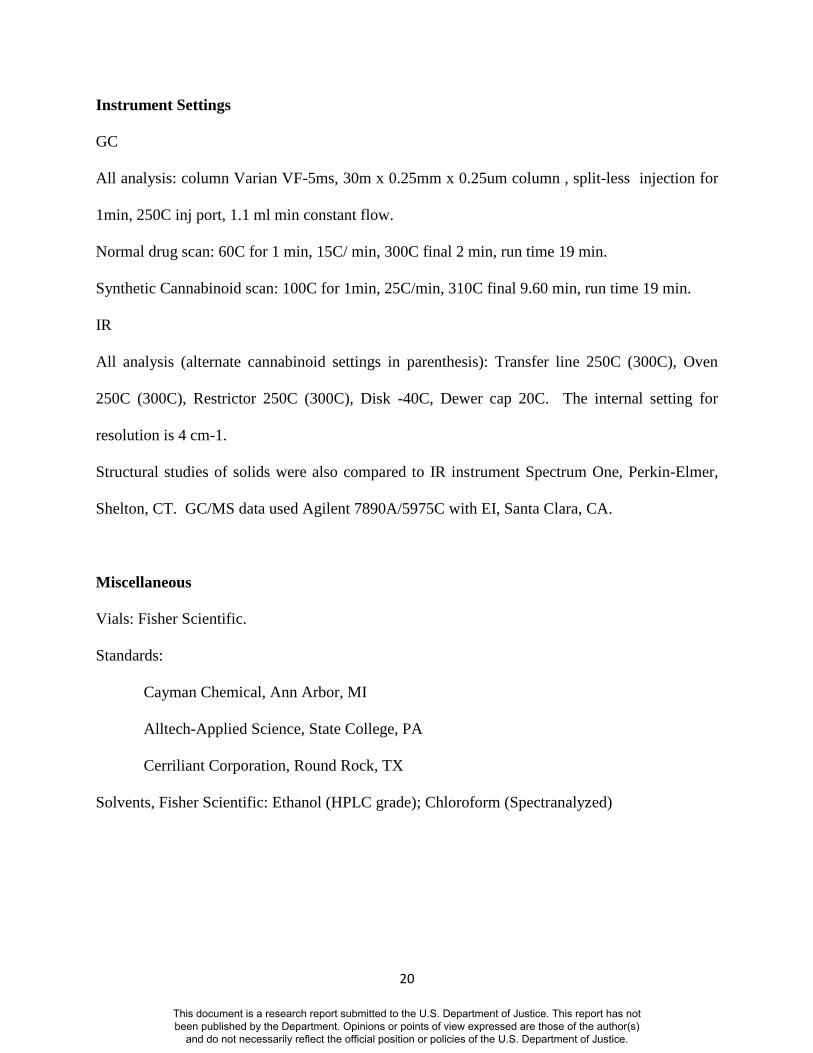
Instrument Settings
GC
All analysis: column Varian VF-5ms, 30m x 0.25mm x 0.25um column , split-less injection for
1min, 250C inj port, 1.1 ml min constant flow.
Normal drug scan: 60C for 1 min, 15C/ min, 300C final 2 min, run time 19 min.
Synthetic Cannabinoid scan: 100C for 1min, 25C/min, 310C final 9.60 min, run time 19 min.
IR
All analysis (alternate cannabinoid settings in parenthesis): Transfer line 250C (300C), Oven
250C (300C), Restrictor 250C (300C), Disk -40C, Dewer cap 20C. The internal setting for
resolution is 4 cm-1.
Structural studies of solids were also compared to IR instrument Spectrum One, Perkin-Elmer,
Shelton, CT. GC/MS data used Agilent 7890A/5975C with EI, Santa Clara, CA.
Miscellaneous
Vials: Fisher Scientific.
Standards:
Cayman Chemical, Ann Arbor, MI
Alltech-Applied Science, State College, PA
Cerriliant Corporation, Round Rock, TX
Solvents, Fisher Scientific: Ethanol (HPLC grade); Chloroform (Spectranalyzed)
This document is a research report submitted to the U.S. Department of Justice. This report has not been published by the Department. Opinions or points of view expressed are those of the author(s)
and do not necessarily reflect the official position or policies of the U.S. Department of Justice.
21
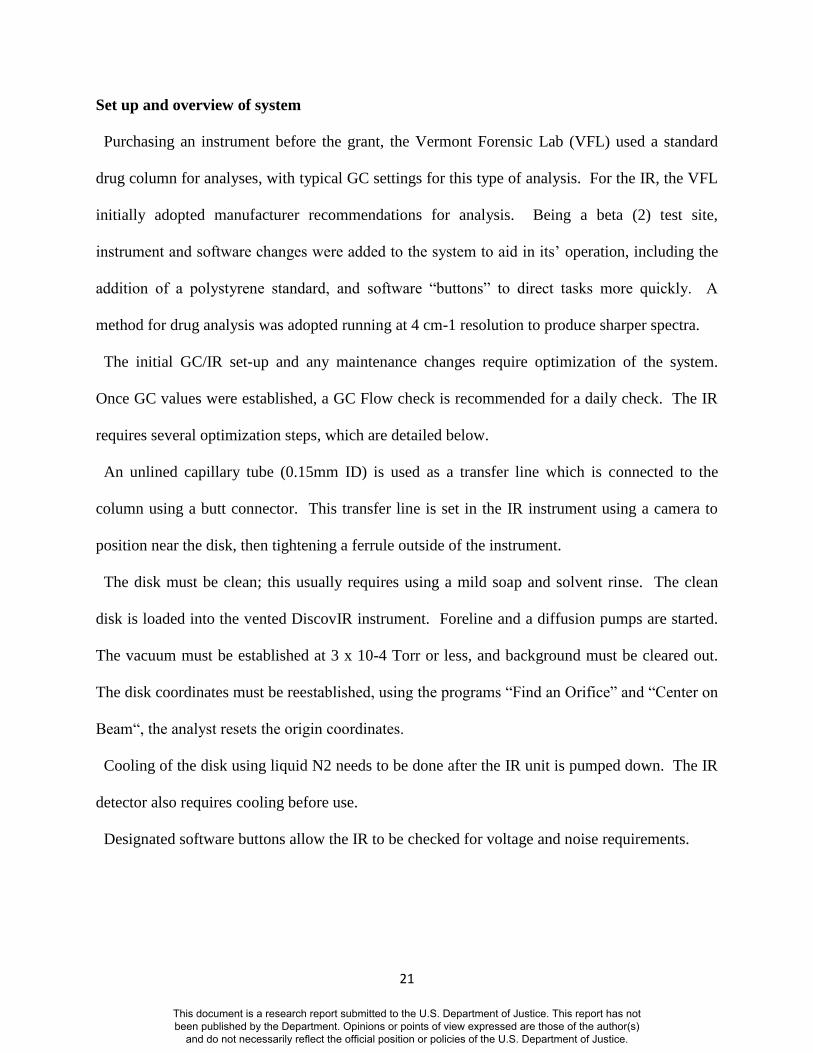
Set up and overview of system
Purchasing an instrument before the grant, the Vermont Forensic Lab (VFL) used a standard
drug column for analyses, with typical GC settings for this type of analysis. For the IR, the VFL
initially adopted manufacturer recommendations for analysis. Being a beta (2) test site,
instrument and software changes were added to the system to aid in its’ operation, including the
addition of a polystyrene standard, and software “buttons” to direct tasks more quickly. A
method for drug analysis was adopted running at 4 cm-1 resolution to produce sharper spectra.
The initial GC/IR set-up and any maintenance changes require optimization of the system.
Once GC values were established, a GC Flow check is recommended for a daily check. The IR
requires several optimization steps, which are detailed below.
An unlined capillary tube (0.15mm ID) is used as a transfer line which is connected to the
column using a butt connector. This transfer line is set in the IR instrument using a camera to
position near the disk, then tightening a ferrule outside of the instrument.
The disk must be clean; this usually requires using a mild soap and solvent rinse. The clean
disk is loaded into the vented DiscovIR instrument. Foreline and a diffusion pumps are started.
The vacuum must be established at 3 x 10⁻⁴ Torr or less, and background must be cleared out.
The disk coordinates must be reestablished, using the programs “Find an Orifice” and “Center on
Beam“, the analyst resets the origin coordinates.
Cooling of the disk using liquid N2 needs to be done after the IR unit is pumped down. The IR
detector also requires cooling before use.
Designated software buttons allow the IR to be checked for voltage and noise requirements.
This document is a research report submitted to the U.S. Department of Justice. This report has not been published by the Department. Opinions or points of view expressed are those of the author(s)
and do not necessarily reflect the official position or policies of the U.S. Department of Justice.
22
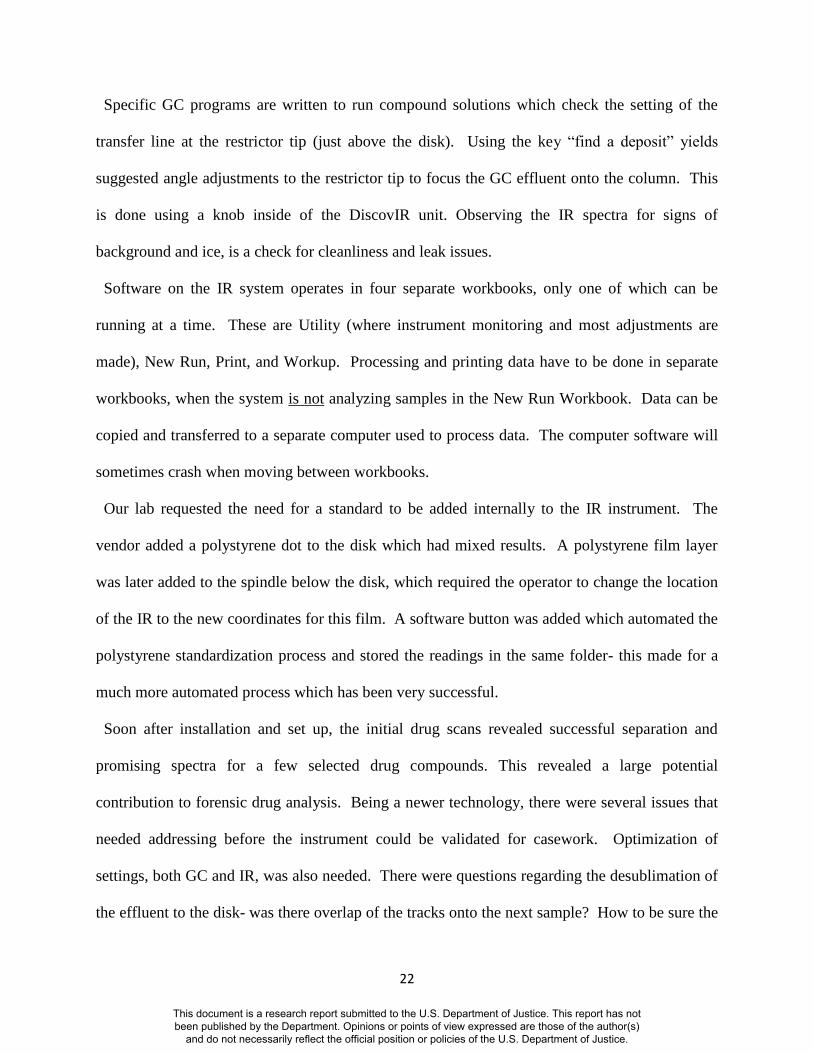
Specific GC programs are written to run compound solutions which check the setting of the
transfer line at the restrictor tip (just above the disk). Using the key “find a deposit” yields
suggested angle adjustments to the restrictor tip to focus the GC effluent onto the column. This
is done using a knob inside of the DiscovIR unit. Observing the IR spectra for signs of
background and ice, is a check for cleanliness and leak issues.
Software on the IR system operates in four separate workbooks, only one of which can be
running at a time. These are Utility (where instrument monitoring and most adjustments are
made), New Run, Print, and Workup. Processing and printing data have to be done in separate
workbooks, when the system is not analyzing samples in the New Run Workbook. Data can be
copied and transferred to a separate computer used to process data. The computer software will
sometimes crash when moving between workbooks.
Our lab requested the need for a standard to be added internally to the IR instrument. The
vendor added a polystyrene dot to the disk which had mixed results. A polystyrene film layer
was later added to the spindle below the disk, which required the operator to change the location
of the IR to the new coordinates for this film. A software button was added which automated the
polystyrene standardization process and stored the readings in the same folder- this made for a
much more automated process which has been very successful.
Soon after installation and set up, the initial drug scans revealed successful separation and
promising spectra for a few selected drug compounds. This revealed a large potential
contribution to forensic drug analysis. Being a newer technology, there were several issues that
needed addressing before the instrument could be validated for casework. Optimization of
settings, both GC and IR, was also needed. There were questions regarding the desublimation of
the effluent to the disk- was there overlap of the tracks onto the next sample? How to be sure the
This document is a research report submitted to the U.S. Department of Justice. This report has not been published by the Department. Opinions or points of view expressed are those of the author(s)
and do not necessarily reflect the official position or policies of the U.S. Department of Justice.
23
disk track was clean prior to analysis? Why are some compounds spectra different from the solid
IR data spectra available on commercial libraries? This research was applied for in order to
address many of these issues and to determine the assets and limitations of this instrument in
forensic drug analysis.
Studies
The VFL performed several studies to address questions /issues with the new instrument. The
GC separation component uses the IR component as a detector. While the studies involved both
components, they are broken down into separate GC and IR sections depending upon the issues
being checked.
GC
The VFL had already established several settings before starting the research. Column flow at
1.1 cm/min was already at the suggested linear flow velocity recommended for helium. Column
temperatures were set for a separation of drug mixtures. Further optimization and checks of the
existing settings were needed on the GC system.
The VFL desired a detection level near that of our GC/MS systems to allow transfer of extracts
and standards between instruments. A 4mm ID injection port liner allowed a larger volume to be
injected. Typical standard concentrations of 25- 250 ppm are used on the GC/MS. Initial set up
by the vendor showed a lack of sensitivity on the GC/IR using a GC split injection and an IR
8cm-1 resolution setting. A 2ul split-less injection yielded the desired sensitivity, which was
dependent upon the layer of solid effluent on the IR disk.
This document is a research report submitted to the U.S. Department of Justice. This report has not been published by the Department. Opinions or points of view expressed are those of the author(s)
and do not necessarily reflect the official position or policies of the U.S. Department of Justice.
24
Several GC studies were devised for this research.
1. A Limit of detection (LOD) study was performed as well as a maximum load study.
2. A split-less vs split inlet study was done for the synthetic cannabinoid JWH-122.
3. Peak symmetry using Peak Gaussian Factor (PGF) calculations was done for a drug
mix, and a synthetic cathinone.
4. PGF and resolution were checked for a synthetic cannabinoid isomer mix.
5. Reproducibility of retention times is addressed in the reproducible spectra section for
the IR studies.
IR
This newer type of GC/IR analyses produces solid spectra, unlike the traditional light-pipe
approach. The deposited solid material can be rescanned at different IR resolutions if desired.
The VFL used a 4cm-1 resolution setting after comparing spectra at the 8cm-1 setting; sharper
and better resolution of minor bands helped to differentiate similar types of compounds.
For this research, IR studies were needed to address questions on reproducibility, track line
stability, disk cleanliness, types of solids formed, and re-depositing of material.
Several IR studies were devised for this research.
1. A study of the solid spectra deposited on the disk was undertaken.
2. A reproducibility study looked at the spectra of compounds after repeated injections of the
same solution.
3. The effect of concentration (thereby the thickness of the deposited layer) of a compound on
the spectra was studied.
4. Temperature effects of the solid formation on the disk were studied.
This document is a research report submitted to the U.S. Department of Justice. This report has not been published by the Department. Opinions or points of view expressed are those of the author(s)
and do not necessarily reflect the official position or policies of the U.S. Department of Justice.
25
5. A track layer overlap study was done to determine if unique solid tracks for each analysis
were formed.
6. The sensitivity study was part of the Limit of Detection (LOD) study in Table 1.
7. Collection disk speed study to determine the optimal disk speed setting for depositing the
solid spectra was done.
8. To speed up the check of the cleanliness of the disk, a blank scan study was done using a
faster disk speed of 12 mm/minute.
9. A redeposit study examined the capability of the instrument to overlay a sample on top of an
existing one.
This document is a research report submitted to the U.S. Department of Justice. This report has not been published by the Department. Opinions or points of view expressed are those of the author(s)
and do not necessarily reflect the official position or policies of the U.S. Department of Justice.
26
III. Results
1. Statement of Results
Aim #1: Optimize GC conditions to test a wide range of drugs in standards and actual casework.
GC study #1
The instrument was equipped with a 4mm ID injection port liner. This liner allowed a wide
volume range to be injected, with a maximum of 1-2 ul. The 0.25 mm ID column allows an
approximate sample capacity of 50- 100 ng (Restek.com, typical column characteristics and
back-flash calculator). Study # 1 was designed to check the actual detection and capacity levels
for drug compounds. An injection amount of 2 ul was used to maximize sensitivity.
A practical limit of detection (PLOD) study and overload study was conducted to determine the
limits of the GC (and IR) system. Eight standard concentrations for Cocaine were analyzed, and
summarized in table 2. The practical limit of detection was 25 ppm with a peak at 9X baseline
level, and an IR hit quality < 0.1. Over 1000 ppm, the GC peaks start to split and integrate more
than once, and some IR bands start exhibiting saturation. Vicki Reed (15) defines sensitivity as
comparing peak height to the baseline noise. A ratio of 3:1 indicates adequate sensitivity. The
VFL uses a higher peak to noise level for the PLOD, to get adequate spectral bands to make an
IR determination of a compound.
A linearity check of this data is presented in figure #4. The instrument was linear for 10 to 100
ppm of cocaine (20-200 ng using a 2 ul injection). At 250 ppm, the column capacity appears to
This document is a research report submitted to the U.S. Department of Justice. This report has not been published by the Department. Opinions or points of view expressed are those of the author(s)
and do not necessarily reflect the official position or policies of the U.S. Department of Justice.
27
have been exceeded since the linearity for cocaine starts to drop. At 1000 ppm and above, the
column and detector are becoming saturated (see figure #5).
Four concentrations of pseudoephedrine were analyzed (see Table 1). A practical limit of
detection was 50 ppm, and GC carryover may occur near 1000 ppm.
In summary, the practical limit of detection for two drugs was 25- 50 ppm. Using a 2 ul
injection, this would load 50-100 ng into the injection port, and using a split-less injection,
theoretically the same amount will deposit onto the disk. The detection level for these
compounds is higher than that for compounds on our GC/MS system at our laboratory, but
within allowable levels for dilute and shoot type and extraction type analysis. For normal
casework sample analysis using dilute and shoot of extracts, the concentration of compounds is
not usually known. Instrument overload should be suspect if chromatography and spectra start to
get compromised, and carry over appears in next run. Samples exhibiting this need to be rerun at
a diluted level.
GC study #2
The injection port split vs split-less mode study was done using injections of the synthetic
cannabinoid JWH-122. Table 3 lists the results of this study. The first line (also sample run #4)
uses the Statement of Operating Procedures (SOP) normal conditions for the synthetic
cannabinoid method, including a split-less injection for 1 minute. The remaining sample runs
use a higher concentration of 1000 ppm, since split analysis will decrease the amount of detected
compound. Parameter changes from the SOP method are listed in the second column. The final
two runs (#10 and 11) were IR disk temperature variances of the method, to see if it affected
peak resolution.
This document is a research report submitted to the U.S. Department of Justice. This report has not been published by the Department. Opinions or points of view expressed are those of the author(s)
and do not necessarily reflect the official position or policies of the U.S. Department of Justice.
28
The Peak Gaussian Factor (PGF) is a good measure of peak symmetry using the equation 1.83 x
peak height at 0.5 height/ peak at 0.1 height (reference 15). A PGF range of 0.8 to 1.2 is
acceptable. The SOP method has an acceptable PGF of 1.108 units (table 3, run #4). Changing
to a split injection also showed acceptable PGF values, but instrument sensitivity decreased.
Increasing the disk temperature to -25C produced a PGF slightly exceeding the acceptable range;
it is unsure if this was an anomaly. In run #11 a slightly raised disk temperature (actual was -
32C) produced a high (but acceptable) PGF of 1.173 units.
Changes to the SOP method did not improve chromatography. Split injection lowered the
detection levels, but did not improve peak symmetry. Changes to disk temperature did not
improve peak symmetry.
GC study #3
PGF calculations were also done for typical drug compounds and a synthetic cathinone. This
study was done at the normal drug scan conditions, including split-less injection. The PGF
values were acceptable for all compounds including heroin, cocaine, ethcathinone, and the
octadecane internal standard (ISTD) peaks, as seen in table 4.
GC Study #4
An isomer mix of synthetic cannabinoids was injected using the synthetic cannabinoid test
method conditions. Table 5 summarizes the results of this study, and figure 22 shows the
chromatogram. PGF, resolution, and linear velocity were calculated (ref 15). The PGF formula
is listed in study #2 above. Resolution is calculated as retention time (RT) difference / average
peak width (pw). Normally good resolution is 0.5 – 1.0, with peak B/C resolution slightly higher
at 1.05. The linear flow velocity was calculated by the instrument at 24.4 cm/sec, which is
This document is a research report submitted to the U.S. Department of Justice. This report has not been published by the Department. Opinions or points of view expressed are those of the author(s)
and do not necessarily reflect the official position or policies of the U.S. Department of Justice.
29
within the optimized range for helium (21-40 cm/sec). All values were found to be acceptable
for these similar isomer structures.
GC Study # 5
Ten Replicate injections of cocaine and pseudoephedrine were done on the instrument. The
retention times (RT) are shown in Table 6, with standard deviation (SD) calculated for both.
Low % RSD values were the result of highly reproducible RTs. The spectra for this study was
also used in IR study #2.
Aim #2: Optimize IR conditions to test a wide range of drugs in standards and actual casework.
IR Study #1
Some initial spectra of compounds showed spectra differing from standard commercial
libraries. There were questions regarding the form of the solid on the disk, knowing that
attenuated total reflectance (ATR) and microscope analysis on another IR instrument had seen
crystal and amorphous type solids of the same compound. The VFL did a study of six drug
compounds to determine the solid form that was being deposited on the disk. Drug solutions
were made and injected on the GC/IR system. The same solutions were evaporated to solid and
run by a Perkin Elmer microscope instrument.
Spectral differences of the same compound would be indicative of different solid forms.
Typical forms of solids can include crystalline, amorphous, and possible mixtures of these.
Figure 6 displays the spectra of base pseudoephedrine in the fingerprint range. The ATR and
diamond scope (microscope) spectra from our Perkin-Elmer Spectrum One instrument are
believed to be that of crystalline solids. The GC/IR spectra differs slightly from the Perkin –
This document is a research report submitted to the U.S. Department of Justice. This report has not been published by the Department. Opinions or points of view expressed are those of the author(s)
and do not necessarily reflect the official position or policies of the U.S. Department of Justice.
30
Elmer spectra. Our conclusion is that pseudoephedrine appeared to be amorphous in its’ solid
form on the disk when compared to crystalline structures on other IR instruments at the VFL.
Other compounds appeared to be crystalline in nature. Comparing amorphous and crystalline
spectral differences in compounds, there may only be a slight shift in some bands in the spectra,
for other compounds widened (less sharp) bands can occur. Studies show what we categorize as
apparent crystalline or amorphous solids when GC/IR analysis is done:
Amorphous: cocaine base, pseudoephedrine.
Crystalline: amitriptyline, diphenhydramine, ephedrine.
Inconclusive: 3,4-MDMA.
The salt form of the injected compound appeared to have no effect upon the structure of the
solids on the disk. Cocaine base and cocaine-HCl standards were used in the studies and the IR
spectra did not appear different (both appeared as the amorphous base form). The salt form did
affect the GC resolution of some compounds. Base extraction of some compounds improved GC
resolution, peak shape, and relative retention time matches with standard libraries.
More studies were designed to determine if the GC/IR solid forms were replicable, and if there
were conditions that affected the type of solid formed.
IR Study #2
Did the GC/IR unit yield similar spectra (reproducible) indicating that the deposited solid form
was consistent? Solutions of two compounds, pseudoephedrine and cocaine were analyzed ten
times and their spectra overlaid.
Figure 7 shows an overlay of the full IR spectra for pseudoephedrine. The spectra appear the
same and are quite reproducible. The same spectral result was found for cocaine. Therefore,
This document is a research report submitted to the U.S. Department of Justice. This report has not been published by the Department. Opinions or points of view expressed are those of the author(s)
and do not necessarily reflect the official position or policies of the U.S. Department of Justice.
31
solid formation appears to be consistent since cocaine and pseudoephedrine IR spectra were
found to be reproducible.
The manufacturer also did a replication study and determined that most compounds (4 out of
the 5 tested) were consistent at forming the same type of solid on the disk. Spectra Analysis
found one compound, linoleic acid methyl ester, appeared to form three different types of solids;
crystalline, amorphous, or an intermediate formation, when fifteen injections were done. It was
theorized that the instability of the methyl ester was likely the cause for this. The other four
compounds that they tested formed replicable solids. Only one compound could be considered a
drug, and that was caffeine.
IR study #3
A concentration study was done to see if any effect on the solid spectra could be produced.
Concentration of the compound in the injected standard should be proportional to the thickness
of the layer deposited on the disk. Did this thickness have any effect on the solid being
deposited? Various levels of pseudoephedrine (figure 8) and cocaine (as shown in the sensitivity
study in figure 9) were analyzed. Pseudoephedrine concentrations appear to show no differences
in the IR spectra as shown in the fingerprint range. Various levels of cocaine also appear quite
similar. Concentration appears to have minimal if any effect upon the solid being deposited, for
these two compounds.
IR Study #4
The effects of disk temperature upon the solid deposition structure were attempted. The VFL
study proved difficult to conduct, since getting lower disk temps (-60C) and maintaining them
was difficult in a same day study. VFL had extensive discussions with the manufacturer on this
subject.
This document is a research report submitted to the U.S. Department of Justice. This report has not been published by the Department. Opinions or points of view expressed are those of the author(s)
and do not necessarily reflect the official position or policies of the U.S. Department of Justice.
32
A temperature disk study by Spectra Analysis was done on the only compound which produced
the three mixed types of solids, linoleic acid methyl ester. This compound produced three
different solids at their normal disk temperature setting of -50C. Changing the disk temperature
to -30C did not appear to change the number of solids types being formed. There seemed to be
more pronounced differences in the solids (with slightly more shift in selected IR bands), but the
number of solid structure types remained about the same for this unstable molecule.
Bill Carson the chief technical officer at Spectra Analysis elaborated on this issue. He stated
that the thermocouple for sensing temperature is on the spindle which is above the disk. This
thermocouple reading may actually be higher than the actual disk temperature, so accurate disk
readings are not possible. His company has run instruments with extremely low settings, where
the thermocouple reads -80C, and the disk is closer to the temperature of liquid nitrogen. At this
point, the heat applied from the spindle (to keep the thermocouple at settings above -60C) does
not come on.
The manufacturer preference of a -40C setting, was recommended by Spectra Analysis scientist
Sid Bourne. At -40C, water ice will sublime off after deposition. Trace levels of water can enter
the system with minor leaks. Water if present, can be detected in the IR as background, and can
interfere with sample spectra. Also at -40C, some liquid Nitrogen will boil and create the gas
needed to purge the IR optical path and the spectrometer.
A true temp disk study would be difficult to conduct because of disk variance during analysis,
and the sensors on the spindle are only indicative of disk temperature. For our research at the
VFL, drug compounds appeared to be consistent in their formation on the disk during our
research project.
This document is a research report submitted to the U.S. Department of Justice. This report has not been published by the Department. Opinions or points of view expressed are those of the author(s)
and do not necessarily reflect the official position or policies of the U.S. Department of Justice.
33
IR Study #5
A study was designed to determine if the tracks of solids on the disk were unique for each
sample. Could overflow of a high concentration sample spill onto the adjacent track? A high
level cocaine standard at 2000 ppm was analyzed. The track pointer coordinates are listed on the
instrument reports, and in the deposited sample log. Using the track pointer start and stop points,
average tracks per minute could be calculated, and accurate determination for the coordinates of
where cocaine was deposited. Adding 72,000 tracks (one revolution of the disk) to the cocaine
coordinates gives a location on the disk where overlap is most likely to occur.
Figure 12 is the GC chromatogram for the 2000 ppm solution. The track coordinate location
for cocaine was calculated to be 508,177. Adding a full rotation of the disk (72,000 tracks) to
508, 177 = 580,177 as the spot to search for any cocaine overflow. The 580,177 track location
was the sixth run after the standard run, at11.77 minutes, where there was no visible peak (see
figure 13).
In summary, a high level standard produced no overlap into the adjacent track. Instrument
restrictions and settings contribute to the track focusing. The narrow 0.15mm ID transfer line
focuses the gas onto the disk after alignment has been done, and its’ small diameter restricts the
amount which can be deposited. Column load would also restrict the loading of a compound
(column capacity approximated at 500- 1000ng for a 0.25mm ID capillary column, from the GC
studies in this research).
This document is a research report submitted to the U.S. Department of Justice. This report has not been published by the Department. Opinions or points of view expressed are those of the author(s)
and do not necessarily reflect the official position or policies of the U.S. Department of Justice.
34
IR study #6
The IR sensitivity study was part of the GC Limit of Detection Study #1. Several
concentrations of cocaine and pseudoephedrine were analyzed. Good spectral quality match
with a standard library match on the instrument aided in setting the practical limit of detection
(PLOD).
Table 1 shows the PLOD for cocaine at 25 ppm and for pseudoephedrine at 50 ppm. Good
spectral matches at these levels provided confirmation of the compound with standards that were
run on the instrument. Figure 9 displays the spectra for a working range for qualitative
determination for cocaine from 25 – 500 ppm.
IR study #7
To determine the optimal setting of the disk speed for depositing the solid spectra, a study using
cocaine at the PLOD of 25 ppm was done. Four analyses at 1 to 4 mm/min of track speed were
performed.
The speed of the rotating disk affects the thickness of the layer of solid that is deposited on the
disk. The manufacturer recommended speed of 3 mm/min was used as a starting point for
analyses since good spectral resolution occurred. At 3 mm/min, sensitivity and spectral quality
were both good, but what spectral differences occur at different speeds?
Figure 10 displays the fingerprint range spectra for four disk speeds. At 4 mm/min, the
sensitivity dropped, likely the result of a thinner layer for the 25 ppm standard. Spectral quality
seemed to suffer at slower disk speeds. The disk speed also needs to be adequate to provide peak
separation for compounds eluting off the column. A disk speed of 3 mm/min was determined to
be optimal for the instrument. At this speed a layer of cocaine at the practical limit of detection
was detected. Good spectral quality was seen, and at this speed adequate separation between
This document is a research report submitted to the U.S. Department of Justice. This report has not been published by the Department. Opinions or points of view expressed are those of the author(s)
and do not necessarily reflect the official position or policies of the U.S. Department of Justice.
35
eluting compounds was exhibited (figure 22, synthetic cannabinoid isomers). Figure 11 also
shows the successful resolution and separation for an amphetamine mix using the 3 mm/min
speed.
IR study #8
A way was needed to check the cleanliness of the disk, since each track was placed on different
parts of the disk. There are two ways to do this, as explained in the Executive Summary. For
this study, we are trying to speed up the second blank check method which scans multiple tracks
at the same time. To speed up this process, a blank scan was done using a faster disk speed of 12
mm/minute. Low levels of cocaine were analyzed to check if they would be detected at this
faster scan rate.
For drug analysis runs by GC/MS, a cleanliness check usually consists of running a blank
before each sample run; the MS is assumed uncontaminated for the next sample run. For the
GC/IR system, a blank run prior to any samples checks the entire system for contamination, but
not the next track section on the disk. The disk should be checked, since each sample is
deposited on a unique space on the disk (except when re-depositing over a previous blank
sample). This re-depositing over a previous blank (method 1explained in the executive
summary) requires the redeposit check box to be activated in the sample injection log for every
sample (then turned off for each blank). This is a lot of manual manipulation and the potential
for missing a check exists.
The VFL devised a fast blank disk check to simplify the disk blank analysis. At 12 mm/min,
four times the normal disk speed, an experiment was performed to check the sensitivity of the
instrument. Table 7 summarizes the results for cocaine at 10 - 50 ppm using 3 and 12 mm/min
disk speeds. The practical limit of detection (PLOD) for cocaine was established at 25 ppm.
This document is a research report submitted to the U.S. Department of Justice. This report has not been published by the Department. Opinions or points of view expressed are those of the author(s)
and do not necessarily reflect the official position or policies of the U.S. Department of Justice.
36
Running the track speed at 12 mm/min still detected cocaine at the 25 ppm level. If cocaine was
present on the disk as a contaminant at the set PLOD, the instrument would detect it.
A disk speed of 12 mm/min can detect compounds at their established PLODs. This rate allows
for a quick scan for the cleanliness of sections of the disk that are going to be used for the day.
The disk space required for all analysis on a given day, can be calculated using the scan rate, the
number of samples to be run, and knowing delay and positioning times between samples.
IR study #9
Was the unit capable of overlaying a sample on top of an existing one? A redeposit study was
performed to check the reproducibility of the system. A drug mixture containing six compounds
was used. This would effectively check the injection, GC separation, and the disk coordinates
settings after the redeposit box was checked at the time of setting up the sample.
Part of the claim of the manufacturer is that this re-deposit can be done to increase sensitivity of
a compound in a sample. Re-depositing is ideal when there is a limited amount of starting
material, a solution is too dilute, and/or if an extensive extraction is required to get more of the
sample ready for GC analysis. Of particular interest, is the accuracy of the disk coordinates,
which require linear and lateral movements that have to be documented.
Figure 14 documents the result of a redeposit study. Six compounds in a solution mix at
concentrations ranging from 30-75 ppm were re-deposited twice over an initial deposit. The
bottom chromatogram in figure 14 shows the successful re-depositing with six peaks.
This document is a research report submitted to the U.S. Department of Justice. This report has not been published by the Department. Opinions or points of view expressed are those of the author(s)
and do not necessarily reflect the official position or policies of the U.S. Department of Justice.

37
2. Tables (see Appendix 1)
3. Figures (see Appendix 2)
This document is a research report submitted to the U.S. Department of Justice. This report has not been published by the Department. Opinions or points of view expressed are those of the author(s)
and do not necessarily reflect the official position or policies of the U.S. Department of Justice.
38
IV. Conclusions
1. Discussion of Findings
Working with the vendor, hardware and software updates were made to ease the use of this
instrument. Hardware issues included leak sealing, and replacing the restrictor oven twice after
runaway temperatures occurred. The IR unit was returned to Spectra Analysis for several
months for a few upgrades and a nitrogen leak in the detector. An “O” ring in the bottom of the
instrument was found to be faulty and was replaced.
Most of the trouble shooting for the instrument was due to software and/or communication
errors. Software updates were downloaded to address specific issues and shorten tasks. A
summary of our maintenance issues was sent to Spectra Analysis in June 2012 to aid in their next
software revision. Some software limitations are being addressed in this new upgrade. However,
use of the instrument is still slowed by the software segregation of tasks into “workbooks”,
which requires extra time on the part of the analyst.
The Spectra Analysis DiscovIR-GC instrument produced reliable spectra and data for drug
analysis. This technique has tremendous potential for determining closely related isomer
structures. In conjunction with GC/MS, GC/IR provides a complimentary set of analysis, since
IR is of value for determining differences in positional and structural chemistry of compounds,
while MS is well suited for differentiating compounds of different masses.
The instrument was particularly valuable when many synthetic compounds were quickly
regulated by government agencies in 2011/2012. Our research began to focus on these newly
outlawed compounds which were coming into the lab in casework samples.
This document is a research report submitted to the U.S. Department of Justice. This report has not been published by the Department. Opinions or points of view expressed are those of the author(s)
and do not necessarily reflect the official position or policies of the U.S. Department of Justice.
39
Three data sets of similar type compounds help to summarize our work with synthetic
compounds. All compounds separated on the 30 meter column.
1. Synthetic cathinones butylone, pentylone, and methylone differ by a methyl group on
the end of the structure (fig. 18 structures). The IR spectra showed small differences
(fig 17) while the MS showed uniquely different spectra (figs. 19-21).
2. Structural isomers 4- and 3-fluoromethcathinone have similar mass spectra (fig 23)
and different IR spectra (fig 24).
3. For synthetic cannabinoid isomers JWH-250, JWH-302, and JWH-201, (fig 16
structures) successful GC separation was also achieved (fig 22). Structural differences
yield IR spectra that allow differentiation (fig 15), while the MS yielded similar
spectra because of the same mass weights.
Using more than one analysis technique aids in the differentiation of these similar compounds.
Note: when a mixture of these three compounds (and others) occurs in a sample, GC or another
separation technique is required for both the MS and the IR.
This instrument has become a valuable resource to our laboratory when identifying isomers of
drugs. GC/IR should be considered along with other instrumentation, when the analytical needs
of a laboratory are being upgraded.
2. Implications for Policy and Practice
The proper identification of synthetic drugs has become a problem in the United States and the
GC/IR provides an additional tool for the identification of these compounds. The forensic
community will need a wide variety of tools to combat this and other drug related problems in
the future. As the criminal justice community seeks to implement the report by the National
This document is a research report submitted to the U.S. Department of Justice. This report has not been published by the Department. Opinions or points of view expressed are those of the author(s)
and do not necessarily reflect the official position or policies of the U.S. Department of Justice.

40
Academy of Sciences: “Strengthening Forensic Science in the United States: a Path Forward”
(16), it may be appropriate to review current policy and practice and implement new
technologies to increase the analytical capabilities of the drug laboratory.
3. Implications for Further Research
More analytical work on the new synthetic compounds that are being developed would further
the research done here. At VFL we have just touched upon this subject matter.
The anticipated software upgrade by the vendor needs to be run on the instrument and
evaluated.
A study of the feasibility and potential benefits of combining this instrument with a MS to
provide single injection analysis as a GC/IR/MS.
This document is a research report submitted to the U.S. Department of Justice. This report has not been published by the Department. Opinions or points of view expressed are those of the author(s)
and do not necessarily reflect the official position or policies of the U.S. Department of Justice.
41
V. References
1. Cody, J. T., Amphetamines: Methods of Forensic Analysis. In F. P. Smith (Ed.)
Handbook of Forensic Drug Analysis (Elsevier Academic Press, Boston, 2005) pp. 357-
451.
2. Mills, T., Robertson, S.C., Instrumental Data for Drug Analysis (Elsevier Science
Publishing Co., New York, 1987).
3. Smyrl, N. R., Hembree, Jr. D. M., Davis, W. E., Williams, D. M., & Vance, J. C. (1992).
Simultaneous GC-FT-IR/GC/MS analysis for isomer-specific identification and
quantitation of complex mixture components Applied Spectroscopy 46(2) 277-282.
4. Lang, P. L., & Richwine, L. J., The Versatile Sampling Methods of Infrared
Microspectroscopy. In P. B. Coleman (Ed.) Practical sampling techniques for Infrared
Analysis (CRC Press, Ann Arbor, 1993) pp. 145-215.
5. Thigpen, A. L., DeRuiter, J., & Clark, C. R. (2007) GC/MS Studies on the regioisomeric
2,3- and 3,4-methylenedioxyphenethylamines related to MDEA, MDMMA, and MBDB
Journal of Chromatographic Sc 45(May/June) 229-235.
6. Awad, T., Clark, C. R., & DeRuiter, J. (2007) GC/MS Analysis of acylated derivatives of
the side-chain regioisomers of 4-methoxy-3-methyl-phenethylamines related to
methylenedioxymethamphetamine Journal of Chromatographic Sc 45(September) 477-
485.
7. Hugel, J., Meyers, J. A., & Lankin, D. C., Analysis of Hallucinogens. In F. P. Smith
(Ed.) Handbook of Forensic Drug Analysis (Elsevier Academic Press, Boston, 2005) pp.
154-234.
8. Awad, T., DeRuiter, J., & Clark, C. R. (2007) Chromatographic and Mass Spectral
Studies on Methoxy Methyl Methamphetamines related to 3,4-
Methylenedioxymethamphetamine Journal of Chromatographic Sc 45(September) 466-
477.
9. Steeves, J., Gagne, H., and Buel, E. (2000) Normalization of Residual Ions after Removal
of the Base Peak in Electron Impact Mass Spectrometry. Journal of Forensic Sc 45(4),
882-885.
10. Moffat, A. C., Osselton, M. D., & Widdop, B., Eds Clarke’s Analysis of Drugs and
Poisons, (Pharmaceutical Press, Chicago, ed.3, 2004).
This document is a research report submitted to the U.S. Department of Justice. This report has not been published by the Department. Opinions or points of view expressed are those of the author(s)
and do not necessarily reflect the official position or policies of the U.S. Department of Justice.
42
11. Skoog, D. A., West, D. M., Principles of Instrumental Analysis (Holt, Rinehart and
Winston, Philadelphia, 1980).
12. Hendrickson, J., Cram, D., Hammond, G Organic Chemistry (McGraw-Hill, New York,
ed. 3, 1970), p. 208.
13. Awad,T., Belal, T., DeRuiter, J., Kramer, K., & Clark, C. R. (2009) Comparison of GC-
MS and GC-IR methods for the differentiationof methamphetamine and regioisomeric
substances. Forensic Sc Int 185: 67-77.
14. Abdullah, M. Al-Hossaini, Awad,T., DeRuiter, J., & Clark, C. R. (2010) GC-MS and
GC-IR analysis of ring and side chain regioisomers of ethoxyphenethylamines related to
the controlled substances MDEA, MDMMA, and MBDB. Forensic Sc Int 200: 73-86.
15. Reedy, V., Optimizing split/split-less flows in capillary GC, 2012, State Hygienic
Laboratory at the Univ of Iowa (web site) V36, No. 1, pp1-6.
16. National Academy of Sciences, Strengthening Forensic Science in the United States: a
Path Forward, The National Academies Press, Washington D.C. (2009).
17. Dept. of Justice, Drug Enforcement Administration, Establishment of Drug Codes for 26
Substances, Federal Register V78, No 3, Jan 4, 2013/Rules and Regulations.
18. Vermont Dept. of Health, Regulated Drugs Rule, Vermont Health Regulations, 18 VSA
4201-4202 as amended for Chapter 84, Title 18.
This document is a research report submitted to the U.S. Department of Justice. This report has not been published by the Department. Opinions or points of view expressed are those of the author(s)
and do not necessarily reflect the official position or policies of the U.S. Department of Justice.
43
VI. Dissemination of Research Findings
Presentations at Scientific Conferences:
The Northeast Association of Forensic Scientists (NEAFS) Annual Meeting, Drug Session, Rye
Brook, NY, November 2006; “The Application of GC/FTIR to Forensic Drug Analyses”, Oral
Presentation
The Northeast Association of Forensic Scientists (NEAFS) Annual Meeting, Drug Session,
Manchester, VT, November 2010; “Forensic Drug Identification by Gas Chromatography-
Infrared Spectroscopy”, Oral Presentation
The National Institute of Justice Grantees’ Meeting, Arlington, VA, February 2011; “”The
Weapon”: Forensic Drug Identification by Gas Chromatography-Infrared Spectroscopy”, Oral
Presentation
The Northeast Association of Forensic Scientists (NEAFS) Annual Meeting, Poster Session,
Saratoga Springs, NY, November 2012; “Optimization and Validation of GC-IR for Forensic
Drug Analysis”, Poster Presentation
One approach to disseminating our results was to provide feedback to the forensic community.
Interested analysts have contacted our lab to find out more about the instrument. They have
This document is a research report submitted to the U.S. Department of Justice. This report has not been published by the Department. Opinions or points of view expressed are those of the author(s)
and do not necessarily reflect the official position or policies of the U.S. Department of Justice.
44
heard about the GC/IR from scientific meetings or from the vendor as a current user of the
system.
Other on-line forums help disseminate information. A LinkedIn forum (Forensic Scientists-
GCIR) was created for current users, the vendor, and others who may express an interest.
We have been using the forensic database established by RTI. Entering our IR spectra in the
database is a possibility.
Citations: None
This document is a research report submitted to the U.S. Department of Justice. This report has not been published by the Department. Opinions or points of view expressed are those of the author(s)
and do not necessarily reflect the official position or policies of the U.S. Department of Justice.
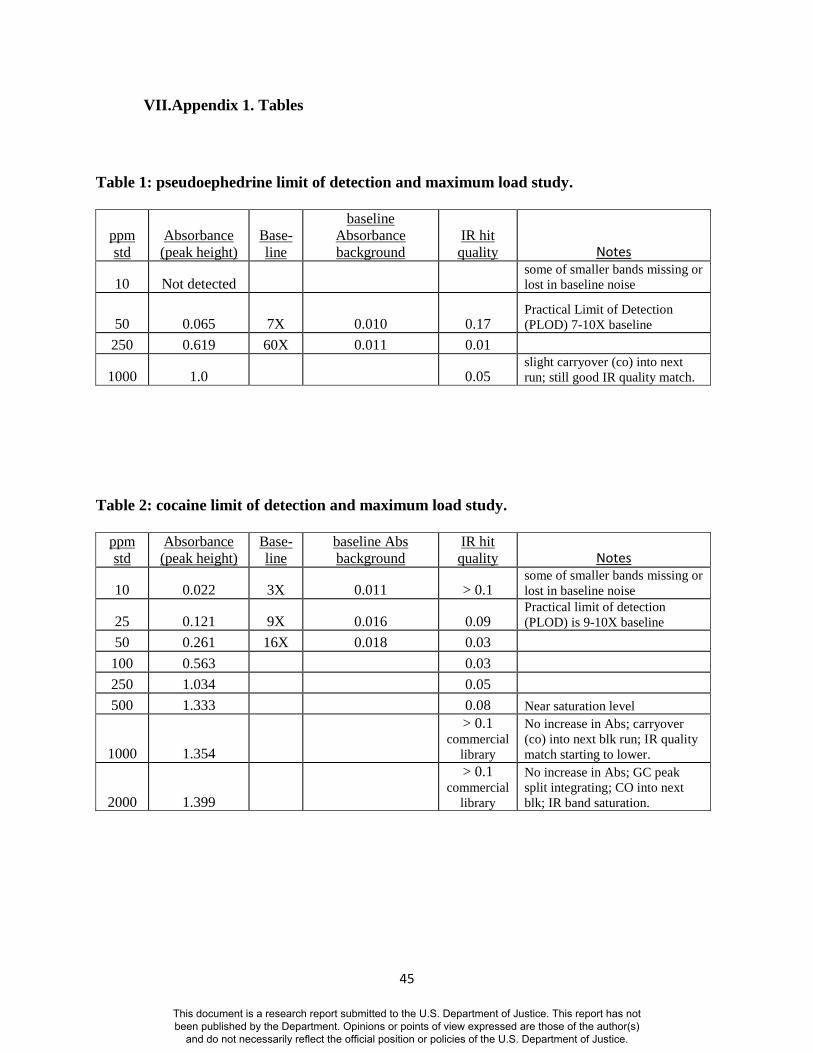
45
VII.Appendix 1. Tables
Table 1: pseudoephedrine limit of detection and maximum load study.
ppm
std
Absorbance
(peak height)
Base-
line
baseline
Absorbance
background
IR hit
quality Notes
10 Not detected
some of smaller bands missing or
lost in baseline noise
50 0.065 7X 0.010 0.17 Practical Limit of Detection
(PLOD) 7-10X baseline
250 0.619 60X 0.011 0.01
1000 1.0
0.05 slight carryover (co) into next
run; still good IR quality match.
Table 2: cocaine limit of detection and maximum load study.
ppm
std
Absorbance
(peak height)
Base-
line
baseline Abs
background
IR hit
quality Notes
10 0.022 3X 0.011 > 0.1 some of smaller bands missing or
lost in baseline noise
25 0.121 9X 0.016 0.09 Practical limit of detection
(PLOD) is 9-10X baseline
50 0.261 16X 0.018 0.03
100 0.563
0.03
250 1.034
0.05
500 1.333
0.08 Near saturation level
1000 1.354
> 0.1 commercial
library
No increase in Abs; carryover
(co) into next blk run; IR quality
match starting to lower.
2000 1.399
> 0.1 commercial
library
No increase in Abs; GC peak
split integrating; CO into next
blk; IR band saturation.
This document is a research report submitted to the U.S. Department of Justice. This report has not been published by the Department. Opinions or points of view expressed are those of the author(s)
and do not necessarily reflect the official position or policies of the U.S. Department of Justice.
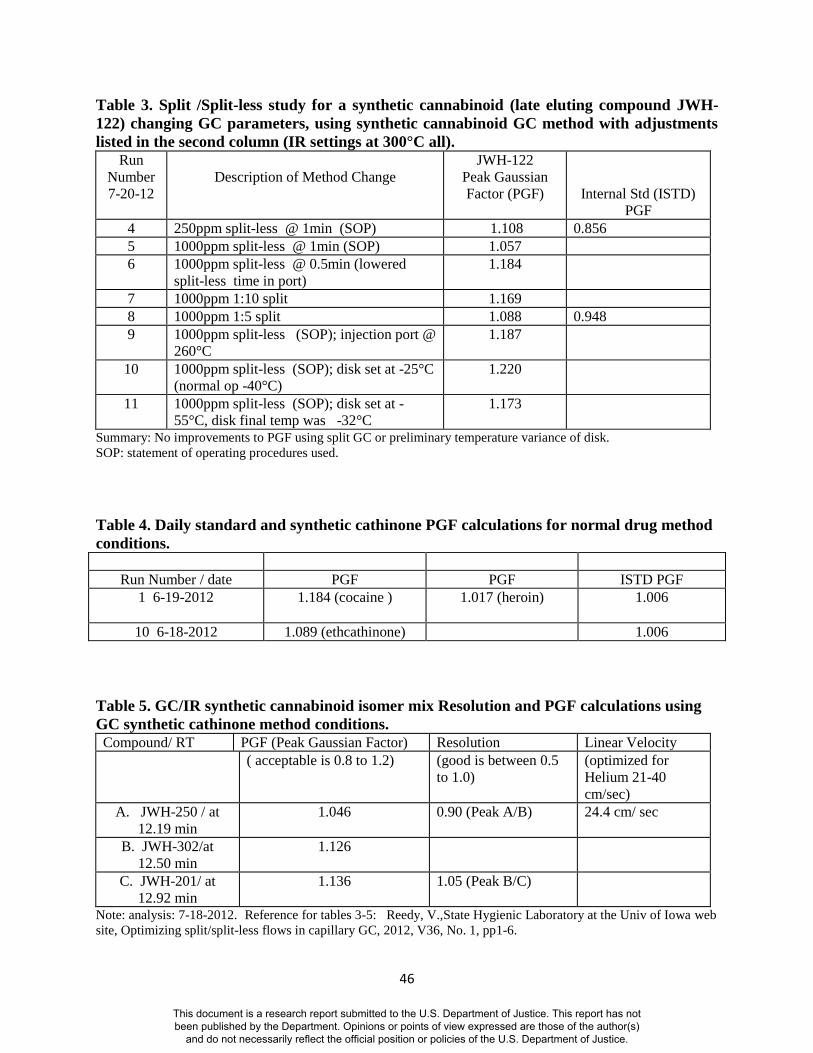
46
Table 3. Split /Split-less study for a synthetic cannabinoid (late eluting compound JWH-
122) changing GC parameters, using synthetic cannabinoid GC method with adjustments
listed in the second column (IR settings at 300°C all).
Run
Number
7-20-12
Description of Method Change
JWH-122
Peak Gaussian
Factor (PGF)
Internal Std (ISTD)
PGF
4 250ppm split-less @ 1min (SOP) 1.108 0.856
5 1000ppm split-less @ 1min (SOP) 1.057
6 1000ppm split-less @ 0.5min (lowered
split-less time in port)
1.184
7 1000ppm 1:10 split 1.169
8 1000ppm 1:5 split 1.088 0.948
9 1000ppm split-less (SOP); injection port @
260°C
1.187
10 1000ppm split-less (SOP); disk set at -25°C
(normal op -40°C)
1.220
11 1000ppm split-less (SOP); disk set at -
55°C, disk final temp was -32°C
1.173
Summary: No improvements to PGF using split GC or preliminary temperature variance of disk.
SOP: statement of operating procedures used.
Table 4. Daily standard and synthetic cathinone PGF calculations for normal drug method
conditions.
Run Number / date PGF PGF ISTD PGF
1 6-19-2012
1.184 (cocaine ) 1.017 (heroin) 1.006
10 6-18-2012 1.089 (ethcathinone) 1.006
Table 5. GC/IR synthetic cannabinoid isomer mix Resolution and PGF calculations using
GC synthetic cathinone method conditions. Compound/ RT PGF (Peak Gaussian Factor) Resolution Linear Velocity
( acceptable is 0.8 to 1.2) (good is between 0.5
to 1.0)
(optimized for
Helium 21-40
cm/sec)
A. JWH-250 / at
12.19 min
1.046 0.90 (Peak A/B) 24.4 cm/ sec
B. JWH-302/at
12.50 min
1.126
C. JWH-201/ at
12.92 min
1.136 1.05 (Peak B/C)
Note: analysis: 7-18-2012. Reference for tables 3-5: Reedy, V.,State Hygienic Laboratory at the Univ of Iowa web
site, Optimizing split/split-less flows in capillary GC, 2012, V36, No. 1, pp1-6.
This document is a research report submitted to the U.S. Department of Justice. This report has not been published by the Department. Opinions or points of view expressed are those of the author(s)
and do not necessarily reflect the official position or policies of the U.S. Department of Justice.
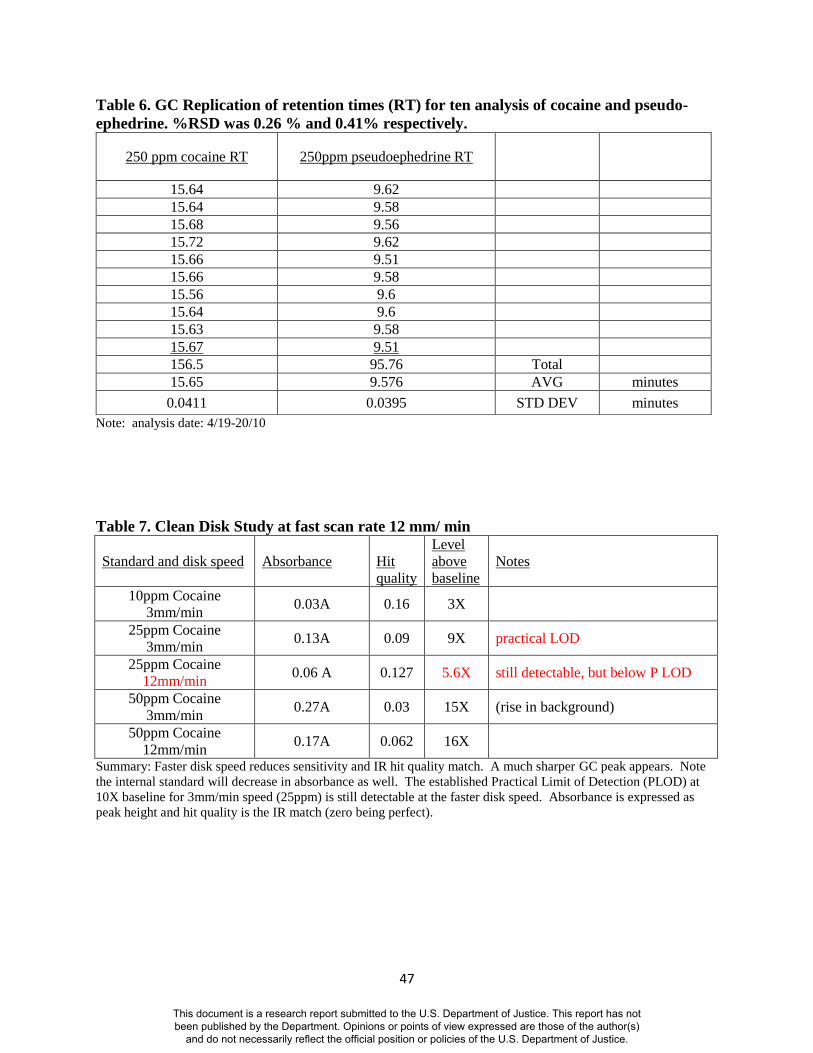
47
Table 6. GC Replication of retention times (RT) for ten analysis of cocaine and pseudo-
ephedrine. %RSD was 0.26 % and 0.41% respectively.
250 ppm cocaine RT 250ppm pseudoephedrine RT
15.64 9.62
15.64 9.58
15.68 9.56
15.72 9.62
15.66 9.51
15.66 9.58
15.56 9.6
15.64 9.6
15.63 9.58
15.67 9.51
156.5 95.76 Total
15.65 9.576 AVG minutes
0.0411 0.0395 STD DEV minutes
Note: analysis date: 4/19-20/10
Table 7. Clean Disk Study at fast scan rate 12 mm/ min
Standard and disk speed Absorbance Hit
quality
Level
above
baseline
Notes
10ppm Cocaine
3mm/min 0.03A 0.16 3X
25ppm Cocaine
3mm/min 0.13A 0.09 9X practical LOD
25ppm Cocaine
12mm/min 0.06 A 0.127 5.6X still detectable, but below P LOD
50ppm Cocaine
3mm/min 0.27A 0.03 15X (rise in background)
50ppm Cocaine
12mm/min 0.17A 0.062 16X
Summary: Faster disk speed reduces sensitivity and IR hit quality match. A much sharper GC peak appears. Note
the internal standard will decrease in absorbance as well. The established Practical Limit of Detection (PLOD) at
10X baseline for 3mm/min speed (25ppm) is still detectable at the faster disk speed. Absorbance is expressed as
peak height and hit quality is the IR match (zero being perfect).
This document is a research report submitted to the U.S. Department of Justice. This report has not been published by the Department. Opinions or points of view expressed are those of the author(s)
and do not necessarily reflect the official position or policies of the U.S. Department of Justice.
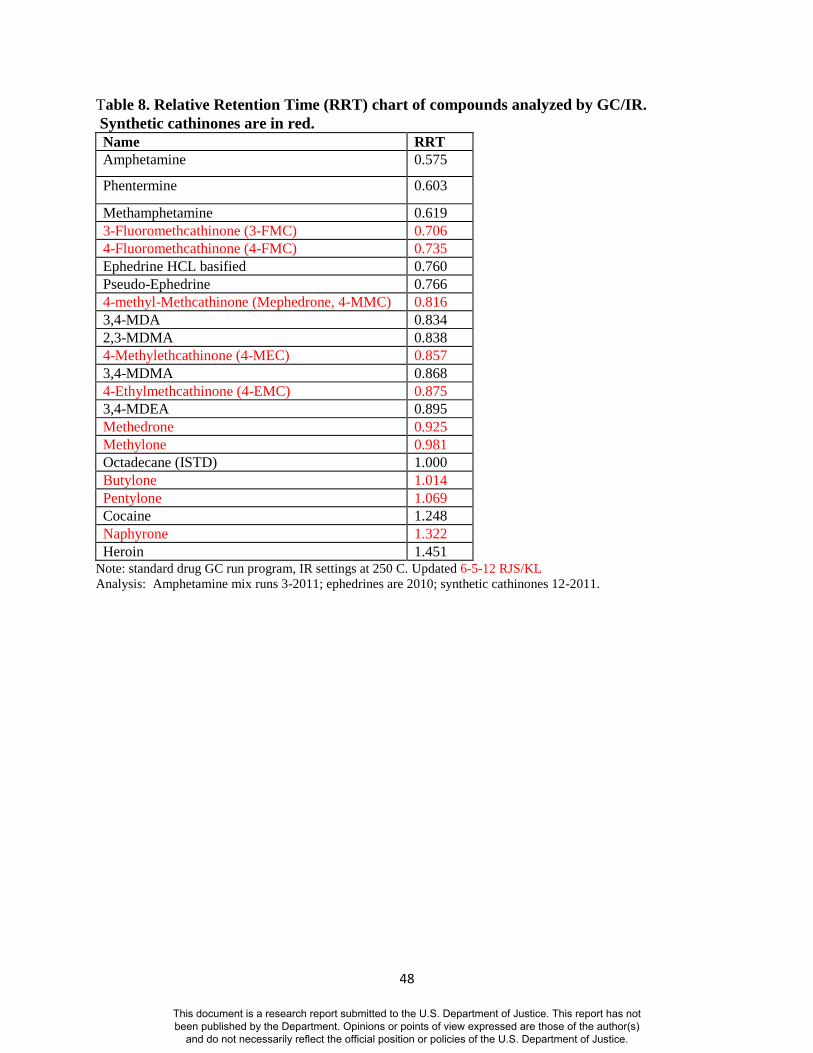
48
Table 8. Relative Retention Time (RRT) chart of compounds analyzed by GC/IR.
Synthetic cathinones are in red.
Name RRT
Amphetamine 0.575
Phentermine 0.603
Methamphetamine 0.619
3-Fluoromethcathinone (3-FMC) 0.706
4-Fluoromethcathinone (4-FMC) 0.735
Ephedrine HCL basified 0.760
Pseudo-Ephedrine 0.766
4-methyl-Methcathinone (Mephedrone, 4-MMC) 0.816
3,4-MDA 0.834
2,3-MDMA 0.838
4-Methylethcathinone (4-MEC) 0.857
3,4-MDMA 0.868
4-Ethylmethcathinone (4-EMC) 0.875
3,4-MDEA 0.895
Methedrone 0.925
Methylone 0.981
Octadecane (ISTD) 1.000
Butylone 1.014
Pentylone 1.069
Cocaine 1.248
Naphyrone 1.322
Heroin 1.451 Note: standard drug GC run program, IR settings at 250 C. Updated 6-5-12 RJS/KL
Analysis: Amphetamine mix runs 3-2011; ephedrines are 2010; synthetic cathinones 12-2011.
This document is a research report submitted to the U.S. Department of Justice. This report has not been published by the Department. Opinions or points of view expressed are those of the author(s)
and do not necessarily reflect the official position or policies of the U.S. Department of Justice.
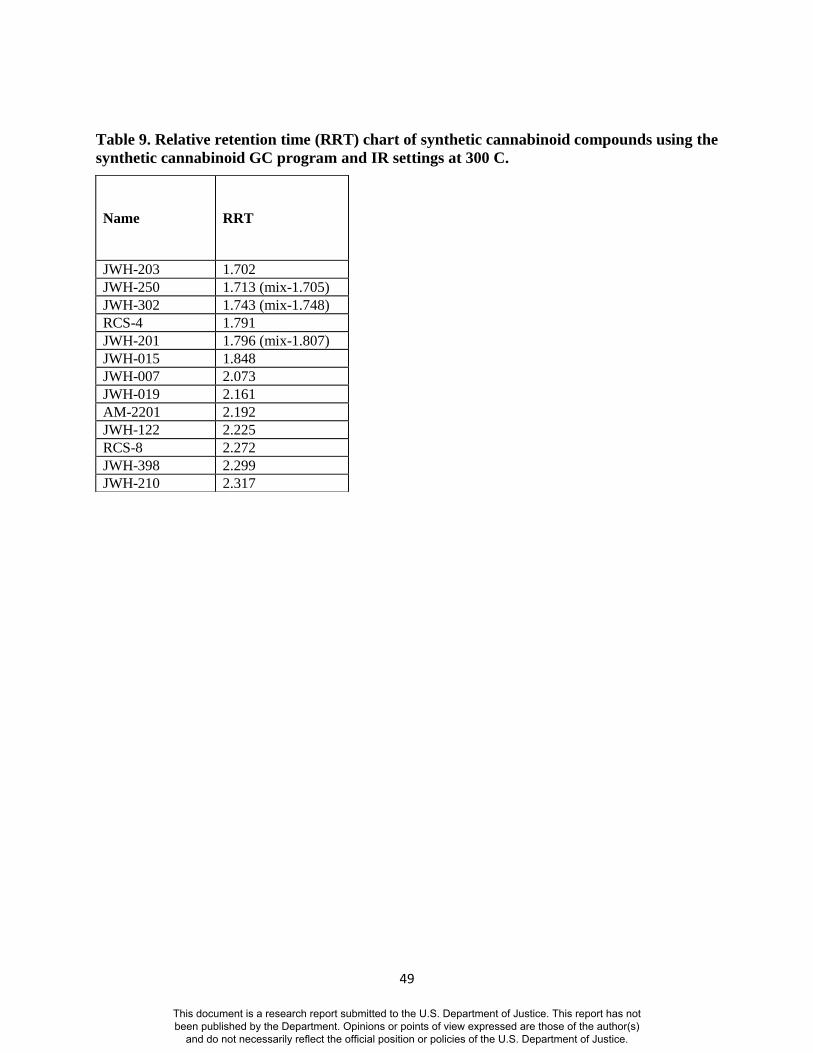
49
Table 9. Relative retention time (RRT) chart of synthetic cannabinoid compounds using the
synthetic cannabinoid GC program and IR settings at 300 C.
Name
RRT
JWH-203 1.702
JWH-250 1.713 (mix-1.705)
JWH-302 1.743 (mix-1.748)
RCS-4 1.791
JWH-201 1.796 (mix-1.807)
JWH-015 1.848
JWH-007 2.073
JWH-019 2.161
AM-2201 2.192
JWH-122 2.225
RCS-8 2.272
JWH-398 2.299
JWH-210 2.317
This document is a research report submitted to the U.S. Department of Justice. This report has not been published by the Department. Opinions or points of view expressed are those of the author(s)
and do not necessarily reflect the official position or policies of the U.S. Department of Justice.
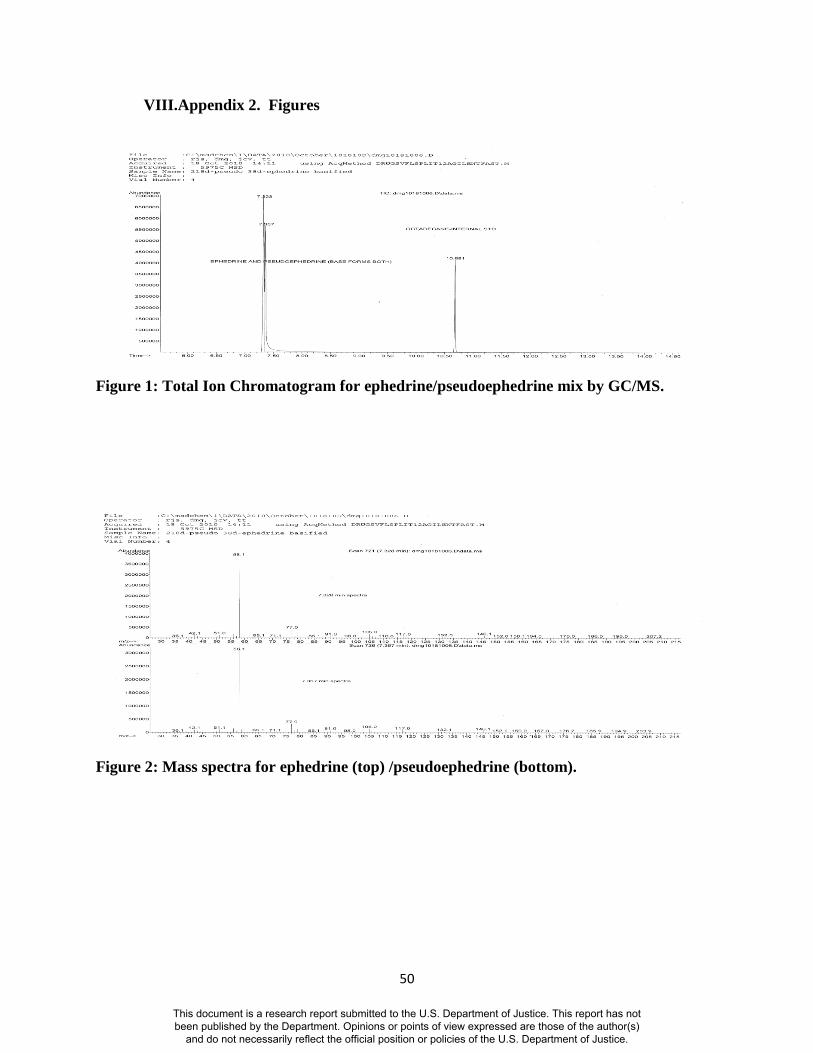
50
VIII.Appendix 2. Figures
Figure 1: Total Ion Chromatogram for ephedrine/pseudoephedrine mix by GC/MS.
Figure 2: Mass spectra for ephedrine (top) /pseudoephedrine (bottom).
This document is a research report submitted to the U.S. Department of Justice. This report has not been published by the Department. Opinions or points of view expressed are those of the author(s)
and do not necessarily reflect the official position or policies of the U.S. Department of Justice.
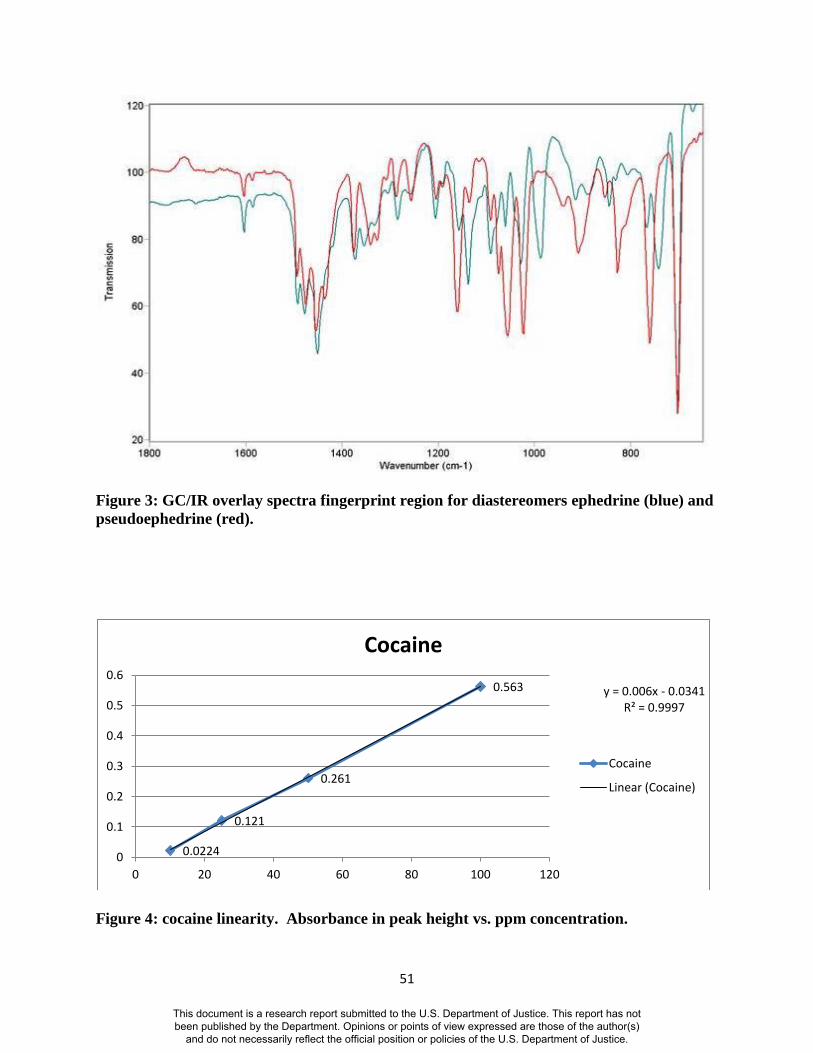
51
Figure 3: GC/IR overlay spectra fingerprint region for diastereomers ephedrine (blue) and
pseudoephedrine (red).
Figure 4: cocaine linearity. Absorbance in peak height vs. ppm concentration.
0.0224
0.121
0.261
0.563 y = 0.006x - 0.0341 R² = 0.9997
0
0.1
0.2
0.3
0.4
0.5
0.6
0 20 40 60 80 100 120
Cocaine
Cocaine
Linear (Cocaine)
This document is a research report submitted to the U.S. Department of Justice. This report has not been published by the Department. Opinions or points of view expressed are those of the author(s)
and do not necessarily reflect the official position or policies of the U.S. Department of Justice.
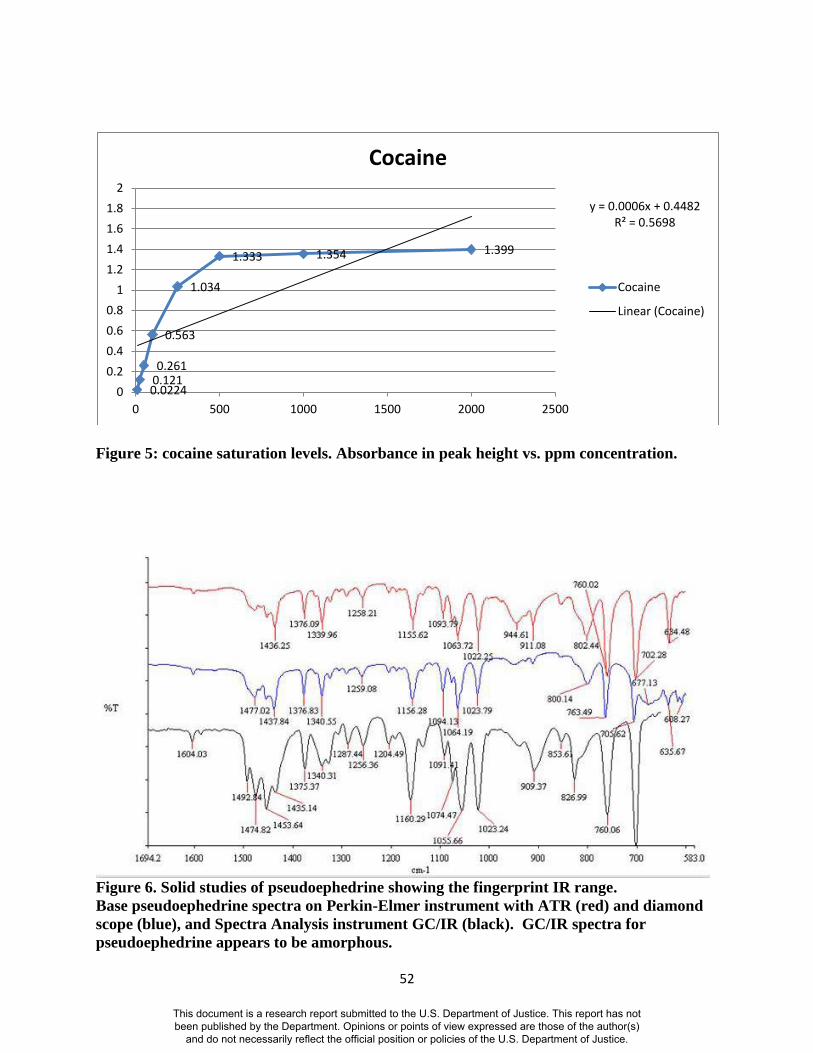
52
Figure 5: cocaine saturation levels. Absorbance in peak height vs. ppm concentration.
Figure 6. Solid studies of pseudoephedrine showing the fingerprint IR range.
Base pseudoephedrine spectra on Perkin-Elmer instrument with ATR (red) and diamond
scope (blue), and Spectra Analysis instrument GC/IR (black). GC/IR spectra for
pseudoephedrine appears to be amorphous.
0.0224 0.121 0.261
0.563
1.034
1.333 1.354 1.399
y = 0.0006x + 0.4482 R² = 0.5698
0
0.2
0.4
0.6
0.8
1
1.2
1.4
1.6
1.8
2
0 500 1000 1500 2000 2500
Cocaine
Cocaine
Linear (Cocaine)
This document is a research report submitted to the U.S. Department of Justice. This report has not been published by the Department. Opinions or points of view expressed are those of the author(s)
and do not necessarily reflect the official position or policies of the U.S. Department of Justice.
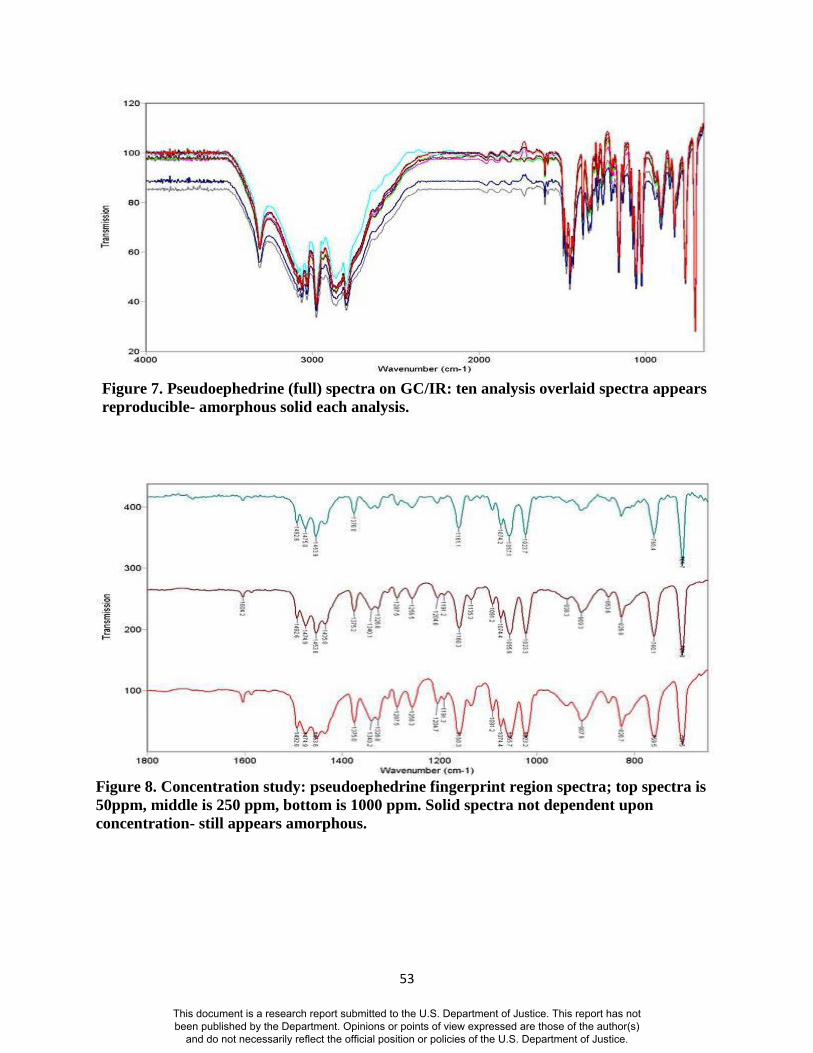
53
Figure 7. Pseudoephedrine (full) spectra on GC/IR: ten analysis overlaid spectra appears
reproducible- amorphous solid each analysis.
Figure 8. Concentration study: pseudoephedrine fingerprint region spectra; top spectra is
50ppm, middle is 250 ppm, bottom is 1000 ppm. Solid spectra not dependent upon
concentration- still appears amorphous.
This document is a research report submitted to the U.S. Department of Justice. This report has not been published by the Department. Opinions or points of view expressed are those of the author(s)
and do not necessarily reflect the official position or policies of the U.S. Department of Justice.
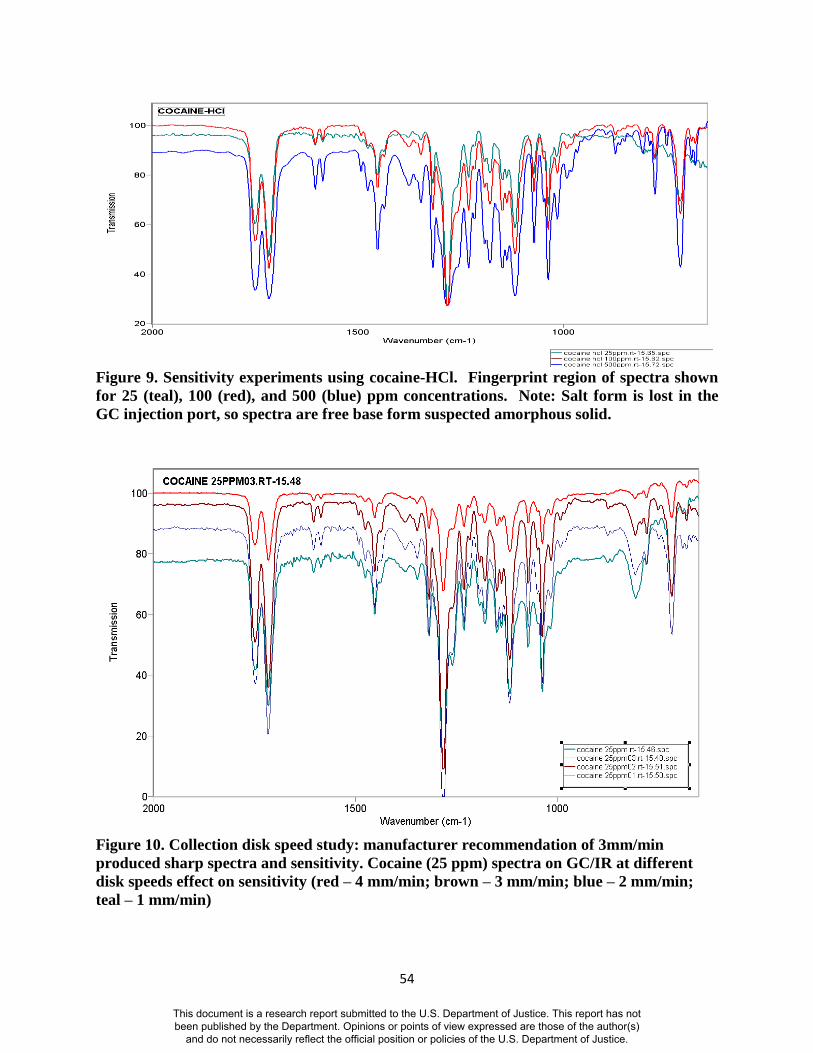
54
Figure 9. Sensitivity experiments using cocaine-HCl. Fingerprint region of spectra shown
for 25 (teal), 100 (red), and 500 (blue) ppm concentrations. Note: Salt form is lost in the
GC injection port, so spectra are free base form suspected amorphous solid.
Figure 10. Collection disk speed study: manufacturer recommendation of 3mm/min
produced sharp spectra and sensitivity. Cocaine (25 ppm) spectra on GC/IR at different
disk speeds effect on sensitivity (red – 4 mm/min; brown – 3 mm/min; blue – 2 mm/min;
teal – 1 mm/min)
This document is a research report submitted to the U.S. Department of Justice. This report has not been published by the Department. Opinions or points of view expressed are those of the author(s)
and do not necessarily reflect the official position or policies of the U.S. Department of Justice.
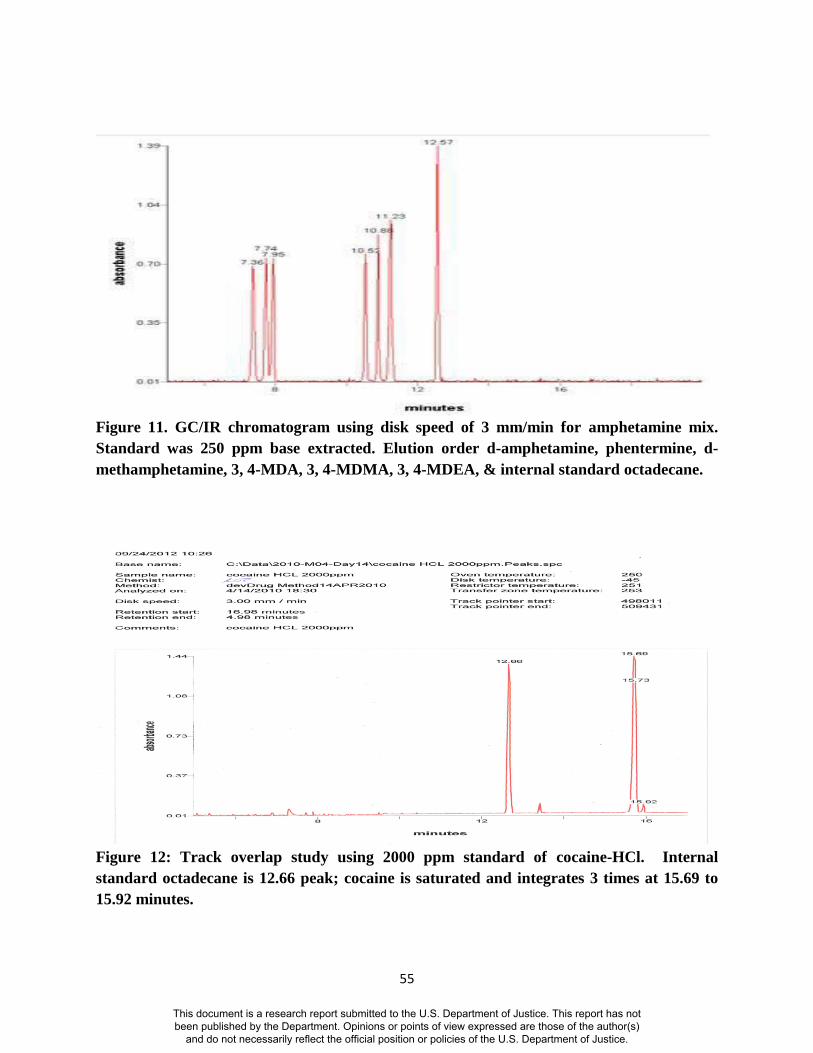
55
Figure 11. GC/IR chromatogram using disk speed of 3 mm/min for amphetamine mix.
Standard was 250 ppm base extracted. Elution order d-amphetamine, phentermine, d-
methamphetamine, 3, 4-MDA, 3, 4-MDMA, 3, 4-MDEA, & internal standard octadecane.
Figure 12: Track overlap study using 2000 ppm standard of cocaine-HCl. Internal
standard octadecane is 12.66 peak; cocaine is saturated and integrates 3 times at 15.69 to
15.92 minutes.
This document is a research report submitted to the U.S. Department of Justice. This report has not been published by the Department. Opinions or points of view expressed are those of the author(s)
and do not necessarily reflect the official position or policies of the U.S. Department of Justice.
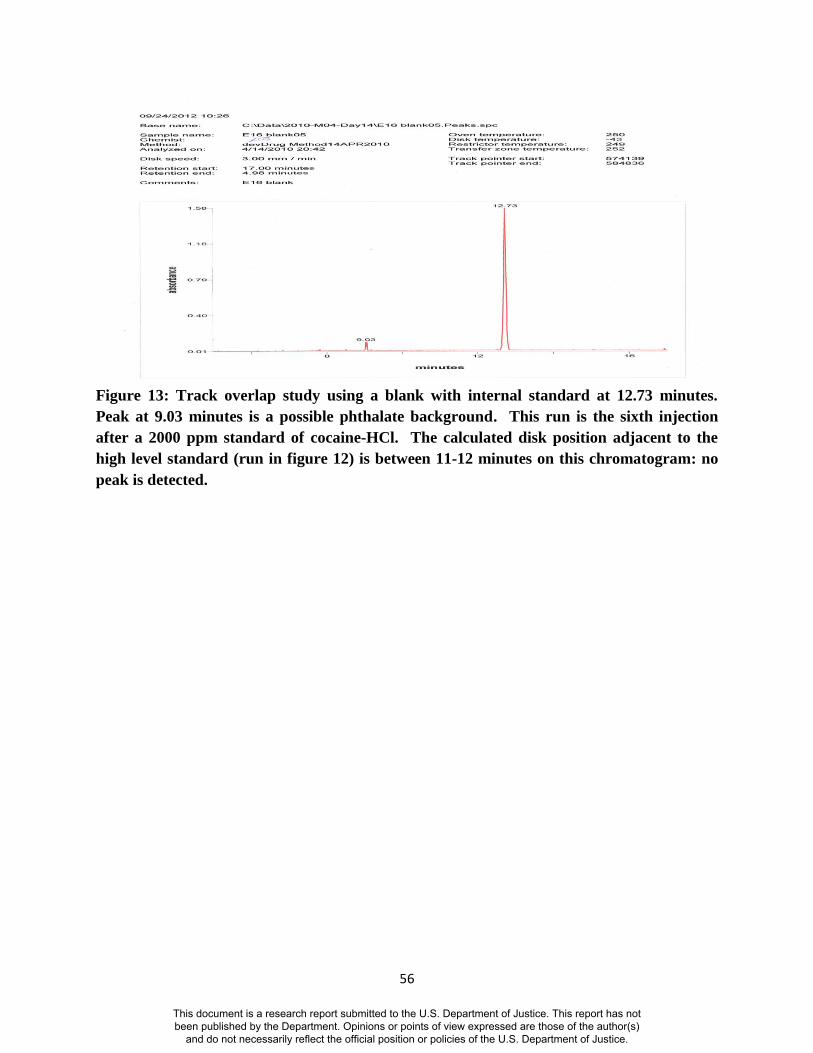
56
Figure 13: Track overlap study using a blank with internal standard at 12.73 minutes.
Peak at 9.03 minutes is a possible phthalate background. This run is the sixth injection
after a 2000 ppm standard of cocaine-HCl. The calculated disk position adjacent to the
high level standard (run in figure 12) is between 11-12 minutes on this chromatogram: no
peak is detected.
This document is a research report submitted to the U.S. Department of Justice. This report has not been published by the Department. Opinions or points of view expressed are those of the author(s)
and do not necessarily reflect the official position or policies of the U.S. Department of Justice.
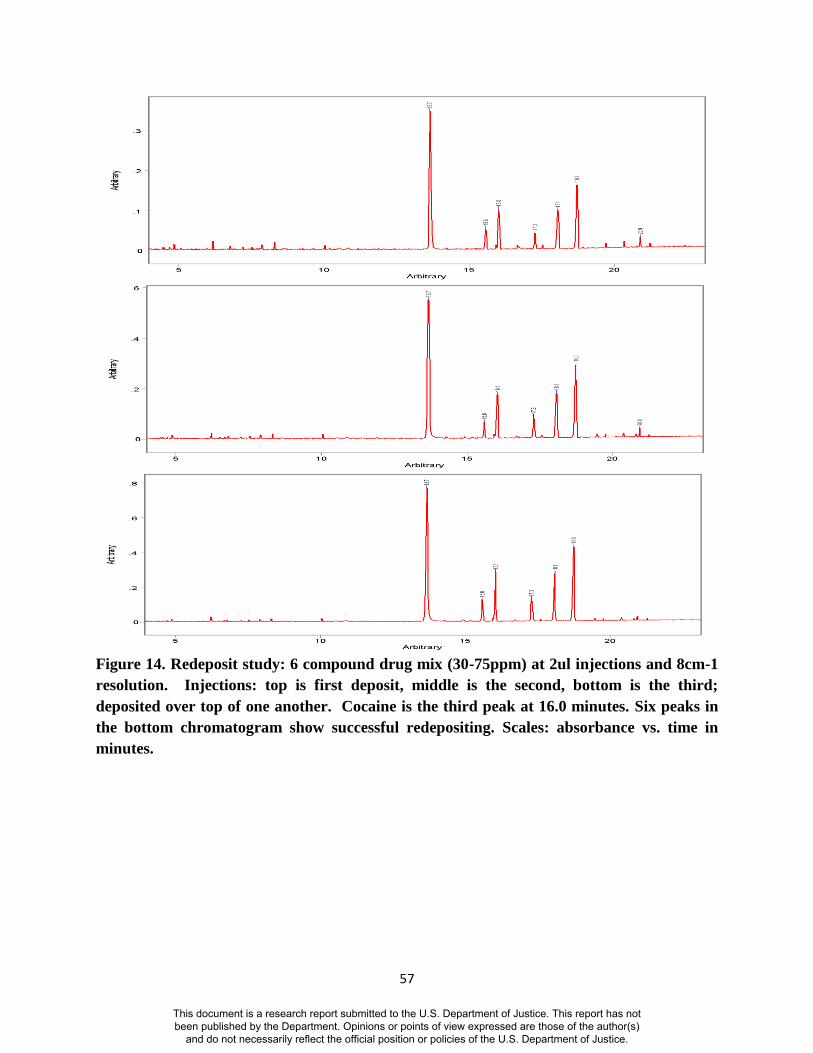
57
Figure 14. Redeposit study: 6 compound drug mix (30-75ppm) at 2ul injections and 8cm-1
resolution. Injections: top is first deposit, middle is the second, bottom is the third;
deposited over top of one another. Cocaine is the third peak at 16.0 minutes. Six peaks in
the bottom chromatogram show successful redepositing. Scales: absorbance vs. time in
minutes.
This document is a research report submitted to the U.S. Department of Justice. This report has not been published by the Department. Opinions or points of view expressed are those of the author(s)
and do not necessarily reflect the official position or policies of the U.S. Department of Justice.
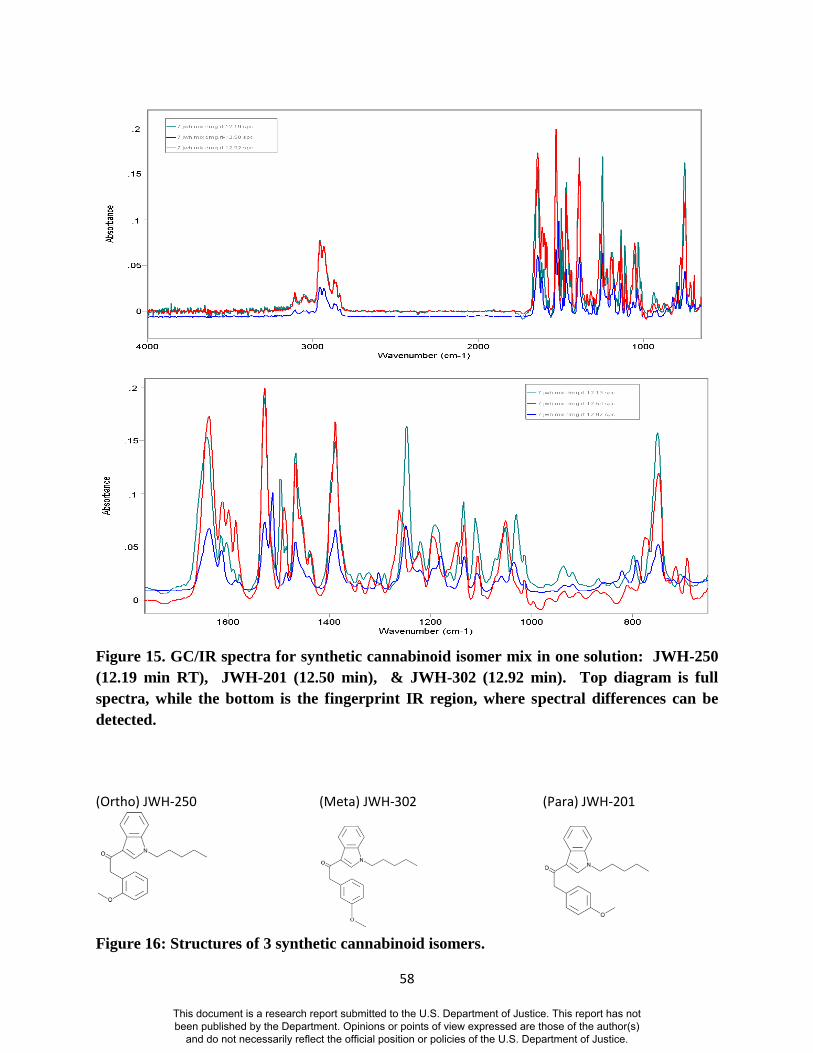
58
Figure 15. GC/IR spectra for synthetic cannabinoid isomer mix in one solution: JWH-250
(12.19 min RT), JWH-201 (12.50 min), & JWH-302 (12.92 min). Top diagram is full
spectra, while the bottom is the fingerprint IR region, where spectral differences can be
detected.
(Ortho) JWH-250
(Meta) JWH-302
(Para) JWH-201
Figure 16: Structures of 3 synthetic cannabinoid isomers.
This document is a research report submitted to the U.S. Department of Justice. This report has not been published by the Department. Opinions or points of view expressed are those of the author(s)
and do not necessarily reflect the official position or policies of the U.S. Department of Justice.
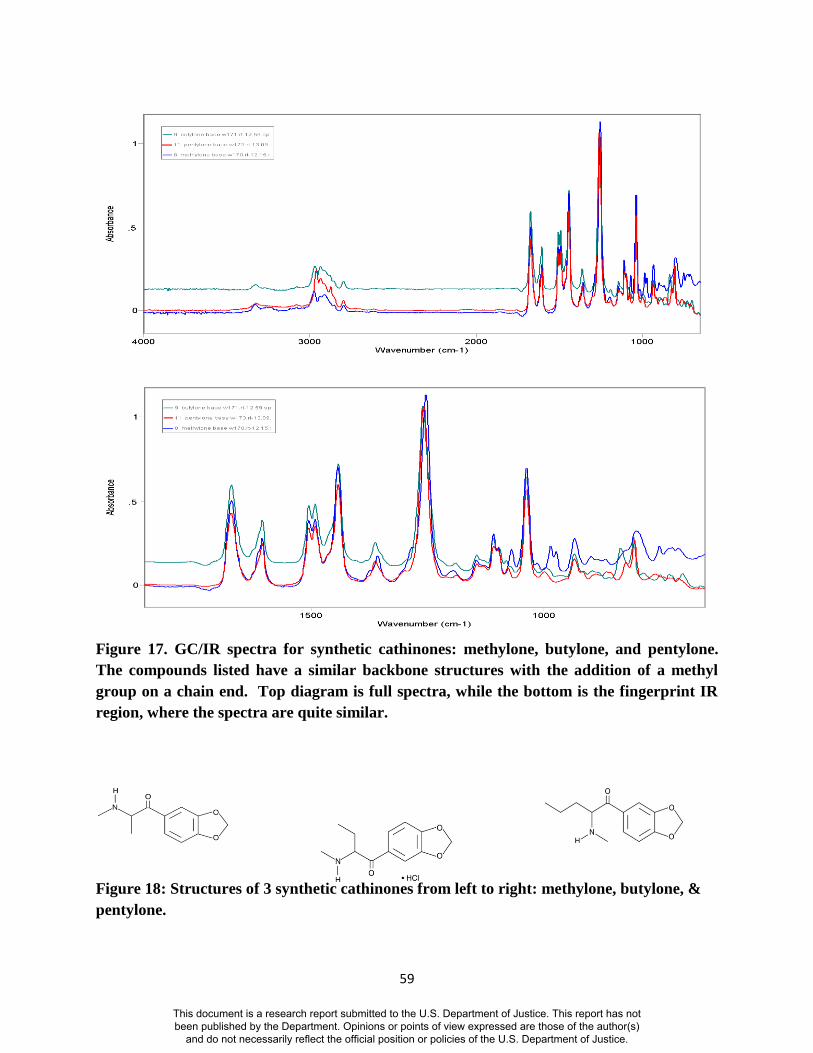
59
Figure 17. GC/IR spectra for synthetic cathinones: methylone, butylone, and pentylone.
The compounds listed have a similar backbone structures with the addition of a methyl
group on a chain end. Top diagram is full spectra, while the bottom is the fingerprint IR
region, where the spectra are quite similar.
Figure 18: Structures of 3 synthetic cathinones from left to right: methylone, butylone, &
pentylone.
This document is a research report submitted to the U.S. Department of Justice. This report has not been published by the Department. Opinions or points of view expressed are those of the author(s)
and do not necessarily reflect the official position or policies of the U.S. Department of Justice.
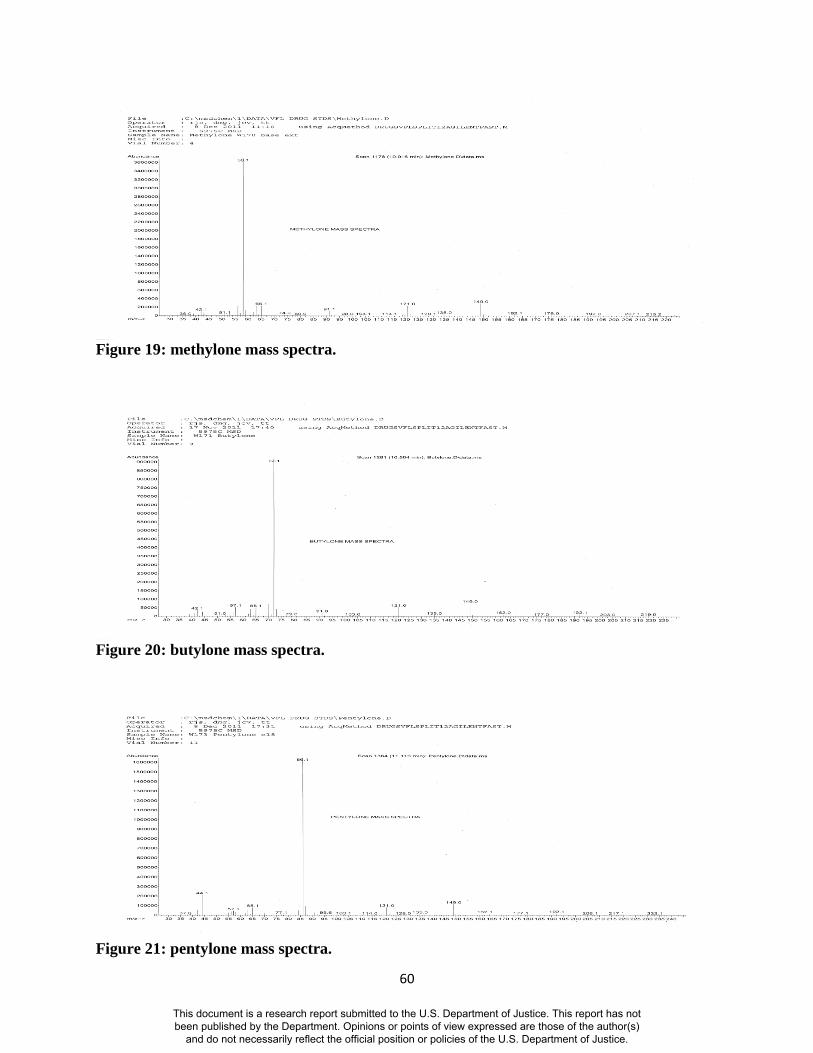
60
Figure 19: methylone mass spectra.
Figure 20: butylone mass spectra.
Figure 21: pentylone mass spectra.
This document is a research report submitted to the U.S. Department of Justice. This report has not been published by the Department. Opinions or points of view expressed are those of the author(s)
and do not necessarily reflect the official position or policies of the U.S. Department of Justice.
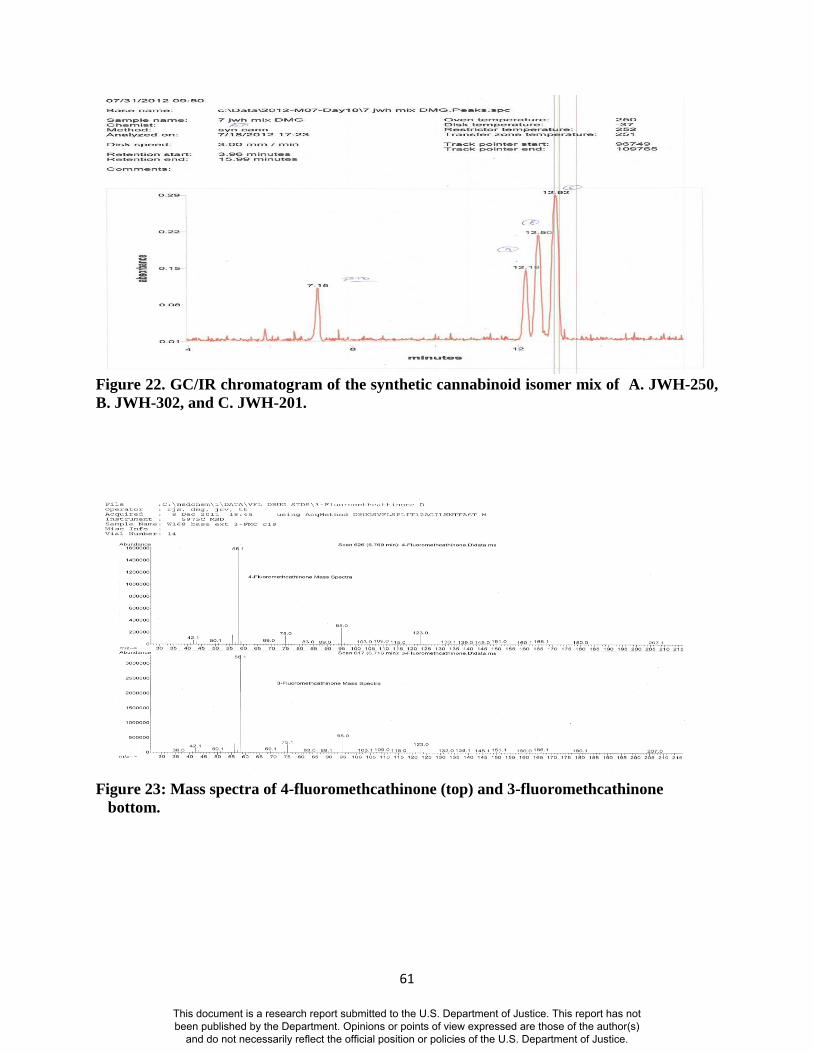
61
Figure 22. GC/IR chromatogram of the synthetic cannabinoid isomer mix of A. JWH-250,
B. JWH-302, and C. JWH-201.
Figure 23: Mass spectra of 4-fluoromethcathinone (top) and 3-fluoromethcathinone
bottom.
This document is a research report submitted to the U.S. Department of Justice. This report has not been published by the Department. Opinions or points of view expressed are those of the author(s)
and do not necessarily reflect the official position or policies of the U.S. Department of Justice.
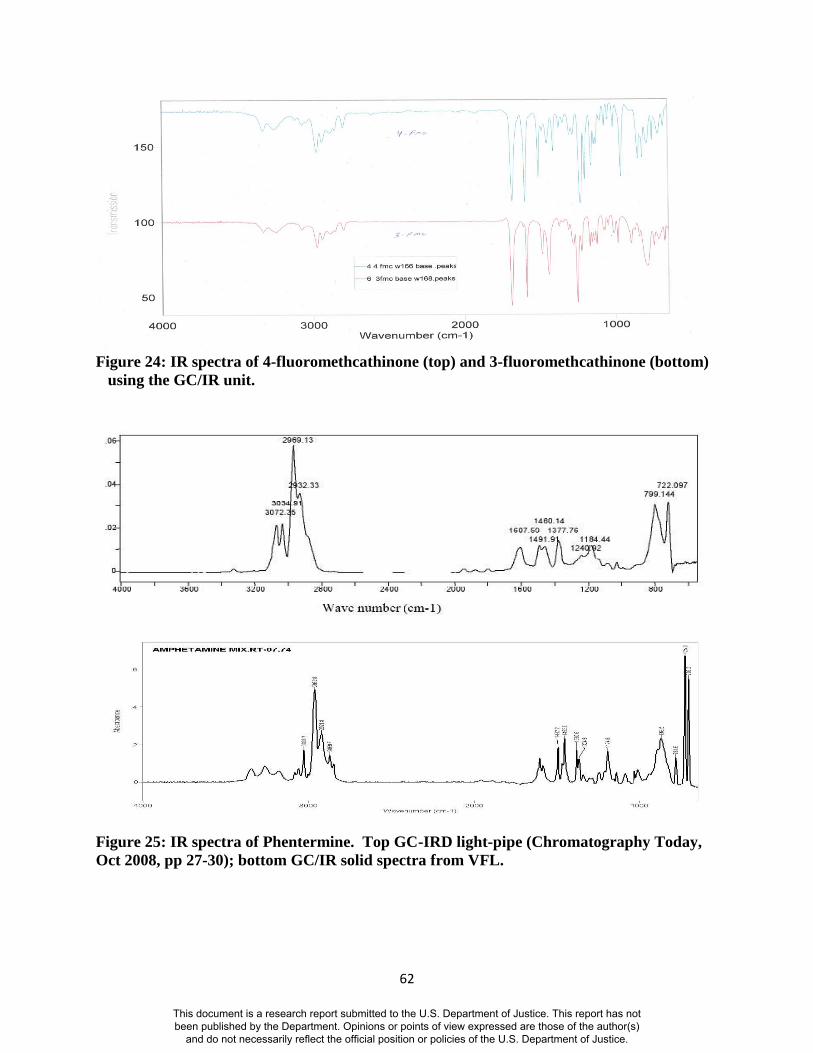
62
Figure 24: IR spectra of 4-fluoromethcathinone (top) and 3-fluoromethcathinone (bottom)
using the GC/IR unit.
Figure 25: IR spectra of Phentermine. Top GC-IRD light-pipe (Chromatography Today,
Oct 2008, pp 27-30); bottom GC/IR solid spectra from VFL.
This document is a research report submitted to the U.S. Department of Justice. This report has not been published by the Department. Opinions or points of view expressed are those of the author(s)
and do not necessarily reflect the official position or policies of the U.S. Department of Justice.