Forensic Applications of Gas Chromatography
179
Gas Chromatography Forensic Applications of Analytical Concepts in Forensic Chemistry Series Michelle Groves Carlin John R. Dean
-
Upload
fernando-itri -
Category
Documents
-
view
65 -
download
2
description
forensic applications of gas chromatography
Transcript of Forensic Applications of Gas Chromatography

6000 Broken Sound Parkway, NW Suite 300, Boca Raton, FL 33487711 Third Avenue New York, NY 100172 Park Square, Milton Park Abingdon, Oxon OX14 4RN, UK w w w . c r c p r e s s . c o m
K14676
Forensics & criminal Justice
GasChromatography
Forensic Applications of
A n a l y t i c a l C o n c e p t s i n F o r e n s i c C h e m i s t r y S e r i e s
Gas ChromatographyForensic Applications of
Carlin | D
eanForensic A
pplications of Gas C
hromatography
Michelle Groves CarlinJohn R. Dean
an informa business
w w w . c r c p r e s s . c o m
Several areas of forensic science use the technique of gas chromatography, ranging from fire analysis to the investigation of fraudulent food and perfumes. Covering the essentials of this powerful analytical technique, Forensic Applications of Gas Chromatography explains the theory and shows applications of this knowledge to various realms of forensic science.
Topics include:• Abriefintroductiontogaschromatographyanditsuseinforensicscience• Variouscomponentsthatmakeupthegaschromatographicinstrumentation•Thetheoryoftheseparationprocess,alongwiththechemistryunderpinningthe
process•Methoddevelopment,withaspecificexampleofaseparationofeightdifferent
compounds using a gas chromatography-flame ionization detector • Qualityassuranceandmethodvalidation—withinformationapplicabletomanytypesofanalyticaltestinglaboratories
• Troubleshootingingaschromatographysystems• Newdevelopmentsingaschromatographyandadvancesincolumnsanddetectors
Realexamplessupplementthetext,alongwithquestionsineachchapter.Thebookincludesexamples of applications of gas chromatography in drugs, toxicology, fire, paint, food, and fragrance. Each application is presented as an individual case study with specific focus on aparticularsamplepreparationtechnique.Thisallowseachtechniquetobediscussedwithrespect to its theory, instrumentation, solvent selection, and function, as appropriate. Each case studyprovides readerswith suitablepractical information toallow themtoperformexperiments in their own laboratory either as part of a practical laboratory class or in aresearchcontext.Thefinalchapterprovidesanswerstothequestionsandencouragesfurtherstudy and discussion.


GasChromatography
Forensic Applications of

A n A ly t i c A l c o n c e p t s i n F o r e n s i c c h e m i s t ry
Series Editors
Shirley O’Hare and Michelle Groves Carlin
Forensic Applications of Gas Chromatography, Michelle Groves Carlin and John R. Dean
Forensic Applications of High Performance Liquid Chromatography, Shirley Bayne and Michelle Groves Carlin

Boca Raton London New York
CRC Press is an imprint of theTaylor & Francis Group, an informa business
Michelle Groves CarlinJohn R. Dean
GasChromatography
Forensic Applications of

CRC PressTaylor & Francis Group6000 Broken Sound Parkway NW, Suite 300Boca Raton, FL 33487-2742
© 2013 by Taylor & Francis Group, LLCCRC Press is an imprint of Taylor & Francis Group, an Informa business
No claim to original U.S. Government worksVersion Date: 20130227
International Standard Book Number-13: 978-1-4665-0755-5 (eBook - PDF)
This book contains information obtained from authentic and highly regarded sources. Reasonable efforts have been made to publish reliable data and information, but the author and publisher cannot assume responsibility for the validity of all materials or the consequences of their use. The authors and publishers have attempted to trace the copyright holders of all material reproduced in this publication and apologize to copyright holders if permission to publish in this form has not been obtained. If any copyright material has not been acknowledged please write and let us know so we may rectify in any future reprint.
Except as permitted under U.S. Copyright Law, no part of this book may be reprinted, reproduced, transmit-ted, or utilized in any form by any electronic, mechanical, or other means, now known or hereafter invented, including photocopying, microfilming, and recording, or in any information storage or retrieval system, without written permission from the publishers.
For permission to photocopy or use material electronically from this work, please access www.copyright.com (http://www.copyright.com/) or contact the Copyright Clearance Center, Inc. (CCC), 222 Rosewood Drive, Danvers, MA 01923, 978-750-8400. CCC is a not-for-profit organization that provides licenses and registration for a variety of users. For organizations that have been granted a photocopy license by the CCC, a separate system of payment has been arranged.
Trademark Notice: Product or corporate names may be trademarks or registered trademarks, and are used only for identification and explanation without intent to infringe.
Visit the Taylor & Francis Web site athttp://www.taylorandfrancis.com
and the CRC Press Web site athttp://www.crcpress.com

v© 2010 Taylor & Francis Group, LLC
For my family
for their continued love and support in my academic and career endeavours.
—Michelle G. Carlin
To Lynne, Sam, and Naomi (and Emmi, the border terrier) for allowing me the time to sit and write this book.
—John R. Dean


vii© 2010 Taylor & Francis Group, LLC
Contents
Series Preface xiiiPreface xvAcknowledgements xviiAbout the Authors xix
1 Introduction to Gas Chromatography 1
References 3
2 Instrumentation for Gas Chromatography 5
2.1 Introduction 52.2 Choice of Gas 5
2.2.1 Gas Purity 62.2.2 Electronic Pressure Control Devices 72.2.3 Gas Cylinders or Generators 7
2.3 Sample Introduction 82.3.1 Split/Splitless Injector 102.3.2 On-Column Injector 102.3.3 Programmed Temperature Vapourisation Injector 112.3.4 Thermal Desorption 122.3.5 Purge and Trap 132.3.6 Pyrolysis 13
2.4 Column Oven 142.5 GC Columns 15
2.5.1 Stationary Phase Selection 162.5.2 Internal Diameter of the Column 192.5.3 Length of the Capillary Column 192.5.4 Thickness of the Stationary Phase 202.5.5 Overall Description of a Capillary Column 20
2.6 Detectors 212.6.1 Flame Ionisation Detector 222.6.2 Electron Capture Detector 232.6.3 Nitrogen–Phosphorus (or Thermionic) Detector 232.6.4 Flame Photometric Detector 252.6.5 Mass Spectrometry 26
2.6.5.1 Quadrupole MS 27

viii Contents
© 2010 Taylor & Francis Group, LLC
2.6.5.2 Ion Trap MS 282.6.5.3 Time-of-Flight (TOF) MS 282.6.5.4 Detection 282.6.5.5 Data Acquisition 29
Questions 30Further Reading 30
3 Basic Principles of Chromatography 31
3.1 Introduction 313.2 Theory of Chromatography 32
3.2.1 Capacity Factor 353.2.2 Column Efficiency 353.2.3 Asymmetry Factor 363.2.4 Resolution 38
Questions 38Further Reading 39
4 Method Development 41
4.1 Introduction 414.2 Influence of Sample Introduction Method 414.3 Influence of the Carrier Gas 424.4 Influence of the Column 424.5 Influence of Oven Temperature 434.6 Influence of the Detector 434.7 An Example 43Questions 47Further Reading 47
5 Quality Assurance and Method Validation 49
5.1 Quality Assurance 495.2 Quality Control 495.3 Why Be Quality Assured? 505.4 Ways to Ensure Quality of Product or Service 505.5 Instrument Qualification 515.6 Method Validation 52
5.6.1 What Is Method Validation? 525.6.2 Steps Involved in Method Validation 535.6.3 Validation Parameters 53
5.6.3.1 Linearity 535.6.3.2 Range 545.6.3.3 Accuracy 54

ixContents
© 2010 Taylor & Francis Group, LLC
5.6.3.4 Precision 545.6.3.5 Robustness 545.6.3.6 Specificity 555.6.3.7 Limit of Detection (LOD) 555.6.3.8 Limit of Quantitation (LOQ) 56
Questions 57Reference 57Further Reading 57
6 Troubleshooting in Gas Chromatography 59
6.1 Introduction 596.2 Baseline Disturbances 626.3 Irregular Peak Shapes 636.4 Retention Time Shifts 646.5 Loss of Separation or Resolution 656.6 Loss of Sensitivity 656.7 Rapid Column Deterioration 666.8 Ghost Peaks 66Question 67Further Reading 67
7 Developments in Gas Chromatography 69
7.1 Introduction 697.2 Developments in Sample Preparation Techniques 69
7.2.1 Sample Derivatisation to Aid Volatility for GC 697.2.1.1 Silylation 707.2.1.2 Acylation 71
7.2.2 Solid Phase Extraction and Use of Mixed Mode Cartridges 72
7.2.3 Headspace Analysis of Volatile Compounds 747.2.4 Microextraction by Packed Sorbent 77
7.3 Developments in Column Technology 787.3.1 Fast GC 787.3.2 Two-Dimensional GC 807.3.3 Ionic Liquid GC Columns 81
7.4 Developments in Instrumentation 827.4.1 Multicapillary Column–Gas Chromatography–
Ion Mobility Spectrometry (MCC-GC-IMS) 82Questions 84Reference 84Further Reading 84

x Contents
© 2010 Taylor & Francis Group, LLC
8 Forensic Applications of Gas Chromatography 85
8.1 Introduction 858.2 Drug Analysis 85
8.2.1 Introduction to Drug Analysis 858.2.2 Forensic Analysis of Drugs 858.2.3 Sample Types 868.2.4 Sample Preparation 868.2.5 Interpretation of Analytical Results 87
8.2.5.1 Natural Drugs 878.2.5.2 Semisynthetic Drugs 898.2.5.3 Synthetic Drugs 928.2.5.4 Designer Drugs 938.2.5.5 Over-the-Counter or Prescription-Only
Medication 938.3 Forensic Toxicology 95
8.3.1 Introduction to Forensic/Analytical Toxicology 958.3.2 Routes of Administration 988.3.3 Biological Specimens 1008.3.4 Sample Pretreatment 101
8.3.4.1 Protein Precipitation 1018.3.4.2 Hydrolysis 102
8.3.5 Extraction Techniques 1028.3.5.1 Liquid–Liquid Extraction 1028.3.5.2 Solid Phase Extraction 103
8.3.6 Interpretation of Analytical Results 1048.3.6.1 A Toxicology Example 104
8.4 Forensic Analysis of Fire Debris 1098.4.1 Combustion 1108.4.2 Hydrocarbon Fuels 111
8.4.2.1 Petrol 1128.4.2.2 Diesel 1138.4.2.3 Lighter Fluid 1138.4.2.4 Paint Thinner 114
8.4.3 Different Types of Fire 1148.4.4 Fire Investigation 1168.4.5 Sample Preparation 1178.4.6 Sample Introduction 1188.4.7 Interpretation of Analytical Results 118
8.4.7.1 Sample Introduction Method 1188.4.7.2 GC-MS Method 118
8.5 Paint Analysis 1248.5.1 Introduction to Colour and Paint Analysis 124

xiContents
© 2010 Taylor & Francis Group, LLC
8.5.2 What Is Colour? 1248.5.3 Why Are Pigment Molecules Coloured? 1258.5.4 Paint as Forensic Evidence 126
8.5.4.1 Colour Analysis 1268.6 Food and Fragrance Analysis 130
8.6.1 Introduction to Food and Fragrance Analysis 1308.6.2 Food Fraud 1308.6.3 Counterfeit Alcohol 1318.6.4 Adulterated Fragrances 131
Questions 134References 135Further Reading 135
Drugs 135Toxicology 135Fire 136Paint 136Food and Fragrances 136
9 Answers to Questions 137
Chapter 2 137Chapter 3 140Chapter 4 145Chapter 5 145Chapter 6 146Chapter 7 146Chapter 8 148
Glossary 153


xiii© 2010 Taylor & Francis Group, LLC
Series Preface
The Analytical Concepts in Forensic Chemistry Series has been written with the undergraduate and postgraduate student in mind. The emphasis in each book is placed upon the understanding of a specific analytical technique that is used in forensic chemistry disciplines. For example, two books from the series, Forensic Applications of High Performance Liquid Chromatography and Forensic Applications of Gas Chromatography, fully explain each tech-nique with examples from various sub-disciplines within forensic chemistry. As forensic chemistry is such a diverse field, this means that both the samples and the methods used in these analyses can be very different, and is what makes these analytical techniques all the more interesting.
Advances in instrumentation have taken place over the last 50 years or so and these advances and improvements continue today. Many of the instru-ment manufacturers involved in forensic science and other analytical chem-istry industries continually push the boundaries and strive to make their next model more innovative and easier for the scientist to use and maintain. This means that there will always be something new to consider in the application of analytical techniques, again making the subject and laboratory work all the more interesting.
Each book in the series covers an introduction to a particular technique, the components that make up the instrument, advances in the technology, method development and practical examples to aid understanding and to assist with troubleshooting. To bring the subject to life, examples from foren-sic chemistry casework such as paint analysis, toxicology and drug and fibre analysis have been used to explain the different procedures for sample prep-aration and analysis. Each of the chapters contains worked examples and questions that facilitate student learning and the further reading sections provide the reader with a starting point for greater exploration of each of the topics covered.
We hope that the books in this series will prove to be a valuable resource for students and those wishing to learn more about the analytical instrumen-tation used in forensic chemistry.
Michelle G. CarlinShirley O’Hare


xv© 2010 Taylor & Francis Group, LLC
Preface
This book has been written for university students studying forensic science, analytical chemistry, forensic chemistry or other courses where an element of gas chromatography is included within the curriculum. The aim of this book is to explain the theory of gas chromatography and to show the appli-cation of this knowledge to areas of forensic science that use this technique.
In the applications chapter (Chapter 8), the fields of forensic toxicology, forensic drug analysis, forensic fire analysis and forensic paint analysis have been included. The analysis of food and fragrances has also been included; although this is not typically associated with the world of forensic science, it is a subject that warrants some discussion due to the ever-increasing crime of fraudulent food and perfumes. Since the main subject of this book is gas chro-matography, applications of gas chromatography in these fields of forensic sci-ence have been provided. However, it should be noted that in all of forensic science, no one technique is used solely in the identification and/or quantita-tion of analytes in a matrix. Forensic science is a multidisciplinary subject and many analytical techniques will be used to assist in criminal investigations.
Chapters 2–8 have been broken down into theory, questions, and further reading. Chapter 8 explains the forensic applications of gas chromatography and, although it is one chapter, each topic (e.g., toxicology, fire and drugs) has been written as a subsection and includes an overview of the specific area, an application of gas chromatography, questions and a specific section listing further reading. Within each of these subsections where analyses have been carried out, the analytical methodologies and instrumental parameters have been provided so that it is possible for readers to use them.
Chapter 1 provides a brief introduction to gas chromatography and its use in forensic science. In Chapter 2, the various components that make up the gas chromatographic instrumentation are covered; it includes the differ-ences in gases used as the mobile phase modes of sample introduction, gas ovens, columns used as stationary phases and the various detectors com-monly used in gas chromatography in forensic science applications.
In Chapter 3, the theory of the separation process in gas chromatogra-phy is explained. These processes are discussed alongside the chemistry that underpins them. Chapter 4 focuses on method development in gas chroma-tography. A specific example of a separation of eight different compounds using gas chromatography-flame ionisation detector (GC-FID) is provided.

xvi Preface
© 2010 Taylor & Francis Group, LLC
However, the main points considered when carrying out method validation in gas chromatography are also covered. In Chapter 5, the subjects of quality assurance and method validation are covered. This chapter is written inten-tionally to be generic with some explanation of the use of these subjects in forensic science. The reason for this is that the quality aspects of laboratory operation can be applied to many types of analytical testing laboratories—not just in forensic science.
Chapter 6 covers troubleshooting in GC systems. It is vital to under-stand when something is not as it should be with a GC system and chro-matograms and associated mass spectra. The main problems encountered in GC troubleshooting are covered alongside an explanation of why these problems exist. Solutions for reducing or eliminating these factors are also provided. Chapter 7 focuses on developments in gas chromatography. As with all technology, advances in gas chromatography columns and detectors will inevitably occur. Some of the most recent and significant advances in gas chromatography are explained.
Chapter 8 is broken down into five subsections: 8.2—drugs, 8.3—toxi-cology, 8.4—fire, 8.5—paint, and 8.6—food and fragrance. As has been pre-viously mentioned, each subsection includes an introduction to the topic, applications of gas chromatography in that field, interpretation of analyti-cal data with real examples and a series of questions. As with all chapters, a ‘Further Reading’ section is included and is divided into literature on each of the subsections.
We hope that you find this book of use to you in your academic studies and that you find the examples of forensic applications beneficial in under-standing gas chromatography.
Special thanks to Dr Brian Singer for his contribution of expert knowledge and examples provided for use in Section 8.5 in Chapter 8 (paint analysis).
Michelle G. CarlinJohn R. Dean

xvii© 2010 Taylor & Francis Group, LLC
Acknowledgements
The following are thanked for providing figures and tables used in this book.
Lynne Dean for Figures 2.7, 2.8, 2.14, 2.15, 2.16, and 2.17.Shirley O’Hare (Teesside University) for Figure 8.38 and Table 8.8.Cathy Kelland (Northumbria University) for Figure 8.28.Dr Alan Langford (Northumbria University) for Table 8.3.Edwin Ludkin (Northumbria University) for Figures 2.1 and 2.4.Gary Noble for Table 8.1.Dr Brian Singer (Northumbria University) for Figure 8.36 and Tables 8.6
and 8.7.CTC for permission to publish Figure 2.5.Restek for permission to publish Figures 6.1 and 6.2.SGE Analytical Science for permission to publish Figure 7.8.Sigma Aldrich for permission to publish Figures 7.9, 7.11, and 7.12.GAS (Dortmund) for permission to publish Figures 7.13 and 7.14.


xix© 2010 Taylor & Francis Group, LLC
About the Authors
Michelle Groves Carlin, MSc, BSc (Hons), MRSC, CChem, studied at Heriot-Watt University on the honours program in colour chemistry with a spell in a dyehouse in the Scottish Borders before embarking on a career in analytical chemistry. After some time spent in a contract research organisation in Edinburgh, Michelle went on to continue her education with an MSc in forensic science from Strathclyde University. A research project was carried out in the toxicology department of the Institut de Recherche Criminelle de la Gendarmerie Nationale (IRCGN) in Paris, using LC-ESI-MS.
After this, Michelle became the manager of a workplace drug testing laboratory in the north east of England before taking up a teaching position as lecturer in forensic science at Teesside University, where she spent 3 years. In 2009, Michelle moved to Northumbria University as a senior lecturer in forensic chemistry, where she carries out research in analytical toxicology.
John R. Dean, DSc, PhD, DIC, MSc, BSc, FRSC, CChem, CSci, Cert. Ed., took his first degree in chemistry at the University of Manchester Institute of Science and Technology (UMIST), followed by an MSc in analytical chem-istry and instrumentation at Loughborough University of Technology, and finally a PhD and DIC in physical chemistry at Imperial College of Science and Technology, London. He then spent 2 years as a postdoctoral research fellow at the Food Science Laboratory of the Ministry of Agriculture, Fisheries and Food in Norwich in conjunction with Polytechnic South West in Plymouth (now Plymouth University). The work was focused on the development of directly coupled high performance liquid chromatography inductively cou-pled plasma mass spectrometry methods for trace element speciation in foodstuffs. This was followed by a temporary lectureship in inorganic chem-istry at Huddersfield Polytechnic (now University of Huddersfield).
In 1988 he was appointed to a lectureship in inorganic/analytical chem-istry at Newcastle Polytechnic (now Northumbria University). This was followed by promotions to senior lecturer (1990), reader (1994), principal lecturer (1998) and associate dean (research; 2004). He was also awarded a personal chair in 2004. In 2008 he became the director (now head) of the graduate school at Northumbria University as well as professor of analytical and environmental sciences in the School of Applied Sciences (now Faculty of Health and Life Sciences).

xx About the Authors
© 2010 Taylor & Francis Group, LLC
In 1998 he was awarded a DSc (London) in analytical and environmen-tal science and was the recipient of the 23rd SAC Silver Medal in 1995. He has published extensively in analytical and environmental science. John is an active member of the Royal Society of Chemistry Analytical Division having served for three terms on the Analytical Division Council and is a former vice president (2002–2004). He is also a current member of RSC/AD north east region.

1© 2010 Taylor & Francis Group, LLC
Introduction to Gas Chromatography
Gas chromatography is an analytical technique used to separate volatile organic compounds. In the most generic form, chromatography is based on the separation of compounds (or ions) present in a sample matrix. A whole range of chromatographic techniques is available in the laboratory that, as well as gas chromatography (GC), includes high-performance liquid chromatogra-phy (HPLC), ion exchange chromatography (IEC), thin layer chromatography (TLC), and size exclusion (or gel permeation) chromatography (SEC(GPC)).
Each type of chromatographic technique has its own area of application based on the sample type, the analytes to be separated, the column technol-ogy used to separate the analytes and type of detection system. Typically, though, the sample must be in solution (either aqueous or organic) prior to its introduction into the chromatograph. So a modern chromatographic system is a sophisticated instrument that requires both technical expertise to use and a combined practical and theoretical approach to utilize and maximize its output fully.
Coupled inextricably with the chromatographic instrument is the inge-nuity that has been applied to prepare samples (and their inherent matri-ces) for analysis of their analytes. These procedures range from the simple dilution aspect through concentration or cleanup approaches to chemical modification of the analytes to make them amenable to the specific chro-matography system. None of these systems, if they may be termed that, are static. Developments take place on a regular basis in terms of different sam-ple introduction/preparation, column technologies and detection systems; sometimes they may be referred to as evolutionary and, occasionally, revo-lutionary. All of this makes chromatography an exciting discipline both to study and to use.
As already indicated, GC is responsible for the separation of volatile organic compounds (VOCs). The first description of gas chromatography was by James and Martin in 1952.1 Their instrument, by definition as the first, was very different from what we see today in the analytical laboratory. The instrumental developments and corporate imagery applied by the mod-ern GC manufacturers (Table 1.1) that have taken place over the past 60 years make the technique one of the cornerstones of the analytical laboratory. Of course, without a detector, nothing can be detected after the GC separa-tion. So the significant development of a range of detectors has been very
1

2 Forensic Applications of Gas Chromatography
© 2010 Taylor & Francis Group, LLC
Table 1.1 Selected Manufacturers of Gas Chromatography Systemsa
Name of Company Internet Address Comments
AGC Instruments www.agc-instruments.com Process systemsAgilent Technologies www.agilent.com Analytical systemsAlpha MOS www.alpha-mos.com Analytical and online
(portable) systemsAmetek Process Instruments www.ametekpi.com Portable and process systemsAzbil www.azbil.com Process systemsBruker www.bruker.com Analytical and portable
systemsBuck Scientific www.bucksci.com Analytical and portable
systemsCE Instruments www.ceinstruments.co.uk Analytical systemsChromatotec www.chromatotec.com Natural gas systemsDani Instruments www.danispa.it Analytical systemsEmerson Process Management
www2.emersonprocess.com Process GC systems
Galvanic Applied Sciences, Inc.
www.galvanic.com Process systems
GAS www.gas-dortmund.com Portable and analytical systems
Gow Mac Instrument Co. www.gow-mac.com Analytical systemHuberg www.huberg.com Portable systemInficon www.inficon.com Portable systemJeol www.jeol.com GC-MS systemKoehler www.koehlerinstrument.com Portable systemLab Kits www.lab-kits.com Analytical systemsLab Logic www.lablogic.com Radio GC systemLeco www.leco.com GC-MS systemPerkin Elmer www.perkinelmer.com Analytical systemsPG Instruments Ltd www.pginstruments.com Analytical systemPID Analyzers www.hnu.com Portable systemRMG www.rmg.com Process systemsShimadzu www.shimadzu.com Analytical systemsSiemens www.automation.siemens.com Process systemTeledyne Analytical Instruments
www.teledyne-ai.com Process system
Thermo Scientific www.thermoscientific.com Analytical systemsWaters www.waters.com GC-MS systemYokogawa www.yokogawa.com Process GC systemsa Includes analytical, portable and process GC instrument suppliers.

3Introduction to Gas Chromatography
© 2010 Taylor & Francis Group, LLC
important from that first paper1 in which they used an automated titration system as the detector.
More familiar to us today are the flame ionisation detector (FID),2,3 nitrogen-phosphorus detector (or thermionic detector),4,5 electron capture detector (ECD),6 flame photometric detector7 and the mass spectrometer (with selected ion monitoring capability).8 It is also necessary to comprehend that, without the development of the split/splitless injector,9 sample introduc-tion was difficult. In this book, every example and description relates to the use of a fused-silica capillary column (invented in 197910)—a very standard type of column that has led to the separation of complex mixtures in the GC laboratory. For a fuller history of GC, the reader is referred to an article writ-ten at the 50th anniversary of GC.11
The coupling of GC with a suitable detection system makes it a very pow-erful tool in the forensic scientists’ arsenal of analytical techniques. Forensic science is a very wide and varied subject that covers drug analysis, toxicology and fire debris analysis.
Depending upon the detector used, GC can provide both qualitative and quantitative data, for example, the identification and quantitation of diacetyl-morphine in a suspected sample of heroin, the identification of an accelerant used at a fire scene and the identification and quantitation of the methanol present in illicit alcohol. Within each field of forensic science, many types of analytical methods and techniques will be used to identify and quantify (if necessary) the components present in a sample as well as to compare one sample to another. However, it is important to realize that forensic scientists do not rely on the one ‘magic’ black box to solve a problem. Often, GC as well as a range of other analytical techniques is required to address the forensic sample; skilful interpretation of the whole data profile allows the complex problem to be solved.
References 1. James, A. T., and A. J. P. Martin. 1952. Biochemical Journal 50:679. 2. Harley, J., W. Nel and V. Pretorius. 1958. Nature 181:177. 3. McWilliam, I. G., and R. A. Dewar. 1958. Nature 181:760. 4. Karmen, A., and L. Giuffrida. 1964. Nature 201:1204. 5. Kolb, B., and J. Bischoff. 1974. Journal of Chromatographic Science 12:625. 6. Lovelock, J. E., and S. R. Lipsky. 1960. Journal of American Chemical Society
82:431. 7. Brody, S. S., and J. E. Chaney. 1966. Journal of Gas Chromatography 4:42. 8. Hammer, G., B. Holmstedt and R. Ryhage. 1968. Analytical Biochemistry 25:532. 9. Desty, D. H., A. Goldup and B. A. F. Whyman. 1959. Journal of Institute of
Petroleum 45:287.

4 Forensic Applications of Gas Chromatography
© 2010 Taylor & Francis Group, LLC
10. Dandeneau, R. D., and E. H. Zerenner. 1979. Journal of High Resonance Chromatography 2:351.
11. Bartle, K. D., and P. Myers. 2002. Trends in Analytical Chemistry 21:547.

5© 2010 Taylor & Francis Group, LLC
Instrumentation for Gas Chromatography
2.1 Introduction
Key to the success of gas chromatography as a separation technique are the advances, some small and some large, in the evolution of the instrumenta-tion. A basic instrumental layout for a capillary gas chromatography (GC) instrument is shown in Figure 2.1. The main instrumental components of a gas chromatograph are
• Gas supply• Sample introduction system• Column oven• Column• Detector• Read-out device, typically a computer with appropriate software
that allows, as a minimum, integration and display of peak area and peak height. In addition, it is likely that a host of other variables are available that contribute to the determination of more fundamental parameters (e.g., retention time), as described in Chapter 3.
Each of these components will now be discussed and its critical operational aspects reviewed.
2.2 Choice of Gas
The choice of carrier gas for GC is one of the key aspects that ultimately determine the performance of the system. Theoretically, a comparison of GC performance (i.e., efficiency; see Section 3.2.2) can be assessed using the van Deemter plot (Figure 2.2).
However, often the choice of gas for GC is determined based on two basic principles: availability at a specific cost suitable for analysis and the optimum gas for a specific task, which leads to enhanced performance. Normally, the former would result in the use of nitrogen as the carrier gas, particularly when a flame ionisation detector is used (see Section 2.6.1), while the lat-ter would be done using helium when a mass spectrometer is used as the
2

6 Forensic Applications of Gas Chromatography
© 2010 Taylor & Francis Group, LLC
detector (see Section 2.6.5). (Note: An additional gas may be required as fuel for the detector—for example, hydrogen and air for a flame ionisation detec-tor; see Section 2.6.)
2.2.1 Gas Purity
As well as the choice of gas, another important quality is its purity. Gas impu-rities would manifest themselves in the resultant chromatogram generated
1.4
1.2
0.8
0.6
0.4
0.2
1
00 20 1008060
Average Linear Velocity (cm/s)
HET
P (m
m)
40
NitrogenHydrogenHelium
Figure 2.2 Van Deemter plot: influence of carrier gas on column efficiency (as HETP).
Chromatogram
Computer Column
Oven
DetectorInjection port
Syringe
Figure 2.1 Schematic diagram of a gas chromatograph.

7Instrumentation for Gas Chromatography
© 2010 Taylor & Francis Group, LLC
by the GC; impurities within the gas supply will appear as either unwanted peaks or peak deterioration over time within the chromatogram. Therefore, it is important to use carrier gases with high purity (e.g., 99.9995% purity). Typical impurities that can occur in the carrier gas are oxygen, water, and hydrocarbons. However, purchasing a high-purity carrier gas is not the end of the story. It is possible for impurities (principally oxygen and water) to become entailed with the carrier gas stream downstream of the supply (cylinder or generator) due to minuscule leakages in the connector fittings. One way to reduce their input into the carrier stream is to introduce a trap in-line between the carrier gas source and the sample introduction system (Figure 2.3). Typically, a trap is added in-line that has the following sequence: a molecular sieve (to remove moisture), hydrocarbon trap (removes hydro-carbons and prevents contamination of the oxygen trap) and an oxygen scrubber (to remove oxygen).
When installing a trap it should be positioned vertically to prevent chan-nelling; channelling occurs as a result of the settling of the material within the trap, leading to the potential for less interaction between the carrier gas and the trap material.
2.2.2 Electronic Pressure Control Devices
The use of electronic pressure control (EPC) devices incorporating mass flow controllers maintains a steady flow of carrier gas through the GC. The use of the EPC acts to minimise or reduce pressure surges as a result of the sample introduction process (see Section 2.3) that would lead to chromato-gram baseline disturbances and drift (see Chapter 6). The use of an EPC also compensates for viscosity changes in the carrier gas resulting from the use of temperature programming in the separation process (see Section 2.4).
2.2.3 Gas Cylinders or Generators
Traditionally, the use of gas cylinders as the source of the carrier gas (and fuel gas) was common. However, having multiple high-pressure (e.g., 2000–3000 psig) cylinders in the laboratory environment (albeit chained to a bench or wall) raises significant potential safety issues. In most cases, therefore, the use
Figure 2.3 An example of an in-line trap to remove moisture and oxygen.

8 Forensic Applications of Gas Chromatography
© 2010 Taylor & Francis Group, LLC
of a generator is preferred and often adopted within laboratories. Typically, a generator could be located within the laboratory or an adjoining location (i.e., a separate room) and connected to a GC or a series of GCs effectively and efficiently. Gas generators are available for nitrogen, hydrogen and air. Attached to the gas cylinder (or generator) is a regulator that controls the pressure of the gas released to the GC as well as indicating the amount of gas left in the case of the cylinder.
2.3 Sample Introduction
Introducing a sample (or calibration standard) into a GC requires some prior preparation. Extensive examples of the processes involved are described in Chapter 8 with a specific focus on forensic analysis. In general terms, how-ever, the most common method of sample introduction is the split/splitless injector, which relies on the use of a (precision-made) syringe (Figure 2.4). Typically, the syringe will deliver precisely 1 μL of sample (or calibration standard) into the GC sample introduction system.
The syringe can be operated manually either by the scientist injecting the sample into the GC or by an autosampler (Figure 2.5) in which the syringe is located. The use of an autosampler is a more robust approach to reproducibly inject samples into a GC system. Nevertheless, scientists can reproducibly inject samples (calibration standards) provided they are meticulous and dili-gent in their use of the syringe. It is typical when using this mode of sample introduction that an internal standard is added to the sample or standard to allow for any inconsistency in the operation of the syringe by the scientist or autosampler. In reality, in a forensic laboratory manual injection would rarely be used. The added advantage of using the autosampler is that the forensic scientist is free to perform other tasks while the samples are being analysed.
An important component within the GC sample introduction system is the injection port. The injection port is (a) heated independently of the GC
Sample Needle
PTFEseal Steel
liner
Plunger
Glass graduatedbarrel
Steel lockingnut
Fine steelwire plunger
Figure 2.4 Syringe for sample introduction.

9Instrumentation for Gas Chromatography
© 2010 Taylor & Francis Group, LLC
column oven, and (b) the location where the injected analytes (compounds), in organic solvent, are vapourised and transported onto the column. Another important part within the injection port is the inlet liner (Figure 2.6). A range of different inlet liners is available; their principal functions are to limit sample degradation and enhance vapourisation while at the same time guiding the syringe needle into the correct position when using, for example, a split/splitless injector. The choice of inlet liner can have a striking effect on the resultant chromatogram and hence its selection is important.
Typical problems associated with the incorrect choice of liner include the potential for peak tailing (see Section 3.2.3) and mass discrimination (i.e., incomplete vapourisation of the analytes prior to introduction onto the col-umn). It is also important when selecting the inlet liner that its volume be larger than the amount of sample injected by the syringe (typically 1 μL) and that it does not react with the sample (important if analysing polar analytes). In the case of the latter, the remedy is to use an inlet liner that has been deac-tivated. As the liner is made of glass, it has the same inherent issue of not being inert as it contains unreacted silanol groups that are going to interact with polar analytes; the process of silanisation by the manufacturer of the inlet liner is one way to deactivate the silanol groups).
In addition, glass wool may have been added within the inlet liner; the presence of glass wool contributes to an increase in vapourisation surface area for the sample or standard, as well as promoting more efficient mixing with the carrier gas.
Moving arm of autosampler
Sample tray
Rinse solutions
Autosampler controllerSyringe holder
Figure 2.5 Typical autosampler for sample introduction. (Source: Hamilton, www.hamiltoncompany.com. With permission from CTC.)

10 Forensic Applications of Gas Chromatography
© 2010 Taylor & Francis Group, LLC
A range of different sample injection devices is based around the injec-tion port, and these will now be discussed.
2.3.1 Split/Splitless Injector
The split/splitless injector (Figure 2.7) comprises a heated chamber contain-ing a glass liner (Figure 2.6) into which the sample is injected through a sep-tum by a syringe (manually or by an autosampler). The chamber is heated independently of the chromatographic oven; typically, this will mean that the injection chamber may be heated to, for example, 270°C, while the column oven may be at 90°C. The injected sample vapourises rapidly to form a mix-ture of carrier gas, solvent vapour and vapourised solutes. A portion of this vapour mixture passes onto the column but the greater volume leaves through the split valve exit. These amounts are predetermined by the operator using the split valve. The ratio of the split flow to the column flow rate is called the split ratio; ratios of 50:1 and 100:1 are common. For example, in a 50:1 split ratio, one part of the injected sample enters the column while the other 50 parts are vented, via a trap, to waste. A disadvantage of this type of injector is the possibility of discrimination (i.e., production of a chromatogram that is not truly representative of the actual composition of the mixture).
2.3.2 On-Column Injector
The on-column injector is designed to allow the entire sample to be intro-duced directly into the capillary column. Typically, this requires a special
Figure 2.6 Inlet liner designs for injection port.

11Instrumentation for Gas Chromatography
© 2010 Taylor & Francis Group, LLC
syringe that has a fine needle that can be inserted into the capillary column. On-column injection is a nonvapourising technique, as the sample reaches the column as a liquid. A disadvantage of this type of injector is that the inter-nal surface of the column stationary phase will be damaged by the insertion of the syringe needle unless a retention gap is attached to the column. (Note: A retention gap is a short length of capillary tubing without the stationary phase being present on its internal surface.)
2.3.3 Programmed Temperature Vapourisation Injector
A programmed temperature vapourisation (PTV) injector (Figure 2.8) is a combined modified version of the split/splitless and on-column injectors. The sample is introduced into a cold chamber and is then subjected to rapid heating to affect vapourisation of the sample. The major advantage of this approach is that the sample volume can be relatively large (up to 250 μL, compared to 1 μL in the case of the split/splitless injector). This large volume injection
Septum
Split outlet
Column
Liner
Carrier gas
Figure 2.7 Split/splitless injector.

12 Forensic Applications of Gas Chromatography
© 2010 Taylor & Francis Group, LLC
technique could be used for analysis of analytes at known low concentration in samples; the introduction of a large sample volume will improve the over-all instrument sensitivity. A disadvantage of the PTV is the level of method development required to achieve a reproducible and effective injection.
2.3.4 Thermal Desorption
Thermal desorption refers to the use of heat to remove volatile organic com-pounds (VOCs) from a trap (containing a sorbent, e.g., Tenax™); the desorbed VOCs are then transferred, via a heated transfer line, directly to the inlet of the GC (Figure 2.9). This approach is commonly used for either occupational health monitoring or air sampling. In the former case, the approach is used
Column
Split outlet
Liner
Carrier gas
Septum
Heating coil
Figure 2.8 Programmed temperature vapouriser injector.

13Instrumentation for Gas Chromatography
© 2010 Taylor & Francis Group, LLC
to assess the risk to humans working in situations for which long-term expo-sure would give them health problems either imminently or in the future. In the latter case, the approach is used to sample the air emitted from either an industrial process or sample. In either case, the most effective approach is to use passive samplers, in which compounds in the atmosphere are immobil-ised on a sorbent, or to actively pump the atmosphere through the sorbent (and trap the VOCs).
2.3.5 Purge and Trap
In purge and trap, the liquid sample is placed in a container (Figure 2.10) through which an inert gas is passed (e.g., N2 for GC-FID). The “purged” VOCs are then “trapped” on a sorbent (e.g., Tenax). Then, by reversing the gas flow and applying heat to the trap, the concentrated VOCs are directly transferred to the GC. Purge and trap could be used to identify suspect BTEX (benzene, toluene, ethylbenzene, and xylenes) samples that have occurred as a result of an accidental spillage from a vehicle, resulting in contamination of a natural water source (e.g., a river).
2.3.6 Pyrolysis
The application of high temperature directly to a sample (e.g., forensic, art material, environmental, polymer or biological) allows larger molecules to be thermally broken down into smaller molecules. In pyrolysis GC, a small
Column
Trap
GC columnVent
Indicates sample pathway
Compoundsdeposited
Desorb gas
Carrier gas
Figure 2.9 Thermal desorption system.

14 Forensic Applications of Gas Chromatography
© 2010 Taylor & Francis Group, LLC
sample (<0.5 g) is rapidly heated (between 500°C and 1200°C) in a pyrolysis unit and directly transferred by an inert carrier stream to the inlet of the GC. As the identity or chemical breakdown products need to be identified, a GC-MS is required. Pyrolysis GC-MS could therefore be applied to assist, for example, in the establishment of the authenticity of a work of art.
2.4 Column Oven
The chromatographic column is located in an oven (Figure 2.11). The tem-perature of the oven is controlled accurately and precisely and its operation is crucial in maintaining reproducible separation by the column. The column oven must be capable of delivering the desired temperature to within ±0.1°C. In addition, the oven must be thermally insulated from both the indepen-dently heated injection port (see Section 2.3) and the detector and its compo-nents (see Section 2.6). Typically, the column oven should be able to deliver the desired temperature range from ambient (room) temperature up to 400°C. The column oven is operated in two modes that affect the separation capability of the technique: isothermal and temperature-programmed GC. In isothermal operating mode, the column oven maintains a fixed, constant temperature as predetermined by the scientist (e.g., 100°C) for the duration of the chromatographic run. In temperature-programmed GC, the tempera-ture of the column oven is varied throughout the chromatographic run (e.g.,
Purge gasin
Trap
GC columnVent
Indicates sample pathway
Compoundsdeposited
Figure 2.10 Purge and trap system.

15Instrumentation for Gas Chromatography
© 2010 Taylor & Francis Group, LLC
50°C for 2 min followed by a linear temperature gradient at 10°C/min up to a temperature of 220°C, with a final hold temperature of 2 min.
In this situation, the column oven is now capable of delivering rapid cooling, allowing the temperature in the oven (and hence the column) to be returned to the starting temperature (i.e., 50°C in this example). For fur-ther details of the method development opportunities that isothermal and temperature-programmed GC provides, see Chapter 4.
2.5 GC Columns
In capillary GC, the forensic scientist needs to consider four important parameters in selecting a column for separation:
• The stationary phase• Internal diameter of the column
(a)
(b)
Injector – column inlet
Column – detector outlet
See (b) for close up
Figure 2.11 GC oven: (a) in situ column, and (b) close-up of injection port con-nection and outlet to detector.

16 Forensic Applications of Gas Chromatography
© 2010 Taylor & Francis Group, LLC
• Length of the capillary column• Film thickness of the stationary phase
Each of these parameters can have a significant impact on the ability to sepa-rate the compounds of interest. The basic anatomy of a capillary GC col-umn is shown in Figure 2.12(a) as well as a photograph of a capillary column coiled and mounted on a circular metal frame or ‘cage’ in Figure 2.12(b).
The stationary phase is chemically immobilised on the internal surface of a fused silica tube. However, the brittle nature of the fused silica requires that it be coated in a polymer (i.e., polyimide) that provides rigidity and flexibility to the column as well as giving the GC column its overall brown colouration.
2.5.1 Stationary Phase Selection
Perhaps the most important of the four parameters is the choice of stationary phase. The most commonly used stationary phases are based on polysiloxane (Figure 2.13). Using the adage that ‘like dissolves like’, it would be appropri-ate to try to match the stationary phase polarity with the polarities of the compounds to be separated (e.g., for nonpolar compounds choose a nonpo-lar stationary phase—that is, 100% polydimethylsiloxane. (Note: Nonpolar
Support ‘cage’Capillary column
(b) Photograph of a typical GC column coiled and mounted on a circular ‘cage’
(a) Schematic diagram of the physical construction of a typical GC column
Polyimide coating
Fused-silica
Stationary phase
Figure 2.12 Capillary gas chromatography column: physical characteristics.

17Instrumentation for Gas Chromatography
© 2010 Taylor & Francis Group, LLC
compounds are normally made up of atoms of carbon and hydrogen only; in addition, they would typically contain carbon–carbon single bonds.)
The interactions between a nonpolar compound and a nonpolar station-ary phase are mainly governed by Van der Waals forces. In contrast, polar compounds and a polar stationary phase are mainly governed by dipole, π–π, and/or acid–base interactions. Table 2.1 summarises the rationale for sta-tionary phase selection.
A general ‘rule of thumb’ is to use the stationary phase that is least polar to produce the separation required (i.e., satisfactory resolution between neighbouring peaks in the shortest analysis time). A good starting position
(a) Poly(dimethyl)siloxane
Si
CH3
CH3
O
100% poly(dimethyl)siloxane: equivalent to a DB-1, HP-1, RTX-1, BP-1 or SPB-1 stationaryphase.
(b) Poly(dimethyl, diphenyl)siloxane
O
CH3
CH3
Si
5% 95%5% diphenyl-95% dimethyl polysiloxane: equivalent to a DB-5, HP-5, RTX-5, BP-5 and
SPB-5 stationary phase
(c) 14% cyanopropylphenyl 86% dimethyl polysiloxane
OSi Si
CH3
CH3
O
(CH2)3
C N
14% 86%
14% cyanopropylphenyl 86% dimethyl polysiloxane: equivalent to a DB-1701, PAS-1701,RTX-1701, BP-10 and SPB-1701 stationary phase.
Si O
Figure 2.13 Chemical structures of common GC stationary phases.

18 Forensic Applications of Gas Chromatography
© 2010 Taylor & Francis Group, LLC
is to select a DB-1 or DB-5* equivalent column. GC column manufactur-ers produce catalogues that describe the performance of their different columns with respect to different applications. By comparison of the chro-matogram produced by a specific column under specified operating condi-tions, it is possible to identify a satisfactory column for a specific application. Manufacturers generally catalogue chromatograms based on the following application areas: environmental; chemical; food, flavours and fragrances; forensic; and fuels and petrochemicals. Some example capillary GC columns as used in forensic applications are shown in Table 2.2.
* The different manufacturers of GC columns use specific alpha and numeric system designations to identify their brand of column; fortunately, they often retain the same numeric values to allow cross reference from one manufacturer to another. For example, a DB-5 (from J&W) is similar to an HP-5 (from Agilent) as well as an RTX-5 (from Restek), a BP-5 (from SGE), and an SPB-5 (from Supelco); other examples are shown in Table 2.3.
Table 2.1 General Guidance on Capillary GC Stationary Phase Selection
Compound Polarity
General Characteristics of Compound Example Compounds
Typical Example Stationary Phases
Nonpolar C and H only; C-C bonds Alkanes DB-1Polar Mainly C and H atoms
but also O, N and SAlcohols, amines, carboxylic acids, ketones
DB-35
Polarisable C and H only; C = C or C≡C bonds
Alkenes, alkynes, aromatic hydrocarbons
DB-FFAP
Table 2.2 Example Capillary GC Stationary Phases Used in Forensic Analysis
Forensic Application Typical Stationary Phases
Accelerants DB-1 or DB-5MSBlood alcohol DB-1Barbiturates DB-5MSCannabinoids (TMSa) DB-5MSCocaine (TMSa) DB-5MSInhalants DB-5MSLSD (TMSa) DB-5MSOpiates (TMSa) DB-5MSSteroids DB-5MSTryptamines DB-5MSa TMS = trimethylsiloxane derivative.

19Instrumentation for Gas Chromatography
© 2010 Taylor & Francis Group, LLC
2.5.2 Internal Diameter of the Column
The internal diameter (i.d.) of a capillary column normally varies between 0.1 and 0.53 mm. Unless a specific application warrants the use of a narrow-bore column (e.g., a fast capillary column uses a 0.1 mm i.d. column or a sample with significantly varying concentrations of its components requires the use of a >0.25 mm i.d. column to avoid column overload), then a 0.25 mm i.d. column can be used. In general terms, a smaller internal diameter column (e.g., 0.25 mm) will give good resolution of early eluting compounds, but lead to longer analysis times and produce a limited linear dynamic range. In con-trast, columns with a larger internal diameter (e.g., 0.53 mm) will result in less resolution for early eluting compounds, but allow shorter analysis times with sufficient resolution for complex mixtures and with a greater linear dynamic range. It is not uncommon in forensic toxicology to use wide-bore columns for the analysis of alcohol and other compounds in biological matrices.
2.5.3 Length of the Capillary Column
The length of a capillary column normally varies between 10 and 60 m. Typically, a column length of 30 m will act as a good starting point in
Table 2.3 Example Capillary GC Stationary Phase Equivalency by Manufacturer
Example Stationary Phases and Their Equivalents Stationary Phase Characteristics
DB-1; SPB-1; Equity-1; HP-1; ZB-1; RTX-1; BP-1
A general purpose phase where a nonpolar column is required. Compounds separated mainly on the basis of their boiling points. A poly(dimethylsiloxane) bonded phase. Typical operating temperature range of –60°C to 325°C.
DB-5MS; SLB-5MS; HP-5MS; ZB-5MS; RTX-5ilMS, BPX5
A general purpose phase where a nonpolar column is required; low column bleed characteristics. Compounds separated mainly on the basis of their boiling points with more selectivity for aromatic compounds. A cross-linked poly 95% dimethyl 5% diphenylsiloxane bonded phase. Typical operating temperature range of –60°C to 325°C.
DB-35; SPB-35; HP-35; ZB-35; RTX-35
A stationary phase that is useful for separation of polar compounds. Polar compounds are retained longer than nonpolar compounds. A cross-linked poly 65% dimethyl 35% diphenylsiloxane bonded phase. Typical operating temperature range of 0°C to 320°C.
DB-FFAP; SPB-1000; HP-FFAP; ZB-FFAP; BP21
A stationary phase that is useful for separation of volatile acid compounds and glycols. An acid-modified poly(ethyleneglycol) bonded phase. Typical operating temperature range of 60°C to 200°C.
Note: Manufacturer information: DB = J&W; SPB or SLB = Supelco; HP = Agilent; ZB = Phenomenx; RTX = Restek; BP = SGE.

20 Forensic Applications of Gas Chromatography
© 2010 Taylor & Francis Group, LLC
developing a separation. For faster analyses, a shorter column may be benefi-cial, provided the compounds are either well separated or few in number. In contrast, a longer column (60 m) may be required when separation of com-pounds is not possible by using a smaller internal diameter column, using a different stationary phase, or altering the column temperature.
2.5.4 Thickness of the Stationary Phase
The thickness of the stationary phase of a capillary column normally varies between 0.1 and 5 μm. Typically, increasing the film thickness (i.e., thickness of the stationary phase) will result in more retention of the compounds, as well as more sample capacity but with an overall lowering in column effi-ciency (see Section 3.2.2). In general terms, a thin film thickness is good for separating high boiling point compounds leading to decreased analy-sis times. In contrast, a thicker film thickness is best for low boiling point compounds resulting in improved resolution of early eluting compounds but with increased overall analysis times. A good starting column for method development would have a film thickness of 0.25 μm.
2.5.5 Overall Description of a Capillary Column
Finally, it is typical to describe a capillary GC column using the following nomenclature:
DB-5 30 m × 0.25 mm i.d. × 0.25 μm film thickness
This is the manufacturer (as identified by the letters at the start), followed by the number that identifies the stationary phase composition of the polysilox-ane, followed by the column length × the internal diameter of the capillary column × the dimensions of the film thickness (i.e., thickness of the station-ary phase) as described by the manufacturer and numerical code.
In addition, the use of either isothermal or temperature-programmed GC will also influence the separation. In isothermal analysis, the retention of compounds is more dependent on the column length such that a doubling of column length will double the analysis time. However, doubling the column length increases the resolution by 41% (see Section 3.2.4).
In contrast, in temperature-programmed GC, the retention is more depen-dent on temperature such that doubling the column length marginally increases analysis time. However, the chromatographic temperature-programmed oper-ating conditions need to be optimised to achieve an optimum separation.
For details of the influence on chromatographic separation of varying the stationary phase, column internal diameter, film thickness and column length, see Chapter 4.

21Instrumentation for Gas Chromatography
© 2010 Taylor & Francis Group, LLC
2.6 Detectors
The purpose of the detector is to respond rapidly to a compound passing from the column in the gas phase and then return to its original state and be ready to record the next eluting compound. A range of detectors can be used for GC, and the most common will be described. It is important in considering any detector to be aware of the following key performance characteristics:
• Noise: Any perturbation of the detector signal not related to an elut-ing compound is described as detector noise. Ultimately, the pres-ence of this type of signal response will limit the overall sensitivity of the GC system. It can be quantified by determining the average amplitude of the background variation of the baseline in the absence of a known eluting compound.
• Sensitivity: This is defined as the change in detector signal as a result of the change in concentration (or mass) of an eluting compound. Sensitivity can be calculated by plotting the signal response versus the compound concentration; the slope of the resultant calibration plot is the sensitivity (S).
• Limit of detection (LOD): This is often described as the concen-tration of compound that produces a signal (e.g., peak area) corre-sponding to a signal-to-noise (s/n) ratio of 2 (or 3). The LOD can be calculated as follows:
LOD = [3. N]/[S. w0.5] (2.1)
where 3 = the proposed basis of the s/n ratio, N = noise, S = sensitiv-ity, and w0.5 = peak width at half its height.
• Dynamic range: This is a measure of the concentration range over which the detector shows an incremental increase in response (sig-nal) for an increase in concentration of the compound. The most useful and significant dynamic range is when the response change occurs in a linear manner (i.e., linear dynamic range). The linear dynamic range for the detector is used to calculate the sensitivity of the detector. An order of magnitude is often applied to dynamic range; one order of magnitude refers to an increasing signal response over, for example, a concentration of between 0.1 and 1.0 (i.e., a 101 order of magnitude).
• Selectivity: A GC detector can be classified as either selective or uni-versal. In the case of a selective detector, it will produce a heightened response for certain types of atoms in a compound, whereas a uni-versal detector will respond to any eluting compound in the sample.

22 Forensic Applications of Gas Chromatography
© 2010 Taylor & Francis Group, LLC
2.6.1 Flame Ionisation Detector
A flame ionisation detector (FID) is classified as a universal detector as it responds to all organic compounds, has an excellent linear dynamic range (up to 107 orders of magnitude) and has no or little response to carrier gas impurities such as CO2 and water. For these reasons, the FID is the most pop-ular detector for GC. The typical carrier gas for GC-FID is nitrogen. A FID (Figure 2.14) consists of a small hydrogen-air flame located at the end of the jet to which the end of the chromatographic column is attached. Additional makeup gas may be added to supplement the carrier gas through the column. As the eluting organic compounds exit the column and enter the flame, they become ionised. The charged species are collected at an electrode producing an increase in electric current proportional to the amount of carbon in the flame (from the eluting compound). The resultant electric current is then amplified and recorded as a chromatogram. In forensic science, the FID is often used in the analysis of fire debris as well as for food and fragrance analyses.
Jet
Air diffuser
Capillary column
Hydrogen
Makeup gas
Output
Exhaust
Flame
Air
Figure 2.14 Flame ionisation detector.

23Instrumentation for Gas Chromatography
© 2010 Taylor & Francis Group, LLC
2.6.2 Electron Capture Detector
The electron capture detector (ECD), as its name suggests, works by captur-ing electrons. The ECD (Figure 2.15) is a selective detector with greater sen-sitivity for specific elements (i.e., those with high electron affinities, such as halogens). It has a more limited linear dynamic range (104) compared to the FID. The typical carrier gas for GC-ECD is nitrogen.
An ECD consists of a small radioactive source, 63Ni (a β-emitter), that produces electrons on collision with the carrier gas, producing a standing current that is measured:
N2 + β → N2+ + e– (2.2)
The electrons generated then interact with an eluting compound (X), resulting in a decrease in the standing current. It is this reduction in stand-ing current as a result of the generation of an anion (X–) that the presence of a compound is measured:
X + e– → X– (2.3)
Finally, the generated compound anion (X–) then interacts with the charged carrier gas (N2
+), resulting in the generation of two neutral com-pounds (i.e., the compound X and carrier gas N2):
X– + N2+ → X + N2 (2.4)
The ECD is therefore a nondestructive detector; care is needed with the venting of toxic gaseous products into the laboratory. The GC-ECD should have appropriate ventilation via a fume hood. In forensic science, GC-ECD can be used in the analysis and identification of nitro-organic explosive compounds.
2.6.3 Nitrogen–Phosphorus (or Thermionic) Detector
The nitrogen–phosphorus (or thermionic) detector (Figure 2.16) is both a destructive and selective detector. It functions in a very similar way to the
Anode (+)
Cathode (–)
Carriergas out
Carriergas in
β-emitter
e–
Figure 2.15 Electron capture detector.

24 Forensic Applications of Gas Chromatography
© 2010 Taylor & Francis Group, LLC
FID; the major significant difference is that an alkali ‘bead’ (e.g., rubidium silicate) is located immediately above the flame. The presence of this alkali bead enhances the ionisation and response specificity for organic compounds that contain nitrogen or phosphorous. It has a typical linear dynamic range of 104. It is therefore very applicable for selected applications in which enhanced sensitivity may be required for nitrogen- and phosphorus-containing com-pounds (e.g., nitrogen- and phosphorus-containing pesticides). In operation, it needs to be optimised for hydrogen gas flow (typically in the range of 4–5 mL/min) as well as bead electric current for sensitivity. In use it can produce negative peaks from solvents as they are able to thermally quench the detec-tor. In addition, the use of chlorinated solvents shortens bead lifetime. It is therefore recommended that an internal standard always be used to compen-sate for changes in signal response. The use of GC-NPD finds application in the analysis of pesticides and some drugs in biological matrices.
Output
Jet
Exhaust
Flame
Air
Air diffuser
Hydrogen
Makeup gas
Capillary column
Ceramic bead heater
Figure 2.16 Nitrogen–phosphorus detector.

25Instrumentation for Gas Chromatography
© 2010 Taylor & Francis Group, LLC
2.6.4 Flame Photometric Detector
The flame photometric detector (Figure 2.17) is both a destructive and a selec-tive detector. It is particularly useful for compounds that contain phosphorus or sulphur. As the compounds elute from the capillary column, they enter a hydrogen-rich flame; the elemental species present in the flame (i.e., S and P) emit light characteristic of themselves at specific wavelengths. The character-istic emitted light (for phosphorus it is 526 nm and for sulphur it is 393 nm) is selected by the use of an optical filter and detected using a photomultiplier tube (PMT). The detector then converts the photons of light into an electric current, which is recorded. The linear dynamic range is typically 103 for S and 104 for P. It is specifically useful in applications that require specific and enhanced signals for S- and P-containing compounds (e.g., organophospho-rus pesticides, sulphur in crude oil and related products—for example, petro-leum, as well as foods).
Jet
Flame
Optical filter
Optical window
PMT
Exhaust
Air
Hydrogen
Capillary column
Figure 2.17 Flame photometric detector.

26 Forensic Applications of Gas Chromatography
© 2010 Taylor & Francis Group, LLC
In operation, the flame photometric detector needs to be optimised for its flame gas flows for good sensitivity. In addition, high concentrations of CO2 from coeluting hydrocarbons can decrease the sulphur compound response (quenching); the detector temperature affects the resultant signal to noise; therefore, a detector temperature of 150°C–275°C is ideal for most applica-tions. The presence of water as condensation may cause detector corrosion and fog the PMT window, resulting in premature failure of the detector and loss of signal. GC-FPD can be used in the analysis of some drugs and envi-ronmental forensic analysis for the detection of pesticides.
2.6.5 Mass Spectrometry
Probably the most important detector for GC is the mass spectrometer (MS); as well as providing quantitative information on the amount of compound present in a sample (as all other detectors), it can also identify the unknown compound by its chemical structure. This is done by comparing a generated mass spectrum for the unknown compound with a database (on the PC) or by generating a mass spectrum from a known standard of the suspected compound. This additional feature of GC-MS (i.e., structure elucidation and compound identification) makes this the ultimate detector for forensic anal-ysis as well as many other analytical applications.
The basis of the detector is that an MS separates ionised compounds based on their mass-to-charge ratio (in contrast to GC, which separates unionised compounds). Therefore, the initial aspect of the detector is to ensure that at the interface between the GC and MS ionisation takes place. In GC-MS, two methods of ionisation are possible: electron impact (EI) and chemical ionisa-tion (CI). The most popular method of choice is electron impact ionisation due to simpler mass spectra interpretation and the requirement for no addi-tional gas to be introduced.
In electron impact ionisation, electrons are produced from a heated fila-ment (cathode) (Figure 2.18). As the electrons accelerate toward an anode, they collide with the vapourised sample exiting from the GC column:
X(g) + e– → X+(g) + 2e– (2.5)
In contrast, in chemical ionisation, a reagent gas (e.g., methane) is ionised by electron bombardment (Equation 2.6); the resultant generated reagent gas molecular ion (Equation 2.7) is then allowed to react with a neutral molecule to produce a reactant ion. The reactant ion then interacts with the vapourised compound exiting from the GC column.
CH4(g) + e– → CH4+
(g) + 2e– (2.6)

27Instrumentation for Gas Chromatography
© 2010 Taylor & Francis Group, LLC
CH4+
(g) + CH4(g) → CH5+
(g) + CH3*(g) (2.7)
X(g) + CH5+
(g) → XH+(g) + CH4(g) (2.8)
where CH4+ is the molecular ion and CH5
+ is the reactant ion.(Note: As a result of electron impact ionisation, the ion generated is
representative of the molecular weight (X+) of that compound; in chemical ionisation, the ion generated has a molecular weight plus 1 (XH+) of that compound.)
The generated ions, of specific m/z ratios, are then separated by a mass spectrometer. A range of different mass spectrometers is available for GC. The most common are
• Quadrupole MS• Ion trap MS• Time-of-flight MS
2.6.5.1 Quadrupole MSIn a quadrupole MS, four stainless steel rods are located horizontally to each other (Figure 2.19) such that the same combination of direct current (DC) and radio frequency (RF) voltages can be applied to opposite rods at the same time. Based on a specific combination of DC/RF voltages, an ion with a selected mass to charge (i.e., m/z) ratio will pass through the quadrupole MS and be detected; at that moment, all other ions of different m/z ratios are lost. Rapidly altering the combined DC/RF voltages allows ions of different m/z ratios to pass through the mass spectrometer and be detected. For GC-MS,
Heated cathodefilament
Sample inlet Ionisation chamber
Anode
Lenses
Mass analyser
Figure 2.18 Electron impact ionisation.

28 Forensic Applications of Gas Chromatography
© 2010 Taylor & Francis Group, LLC
the typical mass range required may extend from 0 up to 400 amu. This is the most commonly used mass spectrometer in forensic science.
2.6.5.2 Ion Trap MSAn ion trap MS traps ions of specific m/z ratios within three cylindrically symmetrical electrodes consisting of two caps and a ring electrode. By apply-ing increasing RF voltages to the electrodes, ions of increasing m/z ratio leave the ion trap and are detected. GC ion trap MS is being used in forensic sci-ence in the areas of toxicology and fire debris analysis.
2.6.5.3 Time-of-Flight (TOF) MSA TOF MS separates ions, based on their m/z ratio, according to their veloc-ity. As each ion has a different molecular weight, it will travel at a different velocity when a voltage is applied. Separation is achieved in this type of MS by allowing the ions to travel over a distance. Often in a TOF, MS presepara-tion is required; this can be done using a quadrupole MS.
2.6.5.4 DetectionThe MS separated ions are detected using an electron multiplier tube (EMT). The ion of a specified m/z ratio strikes the surface of a semiconductor, where it is converted to an electron. Each electron generated is then cascaded toward an anode. On the way, however, an electron will strike the internal surface of the EMT, creating additional electrons. The cascade of electrons generated is collected as an electric current at the anode; the electric current is then converted to a signal and visualised using appropriate software as either a chromatogram or mass spectrum.
Syringe
GC
Oven
Column
Inferface
Ion source
Quadrupole MS
Detector
To vacuum system
Computer
Chromatogram
Figure 2.19 Gas chromatography coupled to a quadrupole mass spectrometer.

29Instrumentation for Gas Chromatography
© 2010 Taylor & Francis Group, LLC
2.6.5.5 Data AcquisitionThe output from a GC-MS system can be visualised as a chromatogram (a plot of signal intensity versus time) superimposed with a mass spectrum for each compound separated (Figure 2.20). In this manner, a GC-MS is able to provide both quantitative and compound identification information.
Two modes of operation are possible for the MS; in the first mode, all ions, from 0 to 400 amu, are monitored in a rapid scanning mode (i.e., full scan or total ion current [TIC] mode). In TIC mode, it is possible to generate a mass spectrum for any eluting compound in the chromatogram. The gener-ated mass spectrum can then be compared to the mass spectrum generated for the suspected same compound purchased as an authentic standard from a recognised supplier, or by comparing the generated mass spectrum with a computer-based database of mass spectra.
However, once a compound (or range of compounds) has been identi-fied, it is possible for the MS to be operated in single (or sequential) ion mode (SIM). In this mode of operation it is not possible to obtain a mass spectrum for any eluting compound; however, signal enhancement is evi-dent, allowing lower limits of detection to be obtained for the identified compounds. In order for SIM mode to be effective, the forensic scientist needs to select key ions, characteristic of the compounds separated, in TIC mode first. (Note: The same ion [m/z ratio] can be selected for more than one compound because they are eluting from the GC column at different times.) For example, the ion at m/z ratio 77 amu is characteristic of C6H5 (i.e., a monosubstituted benzene ring) using the atomic weights of 12C and 1H; this results in 12 × 6 = 72 amu plus 1 × 5 = 5 amu, resulting in a total of 77 amu. Then, instead of the MS rapidly scanning all m/z ratios between 0 and 400 amu in TIC mode, it can now spend longer monitoring m/z ratio 77 amu. By spending a longer time monitoring 77 amu, only an increased signal will result in SIM.
Time (mins)
Sign
al
m/zm/z
Figure 2.20 Data acquisition in GC-MS.

30 Forensic Applications of Gas Chromatography
© 2010 Taylor & Francis Group, LLC
Questions
1. What can you determine from the van Deemter plot (Figure 2.2) with regard to the choice of carrier gas?
2. What is the optimal linear velocity for helium? 3. What is a molecular sieve? 4. What issues would you need to consider when deciding whether to
use a cylinder of nitrogen versus a generator? 5. What is an internal standard? 6. What is an unreacted silanol group? 7. What happens to the vapourised gaseous material that does not go
onto the GC column? 8. How much of the GC column stationary phase do you think will be
damaged by the insertion of the syringe needle? 9. What might a typical PTV temperature programme look like? 10. What is Tenax? 11. How long would the chromatographic run take to separate com-
pounds using the following temperature programme: 50°C for 2 min, followed by ramp rate of 10°C/min to 220°C, with a final hold temperature of 2 min?
12. What is the stationary phase? 13. What are polar compounds composed of? 14. What is the linear dynamic range? 15. What effect would a 60 m capillary column have on the sample
components?
Further ReadingBlumberg, L. M. 2010. Temperature-programmed gas chromatography. Chichester,
UK: John Wiley & Sons.Fowlis, I. A. 1995. Gas chromatography, 2nd ed. Analytical chemistry by open learning.
Chichester, UK: John Wiley & Sons.Grob, K. 2008. Split and splitless injection for quantitative gas chromatography, 4th,
completely rev. ed. Chichester, UK: John Wiley & Sons.Grob, R. L., and E. F. Barry. 2004. Modern practice of gas chromatography, 4th ed.
Hoboken, NJ: John Wiley & Sons.McNair, H. M., and J. M. Miller. 2009. Basic gas chromatography (techniques in ana-
lytical chemistry), 2nd ed. Chichester, UK: John Wiley & Sons.Sparkman, O. D., Z. Penton and F. G. Kitson. 2011. Gas chromatography and mass
spectrometry: A practical guide, 2nd ed. New York: Academic Press.

31© 2010 Taylor & Francis Group, LLC
Basic Principles of Chromatography
3.1 Introduction
The basis of capillary gas chromatography is that when a complex sample is injected into the column, separation takes place. (Note: The term complex sample refers to the presence of more than one compound in the presence of a volatile organic solvent.) The separation of the compounds is influenced by a series of operating conditions, some of which you can alter as part of the normal GC conditions, while others are not so available (during routine operation of the GC). The typical operating condition that can be altered is
• Temperature within the GC oven that influences the so-called col-umn temperature. In practical terms the column can be operated under ‘isothermal conditions’ or ‘temperature-programmed condi-tions’. In the case of the former, the column temperature remains fixed (e.g., 100°C) throughout the GC run. In the case of the latter, the temperature is varied, at a fixed rate, during the GC run (e.g., 80°C for 2 min, then a ramp rate of 10°C/min, to 200°C with a hold of 3 min).
Operating conditions that are generally fixed and not available for change during routine operation include:
• Choice of carrier gas and its flow rate (i.e., while the choice of car-rier gas is important, it is not often practical to change; for example, nitrogen is used as the carrier gas for GC-FID while helium is used for GC-MS).
• Choice of column (i.e., column length, internal diameter, and sta-tionary phase).
This chapter seeks to influence the reader in how to recognise whether the separation achieved is fit for purpose.
3
32 Forensic Applications of Gas Chromatography
© 2010 Taylor & Francis Group, LLC
3.2 Theory of Chromatography
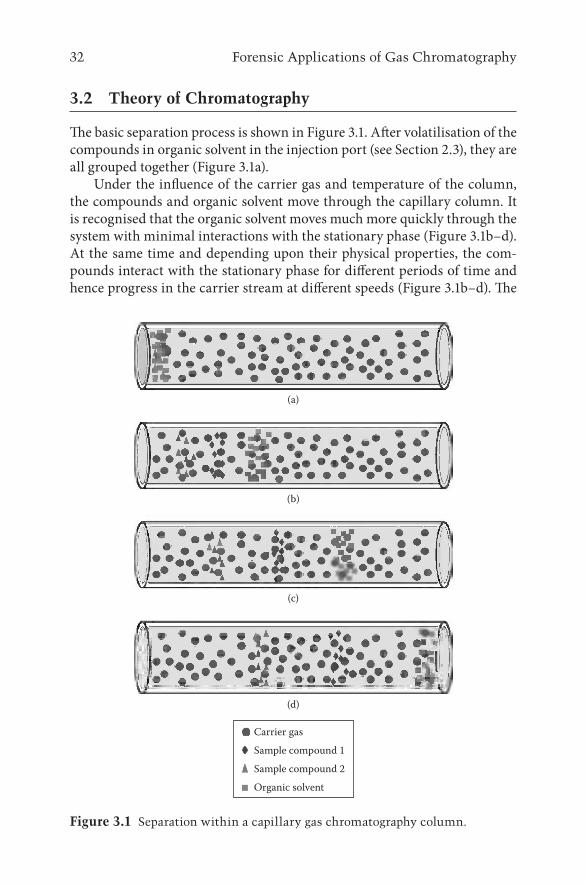
The basic separation process is shown in Figure 3.1. After volatilisation of the compounds in organic solvent in the injection port (see Section 2.3), they are all grouped together (Figure 3.1a).
Under the influence of the carrier gas and temperature of the column, the compounds and organic solvent move through the capillary column. It is recognised that the organic solvent moves much more quickly through the system with minimal interactions with the stationary phase (Figure 3.1b–d). At the same time and depending upon their physical properties, the com-pounds interact with the stationary phase for different periods of time and hence progress in the carrier stream at different speeds (Figure 3.1b–d). The
(a)
(b)
(c)
(d)
Carrier gasSample compound 1Sample compound 2Organic solvent
Figure 3.1 Separation within a capillary gas chromatography column.

33Basic Principles of Chromatography
© 2010 Taylor & Francis Group, LLC
resultant output—the so-called chromatogram—represents the appearance of the organic solvent and compounds (Figure 3.2). The chromatogram is therefore a plot of the amount (concentration) of the compounds present as a function of time.
Within the chromatogram it is possible to define some specific terms and measurements (Figure 3.3); specifically, the following terms are identified:
• to = the time of elution (minutes) of the unretained compound from the point of sample injection; it is sometimes referred to as the col-umn dead time. In practical terms this is often taken to be the time, from sample injection, when the organic solvent appears in the chro-matogram (see Figure 3.3).
• tr = the time of elution (minutes) of each compound from the point of sample injection (or retention time) to the centre of the peak. In the case of the example (see Figure 3.3), two compounds elute from the column; therefore, we can refer to tr1 (the time of elution, from the point of injection, of compound 1) and tr2 (the time of elution, from the point of injection, of compound 2).
• h = the peak height (in units that are representative of the y-axis on the chromatogram, e.g., microvolts). This is the height of the peak measured from the baseline (i.e., the position with the chromato-gram when no compound or solvent is present) to the highest point that the compound attains in the vertical direction.
• A = the peak area (in units that are representative of the y-axis on the chromatogram and the duration of the peak on the x-axis, i.e., time, e.g., μV.s).
10095
2.822.97
3.08 3.40
3.95
4.10 4.54 5.04 5.46 6.23
6.76
6.98 7.42
7.85
8.42 9.29
9876Time (min)
Rela
tive A
bund
ance
543
9.00
908580757065
55
45
35
60
50
40
3025
15
5
20
10
0
Figure 3.2 A chromatogram: a plot of signal (relative abundance; on the y-axis) versus retention time (minutes; on the x-axis).

34 Forensic Applications of Gas Chromatography
© 2010 Taylor & Francis Group, LLC
• wb = the width of the peak at its extrapolated base. When a peak is magnified it is normally observed that some curvature takes place between the baseline and the start of the vertical peak. It is generally accepted that the width of the peak at the base takes into account this curvature by extrapolating through it. (Note: wb1 refers to the width of the peak base for compound 1 and wb2 is the width of the peak base for compound 2.)
to
(a)
Sign
altr2
tr1
Time (mins)
(b)
W1/2
W0.6065
Wb
h, peak height
Figure 3.3 Selected chromatographic terms.

35Basic Principles of Chromatography
© 2010 Taylor & Francis Group, LLC
• w1/2 = the width of the peak at half its height. In practical terms this is done by halving the peak height and measuring the width of the peak at this position.
• W0.6065 = the width of the peak at the point of inflection (or curvature as described in wb) near the peak base. In practical terms this is done by halving the peak height and measuring the width of the peak at this position.
• k ′ = capacity factor. (Sometimes it is defined by use of a small letter k with a prime, i.e., k ′ or simply k. It has no units.)
• N = column efficiency.• L = column length (the dimension needs to be defined in appropriate
units, e.g., metres, centimetres or millimetres).• HETP = height equivalent to a theoretical plate, expressed as column
efficiency (N), in units of millimetres.• As = asymmetry factor.• R = a measure of the degree of separation of adjacent compound peaks.
The importance and use of some key terms will now be described.
3.2.1 Capacity Factor
In order to be able to compare the elution time of one compound between one gas chromatograph and another (whether in the same laboratory or not), the capacity factor for that compound must be calculated. Calculating the capacity factor creates a unitless measure of the compound’s retention time irrespective of column length or flow rate. Capacity factor is therefore often considered a more useful measure of retention time. It is calculated as follows:
k ′ = (tr – to)/to (3.1)
(The terms have been defined in the previous section.)
3.2.2 Column Efficiency
The concept of plate theory was originally developed to evaluate the perfor-mance of distillation columns (e.g., for the separation of crude oil into its component fractions—that is, petrol, diesel etc.). The theory assumes that the column is divided into a number of zones or plates; in reality, for a capillary GC column this is clearly not the case. Nevertheless, the concept of the num-ber of theoretical plates is a useful measure for GC because it gives a practical numerical value that indirectly provides a measure of the peak narrowness. In principle, therefore, the narrower the peak shape is the more peaks (or compounds) can be separated. The number of theoretical plates is therefore

36 Forensic Applications of Gas Chromatography
© 2010 Taylor & Francis Group, LLC
a measure of column efficiency (N). It can be determined mathematically in a number of ways, each of which will provide a number (unitless). (Note: The derived number can be compared from column to column provided the same mathematical approach is used; no comparison is possible between alternate mathematical approaches). The number is the guide on how many theoretical plates could exist in the column or, more appropriately, the column efficiency in separating compounds. The larger the numerical value is the more com-pounds, in theory, can be separated.
N = 16.0 (tr/wb)2 (3.2)
N = 5.54 (tr/w1/2)2 (3.3)
N = 4.0 (tr/w0.6065)2 (3.4)
N = 2π ((tr. h)/A)2 (3.5)
(The terms have been defined previously.)In practical terms, Equation (3.5) is the most useful as the relevant infor-
mation—that is, retention time (tr), peak height (h), and peak area (A)—are all easily derived from the chromatographic software data package.
In capillary GC different column lengths can be used on different instru-ments and by different laboratories. Therefore, it is possible to normalise the column efficiency by using the term height equivalent to a theoretical plate, or HETP (in units of millimetres). This is done as follows:
HETP = L/N (3.6)
(The terms have been defined previously.)
3.2.3 Asymmetry Factor
The plate number assumes that the peak shape is Gaussian (Figure 3.4b), whereas in reality the peak shape can vary due to a range of issues leading to peak fronting (Figure 3.4c) and peak tailing (Figure 3.4a).
Peak fronting can be caused by injecting too much sample onto the capil-lary column, thereby overloading the column, whereas peak tailing is often caused by the compound being separated having too much interaction with the stationary phase. In either case (peak fronting or tailing), it is detrimen-tal to the ability of the column to separate compounds that elute close to each other and the chromatographic data software package in determining peak area. A measure of the asymmetry factor, As, can be done using Equation (3.7) at 10% of the peak height and by referring to Figure 3.5(a):

37Basic Principles of Chromatography
© 2010 Taylor & Francis Group, LLC
(a) Peak tailing (b) Gaussian peak (c) Peak fronting
Figure 3.4 Chromatographic peak shape.
(a)
(b)
wb
h, peak height
0.1 × ha b
wb
h, peak height
0.05 × h a b
Figure 3.5 Asymmetry factor.

38 Forensic Applications of Gas Chromatography
© 2010 Taylor & Francis Group, LLC
As = b/a (3.7)
or, using Equation (3.8) at 5% of peak height and referring to Figure 3.5(b),
As = (a + b)/2.a (3.8)
Ideally, the asymmetry factor should have a numerical value (unitless) between 0.9 and 1.2; between these values no issues will arise in the utilisa-tion of the peak chromatographic data.
3.2.4 Resolution
The final, most important term is resolution. Resolution is the ability to sepa-rate two adjoining compounds such that their peak bases are distinguishable from each other (i.e., a separation exists between the two compound peak shapes). The resolution can be calculated as follows:
R = (tr2 – tr1)/(0.5 (wb1 + wb2)) (3.9)
(The terms have been defined previously.)The numerical value for resolution should be >0.9; this allows the chro-
matographic data software package to be able to distinguish between dif-ferent compound peaks. An illustration of how values for resolution affect separation is shown in Figure 3.6.
Questions
1. The separation of some compounds by gas chromatography with a flame ionisation detector was done. Based on a to of 1.0 min, (a) determine the capacity factor for compound A at a tr of 5.9 min, and (b) determine the capacity factor for compound B at a tr of 6.2 min.
2. A compound with a retention time of 6.3 min has a peak area of 3,088,081 (μV.s) and a peak height of 624,352 (μV). Calculate the col-umn efficiency (N) for this compound. Then, determine the number of theoretical plates per metre for a 30 m column.
3. A compound with a retention time of 6.3 min has (a) a width at its peak base (wb) of 5.74 s, (b) a peak width at half height (w1/2) of 2.91 s and (c) a peak width at 0.6065 peak height (w0.6065) of 2.32 s. Calculate the different values for column efficiency (N) using Equations (3.3), (3.4) and (3.5). Then, determine the number of theoretical plates per metre for a 30 m column in each case.

39Basic Principles of Chromatography
© 2010 Taylor & Francis Group, LLC
4. Based on your answer to Question 3.2 and using Equation (3.6), calculate the height equivalent to a theoretical plate (in units of millimetres).
5. Based on your answers to Question 3.3 and using Equation (3.6), calculate the height equivalent to a theoretical plate (in units of millimetres).
6. A compound with a retention time of 6.3 min and a peak height of 624,352 (μV) has been assessed for peak asymmetry at (a) 10% of its peak height to have a value for ‘a’ of 1.8 s and a value for ‘b’ of 2.2 s, and (b) 5% of its peak height to have a value for ‘a’ of 2.0 s and a value for ‘b’ of 2.5 s. Calculate the peak asymmetry using Equations (3.7) and (3.8).
7. The separation of some compounds by gas chromatography with a flame ionisation detector was done. On visual inspection, it appears that two of the compounds may not be separated (i.e., resolved). Compound A has a tr of 3.32 min and a peak width at its base of 6.5 s, while compound B has a tr of 3.51 min and a peak width at its base of 7.9 s. Calculate the resolution of the peaks and hence determine whether they are resolved or not using Equation (3.9).
Further ReadingBlumberg, L. M. 2010. Temperature-programmed gas chromatography. Chichester,
UK: John Wiley & Sons.Fowlis, I. A. 1995. Gas chromatography, 2nd ed. Analytical chemistry by open learning.
Chichester, UK: John Wiley & Sons.Grob, R. L., and E. F. Barry. 2004. Modern practice of gas chromatography, 4th ed.
Hoboken, NJ: John Wiley & Sons.
(a) (b) (c) (d)
Figure 3.6 Resolution.

40 Forensic Applications of Gas Chromatography
© 2010 Taylor & Francis Group, LLC
McNair, H. M., and J. M. Miller. 2009. Basic gas chromatography (techniques in ana-lytical chemistry), 2nd ed. Chichester, UK: John Wiley & Sons.

41© 2010 Taylor & Francis Group, LLC
Method Development
4.1 Introduction
When faced with the analysis of a new substance or one that has never been analysed in the laboratory before, it is necessary to establish a new method. Depending upon the compound and the matrix of the samples, the develop-ment of this new method can take a few hours to a few months. In forensic science, as well as in many other analytical laboratories required to carry out method development, a number of factors require consideration in order to establish a valid instrumental method of analysis.
The purpose of the analysis must be first established: qualitative or quan-titative? If the work is qualitative, there will be no requirement to establish linearity. Other validation parameters, such as limit of quantitation, will also not be required since no quantitative work is required. (See Chapter 5 for a description of validation parameters.)
The next point for consideration is the sample and any sample prepara-tion that may be required. If the sample is blood, for example, the direct introduction of this specimen into the gas chromatograph is not possible; this means sample cleanup procedures, such as protein precipitation, pH adjustment, extraction methods (e.g., solid phase extraction [SPE] and liq-uid–liquid extraction [LLE]) and filtering. (See Section 8.2 for further infor-mation.) The reason that these cleanup steps are required is that some of the components of the matrix may interfere with the chromatography and may have the same retention time as the analytes of interest.
4.2 Influence of Sample Introduction Method
The method of introduction will depend upon the sample and the analyte(s) analysed. For example, if accelerant analysis is being carried out, direct liquid analysis can be completed by directly introducing the liquid to the injection port of the GC. On the other hand, if debris from a fire scene requires analy-sis for the presence of accelerants, direct injection of the debris is not appro-priate. However, because of the nature of the analytes (i.e., they are volatile), methods of introduction may include headspace analysis, solid phase micro-
4

42 Forensic Applications of Gas Chromatography
© 2010 Taylor & Francis Group, LLC
extraction (SPME), or automated thermal desorption (ATD). (See Section 8.3 for further information.)
Practical issues, such as the chemical nature of the analytes, the nature of the matrix, and the concentration of the analytes, should all be consid-ered. As has been previously mentioned in Chapter 2, split or splitless injec-tion may be used depending upon the amount of analyte(s) present and the method of sample introduction. The higher the sample ratio (i.e., 100:1 versus 20:1) the less sample will be introduced into the GC. If too much sample is introduced to the instrument, this will result in poor peak shape and detec-tor overload; not enough sample in the GC will result in poor sensitivity of the method and may mean no detection (therefore, no peaks).
4.3 Influence of the Carrier Gas
Unlike with high performance liquid chromatography (HPLC), where the mobile phase has a large influence over the separation, the choice of carrier gas in GC does not influence the decision-making process in the same way. The most commonly used carrier gases are nitrogen, helium and hydrogen: All three are inert and will not react with the analytes but are used to carry the analyte(s) through the instrument to the detector. In HPLC, the analytes will partition themselves between the mobile and stationary phases depend-ing upon their affinity for one or the other. In GC, the separation is based on the boiling point(s) of the analyte(s) and the chemical nature of those analyte(s). As has been previously explained (in Chapter 2) the decision of which carrier gas to use ultimately depends on a compromise between cost and appropriateness, which usually results in the use of nitrogen in the case of GC-flame ionisation detector (FID) and the use of helium with GC-mass spectrometry (MS).
4.4 Influence of the Column
In Chapter 2, the choice of GC column was explained considering param-eters such as the stationary phase choice, the length of the column, the thick-ness of the stationary phase and the internal diameter of the column. In most cases, a compromise between peak shape, resolution and run time must be achieved. For some forensic applications (e.g., the identification and quanti-tation of diazepam and desmethyldiazepam), baseline resolution and good peak shape are essential; however, this is not the case when carrying out the identification of petrol in fire debris.

43Method Development
© 2010 Taylor & Francis Group, LLC
4.5 Influence of Oven Temperature
If the oven is maintained at the same temperature and at the same time throughout the whole analysis time, this is known as an isothermal method. This type of oven method is appropriate if a fairly simple sample is being ana-lysed. This usually includes a mixture of compounds with similar retention properties. If a more complex mixture of analytes is present in your sample, an isothermal method may not produce a good separation for all components. In these cases, a temperature gradient may be required. This means that we con-sider the resulting chromatogram as a series of sections; each section requires a different temperature to effect better resolution, peak shape and retention times. Usually, the starting temperature will be at least 10°C below the lowest boiling point of the analyte; however, much of the GC method development carried out will be a well-informed process of trial and error.
4.6 Influence of the Detector
The choice of detector is ultimately determined by the application: If the purpose of the analysis is to identify alcohol (ethanol) in alcoholic bever-ages, mass spectrometry is not required since the analyte is well defined, the retention time will be well known and there will be little, if any, interfering peaks on the chromatogram. This means that the FID can be used. If, on the other hand, drug analysis is being carried out, the analyst must be certain that the peak that he or she has identified and quantified is cocaine and not another chemically similar compound that may have been extracted from the coca leaf in the initial extraction process. In this case, mass spectrom-etry will provide the extra identification required (as opposed to retention time alone with FID).
4.7 An Example
Consider the following example: A mixture of eight compounds (chloro-butane, bromobenzene, fluoroacetophenone, acetophenone, phenylethanol, 4-methylacetophenone, m-nitrotoluene and tridecane) is present in a solvent (methanol) and qualitative analysis is required for the eight compounds. This means that, where possible, baseline–baseline resolution is required and that good peak shape and a reasonable run time should also be achieved (less than 20 min, if possible). In this example a DB-5 column (30 m × 0.25 mm), 0.25 μm film thickness and nitrogen as carrier gas at 0.6 mL/min on a Thermo Electron Finnigan Focus GC-FID were used.

44 Forensic Applications of Gas Chromatography
© 2010 Taylor & Francis Group, LLC
Starting with an isothermal method at 50°C for 20 min, the chromato-gram produced (Figure 4.1) shows six prominent large peaks and two very small peaks close to the baseline. The two small peaks are due to column deg-radation and are not related to the sample, whereas the six prominent peaks are. The very first peak is the solvent (methanol) peak, which means that only five of the eight compounds are being separated with this method within the 20 min run time. This means that this temperature (i.e., 50°C) is too low for all analytes to be detected. Either an increase in temperature or an extremely long run time will be required for the other analytes to elute from the GC column. (Note: 50°C was chosen as the starting point since the boiling point of methanol is approximately 65°C and, as has previously been mentioned, normally a starting temperature at least 10°C lower than the lowest boiling point of the analytes should be used.)
Figure 4.2 shows the resulting chromatogram when the temperature of the isothermal method is altered from 50°C to 70°C. Eight peaks are now present in the chromatogram. However, the first five peaks (after the solvent peak) are sharp and well shaped (ignoring the small peaks on the baseline as these are associated with column degradation). The last three peaks are not as well shaped; they are resolved but a little wide at the baseline. Therefore, an increase in temperature may resolve this issue. However, the first five peaks may be too close to each other and poorly resolved. This is shown in Figure 4.3(a), where the temperature was increased to 90°C, and (b) where the temperature was increased to 120°C for comparison.
As can be seen from the resultant chromatograms in Figure 4.3, the iso-cratic method at 90°C produces a chromatogram where the first few peaks are too close together with no or little baseline resolution, but then the
0 Time (minutes) 20
Figure 4.1 Chromatogram for isocratic 20 min run at 50°C.

45Method Development
© 2010 Taylor & Francis Group, LLC
subsequent peaks are spread out; from the chromatogram obtained from the 120°C, the peaks at the beginning of the chromatogram are coeluting and the two peaks later on are not fully resolved. It is clear that an isothermal method is not the most appropriate method for these eight analytes. Starting at 70°C and introducing a temperature ramp up to 120°C, a rate of 10°C min–1 pro-duces the chromatogram shown in Figure 4.4.
The first five peaks are resolved, perhaps not perfectly but the sixth and seventh peaks are not fully resolved and the last peak has spread out quite considerably, resulting in a squat peak with both fronting and tailing. Again, this is not the most appropriate temperature program. The temperature ramp was decreased from 10°C min–1 to 5°C min–1 to try to spread out the sixth and seventh peaks to try and sharpen the last peak, with the resulting chromato-gram shown in Figure 4.5.
0 Time (minutes) 20
Figure 4.2 Chromatogram for isocratic 20 min run at 70°C.
(a) (b)Time (minutes) 20 00 Time (minutes) 20
Figure 4.3 Chromatogram for isocratic 20 min run (a) at 90°C and (b) at 120°C.

46 Forensic Applications of Gas Chromatography
© 2010 Taylor & Francis Group, LLC
This chromatogram shows that by decreasing the temperature ramp, it has spread the analytes further away from each other altogether, producing a chromatogram with only five peaks (plus the solvent peak), which means that this method is also not appropriate.
In order to achieve a good separation of all eight analytes plus the solvent peak and to have all components eluting within the 20 min run time, a hold
0 Time (minutes) 20
Figure 4.4 Chromatogram from 70°C to 120°C at 10°C min–1 temperature program.
0 Time (minutes) 20
Figure 4.5 Chromatogram from 70°C to 120°C at 5°C min–1 temperature program.

47Method Development
© 2010 Taylor & Francis Group, LLC
time and a ramp will need to be included. Figure 4.6 shows the chromato-gram produced when the temperature was started at 70°C, held for 2 min, and then increased at 10°C min–1 until 120°C and held for 10 min.
As can be seen, all eight analytes have eluted before 14 min and all are resolved. The run time could probably be reduced much further if it were required.
Questions
1. If two peaks were coeluting with each other at the beginning of a chromatographic separation at 80°C (isocratic), what could be done to the method to try to obtain resolution (spread them out)?
2. If there is a large gap of 6 min in the chromatogram between the fourth and fifth peaks of a five-analyte mixture, how could the gap be reduced?
3. If your first (solvent) peak does not elute from the GC system until 6 min, what can be done to try to reduce the retention time of the first peak?
Further ReadingPoole, C. 2012. Gas chromatography. Amsterdam: Elsevier.Swartz, M. E., and I. R. Krull. 1997. Analytical method development and validation.
Boca Raton, FL: CRC Press.
0 Time (minutes) 20
Figure 4.6 Final chromatogram.

49© 2010 Taylor & Francis Group, LLC
Quality Assurance and Method Validation
5.1 Quality Assurance
There are many definitions for quality assurance; however, one of the best is ‘a planned and systematic pattern of all actions necessary to provide con-fidence that adequate technical requirements are established; that products and services conform to established technical requirements and that satisfac-tory performance is achieved’.1 Essentially, this can be simplified to ‘fitness for purpose’.
5.2 Quality Control
Quality control is a process of inspection, analysis and action required to ensure quality of a process or product. For example, if we consider a packet of paracetamol (acetaminophen) that can be purchased from a chemist or pharmacy, how do we know that this product is safe for use and that it will safely rid us of our headache? The answer is quality control. Quality control is a set of procedures that are intended to check that a product or service is fit for purpose and conforms to a defined set of quality criteria that is set by an external regulatory body or a customer.
Each paracetamol (acetaminophen) tablet that we purchase for our head-ache will usually contain 500 mg of the active compound (i.e., paracetamol) plus excipients that will ease administration of the active compound into the body. A paracetamol tablet will also typically contain maize starch, dioctyl sodium sulfosuccinate (docusate sodium), colloidal anhydrous silica, magne-sium stearate and polyvinylpyrrolidone (povidone). Both the active compound and the other excipients will be tested against a particular Pharmacopoeia. A Pharmacopoeia is a book that contains instructions on how to identify sam-ples and provides information on the preparation of medications.
Pharmacopoeias tend to be published by learned pharmaceutical societ-ies of a particular country. For example, the US Pharmacopoeia (USP) is pro-duced by the US Pharmacopoeial Convention and the National Formulary (USP-NF); the British Pharmacopoeia (BP) is produced by the British Pharmacopoeia Commission Secretariat of the Medicines and Healthcare Products and Regulatory Agency (MHRA). Other pharmacopoeias are
5

50 Forensic Applications of Gas Chromatography
© 2010 Taylor & Francis Group, LLC
available, such as the European Pharmacopoeia (PhEur) and the Japanese Pharmacopoeia (JP). When our packet of paracetamol (acetaminophen) is purchased, it will have the initials of the appropriate pharmacopoeia after it, depending upon which set of methods has been used for testing (e.g., paracetamol 500 mg PhEur means the preparation was testing according to the European Pharmacopoeia). On that basis we are assured that the product we are buying is as it should be.
5.3 Why Be Quality Assured?
Ultimately, we wish to avoid product safety issues or to ensure that our ser-vice meets an identified specification. This in turn ensures customer trust in our product or service provided. In forensic science laboratories or services, quality assurance should keep miscarriages of justice to a minimum (since it is impossible to say that no mistakes will ever be made).
5.4 Ways to Ensure Quality of Product or Service
The following points outline the steps to implement a laboratory-based qual-ity assurance scheme that is fit for purpose:
• Quality procedures: By placing procedures in place in the laboratory or organisation we can minimise problems or errors. Procedures will be identified for staff training, instrument performance, validating test methods, recording information and dealing with errors.
• Quality standards: Choosing a standard that is appropriate to our product or service. In the UK, the ISO/IEC 17025 implemented by the United Kingdom Accreditation Service (UKAS) is used; in the United States the ISO/IEC 17025 standard is used but implemented in an accreditation program through the American Association of Crime Lab Directors Laboratory Accreditation Board (ASCLD/LAB). In reality, ISO/IEC 17025 is a standard that provides ‘general requirements for the competence of testing and calibration labo-ratories’ and is used as the basis of accreditation in these types of laboratories. ISO/IEC 17025 was not written specifically for forensic science laboratories but rather for all laboratories carrying out test-ing and calibration.
• Quality management system (QMS): Implementing a QMS is only the first step of the procedure of having a fully documented quality system in place in a workplace. A QMS will be initiated and written in accordance with the standards of an accreditation body, such as

51Quality Assurance and Method Validation
© 2010 Taylor & Francis Group, LLC
UKAS or ASCLD/LAB. The purpose of the QMS is to have proce-dures to deal with organisation management, company structure, testing procedures, and outlining how raw data should be stored and reported, where appropriate. The documented system comprises• Policy is defining the aims of the company relative to the struc-
ture of the organisation. The rest of the quality system will be based on this piece of documentation.
• Manual (quality manual [QM]) outlines the policy statement, the roles and responsibilities and the procedures involved in the organisation.
• Procedures relate to specific activities, methods or instrumental techniques within the organisation, giving step-by-step instruc-tions for use. This is a collection of individual documents called standard operating procedures (SOPs).
• Raw data are anything that you obtain from instruments, any-thing you write, and reports that are released to customers.
In this document system, there should be procedures in place for dealing with errors. No matter how hard we try, it is impossible to avoid errors occur-ring; these can be instrumental or caused by human intervention.
When a laboratory is accredited, part of this accreditation means that an organisation or laboratory should sign up to an external quality control programme and/or proficiency testing scheme. Laboratories undertake pro-ficiency testing as part of their accreditation program or to ensure that their protocols and procedures work as they should. Proficiency tests will be car-ried out as part of an intra- or interlaboratory scheme:
An intralaboratory scheme is in-house testing where known samples will be tested and compared.
An interlaboratory scheme is signing up to a program or scheme where a central organiser will send out samples of known origin for comparison with other labs.
5.5 Instrument Qualification
When purchasing a new piece of equipment for a laboratory, there are four main steps (sometimes termed the ‘four Qs’) involved in the implementation of the new instrument:
• Design qualification (DQ)—the initial stage of this process is to consider what is required of the instrument. At this point, you should be considering such things as the sample preparation involved,
52 Forensic Applications of Gas Chromatography
© 2010 Taylor & Francis Group, LLC
the introduction of the sample to the instrument, the gas supply required, electrical sockets, the space you have available in your laboratory for the instrument, the software requirements and the type of training that may be required for you and your staff, and the amount of money you have to spend. This step is essential and must be done properly; otherwise, it may result in problems further along the process or you may end up with an instrument that is unsuitable for the intended application.
• Installation qualification (IQ)—this stage involves (usually) the vendor checking each of the components of the instrument (mod-ules) and electrical plugs of the instrument against the purchase order. At this point, the instrument will be plugged in and commu-nication will be ascertained before the vendor leaves. The vendor will test a known sample or standard on the instrument to ensure that it is working before signing off the instrument for use.
• Operational qualification (OQ)—usually, this step is done in the laboratory (but can, in some cases, be carried out by the vendor). This step involves making sure that each of the modules of the instrument perform to defined specifications. Usually an SOP that is used in the laboratory will already have been used to check the system suitability.
• Performance qualification (PQ)—this step is designed to demon-strate satisfactory performance and to show that the instrument continues to meet the acceptance criteria throughout the anticipated working range and anticipated working conditions.
When working in a regulated environment, all of the steps mentioned here should be well documented and appropriately stored by the qual-ity assurance team as part of an accreditation process. The documentation should be easily accessible, should it be required.
5.6 Method Validation
5.6.1 What Is Method Validation?
This is subject to analyst interpretation as there are no universally accepted industry practices for method validation but, generally, validation is the pro-cess of establishing an experimental database that verifies that an analytical method performs in the manner for which it is intended. The purpose of method validation is to ensure that the method is fit for purpose and that the data obtained are consistent; it should always be completed prior to using the method in a commercial or regulated environment.

53Quality Assurance and Method Validation
© 2010 Taylor & Francis Group, LLC
5.6.2 Steps Involved in Method Validation
The most important consideration for strategies of method validation is to design experimental work so that the appropriate validation characteristics are studied simultaneously. This will result in minimising the number of experiments that need to be completed. Planning is essential.
5.6.3 Validation Parameters
5.6.3.1 LinearityMethods are described as linear when there is a directly proportional rela-tionship between signal response and the concentration of analyte in the sample, over the range of analyte concentrations of interest. Figure 5.1 shows a typical linear response; as we can see, we have the equation of the straight line (regression equation) in the form y = mx + c. The y-intercept value (c) is typically ≤4% of the response obtained with the 100% analyte response. We also have an R2 value (correlation coefficient). The linearity of the data should be carried out over at least three different concentrations; however, five or more points tend to be used. More concentration points tend to be included in the lower part of the concentration.
The correlation coefficient (R2 value) is used to determine how closely a certain function (e.g., concentration) fits a particular set of experimental data (e.g., peak area). An R2 value ≥ 0.999 is generally considered as acceptable for the correlation coefficient; however, the points at the lower and higher con-centrations should be examined for any slight deviations from the line. If
6000
5000
4000
3000
y = 9.9897x + 7.356R2 = 0.9999
2000
1000
0100 200 300
Concentration (ng/mL)
Peak
Are
a
400 500 6000
Figure 5.1 Linear response showing regression equation and correlation coefficient.

54 Forensic Applications of Gas Chromatography
© 2010 Taylor & Francis Group, LLC
they do not meet the accepted criteria, the method would have to be modified until the acceptance criteria for linearity are met.
5.6.3.2 RangeThis is the interval between upper and lower concentrations of analyte in a sample for which it has been demonstrated that analytical procedure has a suitable level of precision, accuracy and linearity.
5.6.3.3 AccuracyThis is a measure of the difference between expectation of test result and the accepted reference value due to systematic method and laboratory error, or closeness of agreement of results between the true value and the value found. The accuracy is typically established by using nine determinations of the analyte in question (i.e., at least three replicates over a minimum of three concentrations). Accuracy is usually expressed as a percentage and is sometimes termed trueness.
5.6.3.4 PrecisionThis is the closeness of agreement between a series of measurements obtained from multiple sampling of the same homogeneous sample under the pre-scribed conditions.
• Repeatability expresses the precision under the same operating con-ditions over a short period of time. (It can also be referred to as intra-assay precision.)
• Intermediate precision expresses the within-laboratories variation. This is established by carrying out precision tests on different days, with different analysts, and using different instruments.
• Reproducibility expresses the precision between laboratories (col-laborative studies are generally used, for standardisation). This is an optional parameter that requires demonstration of lab-to-lab variation only if multiple laboratories use the same procedure. The reproducibility data can be obtained during method transfer between laboratories.
5.6.3.5 RobustnessThis is a measure of a method’s capacity to remain unaffected by small but deliberate variations in method parameters and provides an indication of the method’s reliability during normal usage. This may include solvent manu-facturer, temperature, flow rate etc. Typically, the method will be assessed against predefined acceptance criteria established in the standard operating procedure by the company and/or by the accrediting body.

55Quality Assurance and Method Validation
© 2010 Taylor & Francis Group, LLC
5.6.3.6 SpecificityThis is the ability of a method to assess unambiguously the analyte in the presence of components that may be expected to be present. These may include impurities, products of degradation and the matrix.
5.6.3.7 Limit of Detection (LOD)This is the lowest amount of analyte concentration in a sample that can be detected but not necessarily quantitated as an exact value. Typically, this parameter is established when carrying out linearity and, when appropri-ate, limit of quantitation (LOQ). The concentration is reduced and the sig-nal from the GC analysed. The limit of detection will be established when the signal-to-noise (S/N) ratio is ≥3:1. Figure 5.2 shows a chromatogram obtained when establishing LOD; it can be seen that the peak at 7 min is the largest peak. If this is the peak associated with the analyte of interest in the validation, the area under this peak must be at least three times greater than the area under the peak of the next largest peak in the chromatogram. For example, the peaks at 4, 12 and 14 min appear to be the next largest peaks (in relation to the analyte peak). The peak at 4 min has a peak area of 20; at 7 min, the peak area is 60; at 12 min, peak area is 18; and the peak at 14 min has a peak area of 8. The peak of interest has a peak area of 60 with the next largest peak having a peak area of 20. The peak of the analyte is exactly three times greater than that of the next largest peak; therefore, this is acceptable.
70
60
50
40
30
20
10
0
–10
2 4 6 8Retention Time (mins)
Peak
Are
a
10 12 14 16 180
Figure 5.2 Chromatogram obtained when establishing LOD.

56 Forensic Applications of Gas Chromatography
© 2010 Taylor & Francis Group, LLC
5.6.3.8 Limit of Quantitation (LOQ)This is the lowest amount of analyte in a sample that can be quantitatively determined with suitable precision and accuracy. This parameter will be established in the same way as the LOD; however, the signal-to-noise ratio should be ≥10:1. Figure 5.3 shows a chromatogram obtained when LOQ was being established in a validation: The largest (analyte) peak at 10 min has a peak area of 300. The peaks at 4, 8 and 12 min are the next largest peaks in relation to the analyte peak; they have peak areas of 20, 25 and 15, respec-tively. Since the largest peak area is 25, this means that the analyte peak is 12 times larger than the next largest peak. Since the lowest signal-to-noise ratio is 10:1, this chromatogram meets the criteria for LOQ.
As with instrument qualification, method validation should be well doc-umented. These documents may be used to help validate methods for similar compounds later. They may also be used if method transfer is required to take place. Method transfer is used when a laboratory that currently has a validated analytical method in place is required to transfer the method to another site or location where the same work will be carried out. The receiv-ing laboratory needs to be fully briefed in order for a successful transfer to take place, thus making the documents produced when carrying out the original method validation highly important and extremely useful.
When validating an analytical method using GC in forensic science, first assess the analytical requirements. Whether carrying out qualitative analysis of fire accelerants or investigating a suspected street drug and determining the presence and amount of cocaine, we must first establish a valid analytical
350
–50
02 4 6 8
Retention Time (mins)10 12 14 16 18
50
100
Peak
Are
a
150
200
250
300
0
Figure 5.3 Chromatogram obtained when establishing LOQ.

57Quality Assurance and Method Validation
© 2010 Taylor & Francis Group, LLC
testing method. In forensic science, we must be certain that the results we obtain from an instrument are true and that the analytical method is robust and will not change dramatically from day to day. If you were to stand up in court and state that the 1 kg of off-white powder submitted to your laboratory for analysis has been found to contain 65% cocaine free base, you need to be able to prove that this is the answer you will achieve every time you analyse the same sample. Method validation is an essential step in forensic analysis for all analytical testing. Each method must be fit for purpose and must meet the requirements laid down in the laboratory and by regulatory specifications.
Questions
1. List the four Qs and explain their purpose in instrument qualification. 2. When trying to establish linearity, experimental data were obtained
from the GC instrument; the R2 value was found to be 0.988. Is this value acceptable or not?
3. What is the purpose of ISO/IEC 17025?
Reference 1. Society of Cost Estimating and Analysis. Definition of quality assurance (http://
www.sceaonline.org/prof_dev/glossarylisting.cfm?term=q).
Further ReadingEurachem/CITAC Guide CG-4. 2000. Quantifying uncertainty in analytical mea-
surement, ICH Guideline Q2(R1). Validation of analytical procedures: Text and methodology.
ISO/IEC. 2005. General requirements for the competence of testing and calibration laboratories, 17025.
Prichard, E., and V. Barwick. 2007. Quality assurance in analytical chemistry. Chichester, UK: John Wiley & Sons Ltd.
Ratliff, T. A. 2003. The laboratory quality assurance system: A manual of quality proce-dures and forms, 3rd ed. Hoboken, NJ: John Wiley & Sons Inc.


59© 2010 Taylor & Francis Group, LLC
Troubleshooting in Gas Chromatography
6.1 Introduction
The key to success in troubleshooting for GC is largely down to personal and practical experience over a period of time. Nevertheless, this chapter seeks to identify some common problems and highlight possible remedies. In most cases, apart from identifying an issue relating to the separation capability of the instrument and its performance, the remedy can often only be done by a trained technician or scientist or representative from the instrument manu-facturer. To be able to carry out any form of troubleshooting requires that the individual have a basic ‘GC troubleshooter’s tool kit’ consisting of the follow-ing (see also Further Reading section):
• Flow meter (capable of measuring flows in the range of 10 to 500 mL/min): An example of a commercially available flow meter is shown in Figure 6.1.
• A spare GC syringe (either for manual injection or autosampler, depending on what is normally used): This syringe should not have been used before (and should also be in full working order).
• A source of methane or butane: These are obtainable either from the natural gas supply in the laboratory or a cigarette lighter, respec-tively. Their purpose is to provide a position in the chromatographic run time when the unretained compound—that is, to (see Section 3.2)—appears. Either gas can be introduced into the hot injection port using a gas tight syringe (see Figure 7.5).
• New septa, ferrules and injection liners: A septum (see Figure 2.6 or 2.7) should be replaced after every 50–100 injections; the repeated injection process, which uses the syringe to pierce the septum, even-tually causes the septum to have a larger hole than initially made by the syringe. Ultimately, therefore, the septum no longer self-seals and air can be introduced into the instrument. Also, the repeated injection process causes parts of the septum to break away and enter the injection port where they must be removed. A graphite ferrule is used to attach the capillary column to the output of the injection port and input of the detector. An air-leak-proof seal is required. On that basis, new ferrules should be used when the column is replaced.
6
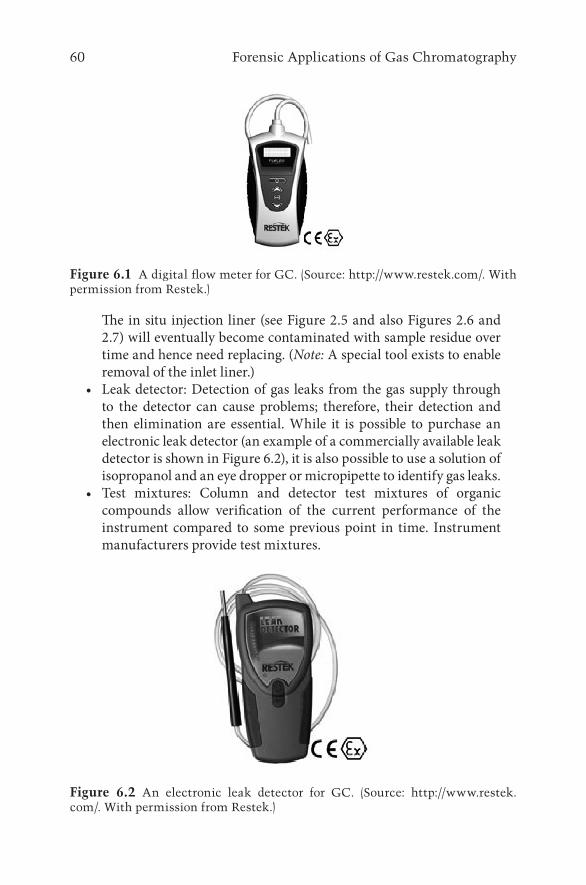
60 Forensic Applications of Gas Chromatography
© 2010 Taylor & Francis Group, LLC
The in situ injection liner (see Figure 2.5 and also Figures 2.6 and 2.7) will eventually become contaminated with sample residue over time and hence need replacing. (Note: A special tool exists to enable removal of the inlet liner.)
• Leak detector: Detection of gas leaks from the gas supply through to the detector can cause problems; therefore, their detection and then elimination are essential. While it is possible to purchase an electronic leak detector (an example of a commercially available leak detector is shown in Figure 6.2), it is also possible to use a solution of isopropanol and an eye dropper or micropipette to identify gas leaks.
• Test mixtures: Column and detector test mixtures of organic compounds allow verification of the current performance of the instrument compared to some previous point in time. Instrument manufacturers provide test mixtures.
Figure 6.2 An electronic leak detector for GC. (Source: http://www.restek.com/. With permission from Restek.)
Figure 6.1 A digital flow meter for GC. (Source: http://www.restek.com/. With permission from Restek.)
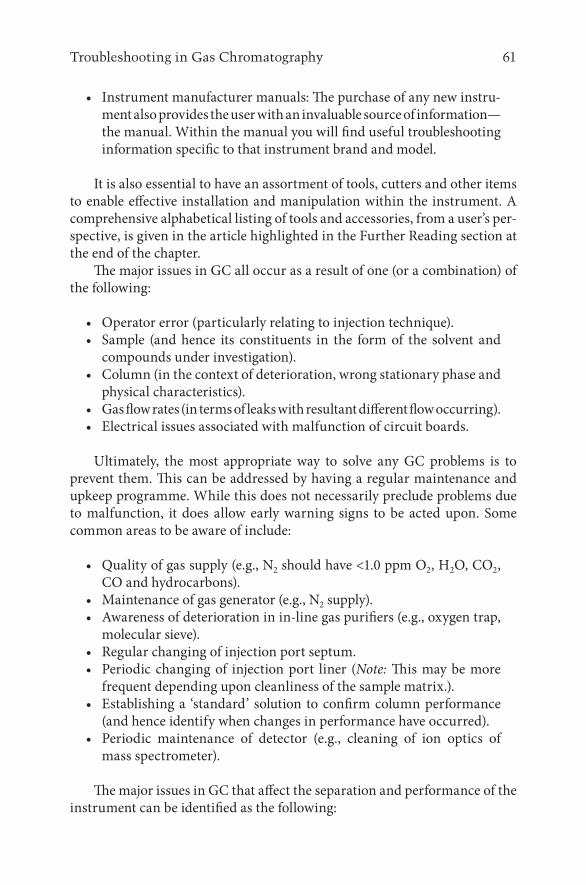
61Troubleshooting in Gas Chromatography
© 2010 Taylor & Francis Group, LLC
• Instrument manufacturer manuals: The purchase of any new instru-ment also provides the user with an invaluable source of information—the manual. Within the manual you will find useful troubleshooting information specific to that instrument brand and model.
It is also essential to have an assortment of tools, cutters and other items to enable effective installation and manipulation within the instrument. A comprehensive alphabetical listing of tools and accessories, from a user’s per-spective, is given in the article highlighted in the Further Reading section at the end of the chapter.
The major issues in GC all occur as a result of one (or a combination) of the following:
• Operator error (particularly relating to injection technique).• Sample (and hence its constituents in the form of the solvent and
compounds under investigation).• Column (in the context of deterioration, wrong stationary phase and
physical characteristics).• Gas flow rates (in terms of leaks with resultant different flow occurring).• Electrical issues associated with malfunction of circuit boards.
Ultimately, the most appropriate way to solve any GC problems is to prevent them. This can be addressed by having a regular maintenance and upkeep programme. While this does not necessarily preclude problems due to malfunction, it does allow early warning signs to be acted upon. Some common areas to be aware of include:
• Quality of gas supply (e.g., N2 should have <1.0 ppm O2, H2O, CO2, CO and hydrocarbons).
• Maintenance of gas generator (e.g., N2 supply).• Awareness of deterioration in in-line gas purifiers (e.g., oxygen trap,
molecular sieve).• Regular changing of injection port septum.• Periodic changing of injection port liner (Note: This may be more
frequent depending upon cleanliness of the sample matrix.).• Establishing a ‘standard’ solution to confirm column performance
(and hence identify when changes in performance have occurred).• Periodic maintenance of detector (e.g., cleaning of ion optics of
mass spectrometer).
The major issues in GC that affect the separation and performance of the instrument can be identified as the following:

62 Forensic Applications of Gas Chromatography
© 2010 Taylor & Francis Group, LLC
• Baseline disturbances• Irregular peak shapes (e.g., split peaks, fronting peaks, tailing peaks
or broad peaks)• Retention time shifts• Loss of separation or resolution• Loss of sensitivity• Rapid column deterioration• Ghost peaks
Each of these will now be discussed.
6.2 Baseline Disturbances
Baseline disturbances can be evidenced by observing spiking, noise or base-line drift in the resultant chromatogram (Figure 6.3).
Spiking (Figure 6.3a) can occur due to, for example, particulate matter passing through the column or detector, which ultimately requires cleaning of the detector. Alternatively, random spiking can occur as a result of poor electrical connection between cables and the instrument; assessing the cable connection to check for loose wires would allow a preliminary diagnosis. However, any electrical repair should be done by a trained electrician.
Baseline drift (Figure 6.3b) can occur as a result of a range of issues relat-ing to contamination of the injection port and column; in this situation, it is necessary to clean the injection port and replace the GC column. In addition, baseline drift can also occur due to use of a new column that has not been conditioned (i.e., taken through a temperature programme to remove extra-neous material) or the detector not being allowed to reach equilibrium (e.g., allowing a flame ionisation detector some time to stabilise).
Baseline noise (Figure 6.3c) can occur due to a range of possibilities including contamination in the injection port, a dirty column and incor-rect fitting of the column (in the detector); options to remedy the situation include cleaning of the injection port, replacing the column and reinstalling the column, respectively.
Spiking Drift Noise(a) (b) (c)
Figure 6.3 Examples of typical baseline disturbances.

63Troubleshooting in Gas Chromatography
© 2010 Taylor & Francis Group, LLC
6.3 Irregular Peak Shapes
Irregular peak shape can be evidenced by the absence of a peak, split peaks, fronting peaks, tailing peaks or broad peaks in the resultant chromatogram (Figure 6.4).
No peaks: This could be particularly difficult to diagnose as it may be caused by problems anywhere throughout the instrument, from sample injec-tion to injection port to column to detector to data collection to data display. A systematic approach to identify what the issue is would be required.
Split peaks (Figure 6.4a): The most obvious symptom of split peaks, specif-ically with manual sample injection by someone new to GC, is poor injection technique. This is often evidenced by the individual having a jerky or erratic injection technique with the syringe; practice with the syringe to deliver a con-stant and smooth plunger depression should solve this problem. Alternative symptoms of split peaks can be evidenced by coelution of two or more com-pounds (almost) simultaneously; this could be further investigated by altering (or applying) a temperature programme to the separation to see if two or more compounds are present in the sample. Other possibilities for the occurrence of split peaks include thermal degradation of the compound of interest in the injection port (the remedy is to lower the injection temperature) and use of a mixed solvent in the sample (the remedy is to use a single solvent only).
Tailing peaks (Figure 6.4b): Peak tailing can occur due to a series of issues. Specifically, peak tailing could result by having an inappropriate sta-tionary phase (the remedy could be to increase the polarity of the stationary phase). In addition, peak tailing can occur due to issues around the injec-tor liner or column contamination, dead volume created by having a poorly installed column or injector liner, inappropriate connector fitting between injector and column or column and detector or incompatibility between sta-tionary phase, compounds under investigation and organic solvent.
Fronting peaks (Figure 6.4c): This is almost certainly due to overloading of the column stationary phase by injection of too much sample. The rem-edies include dilution of the sample, using a thicker film (stationary phase thickness increased, for example, from 0.25 to 0.53 μm) or increasing the
(a) Split peak (b) Peak tailing (c) Peak fronting
Figure 6.4 Examples of irregular peak shapes.

64 Forensic Applications of Gas Chromatography
© 2010 Taylor & Francis Group, LLC
split ratio so that more of the sample is sent to waste rather than introduced onto the column (e.g., 50:1 to 100:1, where 50 or 100 is the amount going to waste and 1 is the amount going onto the column).
Broad peaks: Broad peaks could result as a consequence of having too low a flow rate for the carrier gas, split gas or detector makeup gas; checking flow rates to ensure they are as previously used would allow their elimination from the process, as would checking for gas leaks in connectors and tubing. In addition, other possibilities could involve poor peak separation resulting in coelution.
6.4 Retention Time Shifts
Shifting retention times (Figure 6.5) will cause issues on the data acquisi-tion software output as the PC operated system is relying on compounds appearing at almost the same time in order to identify them (by retention time). This is especially important in quantitative analysis (the main type of analysis done using GC). Shifts in retention time can occur due to a number of possible options, including a leaking septum on the injection port (remedy: replace septum or tighten up the locking nut that holds the septum in place), carrier gas flow rate has changed (remedy: check that gas supply pressure has not changed), temperature programme has changed (remedy: check that the method has not been altered) and a replacement column (remedy: check that the stationary phase and column dimensions are the same as previously used).
Time (mins)
Time (mins)
Figure 6.5 Example of retention time peak shift.

65Troubleshooting in Gas Chromatography
© 2010 Taylor & Francis Group, LLC
6.5 Loss of Separation or Resolution
A loss of separation or resolution (Figure 6.6) will cause issues on the data acquisition software output as the PC operated system is relying on com-pounds appearing at almost the same time in order to identify them (by reten-tion time). A loss of separation (or resolution) can occur due to a number of possible options, including an ageing column that has lost a substantially amount of stationary phase (remedy: replace the column with the same sta-tionary phase and dimensions), the carrier gas flow rate has changed (remedy: check that gas supply pressure has not changed) and the temperature pro-gramme has changed (remedy: check that the method has not been altered).
6.6 Loss of Sensitivity
A loss of sensitivity (Figure 6.7) is ultimately going to affect the ability of the instrument to perform its key functions (i.e., identifying and quantify-ing compounds). A loss of sensitivity can occur due to a number of possible options, including that sample concentration has changed (remedy: recheck calculations and dilutions to ensure no mistakes have been made in the prep-aration of the sample), carrier gas flow rate has dramatically changed (rem-edy: check that gas supply pressure has not changed), the injection port liner is dirty (remedy: replace the liner with a new, deactivated liner), temperature programme has dramatically changed (remedy: check that the method has
Time (mins)
Time (mins)
Figure 6.6 Example of a loss of separation.

66 Forensic Applications of Gas Chromatography
© 2010 Taylor & Francis Group, LLC
not been altered) and split ratio has significantly changed (remedy: check that settings have not changed).
6.7 Rapid Column Deterioration
A significant deterioration in column performance can occur as a result of the following: a dramatic failure of the in-line trap removing oxygen and water from the carrier gas (remedy: replace the in-line trap and column), exceeding the upper column maximum temperature advised by the manu-facturer (remedy: replace the column) and damage of the column by the sam-ple—for example, pH stability of the column is exceeded (remedy: replace the column and adjust the sample).
6.8 Ghost Peaks
Ghost peaks are identifiable in the chromatogram by the reappearance of the original compounds at the wrong time (Figure 6.8). They can occur, for example, in isothermal or temperature programme GC by terminating the chromatographic run too soon, the later eluting compounds appearing after the next sample injection. The remedy is partly to appreciate how many com-pounds are being separated and to wait for their appearance, use a higher
Time (mins)
Time (mins)
Figure 6.7 Example of a loss of sensitivity.

67Troubleshooting in Gas Chromatography
© 2010 Taylor & Francis Group, LLC
column operating temperature to allow all compounds to elute and allow enough chromatographic run time to elapse to ensure complete sample elu-tion. In addition, ghost peaks can occur as a result of cross-contamination of sample and standards in solution (by using the same syringe without proper cleaning between samples), impurities in the solvent (use a different source of the same solvent to identify if this is the issue), and deterioration of the septum—so called ‘septum bleed’ (remedy: replace the septum for one that is suitable for a higher injection port temperature or made of a resistant coated material).
Question
1. Can you name/identify some GC instrument manufacturers?
Further ReadingHinshaw, J. V. 2003. GC troubleshooting—A troubleshooter’s tool kit. LC-GC Europe
June: 2–5.
Time (mins)
Time (mins)
Figure 6.8 Example of ghost peaks.

69© 2010 Taylor & Francis Group, LLC
Developments in Gas Chromatography
7.1 Introduction
This chapter considers progress in GC from the point of view of develop-ments in
• Sample preparation• Column technology• Instrumentation
7.2 Developments in Sample Preparation Techniques
7.2.1 Sample Derivatisation to Aid Volatility for GC
For analysis of samples by GC, the analytes of interest should be volatile, be thermally stable at the operating temperatures of the injection port and column oven, and give good peak shape. However, it is possible to analyse analytes that do not meet these criteria by carrying out an additional step of sample (and hence compound) pretreatment known as derivatisation. Derivatisation is carried out in order to modify the functionality of an ana-lyte to facilitate separation by GC and is generally used with analytes of low volatility and those that are thermally labile, that is, compounds that could often be analysed by high performance liquid chromatography (HPLC) (Note: For books on HPLC, see Further Reading at the end of the chapter.) Derivatisation is therefore normally done for the following reasons:
• To improve the resolution (see Section 3.2.4) and reduce peak tail-ing (see Section 3.2.3) of polar compounds; by definition polar com-pounds contain the following functional groups: –OH, –COOH, =NH, –NH2 and –SH.
• To improve column efficiency (see Section 3.2.2).• To analyse relatively nonvolatile compounds (e.g., those compounds
with higher molecular weight).• To increase detector sensitivity (in some cases) (see Sections 2.6.2,
2.6.3 and 2.6.4).• To improve the thermal stability of some compounds.
7

70 Forensic Applications of Gas Chromatography
© 2010 Taylor & Francis Group, LLC
Important considerations when selecting an appropriate derivatising agent include the following:
• The derivatisation reaction is ideally 100% complete (or at least >95% complete).
• The chosen derivatisation reagent will not affect the compound such that any chemical rearrangement or structural alteration takes place.
• The chosen derivatisation reagent does not contribute to any loss of the compound during the reaction.
• The newly derivatised product does not react with the column.• The newly derivatised product does not chemically degrade with
storage time.• Finally, the newly derivatised product is thermally stable in the GC.
Different derivatising reagents are available for different analytes; the choice of reagent and its suitability are dependent upon the analytes’ func-tional groups. Silylation and acylation are the two main derivatising reagents.
7.2.1.1 SilylationSilylation is the most commonly encountered derivatising reagent due to its ease of use and applicability to a range of functional groups. Silylation involves the addition of a silyl group into the compound, often by substitu-tion of an active hydrogen (see, for example, Scheme 7.1).
As a consequence, the addition of the silyl group reduces the polarity of the compound as well as reducing opportunities for hydrogen bonding. The resultant derivatised product is therefore more volatile and more ther-mally stable. Typical silylation adds the following groups to the compound: either the trimethyl-silyl group (Figure 7.1) or the t-butyldimethylsilyl
Si
CH3
CH3
CH3
Figure 7.1 Silylation using the trimethyl-silyl (TMS) group.
O
CH3
H3C
H3C
H3C H3C
H3CH3C
OH
C5H11
O
N Si
CH3
CH3
CH3
Si
CH3
CH3
O
CH3
O
C5H11
Si
H3CCH3
CH3
H3C
O
NH
Si
CH3
CH3
CH3
+
N,O-bis(trimethylsilyl)acetamide∆9-tetrahydrocannabinol
Scheme 7.1 TMS derivatisation of Δ9-tetrahydrocannabinol.

71Developments in Gas Chromatography
© 2010 Taylor & Francis Group, LLC
group. Addition of the trimethyl-silyl group is the most popular route for silylation derivatisation.
Addition of the trimethyl-silyl group is accomplished by use of spe-cific silylating reagents; these include N,O-bistrimethylsilyl-acetamide (BSA), N,O-bis-trimethylsilyl-trifluoroacetamide (BSTFA), N-methyl-N-trimethylsilyl-trifluoroacetamide (MSTFA) and N-trimethylsilylimidazole (TMSI). (Note: Trimethylchlorosilane [TMCS] is often used as a catalyst to increase the reactivity of the derivatising reagents. For example, it is typical to use the combined BSTFA + 1% TMCS derivatising reagent; the addition of TMCS is to ensure that difficult to derivatise samples are fully derivatised prior to analysis by GC.) Addition of the t-butyldimethylsilyl group is done using the derivatising reagent N-methyl-N-(t-butyldimethylsilyl)trifluoro-acetamide (MTBSTFA).
The resultant derivatised molecule is also less thermally labile, which results in better resolution of analyte peaks. An example of its application is the derivatisation of Δ9-tetrahydrocannabinol (Δ9-THC), the active compo-nent of cannabis. In this case, silylation is used to derivatise an active hydro-gen on Δ9-THC as shown in Scheme 7.1 using BSA as the derivatising reagent.
7.2.1.2 AcylationAs with silylation, acylation produces a resultant molecule that is more vola-tile and less polar than the underivatised, or parent, analyte. This process of acylation is affected by the reaction with acyl derivatives or acid anhydrides (Figure 7.2).
Typical acid anhydride acylating agents include trifluoroacetic acid (TFAA), pentafluoropropionic anhydride (PFPA), heptafluorobutyric anhy-dride (HFBA) and heptafluorobutrylimidazole (HFBI). These reagents add functional groups that are electron ‘rich’ (e.g., contain oxygen and fluorine); therefore, they are sensitive to detection using the electron capture detec-tor (ECD). Acylating reagents are very good at reacting with highly polar functional groups that contain active hydrogens (e.g. –OH, –SH and –NH), converting them into esters, thioesters and amines, respectively. As in the silylation process, the resultant derivatised molecule is also less thermally labile, which results in better resolution of analyte peaks. An example of its application is the derivatisation of metoclopramide. In this case, acylation is used to derivatise an active hydrogen on the amide group of metoclopramide, as shown in Scheme 7.2 using HFBI as the derivatising reagent.
CF3
O
C2F5
O
C3F7
O
Figure 7.2 Acylation using the acyl group.

72 Forensic Applications of Gas Chromatography
© 2010 Taylor & Francis Group, LLC
A summary of examples of different derivatisation reagents and their functions is shown in Table 7.1.
7.2.2 Solid Phase Extraction and Use of Mixed Mode Cartridges
Practically, when using a solid phase extraction (SPE) cartridge (Figure 7.3), it is necessary to condition the sorbent (i.e., packing) material (Figure 7.3a). This is done by first activating the cartridge sorbent with an organic solvent. The type of organic solvent will be chosen depending upon the type of cartridge being used (i.e., whether normal phase, reversed phase, or ion exchange). For example, in a reversed phase system, methanol could be used. Then, after acti-vation, the sorbent needs to be conditioned ready to retain the analytes in the aqueous sample. This is done by passing through the sorbent a solution that is representative of the sample, but without the analytes present (e.g., water or a buffer solution). When this conditioning solvent has been passed through the cartridge, the actual sample solution can be added (Figure 7.3b).
The SPE cartridge is normally used so that the analytes are adsorbed onto the sorbent material while the remaining matrix solution components will pass through unretained. In reality, this process may not be 100% effec-tive such that some washing of the SPE cartridge with an organic solvent or aqueous solution combination is required to remove the unwanted matrix components (Figure 7.3c). Finally, the SPE cartridge is washed with an organic solvent to desorb the retained analytes; this eluted component is col-lected and retained for subsequent analysis (Figure 7.3d). Alternatively, the SPE cartridge can be used to retain the matrix components while allowing the analytes of interest to pass through. However, this is not normally the preferred mode of operation for SPE cartridges.
Mixed mode SPE uses three different types of cartridges for the extrac-tion of drugs or metabolites from biological matrices. Their retention mecha-nisms are based on a combination of one of the following:
H2N
Cl
O
CH3
O
NH
N NN
O
F7C3HN
Cl
O
CH3
O
NH
N
F7C3O
NHN
+
+Metoclopramide hepta�uorobutrylimidazole
Scheme 7.2 Acylation of metoclopramide.
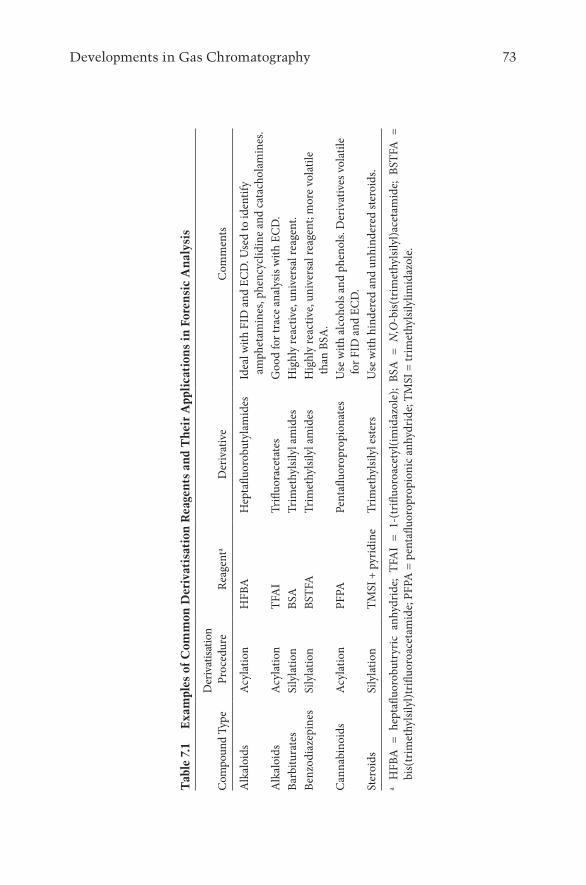
73Developments in Gas Chromatography
© 2010 Taylor & Francis Group, LLC
Tab
le 7
.1
Exa
mpl
es o
f Com
mon
Der
ivat
isat
ion
Rea
gent
s an
d T
heir
App
lica
tion
s in
For
ensi
c A
nal
ysis
Com
poun
d Ty
peD
eriv
atisa
tion
Proc
edur
eRe
agen
taD
eriv
ativ
eC
omm
ents
Alk
aloi
dsA
cyla
tion
HFB
AH
epta
fluor
obut
ylam
ides
Idea
l with
FID
and
EC
D. U
sed
to id
entif
y am
phet
amin
es, p
henc
yclid
ine
and
cata
chol
amin
es.
Alk
aloi
dsA
cyla
tion
TFA
ITr
ifluo
race
tate
sG
ood
for t
race
ana
lysis
with
EC
D.
Barb
itura
tes
Sily
latio
nBS
ATr
imet
hylsi
lyl a
mid
esH
ighl
y re
activ
e, un
iver
sal r
eage
nt.
Benz
odia
zepi
nes
Sily
latio
nBS
TFA
Trim
ethy
lsily
l am
ides
Hig
hly
reac
tive,
univ
ersa
l rea
gent
; mor
e vo
latil
e th
an B
SA.
Can
nabi
noid
sA
cyla
tion
PFPA
Pent
afluo
ropr
opio
nate
sU
se w
ith a
lcoh
ols a
nd p
heno
ls. D
eriv
ativ
es v
olat
ile
for F
ID a
nd E
CD
.St
eroi
ds
Sily
latio
nTM
SI +
pyr
idin
eTr
imet
hylsi
lyl e
ster
sU
se w
ith h
inde
red
and
unhi
nder
ed st
eroi
ds.
a H
FBA
= h
epta
fluor
obut
ryric
anh
ydrid
e; T
FAI
= 1-
(trifl
uoro
acet
yl(im
idaz
ole)
; BS
A =
N,O
-bis(
trim
ethy
lsily
l)ace
tam
ide;
BST
FA =
bi
s(tr
imet
hylsi
lyl)t
rifluo
roac
etam
ide;
PFP
A =
pen
taflu
orop
ropi
onic
anh
ydrid
e; T
MSI
= tr
imet
hylsi
lylim
idaz
ole.

74 Forensic Applications of Gas Chromatography
© 2010 Taylor & Francis Group, LLC
• Nonpolar and strong cation exchange• Nonpolar and weak cation exchange• Nonpolar and strong anion exchange
Other mixed mode sorbent combinations are available for specialist applications, and further information can be found in any SPE-based com-munications or from suppliers of SPE cartridges (see the answer to question 7.4). Mixed mode SPE sorbents work on the basis of the combination of two different types of interactions. For example, for the nonpolar and strong cat-ion exchange SPE system, one retention mechanism is based on hydropho-bicity (utilising the chain length of the nonpolar sorbent, for example, C4, C8 and C18 sorbents), while the strong cation exchange mechanism is based on electrostatic interaction (utilising the negatively charged sulfonic acid groups attached to the packing material) (Figure 7.4). Only analytes that have both nonpolar and basic characteristics will be extracted using this type of non-polar and strong cation exchange SPE cartridge.
7.2.3 Headspace Analysis of Volatile Compounds
The principle of headspace analysis requires the use of a sealed vial main-tained at a constant temperature (and ideally above room temperature). This allows for an equilibration to occur between the volatile compounds, of a solid or liquid sample, and the gaseous phase above it. This gaseous phase above the sample is known as the ‘headspace’. A quantity of the volatile com-pounds in the gaseous phase are removed using either a gas-tight syringe
(a) (b)
(c) (d)
Figure 7.3 Generic protocol for solid phase extraction.

75Developments in Gas Chromatography
© 2010 Taylor & Francis Group, LLC
(Figure 7.5) or a solid phase microextraction (SPME) device (Figure 7.6) and injected into the GC for subsequent analysis.
Headspace analysis is based on the principle of Henry’s law, which states that at a constant temperature, the amount of a given gas that dissolves in a given type and volume of liquid is directly proportional to the partial pres-sure of the gas in equilibrium with the liquid.
Mathematically, Henry’s law can be expressed as
p = κH. c (7.1)
where p = partial pressure of the gas phase solute, c = concentration of the solute and κH = Henry’s law constant (depends on solute, solvent and tem-perature). Headspace GC analysis is used in the analysis of volatile organic compounds, such as alcohol in blood.
Solid phase microextraction is a technique used for the extraction or concentration of volatile or semivolatile compounds from a sample matrix. It can be used for either headspace extraction or direct extraction from the liquid phase; in this section, headspace SPME is discussed. The principle of SPME is to adsorb the compounds of interest onto a silica-coated fibre; the fibre is typically 1 cm in length.
Syringe needle PlungerCalibrated barrel
Figure 7.5 Gas-tight syringe.
OSi
OSi
OSi
OSi
OH
OHSi
OSi
OSi
OSi
O
O OOH OHOH OH
SO3–SO3–
R NH3+
NH3+
R
C8 chain(a)
(b)
(a) Electrostatic interaction(b) Non-polar interaction
Figure 7.4 Retention mechanisms in a mixed mode SPE cartridge.

76 Forensic Applications of Gas Chromatography
© 2010 Taylor & Francis Group, LLC
A range of different coatings is possible, for example, 100 μm poly(dimethylsiloxane) or 85 μm poly(acrylate) representing the nonpo-lar and polar fibre technology, respectively. After an appropriate time scale (the actual time scale for adsorption is an experimental variable, so it can range from a few seconds to minutes depending upon the volatility of the specific compounds to be extracted), the fibre is retracted back into its holder, removed from the headspace of the vial, and inserted into the GC injection port. At that point the coated silica fibre is reexposed inside the hot GC injection port, the compounds desorb and the normal processes of the GC proceed. The SPME fibre is then retracted back into its holder and removed from the GC injection port and the process repeated for the next sample. SPME-GC has a range of applications in fire debris analysis as well as toxicol-ogy and fragrance or food analyses.
Plunger Stainless steel needle
Stainless steel needle Support for silica fibre Coated silica fibre
SPME fibre holder
Cap with septumCoated fibreVialSample
(a)
(b)
(c)
Figure 7.6 Solid phase microextraction (a) manual SPME holder, (b) coated fibre and (c) diagram of headspace SPME in use.

77Developments in Gas Chromatography
© 2010 Taylor & Francis Group, LLC
7.2.4 Microextraction by Packed Sorbent
Microextraction by packed sorbent (MEPS) is analogous to SPE (see Section 7.2.2). In practical terms, MEPS can be considered as a miniature version of SPE. In MEPS the sorbent is immobilised within a stainless steel body incor-porated with the syringe (Figure 7.7).
Typical sorbents allow reversed phase (C18, C8, or C2), normal phase (sil-ica) or mixed mode (e.g., C8 + strong cation exchange) extraction to be done for GC. In operation the MEPS chamber is conditioned prior to application of the sample (e.g., by drawing up methanol and water, and then discarding them). Then, the liquid sample is drawn up the syringe barrel into the MEPS chamber; this process of filling and emptying the MEPS chamber can be conducted singularly or multiple times. Then, wash solution (e.g., water) is drawn up into the MEPS chamber and discarded; this allows the removal of extraneous matrix components. Finally, an elution solvent (e.g., methanol) is drawn up into the MEPS chamber and its content injected directly into the GC injection port for separation and analysis. An example of extracting xanthines from urine is shown in Figure 7.8.
(a)
(b)
C18 sorbent in barrel
C18 barrel hidden within the syringe nut
Syringe locking nut
Syringe needle for piercing injection septum
Figure 7.7 Microextraction by packed sorbent (a) complete MEPS syringe, and (b) unassembled syringe.

78 Forensic Applications of Gas Chromatography
© 2010 Taylor & Francis Group, LLC
7.3 Developments in Column Technology
Column manufacturers are always producing modifications to capillary GC stationary phases and these developments can be considered as part of the normal evolution of the technique. This section proposes to look at three spe-cific developments only: fast GC, two-dimensional GC and the use of ionic liquid GC columns.
7.3.1 Fast GC
While fast GC has been included in this section under column technology, it is essential to appreciate that other instrumental developments were required in order to allow its successful application. These GC instrumental devel-opments include rapid automated injection, high head pressures and split flows, accelerated oven temperature ramp rates and fast detection acquisi-tion rates. In terms of column development, fast GC uses shorter columns (traditional 30 m column lengths are reduced to column lengths in the range of 5 to 20 m) and considerably narrower internal diameters (traditional 0.25 to 0.53 mm internal diameter columns are reduced to 0.05 to 0.18 mm inter-nal diameters) with a stationary phase of choice. In addition, hydrogen is the preferred carrier gas (due to its high diffusivity and high optimal linear velocity; see Section 2.2). Figure 7.9 shows the advantage of increased col-umn efficiency (see Section 3.2.2) obtainable as the column internal diameter
Abundance
18000 m/z 180 53
55 67 82 109123 137
180
194
165
109
8274
675542
40 60 80 100 120 140 160 180 200
68
95
123
eophylline/Paraxanthine
eobromine
Caffeine
151
180
m/z 194
10.0 11.0 12.0Retention Time (minutes)
13.0 14.0
Figure 7.8 Extracting xanthines from urine by MEPS. (Reprinted with permis-sion from SGE Analytical Science.)
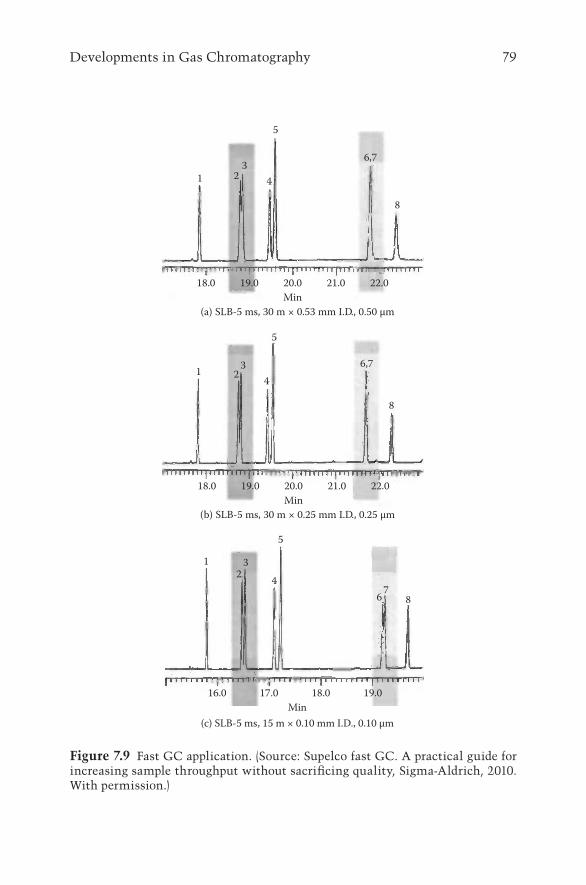
79Developments in Gas Chromatography
© 2010 Taylor & Francis Group, LLC
(c) SLB-5 ms, 15 m × 0.10 mm I.D., 0.10 µm
(b) SLB-5 ms, 30 m × 0.25 mm I.D., 0.25 µm
(a) SLB-5 ms, 30 m × 0.53 mm I.D., 0.50 µm
18.0 19.0 20.0Min
21.0 22.0
18.0 19.0 20.0Min
21.0 22.0
16.0 17.0 18.0Min
19.0
1 23
5
4
6,7
1 23
5
4
8
6,7
12
3
5
4
86 7
8
Figure 7.9 Fast GC application. (Source: Supelco fast GC. A practical guide for increasing sample throughput without sacrificing quality, Sigma-Aldrich, 2010. With permission.)

80 Forensic Applications of Gas Chromatography
© 2010 Taylor & Francis Group, LLC
decreases along with column length and thickness of the stationary phase. Fast GC has found some application in forensic drug and explosive analyses; however, it is still relatively new in forensic analysis.
7.3.2 Two-Dimensional GC
The development of two-dimensional (2-D) GC (i.e., GC × GC) took place over 20 years ago. The basis of the approach is that a sample is injected into a GC; initially some degree of separation takes place on GC column 1, perhaps resulting in the nonseparation of some components. These nonseparated components are then thermally modulated and introduced into a second GC column where they are then separated. The basis of GC × GC is shown in Figure 7.10. The advantages of the GC × GC approach are as follows:
B
A
Out
put 2
BA
A+B
Injection port
Detector
Modulator
Output 1 Output 2
Data processed result
Output 1
GC 1
GC 2
Figure 7.10 GC × GC.

81Developments in Gas Chromatography
© 2010 Taylor & Francis Group, LLC
• Higher peak capacity.• Signal enhancement due to analyte refocusing in the thermal
modulator.• Ability to record a series of 2-D chromatograms (i.e., retention time
versus signal) that can be transformed into a three-dimensional chromatogram (Figure 7.10).
In forensic analysis, the approach has been applied to differentiate between different ignitable liquids in fire debris samples.1 It has also been used in food and fragrance analyses.
7.3.3 Ionic Liquid GC Columns
The types of ‘traditional’ stationary phases used in GC have been discussed previously (see Section 2.5). A distinctly different type of stationary phase has emerged within the last decade based on ionic liquids. An ionic liquid is characterised as a solvent with both organic cations associated with either inorganic or organic anions and an inherently low melting point. The key properties that make ionic liquids suitable as stationary phase for GC include:
• Low volatility (i.e., potential for the column to have a longer opera-tional lifetime).
• Good temperature stability (i.e., potential for the column to remain in the liquid state over an extended temperature range).
• No reactive hydroxyl groups (i.e., potential for the column to be resistant to damage from water and oxygen).
• Highly polar (i.e., potential for the column to have a high polarity).• Range of physical—chemical solvation characteristics (i.e., potential
for the column to have unique selectivity).
A typical ionic liquid stationary phase (e.g., SLB-IL 100, from Supelco) is shown in Figure 7.11.
S
CF3
O
+ +N–
O
S
CF3
anion anion
cation cationlinkageO
O
S
S
CF3
CF3
O
O
O
N–
O
NN
NNN
Figure 7.11 Ionic liquid phase. (Source: Supelco ionic liquid GC columns, Sigma-Aldrich, 22 January 2011. With permission.)

82 Forensic Applications of Gas Chromatography
© 2010 Taylor & Francis Group, LLC
An example of the differences achievable using an ionic liquid GC col-umn is shown in Figure 7.12 by considering how the temperature of the col-umn can affect selectivity.
7.4 Developments in Instrumentation
7.4.1 Multicapillary Column–Gas Chromatography–Ion Mobility Spectrometry (MCC-GC-IMS)
In this approach, volatile organic compounds in the headspace above a sam-ple are injected (10 mL) into a multicapillary GC column. Typically, 1,000 capillaries are contained within stainless steel housing; each capillary has an internal diameter of 40 μm. The typical dimensions of the column are 20 cm length × 3 mm internal diameter × 0.2 μm film thickness. Separation takes place in milliseconds. The compounds are then transferred by the N2 carrier gas into the ion mobility spectrometer (IMS) where they are ionised by β-radiation (e.g., 3H). Separation in the IMS is based on the drift times that the ionised compounds pass through the drift tube in the presence of a defined electric field. The whole process takes place at atmospheric pressure. A typical layout of an MCC-IMS is shown in Figure 7.13.
80 °C isothermal
Temperature Effects on SelectivityAn Example
100 °C isothermal
110 °C isothermal
1. Toluene2. Ethylbenzene3. p-Xylene4. Isopropylbenzene5. n-Tridecane (C13)
column: SLB-IL 100, 30 m × 0.25 mm I.D., 0.20 µm (28884-U)inj.: 250 °Cdet.: FID, 250 °Ccarrier gas: helium, 30 cm/secinjection: 1.0 µL, 100:1 splitliner: 4 mm I.D., split, cup designsample: each analyte at various concentration in isooctane
Peak IDs (in boiling point order)
1.8
1
1
1,5
5
5
2
2
2
3
3
4
4
3 4Higher oven temperature:
Selectivity changes•
n-Tridecane (peak 5) isprimarily retained bydispersive interactions
–
�e aromatics are retainedby dipole and induceddipole interactions inaddition to dispersiveinteractions
–
Decreased retention; expected,a higher temperature willweaken all interactions
•
2.0 2.2 2.4
1.8 2.0 2.2 2.4
1.8 2.0Time (min)
2.2
Figure 7.12 Ionic liquid phase application. (Source: Supelco ionic liquid GC col-umns, Sigma-Aldrich, 22 January 2011. With permission.)

83Developments in Gas Chromatography
© 2010 Taylor & Francis Group, LLC
The reaction ion peak (RIP) represents the formation of H+(H2O)n, the reactant ion, by which chemical ionisation of VOCs takes place and can be displayed as shown in Figure 7.14. It should be noted that the output (Figure 7.14) is a three-dimensional output of MCC run time (e.g., 100 s), IMS drift time (e.g., 12 ms) and signal intensity (V).
IMS
inte
nsity
Runt
ime
GC-
sepa
ratio
n
IMS-separation
SingleIMS spectra
3DIMS chromatogram
pseudo-colour representationIMS chromatogram
Diacetyl PentandioneGC-separa
tion
Runtime
9.759.59.259.08.758.58.258.07.757.57.257.06.756.56.256.05.755.55.25
Figure 7.14 MCC–GC–IMS output. (Source: G.A.S., Dortmund, Germany, www.gas-dortmund.de. With permission.)
GC pre-separation(column variable)
IMS Separation and Detection
IMS separation
GC se
para
tion
Figure 7.13 MCC–GC–IMS. (Source: G.A.S., Dortmund, Germany, www.gas-dortmund.de. With permission.)

84 Forensic Applications of Gas Chromatography
© 2010 Taylor & Francis Group, LLC
Questions
1. What is a functional group? 2. Give the chemical structures of the following derivatising agents: (a)
BSTFA, (b) MSTFA, (c) TMSI and (d) MTBSTFA. 3. Give the chemical structures of the following derivatising agents:
(a) trifluoroacetic acid (TFAA), (b) pentafluoropropionic acid anhy-dride (PFPA) and (c) heptafluorobutyric acid anhydride (HFBA).
4. Identify some commercial suppliers of solid phase extraction cartridges.
5. Identify a forensic gas chromatography application that uses solid phase extraction.
6. Identify a forensic gas chromatography application that uses solid phase microextraction.
Reference 1. Frysinger, G. S., and R. B. Gaines. 2002. Journal of Forensic Science 47:471.
Further ReadingBayne, S., and M. Carlin. 2010. Forensic applications of high performance liquid chro-
matography. Boca Raton, FL: CRC Press.Kromidas, S. 2000. Practical problem solving in HPLC. Chichester, UK: John Wiley &
Sons Ltd.Meyer, V. R. 2010. Practical high-performance liquid chromatography, 5th ed.
Chichester, UK: John Wiley & Sons Ltd.Sadek, P. C. 1999. Troubleshooting HPLC systems: A bench manual. Chichester, UK:
John Wiley & Sons Ltd.Snyder, L. R., J. J. Kirkland and J. L. Glajch. 1997. Practical HPLC method develop-
ment, 2nd ed. Chichester, UK: John Wiley & Sons Ltd.
85© 2010 Taylor & Francis Group, LLC
Forensic Applications of Gas Chromatography
8.1 Introduction
In this chapter the applications of GC in five different contexts will be con-sidered, namely, drug analysis, forensic toxicology, fire debris, paint analy-sis and food and fragrance analysis. Each will be considered in turn using examples to illustrate its use of GC in a forensic application.
8.2 Drug Analysis
8.2.1 Introduction to Drug Analysis
Drugs of abuse such as amphetamines, heroin and cocaine are drugs that are sold by drug dealers and are commonly referred to as street drugs. Street drugs are rarely, if ever, pure substances. They are usually ‘cut’ with other substances, such as paracetamol, or other less pharmacologically active drugs, such as aspirin. They may also contain other compounds such as talc and/or sugars. This means that if a suspected drug sample requires analysis, there may be more than one compound present. However, as drug analysts, we are trying to establish if any drugs are present (or not) and, if necessary, to establish how much is present. It may also be necessary to identify those substances used to ‘cut’ the items or to carry out impurity profiling.
8.2.2 Forensic Analysis of Drugs
The amount of the substance suspected of being a controlled drug will deter-mine what tests can be carried out. For example, a swab from a set of scales thought to be used for the weighing of cocaine is classed as a trace sample. This means that the sample size is limited; as a consequence, the presump-tive colour tests and thin layer chromatography (TLC) approaches cannot be carried out here. In this situation, GC-MS would typically be used. If, on the other hand, a 1 kg block of off-white powder has been submitted for analysis, we have a bulk sample, which means that we can carry out more tests than we can with the trace sample.
8

86 Forensic Applications of Gas Chromatography
© 2010 Taylor & Francis Group, LLC
Typically, the analysis of suspected drugs of abuse is carried out by first preparing the analytical workspace. Swabs of the workspace will usually be taken before the physical examination takes place. This swab is taken to show that the space we have used for examination is free of drug substances. Assuming that a sufficient amount of sample is available for testing, a num-ber of analytical methods and techniques can be used, starting with pre-sumptive tests.
Presumptive tests are simple colour change tests that can be used to establish if an item may contain a drug compound; however, these tests are not specific and may produce a ‘positive’ for substances unrelated to drug compounds. For this reason, presumptive tests help the scientist to establish methods for further testing of the submitted item. If trace samples are being analysed, presumptive colour tests and TLC will not be carried out due to the limitation on sample size; the analyst will move straight to GC-MS.
8.2.3 Sample Types
The drug analysis laboratory may be faced with a number of different sam-ples, such as
• Tablets• Powder• Liquid• Plant material
8.2.4 Sample Preparation
Gas chromatography is one of the standard instruments used in drug analy-sis; however, many drug compounds do not chromatograph well using GC. Due to this fact, these compounds will require derivatisation. Derivatisation is used to modify the chemical structure of the analytes of interest in order to produce less thermally labile forms of the analyte(s) and/or to produce better peak shape. For further information on derivatisation, see Section 7.2.1. The derivatisation reactions are fairly straightforward and are carried out in GC vials.
Barbiturates and benzodiazepines, ecgonine alkaloids (with the excep-tion of cocaine), opiates, amphetamines and cannabinoids all require deri-vatising. On completion of the derivatisation step, samples will be loaded into the autosampler of the GC-flame ionisation detector (FID) or GC-MS instrument for analysis. Over the last five years or more, LC-MS has been introduced as an alternative or as a complementary technique. In this case, derivatisation is not required. See the Further Reading section of this chapter for more information on this technique.

87Forensic Applications of Gas Chromatography
© 2010 Taylor & Francis Group, LLC
8.2.5 Interpretation of Analytical Results
When drug samples are submitted to the laboratory for analysis, the purpose is to identify, quantify and/or profile. Some submitted items, such as canna-bis plants, may only require identification, whereas other items, such as 1 kg of off-white powder, will require identification of the drug(s) and establishing the amount of free base compound in the powder. This value is typically as a percentage of weight of the powder (e.g., 86% w/w). Many active drug com-pounds are present as salt forms of the pure compound; it is usual to establish the amount of pure compound (i.e., free base form) and not the salt form.
Profiling may also be carried out. The process of a drug travelling from the country of origin to other countries is called trafficking. Profiling can be used to compare seizures that are suspected of being connected by the same known routes of trafficking. Profiling can also be used to compare synthetic drugs thought to originate from the same source.
In the following sections, we will consider the categories of drugs that we may encounter within the drugs laboratory. For each drug, an example is provided for each category and a brief summary of the analytical strategy is provided. Drugs generally fall into one of the following categories: natural, semisynthetic, synthetic designer drugs and over-the-counter medication, on the basis of how they are derived.
8.2.5.1 Natural DrugsNatural drugs are those that contain active ingredients and secondary meta-bolic products that can be isolated by extraction processes. Examples include cannabis, psilocin and psilocybin.
Cannabis is the most consumed drug across the world. One of the most common botanical forms is Cannabis sativa (other strains containing vari-ous amounts of the pharmacologically active compound are also becoming commonly available), which is typically referred to as marijuana (herbal can-nabis), hashish (cannabis resin) or hemp (plants grown for their fibre content, which is a legitimate use). Since cannabis is one of the most consumed drugs in the world, it accounts for a large amount of drug work carried out in drug laboratories.
Cannabis can be submitted in a number of forms that can include plant material (both dried and growing plant), resin, and hashish oil (how-ever, the oil is rarely seen). The active compound in all forms of cannabis is Δ9-tetrahydrocannabinol (Δ9-THC); however, other cannabinoids are also found in cannabis and include Δ8-tetrahydrocannabinol, cannabidiol (CBD), cannabinol (CBN) and Δ9-tetrahydrocannabinolic acid (Δ9-THCOOH), which is converted to Δ9-THC through smoking.1 The chemical structures of some of these cannabinoids are shown in Figure 8.1.

88 Forensic Applications of Gas Chromatography
© 2010 Taylor & Francis Group, LLC
If the fresh plant is submitted for laboratory analysis, a physical exami-nation will be carried out in the first instance. If the leaves are palmate (hav-ing a shape similar to that of a hand with the fingers extended) with serrated edges, then the plant will have a very characteristic smell. In this case, a low-power microscope will be used to examine for cystolithic hairs on the top of the leaf and glandular hairs on the underside. The leaves and stem of the plant are coated in these small hairs, called trichomes, and it is these that contain the pharmacologically active cannabinoids. The plants are male or female, although the density of trichomes is much higher in female plants.
Dried plant can be of a high or low quality. The high-quality mate-rial generally contains flowers and fruiting tops only, whereas low-quality material generally contains flowering tops but also stalks, leaves and seeds. Hashish can contain between 2% and 10% Δ9-THC (by weight).1
On examination, if the dried material is crushed or finely chopped, then it is difficult to confirm the presence of the trichomes. In this situation, identification can only be carried out by extraction and subsequent GC-MS analysis. Cannabis resin is a product that is produced by scraping off the glandular trichomes and pressing the material into blocks. The resin can contain between 3% and 19% Δ9-THC.1 Hashish oil is produced when the cannabis plant is treated with a suitable solvent under reflux. This extracts the active cannabinoids and concentrates them into a thick, dark-coloured oil. The oil can contain between 10% and 40% Δ9-THC; however, only 0.05% of cannabis products seized worldwide in 2009 were in the form of oil.1 Much of the cannabis resin found in Europe is grown in Northern Africa; more specifically, it tends to originate from Morocco. The United States has a high production of cannabis that typically is found in the herbal form.
Material suspected of being cannabis resin will be examined physically; however, since the trichomes that are used to identify herbal cannabis will not be seen in resin, other tests will be carried out. These tests will be used to show the presence of Δ9-THC and other degradation compounds, such as cannabinol (CBN) and cannabidiol (CBD).
Typically, the first test to be carried out on finely shredded or grated resin is a presumptive colour test. The most commonly used presumptive reagent
O
CH3
H3CH3C
OH
C5H11
O
OH
∆9-THCOOH
O
CH3
OH
O
CH3
OH
C5H11C5H11
∆8-THC∆9-THC
H3CH3CH3C
H3C
Figure 8.1 Molecular structures of some cannabinoids.

89Forensic Applications of Gas Chromatography
© 2010 Taylor & Francis Group, LLC
for an item suspected of being cannabis is the Ducquenois–Levine test. This test consists of three reagents (reagent 1, acetaldehyde + vanillin; reagent 2, concentrated hydrochloric acid; and reagent 3, chloroform) that, when added to a suspected cannabis sample in order, will show a positive result if the organic layer (chloroform layer) becomes a violet colour. Presumptive colour tests are not definitive but do provide a good indication of what may be present.
After extraction, further analysis by TLC will be carried out to screen for the presence of cannabis and also as a comparative technique between samples. TLC is a further presumptive test that can be carried out to help identify the types of drugs present in the item under examination. Usually, a small amount of the item will be dissolved in an appropriate solvent and spotted onto a TLC plate alongside positive and negative controls. A typical TLC setup is shown in Figure 8.2.
Positive controls of cannabinoids (Δ9-THC, CBN, and CBD) and a solvent blank will be run alongside samples. When the TLC is complete, the plate will require a visualisation technique since the drugs are colourless. A reagent will be used (usually Fast Blue B) and a light source at 254 and 360 nm will be used.
If a swab is being analysed or further identification is required, GC-MS is employed. Cannabinoids will not chromatograph well and hence derivatisa-tion is required prior to GC-MS. Typically, N,O-bistrimethylsilyl acetamide (BSA) will be used to produce a trimethylsilyl derivative. (See Section 7.2.1 for further information on selection of derivatising reagents.)
8.2.5.2 Semisynthetic DrugsSemisynthetic drugs include products from natural sources that may have to undergo a chemical process for the active ingredient to be isolated. Examples include opiates, cocaine, tryptamines and LSD.
Papaver somniferum L., also known as the opium poppy, is cultivated worldwide. The two main licit uses of this plant are as a source of alkaloid compounds for the pharmaceutical industry and as a source of poppy seeds for the food industry. In addition, this plant is used illicitly in the manufac-ture of diacetylmorphine (the active component of heroin).
TLCchamber
Solvent filledto below
sample line
Figure 8.2 Thin layer chromatography setup.

90 Forensic Applications of Gas Chromatography
© 2010 Taylor & Francis Group, LLC
Opium is the substance that is formed from a milky exudate obtained by incising the unripe capsules of Papaver somniferum L. when it is air-dried. It is a complex mixture of sugars, proteins, lipids, water and active alkaloid compounds, which make up approximately 10%–20% of the latex. More than 50 alkaloids have been identified from opium, with five of them (morphine, codeine, thebaine, noscapine and papaverine) accounting for almost all of the quantitative alkaloid content.2 Three of these major alkaloids (morphine, codeine and thebaine) are classed as phenanthrene alkaloids and the molec-ular structures are shown in Figure 8.3.
Thebaine is used as a precursor for morphine and codeine by the phar-maceutical industry; however, it is rarely identified in heroin samples due to its limited control under the misuse of drug legislation in most countries.
If heroin is being illicitly synthesised from raw opium, the first step is to extract morphine from the opium latex. The extraction can be carried out by a number of routes, but one of the main routes is through the lime method. This involves the use of calcium hydroxide (lime) to precipitate out a crude morphine base, which is then dissolved in warm hydrochloric acid. The resulting product is the hydrochloride salt of morphine.
Diacetylmorphine (diamorphine) results from the reaction with mor-phine and acetic anhydride at elevated temperatures and the subsequent addition of sodium carbonate. The free base form of diacetylmorphine is produced. However, in some countries, the diacetylmorphine is further reacted with hydrochloric acid to produce the hydrochloride salt. The molec-ular structure of diacetylmorphine is shown in Figure 8.4.
The main country cultivating opium is Afghanistan; South East Asia (particularly Myanmar) and South America (particularly Colombia) are also recognised for opium cultivation.
In North America, the main source of heroin tends to be Mexico or Colombia; in the UK the heroin seized tends to have originated from Afghanistan and been trafficked through along the Balkan route. This route starts in Afghanistan and then goes through to South Eastern Europe and into Western Europe. In the UK, heroin samples have been adulterated with
OOH
N
CH3
HO
Morphine
O
N
OHCH3O
CH3
Codeine
OO
N
CH3
OCH3H3C
Thebaine
Figure 8.3 Molecular structures of three of the major opium alkaloids.

91Forensic Applications of Gas Chromatography
© 2010 Taylor & Francis Group, LLC
benzodiazepines and barbiturates. (Note: The Balkan route has three main trafficking pathways: The northern route runs from Bulgaria, Romania and Turkey to Poland, Germany, Hungary and Austria; the southern route runs through Greece, Turkey, Italy and Albania; and the central route runs through Turkey, Bulgaria, the Former Yugoslav Republic of Macedonia, Serbia, Montenegro, Bosnia and Herzegovina, Croatia, Slovenia and into either Italy or Austria.3) Items suspected of containing heroin will be examined, as with cannabis, initially with presumptive colour tests. The Marquis reagent will give a violet-purple colour if an opiate is present. Again, TLC can be used; however, acidified potassium iodoplatinate will be used to visualise any opi-ates. Light of 254 and 360 nm will again be used, as with cannabinoids.
Confirmation and quantitation will subsequently be carried out using GC-MS. Opiates can be analysed derivatised or underivatised. When deriva-tisation is carried out, BSA will be used to produce a trimethylsilyl derivative.
The purity of Afghan heroin is approximately 70%, but this is much higher than what is sold on the global streets. Heroin can contain between 0% and 35% opiates.
Cocaine is derived from ecgonine alkaloids present in the leaf of the coca plant (Erythroxylon species). It is typically found in the form of a cocaine hydrochloride or as free base (commonly known as ‘crack’). The leaves from the coca plant tend to be mixed with calcium hydroxide and water and the mixture is crushed and stirred in a hydrocarbon solvent (typically kerosene or paraffin). The extracted coca leaf pulp is rejected and hydrocarbon solvent is extracted with acidified water. Cocaine alkaloids are then extracted into the aqueous layer and coca paste is precipitated by addition of a base (such as calcium hydroxide or ammonia). This coca paste is then dissolved in sulph-uric acid to produce ecgonine. Potassium permanganate can be added at this point to remove cinnamoylcocaine isomers that may be present. The solution is typically left to stand and the filtrate is made basic to produce cocaine base, which is further dissolved in ether. This solution is filtered and hydrochloric acid is added to produce the hydrochloride salt. Adding sodium bicarbonate to the wet mixture and heating in the microwave can produce the ‘crack’
OO
N
CH3
O
O
H3C
O
CH3
Figure 8.4 Molecular structure of diacetylmorphine.

92 Forensic Applications of Gas Chromatography
© 2010 Taylor & Francis Group, LLC
form of cocaine. The molecular structures of cocaine, ecgonine and benzoy-lecgonine are shown in Figure 8.5.
Cocaine is mainly produced in Southern and Central America, predomi-nantly in Colombia but also in Bolivia and Peru. The cocaine found in North America is trafficked from South America through Mexico; the cocaine in Europe has been shown to have originated from Bolivia and Peru. The amount of cocaine present tends to be between 60% and 80% (by weight) in cocaine hydrochloride and up to 90% in crack cocaine.
8.2.5.3 Synthetic DrugsSynthetic drugs are artificially produced for the illicit market and almost wholly manufactured from chemicals in illicit or clandestine laboratories. Synthetic drugs include amphetamines and other amphetamine-related com-pounds. Amphetamines and amphetamine-type stimulants (ATS) are deriv-atives of β-phenethylamine (the chemical structure is shown in Figure 8.6).
Amphetamines available on the illicit market include, for example, amphetamine, methylamphetamine, methylenedioxy amphetamine (MDA), methylenedioxymethylamphetamine (MDMA) and methylenedioxyethyl-amphetamine (MDEA). Many other amphetamine type stimulants are also available on the illicit market. The chemical structures of some of these com-pounds are shown in Figure 8.7.
Amphetamine tends to be found as the sulphate salt and is a white to off-white powder. Methylamphetamine is also found as a powder, whereas
HO
COOCH3
NH3C
O
HOH
NH3C
OOH
HO
NH3C
O
OOH
Cocaine Benzoylecgonine
Ecgonine
Figure 8.5 Molecular structure of three ecgonine alkaloids extracted from coca leaf.
NH2
Figure 8.6 β-Phenylethylamine.

93Forensic Applications of Gas Chromatography
© 2010 Taylor & Francis Group, LLC
MDA and MDMA tend to be found in tablet forms, which vary in colour and logo (if used). Logos, such as the smiley face or cartoon characters, may be embossed onto tablets; these logos will be specific to the people or organisa-tion who has manufactured the tablets.
After physical examination, presumptive colour tests will be carried out; the Marquis reagent is used with amphetamines. With this reagent, amphet-amine will produce an orange colour, methamphetamine will produce a yel-lowish-green colour and MDMA will produce a black colour. When TLC is used, Fast Black K can be used as a visualisation reagent. For confirmation, GC-MS will be used.
8.2.5.4 Designer DrugsDesigner drugs are substances whose chemical structures have been modi-fied to optimise their effects but also to bypass laws and regulations that con-trol them. One of the first examples of this type of drug was ecstasy. When initially introduced in the 1970s, ecstasy was the US street name for prepara-tions containing methylenedioxymethyl amphetamine (MDMA). Now the term ‘ecstasy’ describes tablets predominantly containing one (or more) psy-chotropic agents derived from the β-phenethylamine group of compounds. More recently, there has been an influx in the illicit drug market of syn-thetic cannabinoids and synthetic cathinones (sometimes called bath salts). In 2012, these compounds were legislated against in both the UK and the United States.
8.2.5.5 Over-the-Counter or Prescription-Only MedicationOver-the-counter (OTC) medication such as paracetamol (acetaminophen) can be found as a compound added to bulk out other illicit drugs. Other drugs may also be found in the same samples and may include other prescrip-tion-only medication (PoM) or OTC preparations (due to ease of availabil-ity). Drugs bought over the Internet, from erectile dysfunction medication
CH3
NH2
CH3
NH.CH3
CH3
NH2O
O
CH3
NH.CH3O
O
Amphetamine
Methylamphetamine
Methylenedioxyamphetamine
Methylenedioxymethylamphetamine
Figure 8.7 Molecular structures of some amphetamines.

94 Forensic Applications of Gas Chromatography
© 2010 Taylor & Francis Group, LLC
to cancer treatments, can be submitted to the laboratory for analysis. These drugs may contain little or no active compound and/or may contain sugars, talc or other medication unrelated to the advertised active compound.
Drugs such as barbiturates and benzodiazepines may be sold as ‘downers’ or may be abused (taking more than the prescribed dose) by people who hold a prescription. Both benzodiazepines and barbiturates are central nervous system depressants; however, benzodiazepines have superseded barbiturates as treatment for anxiety and for sedation, but the latter group of compounds is still used to treat some forms of epilepsy.
One example that shall be considered in this section is the analysis of a mixture of three barbiturates (butobarbital, pentobarbital, and phenobar-bital). The chemical structures and principal ions for mass spectrometric analysis are shown in Figure 8.8.
The analysis was carried out on a Thermo Electron DSQ GC-MS with a DB-5MS (30 m × 0.25 mm) 0.25 μm film thickness column fitted. The method shown in Table 8.1 was used in the analysis.
Figure 8.9 shows the total ion chromatogram (TIC) for the analysis of butobarbital, pentobarbital and phenobarbital. As can be seen, the first two peaks are fairly close together (11.8 and 12.6 min, respectively); then the third compound follows shortly behind (15.0 min).
By consideration of the first two peaks and examining their associated mass spectra (Figure 8.10), it is observed that they are very similar. Both of
N
NO O
O
N
NO O
O
N
NO O
O
ButobarbitalPrincipal ions m/z 141,156
PentobarbitalPrincipal ions m/z 141,156
PhenobarbitalPrincipal ions m/z 204,117,146
Figure 8.8 Molecular structures of the three barbiturates analysed.
Table 8.1 GC-MS Instrument Parameters for Analysis of Barbituratesa
GC Method Parameters Mass Spectrometry Parameters
Injection volume: 1 μLTemperature program: 90°C held for 2 min, then increased at 10°C/min until 280°C and held for 10 min
Injection port temperature: 250°CCarrier gas: Heat a flow rate of 1 mL/minSplit ratio: 20:1MS transfer line temperature: 270°C
Ion source temperature: 250°CMode: positive ionFull scan range: 50–650 Da
a Provided courtesy of Gary Noble, Northumbria University, 2012.

95Forensic Applications of Gas Chromatography
© 2010 Taylor & Francis Group, LLC
the analytes have a mass spectrum with both 141 and 156 Da as the prin-cipal ions. Of the three barbiturates being analysed, all three have well-documented mass spectra data and both butobarbital and pentobarbital have principal ions of 141 and 156 Da. It is therefore virtually impossible to differ-entiate between the two based on mass spectra alone. Normally, single drug standards of the three analytes would be run to establish the retention times of the analytes of interest. (Note: There is some tailing on the three peaks because the concentrations of each of the barbiturates in the mixture were particularly high.)
By comparing the first two peaks and mass spectra to the third peak (Figure 8.11), it is observed that this analyte has a mass spectrum with prin-cipal ions of 204 and 117 Da; these are the principal ions associated with phenobarbital.
8.3 Forensic Toxicology
8.3.1 Introduction to Forensic/Analytical Toxicology
A poison can be defined as follows: ‘What is there that is not a poison? All things are poison and nothing [is] without poison. Solely the dose determines that a thing is not a poison’ (Paracelsus 1493–1541).
100
90
80
70
60
50
40
Rela
tive A
bund
ance
30
20
10
00 5 10 15
Time (min)20 25 30
Figure 8.9 Total ion chromatogram for butobarbital, pentobarbital and phenobarbital.

96 Forensic Applications of Gas Chromatography
© 2010 Taylor & Francis Group, LLC
100
90
80
70
60
50
40
Rela
tive A
bund
ance
30
2055.05 97.99
69.03 167.08206.96 281.03 339.27 415.02 453.49 518.61 565.99 646.86
156.03
141.00
10
050 100 150 200 250 300 350
m/z400 450 500 550 600 650
100
90
80
70
60
50
40
Rela
tive A
bund
ance
30
2055.04
97.99 197.09207.06 281.57 341.68 400.33 429.01 523.46 550.03 626.20
156.03140.99
10
050 100 150 200 250 300 350
m/z
(a)
(b)
400 450 500 550 600 650
Figure 8.10 Mass spectra of peaks with (a) retention time of 11.8 min and (b) retention time of 12.6 min.

97Forensic Applications of Gas Chromatography
© 2010 Taylor & Francis Group, LLC
100
90
80
70
60
50
40
Rela
tive A
bund
ance
30
20
0
10
14.2 14.4 14.6 14.8 15.0 15.2 15.4Time (min)
15.6 15.8 16.0
(a)
100 204.00
77.04
117.05
146.05 232.06
280.94 356.48 383.48 427.80 498.13 565.59 637.19
90
80
70
60
50
40
Rela
tive A
bund
ance
30
20
0
10
50 100 150 200 250 300 350 400m/z
450 500 550 600 650
(b)
Figure 8.11 (a) TIC for the third analyte in the barbiturate mixture; (b) associ-ated mass spectrum.

98 Forensic Applications of Gas Chromatography
© 2010 Taylor & Francis Group, LLC
8.3.2 Routes of Administration
For drugs and other poisons to have any effect on an individual they first have to enter the body. There are various routes, called routes of administration, which these compounds can take to enter the body (with the main routes explained next). For the purposes of conciseness, this chapter will focus only on drugs of abuse. The field of toxicology covers many different compounds that can be found in biological matrices; for more information on the field of toxicology and the broad range of compounds encountered see the Further Reading section at the end of this chapter. When a drug enters the body, it will eventually reach the bloodstream. The bloodstream is the mode of trans-port for the drug to move around the body and thus to cause an effect. The first point to consider is how a drug enters the human body. The following are the common routes of administration:
Intravenous administration: This involves the injection of a compound in liquid form, through a vein and into the bloodstream. This is one of the fastest routes of administration since the drugs directly enter the bloodstream.
Inhalation: Drugs are absorbed by entering and travelling down the trachea and on into the lungs for absorption into the bloodstream. This is a relatively speedy route of administration.
Oral/swallowing: Oral administration of a drug involves the introduc-tion of the compound into the mouth, through the oesophagus, and down the gastrointestinal tract and into the stomach. Some of the drugs will be absorbed through the stomach wall while some will move through the digestive system into the intestines and will be absorbed there. For some drugs, such as morphine, first-pass metab-olism may occur through this route. This is where the concentration of a drug is greatly reduced before entering the bloodstream. This reduction of concentration usually occurs when a drug is adminis-tered orally and enters the digestive system and then the hepatic por-tal system. A large proportion of the original concentration of active drug will travel through the portal vein directly to the liver where it will be metabolised before being absorbed into the body.
Intramuscular administration: This is an injection of the drug directly into a muscle and then into the bloodstream. How well and how quickly a particular drug will enter the bloodstream depends upon the chemistry of the compound.
Subcutaneous: This type of administration involves the introduction of the drug, by injection, into the fatty tissue just below the skin. The drug will enter the lymphatic or blood vessels before entering

99Forensic Applications of Gas Chromatography
© 2010 Taylor & Francis Group, LLC
the bloodstream. The route by which the drug enters the blood will depend on the chemistry of the drug.
Dermal sorption: The drug is absorbed through the skin into the tissue below and on into the bloodstream. Not all drugs can be adminis-tered in this way.
After administration, the drug undergoes the following processes:
• Absorption: After administration of a drug into the body, the pro-cess of absorption takes place. This is where the drug is absorbed from the site of administration into the bloodstream. The route of administration can greatly affect how the drug will be absorbed.
• Distribution: Once in the blood, the drug travels through the body in the flow of the blood, affecting various organs. The distribution of the drug is facilitated by the fluid in the body.
• Metabolism (biotransformation): The key organs in metabolism are the liver, lungs, kidneys and intestine. In metabolism, there are two types of reaction. Phase I reactions are functionalisation reactions and are intended to deactivate (detoxify) xenobiotics, but sometimes they do the opposite (e.g., produce active metabolites, which in some cases can be more potent than the drug/xenobiotic itself). For exam-ple, Figure 8.12 shows the oxidation of Δ9-tetrahydrocannabinol (Δ9-THC), to produce Δ9-THC, which is thought to be more pharma-cologically active than the Δ9-THC itself. Δ9-THC is the pharmaco-logically active compound present in cannabis. Phase II reactions are conjugation reactions. This type of reaction produces water soluble metabolites that can be easily excreted from the body (through the kidneys into urine). For example, the glucuronidation of tetrahydro-cannabinol carboxylic acid (THC–COOH) to produce the water-sol-uble form for elimination is shown in Figure 8.13 as an example of a phase II reaction.
O
CH3
H3CH3C
OH
C5H11 O C5H11
OH
OH
H3CH3C
Oxidation
Figure 8.12 Oxidation of D9-THC to D9-THC.

100 Forensic Applications of Gas Chromatography
© 2010 Taylor & Francis Group, LLC
• Elimination: The kidneys are the most important organ for elimina-tion of drugs and/or their metabolites. Some compounds are also eliminated through sweat, exhaled air, bile, saliva and faecal matter.
8.3.3 Biological Specimens
The types of biological specimens encountered in the toxicology laboratory are shown in Table 8.2.
Note that not all of these samples will be taken, even if they are avail-able. Blood is by far the best specimen for analysis and subsequent inter-pretation. However, in postmortem cases, liver (collected from deep within the right lobe to reduce the possibility of postmortem redistribution), gastric contents and sometimes vitreous humour will be collected. Other samples will be used for analysis, particularly when a body is decomposed, because preferred specimens such as blood are no longer available. For further infor-mation on sample choices and collection, please see specialist books found in the Further Reading section at the end of this chapter.
O
OOH
H3C
H3C C5H11 O
OO
H3C
H3C
O
O
HO
OH
OHHO
C5H11
Glucuronidation
Figure 8.13 Glucuronidation of THC-COOH.
Table 8.2 Typical Biological Specimens in Toxicology
Antemortem/Clinical Postmortem
Blood BloodUrine UrineBreath Vitreous humourOral fluid (or saliva) Gastric contentsSweat Lung tissueHair/nail Liver tissue
Muscle tissueBrainHair/nailBile

101Forensic Applications of Gas Chromatography
© 2010 Taylor & Francis Group, LLC
There are a number different ways in which to classify drugs that may be investigated in toxicology. (Note: The classification used in this chapter is not the same as the one used in the previous chapter. Here we will use the clas-sification for the way that the drug acts when it enters the body.)
Central nervous system stimulants: This group of drugs will increase the rate of mental and physical responses. Examples include cocaine, amphetamine, MDMA, caffeine and methylphenidate.
Central nervous system (CNS) depressants: This group of drugs reduces the activity of the brain. The most commonly encountered CNS depressant in the UK and United States is ethanol (or alcohol). Other examples of CNS depressants are benzodiazepines (e.g., alpra-zolam, diazepam and flunitrazepam) and barbiturates (e.g., pheno-barbitone, pentobarbital and amylobarbitone).
Narcotic analgesics: This group of drugs is used to relieve moderate to severe pain. Examples include opioids such as morphine, diacetylmor-phine, codeine, propoxyphene, oxycodone, fentanyl and tramadol.
Hallucinogens: These drugs will produce hallucinations in an individ-ual. Examples include lysergic acid diethylamide (LSD), psilocybin, mescaline, ketamine and phencyclidine (PCP).
Other: This may include inhalants such as carbon monoxide and organic solvents such as those found in glues and aerosols.
8.3.4 Sample Pretreatment
Due to the nature of samples in toxicology, it is necessary to carry out sample pretreatment to clean up the sample prior to analysis by GC. If this is not carried out, it is possible that the GC liner (see Chapter 2) and column will be contaminated with the sample matrix, thus reducing the sensitivity of the detection (if not impeding detection altogether). The type of pretreatment chosen depends upon the matrix being analysed.
8.3.4.1 Protein PrecipitationProtein precipitation is a technique used in toxicology that is used to remove the protein content of human body fluids and tissues before they are analysed. The reason for this is that in these samples, the protein content can vary from 6% to more than 50%, by weight, in some tissues. This can greatly affect the possibility of detecting and quantifying drug or metabolite concentrations.
Generally, a precipitation reagent will be used, such as an organic solvent (e.g., acetonitrile or methanol) or a salt and an acid (e.g., ammonium sul-phate and hydrochloric acid). Once the proteins have been precipitated, the solid protein will then be removed by filtering or by centrifuging. The rest of

102 Forensic Applications of Gas Chromatography
© 2010 Taylor & Francis Group, LLC
the liquid sample will then be further cleaned up before extraction or extrac-tion will occur immediately after the protein precipitation stage.
8.3.4.2 HydrolysisMany drugs and metabolites will form conjugates with d-glucuronic acid as glucuronides or with sulphates that will be excreted in the urine. It is impor-tant in toxicological analyses that appropriate consideration is taken to dif-ferentiate between ‘free’ and ‘bound’ drugs or metabolites. Either selective (enzymatic) or nonselective (chemical) hydrolysis can be carried out on the urine sample.
Enzymatic hydrolysis methods produce clean extracts; however, they take much more time to carry out and are also more expensive than chemical methods. A number of enzymes can be used and are commercially available. Typically, overnight incubation with β-glucuronidase and/or arylsulfate is carried out, but control of pH and temperature is required to achieve opti-mum cleavage of the conjugate bond. Chemical hydrolysis methods are harsh and require strong acids or alkalis at elevated temperatures, usually in a pres-sure cooker or microwave oven. These methods do, however, yield unwanted by-products and generally require time-consuming cleanup procedures.
8.3.5 Extraction Techniques
Extraction techniques, in particular liquid–liquid extraction (LLE) and solid phase extraction (SPE), are used in toxicological analysis and some drug analysis, prior to chromatographic analysis. The process of extraction is used to extract organic substances, such as drugs, directly from body fluids and tissues. The two main types of extraction used in these types of analyses are liquid–liquid extraction and solid phase extraction.
8.3.5.1 Liquid–Liquid ExtractionLiquid–liquid extraction has been discussed in Chapter 7. The following example outlines the analytical method used for preparing an ‘unknown’ blood sample using a combination of pH adjustment and LLE prior to GC-MS analysis. First, a 1 mL volume of the blood is transferred into a screw-top test tube. To this, 20 μL of a 0.1 mg/L standard of Proadifen as internal stan-dard is added. (Note: Proadifen is used in our laboratory since it is ampho-teric; this means that it will be extracted in both the acidic and basic layers.) Typically in a working forensic toxicology laboratory, a deuterated analogue of the compound being quantified is added as the internal standard.
To extract any acidic compounds present in the blood sample, 1 mL of 0.025 M hydrochloric acid is added to the sealed test tube containing the blood. To this, 5 mL of diethyl ether is added, the lid replaced and the tube

103Forensic Applications of Gas Chromatography
© 2010 Taylor & Francis Group, LLC
placed on a rotator mixer for 10 min. After this, the blood sample is placed into a balanced centrifuge and centrifuged at 2000 rpm for 3 min and the top solvent layer transferred into a clean test tube, labelled ACIDIC EXTRACT, using a Pasteur pipette. The blood is then further pH adjusted, this time using a 3% solution of sodium hydroxide. Then, 1 mL of the sodium hydroxide is added to the blood; the blood sample should now be approximately pH 9. Any basic compounds present in the blood sample will now be extracted into the organic solvent. As before in the acidic extraction, 5 mL of diethyl ether is added to the screw-top lid, the top replaced, and the tube and contents placed on the rotator mixer for 10 min.
Again, the blood sample is centrifuged at 2000 rpm for 3 min and the top solvent layer transferred into a clean test tube labelled with BASIC EXTRACT. Both extracts are then placed into a sample concentrator (Figure 8.14) and the solvent evaporated under nitrogen gas. When both are evaporated to dry-ness (Figure 8.14), the residue is reconstituted in 100 μL of ethyl acetate, fil-tered and placed into a vial for GC-MS analysis.
If any acidic compounds are present in the blood sample, they should be seen in the chromatogram of the acidic blood extract, and if any basic com-pounds are present, they should be seen in the chromatogram of the basic blood extract. The results of these extractions will be discussed in Section 8.3.6.
8.3.5.2 Solid Phase ExtractionThe type of SPE cartridge used will depend upon the analytes being exam-ined; however, mixed mode cartridges are fairly commonly used in forensic toxicology. Solid phase extraction has been discussed in Chapter 7 and you can find more information on choosing the appropriate SPE cartridge for your analysis in Section 7.2.2.
(a) (b) (c) (d)
Figure 8.14 (a) Blood pH adjusted and diethyl ether added; (b) blood sample after rotator mixer; (c) sample dried in sample concentrator; (d) residue left after dry down under nitrogen.

104 Forensic Applications of Gas Chromatography
© 2010 Taylor & Francis Group, LLC
8.3.6 Interpretation of Analytical Results
The interpretation of analytical results depends upon the purpose of analysis. Interpretation of the analytical data requires access to data on the concentra-tions of drugs or metabolites in biological samples and knowledge of their effects, including other factors that may influence these effects.
One of the important points to consider is the condition of the biological sample (i.e., the level of decomposition). Other factors, such as tolerance to the drug, should also be considered.
8.3.6.1 A Toxicology ExampleIn Section 8.3.5.1, the LLE method for extracting both acidic and basic compounds from a blood sample was provided. In this section, the result-ing chromatograms and the associated mass spectra will be examined, to establish what if anything is present in our sample. The method shown in Table 8.3 was used in the analysis.
Figure 8.15 shows the total ion chromatogram (TIC) for the acidic extract from the unknown blood sample. As can be seen, this is a particularly complex chromatogram. (Note: The method of pH adjustment and liquid–liquid extraction applied will extract many of the fatty acid components of the blood sample, along with any other acidic compounds present.) It is not necessary to quantify these endogenous compounds; however, we must take account of them.
Typically, we will analyse the mass spectra for each of the peaks in the sample. With time, an analyst will become familiar with the mass spectra for commonly encountered drugs. When examining the mass spectra for the TIC in Figure 8.15, it was noted that the mass spectrum for diazepam may have been present. In order to confirm the presence of diazepam, the princi-pal ion for diazepam (285 Da) was extracted from the TIC and the result is shown in Figure 8.16.
On examining the mass spectrum for the peak at 14.9 min (Figure 8.17), it can be seen that the peak is consistent with a fatty acid. Again, analysts will become familiar with commonly encountered endogenous compounds
Table 8.3 GC-MS Instrument Parameters for the Analysis of an ‘Unknown’ Blood Samplea
GC Method Parameters Mass Spectrometry Parameters
Injection volume: 1 μLTemperature program: 60°C held for 2 min, then increase to 300°C at 15°C/min
Injection port temperature: 250°CCarrier gas: Heat a flow rate of 1.5 mL/minMS transfer line temperature: 300°C
Ion source temperature: 250°CMode: positive ionFull scan range: 40–450 Da
MS detector switched on at a run time of 4.5 min
a Provided courtesy of Dr Alan Langford, Northumbria University.

105Forensic Applications of Gas Chromatography
© 2010 Taylor & Francis Group, LLC
100
90
80
70
60
50
40
Rela
tive A
bund
ance
30
20
00 2 4 6 8 10
Time (min)12 14 16 18 20
10
Figure 8.15 Total ion chromatogram of the acidic extract from the unknown blood sample.
100
90
80
70
60
50
40
Rela
tive A
bund
ance
30
20
00 2 4 6 8 10
Time (min)12 14 16 18 20
10
Figure 8.16 Extracted ion (285 Da) chromatogram for acidic extract.

106 Forensic Applications of Gas Chromatography
© 2010 Taylor & Francis Group, LLC
present in biological specimens, and fatty acids are one of these compounds. The mass spectrum (Figure 8.18) is consistent with the mass spectrum of octadecanoic (stearic) acid.
However, this mass spectrum is consistent with diazepam. This can be checked by running a known standard of diazepam under the same instru-ment settings for comparison. It is also possible to use a library to search for a compound with similar mass spectra on the software available on the GC-MS. The most abundant ion in this mass spectrum (diazepam) is 256 Da and the next is 283 Da. However, sometimes, the opposite is seen and the 283 Da is the most abundant, followed by the 256 Da. Since diazepam has been identified, the potential metabolites of this drug should be considered and investigated for their presence in the blood sample. As we know that drugs will be metabolised when they have entered the body, it is important to consider the metabolite(s) expected. The main metabolite of diazepam is desmethyldiazepam (nordazepam). The principal ion for this compound is 242 Da; therefore, this ion will be extracted from the TIC (Figure 8.19).
Again, multiple peaks are present in the extracted chromatogram. By examining the mass spectrum for the peak at 12.8 min (Figure 8.20), another fatty acid commonly found in blood, pentadecanoic (palmitic) acid, is found.
At 14.9 min, the same peak that has already been identified as octadec-anoic (stearic) acid is again present. In the mass spectrum for the peak at 17.1 min (Figure 8.21), the most abundant ion is found at 242 Da. The other principal ion is at 269 Da, which is what is expected for desmethyldiazepam.
100
90
80
70
60
50
40
Rela
tive A
bund
ance
30
20
050 100 150 200 250 300
98.08
143.06171.13 199.14
185.13
255.24
327.20 355.11 402.23 430.24
284.22
83.03
72.96
55.02
m/z350 400 450
10
Figure 8.17 Mass spectrum for peak at 14.9 min.

107Forensic Applications of Gas Chromatography
© 2010 Taylor & Francis Group, LLC
100
90
80
70
60
50
40
Rela
tive A
bund
ance
30
20
10
050
41.0088.98 151.07
165.07177.09 241.16
221.11
300.31
283.11
256.09
342.23 371.44 410.46 431.36
110.07127.06
100 150 200 250m/z
300 350 400 450
Figure 8.18 Mass spectrum for the peak at 16.7 min.
100
90
80
70
60
50
40
Rela
tive A
bund
ance
30
20
10
00 42 6 8 10 12
Time (min)1614 18 20
Figure 8.19 Extracted ion (242 Da) chromatogram for acidic extract.

108 Forensic Applications of Gas Chromatography
© 2010 Taylor & Francis Group, LLC
100
90
80
70
60
50
40
Rela
tive A
bund
ance
30
20
10
050
110.16
151.15207.09
269.09
242.07
235.11
297.29 329.15 386.07 429.21355.17
178.0876.03
103.02
100 150 200 250m/z
300 350 400 450
Figure 8.21 Mass spectrum for the peak at 17.1 min.
100
90
80
70
60
50
40
Rela
tive A
bund
ance
30
20
10
050
60.02
129.03
143.08
87.02
213.21
242.24
199.12
185.15
281.62 324.11 342.19 403.00 426.65
72.98
97.07
100 150 200 250m/z
300 350 400 450
Figure 8.20 Mass spectrum for the peak at 12.76 min.

109Forensic Applications of Gas Chromatography
© 2010 Taylor & Francis Group, LLC
Again, a known standard of this metabolite would be run and retention times and mass spectra compared.
Since an internal standard (Proadifen) was added to the blood sample prior to extraction, it must also be identified in the blood sample. The molec-ular ion for this compound is 86 Da; therefore, this ion can be extracted from the TIC, as we have done previously (Figure 8.22).
The first two peaks on the chromatogram are the already identified fatty acids; the mass spectrum for the third peak at 15.9 min (Figure 8.23) shows the most abundant ion at 86 Da, which is what is expected for Proadifen. As previously mentioned, a pure standard would be run for comparison.
On examining every peak on the original TIC (Figure 8.15) no other drugs were found in the acidic extract. The same procedure was carried out for the basic extract; however, only Proadifen (internal standard) was found. This is expected since Proadifen is amphoteric.
8.4 Forensic Analysis of Fire Debris
In order for a fire to occur, several conditions must exist:
• A combustible fuel must be present.• An oxidiser (such as the oxygen in air) must be available in suffi-
cient quantity.
100
90
80
70
60
50
40
Rela
tive A
bund
ance
30
20
10
00 42 6 8 10 12
Time (min)1614 18 20
Figure 8.22 Extracted ion (86 Da) chromatogram for acidic extract.

110 Forensic Applications of Gas Chromatography
© 2010 Taylor & Francis Group, LLC
• Energy, as some means of ignition (e.g., heat), must be applied.• The fuel and oxidiser must interact in a self-sustaining chain reaction.
8.4.1 Combustion
Combustion is an oxidative decomposition in which an oxidant (usually oxy-gen) oxidises a fuel. Combustion is an exothermic (heat-releasing) reaction in which the reactants are converted to products that are predominantly gas-eous in nature. The product gases heat up and expand and, during a fire, this expansion generates plumes with predictable behaviours that leave distinc-tive markings at the scene of the fire. These markings are typically referred to as postfire indicators and will be used to help a fire investigator establish what may have happened.
Fire is essentially a chemical reaction producing physical effects. It is important to understand what a chemical reaction is and how it is involved in a fire since there are many chemical reactions taking place at the same time. The main reactions that take place during a fire are known as oxidative reactions. These reactions occurring during a fire are the atoms in the fuel being oxidised by the oxygen in the air.
Most of the important fuels involved in structure (buildings) and forest fires are organic compounds. Organic compounds are many and varied but will always contain carbon (C) and hydrogen (H) and sometimes oxygen (O), nitrogen (N), sulphur (S) and phosphorus (P). The most basic of the organic compounds are hydrocarbon compounds and are composed solely of carbon
100
90
80
70
60
50
40
Rela
tive A
bund
ance
30
20
10
050
124.34
147.31
222.31
240.71
86.05
292.41 320.38370.69 414.49345.08
193.3075.27
99.06
100 150 200 250m/z
300 350 400 450
Figure 8.23 Mass spectrum for the peak at 15.9 min.

111Forensic Applications of Gas Chromatography
© 2010 Taylor & Francis Group, LLC
and hydrogen with the simplest of these being methane (CH4). Hydrocarbons are very good fuels, but it is rare to find pure compounds used commercially due to the cost involved in the isolation process. Even if the pure compounds are isolated, they may not have the desired physical or chemical properties and would require blending with (an)other compound(s). Almost all com-mercial fuels associated with fires are mixtures of large numbers of individ-ual compounds that are chemically similar, thus making their combustion behaviour similar.
As previously mentioned, methane (CH4) is the simplest of the hydrocar-bons. If we consider the combustion reaction of this hydrocarbon, methane is the reactant, oxygen (O2) is the oxidising agent, and carbon dioxide (CO2) is the product of the oxidised methane:
CH4(g) + 2O2(g) → CO2(g) + 2H2O(g) (8.1)
The generic combustion reaction is given in Equation (8.2). This equation describes the process of complete combustion:
CxHy(s,l,g) + O2(g) → CO2(g) + H2O(g) (8.2)
If there is a lack of oxygen, the reaction cannot proceed to produce CO2; instead, carbon monoxide (CO) is produced. Also produced in the case of incomplete combustion is solid carbon (C), seen as soot:
CxHy(s,l,g) + O2(g) → CO2(g) + H2O(g) + CO(g) + C(s) (8.3)
Carbohydrates are another class of organic compounds considered in the study of combustion processes. These compounds are structurally more complicated than hydrocarbons and make up the bulk of wood (the most common fuel of structural fires). Carbohydrates differ from the hydrocar-bons in very significant ways. Most notably, they contain a relatively high content of oxygen, which means that they are already partially oxidised. The process of burning wood is simply a completion of the oxidation that started in the synthesis of the fuel itself.
Carbohydrates include the elements carbon, hydrogen and oxygen in multiples of the general formula –CH2O–. The simplest of the carbohydrates is glucose: C6H12O6. The complete combustion of glucose is
C6H12O6(s) + O2(g) → CO2(g) + H2O(g) (8.4)
8.4.2 Hydrocarbon Fuels
When a fire is started deliberately, ignitable liquids may be used to acceler-ate the fire. Some of the ignitable liquids that may be encountered are petrol

112 Forensic Applications of Gas Chromatography
© 2010 Taylor & Francis Group, LLC
(gasoline), lighter fluid, paint thinner and turpentine. Other less commonly encountered ignitable liquids such as methylated spirits, diesel and toluene may also be found.
8.4.2.1 PetrolPetrol (also known as gasoline) is a complex mixture of chemicals obtained from the distillation of crude oil with performance-enhancing chemicals added by the company blending the product. Petrol is typically used as a fuel for light road vehicles (e.g., cars) and small motorised devices (e.g., lawn mowers) and is typically composed of hydrocarbons with chain lengths of C4 to C12.
When analysed by GC-MS, petrol produces a fairly characteristically shaped chromatogram (Figure 8.24); however, petrol evaporates easily, so what is generally found is that there will be very variable proportions of the different peaks because of the ease of weathering. Weathering is a term used to describe the evaporation effects of ignitable liquids. Weathering can be controlled in a laboratory environment when an ignitable liquid will be left until a certain volume of the liquid has evaporated. For example, if the start-ing volume for petrol is 100 mL and 50 mL is left after evaporation, then the liquid is 50% weathered. This is much more difficult to control and understand in an actual fire scenario since there are many environmental
1e+07
9000000
Abundance
8000000
7000000
6000000
5000000
4000000
3000000
2000000
1000000
01.00Time --> 2.00 3.00 4.00 5.00 6.00 7.00 8.00 9.00 10.00 11.00 12.00 13.00 14.00 15.00
a
b cd
e
Figure 8.24 Total ion chromatogram of a pure petrol standard sampled by SPME. Peak identification: (a) toluene, (b) ethylbenzene, (c) m,p-xylene, (d) o-xylene, (e) 1,2,4-trimethylbenzene.

113Forensic Applications of Gas Chromatography
© 2010 Taylor & Francis Group, LLC
parameters that can affect weathering (e.g., the weather, temperature and how the fire was extinguished).
Compounds with shorter retention times are lighter (weight) and have lower boiling points. These compounds are more susceptible to thermal decomposition.
8.4.2.2 DieselDiesel is a heavy petroleum distillate and contains hydrocarbons between C8 and C20. The total ion chromatogram for a pure standard of diesel is shown in Figure 8.25. Diesel contains the longer and heavier hydrocarbons such as hexadecane, heptadecane and nonadecane. Diesel is typically used in cars, larger vehicles (such as tractors, buses and trucks) and generators used for backup power in commercial settings and outdoor sites.
When analysed by GC-MS, diesel has a characteristic pattern, as with petrol (Figure 8.25). If we compare the chromatogram of diesel to that of petrol, we can see that all of the components in petrol have retention times shorter than 10 min, whereas with diesel, the components are still detected beyond the 10 min retention time. This is because the heavier hydrocarbons require higher temperatures to make it through the column and be detected.
8.4.2.3 Lighter FluidThis is a light petroleum distillate, which means that it is composed of the lighter hydrocarbons. Lighter fluid is used to refill cigarette lighters. As you can see (Figure 8.26), most of the components of lighter fluid have been detected before 6 min using this method.
280000260000
220000200000
240000
180000
140000120000
160000
10000080000600004000020000
01.00Time --> 2.00 3.00 4.00 5.00 6.00 7.00 8.00 9.00 10.00 11.00 12.00 13.00
Time (minutes)14.00 15.00 16.00 17.00 18.00 19.00
Abu
ndan
ce
Figure 8.25 Total ion chromatogram of a pure diesel standard sampled by SPME.

114 Forensic Applications of Gas Chromatography
© 2010 Taylor & Francis Group, LLC
8.4.2.4 Paint ThinnerThis is a term used to describe liquids that are used to thin down thick, oil-based paints as well as to remove paint from brushes and rollers used in the painting process. These thinners may include turpentine (derived from pine trees with an approximate chemical formula of C10H16), turpentine substitute (derived from crude oil typically of C9 to C16 range) or white spirit (derived from crude oil typically of C7 to C12 range). These liquids are generally classed as medium petroleum distillates (Figure 8.27).
8.4.3 Different Types of Fire
• Accidental: These fires usually have a certain degree of contributory negligence attached to them. This is typically important and of inter-est to insurance companies. Fires due to accidental cause can be split into three main categories:• Human error (e.g., lit candles or accumulation of grease).• Electrical fires (e.g., old or faulty electrical wiring).• Natural fires (e.g., lightning strikes or spontaneous combustion).
• Deliberate: Generally, such incidents are caused by some form of flammable material used to accelerate the fire. An ignitable liquid may be used; however, this is not always the case. Motivations for deliberate fire-raising are varied and complex and may include an
9000000
8000000
7000000
6000000
5000000
4000000
3000000
2000000
1000000
01.00Time --> 2.00 3.00 4.00 5.00 6.00 7.00 8.00 9.00 10.00 11.00 12.00 13.00
Time (minutes)14.00
a
b
c
Abu
ndan
ce
Figure 8.26 Total ion chromatogram of a pure lighter fluid standard sampled by SPME. Peak identification: (a) 3-methylhexane; (b) 2-methyheptane; (c) octane.

115Forensic Applications of Gas Chromatography
© 2010 Taylor & Francis Group, LLC
01.00Time --> 2.00 3.00 4.00 5.00 6.00 7.00 8.00 9.00
(a)
(b)
10.00 11.00 12.00 13.00 14.00 15.00 16.00 17.00
100000
200000
300000
400000
500000
600000
700000
800000
900000
1000000
Abu
ndan
ceA
bund
ance
1100000
1200000
1300000
1400000
01.00Time --> 2.00 3.00 4.00 5.00 6.00 7.00 8.00 9.00 10.00 11.00 12.00 13.00 14.00
200000
400000
800000
600000
1000000
1200000
1400000
1600000
1800000
2000000
2200000
2400000
2600000
2800000
3000000
Figure 8.27 (a) Total ion chromatogram of a pure turpentine substitute stan-dard sampled by SPME; (b) total ion chromatogram of a paint thinner standard sampled by SPME.

116 Forensic Applications of Gas Chromatography
© 2010 Taylor & Francis Group, LLC
attempt to cover up other crimes, be part of a series of crimes of a known arsonist or may be set as a grudge against a particular race, religion, society or group. Fires may also be deliberately started if an individual or organisation is involved in cases of bankruptcy or financial difficulties and attempts to claim insurance.
There will also be cases where it is not possible to determine with any degree of certainty what has happened. This conclusion may be amended if further evidence is introduced to the case.
8.4.4 Fire Investigation
Forensic arson analysis deals with the analysis of fire debris for the presence of accelerants. As previously mentioned, some of the common accelerants found in arson cases are petrol (gasoline), lighter fluid and paint thinners (including turpentine, turpentine substitutes, toluene and acetone).
However, information obtained from laboratory analyses alone does not provide enough data with which to offer a fully informed opinion. During a fire, product gases will heat up and expand, generating plumes with predictable behaviours that leave distinctive markings. An example of these postfire indicators can be seen in Figure 8.28. Figure 8.28(a) shows a small room set up for the purposes of simulating a fire; it is white walled, containing two single beds, a sofa and a number of electrical items such as a television and a hoover. Figure 8.28(b) shows the room after the fire was
(a) (b)
Figure 8.28 Before (a) and after (b) images of a mock-up fire scene.

117Forensic Applications of Gas Chromatography
© 2010 Taylor & Francis Group, LLC
allowed to proceed and extinguished by a fire fighter. As can be seen, much soot (C(s) from incomplete combustion) has been deposited on the walls during the fire.
Less damage appears to have been caused to the sofa at the front of the image. This is in keeping with the knowledge that the fire was started by throwing a petrol-soaked rag through the right-hand side window. As you will see, extensive damage has been caused to the bed coverings, pillow and the covering of the base of the bed (in comparison to the bed on the left-hand side of the image). A scene investigator would use a combination of postfire indicators, evidence from fire and rescue employees who attended the scene, information from other witnesses and data obtained from laboratory analy-ses to form a conclusion on what he or she thinks has occurred. The science of fire behaviour (fire dynamics) is a complex, although well documented, subject but exceeds the scope of this book; see the Further Reading section for more specialised texts on this subject.
8.4.5 Sample Preparation
Debris collected from a fire scene is usually collected in a metal tin, nylon bag (Figure 8.29a) or glass jars. These items will vary in size, depending upon the size of the item that is being collected. The choice of the packaging will depend upon the country and/or the laboratory standard method. Integrity of packaging must be maintained from collection to the laboratory and dur-ing storage after analysis. Choosing the correct size of packaging and ensur-ing that the packaging will remain intact for a considerable period of time is of the utmost importance as this can have serious consequences with regard to loss of sample, interpretation of results and, ultimately, on the outcome of a case. Figure 8.29(b) shows an example of fire debris packaged in a nylon bag, swan-neck sealed.
(a) (b)
Figure 8.29 (a) Packaging used to sample fire debris at a scene; (b) example of fire debris sealed in a nylon bag.

118 Forensic Applications of Gas Chromatography
© 2010 Taylor & Francis Group, LLC
8.4.6 Sample Introduction
A number of techniques may be used to introduce the gas phase of a sample or debris into the GC instrument. The most widely used technique is called automated thermal desorption (ATD). Fire debris will be collected in a nylon bag (or other appropriate packaging as outlined earlier). The contents will be heated to allow any volatile compounds to enter the headspace. In order for the headspace to be sampled, a small incision will be made in the nylon bag to allow a fixed volume of the headspace to be drawn through a metal tube containing an adsorbent material. The tube is then placed onto a ther-mal desorption unit for introduction to the GC instrument (see Section 2.3.4 for further explanation of thermal desorption). Other techniques used for sample introduction are headspace and solid phase microextraction. Both of these techniques are explained in Chapter 7, Section 7.2.
8.4.7 Interpretation of Analytical Results
Consider the following example to help explain the interpretation of analyti-cal results in cases involving accelerants. Assume that the rag packaged in a nylon bag and shown in Figure 8.29 has been collected from the fire scene shown in Figure 8.28. Already, since the fire was established on purpose for educational purposes, it is known that throwing a rag soaked in petrol through the right-hand side window started the fire; however, the analytical data should be examined to show that this is indeed the case. The following analytical method was used to analyse standards of petrol (gasoline), diesel, lighter fluid, paint thinners and turpentine substitute.
8.4.7.1 Sample Introduction MethodA carboxen/PDMS solid phase microextraction fibre was used to sample the headspace of liquid standards as well as the debris collected from the fire. The samples were heated to 80°C for 10 min before the headspace was sampled with the solid phase microextraction (SPME) fibre. The volatile compounds that had adsorbed onto the SPME fibre were desorbed in the injection port of the GC-MS.
8.4.7.2 GC-MS MethodAn HP6890 GC-MS was used for these analyses. The column used was a DB5-MS (30 m × 0.25 mm i.d), 0.5 μm film thickness. The full method parameters for the GC-MS are provided in Table 8.4.
GC-MS is used in these types of analyses since a complex mixture of compounds will be present in the pyrolysed debris. (Note: Using a mass spec-trometer, as opposed to a FID, allows for greater discriminating power as

119Forensic Applications of Gas Chromatography
© 2010 Taylor & Francis Group, LLC
can be seen in the following examples.) From the sample of fire debris, the chromatogram shown in Figure 8.30 was found.
Using the software available on the GC-MS system, it is possible to extract certain ions from the chromatogram (see also Section 8.3.6). If, for example, we are looking for the aromatic component in the chromatogram, it would be appropriate to extract the ions 91, 105 and 119 Da. These ions were extracted from the fire debris collected from the scene and are shown in Figure 8.31.
Other classes of compounds also have associated ions that will be extracted (examples are shown in Table 8.5). However, for the purposes of this example, we shall use only the aromatic components. Initially, the chro-matogram from the fire debris compared to the standard liquids will be con-sidered (Figure 8.32).
550000
Abu
ndan
ce
500000
450000
400000
350000
300000
250000
200000
150000
100000
50000
01.00Time --> 2.00 3.00 4.00 5.00 6.00 7.00 8.00 9.00 10.00 11.00 12.00 13.00 14.00
Time (minutes)15.00 16.00
Figure 8.30 Total ion chromatogram from SPME-GC-MS analysis of fire debris.
Table 8.4 GC-MS Instrument Parameters for the Analysis of Fire Debris and Accelerant Standards
GC Method Parameters Mass Spectrometry Parameters
Temperature program: 50°C held for 1 min; increase to 225°C at 10°C/min and hold for 1.5 min
Split: 20:1Total run time: 20 minInjection port temperature: 250°CCarrier gas: Heat a flow rate of 1.0 mL/minMS transfer line temperature: 280°C
Ion source temperature: 250°CMode: positive ionFull scan range: 50–250 Da

120 Forensic Applications of Gas Chromatography
© 2010 Taylor & Francis Group, LLC
2800
026
000
Abundance2400
022
000
2000
018
000
1600
014
000
1200
010
000
8000
6000
4000
2000 0
Tim
e -->
(a)
(b)
(c)
Abundance2000
00
1800
00
1600
00
1400
00
1200
00
1000
00
8000
0
6000
0
4000
0
2000
0 0Ti
me -
->
1.002.003.004.005.006.007.008.009.0010.0011.0012.0013.0014.0015.0016.00
6000
0
5500
0
Abundance5000
0
4500
0
4000
0
3500
0
3000
0
2500
0
2000
0
1500
0
1000
0
5000 0
Tim
e -->
1.002.003.004.005.006.007.008.009.0010.0011.0012.0013.0014.0015.0016.00
16.00
1.002.003.004.005.006.007.008.009.0010.0011.0012.0013.0014.0015.00
Figu
re 8
.31
Ext
ract
ed io
n c
hro
mat
ogra
ms
for
(a) 9
1 D
a; (b
) 105
Da;
(c) 1
19 D
a.

121Forensic Applications of Gas Chromatography
© 2010 Taylor & Francis Group, LLC
Abu
ndan
ce
550000500000450000400000350000300000250000200000150000100000
500000
Time -->
(a)1.00
2.003.00
4.005.00
6.007.00
8.009.00
10.0011.00
12.0013.00
14.0015.00
16.00
Abu
ndan
ce
30000002800000
2000000220000024000002600000
18000001600000140000012000001000000
800000600000400000200000
0Time -->
(c)1.00
2.003.00
4.005.00
6.007.00
8.009.00
10.0011.00
12.0013.00
14.00
Abu
ndan
ce
200000
280000260000
220000240000
180000160000140000120000100000
80000600004000020000
0Time -->
(e)
Abu
ndan
ceA
bund
ance
10000001100000120000013000001400000
900000800000700000600000500000400000300000200000100000
0Time -->
(f )1.00
1.002.00
3.004.00
5.006.00
7.008.00
9.0010.00
11.0012.00
13.0014.00
16.0017.00
19.0015.00
2.003.00
4.005.00
6.007.00
8.009.00
10.0011.00
12.0013.00
14.0016.00
17.0018.00
15.00
Abu
ndan
ce
90000005e+07
80000007000000600000050000004000000300000020000001000000
0Time -->
(b)1.00
2.003.00
4.005.00
6.007.00
8.009.00
10.0011.00
12.0013.00
14.0015.00
9000000
8000000
7000000
6000000
5000000
4000000
3000000
2000000
1000000
0Time -->
(d)1.00
2.003.00
4.005.00
6.007.00
8.009.00
10.0011.00
12.0013.00
14.00
Figure 8.32 Fire debris chromatogram compared to standard liquid chromato-grams. (a) Fire debris; (b) petrol standard; (c) paint thinner standard; (d) lighter fluid standard; (e) diesel standard; (f) turpentine substitute standard.
Table 8.5 Ions Extracted for Compounds Found in Accelerants
Class of Compound Ions Extracted (Da)
Alkanes 51, 71, 85 and 99Cycloalkanes 55, 65 and 83Indanes 17, 118, 131 and 132

122 Forensic Applications of Gas Chromatography
© 2010 Taylor & Francis Group, LLC
By comparing a chromatogram of fire debris, the sample is pyrolysed (burnt). This means that comparing the output from the debris to a pure liquid standard of ignitable liquids will be a little more difficult. Most of the lighter (by weight) components found at the beginning of a chromatogram will disappear from the chromatogram and decomposition products of these lighter components may not be found. Pyrolysis products from the material that has been consumed during the fire will also have to be considered. For this reason, a control sample should always be analysed alongside the fire debris. This control sample should be of the same material as the ‘suspect’ sample; however, the control should be collected as far away as possible from the sampling site of the ‘suspect’ sample. A control sample of the same mate-rial was analysed and the chromatogram is shown in Figure 8.33.
Although the peaks look large, what happens with the software on our GC-MS, and many other manufacturers’ instruments, is that the chromato-gram scales the chromatogram to have all peaks proportional to the largest peak. If you look at the top left-hand side of the y-axis of the chromatogram shown in Figure 8.33, you will note that, for the control sample, the abun-dance scale reaches approximately 6500. However, if you look at the same point on the chromatogram in Figure 8.30 for the ‘suspect’ sample, the abun-dance scale reaches approximately 600,000.
By examining the extracted ion chromatograms for each of the classes of compound (Table 8.5) in each of the pure ignitable liquid standards to that of the unknown sample (fire debris), some of the hydrocarbon fuels can be eliminated. Figure 8.34 shows the extracted ion chromatogram for petrol compared to the unknown sample.
What you should be able to see are the similarities in the peaks between the extracted ions (91, 105 and 119 Da for both the ‘suspect’ and petrol
6000
5500
5000
4500
4000
3500
Abu
ndan
ce
3000
2500
2000
1500
1000
500
01.00Time --> 2.00 3.00 4.00 5.00 6.00 7.00 8.00 9.00 10.00 11.00
Time (minutes)12.00 13.00 14.00 15.00 16.00 17.00 18.00 19.00
Figure 8.33 Total ion chromatogram for control fire debris.

123Forensic Applications of Gas Chromatography
© 2010 Taylor & Francis Group, LLC
(gasoline) standard chromatograms. This would be completed for all of the major expected components in petrol (gasoline).
As you have seen in this fairly simple example, the interpretation of fire debris analysis could prove difficult if there are many different materials present in the debris. You would need to consider what materials you would expect to be present and try to eliminate as much as possible from your chro-matogram. Many of the polymers that are used in our everyday lives, such as plastic bags, cosmetics bottles, carpet backing and the outer packaging of washing machines and fridges, are derived from crude oil, as have the most commonly encountered ignitable liquids in cases where accelerants have been used.
Abu
ndan
ce
28000260002400022000200001800016000140001200010000
8000600040002000
0Time -->
1.002.00
3.004.00
5.006.00
7.008.00
9.0010.00
11.0012.00
13.0014.00
15.0016.00
(a)
Abu
ndan
ce
200000180000160000140000120000100000
80000600004000020000
0Time -->
(b)1.00
2.003.00
4.005.00
6.007.00
8.009.00
10.0011.00
12.0013.00
14.0015.00
16.00
Abu
ndan
ce
6000055000
400004500050000
350003000025000200001500010000
50000
Time -->
(c)1.00
2.003.00
4.005.00
6.007.00
8.009.00
10.0011.00
12.0013.00
14.0015.00
16.00
Abu
ndan
ce
900000
800000
700000
600000
500000
400000
300000
200000
100000
0Time -->
1.002.00
3.004.00
5.006.00
7.008.00
9.0010.00
11.0012.00
13.0014.00
15.00
(d)
Abu
ndan
ce
900000
800000
700000
600000
500000
400000
300000
200000
100000
0Time -->
(e)1.00
2.003.00
4.005.00
6.007.00
8.009.00
10.0011.00
12.0013.00
14.0015.00
90000
Abu
ndan
ce
8000070000600005000040000300002000010000
0Time -->
(f )1.00
2.003.00
4.005.00
6.007.00
8.009.00
10.0011.00
12.0013.00
14.0015.00
100000
Figure 8.34 Extracted ion chromatograms for suspect sample and petrol stan-dard: (a) 91 Da from fire debris; (b) 91 Da from petrol standard; (c) 105 Da from fire debris; (d) 105 Da from petrol standard; (e) 119 Da from fire debris; (f) 119 Da from petrol standard.
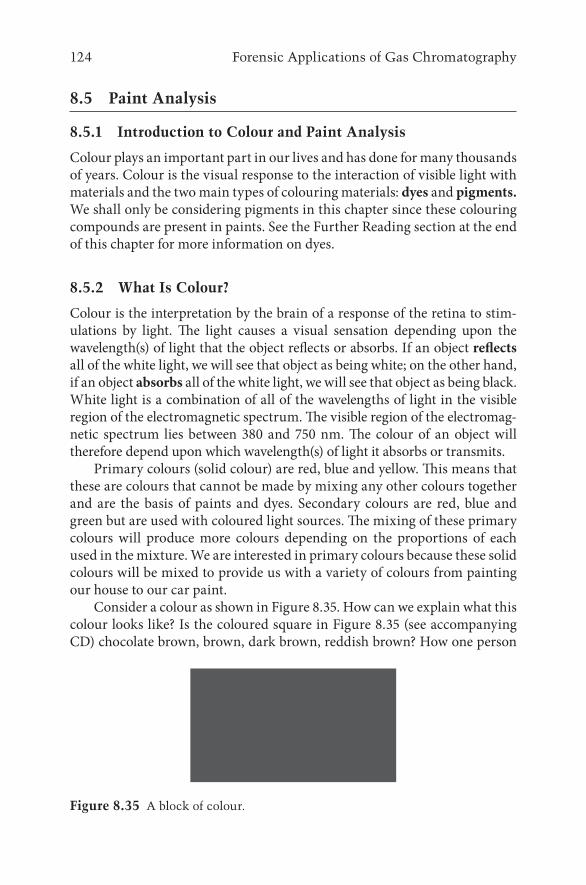
124 Forensic Applications of Gas Chromatography
© 2010 Taylor & Francis Group, LLC
8.5 Paint Analysis
8.5.1 Introduction to Colour and Paint Analysis
Colour plays an important part in our lives and has done for many thousands of years. Colour is the visual response to the interaction of visible light with materials and the two main types of colouring materials: dyes and pigments. We shall only be considering pigments in this chapter since these colouring compounds are present in paints. See the Further Reading section at the end of this chapter for more information on dyes.
8.5.2 What Is Colour?
Colour is the interpretation by the brain of a response of the retina to stim-ulations by light. The light causes a visual sensation depending upon the wavelength(s) of light that the object reflects or absorbs. If an object reflects all of the white light, we will see that object as being white; on the other hand, if an object absorbs all of the white light, we will see that object as being black. White light is a combination of all of the wavelengths of light in the visible region of the electromagnetic spectrum. The visible region of the electromag-netic spectrum lies between 380 and 750 nm. The colour of an object will therefore depend upon which wavelength(s) of light it absorbs or transmits.
Primary colours (solid colour) are red, blue and yellow. This means that these are colours that cannot be made by mixing any other colours together and are the basis of paints and dyes. Secondary colours are red, blue and green but are used with coloured light sources. The mixing of these primary colours will produce more colours depending on the proportions of each used in the mixture. We are interested in primary colours because these solid colours will be mixed to provide us with a variety of colours from painting our house to our car paint.
Consider a colour as shown in Figure 8.35. How can we explain what this colour looks like? Is the coloured square in Figure 8.35 (see accompanying CD) chocolate brown, brown, dark brown, reddish brown? How one person
Figure 8.35 A block of colour.

125Forensic Applications of Gas Chromatography
© 2010 Taylor & Francis Group, LLC
describes it is not necessarily how another person would describe it; there-fore, we need to be able to ‘standardise’ colour.
There is a scientific way of describing colour: giving a colour three val-ues to represent the proportions of red, blue and yellow. The basis of all colour measurement is based on the CIE (International Commission on Illumination) colour system. Work was agreed in 1931 and remains the same today, with a few modifications (see also the Further Reading section).
Attributes of colour are
• Lightness (or brightness): The degree of lightness refers to the level of grey of an achromatic colour.
• Hue: This is determined by the wavelengths of light that are reflected and absorbed by an object.
• Chroma (or saturation): This is the attribute of a visual sensation according to which an area appears to exhibit more or less of its hue.
There are two types of colourants: dyes and pigments. Both of these colourant types tend to be supplied by a manufacturer in powder form, but the main difference between the two is in terms of solubility. Dyes are soluble and pigments are insoluble in the liquid medium.
As previously mentioned, we will be focussing on pigments only.
8.5.3 Why Are Pigment Molecules Coloured?
A coloured molecule will contain a chromophore and an auxochrome. A chromophore is principally responsible for the colour, for example, an azo group (–N=N–), the nitro (–NO2) or carbonyl (C=O) functional groups. Auxochromes, on the other hand, will ‘enhance’ the colour properties of the chromophore and will be either electron withdrawing or electron releasing. Examples include the hydroxyl (–OH) and amine (–NH2) func-tional groups. Essentially, the colour arises from electronic transitions from a ground state to an excited state causing absorption of visible light. Paint has been used for many years as protection and also for decoration. It is typically composed of a pigment and extender, binder or carrier, solvent, and additives with the proportions of each varying depending upon the manufacturer. When explaining paint we shall use the term coating and paint interchangeably.
The functions of paint components can be identified as follows:
Pigment: This not only provides the colour of the paint but also can add other optical properties such as opacity and gloss reduction. The pig-ment may also be designed to provide protective properties.

126 Forensic Applications of Gas Chromatography
© 2010 Taylor & Francis Group, LLC
Extender: This is an inorganic filler that is used to provide various properties, such as mechanical strength, flow and degree of gloss, to the coating.
Resin/binder: This is a liquid or solid material that is used to bind the pigment particles together in order to form a continuous film. Resins are used to determine the physical and chemical characteristics of the coating. The coatings are usually named after the resin that has been used in the paint formulation. Typical resins used in coatings are polyurethane, alkyd resin, epoxy resins, nitrocellulose, acrylic, acrylic emulsions and vinyl emulsions.
Solvent: This is a liquid that aids application by transporting the pig-ment and other components onto the substrate.
Additives: Additives are added to the coatings for a variety of reasons, maybe to aid application, to increase the shelf-life, to provide quali-ties such as moisture resistance or to slow the growth of organisms.
8.5.4 Paint as Forensic Evidence
Paint can become evidence in the form of smears or chips or fragments. It can be obtained from premises (e.g., after a breaking and entering where fragments may remain on the ground), people (e.g., on clothing, shoes or in hair), vehicles (e.g., transfer of paint from car to car or car to person), instru-ments (such as screwdrivers, crow bars/jemmies, cutting instruments that may have been used in a breaking and entering).
Forensic analysis and the identification of various components of paint samples will be identified by a variety of different techniques, not only GC. When carrying out tests in forensic science, it is best to use the least destruc-tive analytical methods and techniques possible.
8.5.4.1 Colour AnalysisThe Methuen Colour Atlas (or Munsell Colour Atlas) or collections of car paints will be used to try to identify the colour; however, because such small samples are usually available for analysis, it is not always possible to provide a colour description by this method.
Microspectrophotometry (MSP) is an analytical instrument that can be use to provide a numerical colour description for a small paint sample. This instrument allows the visualisation of very small samples but also allows us to pass ultraviolet-visible regions (190–750 nm) of the electromagnetic spectrum through the specimen and to measure the energy reflected or transmitted.
Fourier transform infrared (FTIR) microscopy or attenuated total reflec-tance (ATR)–FTIR can also be used to help identify functional groups on molecules. Molecules absorb infrared light by changing their vibrational energy levels with certain functional groups having their own characteristic

127Forensic Applications of Gas Chromatography
© 2010 Taylor & Francis Group, LLC
absorption of IR frequencies. Molecules can be recognised from the ‘fin-gerprint region’ in their IR spectrum, which is typically below 1500 cm–1. Usually, an FTIR spectrum would be carried out between 4000 and 350 cm–1. FTIR has been used for pigment analysis as well as resin analysis. This tech-nique can also be used to compare samples without having to identify all of the components in the paint sample. Table 8.6 shows the FTIR peaks associ-ated with a polyurethane and alkyd resins.
Table 8.7 shows the diagnostic peaks of some common pigments and extenders found in coatings. These are inorganic in chemical nature. Figure 8.36 shows the FTIR spectrum of a green paint. This sample of green paint was found to contain polyvinylacetate (PVA) as the resin is indicated by the bands present at 1230, 1370, 1432 and 1732 cm–1, which are quite strong. It also appears that titanium dioxide is present as is indicated by the broad peak at approximately 600 cm–1.
Other analytical techniques, such as scanning electron microscopy–energy dispersive x-ray analysis (SEM-EDS), Raman spectroscopy, and solubility testing, are also used (see the Further Reading section for more information on these techniques and instruments).
Pyrolysis gas chromatography (py-GC) can also be used; however, it is not favoured unless completely necessary. This is because py-GC is a destruc-tive technique and destructive techniques are not favoured in forensic sci-ence. In Chapter 2, we mentioned pyrolysis to allow larger molecules to be broken down thermally into smaller molecules. In pyrolysis GC, a small
Table 8.6 Polyurethane and Alkyd Resin FTIR Interpretationa
Components of Paint Associated FTIR Peaks Interpretation
Polyurethane a. Broad band at 3380 cm–1
b. Peak at 1522 cm–1
c. Peaks at 2936 and 2861 cm–1
d. Doublet at 1729 and 1691 cm–1
e. Peak at 1468 cm–1
f. Weak peak at 1380 cm–1
g. Broad absorption at 1254 cm–1
a. N–H stretch b. N–H bend c. Aliphatic C-H stretch d. C–H bend in methylene
(–CH2–) group e. C = O stretch f. C–H bend in methyl
(–CH3) group g. C–N–H vibration together
with C-O stretch of carboxyl group
Alkyd resin a. Two peaks around 2900 cm–1
b. 1730 cm–1
c. 1285 and 1122 cm–1
d. Two peaks at 1467 and 1376 cm–1
e. 706 cm–1
a. C–H stretch, primarily from drying oils
b. Carbonyl (C = O) c. C–O stretch due to ester d. –CH2 and –CH3 stretching e. Aromatic ring bending
a Courtesy of Dr Brian Singer, Northumbria University.

128 Forensic Applications of Gas Chromatography
© 2010 Taylor & Francis Group, LLC
90
80
70
Tran
smitt
ance
[%]
3500 3000 2500Wavenumber cm–1
2957
.84
2924
.27
2873
.11
1432
.78
1370
.54
1229
.64
1005
.30
504.
8846
6.22
379.
85
1731
.86
2000 1500 1000 500
60
50
40
Figure 8.36 FTIR spectrum of a green paint.
Table 8.7 Diagnostic FTIR Peaks Associated with Some Inorganic Pigments/Extenders Used in Paintsa
Pigment/Extender Associated FTIR Bands
OxidesIron oxide, red 350–310, 480–440, 560–530 cm–1
Iron oxide, yellow 278, 405, 606, 797, 899 cm–1
Lead oxide 450, 530 cm–1
Zinc oxide 500–420 cm–1
Silicon dioxide (quartz) 373, 397, 460, 512, 779, 798, 1081 cm–1
Titanium dioxide (rutile) 340, 410, 600 cm–1
Titanium dioxide (anatase) 340, 600 cm–1
CarbonatesCalcium carbonate (arogonite)
317, 712, 857, 870, 1445–1390 cm–1
Calcium carbonate (calcite) 317, 712, 870, 1390–1445 cm–1
SilicatesMagnesium silicate (talc) 345, 390, 420, 450, 465, 670, 1015 cm–1
Aluminium silicate (kaolinite) 280, 350, 430, 470, 540, 910, 940, 1005, 1035 cm–1
a Courtesy of Dr Brian Singer, Northumbria University.

129Forensic Applications of Gas Chromatography
© 2010 Taylor & Francis Group, LLC
sample is quickly heated in a pyrolysis unit in the absence of air and is then directly transferred by an inert carrier stream to the inlet of the GC-MS. The output from the py-GC is called a pyrogram. The smaller molecules formed in the pyrolysis of the paint sample can be identified by mass spectrometry and the paint polymer can also be identified by understanding the chemistry of the thermal decomposition of the components.
Consider an example where the green paint analysed by FTIR was col-lected from a scene where a painted monument to soldiers who died in World War II was vandalised. A suspect was apprehended shortly after the crime took place and was found to be carrying a crow bar/jemmy with small chips of green paint attached. Some very small chips of paint were also found in the inside jacket pocket of the suspect. When FTIR analysis was carried out, it appeared that the spectra of the chips were very similar to those of the FTIR of the paint collected from the monument. However, the results from colour analysis and FTIR were not conclusive enough to provide an interpretation; therefore, py-GC was carried out.
The pyrogram of the green paint is shown in Figure 8.37. This pyrogram shows peaks for benzene and acetic acid. These compounds are typical of
105 bergene
acet
ic ac
id
styr
ene
vinyl versatatecomponents
100
95
90
85
80
75
70
65
60
55
50
45
40
35
30
25
20
15
10
5
02 3 4 5 6 7 8 9 10
Time (min)
201
Rela
tive A
bund
ance
322
215
871 13.357.38
7.52
7.33226
309
459 485
5.546.09
6.84
11 12 13 14 15 1716
12.04
14.57
14.6914.93
15.06
15.48
15.5615.74
16.17
14.4513.45
13.68
10.339.399.068.80
Figure 8.37 Pyrogram of green paint from WW2 monument.
130 Forensic Applications of Gas Chromatography
© 2010 Taylor & Francis Group, LLC
polyvinyl acetate. A group of peaks identified as branched chained carbox-ylic acids of quite high molecular mass (approximately 10 carbon atoms per molecule) can also be identified in the pyrogram. This pyrogram is typical of a vinyl acetate/vinyl versatate copolymer. Vinyl versatate is also known as VeoVa and this type of paint is also known as a VA/VeoVa copolymer. Such paints have been and are used as both internal and external decorative wall paints. The pyrogram was compared to a sample of green paint from the monument and was found to be of the same components.
8.6 Food and Fragrance Analysis
8.6.1 Introduction to Food and Fragrance Analysis
Intellectual property (IP) crime is the counterfeiting of trade and copyrighted goods and services. High-value items are open to adulteration; this includes food substances, alcoholic beverages and fragrances.
8.6.2 Food Fraud
Food fraud is the deliberate modification of a product or labelling for the intention of deceiving the consumer. The Food Standards Agency4 states that the two main types of food fraud are ‘the sale of food that is unfit and poten-tially harmful’ and the ‘deliberate misdescription of food’. The first type of food fraud covers the sale of goods at or past their sell-by dates; the second describes the mislabelling of food stuffs (e.g., if apples are labelled as being ‘organic’ but they have not been grown on an organic farm).
Food substances such as olive oil, honey, saffron, milk, fruit juices, and coffee are amongst the most commonly adulterated food products.5 For example, extra virgin olive oil is one of these high-cost food products that is open to adulteration; often, other cheaper oils, such as hazelnut, sunflower and vegetable oils, are added to the extra virgin olive oil. In this type of adul-teration, the final product is cheaper to manufacture but allows sellers to charge the full price of extra virgin oil (when in fact they are selling a cheaper imitation). Extra virgin olive oil can be analysed using SPME-GC-MS. This is an analytical method that is used to examine the flavour compounds since it has previously been difficult to differentiate between olive oil and other oils due to the similarity of the oils in the composition of fatty acids, triacyl-glycerols and sterols. SPME (see Section 7.2.3) allows sampling of the volatile compounds present in the headspace of a vial. Only the volatile compounds that enter the headspace will be analysed by this method and this has proven a good analytical technique for establishing differences between olive oil and other oils (see the Further Reading section for more information).

131Forensic Applications of Gas Chromatography
© 2010 Taylor & Francis Group, LLC
8.6.3 Counterfeit Alcohol
In the UK alone, alcohol fraud costs the economy more than £1 billion in lost revenue.6 Alcohol can be tainted with methanol or chloroform, both of which are very dangerous as, depending upon the amount present, they can cause kidney or liver damage, blindness or even death. Alcohol can be pro-duced or distilled in large warehouses by organised groups and when alcohol is manufactured in this way it is usually not the only illegal activity that the group will be carrying out. When carrying out analysis of suspected coun-terfeit alcohol, comparison can be carried out directly between samples of suspected counterfeit alcohol and the ‘real’ alcoholic beverage. The amount of ethanol (expected in alcoholic beverages) and any other unexpected liq-uids such as methanol, chloroform or ethylene glycol, for example, will be identified against known standards and compared to the original. This type of analysis can be carried out using headspace or SPME sampling and GC-FID or GC-MS. Flavour compounds may also be compared if no differ-ences are found between the original alcohol specimen and the suspected specimen. Flavour compounds or congeners can be identified and compared using GC-MS (again with headspace or SPME as a sampling technique).
8.6.4 Adulterated Fragrances
Fragrances can be produced fraudulently and will require a complex network of organisations designed to print labels, manufacture bottles and packag-ing, and bottle the liquid before shipping to unsuspecting consumers. These fraudulent items have been shown to contain urine as a stabiliser7 as well as other chemicals, such as ethylene glycol (the main component of anti-freeze) and contaminated alcohol. Some of the fraudulent perfumes seized by trading standards officers have been shown to be watered down versions of the original scent, coloured water or a combination of many chemicals that have a similar scent to the original perfume that wears off very quickly. As with alcoholic beverages, fragrance samples will be compared to the origi-nal by using SPME-GC-MS or headspace-GC-MS. A specimen of perfume suspected of being fraudulent was compared to the original using head-space-GC-MS. The method used for this analysis is provided in Table 8.8. A BPX5 GC column (30 m × 0.25 mm i.d), 0.5 μm film thickness was used in this application and the analytical work was carried out on a Perkin Elmer Clarus™ GC-MS.
Both the original perfume sample and the suspect perfume sample are shown in Figure 8.38. A direct comparison between the two chromatograms shows that they are not the same. Each perfume or fragrance will have a very distinctive chromatogram and the firm producing the perfume will have a rigorous quality control system in place to ensure that each bottle of perfume

132 Forensic Applications of Gas Chromatography
© 2010 Taylor & Francis Group, LLC
will be the same. This makes it easy to spot the difference in this case; how-ever, other cases will not be as simple.
Other techniques can and will be employed in the fight against food and fragrance fraud since this crime costs the economy greatly. These techniques may include isotope analysis, proteomics and metabolomics (see also the Further Reading section).
Table 8.8 GC-MS Parameters Used for the Analysis of Perfume Samplesa
GC Method Parameters Mass Spectrometry Parameters
Injection volume: 1 μLTemperature program: 75°C for 2 min, then 30°C/min to 250°C and hold for 1.67 min
Injection port temperature: 50°CCarrier gas: Helium at 20 mL/minSplit ratio: 20:1MS transfer line temperature: 230°C
Ion source temperature: 250°CMode: positive ionFull scan range: 50–650 Da
a Provided courtesy of Shirley O’Hare, Teesside University.

133Forensic Applications of Gas Chromatography
© 2010 Taylor & Francis Group, LLC
(b)
(a)
Figure 8.38 (a) Chromatogram from original perfume sample, and (b) chromato-gram from suspect perfume sample.

134 Forensic Applications of Gas Chromatography
© 2010 Taylor & Francis Group, LLC
Questions
1. When analysing a trace sample suspected of being heroin, what technique(s) would you use to confirm and what compound(s) would you be looking for?
2. The barbiturates butalbital and secobarbital were analysed by GC-MS and two peaks were found with similar retention times. On further mass spectrometric analysis, both peaks were found to have princi-pal ions of 167 and 168 Da. How would you identify which peak was which compound?
3. Which derivatising reagent would you choose to use with the follow-ing analytes?
(a) (b) (c)
OOH
N
CH3
HO CH3
NH2O
OO
CH3
H3CH3C
OH
C5H11
O
OH
4. In our toxicology example (Section 8.3.6) Proadifen was used as an internal standard and was added to the blood sample prior to the extraction step. What is the purpose of an internal standard?
5. Although Proadifen was used in our example, it is best to use a deu-terated analogue of the analyte(s) under investigation. Why?
6. In GC-MS, the most abundant ion is not always the molecular ion. Why?
7. When extracting ions to identify the aromatic components from the chromatogram from fire debris that may contain an ignitable liquid, two ions, 91 and 105 (as well as 119) Da, are used. Why use these ions?
8. Is there a difference between an accelerant and an ignitable liquid? 9. In the example of the fire debris analysis by GC-MS (Section 8.4.7),
SPME was used as the sample introduction technique with a car-boxen/PDMS fibre. Why was this fibre chosen?
10. Why is py-GC the ‘last resort’ when carrying our forensic analysis of paint?
11. Why are molecular ions not investigated in py-GC analysis of paint? 12. Why is urine sometimes added to adulterated perfume? 13. Why are high-value goods adulterated?

135Forensic Applications of Gas Chromatography
© 2010 Taylor & Francis Group, LLC
14. Why are SPME and headspace good sampling methods for the anal-ysis of fragrances?
References 1. UNODCP, United Nations. 2009. Recommended methods for identification
and analysis of cannabis and cannabis products, New York (http://www.unodc.org/documents/scientific/ST-NAR-40-Ebook.pdf).
2. UNODCP, United Nations. 2012. World Drug Report 2012, New York (http://www.unodc.org/documents/data-and-analysis/WDR2012/WDR_2012_web_small.pdf).
3. Interpol. Heroin (http://www.interpol.int/Crime-areas/Drugs/Heroin). 4. Food Standards Agency. Food fraud (http://www.food.gov.uk/enforcement/
enforcework/foodfraud/). 5. Journal of Food Science. http://consumers.californiaoliveranch.com/2012/04/13/
olive-oil-milk-honey-among-top-items-involved-in-food-fraud-researchers/ 6. Food Standards Agency. Fraudulent alcohol (http://www.food.gov.uk/
news-updates/news/2012/apr/dropvodka). 7. Anti-Counterfeiting Group. http://www.a-cg.org/guest/pdf/Dangers_of_
Fakes08.pdf
Further Reading
Drugs
Bayne, S., and M. Carlin. 2010. Forensic applications of high performance liquid chro-matography. Boca Raton, FL: CRC Press.
Cole, M. D. 2003. The analysis of controlled substances. Chichester, UK: John Wiley & Sons.
King, L. 2003. The Misuse of Drugs Act: A guide for forensic scientists. Cambridge, UK: Royal Society of Chemistry (a UK-based source).
Smith, F., and J. A. Siegel. 2004. Handbook of forensic drug analysis. London: Academic Press.
Toxicology
Baselt, R. C. 2011. Disposition of toxic drugs and chemicals in man, 9th ed. Seal Beach, CA: Biomedical Publications.
Flanagan, R. J., A. A. Taylor, I. D. Watson and R. Whelpton. 2008. Fundamentals of analytical toxicology. London: Wiley-Blackwell.
Klaassen, C. D., ed. 2008. Casarett & Doull’s toxicology: The basic science of poisons, 7th ed. New York: McGraw–Hill.
Moffat, A. C., M. D. Osselton, B. Widdop and J. Watts, eds. 2011. Clarke’s analysis of drugs and poisons, 4th ed. London: Pharmaceutical Press.

136 Forensic Applications of Gas Chromatography
© 2010 Taylor & Francis Group, LLC
Fire
American Society for Testing and Materials (ASTM). http://www.astm.org/DeHaan, J. D., and D. J. Icove. 2011. Kirk’s fire investigation, 7th ed. London: Prentice
Hall.Drysdale, D. 2011. An introduction to fire dynamics. Chichester, UK: John Wiley &
Sons.Icove, D. 2008. Forensic fire scene reconstruction. London: Pearson/Prentice Hall.Newman, R., M. Gilbert, and K. Lothbridge. 1997. GC-MS guide to ignitable liquids.
Boca Raton, FL: CRC Press.Stauffer, E., J. A. Dolan and R. Newman. 2007. Fire debris analysis. London: Academic
Press.
Paint
Caddy, B. 2001. Forensic examination of glass and paint: Analysis and interpretation. Boca Raton, FL: CRC Press.
Christie, R. M. 2001. Colour chemistry. Cambridge: Royal Society of Chemistry.Goldstein, J., D. E. Newbury, D. C. Joy, C. E. Lyman, P. Echlin, E. Lifshin, L. Sawyer
and J. R. Michael. 2007. Scanning electron microscopy and x-ray microanalysis. Berlin: Springer.
Food and Fragrances
Coultate, T. P. 2009. Food: The chemistry of its components. Cambridge: Royal Society of Chemistry.
Marsili, R. 2012. Flavor, fragrance, and odor analysis. Boca Raton, FL: CRC Press.Pico, Y. 2012. Chemical analysis of food: Techniques and applications. London:
Academic Press.Sell, C. S., ed. 2006. The chemistry of fragrances: From perfumer to consumer, 2nd ed.
2006. Cambridge: Royal Society of Chemistry.Sun, D-W., ed. 2008. Modern techniques for food authentication. London: Academic
Press.

137© 2010 Taylor & Francis Group, LLC
Answers to Questions
Chapter 2
1. What can you determine from the van Deemter plot (Figure 2.2) with regard to the choice of carrier gas?Answer: The best compound separation is obtained with the low-
est value of HETP (millimetres). In addition, changing the linear velocity of gas to a value that is too low or too high has a detrimen-tal effect on HETP (and hence the resolution). Nitrogen has the best column efficiency at the lowest linear velocity; however, the minimum HETP occurs over a narrow range. Both helium and hydrogen have a much broader range of linear velocities, giving low values of HETP (i.e., greatest efficiency to separate compounds).
2. What is the optimal linear velocity for helium?Answer: The optimal linear velocity for helium from the van Deemter
plot (Figure 2.2) is the point with the lowest HETP (millimetres). On that basis, 20 cm/s is the optimal linear velocity for He.
3. What is a molecular sieve?Answer: Molecular sieves are crystalline, highly porous, alumina
silicates. In this case, they are used to remove moisture from the gas supply.
4. What issues would you need to consider when deciding whether to use a cylinder of nitrogen versus a generator?Answer: The main issues for use of a cylinder include the cost of the
purchase of gas, cylinder rental cost and delivery regime as well as the capital cost of a pressure regulator. In the case of the nitro-gen generator, the main issues relate to capital cost and regular annual maintenance. In addition, it is also important to con-sider the safe storage of pressurised cylinders in the laboratory (or annexe to the laboratory or external to the building). From a cost perspective, it is important to consider how many nitrogen cylinders are required and how long each cylinder will last in normal operation (depends upon how many GCs are in use from a cylinder) versus the relatively high capital cost of purchasing a nitrogen generator.
9

138 Forensic Applications of Gas Chromatography
© 2010 Taylor & Francis Group, LLC
5. What is an internal standard?Answer: An internal standard is a known compound that is not
present (and is never likely to appear) in the sample. Ideally, it has a similar chemical structure to the compounds of interest. It is added, at the same concentration, to both standards and samples prior to analysis. By measuring its signal response (peak area) compared to that of the unknown compounds, it is possible to eliminate signal variation due to imprecise injection technique. In GC it is common practice when plotting a calibration graph to plot the peak area (on the y-axis) as the ratio of the peak area of the compound under investigation divided by the peak area of the internal standard versus concentration of the compound under investigation.
6. What is an unreacted silanol group?Answer: An unreacted silanol group is essentially the –OH (hydroxyl
group) that is present on the surface of silica, which has the potential to ionize, generating the –O– species, which can itself interact with polar compounds.
7. What happens to the vaporized gaseous material that does not go on to the GC column?Answer: Depending upon the split ratio valve setting, a significant
portion of the vaporized sample goes to waste and not onto the column. Typically, one part of the vaporized sample goes onto the column and 50 or 100 parts go to waste. Fortunately, the waste does not vent directly into the laboratory, as this would be very dangerous for the user (the inhalation pathway is a signifi-cant exposure pathway to humans); it passes through a trap that removes the often toxic organic compounds from the sample or standard.
8. How much of the GC column stationary phase do you think will be damaged by the insertion of the syringe needle?Answer: An approximate 5 cm length of the GC stationary phase
will be damaged by the insertion of the syringe needle. This is not that important when you consider that the column will typically be 30 m long. What is more important is what happens to the removed stationary phase. It will eventually work its way down the entire length of the column and contaminate the detector, leading to response issues (see Chapter 6).
9. What might a typical PTV temperature programme look like?Answer: A typical temperature programme for a PTV injector might
be the following: initial temperature 50°C for 30 s, then 200°C/min to 250°C, followed by introduction to the column.

139Answers to Questions
© 2010 Taylor & Francis Group, LLC
10. What is Tenax?Answer: Tenax is a porous polymer for concentration of airborne
organic compounds. It is based on 2,6-diphenyl-p-phenylene oxide. 11. How long would the chromatographic run take to separate com-
pounds using the following temperature programme: 50°C for 2 min, followed by ramp rate of 10°C/min to 220°C, with a final hold temperature of 2 min?Answer: The total chromatographic run time can be calculated as
follows:Temperature difference:Final temperature – initial temperature = 220°C – 50°C= 170°CRamp rate is 10°C per minuteTherefore, the time for the ramp to be delivered is170°C/10°C per minute = 17 min
Add all the time together:Initial hold time = 2 minRamp time = 17 minFinal hold time = 2 minTotal time for chromatographic run is 21 min.
12. What is the stationary phase?Answer: The stationary phase is the film coated on the inner wall of
the capillary column. 13. What are polar compounds composed of?
Answer: Polar compounds are made up mainly of carbon and hydrogen atoms but also must contain electronegative atoms such as oxygen, nitrogen and sulphur, as well as double bonds (e.g., carbon–oxygen).
14. What is the linear dynamic range?Answer: The linear dynamic range is the extent of the calibration
range over which the concentration rises in a linear manner. It would be reasonable to quote a linear dynamic range of 105. This means the instrument detector produces a linear calibration graph over the concentration range from 0.001 (via 0.01, 0.1, 1, 10) to 100 (in appropriate units).
15. What effect would having a 60 m capillary column have on the sam-ple components?Answer: Typically, a longer column (60 m) has a longer analysis
time (e.g., twice the time of a 30 m column to separate the same compounds under isothermal conditions) but can be extremely useful for complex samples with a large number of compounds for separation.

140 Forensic Applications of Gas Chromatography
© 2010 Taylor & Francis Group, LLC
Chapter 3
1. The separation of some compounds by gas chromatography with a flame ionization detector was done. Based on a to of 1.0 min, deter-mine the capacity factor for (a) compound A at a tr of 5.9 min, and (b) compound B at a tr of 6.2 min.Answer:
(a) Capacity factor for compound A is determined using the equation k ′ = (tr – to)/to
k ′ = (5.9 – 1.0)/1.0
k ′ = 4.9
(b) Capacity factor for compound B is determined using the equation k ′ = (tr – to)/to
k ′ = (6.2 – 1.0)/1.0
k ′ = 5.2
2. A compound, with a retention time of 6.3 min, has a peak height of 624,352 (μV) and a peak area of 3,088,081 (μV.s). Calculate the col-umn efficiency (N) for this compound. Then, determine the number of theoretical plates per meter for a typical 30 m column.Answer: The initial issue is which equation to use to calculate the
column efficiency (N); four possible equations are available (see following). However, based on the available data, only one equa-tion is possible (i.e., N = 2π ((tr. h)/A)2).
N = 16.0 (tr/wb)2
N = 5.54 (tr/w1/2)2
N = 4.0 (tr/w0.6065)2
N = 2π ((tr. h)/A)2
Therefore, N = 2π ((tr. h)/A)2 is to be used. It is a useful starting position to consider the units.
Units:
N = (min. μV)/μV.s

141Answers to Questions
© 2010 Taylor & Francis Group, LLC
In order for the units to cancel, they need to be compatible. Clearly, in this example, we have time units of minutes and sec-onds. It is sensible to convert the retention time of 6.3 min to seconds by multiplying by 60.
N = (s. μV)/μV.s
N = no units
Now add the values for tr, h, and A.
N = 2π (378 s. 624,352 μV)/3,088,081 μV.s
N = 2π (76.4)2
N = 2π (5,837)
N = 36,675
Therefore, we have 36,675 theoretical plates; for a 30 m column, this is equivalent to
36,675/30 = 1,223 theoretical plates per metre
3. A compound with a retention time of 6.3 min has (a) a width at its peak base (wb) of 5.74 s, (b) a peak width at half height (w1/2) of 2.91 s and (c) a peak width at 0.6065 peak height (w0.6065) of 2.32 s. Calculate the different values for column efficiency (N) using Equation (3.3), Equation (3.4) and Equation (3.5). Then, determine the number of theoretical plates per metre for a 30 m column in each case.Answer: In the first instance it is necessary to check if the units are
compatible and hence will be cancelled out to lead to a unitless value for the column efficiency.
(a) Using the equation N = 16.0 (tr/wb)2, the units for N are min-utes per second. It is appropriate to convert the retention time of 6.3 min to seconds by multiplying by 60.
N = 16.0 (378/5.74)2
N = 16.0 (65.9)2
N = 16.0 (4343)
N = 69,488

142 Forensic Applications of Gas Chromatography
© 2010 Taylor & Francis Group, LLC
Therefore, we have 69,488 theoretical plates; for a 30 m column, this is equivalent to 69,488/30 = 2,316 theoretical plates per metre.
(b) Using the equation N = 5.54 (tr/w1/2)2, the units for N are min-utes per second. It is appropriate to convert the retention time of 6.3 min to seconds by multiplying by 60.
N = 5.54 (378/2.91)2
N = 5.54 (130)2
N = 5.54 (16,900)
N = 93,626
Therefore, we have 93,626 theoretical plates; for a 30 m column, this is equivalent to 93,626/30 = 3,121 theoretical plates per metre.
(c) Using the equation N = 4.0 (tr/w0.6065)2, the units for N are minutes per second. It is appropriate to convert the retention time of 6.3 min to seconds by multiplying by 60.
N = 4.0 (378/2.32)2
N = 4.0 (163)2
N = 4.0 (26,569)
N = 106,276
Therefore, we have 106,276 theoretical plates; for a 30 m column, this is equivalent to 106,276/30 = 3,543 theoretical plates per metre.
4. Based on your answer to question 3.2 and using Equation (3.6), calculate the height equivalent to a theoretical plate (in units of millimetres).Answer:
HETP = L/N
HETP = 30,000 mm/36,675
HETP = 0.82 mm

143Answers to Questions
© 2010 Taylor & Francis Group, LLC
5. Based on your answers to question 3.3 and using Equation (3.6), calculate the height equivalent to a theoretical plate (in units of millimetres).Answer:
(a):
HETP = L/N
HETP = 30,000 mm/69,488
HETP = 0.43 mm
(b):
HETP = L/N
HETP = 30,000 mm/93,626
HETP = 0.32 mm
(c):
HETP = L/N
HETP = 30,000 mm/106,276
HETP = 0.28 mm
6. A compound with a retention time of 6.3 min and a peak height of 624,352 (μV) has been assessed for peak asymmetry at (a) 10% of its peak height to have a value for ‘a’ of 1.8 s and a value for ‘b’ of 2.2 s, and (b) 5% of its peak height to have a value for ‘a’ of 2.0 s and a value for ‘b’ of 2.5 s. Calculate the peak asymmetry using Equations (3.7) and (3.8).Answer: Using Equation (3.7) at 10% of the peak height and referring
to Figure 3.3:
As = b/a (3.7)
As = 2.2 s/1.8 s
As = 1.22 (no units)

144 Forensic Applications of Gas Chromatography
© 2010 Taylor & Francis Group, LLC
Using Equation (3.8) at 5% of the peak height and referring to Figure 3.3:
As = (a + b)/2. a (3.8)
The units are
As = (s + s)/s
As = no units
The calculation is therefore
As = (2.0 + 2.5)/2. 2.0
As = (4.5)/4
As = 1.13 (no units)
7. The separation of some compounds by gas chromatography with a flame ionisation detector was done. On visual inspection, it appears that two of the compounds may not be separated (i.e., resolved). Compound A has a tr of 3.32 min and a peak width at its base of 6.5 s, while compound B has a tr of 3.51 min and a peak width at its base of 7.9 s. Using Equation (3.9), calculate the resolution of the peaks and hence determine whether they are resolved or not.Answer: Using Equation (3.9)—that is, R = (tr2 – tr1)/(0.5 (wb1 + wb2)),
determine the resolution of the two peaks.
R = (tr2 – tr1)/(0.5 (wb1 + wb2))
where tr2 is the retention time of compound B and tr1 is the reten-tion time of compound A. Similarly, wb1 is the width at the base of compound A and wb2 is the width at the base of compound 2.
The units are
R = (min – min)/(s + s)
R = (min)/(s)
Therefore, the units will not cancel (giving the unitless term for resolution). To remedy this situation, convert the tr values in minutes to seconds by multiplying by 60.

145Answers to Questions
© 2010 Taylor & Francis Group, LLC
R = (3.51 – 3.32)/(0.5 (6.5 + 7.9))
Or now, more correctly (after converting all units to seconds),
R = (211 – 199)/(0.5 (6.5 + 7.9))
R = (12)/(0.5 (14.4))
R = (12)/(7.2)
R = 1.7 (no units)
Therefore, compound A and compound B are separated (resolved).
Chapter 4
1. If two peaks were coeluting with each other at the beginning of a chromatographic separation at 80°C (isocratic), what could be done to the method to try to obtain resolution (spread them out)?Answer: Decrease the temperature at the start of the run; this may
result in a temperature ramp to elute all analytes (if more are present).
2. If there is a large gap of 6 min in the chromatogram between the fourth and fifth peaks of a five-analyte mixture, how could the gap be reduced?Answer: Introduce a quick temperature ramp.
3. If your first (solvent) peak does not elute from the GC system until 6 min, what can be done to try to reduce the retention time of the first peak?Answer: Increase the initial temperature on the temperature pro-
gram to 10°C below that of the solvent.
Chapter 5
1. List the four Qs and explain their purpose in instrument qualification.Answer: The four Qs are design qualification (initial consider-
ation of what is required of the instrument, including software requirements; the space and money available, and the training required), installation qualification (checking the modules and electrical plugs of the instrument against the purchase order;

146 Forensic Applications of Gas Chromatography
© 2010 Taylor & Francis Group, LLC
typically the instrument will be plugged in and communication will be ascertained), operation qualification (making sure that each of the modules of the instrument performs to defined speci-fications) and performance qualification (demonstrate that the instrument continues to meet the acceptance criteria throughout the anticipated working range).
2. When trying to establish linearity, experimental data were obtained from the GC instrument. The R2 value was found to be 0.988. Is this value acceptable or not?Answer: An R2 value of 0.988 is not generally accepted. Further work
should be carried out to establish a better R2 value. This value should be ≥0.999 in order to be acceptable for method validation purposes.
3. What is the purpose of ISO/IEC 17025?Answer: ISO/IEC 17025 is the International Standard ISO 17025:2005
and outlines the ‘general requirements for the competence of test-ing and calibration laboratories’. It is used as the basis of accredi-tation schemes in forensic science (e.g., UKAS and ASCLD/LAB).
Chapter 6
1. Can you name and identify some GC instrument manufacturers?Answer: Some suppliers of GC instruments are Agilent Technologies
(http://www.agilent.com), Thermo Scientific (http://www.thermo-scientific.com) and Perkin Elmer (http://www.perkinelmer.com).
Chapter 7
1. What is a functional group?Answer: A functional group is an atom or group of atoms that have
similar chemical properties within molecules and are responsi-ble for the chemical reactions that molecules undergo. Examples include the carboxylic acid group (RCOOH), the ester group (RCOOR′), the alcohol group (ROH), the aldehyde group (RCHO) and ketone group (RCOR′), where R and R′ are alkyl groups.
2. What are the chemical structures of the following derivatising agents (a) BSTFA, (b) MSTFA, (c) TMSI and (d) MTBSTFA?Answer:
(a) N,O-bis-trimethylsilyl-trifluoroacetamide (BSTFA)

147Answers to Questions
© 2010 Taylor & Francis Group, LLC
N
H3C
H3C
H3C
OSi Si
F
FF
CH3CH3
CH3
(b) N-methyl-N-trimethylsilyl-trifluoroacetamide (MSTFA)
O
N Si
H3CF
FF CH3
CH3
CH3
(c) N-trimethylsilylimidazole (TMSI)
CH3
CH3Si
N
N
H3C
(d) N-methyl-N-(t-butyldimethylsilyl)trif luoroacetamide (MTBSTFA)
O
CH3
NSi
H3CF
F
FH3C
CH3CH3
H3C
3. What are the chemical structures of the following derivatising agents: (a) trifluoroacetic acid (TFAA), (b) pentafluoropropionic acid anhy-dride (PFPA) and (c) heptafluorobutyric acid anhydride (HFBA)?Answer:
(a) Trifluoroacetic acid (TFAA)
OHO
F F
F
(b) Pentafluoropropionic anhydride (PFPA)

148 Forensic Applications of Gas Chromatography
© 2010 Taylor & Francis Group, LLC
OOF F
FF
F FF F
F F
O
(c) Heptafluorobutyric anhydride (HFBA)
OOF F
FF
FF
F FF F
F FF F
O
4. Identify some commercial suppliers of solid phase extraction cartridges.Answer:
Agilent Technologies (http://www.agilent.com)Perkin Elmer (http://www.perkinelmer.com)Phenomenex (http://www.phenomenex.com/)Restek (http://www.restek.com/)Sigma Aldrich (http://www.sigmaaldrich.com)Thermo Scientific (http://www.thermoscientific.com)Waters (http://www.waters.com)
5. Identify a forensic gas chromatography application that uses solid phase extraction.Answer: Many applications exist that use solid phase extraction in
forensic GC applications. As well as using your respective uni-versity library search engine to find relevant articles, you could also search within http://scholar.google.co.uk/using the key words ‘forensic spe gc’.
6. Identify a forensic gas chromatography application that uses solid phase microextraction.Answer: Many applications exist that use solid phase microextrac-
tion in forensic GC applications. As well as using your respec-tive university library search engine to find relevant articles you could also search within http://scholar.google.co.uk/using the key words ‘forensic spme gc’.
Chapter 8
1. When analysing a trace sample suspected of being heroin, what technique(s) would you use to confirm and what compound(s) would you be looking for?

149Answers to Questions
© 2010 Taylor & Francis Group, LLC
Answer: Since limited sample is available for analysis, GC-MS would be used, diacetylmorphine and other opium alkaloids such as morphine and codeine.
2. The barbiturates butalbital and secobarbital were analysed by GC-MS and two peaks were found with similar retention times. On further mass spectrometric analysis, both peaks were found to have princi-pal ions of 167 and 168 Da. How would you identify which peak was which compound?Answer: Pure standards of both barbiturates would be analysed
separately and the retention times would be compared to those found in the mixture analysed.
3. Which derivatising reagent would you choose to use with the follow-ing analytes?
(a) (b) (c)
OOH
N
CH3
HO CH3
NH2O
OO
CH3
H3CH3C
OH
C5H11
O
OH
Answer: (a) BSA or MSTFA, (b) HFBA or other acylating agent, (c) MSTFA or BSTFA.
4. In our toxicology example (Section 8.3.6), Proadifen was used as an internal standard and was added to the blood sample prior to the extraction step. What is the purpose of an internal standard?Answer: An internal standard is added to the sample prior to extraction
for comparison of signal from the analyte. This is used to establish how much analyte is extracted (efficiency of extraction). Internal standards are especially useful for analyses where the quantity of sample analysed or the instrument response varies slightly from run to run for reasons that are out of the analyst’s control.
5. Although Proadifen was used in our example, it is best to use a deu-terated analogue of the analyte(s) under investigation. Why?Answer: An isotopically labelled version of the analyte(s) is best to
use since this compound is chemically similar and therefore will have a similar (or the same) retention time but is not likely to be present in the sample being analysed.
6. In GC-MS the most abundant ion is not always the molecular ion. Why?

150 Forensic Applications of Gas Chromatography
© 2010 Taylor & Francis Group, LLC
Answer: The molecular ion may not be the most stable fragment formed and therefore may not always be the most abundant.
7. When extracting ions to identify the aromatic components from the chromatogram from fire debris that may contain an ignitable liquid, two ions, 91 and 105 (as well as 119) Da, are used. Why use these ions?Answer: Alkylbenzene to tropylium ion = 91 Da; 1,2,4-trimethyl-
benzene to methyltropylium ion = 105 Da. 8. Is there a difference between an accelerant and an ignitable liquid?
Answer: Yes. An accelerant is used to help increase the rate at which fire will spread or can make the fire more intense. An ignitable liquid is one that will ignite readily in the presence of a source of ignition. Not all ignitable liquids are used as accelerants; they can be present normally in the fire environment (e.g., paint thin-ners and paint brushes stored inside a garden shed that catches fire). The paint thinners were being stored in the shed rather than being used to accelerate the fire.
9. In the example of the fire debris analysis by GC-MS (Section 8.4.7), SPME was used as the sample introduction technique with a car-boxen/PDMS fibre. Why was this fibre chosen?Answer: The carboxen/PDMS SPME fibre is a bipolar fibre that is
typically used with gases and low molecular weight (typically 30–250 Da) compounds.
10. Why is py-GC the ‘last resort’ when carrying out forensic analysis of paint?Answer: py-GC is a destructive technique and these types of tech-
niques should only ever be used as a last resort since the sample is used up in the analysis.
11. Why are molecular ions not investigated in py-GC analysis of paint?Answer: As pyrolysis is used to break down components in the paint
sample thermally, we will not use molecular ions to identify paint components; instead, we will consider the pyrolysed prod-ucts from the paint components.
12. Why is urine sometimes added to adulterated perfume?Answer: Urine has been added as a stabiliser in fraudulent perfume.
Stabilisers are usually added to stop or slow the degradation of components in perfume. (These compounds are also used in food products for the same reasons.)
13. Why are high-value goods adulterated?Answer: By their very nature, high-value goods are open to adul-
teration because they are generally sought after and are products that cost much money to produce or harvest. By adding lower

151Answers to Questions
© 2010 Taylor & Francis Group, LLC
cost, similar products to the high-value ones, the adulteraters can make more money (and deceive buyers and consumers).
14. Why are SPME and headspace good sampling methods for the anal-ysis of fragrances?Answer: Fragrances are volatile compounds; both headspace and
SPME sampling techniques exploit the volatility of components in a sample. Heating the sample gently aids the transfer of the volatile components from the liquid phase to the gas phase (into the headspace). The headspace can be sampled directly or SPME fibres can be chosen to sample the headspace.


153© 2010 Taylor & Francis Group, LLC
Glossary
Accuracy: A measure of the degree of closeness of the measured value to the true or actual value.
Activity coefficient: A thermodynamic factor used to account for devia-tions from the ideal behaviour in a mixture of substances.
Adsorption chromatography: Involves the interactions of a solute at the surface (or on fixed sites) of a solid stationary phase.
Analyte: Substance or compound of interest measured in an analytical procedure.
Anion: An ion or group of ions carrying a negative charge.Atom: Basic unit of matter with a central nucleus and surrounded by a cloud
of negatively charged electrons.Buffer: A solution that resists changes in pH when small amounts of acid or
alkali are added to it.Calibration: The comparison of one measurement of known amount made
on a specific piece of instrumentation with a second measurement made on a similar piece of equipment.
Capacity factor (retention factor): A measure of the time the analyte resides in the stationary phase relative to the time it resides in the mobile phase.
Carry over: That which is carried over or extended to a later time. In chro-matography this refers to material that is carried over from one run to another as a result of an insufficiently long run time or through contamination of the injector.
Cation: An ion or group of ions carrying a positive charge.Chromatogram: The pictorial representation of separated substances
obtained using chromatography.Chromatograph: A piece of equipment used to generate a chromatogram or
the act of separating a mixture of compounds using chromatography.Column: The support in which a chromatographic separation occurs.Dilution: Reduction in concentration of a solution through the addition of
further solvent, usually to a known final volume.Dipole–dipole moment: Inter- or intramolecular interaction between mol-
ecules or groups having a permanent electric dipole moment.Dipole moment: Measured polarity of a polar covalent bond.

154 Glossary
© 2010 Taylor & Francis Group, LLC
Dissociation: The process by which a chemical combination splits up into its chemical components.
Dissociation constant: A measure of the likelihood of a larger entity break-ing up into smaller components. It is denoted by Kd and the higher the value is the higher the proportion of the dissociated component that will be present in a mixture.
Eddy diffusion: The process by which substances are mixed due to eddies, where an eddy is described as being a current that is inconsistent with the main stream in a flow of liquid or gas.
Element: A pure chemical substance consisting of atoms that have the same atomic number.
Extraction: The process of separating a substance from a mixture of substances.
Filtration: A technique used to remove impurities from a solution or to iso-late a particular chemical substance from a solution based on size.
Functional group: A functional group is a specific group of atoms within a molecule that characterise it in terms of reactivity. An example of a functional group is a carboxylic acid group (–COOH).
Intermediate precision: Expresses the variation in results within a labora-tory due to differences in (a) the instrumentation used and (b) the analyst who carries out the processes.
Intermolecular forces: Momentary unstable forces that act between stable molecules or between functional groups of macromolecules.
Intramolecular forces: Describe any force that holds atoms or ions together in a molecule or compound. They can be covalent, ionic or metallic.
Linearity: A linear relationship in GC is demonstrated when the plot of the detector response as a function of concentration or content is found to be a straight line by statistical means. The linearity of an analyti-cal procedure is its ability to obtain results directly proportional to the concentration of analyte in the substance (ICH Q2 R1).
Lipophilic: A substance that has an affinity for lipids; that is, it will dissolve much more readily in lipids (oily organic compounds) than it will in water.
Liquid–liquid extraction: The process of separation of an analyte or ana-lytes from a substance due to unequal solubility in two immiscible liquids, usually water and an organic solvent.
Longitudinal diffusion: The diffusion of an analyte in the mobile phase as it passes through the analytical column driven by the concentra-tion gradient. It contributes to band broadening, especially at low flow rates.
Matrix: The components within a mixture that provide support and struc-ture but are not directly relevant to the analytes of interest. Blood is an example of a matrix in the examination of drugs of abuse.
155Glossary
© 2010 Taylor & Francis Group, LLC
Mobile phase: Carries the analyte through the stationary phase. It is usually an inert gas such as helium, nitrogen or hydrogen.
Molecule: The smallest part of a substance that is composed of two or more atoms of the same or different type that are held together by chemi-cal forces.
Peak area: A measure of the area under the curve or peak within a chromatogram.
Polarity: Polarity of a bond refers to the distribution of the electrical charge over the atoms that are joined together by the bond. In a polar com-pound, the charge is distributed asymmetrically due to the differences in electronegativity between the atoms that make up the compound.
Precision: The closeness of agreement between a series of measurements obtained from multiple sampling of the same sample. It can be considered at three levels: repeatability, intermediate precision and reproducibility.
Qualitative: An analysis in which identification of the analyte of interest is determined. This is usually achieved using a particular characteristic of the compound of interest, such as retention time, detector response (e.g., flame ionisation detector) and reference standard comparison.
Quality assurance: The process of establishing whether a process or product meets customer expectations and is suitable for its intended purpose.
Quality control: The systems that are put in place in order to ensure that the product is fit for its intended purpose.
Quantitative: An analysis in which the amount of the analyte of interest is determined using a reference standard material of the same chemi-cal structure.
Quantum theory: The study of the interactions of matter and radiation at the atomic and subatomic levels.
Range: The interval between the upper and lower concentration for which it has been demonstrated that there is a suitable level of accuracy, precision and linearity.
Repeatability: A measure of the precision of the method over a short period of time using the same sample solution.
Resistance to mass transfer: The time taken for the analyte to transfer from the mobile to the stationary phase.
Resolution: A measure of the separation between two adjacent compounds within a chromatographic separation. Under ideal conditions, reso-lution should be ≥1 and ≤10.
Retention factor: A measure of the amount of time an analyte spends in the stationary phase relative to the mobile phase.
Retention time: Time taken for an analyte to travel from the point of injec-tion to the point of detection within a GC system.

156 Glossary
© 2010 Taylor & Francis Group, LLC
Robustness: A measure of a method’s ability to withstand small but deliber-ate changes in the method parameters; provides an indication of its reliability during normal usage.
Separation factor: A measure of the ability of the system to separate two components within a mixture.
Solid phase extraction: A process used to separate compounds from a mix-ture based on their chemical and physical characteristics.
Solubility: A measure of the amount of solid required to be added to a given volume of solvent in order to form a saturated solution.
Specificity: A method’s ability to measure, without doubt, an analyte in the presence of other materials that might be expected to be present in the sample matrix.
Stationary phase: Typically refers to the liquid-coated capillary columns. The choice of stationary phase influences the chromatographic separation.
Theoretical plate: A hypothetical zone within a GC column. The greater the number of theoretical plates within a column is the better the separating power will be.
Validation: Confirms that the method and the equipment consistently meet the requirements for a specific use and are fit for purpose.
Van der Waals forces: The weak electric forces of attraction or repulsion that exist between neutral molecules.
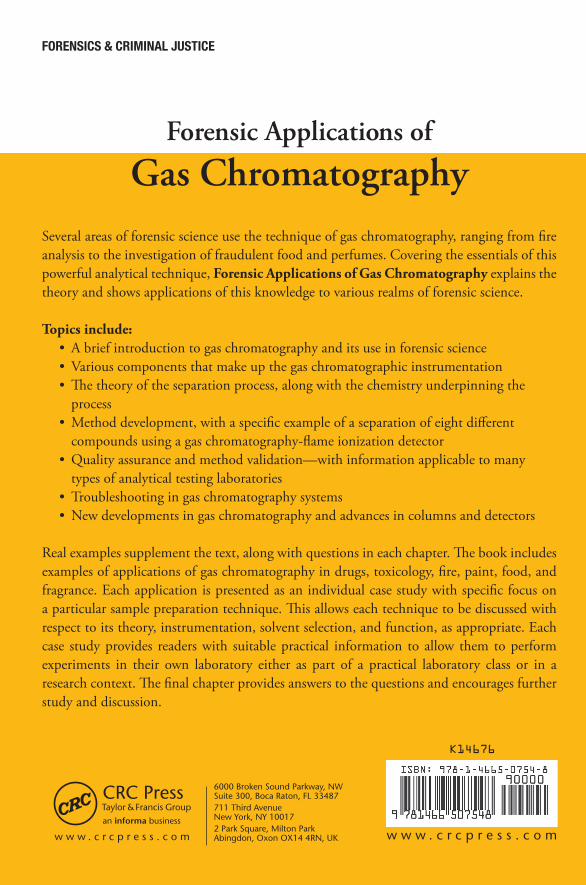
6000 Broken Sound Parkway, NW Suite 300, Boca Raton, FL 33487711 Third Avenue New York, NY 100172 Park Square, Milton Park Abingdon, Oxon OX14 4RN, UK w w w . c r c p r e s s . c o m
K14676
Forensics & criminal Justice
GasChromatography
Forensic Applications of
A n a l y t i c a l C o n c e p t s i n F o r e n s i c C h e m i s t r y S e r i e s
Gas ChromatographyForensic Applications of
Carlin | D
eanForensic A
pplications of Gas C
hromatography
Michelle Groves CarlinJohn R. Dean
an informa business
w w w . c r c p r e s s . c o m
Several areas of forensic science use the technique of gas chromatography, ranging from fire analysis to the investigation of fraudulent food and perfumes. Covering the essentials of this powerful analytical technique, Forensic Applications of Gas Chromatography explains the theory and shows applications of this knowledge to various realms of forensic science.
Topics include:• Abriefintroductiontogaschromatographyanditsuseinforensicscience• Variouscomponentsthatmakeupthegaschromatographicinstrumentation•Thetheoryoftheseparationprocess,alongwiththechemistryunderpinningthe
process•Methoddevelopment,withaspecificexampleofaseparationofeightdifferent
compounds using a gas chromatography-flame ionization detector • Qualityassuranceandmethodvalidation—withinformationapplicabletomanytypesofanalyticaltestinglaboratories
• Troubleshootingingaschromatographysystems• Newdevelopmentsingaschromatographyandadvancesincolumnsanddetectors
Realexamplessupplementthetext,alongwithquestionsineachchapter.Thebookincludesexamples of applications of gas chromatography in drugs, toxicology, fire, paint, food, and fragrance. Each application is presented as an individual case study with specific focus on aparticularsamplepreparationtechnique.Thisallowseachtechniquetobediscussedwithrespect to its theory, instrumentation, solvent selection, and function, as appropriate. Each case studyprovides readerswith suitablepractical information toallow themtoperformexperiments in their own laboratory either as part of a practical laboratory class or in aresearchcontext.Thefinalchapterprovidesanswerstothequestionsandencouragesfurtherstudy and discussion.


![Gas Chromatography-Mass Spectrometric Analysis of Forensic … · 2017-10-28 · benzodiazepines in blood [12-14]. Using liquid-liquid extraction, gas chromatography with tandem mass](https://static.fdocuments.in/doc/165x107/5e3b4516665f2b635c6b48a7/gas-chromatography-mass-spectrometric-analysis-of-forensic-2017-10-28-benzodiazepines.jpg)