FOREIGN TECHNOLOGY. - Defense Technical … TECHNOLOGY. DIVISION ... STalUNS OR TamaIS P IPARD bTs...
15
FOREIGN TECHNOLOGY. DIVISION A RESONANCE-TYPE ULTRASONIC THICKNESS GAGE FOR MEASURING THE WALL THICKNESS AND CORROSION OF CHEMICAL PLANT EQUIPMENT by M. C. Tang Distribution of this document is ,. unlimited. It May be released to the Clearinghouse, Department of' Comerce, for sale to the general "h"" Is @i V& Best Available Cop.
-
Upload
dinhkhuong -
Category
Documents
-
view
214 -
download
1
Transcript of FOREIGN TECHNOLOGY. - Defense Technical … TECHNOLOGY. DIVISION ... STalUNS OR TamaIS P IPARD bTs...

FOREIGN TECHNOLOGY. DIVISION
A RESONANCE-TYPE ULTRASONIC THICKNESS GAGE FOR MEASURING THE
WALL THICKNESS AND CORROSION OF CHEMICAL PLANT EQUIPMENT
by
M. C. Tang
Distribution of this document is,. unlimited. It May be released to
the Clearinghouse, Department of'
Comerce, for sale to the general
"h"" Is @i V& Best Available Cop.

fD-HI- 67-163
EI EDTRANSLATION
A RESONANCE-TYPE ULTRASONIC THICKNESS GAGE FOR MEASURING THE
WALL THICKNESS AND CORROSION OF CHEMICAL PLANT EQUIPMENT
By: M. C. Tang
English pages: 12
SOURCE: Hua Hsueh Shih Chieh (Chemical World). Vol. 18,No. 8, 1964, pp. 377-379.
Translated under: Contract AF33(657)-16410
CR/o115- 64- 018-008 TP7001 22
TINS TRAIAW IS A UMiTO0S OF TlI OSMI.PAL FMo31 TMXT ITNoW AMN ANALYTICAL 92ftwa COIEww. STalUNS OR TamaIS P IPARD bTs
AeYWTMOe waPI nAnsml ost p e scum'"AM* NOT MCINARIY REflECf TIlE POSTION TANATION SMOat OPINIoew TI POlMN TIr•C ,Oy S. PW real" TURCLHoty DwIVo"
FTD- HIT - 67-163 DIj3.Sep 19 67
F
* p,

ITIS INI.,U. CONT£RWi.- FORN.
OIc r18Tasation Nx j 5 X RLfcA~ce Nx 76 Reel/Fxawes NA:TI"y0O1'- C)2 11T6700.63 AP I000255 If ]I 093197 Header Clas 63 C los 164 Conthxol Markinq! 94 rI?-;Pans:1o( 40 Ctry InfoUNCL U CL, 0/0 CH02 Ctry 03 Ref 1 04 )r_ 05 Vo 0 s 077Pg 45 Ei. P9. 10D0 tOH 01i15 | 6.08 08 |0377_. 0379 NONEo Transliterated Title...807 .39 -NONE AVAILABLE
• 09 English Title A RESONANCE-TYPE ULTRASONIC THICKNESS GAGE FOR MEASURING•TE WALL THICKNESS AND CORROSION OP CHEMICAL PLANT EQUIPMENT43 Source
HUA HSUEH SHIH CHIEH (CHINESE)42 Author 98 Document Location
T'ANG, MENG-CH'I (0781/1125/i142) 116 Co-,Aiithr 47 Subject Codes
NONE 20, 1316 Co-Author 39 Topic Tags:
NONE corrosion, ultrasound, signal identificatie.l;16 Co-A.tho / thickness gage, ultrasonic wave,
NONE •chemical plant equipment
NONE
ABSTRACT: The author discusses'he principles of thickness measurement by theultrasonic resonance method and deee4kes equipment designed for applyingthis tehnin!e to the measurement of the depth of corrosion in chemicalequimeý.4 phasis is placed on the proper use of transducers and couplingmedia for optimum results. In actual practice, certain key points should beselected for testing signal identification is best achieved with an oscilloscope,and if the resonant signal appears very often during measurements of thickness,the accuracy can be improved by taking the mean of several measurements.Some of the parameters of the Chinese model HS-i meter, which has a maximumerror of 4-4%, and an average error of 1-3% when meazuring steel having athickness of 3-30 mm, are given. At the present time, this techniquecannot be used for measuring the wall thickness of small-diameter pipes.("Comrades Ku Wang (7357/2598) and Engineer Tso Ching-i (1563/2529/0122))also took part in the work." Orig. art. has: i table, 2 figures and4 formulas. English Translation: 12 pages.
Frm~FTD r1 O-.-90

A RESONANCE-TYPE ULTRASONIC MtlCiCNESS GAGE FOR ,.,EASU ( TH....WALL THICKNESS AND CORROSION' Of CHIFZICAL I'LkNT ,QUI
M. C. Tang
1. Introduction
Due to the fact that chemical plant equipment is often subject to chemical
corrosion, regular inspections and maintenance are necessary. In the past, the
testing of the wall thickness of equipment such as high-pressure containers, pipe-
lines, reservoirs, etc., employed the hole-drilling method to make mechartical
measurements. This method of testing is not only uneconomical with respect to time
and cost, but also has the disadvantage of not being applicable to the equipment
in operation. If an ultrasonic resonant thickness gage is employed, it does not
interfere with the plant operation; it is easy to use and makes it possible to
perform measurements on operating equipment. Furthermore, it is also possible to
detect internal cracks, pits, and unevenness in thickness of equiprment such as
pipes. Corrosion as well as weak spots between pipes and furnace walls can also be
detected. Therefore, this type of gage has not become a very important instrument
for corrosion tests [1-8].
II. Principle of Measurin. Thickness by Resonance
An ultrasonic wave is produced by the stimulation of a piezoelectric crysta"
plate by means of high frequencies. The vibration caused by a crystal plate is
similar to the vibration of a piston, and the vibrational frequency is the same aw;
a high-frequency electrical oscillation. This kind of vibration produces ultra--
sonic waves. When the crystal plate is placed against the equipment to be measured
with the aid of a coupling device, ultrasonic waves may be transmitted to the
material.
The principle of the resonance-type ultrasonic thickness measuremnt technique
is based on two fundamental characteristics of ultrasonic waves. First, ultra';onic
waves produce reflections at the boundary of two materials with two difterent
FTD-UIT-67-163,

sound resistances. For example, at an air/steel or chemical medium/steel boundary,
most of the ultrasonic waves reflect back to steel. Second, the velocity of propa-
gation of an ultrasonic wave in a material depends on the density of the material
and the elastic constant. For eaz; -naterial, the ultrasonic wave has a certain
value of propagation velocity. For example, its veiocity in steel is 5,SIO meters/
second. In the process of propagation, the wavelength Is inversely proportional
to frequency and directly proportional to velocity. lRxequency does not affect
veloeity.- Therefore, if the wavelength of the. ultrasonic wave propagated between
the correct and incorrect sides of the material is ascertained, the thickness
reading of the material can be obtained. In actual practice, the frequency of the
ultrasonic waves produced by the crystal plate usually undergoes a conversion
through a variable capacitor of the regulating instrument, and the value may be
directly indicated by the regulator in terms of megacycles (Mc). Therefore, the
wavelength of the ultrasonic wave in the material cadl be controlled by adjusting
the frequency. As soon as the wavelength of the ultrasonic wave is adjusted to a
value at which the half-wavelength or the multiple of the half-wavelength is equal
to thc thickness of the material to be measured, a standing wave is established,
thus producing resonance. This principle is similar to the resonance phenomenon
which occurs in organ pipes. The equation is:
S- 2t fl V/2t (1)
where A - the waveleng. of the ultrasonic wave
t - the thickness of the material to be measured
fl a the fundamental resonance frequency
V - the velocity of propagation of the ultrasonic wave in the
workpiece.
The phenomenon of resonance can appear not only at the fundamqptal resonance
frequency, but also at the multiples of the fundamental resonance frequency; nAmely,
2fl, 3fl, 4f1 ..... 2fl is called the second harmonic frequency, 3fl, the third
FTD-HT-67-163
----- ----- ---- W
*6sI

harmonic frequency, etc. If only the fundamental frequency .u u',,d to moasur ,
thickness, it needs a very wide frequency range in order to t ( "o re~pwe a
certain thickness range. For steel with a thickness range of 0.025-0.5 in(uhes, ae
frequency range should be 0.23 - 4.6 Mc, It is very difficult to arrange such a,
wide frequency range into one wave section. Therefore, in actual practice, harmonic
.frequencies are employed. In the process of weasurement, one must knou tvo~adja-
ceut resonance frequencies. Their difference is the fundamental resonance frequency.
Now equation (1) can be written as
V .t -(2)
2(fn-- fn-l)
where fn a the n-th harmonic frequency
fn-1 - the (n-l)-th harmonic frequency
(fn- fn- 1 ) - f, - the fundamental resonance frequency
The frequency should be adjusted so that the material to be measured produces
resonance. During resonance, the plate current in the oscillating tube is in-
creased; after amplification, the resonance signal can be detected by means of
"earphones or by an electric meter. The signal can also be carried to the Y-axis of
the oscillograph, and the height of the wave pip may be seen from the fluorescent
screen as shown in Figure 1. Find any two adjacent harmonic frequency values and
4
Figure 1. Schematic diagram of resonancethickness gage. 1. variable-frequency o.,:cil-"lator; 2. range-selector switch; 3 motor-driven capacitor; 4. cable; 5. energy con-verter; 6. workpiece; 7. sweep amplifier; 8.signal amplifier; 9. oscillograph.
substitute them into equation (2), and the thickness of the material to be reasured
FTDW-IT-67-163 3

can be calculated. In this equation, C/2 is a constant for a certain material.
For steel, if t is given in rm, and frequency in Me, C/2 equals 2.95. It is very
convenient to calculate the thiciknss by constructing a frequency-thickness con-
version teble or by using a sliderule as calduladng tools.
III ku.t al Zw lS wqvrp.j atd .CJusPLM kmataShere are many kbhds of piezoelectric materials, such as lithium sulfate,
4aarts, bArium titanate, oetc. Quartz and barium titanate, however, are used the
"-most for Liwpection pftrpo : I Barium titanate piezoelectric crystals are made by
beating titanium dioxide with baezm carbonate at a high temperature,. followed by
polarizing treatment. It can produce comparatively strong ultrasonic weves. In
the meantime, it is highly moisture resistant and can be easily made into crystal
plates of a variety of shapes. Therefore, it has a more extensive application.
A crystal plate has its own natural frequency. The hs oral frequency is
Iniersely proportional to thickness. Quartz has a frequency coastant (the product
of natural frequency and thickness) of 2.87 Meamm, whila the frequency constant of
a barium tatanate crystal is 2.5 Hcomm. Hence, a rystal with a tized thickness
also ha. a fixed natvaral frequency. In measuring t11ckmes8, it Is possible to
detect the re& wnsit signal of the crystal's natural frequency. Its appearance can
be detect4 by looking Or the existence of a resonant signal without contacting
the material to be uMd. Thus, we can distinguish a false signal from a real
m. It is best to select the crystal plate used for the resonance-type thicknes
Vse with such a thickness that the aetural frequency of the crystal plate Is
higher than the highest operating frequency of the instrument. However, they should
"not be too far apart; othervise, the seusitivIty of the meagurement will be greatly
ieduced. It has been proved in prattice that it would be satisfactory if the
frequency ratio does not exceed 2:1.
The size of the crystal plat. ;rodned by the lowest operating frequency.
IUs diameter must correspond to several vevelengths of the ultrasonic wave in the
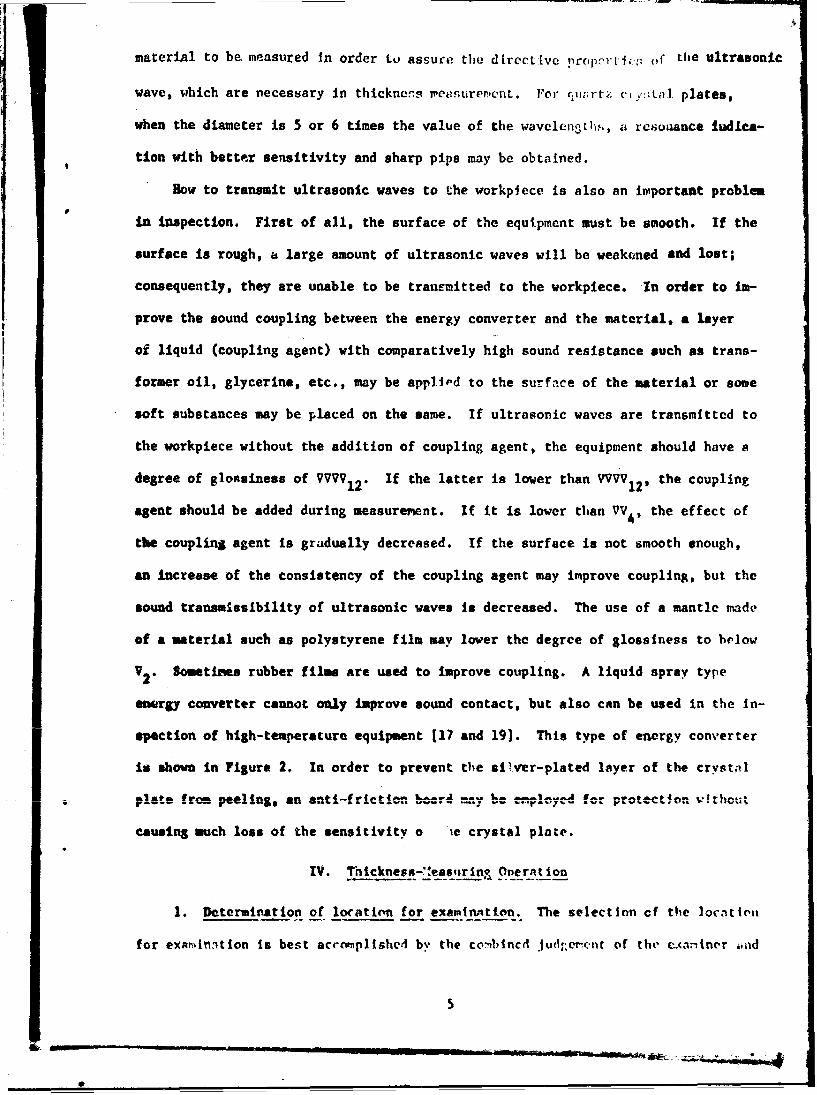
material to be measured In order Lu assure the direct lve propfrl-iýs r,f the ultrasonic
wave, which are necessary in thickne'~s roeuremcnt. Fo" r.nrtz ci yja::t plates,
when the diameter is 5 or 6 times the value of the wavelengtl., a resoaance tudica-
tion with better sensitivity and sharp pips may be obtained.
How to transmit ultrasonic waves to the workplece is also an important problem
in inspection. First of all, the surface of the equipment must be smooth. If the
surface is rough, a large amount of ultrasonic waves will be weakcned and lost;
consequently, they are unable to be transmitted to the workpiece. In order to im-
prove the sound coupling between the energy converter and the material, a layer
of liquid (coupling agent) with comparatively high sound resistance such as trans-
former oil, glycerine, etc., may be applAod to the surface of the material or some
soft substances may be placed on the same. If ultrasonic waves are transmitted to
the workpiece without the addition of coupling agent, the equipment should have a
degree of glossiness of VVVV 1 2 . If the latter is lower than VVVV1 2, the coupling
agent should be added during measurement. If it is lower than VV4, the effect of
the coupling agent is gradually decreased. If the surface is not smooth enough,
an increase of the consistency of the coupling agent may improve coupling, but the
sound transmissibility of ultrasonic waves is decreased. The use of a mantle made
of a material such as polystyrene film may lover the degree of glossiness to below
V2. Sometimes rubber films are used to improve coupling. A liquid spray type
energy converter cannot only improve sound contact, but also can be used in the In-
spection of high-temperature equipment [17 and 191. This type of energy converter
is shown in Figure 2. In order to prevent the silver-plated layer of the crystal
causingsmuch loss of the sensitivity o ie crystal plate.
IV. Tnickness-":eassirin? Oneration
1. Determination of location for examInAtion. The selection of the location
for examinntion is best acrornplished by the ccbIncd jud••e•tit of the e..axdner 4,d
5

Figure 2. Construction of a liquid spraytype energy converter. 1. circulatingcooling water; 2. internal diameter of ultra-sonic wave absorbing compartment; 3. pieso-electric crystal; 4. water chamber; 5. thermal-Insulated sound- transmission housing.
the person who is filiar with the corrosion condition of the equipment in the
plant. A selected location should be representative and significant. It should
not be arbitrarily determined. For instance, the rate of corrosion at different
depths of a reservoir is possibly not the same: e.g., the corrosion is different
at the top from that at the bottom and is especially bad at the water level. There-
fore, it is more important to exins the top mad the water-level parts of a
reservoir. The examining location mat be accessible and easy to work with. In
order to esxine a high washing tower and the top of a reservoir, the examiner
mast we a suspension basket or similar means to elevate himself to that hei&ht to
treat the surface and make the measurements.
2. � S dain locations. Insulating materials, thick layers
of paint, and decayed products most be removed. Polishing equipment, such as hand
a Sh&&F4 1&* sand paper.. cktt P bew qkmlovatd in order to _asure a tood
socmd-couplinS plane. The plane should be a little larger than the ene-gy converter
in order to silow enougb space for the latter to mov around. Because sometimes
die internal surface of the equipment is too rough or pitted, it will lower the
strength of the signal, or even no signals can be received. Vhan the depth of a
certain pit reaches 202 of the total thickness, it is Impossible to make thickness
.aserements. If the energy converter can be moved a little freely, the thickness
reading say be obtained.
6

In order to determine the corrosion zate of a certain .. ,' a piece of
equipment, such as a contalner or a reservoir, the poliý:;Ied p,:r.L: i,.--:L bC well
protected after the thickness measurement, other..isc. t:•I. - V illquiI).'.•,-•t viii
be the result in both cases. The dirt and sedimenit cn the internal surface and
the materials inside the equipment do not affect the measureiaent, but the inclina-
tion at the back, corrosion marks, uneven areas and spots can affect signals, thus
causing difficulty in measurcment.
3. Interpretation of signal. It is more accurate to use an oscillograph to
detect the appearance of the resonance point than to use an electric meter or ear-
phones. Sharp wave pips will appear on the screen of the oscillograph as soon as
the resonance point is reached, and they will disappear immediately if the resonance
point is slightly off. During resonance, the amplitude is expecially high. From
the shape of the wave, the condition of corrosion on the inner surface of the equip-
ment can be dittinguished. If the inner surface is smooth, the shcpe of the
resonance iave is high and regular. In actual practice, there must be some corrosion
on the inner surface of the equipment, so the wave is usually not re3ular In shape.
To perform a more detailed analysis of these conditions, it is necessary to make
judgements besed on a variety of wuve shapes. It is difficult to take average
thickness measurements of equipment with large inclinations. When the inner surface
has spots and zigzag areas, the energy converter may take mcasurement.i by golug a
round the spots or zigzag areas once. The wave shape is r'gular. The energy con-
verter should be moved to the center of the spots or zigzag areas. The wave shape
then becomes very irregular. Thus, the location and size of the spots and zizag.
areas can be determined.
In general, the more uneven the inner surface is, the lower is the hci,'tt of
the wave and the more irregular in the wrva shape; conseque.ntly, the r.oro difflcuit
is the measurement.
4. Neasurenent of wall thicknc.ns. In neasurinm the thickne.- of thiick--:ill. d
equipment, the resonance signals are quite close together. To incr.acn accuracy,
7
0' " - . . • - . . .. . • ... " - i '" i • -,,• • •,
average values are adopted. It is best to make several measurements so that the
resonauce point will not be overlooked. In the same frequency range, fewer reso-
nance points will appear in thin-walled equipment, because it is not possible to
take a sufficiently large number of readings to get an average; therefore, it should
be accurately measured each time. We used an HS-l resonance-type thickness gage
me•ifactured in this country to make experimental thickness measurements of
chemical plant equipment in laboratories and factories. The result was satisfactory.
The error was less than 3% of the measured thickness (measuring range: 3-30 mm).
For higb-?ressure tubing with a diameter of several centimeters, however, since it
is impossible to work out a more smooth surface on the tubing to assure a good
sound coupling, measurements cannot be made. This is due to the fact that working
on such a surface for inspection will affect the mechanical properties of the high-
pressure tubing. However, the thickness measurement can be made for equipment with
large diameters, such as reservoirs, towers, etc. On such large equipment, it is
very easy to work on a surface with a diameter of about 25 mm without much effect
on the mechanical properties of the equipment. We are now in the process of im-
proving the circuits of the instruments and the shape of the energy converters, to
broaden the fiel. of application.
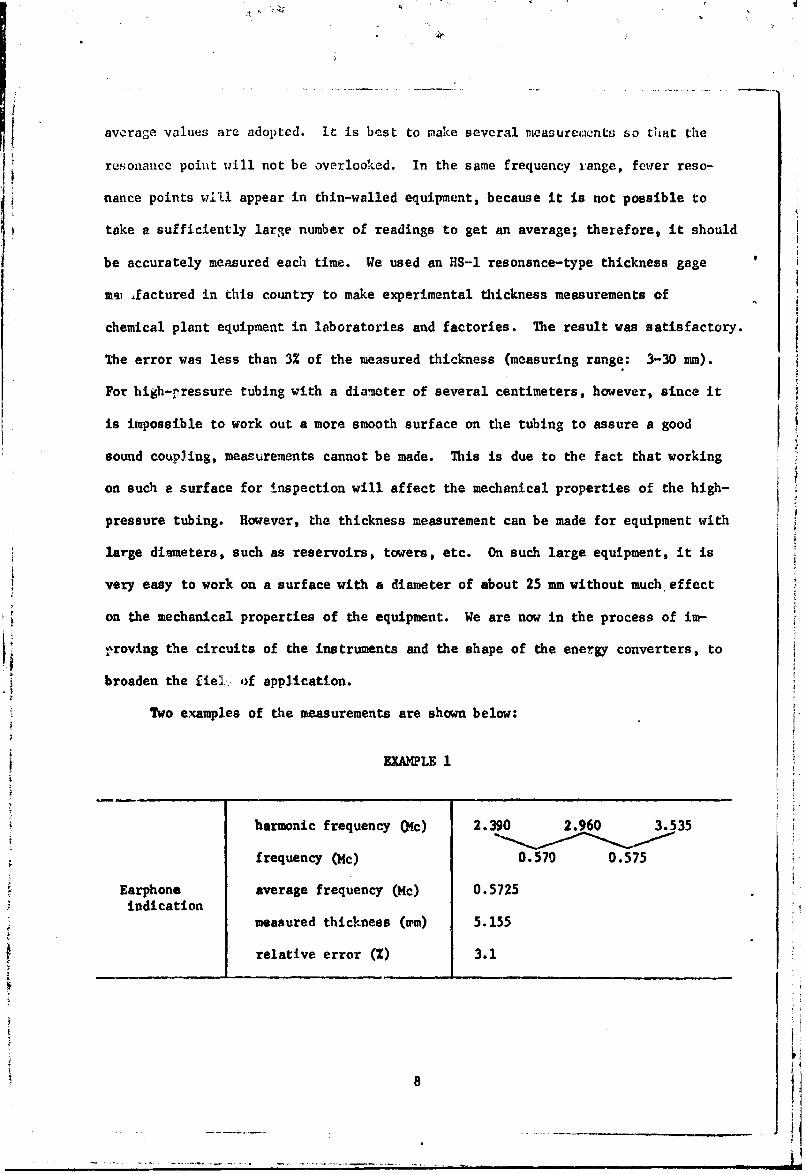
Two examples of the measurements are shown below:
EXAMPLE 1
harmonic frequency (Nc) 2.390 2.960 3.535
frequency (mc) 0.570 0.575
Earphone average frequency (Mc) 0.5725indication
measured thickness (inn) 5.155
relative error (Z) 3.1
8
H,

- tv
EXAMPLE 1 (continued)
harmonic frequency (Mc) 2.390 2.960
frequency (Mc) 0.570 0.575Electric
meter indi- average frequency (Nc) 0.5725cation
measured thickness (mm) 5.155
relative error (Z) 3.1
harmonic frequency (Nc) 2.665 3.260 3.865
frequency (Mc) 0.595 0.605
Oscillograph average frequency (Mc) 0.600indication
measured thickness (mm) 4,915
relative error (%) 1.7
-EMAPLE 2
harmonic frequancy (Mc) 2.645 2.940 3.235 3.530
frequency (Mc) 0.295 0.295 0.295
Earphone average frequency (Mc.) 0.295indication
measured thickness (m) 9.995
relative error (M) 0.5
harmonic frequency (Mc) 2.640 2.935 3.235 3.525
frequency (Mc) 0.295 0.300 0.290Electricueter indi- average frequency (Mc) 0.295cation
measured thickness (mm) 9.995
relative error (%) 0.5
9
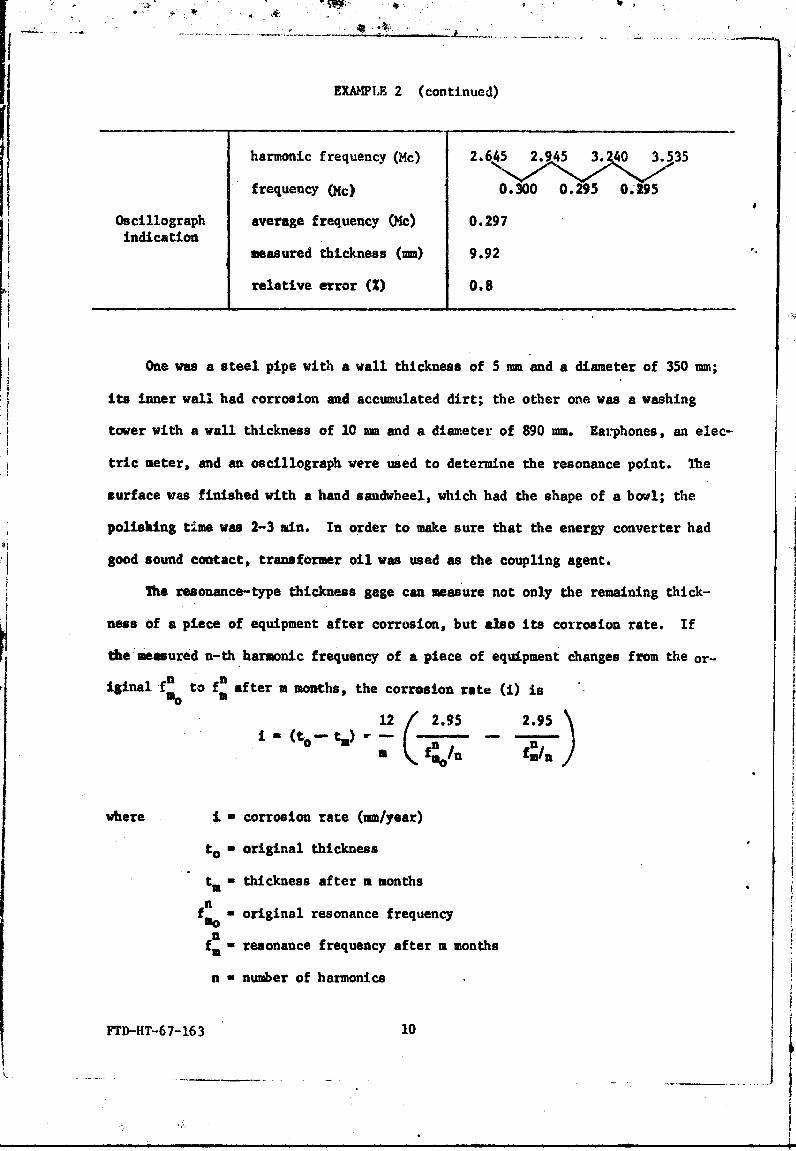
EXAMPLE 2 (continued)
harmonic frequency (Mc) 2.645 2.945 3.240 3.535
frequency (Mc) 0.300 0.295 0.195
Oscillograph average frequency NO) 0.297indication
measured thickness (W) 9.92
relative error (W) 0.8
One was a steel pipe with a wall thickness of 5 mm and a diameter of 350 mm;
its inner wall had corrosion and accumulated dirt; the other one was a washing
tower with a wall thickness of 10 mm and a diameter of 890 mm. Earphones, an elec-
tric meter, and an oscillograph were used to determine the resonance point. The
surface was finished with a hand sandvheel, which had the shape of a bowl; the
polishing time was 2-3 mnm. In order to make sure that the energy converter had
good sound contact, transformer oil was used as the coupling agent.
The resonance-type thickness gage can measure not only the remaining thick-
ness of a piece of equipment after corrosion, but also its corrosion rate. If
the measured n-th harmonic frequency of a piece of equipment changes from the or-
fn niginal f to f after m months, the corrosion rate (i) is
12 / 2.95 2.95M(to .t1) - - -
fuIn f /
where i - corrosion rate (un/year)
to a original thickness
tm - thickness after m months
ffo - original resonance frequency
-fm- resonance frequency after m months
n - number of harmonics
FTD-HT-6 7-163 10
I

k - 2.95, a constant.
n nFor example: m - 16 months; n - 8; fn 1. 75 c; f 1.78 Mc.
12 (2.95 2.95 0-U- - _- ý 0.171 mrn/year.
16 1.75/8 1.-78/ 8)
V. Conclusion
The resonance-type thickness gage has been in mass production abroad. It has
a wide application and has become an important inspection instrument for equip-
ment corrosion in chemical engineering departments and refining departments. In
this country, this technique is also urgently needed by different chemical firms
in order to know the corrosion rate as well as the remaining wall thickness of the
operating equipment. We have not spent much time in doing research in this re-
spect. Thickness measurements have been made on steel materials with a range of
3-30 rm; the largest error is 4.4Z, while most errors are 1-3%. As for thin-walled
pipes with small diameters, we have not yet been able to use ultrasonic resonance-
type thickness gages to make tbe thickness measurements; only the photometric
:•ethod has been used. We are now improving the instrument circuits and the energy
converter of the gage, so that it may have a wider application to meet the needs
of the production departments.
The author wishes to express his thanks to Courade W. Ku for taking part in
this work, and to Engineer C. Y. Tsu for his guidance and revision of the publica-
tion.
FTD-TIT-67-163 11

•: ' ! ? / J . ..- .• . .. • .. - .. •. .
Bi bliography
1. .Zcvod•.•kja Labor'atoryi-t, No. 7, p. 855, 1951; No. 11, p. 1232, 1960; No. 10,
p. 1254, 1963.
2. Corrosion TeohnoZoty, Vol. 3, No. 9, p. 282, 1956.
3. Cor'rosion, Vol. 11, No. 3, p. 109, 1935; Vol. 15, No. 11, p. 361, 1959.
4. O•Z and Gae J., Vol. 59, No. 34, pp. 102-103, 1961.
5. Petroleun Chemisry, Engineer', Vol. 34, Ne. 10, pp. 56-60, 1962.
6. Petr'tewn Refiner, Vol. 39, No. 5, p. 180, 1960.
7. Okahayashi, H. and A. Yamanaka: Eleotronio Engineering, Japen, ,,ol. 6, No. 8,
1957.
S. Ott and Gas J., Vol. 61, No. 9, p. 140, 1963
FTD-IIT-67-163 12