
Foreign Recipients of U.S. Income, 1989 - Internal … under the direction of Chris Carson, Chief....
13
Foreign Recipients of U.S. Income, 1989 By Randy Miller* U.S. source income paid to "foreign persons" rose nearly 73 percent in 1989 to over $55 billion. U.S. tax withheld on this income rose by only 15 percent, to nearly $2 billion. This difference results from the fact that a significant proportion of the increase in total payments was comprised of tax-free interest income. Almost 85 percent of the countries whose recipients received pay- ments of more than $10 million in 1989, experienced increases in such payments from 1988 levels; less than 10 percent of these countries experienced declines from prior year levels. Payments to United Kingdom recipients increased by 181 percent to $13.6 billion, making them the largest recipient group of U.S. source income in 1989. Payments to Japanese recipients, the largest recipient group in 1987 and 1988, rose to $13.1 billion, an increase of 56 percent from 1988. Together these two countries ac- counted for almost half of all income paid to foreign recipients. Payments to foreign persons rose from $5 billion in 1979 to $55 billion in 1989. A number of factors led to increased foreign investment in the United States during the 1980's, contributing to this large increase in total payments to foreign persons. For most of the 1980's, the U.S. economy was in an expansionary phase, providing an attractive and secure place for foreign investment. During the 1980's, the U.S. national savings rate was one of the lowest in the industrialized world, at about 3 percent of national income [1]. This forced domestic entities to search abroad for investment funds. Furthermore, the demand for investment funds by U.S. entities exerted upward pressure on interest rates, making investment in the United States more attractive. Because national sav- ings rates were considerably higher in other countries, these countries were able to respond to the U.S. demand for investment funds. Also, in 1984, the United States removed the withholding tax on most types of portfolio interest, enabling U.S. entities to compete more effec- tively for funds in international financial markets. BACKGROUND U.S. source income of nonresident alien individuals and other foreign entities is taxed at a flat, statutory rate of 30 percent (or a lower treaty rate), unless such income is "effectively connected" with a U.S. trade or business or is exempt from U.S. taxation. The income shown in this article includes, but is not limited to, certain interest, dividends, compensation for personal services, rents and royalties, retirement payments and capital gains. Foreign persons' bank deposit interest is not included in these statistics, nor are amounts remitted to the United States by foreign governments under treaty agreements (see the Data Sources and Limitations section of this article). U.S. individuals or corporations distributing U.S. source income are required to withhold taxes on this income, or to appoint a withholding agent (normally a financial insti- tution) to do so. The payer or designated agent is fully liable for all taxes owed. Without this withholding require- ment there would be no way to enforce taxpayer compli- ance. The payer or withholding agent is required to report the income paid to each foreign recipient on a Form 1 042S, Foreign Persons'Ll. S. Source Income Subject to Withholding, an information return used to report income paid to foreign persons. Because foreign recipients are not required to file U.S. tax returns to report this income, it is not possible to tax them at ordinary graduated rates on their consolidated U.S. source income (as one U.S. payerwould have no knowledge of payments made tothe same recipient by other United States. payers). Gener- ally, the data on Form 1042S returns are shared with foreign countries with which the United States has a tax treaty or some type of exchange of information agree- ment. Although the statutory withholding rate is 30 percent, the effective tax rate is frequently considerably lower for a number of reasons. First, more than 35 reciprocal tax treaties between the United States and its principal trad- *Foreign Returns Analysis Section. Prepared under the direction of Chris Carson, Chief. 25
Transcript of Foreign Recipients of U.S. Income, 1989 - Internal … under the direction of Chris Carson, Chief....
Foreign Recipients of U.S. Income, 1989
By Randy Miller*
U.S. source income paid to "foreign persons" rosenearly 73 percent in 1989 to over $55 billion. U.S. taxwithheld on this income rose by only 15 percent, to nearly$2 billion. This difference results from the fact that asignificant proportion of the increase in total paymentswas comprised of tax-free interest income. Almost 85percent of the countries whose recipients received pay-ments of more than $10 million in 1989, experiencedincreases in such payments from 1988 levels; less than10 percent of these countries experienced declines fromprior year levels.
Payments to United Kingdom recipients increased by181 percent to $13.6 billion, making them the largestrecipient group of U.S. source income in 1989. Paymentsto Japanese recipients, the largest recipient group in1987 and 1988, rose to $13.1 billion, an increase of 56percent from 1988. Together these two countries ac-counted for almost half of all income paid to foreignrecipients.
Payments to foreign persons rose from $5 billion in1979 to $55 billion in 1989. A number of factors led toincreased foreign investment in the United States duringthe 1980's, contributing to this large increase in totalpayments to foreign persons. For most of the 1980's, theU.S. economy was in an expansionary phase, providingan attractive and secure place for foreign investment.During the 1980's, the U.S. national savings rate was oneof the lowest in the industrialized world, at about 3 percentof national income [1]. This forced domestic entities tosearch abroad for investment funds. Furthermore, thedemand for investment funds by U.S. entities exertedupward pressure on interest rates, making investment inthe United States more attractive. Because national sav-ings rates were considerably higher in other countries,these countries were able to respond to the U.S. demandfor investment funds. Also, in 1984, the United Statesremoved the withholding tax on most types of portfoliointerest, enabling U.S. entities to compete more effec-tively for funds in international financial markets.
BACKGROUND
U.S. source income of nonresident alien individualsand other foreign entities is taxed at a flat, statutory rateof 30 percent (or a lower treaty rate), unless such incomeis "effectively connected" with a U.S. trade or business oris exempt from U.S. taxation. The income shown in thisarticle includes, but is not limited to, certain interest,dividends, compensation for personal services, rents androyalties, retirement payments and capital gains. Foreignpersons' bank deposit interest is not included in thesestatistics, nor are amounts remitted to the United Statesby foreign governments under treaty agreements (seethe Data Sources and Limitations section of this article).
U.S. individualsor corporations distributing U.S. sourceincome are required to withhold taxes on this income, orto appoint a withholding agent (normally a financial insti-tution) to do so. The payer or designated agent is fullyliable for all taxes owed. Without this withholding require-ment there would be no way to enforce taxpayer compli-ance. The payer or withholding agent is required to reportthe income paid to each foreign recipient on a Form1 042S, Foreign Persons'Ll. S. Source Income Subject toWithholding, an information return used to report incomepaid to foreign persons. Because foreign recipients arenot required to file U.S. tax returns to report this income,it is not possible to tax them at ordinary graduated rateson their consolidated U.S. source income (as one U.S.payerwould have no knowledge of payments made tothesame recipient by other United States. payers). Gener-ally, the data on Form 1042S returns are shared withforeign countries with which the United States has a taxtreaty or some type of exchange of information agree-ment.
Although the statutory withholding rate is 30 percent,the effective tax rate is frequently considerably lower fora number of reasons. First, more than 35 reciprocal taxtreaties between the United States and its principal trad-
*Foreign Returns Analysis Section. Prepared under the direction of Chris Carson, Chief. 25

26 Foreign Recipients of U.S. Income, 1989
ing partners often'lower the effective withholding rates(see the Tax Treaties section of this article). Second,certain types of payments are exempt from U.S. taxationaltogether, but still must be reported on Forms 1042S. Inmost cases, income paid to foreign government organiza-tions is not taxed, unless such income is deemed to beeffectively connected with a U.S. trade or business.Portfolio interest income is not subject to withholding.Only half of each social security and railroad retirementbenefit payment is subject to the statutory rate of with-holding. Finally, tax is withheld on most income paid toforeign private foundations at only a 4 percent rate.
DATA HIGHLIGHTS
Total payments to foreign persons increased by over$23 billion in 1989. Interest payments comprised 67percent of this increase, accounting for 60 percent of allJoreign persons' U.S. source income in 1989. Dividendsrepresented 22 percent of the increase in payments from1988, but decreased as a percentage of total payments.
Figure-A depicts the percentage of total income aftrib-utable tointerest, dividends, and rents and royalties for
odd years from 1979-1989. During this period interestnearly doubled as a percentage of total income, while thepercentage oftotal income attributable to dividends fell byhalf. Rents and royalties, as a percentage of total income,remained relatively stable.
In 1989, the total number of Forms 1042S fell 2 percentto 1,290,140. This was the first time since 1982 that thenumber of forms filed declined. The average paymentrose to $42,672, up 76 percent from 1988. The averagetax withheld rose 14 percent to $1,523. The principalreason for such a large disparity between the rise inincome and the rise in taxes is that of the $23 billionincrease in total payments, $19 billion (or83 percent) wasexempt from taxation.
Payments to United Kingdom and Japanese recipientscontinued to rise, as. they had throughout the -1980's.'Payments to persons in the Netherlands Antilles (one ofthe most important sources of investment funds for muchof the decade) rose by almost $890 million in 1989, butdecreased as a percentage of total income. Figure Bdisplays the percentage of total income received by thesecountries for odd years between-1 979-1989: More will besaid ab
*out these trends in the Country of Recipient
section of this article.
Figure APercentage of Total Income by Selected Income Type, 1979 - 1989
Percentage
1 20 +
10 +
0n.a.
1979($5.0)
Rents and royalties .6 64 --------_-------- *--------- ---------- ----------------- *--------------------------------- 5,------------ .... * ----------------- 4-------------------- *
1981 1983 i985 1987($9.5) ($11.1). ($17.5) ($22.7) ($55-0)
Tax Year
Total Income In billions of dollars. na. - not available.

Foreign Recipients of U.S. Income, 1989
Figure BPercentage of Total Income Remitted to the United lCingdom, Japan, and the Netherlands Antilles,1979-1989
Percentage
30 -r
0
1979($5.0)
1981($9.5)
($) - Total income In billions of dollam
TAX TREATIES
1983
Tax Year
The United States participates in tax treaties with morethan 35 of its principal trading partners (see Table 1). Themain purpose of these treaties is to avoid internationaldouble taxation. Tax treaties generally involve reciprocalreductions in tax rates (or exemptions in some cases)between the participating countries. Tax treaties typicallycede primary taxing authority to the source country (thecountry in which the income is earned), although thisauthority is frequently limited. The resident country of therecipient is then granted the residual taxing authority [2].
Most countries, including the United States, tax theirresidents on their worldwide income. Residents of suchcountries will typically receive domestic tax credits fortaxes paid to foreign countries. Other countries, includinga number of Latin American countries, tax only thatincome earned within their borders [3]. Generally, per-sons in these countries are granted exemptions fromdomestic taxation for any foreign source income.
Tax treaties reduce the U.S. tax liability for foreignpersons earning U.S. source income. This reduction in
1985 1987($17.5) ($22.7)
1989($55.0)
27
U.S. tax revenue is at least partially offset by the declinein foreign tax credits of U.S. persons receiving incomefrom and paying taxes to treaty countries. These treatiesreduce the foreign tax liability of U.S. persons, thusreducing the foreign tax credits available to such persons.Fewer foreign tax credits increase the revenue intake ofdomestic taxing authorities.
In 1989, persons in treaty countries received 89 percentof total U.S. source income payments to foreign persons,while paying 83 percent of all taxes. Figure C comparesincome, U.S. tax withheld, and effective U.S. tax rates fortreaty and nontreaty country recipients for 1989. Theeffective rate of taxation is the amount of tax withheld asa percentage of total income paid.
Figure C.-Total Income, U.S. Tax Withheld, and EffectiveU.S. Tax Rates for Treaty and Nontreaty Countries, 1989[Money amounts are in millions of dollarsl
Treaty Total U.S. tax Effective U.S.status income withheld tax rate
(2) (3)All countries.......... .... . . ..... $56,047 $1,964 16%
Treaty countries............................. 49,542 1,6341
33*Nontreaty countries........................ 5,505 'AAn 6 0-

28 Foreign Recipients of U.S. Income, 1989
TYPE OF INCOME TYPE OF RECIPIENT
In 1989, interest payments of $33 billion accounted for60 percent of total U.S. source income paid to foreignpersons (up 5 percentage points from the previous year).Such a high percentage of total income attributable tointerest is a result of several factors. First, the DeficitReduction Act of 1984 eliminated the tax withholdingrequirements on most portfolio interest payments, mak-ing interest-bearing portfolio accounts more attractiveinvestments. In addition, many tax treaties reduce oreliminate the withholding on other interest payments toresidents of these countries. Second, relatively high U.S.interest rates for much of the 1980's made U.S. interestbearing securities an attractive investment. As a result,foreign holdings of U.S. Treasury bonds and other bondsincreased to record levels in the late 1980's [4]. -
The stockmarket crash on October 19,1987, mayhavedeterred foreign investors from increasing their equityinvestments [5]. The decrease in the percentage of totalpayments attributable to dividends in 1989 may partiallyreflect-this hesitancy. It should also be noted that foreigninvestors.in some countries simply chose to sell U.S.stocks and purchase stocks in their own domestic stockmarkets [6]. This tended to decrease U.S. dividend pay-ments to foreign persons, thereby increasing the percent-age of income paid in the form of interest.
Dividend income in 1989, at almost $15 billion, was thesecond largest type-of payment to foreign persons. Thesepayments, however, decreased from 40 percent of allpayments in 1988 to,26 percent in 1989. Dividend pay-ments accounted for 67 percent of all taxes withheld(compared to 18 percent for interest payments). Figure Ddetails income and tax information for the different typesof income.
Figure D.-Income and U.S. Tax Withheld, by Type ofIncome, 1989(Money amounts are in millions of dollars]
Income,type
TotalIncome
U.S. taxwithheld
Percentage oftotal taxes
Effective U.S.tax rate
(1) (2) (3) (4)All Income types $55,047 $1,964 100% 3.6%
Interest .......... : ................. 33.267 348 18 1.0Dividends......................... 14,577 1,312 67 9.0Rents and royalties .......... 2,611 106 5 4.1Retirement payments' 893 79 4 8.8Compensation for
personal services M 40 2 4.8Other/unknown ................ 2,863 1 78 4 2.7
I Includes social security and railroad retirement benefits.Note: Detail may not add to totals due to rounding.
Foreign corporations received 75 percent of all U.S.source income paid to foreign persons in 1989, whileaccounting for 69 percent of the U.S. tax withheld. U.S.source income paid to corporations totaled almost $42billion, more than doubling from 1988. Also, 88 percent ofthe increase in total payments from 1988 to 1989 wasaccounted for by corporations. Individuals and fiduciariesand nominees were the next largest groups (receiving$3.8 and $3.5 billion, respectively). Figure E presents thepercentage of total income and U.S. tax withheld by typeof recipient.
Compared with their income, corporations accountedfor a relatively low percentage of total taxes. This wasbecause nearly 70 percent of income distributed to corpo-rations was exempt from taxation. Individuals, on theother hand, accounted for a high percentage of total taxesrelative to their income. This was because individualsreceived almost 40 percent of their income in the form ofdividends and retirement benefits, the two income typestaxed at the highest effective rates.
Foreign government organizations received $1.5 billionin U.S. source income during 1989, and had almost $20million in taxes withheld. In 1988, the tax withheld was$7.3 million on income of $1.1 billion. For 1989, mostincome received by foreign government organizationswas in the form of interest and dividends (over $1 billionand nearly $0.5 billion, respectively). Figu re F shows thecountries whose government organizations received themost income.
The War'Revenue Act of 1917 provided for the taxexemption of certain income paid to foreign governmentorganizations. This exemption was modified throughoutthe years due to the increase in commercial activities byforeign governments. The exemption generally does notapply to such commercial activities or in instances inwhich benefits are remitted to private entities [7]. ~
COUNTRY OF RECIPIENT
.In 1989, eight countries received total payme'nts of
more than $1 billion each. These countries accounted forover 81. percent of total income and almost 74 percent of

Foreign Recipients of U.S. Income, 1989
Figure ETotal Income and U.S. Tax Withheld, by Type of Recipient, 1989
To al Income
Nominees and fiduciaries(60/6)
Total U.S. Tax Withheld I
Governmentorganizations
(1%)
Nominees and fiduciaries(12%)
29

30 Foreign Recipients of U.S. Income, 1989
Figure F.-Countries Whose Government OrganizationsReceived the Most U.S. Source Income, 1989(Money amounts are in thousands of dollars)
CountryTotal Income received
by governmentorganizations
U.S.
taxwithheld
All countries........................................
Kuwait.......................................................United Kingdom..............................
:-*"-'Japan ........................................................United Arab Emirates ................................
Spain .........................................................
Singapore ..................................................
$1,535,004
219,942195,432174.577172,280163,250126,611
$19,832
5439
9,669
123.271
counted for by large dividend payments to foreign per-sons (particularly to U.K. recipients) [8].
Payments to Japanese recipients rose by nearly $4.7billion, to just over $13 billion. As Figure B demonstrates,.Japan's share of total payments rose sharply since thebeginning of the decade. This rise was due to the fact thatin the 1980's Japan became the second largest source ofinvestment funds for U.S. entities. Japan's rate of sav-ings, at 20 percent of national income, has been one ofthehighest in the industrialized world [9]. Japanese banksbecame the world's largest and most powerful around themid-1980's, making them a large source of funds forforeign borrowers [10]. Figure H displays the percentageof income and taxes by income type for Japanese andUnited Kingdom recipients.
total taxes withheld. Figure G presents income and taxinformation on these countries by order of the largestincome totals.
These 8 countries had an aggregate effective tax rateof 3.2 percent. The tax rates among each of thesecountries, however, varied between 1.6 percent and 4.9percent. This variation can best be explained by differ-ences in tax treaty provisions and differences in incometype composition.
.In 1989, United Kingdom residents received more U.S.
source income than persons in any other country. Anumber of factors may explain this. First, during the1980's, the United Kingdom invested more money in theUnited States than did any other country. Purchases ofU.S. Treasury securities by persons in the United King-dom increased by about 200 percent in 1989. Persons inthe United Kingdom made net purchases of nearly $3.5billion in U.S. stocks, offsetting net sales by other Euro-pean countries (such as West Germany and Switzer-land). Foreign direct investment in the United States bythe United Kingdom totaled $119 billion in 1989, farsurpassing every other country. Total reinvested earn-ings in U.S. assets dropped by $6.6 billion to a slightlynegative figure. A great deal of this decrease was ac-
Figure G.--income.and Taxes for the Eight CountriesWhose Residents Received the Most U.S. Source Income),19894[Money amounts are in millions of dollars]
Country Total incomePercentageincrease
-from 1988
U.Stax*
withheld
EffectiveU.S. tax
rate
(2) (3) (4)
Selected countrlo~, total $",log 90% $1,445 3.2%
United Kingdom........... ............. 13,640 181 435 3.2japan .........................................
..13,107 so 436 3.3
..Netherlands.................................. 4.266 77 70 1.6Canada......................................... 4,195 34 141 3.4PWtzedand ................................... 3.134 60
152 4.9
Post Germany ............................. 2.476 71 103 4.2Netherlands Antilles ..................... 2,466 66 52 2.1Trance ......................... 1.914 49 66 2.9
Payments to residents of the Netherlands Antilles in-creased in 1989 for the first time since 1985. In 1989, asin years past, interest accounted forthe bulk of paymentsmade to residents of the Netherlands Antilles. As apercentage of total income, payments to residents of theNetherlands -Antilles decreased in 1989, as they haveevery year since the enactment of the Deficit ReductionAct in 1984. One goal of the Deficit Reduction Act of 1984was to curb the need of U.S. borrowers to acquire fundsindirectly through "tax haven" countries. Prior to this Act,the Netherlands Antilles was one of the most importantsources of investment funds for U.S. borrowers becausethe present portfolio interest exemptions were not yet ineffect. Interest payments to persons in the NetherlandsAntilles were exempt from U.S. taxation under treatyprovisions. Also, the Netherlands Antilles did not imposea withholding tax on interest payments to third-partylenders [11 ].
TAXES WITHHELD
For Tax Year 1989, U.S. tax withheld amounted toalmost $2 billion on income of over $55 billion. Thistranslates to* an effective tax rate of 3.6 percent. Only 3.9percent of total U.S. source income Was subject to the 30percent statutory rate. Sixty-nine percent (or $38 billion)of the $55 billion total was exempt from taxation. Theeffective tax rate for income -subject to - withholding was11.5 percent. Of the $17,, billion of, income subject totaxation, only 12.7 percent was taxed atthe statutory rate.Figure I displays the countr
'ieswith the highest and lowest
effective tax rates for 1989 (for countries with total U.S.source income greater than $10 million).

Foreign Recipients of U.S. Income, 1989
Figure HTotal Income and U.S. Tax Withheld, by Income Type for United Kingdom and JapaneseRecipients, 1989
United KingdomI
Income
Rents and royalties(4%)
Other or unknown(4%)
Income
RentsOther or unknown and
(8%) royalties(13%
Tax withheld
Dividends(96%)
$0.4 Billion Qiwomgmm
Tax withheld
Other or unknown(50/6)
31
32 Foreign Recipients of U.S.- Income, 1989
Figure I.-Countries with the Highest and Lowest EffectiveTax Rates, 19891
Country
Algeria ................................................... :.............................Guernsey............................................................................
Liberia............ ..........* *Yugoslavia..........................................................................
Lebanon.... ........................................................................Liechtenstein......................................................................
Greece ................................................................................Philippines ..............................................
--- *** ***Monaco................................................................................South Africa.......................................... ....................
United Arab Emirates .........................................................
.............................Finland.................................................................................
Nigeria ................Jordan ....
..........*..........KuwaitPakistan
............China..................
BahrainTaiwan ................ ...............................................................
For countries with total payments of $10 million or more.Less than 0.05 percent.
Effective U.S.,tax rateHighest
29.7%
18.1
16.9
14.414.213.212.612.612.211.4
1_7waat(2)
0.6%0.60.70.8
-,0.91.0
.1.21.51.5
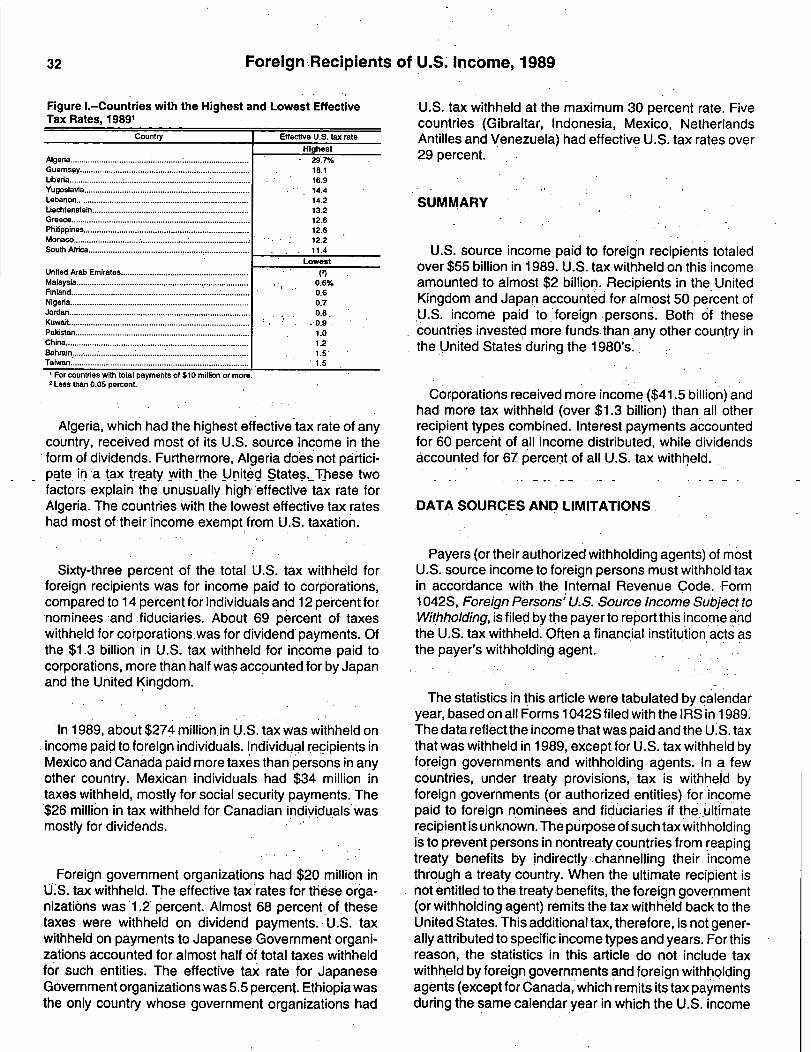
Algeria, which had the highest effective tax rate of anycountry, received most of its U.S. source income in theform of dividends. Furthermore, Algeria does not partickpate in a tax t
-reaty with
-the United States. These two
factors explain the unusually high'effective tax rate forAlgeria. The countries with the lowest effective tax rateshad most of1heir income exempt from U.S. taxation.
Sixty-three percent of the total U.S. tax withheld forforeign recipients was for income paid to corporations,compared to 14 percent for individuals and 12 percent fornominees -and fiduciaries. About 69 percent of taxeswithheld for corporations.was for dividend'payments. Ofthe $1.3 billion in U.S. tax withheld for income paid tocorporations, more than half was accounted for by Japanand the United Kingdom.
In 1989, about $274 million, in U.S. tax was withheld onincome paid to foreign individuals. Individual recipients inMexico and Canada paid more taxes than persons in anyother country. Mexican individuals had $34 million intaxes wit
'hheld, mostly for social security payments. The
'$26 million in tax withheld for Canadian i1ndivilduals'wasmostly for dividends.
Foreign government organizations had $20 million inU.'S. tax withheld. The effective tax rates for these orb'a-nizati6ns was 1.2 percent. Almost 68 percent of thesetaxes were withheld on dividend payments. U.S. taxwithheld on payments to Japanese Government organi-zations accounted for almost half of total taxes withheldfor such entities. The effective tax rate for JapaneseGovernment organizations was 5.5 percent. Ethiopia wasthe only country whose government organizations had
U.S. tax withheld at the maximum 30 percent rate. Fivecountries (Gibraltar, Indonesia, Mexico, NetherlandsAntilles and Venezuela) had effective U.S. tax rates over29 percent.
SUMMARY
U.S. source income paid to foreign recipients totaledover $55 billion in 1989. U.S. tax withheld on this incomeamounted.to almost $2 billion. Recipients in the UnitedKingdom and Japan accounted for almost 50 percent of.U.S. income paid to foreign persons. Both of thesecountries invested more funds.than.any other country inthe United States during the 1980's...
Corporations received more income ($41.5 billion) andhad more tax withheld (over $1.3 billion) than all otherrecipient types combined. Interest payments accountedfor 60 percent of all income distributed, while dividendsAccounted for 67 percent of all U.S. tax withheld.
DATA SOURCES AND LIMITATIONS
Payers (or their authorized withholding agents) of mostU.S. source income to foreign persons must withhold taxin accordance with.the Internal Revenue Code. Form1042S, Foreign Persons' U.S. Source Income!Subject toWithholding, is filed by the payerto report this income andthe U.S. tax withheld. Often a financial. institution acts asthe payer's withholding agent.
The statistics in this article were tabulated by calendaryear, based on all Forms 1042S filed with the IRS in 1989.The data reflectt.he incomethat was paid and the U.S. taxthat was withheld in 1989, except for U.S. tax withheld byforeign governments and withholding agents. In a fewcountries, under treaty provisions, tax is withheld byforeign governments (or authorized entities) forincomepaid to foreign nominees and fiduciaries if the,.ultimaterecipient is unknown. The purpose ofsuch tax withholdingis to prevent persons in nontreaty countries from reapingtreaty benefits by indirectly. channelling their incomethrough a treaty country. When the ultimate recipient isnot entitled to the treaty benefits, the foreign government(or withholding agent) remits the tax withheld back to theUnited States. This additional tax, therefore, is not gener-ally attributed to specific income types and years. For thisreason, the statistics in this article do not include taxwithheld by foreign governments and foreign withholdingagents (except for Canada, which remits its tax paymentsduring the same calendar year in which the U.S. income

Foreign Recipients of U.S. Income, 1989
is paid). These amounts, however, are shown in Column7 of Table 1.
Income that is "effectively connected" with a foreignperson's U.S. trade or business is not subject to withhold-ing tax, and is therefore generally not included in thesestatistics. This category of income was subject to thesame graduated tax rates and methods of payment as theincome of U.S. individuals and corporations.
Because all Forms 1042S are included in the statistics,the data are not subject to sampling error. However, thedata are subject to nonsampling error, such as computerdata entry errors and minor taxpayer reporting errors. Alimited computerized program was used to test the datafor certain basic numerical relationships, including thecalculation of the correct tax withheld. In addition, Forms1042S with income greater than $2 million were manuallyverified.
EXPLANATION OF SELECTED TERMS
Effective Tax Rate.-For purposes of this article, theeffective tax rate is total U.S. taxes divided by totalincome.
Foreign Persons.-For purposes of this article, foreignpersons include (a) individuals whose residence is notwithin the United States and who are not U.S. citizens;and (b) corporations and other organizations (partner-ships, private foundations, estates, trusts and other enti-ties) created or organized outside the United States. Forpurposes of this article, persons residing in Puerto Ricoand U.S. possessions are also considered foreign per-sons.
Income Effectively Connected With a U.S. Trade orBusiness.-Income that is "effectively connected" with aU.S. trade or business is exempt from withholding taxrequirements. This income is taxed in the same manneras income paid to U.S. citizens and residents. Foreigncorporations (individuals) must report such income on aForm 11 20F (1 040NR). This income is taxed at ordinarygraduated U.S. rates. Effectively connected income maybe erroneously reported on Forms 1042S, but the extentof its inclusion in the statistics is believed to be insignifi-cant although unknown.
NomineeandFiduciary.-An entitychosen orappointedto accept income for the eventual recipient of the income.
33
Typically, a financial institution acts as a nominee orfiduciary.
Tax Haven.-Countries having tax and secrecy lawsfavorable to foreign persons are generally considered tobe tax havens.
WithholdingAgent-A withholding agent is any personor entity required to withhold taxes. Usually the withhold-ing agent is the payer of the income or an entity (normallya financial institution) acting on behalf of the payer.
NOTES AND REFERENCES
Ill "Whatever happened to saving?," The Economist,February 3-9, 1990, p. 13.
[2] Doemberg, Richard L., International Taxation, WestPublishing Company, 1988, p. 81.
[31 Hannes, Steven, World Trade Institute Seminar.,Introduction to International Taxation, Washington,D.C., December 3,1991.
[4] Scholl, Russell B., "The Investment Position of theUnited States in 1988," SurveyofCurrentBusiness,U.S. Department of Commerce, Bureau of Eco-nomic Analysis, June 1990, p. 58.
[5] Bradford, John J., "Foreign Recipients of U.S. In-come, 1988," Statistics of Income Bulletin, Winter1990-1991, Volume 10, Number 3.
[6] Scholl, op. cit., p. 59.
[7] Dick, Ryan, and Jarchow, 913 Tax ManagementPortfolio, U.S. Income Taxation of Foreign Govern-ments, International Organizations and Their Em-ployees, Tax Management Inc., Bureau of National.Affairs, 1990.
[8] Scholl, op. cit., pp. 58-64. All statistics in thisI paragraph come from this source.
191 "Whatever happened to saving?," op. cit., p. 13.
[10] Daniels, John and Radebaugh, Lee, InternationalBusiness, Addison-Wesley Publishers Company,1989, pp. 312-314.
[11 ] Lewis, Margaret P., "Foreign Recipients of U.S.Income, 1985," Statistics of Income Bulletin, Fall1987, Volume 7, Number 2.

34 Foreign Recipients of U.S. Income, 1989
Table 1.-Forms 1042S: Number of Returns, Total Income Paid, Tax Withhold, by Selected Treaty and Nontreaty Countries[money amounts are in thousands of dollars) I
II I I
Income paid U.S. tax withheld
By foreignCountry or Number of Exempt Subject By domestic governmen
geographic area Forms 1042S Total from to Total withholding andwithholding withholding agents withholding
agents
(1) (2) (3)- (4) (7)Total ........................................................... 1,290,140 55,047,138 38,028,862 17,018,276 2,105,738 1,964,374 141,364
Treaty countries, total ...................................... 944,754 49,642,478 34,028,370 15,514,611 1,T76,293 1,634,929 141,364.Au tralia.........................................................
:22,824 528.213 286.364 241,849 34.702 34.702 -
Au tfia ............................................................ 6.096 199.581 173.187 26.394 4,263 4,159 104Barbados...............................7 ................ * 933 59.182 46,384 13.429 2.109 2,109 -Belgium.......................................................... 11,574 874,182 712.692 161.489 27.313 22.579 4,734Canada .......................................................... 252,272 4.195.804 3.072.577 1,123.227 -140,837 140.837China .............................................................. 11.469 116.230 108,156 8.075 1.388 1.388Cyprus ............................................................ 1.040 9,446 7.636 1.810 208 208 -Denmark ........................................................ 3.365 294,078 254.037 40,041 6.003 6.000 3Egypt.............................................................. 1,627 6,251 4,156 2.095 346 346 -Finland........................................................... 1.456 199,130 185,060 14.070 1.226 1.226 -France............................................................ 22,990 1,913,535 1.318.075 S95.460 56,693 56.380 313Greece ........................................................... 16,344 50,074 12,728 37.346 6.307 6.307Hungary ; ................................................ 630 8,297 7.508 789 134
.134
Iceland ........................................................... 157 612 287 325 63 63Ireland ............................................................ 10,809 91,762 57.613 34.149 4,344 4.344Italy................................................................ 35.628 616.161 481.455 134,706 18.194 18.194Jamaica.......................................................... 2,261 9.783 2.801 6,982 1,043 1.043Japan............................................................. 34.474 13.107,452 9.141,120 3,966.332 436,365 436.365Luxembourg ................................................... 4.508 492.706 324.114 168,593 46,731 43,180 3,551Malta .............................................................. 681 2,027 1.831 196 39 39Morocco ......................................................... 901 A,624 3,513 1,111 257 257 -Netherlands Antilles....................................... 4.428 2.466.40 2,276,377 190.031 63.004 52.142 862Netherlands ................................................. 7, 13,243 4,266,348 3.630.426 635,921 71,521 70,326 1,195NowZealand .................................................. 5,848 49,315 33,099 16,216 1.919 1,919Norway........................................................... 7.086 141.601 119,897 21.704 3,460 3.460Pakistan......................................................... 2.985 21,432 20,379 1.053 221 221
-Philippines- ........ ................................... 27.719 95,276- 20.766- 74,510 11,972- 11,972-Poland............................................................ 3,033 16.110 4.992 11.118 1,636 1,636Romania......................................................... 116 3.227 265 2,973 335 335South Korea................................................... 3,064 79,619 64.506 15.113 1,980 1.980Sweden .......................................................... 7,823 359,132 96.563 262,669 20,237 20.237Switzerland ..................................................... 35.161 3,134.320 1.560,416 1.573.904 279,530 152.065 127.465Trinidad and Tobago...................................... 1.299 3.897 '11.1011 2.797 4112 462 -United Kingdom............................................. 296,170 13.639,871 8,194.855 5,445.016 438.516 435,379 3,137USSR ............................................................. 1.036 10,645 9,194 1,451 355 355 -West Germany............................................... 93.547 2,475,516 1,794,250 681.667 102.560 102.660 -
Nontreaty countries, total................................ 34S,386 6,1504,660 4,000,492 1,503,765 329,"S 329,445 -Argentina........................................................ 10,097 37,658 24.666 12,993 2.989 2.989 -Bahamas ........................................................ 5.070 241.343r' 174.275 67,068 19.826 19,826Bermuda ........................................................ 2.975 264,935 170.800 94,135 28.088 28,088 -Brazil .......................................................... ... 6,305 29,965 17.133 12.833 3.145 3.145 -British Virgin Islands ....................................... 2,531 155,698 114,603 41,095 11,790 11.790 -Cayman Islands ............................................. 3,895 386.372 322.131 64,240 19.079 19,079 -Hong Kong ..................................................... 17,488 313,410 207,259 106.151 28.532 28.532Israel.............................................................. 7,669 43,723 28,335 15,388 3.610 3,610Jersey............................................................. 765 81,914 46.745 35,169 9.304 9,304Kuwait............................................................ 1.948 403.886 329.904 11,982 3,575 3.575Liberia............................................................ 1,124 63,654 27,457 36.197 10.821 10,821Liechtenstein .................................................. 2.432 48~320 26.711 21,609 6.394 6,394Mexico.......................... ; ................................. 89,520 338.144 116,865 221,278 39,860 39,860Panama.......................................................... 8,930 300,040 212,664 87.376 25.368 25,368Portugal.......................................................... 7,673 38.697 15.193 23,774 3.912 3.912Puerto Rico .................................................... 3.958 15,223 13.031 2,191 562 562Saudi Arabia ................................................... 5,107 125,646 107,753 17.893 5,277 5.277Singapore ....................................................... 7,177 228,091 206.171 21,920 6,198 6,198South Africa .................................... 1............... 6,477 31.214 17.683 13,531 3.551 3.551Spain .............................................................. 11,061 424.998 385,737 39,261 9,127 9.127Taiwan ........................................................... 7,387 187,317 174,968 12.349 2,896 2.896United Arab Emirates..................................... 909 316.177 315,270 908 270 270Venezuela...................................................... 10.617 37.159 25.295 11,864 3.291 3.291Other nontreaty countries............................... 124.271 1 1.391,076 1 919,843 471.233 1 81,980 1 81,980 1Note: Detail may not add to totals because of rounding.

Mm
mm
ma
Cl
00
00
0ca
03
>>
2a
20
:gan
dp
al
E?
K!
Kkp
Kj
al
5ng
Is0
5j
jlf
-i
iat:
5--
if
1-H
0w
Rgj
RR.
ja1
ii
r
ii
0
.....msi-&8~80.2;~
NNS.
wCD
so.
SM
P:4
."
CDw
mt2
O021d
WN
gm
m;S
E,
01
-4n
2ow
Iwo
28
-4-4
MC'
D0
00
0w
. 0
..
..
..
00,
~0
04~
010
wow
ow
w
NN
0(0
ow0
wF
a2
v
CAP
..
..
..
..
..
..
..
..
z-4
Wj4,
~40
-4!!
14W
-40
Wm
gO
WN
9
'N
"id
-M
&~
40
tO
W§
-~
;-
P-N
oP
!Q.
..
..
..
..
.
rak
8-
So-,t
8g
0~4
Q~
);s
..
.Ow
nt~
tO
ws
D-M
A-0,C
).
'MU
-42@
-C
~n@
mm
gow
ow
c~
)w
tN
o00N
-0
0)
W
Nw
-w
04
41
.I
..
..
..
..
..
..
..
.!
:4W
:
FD0,
80
":74
2...
M10
-A
8=
Wo
0-
W0
WZ
TW
SW
-NW
w"
8C~J
j84
cw,n20
m=(~n!
C.0
'T:0-,
-3%
2N
-00
0S
80
MR
0m
0-
0'A
WM
.m
oo
mw
wo
om
m0`4
a"
II
MR
.2
mw
w"
N
ww
'J'J
wo
ww
ww
00
Ow
~~
II
NM
I~1
~4:
MM
II
..
TDF.
1.1
~-4Z
J00
0T
TI
108
~04W
Wg
R::4
4"o
"m00
00
12T
TI
5n3D
"M
88w
ow
N...
a,"N
cg
s""
44~
m4m
.a
tgJ:
1i~
No
"I0
-m-w
o-.
4,40
-4,w
4,w
W2,
0~
,".M
ww
w1"""g
1"":N
I"P
ON
'ON
,m
mO
N0
mW
,;W
"o
~0
WN
-~4m
,iN
oJ~
1N
wo
o
gg
'acr
CL C-)n
a0
0
e0
0 U) z r.r CD 0 x :r :r CD PL 1w CL
0 3 (D CL
C7
li 0 3 (D v (D cr
l< Ch
!L CD 0 (D CL

pq
...
?Jel
0-4
Lo
u(n
M3z
mmo9",M=-"Z
TWOO
own
to
-A
8"
.
PO0
zi
10T
0Im
9
PQ-4
CDt'
Ck
P2,g
kg
..
.'6
4-
V,-
-ii
E-
OW
48
8
U)
wM
gj
WC.
80
0-
08
ibW
W.
W"W
041
1,0
CAw
-4
~0)0(nM
~4o
nT
&
0~4
WW
~92"R
^ts
Z38 _TW:~g
M~-4-4~4%
4T
-TNW~
W~m
@00200-w
TWO-W
4OW(A00NO
M~4&
MN1
P.S
WM
IDM
440,
WtJ
WO
Mtg
=0
MIS
Tg
T61,2"
MO
LOn"
EtO
~j(
"DT
WoT*
-"'"
SC
J~4
wso
*4'N
To
ER0
8CR
~g~Mj
"4W
..
..
..
..
..
"...
2&
.g
8t'"
A04
T~
4-484=
80
ZV
04tM
S-1coo"=
80
~g("D
e?n
-4(a
WW
~W
O,W
~O
at3
8~
8,
RFS
"0
WWt
AW
4a
!4ca
P4
91
P4p
tn.
T41
~4~4
~4-4
N)
00
TT
;(~oI
C,3)"W
r~a881
11
1O
R
F-
g
0-4(A
jN:'
CD
"M
w~
~W
8~g
gji
~T,
8N
EV8
totn
?Q-
ED
.44
20!('&A'
WC"'n
C-)
C&AO
TO
TL,
8W
?n(00
&tn
N&
wpo
co4.
tn
9 x

r-CV)
xc
0L)
Ez6icc
CY0
E801
U.1.10C4
ccl4)
C4~MHID'
a,C94
!V20A
C40CO%L
VW
Ct
P.
.-7
VN
!Rts
188
(DoN
Nm
NQ
)Q
)cr
cr
lea
ao
la,
4-4
mN
wX
N!4
wN
Dicl
cco6
"wn
!2cy
Ar,
v
mm
Ln
mw
rP(co,
243&
2p
RN
99
Nt%
vW
(bclj9
mQ
)w
o.
..
..
..
r,
f8v.
Nvi
0N
nP
2N
Mv
c.)c%l
Ok
vcl
(-7
qu
)o
-(
lk
t.
R-,
--
--
--
--
-w
Nm,M
wc4
(1)N
NI
NwN
'mmv-)
(4a
tR
PR
6v
;z8
iz8
E8
~eu
)W
14to
cyc,
.N
--osw
ciR
cl
cl
43iR.
..
..
..
..
..
..
..
.c;~6
dPZ
ag,~:
d'i
cidg
vg
cli(Yge
fg
dd
wA
vcb
mclj
9,Q)
c6cr
cli
32D;
qN
qcNL
vL
.L
..
t%c~t
..
..
..
..
.
cy-c
y-
c9cljg
osN
NR
VV
c'Ivi
16clid
-,m
,clj
Lnq
akrIt
RR
.~L
;W-~
-RE
w=I
am
w6666
Nw
mN
NN
mm
WO
No
ow
cl)cy
~m
No
AV
VN
oN
wN
Ncy
mN
tom
CY
A
4i6
iof
a
ocLIE


![Malaysia's Foreign Policy under Najib · 2. Chamil Wariya, Dasar Luar Era Mahathir [Foreign policy era of Mahathir] (Shah Alam, Malaysia: Fajar Bakti, 1989). 3. Khadijah Md. Khalid,](https://static.fdocuments.in/doc/165x107/5ebf0147cff109730361e0a0/malaysias-foreign-policy-under-najib-2-chamil-wariya-dasar-luar-era-mahathir.jpg)


