FOREIGN OWNERSHIP AND FIRM PERFORMANCE: A … · A thesis submitted in partial fulfillment of the...
56
FOREIGN OWNERSHIP AND FIRM PERFORMANCE: A CLOSER LOOK AT OFFSHORE-OWNED COMPANIES IN UKRAINE by Olga Bilyk A thesis submitted in partial fulfillment of the requirements for the degree of MA in Economics Kyiv School of Economics 2009 Approved by ___________________________________________________ Tom Coupé, KSE Program Director Date
Transcript of FOREIGN OWNERSHIP AND FIRM PERFORMANCE: A … · A thesis submitted in partial fulfillment of the...

FOREIGN OWNERSHIP AND FIRM PERFORMANCE: A CLOSER LOOK
AT OFFSHORE-OWNED COMPANIES IN UKRAINE
by
Olga Bilyk
A thesis submitted in partial fulfillment of the requirements for the degree of
MA in Economics
Kyiv School of Economics
2009
Approved by ___________________________________________________ Tom Coupé, KSE Program Director
Date

Kyiv School of Economics
Abstract
FOREIGN OWNERSHIP AND FIRM PERFORMANCE: A CLOSER
LOOK AT OFFSHORE-OWNED COMPANIES IN UKRAINE
by Olga Bilyk
KSE Program Director Tom Coupé
This study investigates the effects of foreign ownership on performance of
Ukrainian manufacturing companies in 2002 – 2006. It addresses two important
issues, namely the distinguishing between different types of foreign owners and
reverse causality between ownership and performance. The empirical results
confirm the hypothesis that in studying the ownership-performance relationship
a closer look at foreign offshore and foreign non-offshore owners is crucial.
The positive effect of investment coming from the group of developed
countries, USA and Cyprus is found, while capital from transition economies is
negatively related to profitability. These results are discussed in the context of
on-going debates on international tax cooperation standards and informational
transparency of ownership structures. Besides ownership variables, two firm-
specific characteristics, leverage and firm size, are important determinants of
profitability. The results of the study suggest in favor of taking into account the
international standards when policy concerning offshore and “pseudo-offshore”
structures is adopted.

ii
TABLE OF CONTENTS
Acknowledgments……………………………………………………………..iii Glossary……………………………………………………………………….iv Chapter 1. Introduction………………………………………………………...1 Chapter 2. Literature Review………………………………………………...…5 Chapter 3. Methodology……………………………………………………....12 3.1 Performance measures……………………………………………12 3.2 Ownership variables……………………………………………....14 3.3 Model specification……………………………………………….17 Chapter 4. Data and sample description…………………………………….....23 Chapter 5. Empirical results……………………………………………...……30 5.1 Fixed effects and IV/GMM estimation…………………………...30 5.2 Effects of ownership: looking for possible explanations in the actual data………………..…………………............................37 Chapter 6. Conclusions……………………………………………………….41 Bibliography…………………………………………………………………..44 Appendices

iii
ACKNOWLEDGMENTS
The author wishes to thank her thesis advisor, Prof. Oleksandr Talavera, for his
helpful criticism and sound guidance in conducting the research. The valuable
comments and suggestions of Research Workshop Professors are greatly
appreciated. I express special gratitude to Prof. Tom Coupé for his understanding
and timely feedback.
I am grateful to my flatmates and classmates for sharing inspirational ideas and
spending two years of studying effectively and pleasantly. My family’s support
and unconditional love are invaluable.

iv
GLOSSARY
Foreign ownership. Complete or majority ownership/control of a business in a country by companies whose headquarters are not in that country.
Offshore ownership. Complete or majority ownership/control of a business in a country by companies whose headquarters are based in places where the tax system is more advantageous than that of the home country.
C h a p t e r 1
INTRODUCTION
One of the gains of the transition process in Ukraine is the possibility to attract
foreign capital as far as the domestic economy has become more open. Among
different sources of financing, foreign direct investment (FDI) plays a major role
in transition economies. FDI is defined by national legislation as the acquisition
of corporate rights of domestic company which allows a foreign investor to exert
control over company’s management and assets1. Therefore, the possession of
control rights creates the grounds for the investor’s lasting interest in the host
country. Recent economic literature documents the benefits of FDI in terms of
bringing new technologies and managerial techniques, increase in productivity
and competition of the domestic industry (e.g., Javorcik, 2004). However, FDI
per se cannot be considered as a remedy for problems in transition economies,
rather vice versa: the effectiveness of foreign ownership heavily depends on the
development of country’s legal framework and the institutional environment (e.g.,
Svejnar, 2002). In practice, the evidence on the positive effect of foreign
investments on the domestic economy is not conclusive.
One of the reasons why the effectiveness of foreign ownership in transition
economy might raise a doubt is the structure of foreign investment in terms of
country of origin. Recent statistical information provided by the State Statistics
Committee of Ukraine2 documents the prevalence of offshore investment in the
structure of FDI. In particular, Cyprus made the largest volume of direct
1 The decree of the National Bank of Ukraine “On the regulation of foreign investment
in Ukraine”, 2005
2 The Internet address is http://ukrstat.gov.ua.

2
investment as of 01.04.2009. Another offshore zone, Virgin British Islands, is
among the top-10 foreign direct investors. The share of these two countries as
the ratio to total cumulative FDI amounts to 25% (see Appendix A). The
problem with offshore ownership is that it results in extremely low ownership
structure transparency; therefore offshore firms are widely used for money-
laundering purposes3. The capital inflows from offshore zones in form of FDI
might be simply the transfer of domestic capital to its owners and have nothing
to do with the improvement of production and managerial techniques.
The question of the relationship between ownership and performance has both
research and policy importance. Firstly, there is not much literature devoted to
the origin of foreign capital in Ukraine as well as in other countries. However,
there are papers on different aspects of corporate governance, including the link
between different types of ownership and performance (e.g., Akimova and
Schowödiauer, 2004, Zheka, 2005). This research can contribute to the existing
body of literature since it explicitly takes into account the source country of
foreign capital in investigating the link between ownership and firm performance.
Secondly, the study may have implications for regulation of offshore investment
which is relevant from the policy perspective. By this time, legal regulation of
offshore zones is limited mainly to passing the list of countries and regions that
are officially recognized as offshore.4 This list is called a “black” since financial
transactions carried out with the assistance of countries listed in it are subject to
tough financial control. At the same time, the Ukrainian legislation does not even
provide a strict definition of offshore zones which creates the ground for
3 State Committee on Financial Monitoring argues that offshore firms are among the
most popular means to hide profits. Their contribution to “money-laundering” was estimated at UAH 32 billion in 2006 (the internet address is http://www.pravda.com.ua/news/2006/11/27/51373.htm)
4 The official list of offshore zones is ratified by the governmental decree, the link to the document is http://zakon1.rada.gov.ua/cgi-bin/laws/main.cgi?nreg=77-2003-%F0
3
ambiguous interpretation of the law. For instance, the main changes in “black”
list during the last years consisted in the inclusion/exclusion of Cyprus, and this
decision was greatly impacted by political discretion of every newly formed
government. Cyprus was “labelled” in 2005, and excluded from the list in 2006.
However, the revision of government policies should be brought about by the
evidence on the effect of a particular source of investment on economic
performance rather than by political discretion.
This research aims to determine the relationship between foreign ownership and
firm performance taking into account the source country of capital. The analysis
is conducted using financial and ownership data on open joint stock companies
that operated in Ukraine in 2002 – 2006. The data on owners affords to study the
effects of various sources of foreign capital on firm performance by including
ownership shares of different types of investors into the model. In addition, firm-
specific and industry specific characteristics are taken into account. In studying
the link between ownership and performance the problem of reverse causality
between ownership and performance is addressed. Past (pre-privatization)
financial ratios are considered to be relevant instruments for the endogenous
ownership.
The results suggest the absence of the clear ownership-performance link when
the benchmark fixed-effect model is estimated. In contrast, IV/GMM technique
provides the evidence on the relationship between ownership and performance.
In particular, investors of both types, offshore and non-offshore are positively
associated with firm profitability, but this effect comes mainly from the group of
developed countries, USA, and Cyprus. Other types of ownership are found to
have no impact on firm performance, with exception of “transition” type
exhibiting negative effect on ROA. Among the control variables, leverage and
firm size are important determinants of firm performance.

4
The rest of the paper is organized as follows. Chapter 2 reviews theoretical
background and empirical evidence on the issue. Chapter 3 discusses research
methodology, Chapter 4 describes the data needed for the analysis. The results of
the estimation are presented in Chapter 5, and Chapter 6 concludes.
5
C h a p t e r 2
LITERATURE REVIEW
There is an extensive body of literature devoted to investigating the link between
ownership and firm performance. It is reasonable to present the existing evidence
on the particular issues which are relevant to this study. Firstly, the findings on
the effects of foreign ownership on firm performance are discussed. Secondly,
the importance of the distinction between different types of foreign owners is
considered. Thirdly, the issue of reverse causality between ownership and
performance is addressed with the reference to the history of privatization
process in Ukraine.
Foreign vs. domestic ownership is one of the most debated issues in the literature
focused on the effects of different types of owners on corporate performance.
The empirical evidence in developed countries does not document drastic
differences in performance of domestically-owned and foreign-owned firms. For
instance, Barbosa and Louri (2003) find out no evidence that multinational
corporations perform better than domestic firms in Portugal and Greece in terms
of return on assets as a performance measure. Similarly, Pfaffermayr and Bellak
(2000) state that the performance gaps (in terms of labor productivity, investment
propensity, and profitability) among the domestically-owned and foreign-owned
firms in Austria are not explained by the foreign ownership per se. They argue
that gaps concerning the investment propensity and growth are mainly explained
by firm characteristics rather than ownership. In addition, the positive spillovers
are found for the firms participating in a foreign MNE’s network. Similarly, the
effect of the foreign firms’ presence on the domestic economy is investigated by
Reganati and Sica (2005). The authors suggest the absence of “horizontal

6
spillovers” (at the intra-industry level) and the presence of “vertical spillovers” (at
the inter-industry level) in manufacturing sector: foreign firms act as a driving-
force to their domestic producers. However, the majority of the studies in
developed economies do not distinguish between different sources of foreign
investment. One of the studies that do take into analysis the origin of foreign
capital is the paper by Ford et al. (2008) for the case of developed economy, US.
They provide evidence that the source country contributes to the differences in
output per worker of domestic and foreign firms. Namely, growth is dependent
upon how closely related are the source countries’ and host economy’s
endowments.
One of the reasons why the origin of capital is not taken into consideration in
developed countries is that developed economies have not experienced crucial
transformation of ownership, in contrast to transition countries. The emergence
of transition types of owners, such as “pyramid” ownership, “crony” firms, and
firms with headquarters in offshore zones is a particular feature of transition
economies. There are problems with distinguishing between different types of
owners and determination of the ultimate owners, mainly because of low
transparency of companies’ ownership structures. Consequently, many studies do
not manage to separate the effects of foreign non-offshore ownership and
foreign offshore ownership. For instance, Yudaeva et al. (2003) argue that foreign
firms in Russia are more productive than domestic ones in terms of value added.
Moreover, the authors find the presence of positive spillovers from foreign-
owned firms to domestic firms in the same industry (intra-industry spillovers) and
negative vertical spillovers (inter-industry spillovers). There is no discussion of
offshore ownership in the paper despite the fact that in many Russian enterprises
the core company is surrounded by offshore firms (Sprenger, 2002). The recent
study of Aydin et al. (2007) provides similar evidence on the effect of foreign

7
ownership: foreign firms operating in Turkey are found to perform better than
domestic ones in respect to return on assets.
In general, as it is reported in the survey of Djankov and Murrell (2002), the
majority of studies on the ownership-performance relationship in transition
economies do suggest that foreign ownership is effective from the point of view
of enterprise restructuring and improving productivity. However, taking into
account the distinction between foreign offshore and foreign non-offshore firms,
differences in their effects on firm performance are revealed. For instance, case of
Bulgaria is presented by Mueller et al. (2003) who find a negative but statistically
insignificant effect of offshore ownership on firm performance measured by
ROA. Nenovsky et al. (2003) find out that offshore-owned firms with dubious
origin of capital have higher bank crediting.
Ukraine, similarly to other East European countries, has experienced dramatic
changes of ownership structures. The so-called “mass” privatization was
completed in 1998; therefore the effectiveness of new types of owners can be
measured by looking at their effect on firm performance, and the research
interest to this issue has risen (e.g., Grygorenko and Lutz, 2004, Zheka, 2005).
The ownership structure is usually measured by the percentage of shares held by
each type of owner, for instance state, managers, workers, domestic and foreign
concentrated owners, as Akimova and Schowödiauer (2004) do in their study.
The authors find a non-linear impact of concentrated foreign ownership on
performance: its effect is positive only up to a level that falls short of majority
ownership. The effects of foreign ownership are investigated also by Pivovarsky
(2001) who finds that the concentration of ownership by foreign companies is
positively associated with enterprise performance in Ukraine. However, none of
the above mentioned studies presenting the case of Ukraine “labels” the foreign

8
capital by its country of origin. This might raise doubts about the validity of
results concerning the presence of the link between ownership and performance.
The reason why we should be concerned about the separation of offshore
ownership is that a substantial share of foreign capital into Ukrainian economy
comes from the classical offshore zones such as Cyprus and British Virgin
Islands. The problem is that offshore ownership results in low transparency of
ownership structure, i.e. anonymity of the ultimate owners. Thus, the substantial
part of offshore capital may belong to Ukrainian or Russian owners transferring
their money through offshore schemes.5 Therefore, offshore firms by nature do
differ from non-offshore foreign firms, and consequently companies under their
control could perform differently. It is not obvious whether offshore investments
improve company performance since the goals of these companies are not always
in line with conventional theory of firms’ profit-maximizing behaviour.
Controlling for the origin of foreign capital, it is possible to reveal whether
owners’ characteristics contribute to the differences in firm performance.
One more concern about the validity of results that reveal the ownership-
performance link is the problem of reverse causality, or endogeneity. The
assumption of exogenous ownership (which is accepted by the majority of studies
in this area) is very strong and can explain the ambiguity of results across
different empirical studies. A similar problem is revealed in the analysis of the
effects of privatization upon firm performance. Bevan and al. (1999) argue that
firms which are selected for privatisation are typically not selected purely
randomly, and similarly, the particular ownership is determined by the firm’s
perspectives from the point of view of potential investor. This argument is
supported by the studies that manage to deal with reverse causality between
5 Additional commonly known purposes of offshore firms’ usage are tax optimization of
export operations and investments, avoidance of raider attacks and monopoly regulation

9
privatization and ownership, or firm performance and ownership. For instance,
Smith et al. (1997) estimate the elasticity of firm’s value added with respect to
foreign ownership and find positive association between two variables after
controlling for simultaneity between privatization and firm performance in
Slovenia (namely 3.9% increase in value added is due to foreign ownership).
Other study by Benfratello and Sembenelli (2006) does not find any significant
effect of foreign ownership on total factor productivity of firms in Italy after
controlling for simultaneity of foreign ownership variable. These studies highlight
the importance of controlling for the direction of the link between the variables
of interest.
However, there are papers that point out the issue of endogenous ownership but
manage to justify that this is not the case for their particular study. For instance,
Xu and Wang (1997) argue that in the institutional environment where legal
person have less power to select the shares of which company to purchase, the
issue of endogenous ownership is not crucial. The authors present the case of
China where the state has the control over which company to be listed and how
many shares to be kept in the hands of the state, therefore they find it to be
unlikely that the state would prefer to keep the shares in poorly performed firms,
while better performed would be bought by private sector. As for Eastern and
Central Europe, ownership was largely determined through political and
administrative processes (Djankov and Murrell, 2002), but legal persons had more
power to select the firms for purchase. Anecdotal evidence from transition
economies suggest that it can be the case that stakes of better performing firms
are bought by investors setting aside poorly performing enterprises, therefore
ownership is usually viewed as endogenous (e.g., Demsetz and Villalonga, 2001).
The empirical evidence suggests that a particular study on the ownership-
performance relationship has to take into account the quality of national legal and
10
regulatory environment and the features of privatization programs. The reason is
that this information does not only contribute to our understanding of why
different types of owners may have (or may not have) effect on firm performance
but also helps to decide on the appropriate estimation technique. In contrast to
developed economies where the particular ownership structure is the outcome of
market forces, the ownership structure of firms in transition economies is
generally recognized to be endogenous mainly due to the implementation of
different mass privatization schemes (e.g., Grosfeld and Hashi, 2003). In
particular, privatization program of state-owned enterprises in Ukraine was
adopted in early 90’s. The first stage (from 1992 to 1994) was characterized by the
struggles of so-called “red directors” for the stakes of enterprises which de-facto
were under their control. As far as it became obvious that such a scheme had
nothing to do with the economic efficiency and reform of the ownership, “mass”
privatization was introduced in 1994. “Mass” privatization (or voucher
privatization) offered the possibility of fast transfer of assets from the state to
large number of private owners (Estrin and Rosevear, 2003). The program stated
that it was aimed at the establishment of dispersed ownership; however, in
practice it was associated with political discretion and greatly complicated by the
lack of legal protection of minority shareholders. Consequently, the evidence of
“fair” privatization turned out to be illusory, since de-facto control was exercised
by the business groups closely connected with political circles. The privatization
process in 1992 – 1998 in Ukraine was associated with growing disillusionment of
the population; however, it managed to transform the state ownership into the
private ownership which became the base of the Ukrainian economy.
“Mass” privatization, however, as a whole could not ensure the emergence of real
owners dedicated to the interest of profit which meant that enterprise
performance did not improve (Estrin and Rosevear, 2003). Moreover, the
government failed to realise the value of its portfolio which could have been
11
accomplished with the privatization by sale. The latter required well-functioning
capital markets for valuation of the companies, making this method of
privatization simply infeasible at early stages of transition. Starting from 2000,
case-by-case privatization took the place of previous scheme, in particular due to
the privatization of strategic units which required individual approach and more
rigorous valuation techniques. Again, as anecdotal evidence suggests, it was
associated with non-competitive (and even illegal) practices for the transfer of
property. The ownership structure of the majority Ukrainian companies observed
after 2002 is the outcome of the market and non-market forces that took place
after the “mass” privatization.
This short discussion of privatization process is needed in order to decide
whether ownership should be treated as endogenously determined. I believe that
it is worth looking for the various determinants of ownership among the
enterprises’ accounting information prior to 1998. The latter provided the
potential buyers with the information necessary for valuation of the company and
estimation of its future prospects. This approach (i.e., usage of pre-privatization
performance measures) is employed in studies on ownership-performance
relationship in transition economies. For instance, Filatotchev and Mickiewicz
(2002) discuss the relevant characteristics determining the ownership structure
among which are firm size, investment needs, industry, location, export potential.
Demsetz and Villalonga (2001) show that ownership concentration is related to
firm size and the degree of the regulation of the given industry. Similar approach
is employed by Claessens and Djankov (1997), and Hanousek et al. (2004).
Therefore, the relationship between ownership and performance is the subject of
an ongoing debate in the literature. I try to contribute to the existing evidence by
addressing the important issues of endogenous ownership and distinguishing
between foreign offshore and foreign non-offshore owners owners.
12
C h a p t e r 3
METHODOLOGY
3.1 Performance measures
In order to estimate the link between ownership and performance it is necessary
to decide on the appropriate performance indicators. Bevan et al. (1999) in their
comparative study of literature on the determinants of enterprise performance
discuss the advantages and shortcomings of different performance measures
stressing the interpretation and measurement difficulties connected with each
indicator. In particular, poor accounting standards and the underdevelopment of
stock markets are the main reasons why Tobin’s Q, the traditional measure of
performance in developed countries, can not be employed in transition context.
Even in developed countries performance measures based on capital stock,
assets, or equity are criticized for the lack of precision, not to mention transition
countries. As an alternative, the researchers refer to labour productivity, total
factor productivity, proportion of sales exported, investment propensity, firm
growth, and profitability ratios as performance measures.
Profitability is widely viewed as the best measure of corporate performance,
especially in transition context, as it is suggested by Kocěnda and Svejnar (2002).
This indicator is usually calculated using the financial information of large
companies which is publicly available. Among the financial ratios, the most
commonly used candidates for performance measures are return on assets
(ROA), return on sales (ROS), and return on equity (ROE). Return on assets as
the ratio of net profit to firm’s assets gives an idea as to how
efficient management is at using its assets to generate earnings. Return on sales is

13
the ratio of yearly sales to assets and captures company’s operational efficiency
and growth opportunities. Return on equity (ROE), the ratio of net profit to
equity, captures firm’s efficiency at generating profits from shareholders’ equity.
In general, the existing literature documents the appropriateness of these financial
ratios as performance measures in transition context. For instance, Hanousek et
al. (2004) use two measures of profitability: return on sales and return on assets,
and two additional performance measures which are the rate of change in sales
revenue and in labour cost.
However, there are potential problems with the usage of the above-mentioned
ratios. ROE is subject to the most serious accounting distortions. The problem is
that the positive ROE does not always witnesses that a company is profitable.
This is due to the fact that many Ukrainian firms report negative equity in their
balance sheets. If the corporation incurs losses during several accounting periods,
accumulated losses appear in the equity section of balance sheets and may result
in negative value of equity. Therefore, positive values of ROE may occur as the
ratio of two negative entries, loss to equity. It may turn out that loss-maker has a
positive return on equity, therefore this measure has nothing to do with the actual
firm performance. As to the remaining ratios, ROA and ROS, they may also
suffer from the accounting errors (both random and intended), missing values in
financial reports that cause the bias in estimation. However, they can be mitigated
by applying screening procedures, as many researchers do (e.g., Kocěnda and
Svejnar, 2002). The magnitude of possible distortions in measuring ROA and
ROS is therefore much smaller than in case of ROE and these profitability ratios
are considered to be appropriate performance measures. In general, it is
reasonable to refer to several performance measures rather than to the single
indicator in order to compensate for individual shortcomings.
14
3.2 Ownership variables
The main research question relates to the impact of foreign offshore and foreign
non-offshore ownership on performance: it is unclear whether foreign capital
from different source countries affects firm performance differently. In order to
investigate this question it is needed to decide on how the ownership is captured.
Previous studies by Mueller et al. (2003) and Nenovsky et. al. (2003) employ
dummy variables to capture the effect of offshore ownership: the offshore largest
owner dummy that is 1 if the largest shareholder of the company is an offshore
owner, and 0 otherwise; an offshore owner dummy if the firm has some offshore
owner, and 0 otherwise. A similar approach is used by Yudaeva et al. (2003) who
control for the effect of foreign ownership with dummy variable, which takes
value one for fully or partially (at least 10%) foreign-owned firms. Another way to
capture the effect of ownership is to use the percentage of shares held by foreign
owners (e.g., Lee, 2008), and this study uses the latter approach.
The data on the largest shareholders provided by State Commission on Securities
and Stock Market includes the names, addresses and shareholdings of the largest
shareholders. These data allows to compute the ownership stake of foreign
ownership from each country. However, owners from some countries posses the
stakes in only a few Ukrainian companies so that the data are not sufficient to
create the separate variable for every country of origin. A separate variable is
created either for the group of countries or for one country in case there are
enough observations and there is a reason to regard the country individually. The
variable capturing the origin and concentration of capital is constructed in the
following way (consider the case of Cyprus): it is equal to the proportion of
shares held by Cyprian company if there is Cyprian owner, and zero otherwise.
For the convenience of classification, I define two main blocks of countries:

15
foreign offshore and foreign non-offshore jurisdictions within which more
detailed classification is applied.
The first block consists of countries that are officially recognized as offshore
zones according to the Ukrainian government’s regulations. Foreign offshore
countries are grouped as follows:
Cyprus6 (the biggest foreign investor in Ukrainian economy);
British Virgin Islands (the second biggest foreign offshore investor in
Ukrainian economy);
Other offshore zones: Seychelles, Panama, Bahamas, Saint-Vincent and
Grenadines, Saint-Kitts and Nevis, Belize, Isle of Man, and Gibraltar.
The second block consists of countries which are subject to specific regulation by
The Organisation for Economic Co-operation and Development (OECD)
because they have not implemented internationally agreed standards of tax
cooperation and the effective exchange of information. These jurisdictions are
often called “tax havens”. In April 2009, at the behest of the London G20
meeting OECD published three lists of countries: the “black” list (countries that
ignore foreign fiscal authorities), a “grey” list (countries that supposedly lack fiscal
transparency but have committed to change), and a “white” list (countries that
substantially implemented the agreed tax cooperation standards)7. OECD’s 7
April press release has moved last four black-listed countries (Costa Rica,
Malaysia, Philippines and Uruguay) to the grey list so that black list is empty now.
However, there are still doubts whether it is possible to ensure there are no
6 Since 2006 Cyprus has not been officially recognized as offshore zone because of its
exclusion from the list. This initiative was driven by the fact that Cyprus had joined EU, as officials argued. However, there are thoughts that this decision is a matter of political conspiracy.
7 A progress report on the jurisdictions surveyed by the OECD Global Forum in implementing the internationally agreed tax standards, accessed at http://www.oecd.org/dataoecd/38/14/42497950.pdf

16
longer tax havens8. Thus, the second block consists of countries that have been
indulged by OECD in harmful tax practices during the last several years. They are
called “pseudo-offshore” for the convenience of notation. Two variables are
defined as follows:
“Pseudo-offshore” countries (Europe): Liechtenstein, Luxembourg,
United Kingdom, Denmark, Switzerland, Belgium, Austria, and Netherlands;
United States of America9.
It is worth mentioning that many of these jurisdictions have recently concluded
bilateral tax agreements and have made commitments to work with OECD and
its partners to improve transparency However, Liechtenstein is still defined as
“tax haven” while Austria, Belgium, Luxembourg, and Switzerland are
categorized as “other financial centres” and included into the OECD “grey list”.
The third group of foreign investors consists of foreign non-offshore countries,
and dummy variable is created for each of the following groups of countries:
Developed economies (appear on OECD’s “white list”): Germany,
France, Sweden, Italy, Norway, and Canada;
Transition economies: Slovakia, Latvia, Lithuania, Poland, Estonia,
Greece, Hungary, Bulgaria, and Czech Republic;
CIS: Russia and Moldova.
Thus, eight variables capturing the effect of ownership are constructed. First
three variables comprise the group of “foreign offshore” countries, while the rest
are called “foreign non-offshore” countries.
8 “White” list comprises a number of offshore and low-tax jurisdictions, including
Barbados, Cyprus, Guernsey, Ireland, Isle of Man, Jersey, Malta, Mauritius, Seychelles, the United Arab Emirates, and the US Virgin Islands.
9 In particular, the LLC legislation of State of Delaware allows to register offshore structures.

17
Since the aim of this study is to examine the relation between ownership and
performance, the main hypothesis concerning this link can be formulated as
follows: foreign offshore ownership is negatively related to firm performance
suggesting the possibility of money-laundering purposes of owners’ offshore
registration. Foreign non-offshore ownership is supposed to affect firm
performance positively. However, I abstain from making any strong predictions
on the sign of the effect of each type of owners even though I would expect the
countries belonging to the group of non-offshore jurisdictions to be positively
associated with firm performance and those belonging to offshore zones to be
negatively linked to performance.
3.3 Model specification
Past literature suggests to estimate performance as a function of ownership, firm
attributes, industry-specific and macro-economic variables. Among the firm-
specific characteristics, financial structure, size, market share and business strategy
are found to be important determinants of corporate performance (e.g., Joh,
2003). The model that links performance, ownership and other variables is usually
specified as follows:
ititititit uZOwnershipXePerformanc ,
where itX is a set of firm-specific characteristics, Ownershipit is a set of ownership
variables, Zit is a set of dummies (region, industry, and year), itu is an
unobservable term, β, α and γ are vectors of unknown parameters.
Among the control variables, traditional firm-specific characteristics widely used
in the literature on ownership-performance relationship are leverage, firm size,
and liquidity. These variables are used in this study and viewed as exogenous
18
which can be subject to critique. Leverage, according to different theories of
capital structure, depends on past profitability. Most tax and agency-cost models
of capital structure predict that leverage is increasing in profitability due to the
possibility of managers to exploit valuable tax shields (e.g., Myers, 2003). Debt
may yield a disciplinary effect on the distribution of free cash flow (Jensen, 1986).
Empirically, the opposite relationship is often found (e.g., Fama and French,
2002) which is supported by pecking-order theory suggesting that profitable firms
borrow less because they have more internal financing available. The causation
between leverage and profitability may in fact run in both directions. For
instance, the effect of debt on performance is estimated using simultaneous
equations in the study of Baker (1973). Similarly, there are arguments in support
of the simultaneous determination of profitability and firm size (e.g., Hall and
Weiss, 1967).
Nevertheless, the majority of studies on ownership-performance relationship
regard firm-specific characteristics as exogenous control variables. I follow the
methodology of Joh (2003), Mueller et. al. (2003), Barbosa and Louri (2003)
whose primary research interest is the effect of ownership on firm performance
while firm-specific characteristics are regarded as predetermined. Therefore, the
following control variables are employed:
Leverage is measured as the ratio of total debt to assets. Higher leverage
increases the risk of bankruptcy and is associated with firm dependency and
bargaining power in the capital market, as Barbosa and Louri (2003) suggest. At
the same time, leverage increases profit opportunities. The on-going debates on
relationship between variables of interest refrain from making strong predictions
on the ex-ante sign of the effect.
19
Firm size (measured by the logarithm of company’s assets) is positively
related to profitability in case the firms make use of the economies of scale and
scope. The logic is that large firms have all options of small firms, and, in
addition, their scale allows to invest in projects that are not available for small
firms (e.g., Hall and Weiss, 1967). However, the management of large companies
is associated with bigger bureaucracy and increasing monitoring costs. One
possible explanation of the negative relationship between firm size and
performance is the separation of ownership and control in modern corporations.
The conflict of interests between managers and owners arises when managerial
utility maximization replaces profit maximization as the firm’s objective function.
This separation may increase with firm size, therefore large firms are more
vulnerable to managerial discretion (e.g., Ammar et. al., 2003). As empirical
studies provide varying results for firm size-performance relationship, I do not
make a strong prediction on the sign of the relationship.
Liquidity is a measure of asset management efficiency and reflects the
speed of assets conversion in order to respond to profit opportunities (Barbosa
and Louri, 2003). Liquidity can be measured by several ratios, such as quick
liquidity ratio (cash-to-current liabilities ratio) or current ratio (current assets-to-
current liabilities ratio), and this study employs the latter. Efficient liquidity
management balances the risks of inability to pay out short-term obligations with
the avoidance of excessive holdings of liquid assets which do not bring the return
until are invested. Liquidity-profitability trade-off is discussed in detail by Abuzar
(2004) who finds significant negative relation between the firm’s profitability and
its liquidity level, as measured by current ratio.
Region, industry and year dummies are available to control for location, industry
and time.

20
The starting point for the studying of the link between ownership and
performance is the fixed-effect estimation for panel data. This approach deals
with the unobserved heterogeneity which causes OLS estimates to be biased and
inconsistent. Using fixed-effect estimator, we allow for heterogeneity across panel
units and confine this heterogeneity to the intercept of the relationship. In the
model proposed above, performance depends on a set of the ownership
variables, firm-specific characteristics which do vary over time (leverage, firm
size, and liquidity), and time dummies.
Possible problems with the fixed-effect estimation, however, refer to the presence
of reverse causality in case firm characteristics (in particular, firm performance)
determine ownership structure. The point is that firms of specific ownership are
not randomly “selected”, that is their assets are purchased by different types of
foreign owners conditional on some observable firm characteristics. The latter
may be efficiency, productivity, growth opportunities or other firm-specific
characteristics.
The problem of endogeneity is addressed in several studies on the ownership-
performance relationships, particularly by Demsetz and Villalonga (2001) and
Earle and Estrin (1997) who study the impact of privatization upon firm
performance. There are several approaches how to deal with reverse causality
suggested in the literature. For instance, Smith et. al. (1997) control for
simultaneity between privatization and firm performance employing two-stage
Tobit least-square procedure while Mueller et. al. (2003) use binary logistic
regression. Alternative approach is to use IV-GMM technique which is employed
by Benfratello and Sembenelli (2006) for the estimation of effect of foreign
ownership on total factor productivity of Italian manufacturing firms. Similar
approach is used for transition economies by Claessens and Djankov (1997), and
Hanousek et al. (2004). The authors use the set of variables reflecting different

21
firm characteristics in pre-privatization period, more specifically, the number of
privatization projects, net asset value, number of shares, geographic and industry
location of the firm, sales, profit, debt and employment prior to privatization. In
addition, Claessens and Djankov (1997) argue that sales to foreign investors were
possibly focused on firms with substantial market power.
Usage of pre-privatization performance measures as the predictors of firm’s
ownership structure indeed make sense. The essence of the instrumental variables
approach is to find exogenous variables uncorrelated with dependent variable, but
strongly correlated with endogenous regressor, and pre-privatization performance
indicators comply with these requirements. In this respect, special attention
should be paid to the history and schemes of privatization process in a particular
country since the latter may induce the emerging ownership structures (e.g.,
Bevan et al., 1999). As it was already discussed, in Ukraine sale to outsiders
required the valuation of the firm which was extremely problematic in the context
of undeveloped capital markets. In this respect, reported accounting information
had some predicative power for the estimation of company’s perspectives and
could be used for its valuation. It has to be noted that there are many problems
associated with the data in this period. First, this information is often not
available due to the lack of regulation that obliged all the companies to make their
reports public. Secondly, if these data are available, they are subject to many
serious accounting distortions mainly due to the hyperinflation, changes in input
prices, and imperfections of accounting standards. These problems, in particular,
force to refer to ratios rather than to nominal values as the candidates for
instruments. Among the possible instruments, I identify the following ratios:
Return on sales can be considered as a proxy for firm’s growth
opportunities and may have influence on the preference of investors for better
performing firms;

22
Capital productivity ratio (sales divided by the basic capital) is
considered to be the measure of operational efficiency as it shows the possibility
of firm’s resources to generate sales;
Firm size which is captured by the number of employees.
The above-mentioned performance measures prior to 1998 are expected to
perform well as instruments for endogenous ownership. What is important with
regard to the instruments is that they can not be correlated with the error term in
the period under investigation (2002 – 2006). Therefore, IV-GMM approach can
be employed to estimate the relationship between ownership and performance.
Usage of IV-GMM approach is justified by the fact that it is more efficient than
2SLS in case of overidentification as “boiling down” of the available instruments
is not necessary.

23
C h a p t e r 4
DATA AND SAMPLE DESCRIPTION
The data used in the empirical analysis is provided by State Commission on
Securities and the Stock Market10. This datasets covers about 13,000 of Ukrainian
companies of two types, open and closed joint stock companies. For the analysis,
financial data (companies’ balance sheets and income statements), ownership data
for 2002 – 2006, and pre-privatization indicators (1993 – 1998) are used. The
latter dataset includes a number of important firm indicators such as profits, sales,
basic capital, employment etc. As it was mentioned above, these data suffer from
accounting distortions due to the general economic instability and the absence of
approved accounting standards11. These shortcomings are mitigated by applying
screening procedures and referring to the ratios rather than to nominal values
when excluded instruments are chosen. It is worth mentioning that the data on
closed joint stock companies are deliberately excluded from the analysis since
closed joint stock companies are not obliged to report the information on their
owners, therefore it is not publicly available. In addition, financial companies are
not taken into analysis.
The sample for the analysis includes 264 manufacturing firms which have the
share of foreign ownership in their equity. For these firms, there is data about
ownership and accounting variables for the period 2002 – 2006, and accounting
data for 1993 – 1998 (the breakdown of the firms by industry and region is
10 The Internet address is http://www.smida.gov.ua, the link effective as of May 2009. 11 The Law “On accounting and financial reporting in Ukraine” was passed in 2000.
Consequently, Ukrainian accounting standards came into line with International Accounting Standards.

24
presented in Appendices B and C). The unbalanced panel includes 794
observations, each firm is observed for at least two reporting periods. It has to be
noted that pre-privatization data for some companies is unavailable which
reduces the effective number of observations. Some firms may be lost because
they have gone out of business or have merged with other companies, that is they
may drop from the data due to some reasons correlated with firm performance.
In order to verify the possibility of sample selection, it is needed to check
whether the variables of interest are systematically different for two groups of
companies, namely those for which the pre-privatization data is available and
those that miss this information. t-test on the equality of means does not reveal
significant differences in mean values of ROA, ROS and control variables for two
groups.
Ownership data is taken from the reports of open joint-stock companies on
firm’s largest shareholders with 5% of equity or more. The information reported
includes the name and address of the owner (legal entity) which allows to
determine the “origin” of ownership12. There are 36 different sources of foreign
capital in the sample of Ukrainian corporations (see Appendix D). Based on the
groups of countries defined as above, the variables capturing share ownership are
computed. For instance, variable CYPRUS captures ownership of Cyprian
companies in the equity of Ukrainian firm, and it is equal to the proportion of
shares to all equity.
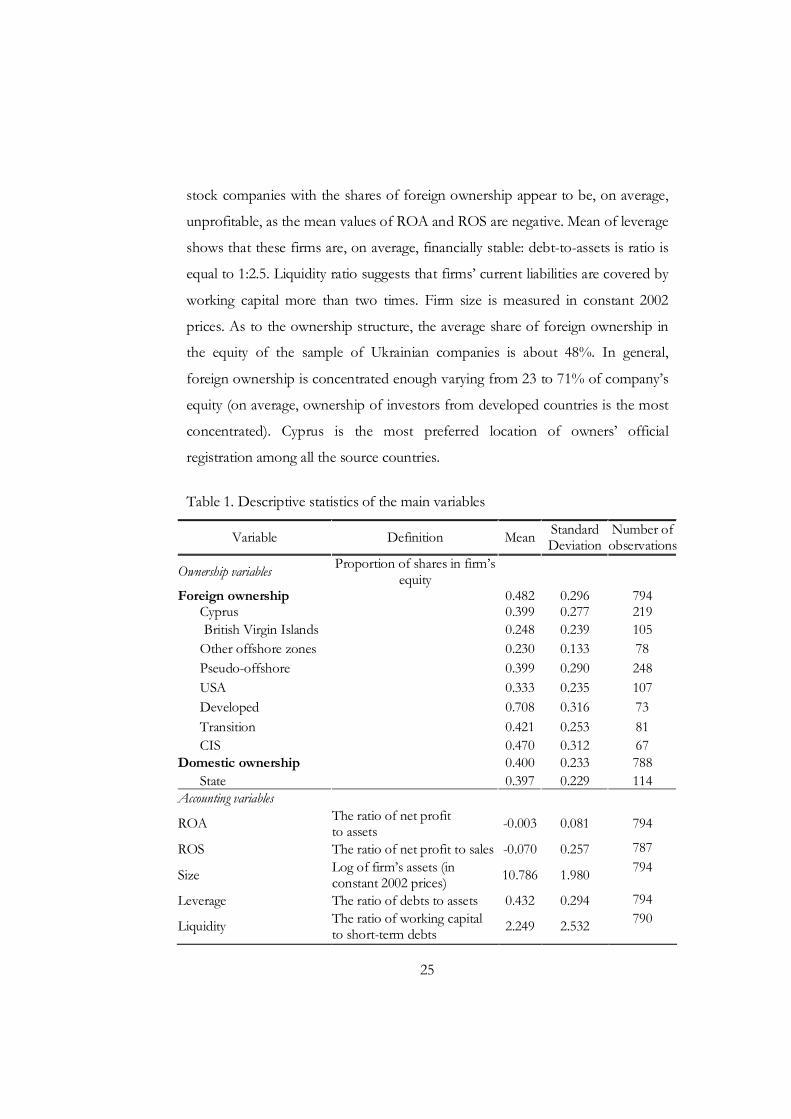
The descriptive statistics on the main financial indicators and ownership variables
used in the analysis is presented in Table 1. As it can be observed, Ukrainian joint
12 It must be mentioned that the identification of the ultimate owners is indeed infeasible.
For instance, there is now guarantee that the company-owner from, say, UK or Netherlands is not just an intermediary in offshore scheme. The reasoning that even country with relatively “good” reputation can be blamed for tax haven’s practices is supported by the OECD’s reports on internationally agreed tax standards. This shortcoming of the ownership data is acknowledged and taken into account when the estimation results are analyzed.
25
stock companies with the shares of foreign ownership appear to be, on average,
unprofitable, as the mean values of ROA and ROS are negative. Mean of leverage
shows that these firms are, on average, financially stable: debt-to-assets is ratio is
equal to 1:2.5. Liquidity ratio suggests that firms’ current liabilities are covered by
working capital more than two times. Firm size is measured in constant 2002
prices. As to the ownership structure, the average share of foreign ownership in
the equity of the sample of Ukrainian companies is about 48%. In general,
foreign ownership is concentrated enough varying from 23 to 71% of company’s
equity (on average, ownership of investors from developed countries is the most
concentrated). Cyprus is the most preferred location of owners’ official
registration among all the source countries.
Table 1. Descriptive statistics of the main variables
Variable Definition Mean Standard Deviation
Number of observations
Ownership variables Proportion of shares in firm’s equity
Foreign ownership Cyprus 0.482
0.399 0.296 0.277
794 219
British Virgin Islands 0.248 0.239 105 Other offshore zones 0.230 0.133 78 Pseudo-offshore 0.399 0.290 248 USA 0.333 0.235 107 Developed 0.708 0.316 73 Transition 0.421 0.253 81 CIS 0.470 0.312 67
Domestic ownership 0.400 0.233 788 State 0.397 0.229 114
Accounting variables
ROA The ratio of net profit to assets -0.003 0.081 794
ROS The ratio of net profit to sales -0.070 0.257 787
Size Log of firm’s assets (in constant 2002 prices) 10.786 1.980 794
Leverage The ratio of debts to assets 0.432 0.294 794
Liquidity The ratio of working capital to short-term debts 2.249 2.532 790
26
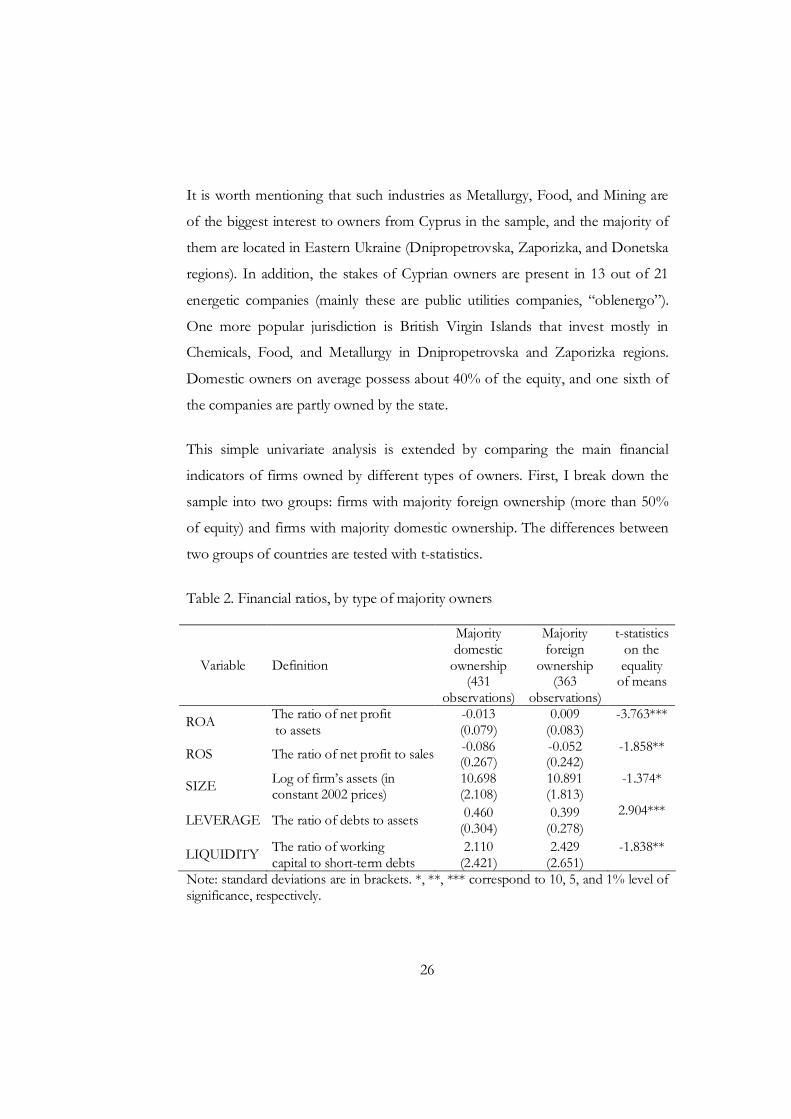
It is worth mentioning that such industries as Metallurgy, Food, and Mining are
of the biggest interest to owners from Cyprus in the sample, and the majority of
them are located in Eastern Ukraine (Dnipropetrovska, Zaporizka, and Donetska
regions). In addition, the stakes of Cyprian owners are present in 13 out of 21
energetic companies (mainly these are public utilities companies, “oblenergo”).
One more popular jurisdiction is British Virgin Islands that invest mostly in
Chemicals, Food, and Metallurgy in Dnipropetrovska and Zaporizka regions.
Domestic owners on average possess about 40% of the equity, and one sixth of
the companies are partly owned by the state.
This simple univariate analysis is extended by comparing the main financial
indicators of firms owned by different types of owners. First, I break down the
sample into two groups: firms with majority foreign ownership (more than 50%
of equity) and firms with majority domestic ownership. The differences between
two groups of countries are tested with t-statistics.
Table 2. Financial ratios, by type of majority owners
Variable Definition
Majority domestic
ownership (431
observations)
Majority foreign
ownership (363
observations)
t-statistics on the equality
of means
ROA The ratio of net profit to assets
-0.013 (0.079)
0.009 (0.083)
-3.763***
ROS The ratio of net profit to sales -0.086 (0.267)
-0.052 (0.242)
-1.858**
SIZE Log of firm’s assets (in constant 2002 prices)
10.698 (2.108)
10.891 (1.813)
-1.374*
LEVERAGE The ratio of debts to assets 0.460 (0.304)
0.399 (0.278)
2.904***
LIQUIDITY The ratio of working capital to short-term debts
2.110 (2.421)
2.429 (2.651)
-1.838**
Note: standard deviations are in brackets. *, **, *** correspond to 10, 5, and 1% level of significance, respectively.
27
As it can be seen from Table 2, firms with majority domestic ownership perform
relatively worse in terms of return on assets and return on sales comparing to
foreign-owned firms. It worth mentioning that state-owned firms demonstrate on
average even lower performance than privately-owned firms (these computations
are not presented in table). In addition, foreign-owned firms are relatively larger,
less levered and have on average higher liquidity ratio comparing to domestically-
controlled firms.
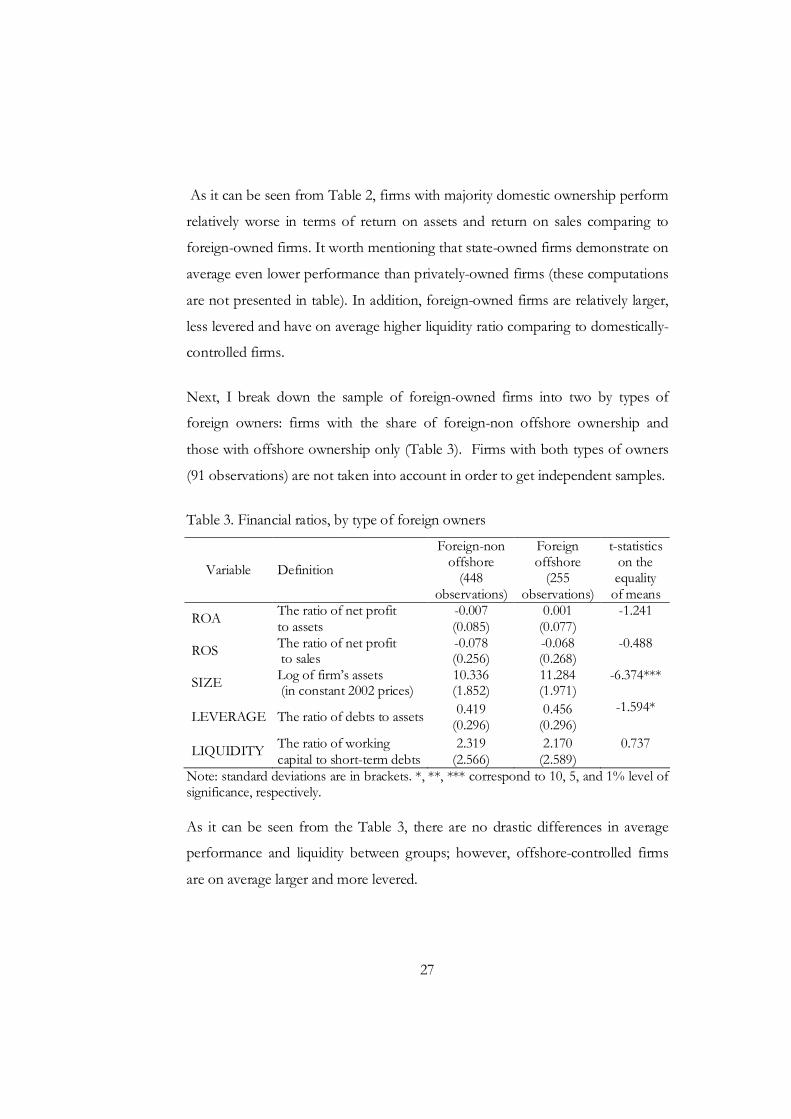
Next, I break down the sample of foreign-owned firms into two by types of
foreign owners: firms with the share of foreign-non offshore ownership and
those with offshore ownership only (Table 3). Firms with both types of owners
(91 observations) are not taken into account in order to get independent samples.
Table 3. Financial ratios, by type of foreign owners
Variable Definition
Foreign-non offshore
(448 observations)
Foreign offshore
(255 observations)
t-statistics on the equality
of means
ROA The ratio of net profit to assets
-0.007 (0.085)
0.001 (0.077)
-1.241
ROS The ratio of net profit to sales
-0.078 (0.256)
-0.068 (0.268)
-0.488
SIZE Log of firm’s assets (in constant 2002 prices)
10.336 (1.852)
11.284 (1.971)
-6.374***
LEVERAGE The ratio of debts to assets 0.419 (0.296)
0.456 (0.296)
-1.594*
LIQUIDITY The ratio of working capital to short-term debts
2.319 (2.566)
2.170 (2.589)
0.737
Note: standard deviations are in brackets. *, **, *** correspond to 10, 5, and 1% level of significance, respectively.
As it can be seen from the Table 3, there are no drastic differences in average
performance and liquidity between groups; however, offshore-controlled firms
are on average larger and more levered.

28
I try to explore some differences using more detailed division, namely by type of
foreign owners as described in the methodology section. t-statistics is used to see
whether the means of firm-specific characteristics statistically differ across firms
with different owners. For instance, it can be tested whether mean ROA of firms
with share ownership from Cyprus is statistically different from the mean ROA
of firms without Cyprian ownership.
Table 4. Financial ratios, by type of foreign owners (eight groups)
Variable
Cyprus (219 obs)
BVI (105 obs)
Other offshore (78 obs)
Pseudo-offshore (248 obs)
ROA 0.005** (0.080)
0.003 (0.071)
-0.001 (0.076)
0.002 (0.086)
ROS -0.056 (0.248)
-0.061 (0.080)
-0.108* (0.346)
-0.067 (0.273)
SIZE 11.306*** (2.042)
11.630*** (1.939)
11.081 (1.872)
11.176*** (1.955)
LEVERAGE 0.448 (0.285)
0.486** (0.281)
0.412 (0.280)
0.440 (0.293)
LIQUIDITY 2.104 (2.422)
1.833** (2.001)
2.378 (2.682)
2.292 (2.629)
Variable
USA (107 obs)
Developed (73 obs)
Transition (81 obs)
CIS (67 obs)
ROA -0.010 (0.067)
0.005 (0.098)
-0.020** (0.085)
-0.006 (0.066)
ROS -0.080 (0.253)
-0.026* (0.169)
-0.084 (0.257)
-0.051 (0.140)
SIZE 10.662 (2.119)
10.602 (1.904)
9.499*** (1.281)
9.980*** (1.431)
LEVERAGE 0.434 (0.245)
0.520*** (0.317)
0.375** (0.295)
0.296*** (0.268)
LIQUIDITY 2.014 (2.406)
2.055 (2.223)
2.404 (2.343)
2.775** (2.369)
Note: standard deviations are in brackets. *, **, *** correspond to 10, 5, and 1% level of significance, respectively for the t-test on equality of means between the corresponding type of ownership and the rest of the sample.
29
The results presented in Table 4 suggest the differences in performance: Cyprus-
owned firms are more profitable, while “transition”-owned companies are the
worst performers in terms of ROA comparing to the rest. As for ROS, the worst
performers are “other-offshore”-controlled firms, while the “developed”-
controlled firms are the least loss-makers. Firms with offshore ownership from
Cyprus and British Virgin Islands, and “pseudo-offshore” companies are
relatively larger comparing to the rest, while companies labeled with “transition”
and “CIS” ownership are smaller. Mean of leverage is higher in firms with
investment from British Virgin Islands and developed countries, while firms with
“transition” and “CIS” ownership are the least levered. “BVI”-owned companies
have on average low liquidity, while “CIS” firms have the highest current liquidity
ratio.
The univariate analysis provides some evidence on the differences in
performance and operational efficiency of companies with different owners
which may be due to the specific nature of owners. An insight into the causal
relationship between ownership and performance can be gained with regression
analysis.
30
C h a p t e r 5
EMPIRICAL RESULTS
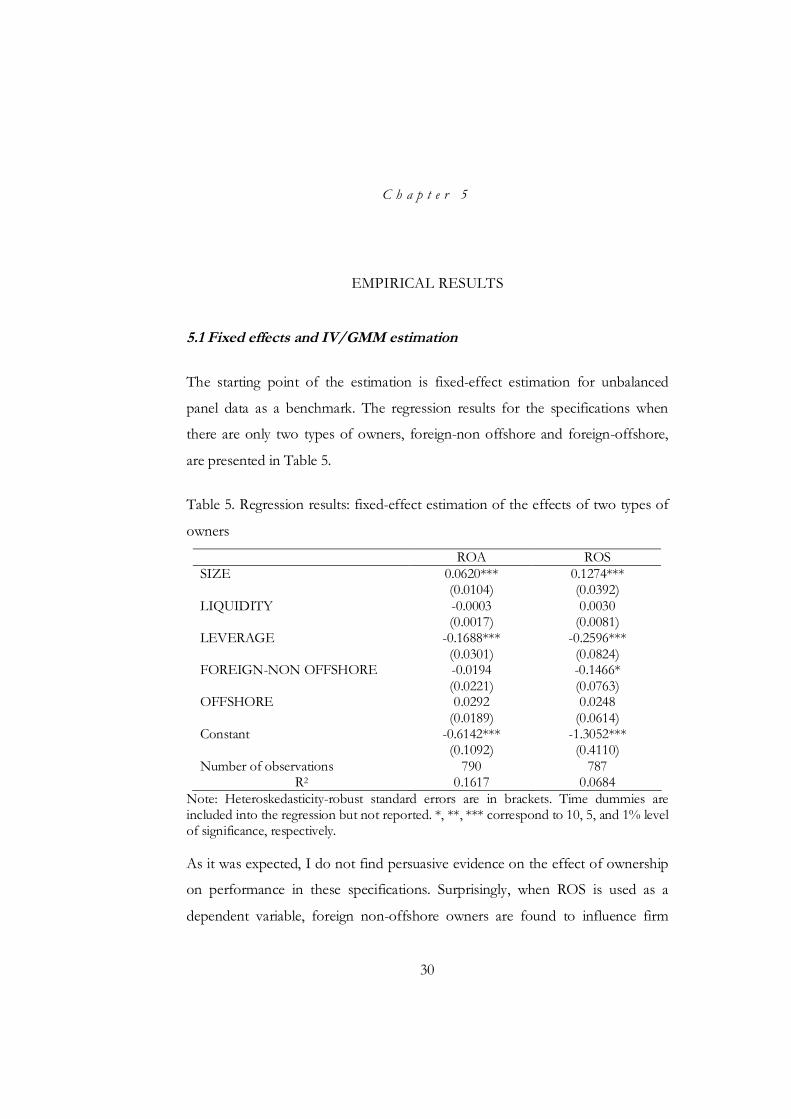
5.1 Fixed effects and IV/GMM estimation
The starting point of the estimation is fixed-effect estimation for unbalanced
panel data as a benchmark. The regression results for the specifications when
there are only two types of owners, foreign-non offshore and foreign-offshore,
are presented in Table 5.
Table 5. Regression results: fixed-effect estimation of the effects of two types of
owners
ROA ROS SIZE 0.0620*** 0.1274*** (0.0104) (0.0392) LIQUIDITY -0.0003 0.0030 (0.0017) (0.0081) LEVERAGE -0.1688*** -0.2596*** (0.0301) (0.0824) FOREIGN-NON OFFSHORE -0.0194 -0.1466* (0.0221) (0.0763) OFFSHORE 0.0292 0.0248 (0.0189) (0.0614) Constant -0.6142*** -1.3052*** (0.1092) (0.4110) Number of observations 790 787
R2 0.1617 0.0684 Note: Heteroskedasticity-robust standard errors are in brackets. Time dummies are included into the regression but not reported. *, **, *** correspond to 10, 5, and 1% level of significance, respectively. As it was expected, I do not find persuasive evidence on the effect of ownership
on performance in these specifications. Surprisingly, when ROS is used as a
dependent variable, foreign non-offshore owners are found to influence firm

31
performance negatively. Firm-specific characteristics, size and leverage, are found
to be significant determinants of firm performance: size is positively associated
with both performance measures while leverage decreases firm performance.
Similarly, Mueller et al. (2003) find out the positive and statistically significant
effect of firm size on performance, and negative but statistically insignificant
effect of leverage. R2 is relatively low, especially when ROS is used as a dependent
variable.
Similarly, fixed-effects are estimated including all the types of foreign-owners
(Table 6). The signs, magnitudes and significance of firm-specific characteristics
are almost unchanged. The only type of ownership which demonstrates
statistically significant effect on firm performance is pseudo-offshore ownership
which appears with the negative sign.
In case there were not reverse causality problem I would rely on these estimates
suggesting the absence of strong ownership-performance relationship13.
However, there are several problems associated with fixed effect estimation. The
first problem is that there can be not enough variation in ownership making it
unable to explain the variation in performance. In addition, the results suggesting
that ownership is not consistently related to the performance may indicate that
underlying assumption of exogenous ownership is not satisfactory. It can be the
case that ownership structure is determined by the “quality” of the company
which is the outcome of privatization process. To address endogeneity problem,
instrumental variables approach is employed. Past performance are used as the
determinants of equity stakes held by foreign investors.
13 Hausman test performed after the estimation of two alternative models, fixed-effects
and random-effects, suggests in favour of the former.

32
Table 6. Regression results: fixed-effect estimation of the effects of eight types of
owners
ROA ROS SIZE 0.0630*** 0.1380*** (0.0104) (0.0383) LIQUIDITY -0.0003 0.0027 (0.0017) (0.0084) LEVERAGE -0.1672*** -0.2748*** (0.0307) (0.0812) CYPRUS 0.0334 -0.0066 (0.0215) (0.0578) BVI 0.0216 0.2108 (0.0312) (0.1724) OTHER OFFSHORE -0.0029 -0.1063 (0.0496) (0.1262) PSEUDO OFFSHORE -0.0804** -0.3769*** (0.0316) (0.1359) USA 0.0160 -0.0427 (0.0398) (0.0794) DEVELOPED 0.0342 0.0804 (0.0615) (0.1394) TRANSITION 0.0636 -0.0761 (0.0618) (0.2258) CIS 0.0098 0.0534 (0.0275) (0.0651) Constant -0.6288*** -1.4135*** (0.1097) (0.4014)
Number of observations 790 787 R2 0.1537 0.0767
Note: Heteroskedasticity-robust standard errors are in brackets. Time dummies are included into the regression but not reported. *, **, *** correspond to 10, 5, and 1% level of significance, respectively.
IV-GMM is estimated by instrumenting two types of owners, foreign non-
offshore and foreign-offshore owners. Four financial ratios such as return on
sales in 1993 and 1998, logarithm of employment in 1994 and 1997 are used as
instruments. In contrast to FE estimation, there is the evidence on the
ownership-performance relationship. The regression results (Table 7) suggest the
presence of positive effect of both foreign non-offshore and foreign offshore
ownership on firm performance in terms of both performance measures, and the
effect of offshore ownership is larger in absolute value. The latter result

33
contradicts the hypothesis of the study. However, this is the effect of the
aggregated group of the countries that are put into one category based on the
official document. Owing to the fact that more detailed classification of owners is
available, it is possible to look which owners contribute to this increase in
profitability. As to the control variables, the coefficients on them are of the same
sign as in FE-estimation, however, the magnitude of coefficients is smaller and
leverage has no statistically significant on ROS in IV estimation.
Table 7. Regression results: IV estimation of the effects of two types of owners
ROA ROS SIZE 0.0141*** 0.0226*** (0.0031) (0.0079) LIQUIDITY 0.0022 0.0091 (0.0021) (0.0066) LEVERAGE -0.0824*** -0.0235 (0.0184) (0.0507) FOREIGN-NON OFFSHORE 0.1717*** 0.2614**
(0.0422) (0.1265) OFFSHORE 0.1913*** 0.3512** (0.0600) (0.1681) Anderson canon. corr. LR statistic
58.636 (p=0.0000)
58.574 (p=0.0000)
Hansen J statistic 14.636 (p=0.4035)
12.353 (p=0.5770)
Wu-Hausman F-test 7.157 (p=0.0279)
5.495 (p=0.0641)
Number of observations 631 630 Note: Excluded instruments: Return on sales in 1993, Return on sales in 1998, Log (employment) in 1994, Log (employment) in 1997. Cluster-robust standard errors are in brackets. Time, industry and region dummies are included into the regression but not reported. *, **, *** correspond to 10, 5, and 1% level of significance, respectively.
Next two specifications with ROA and ROS as dependant variables include eight
types of foreign owners as the regressors (Table 8). Ownership variables are
instrumented with past financial measures, namely ROS, logarithm of
employment, and capital productivity ratio prior to 1998. The control variables
preserve their signs and significance in two specifications, that is the negative
34
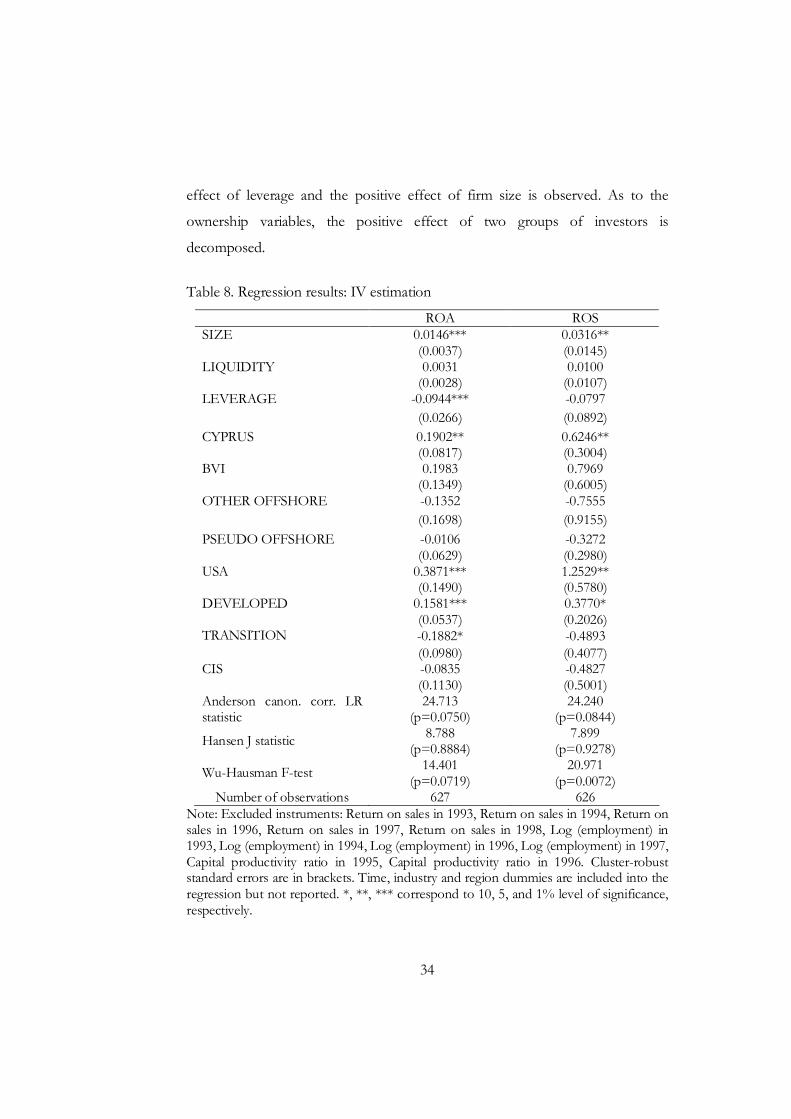
effect of leverage and the positive effect of firm size is observed. As to the
ownership variables, the positive effect of two groups of investors is
decomposed.
Table 8. Regression results: IV estimation
ROA ROS SIZE 0.0146*** 0.0316** (0.0037) (0.0145) LIQUIDITY 0.0031 0.0100 (0.0028) (0.0107) LEVERAGE -0.0944*** -0.0797 (0.0266) (0.0892) CYPRUS 0.1902** 0.6246** (0.0817) (0.3004) BVI 0.1983 0.7969 (0.1349) (0.6005) OTHER OFFSHORE -0.1352 -0.7555 (0.1698) (0.9155) PSEUDO OFFSHORE -0.0106 -0.3272 (0.0629) (0.2980) USA 0.3871*** 1.2529** (0.1490) (0.5780) DEVELOPED 0.1581*** 0.3770* (0.0537) (0.2026) TRANSITION -0.1882* -0.4893 (0.0980) (0.4077) CIS -0.0835 -0.4827 (0.1130) (0.5001) Anderson canon. corr. LR statistic
24.713 (p=0.0750)
24.240 (p=0.0844)
Hansen J statistic 8.788 (p=0.8884)
7.899 (p=0.9278)
Wu-Hausman F-test 14.401 (p=0.0719)
20.971 (p=0.0072)
Number of observations 627 626 Note: Excluded instruments: Return on sales in 1993, Return on sales in 1994, Return on sales in 1996, Return on sales in 1997, Return on sales in 1998, Log (employment) in 1993, Log (employment) in 1994, Log (employment) in 1996, Log (employment) in 1997, Capital productivity ratio in 1995, Capital productivity ratio in 1996. Cluster-robust standard errors are in brackets. Time, industry and region dummies are included into the regression but not reported. *, **, *** correspond to 10, 5, and 1% level of significance, respectively.
35
Positive and statistically significant relationship between “developed” ownership
and both profitability measures if found: if the ownership stake of investors from
Germany, France, Sweden, Italy, Norway, or Canada increases by 1%, ROA
increases by 0.0016 and ROS increases by 0.0038. Similarly, positive effect is
found for the effect of investments from the USA. These two findings are in line
with the priori expectations. However, as it turns out, the positive effect of
offshore ownership comes from the Cyprian ownership, the coefficient on which
is significant and especially high in case of ROS (increase of Cyprian ownership
by 1% increases ROS by 0.0062). One more unexpected result is the negative
effect of “transition” ownership (Slovakia, Latvia, Lithuania, Poland, Estonia,
Greece, Hungary, Bulgaria, and Czech Republic) on ROA (we recall that
descriptive statistics reveals that this type of ownership is relatively worse in terms
of ROA).
Other offshore zones such as Seychelles, Panama, Bahamas, Saint-Vincent and
Grenadines, Saint-Kitts and Nevis, Belize, Isle of Man, Gibraltar, and British
Virgin Islands do not contribute to the change in firm performance. Similarly,
ownership of entities registered in “pseudo-offshore” jurisdictions (countries
under the special attention of OECD) and in the members of CIS, Russia and
Moldova, is irrelevant. These results are discussed in the next subsection with the
reference to actual data and recent improvements of international disclosure
standards.
Several issues on the estimation technique and specifications tests have to be
mentioned. Even though panel data are used for estimation, I do not employ
two-stage least-squares within estimator because the instruments do not vary
within the firm (that is, ROS in 1993 is the same for every year when the firm i is
observed). In a polled estimation (no fixed or random effects), it may be
reasonable to assume that the observations on the same firm (cluster) in two
36
different periods are correlated, but observations on two different firms are not. I
estimate the model which is robust to arbitrary heteroskedasticity and intra-
cluster correlation, and this is useful alternative to the fixed or random IV
estimators because it relaxes the constraint imposed by the latter estimators that
the correlation of individual observations within a group is constant (Baum et al.
(2003)).
Instrumental variables must satisfy two requirements: they must be correlated
with the included endogenous variables, and orthogonal to the error process. The
former is tested by examining the first stage regressions. Commonly used
statistics are R2 of the first-stage regression with the included instruments
“partialled-out” and F-test of the joint significance of excluded instruments.
However, these statistics are nor sufficient to decide in the instruments’ relevance
because of multiple endogenous regressors. The relevance of the instruments is
tested with Anderson canonical correlations likelihood-ratio test of whether the
equation is identified. The null hypothesis of the test is that the matrix of reduced
form coefficients equation is underidentified. As it can be seen fro the Tables 7
and 8, we can reject the null, as p-values are sufficiently low. The rejection of the
null provides the measure of instruments’ relevance.
To check whether there is non-orthogonality between regressors and errors,
endogeneity tests of ownership variables is performed. This is Wu-Hausman F-
test analogous to a Hausman test comparing IV and OLS estimates. The null
hypothesis is that the specified endogenous regressors (namely, ownership
variables) can actually be treated as exogenous in order to derive consistent
estimates. Again, p-value is sufficiently low to reject the null, therefore IV should
be used.
However, rejection of the null should be treated with caution because it does not
eliminate weak instrument problems. In the context of IV/GMM, the Sargan-

37
Hansen test of overidentifying restrictions suggests whether the instruments are
valid. The null hypothesis is that they are uncorrelated with the error term, and
that the excluded instruments are correctly excluded from the estimated equation.
The statistics performed in overidentified models suggest that we cannot reject
the null (p-value is sufficiently high).
4.2 Effects of ownership: looking for possible explanations in the actual
data
Even though the regression results provide the evidence on the relationship
between ownership and performance, the signs of the coefficients are not
always in line with the priori expectations. Possible explanation of the observed
effects may come from the actual data. Firstly, the positive impact of Cyprian
ownership is found. The logical question arises from this result: should be
Cyprus treated as offshore? The Ukraine’s legislative practices evidence that its
status was largely determined by political discretion of every newly-formed
government. The first time Cyprus was “labeled” in 2000. In 2002, two
controversial events happened: its exclusion from the list on February and
inclusion on March. In 2003, the “stigma” of being tax haven was eliminated
again. During 2003 – 2005, the volume of FDI from Cyprus increased
drastically. Then, Cyprus was “labelled” in 2005, and excluded from the “black”
list in 2006.
On the international level, the offshore regime in Cyprus has changed as part of
the island’s accession to the EU in 2004, and as a result of agreements with the
Organisation for Economic Cooperation and Development (OECD). Cyprus
was excluded from the OECD’s June 2000 “harmful” tax haven blacklist in
return for pledging a commitment to amend its tax practices. The progress of
Cyprus made at 2nd April 2009 is its recognition as a “jurisdiction that have
substantially implemented the internationally agreed tax standard” (in other

38
words, it belongs to the OECD “white” list). However, Cyprus still remains one
of the world’s most attractive financial centres having the lowest corporate tax
rate in Europe and containing many favourable tax provisions. Therefore, its
status is subject to discussion.
The regression results suggesting the positive effect of Cyprian ownership raises
doubts. The main concern is that in reality the ultimate owners of stakes in
company’s equity are not known since offshore registration guarantees the
anonymity of owners. This problem is aggravated by the fact that so-called
strategic firms are often of this type of ownership. For instance, 13 out of 21
energetic companies in the sample are partly owned by Cyprus, and in 5 of
them Cyprus has a majority ownership. Anecdotal evidence suggests that
purchase of the stakes in strategic units is often associated with fraud and
raider’s attacks. However, I do not find clear evidence that the subsequent firm
performance after the privatization is deteriorated by the presence of this non-
transparent type of ownership.
The positive effect of investment from USA is also subject to discussion. It is
possible to register offshore companies in the State of Delaware and the state of
Oregon. However, USA is positioned as a zealous proponent of information
transparency and international tax standards. According to the classification of
this study, USA is defined as “pseudo-offshore” country, together with the
group of European countries such as Liechtenstein, Luxembourg, United
Kingdom, Denmark, Switzerland, Belgium, Austria, and Netherlands. In
contrast to the American owners, the group of European countries is found to
have no effect on firm performance. According to OECD list, Liechtenstein is
officially recognized as tax haven, while Austria, Belgium, Luxembourg and
Switzerland are labelled as “other financial centres” lacking the substantial
implementation of tax standards. In March, 2009 Austria, Belgium,
39
Luxembourg and Switzerland withdrew their reservations to Article 26 of the
OECD Model Tax Convention which creates an obligation to exchange
information that is relevant to the correct application of a tax convention14. As
to Denmark, Netherlands and United Kingdom, they are listed as countries
with good reputation, however in practice they allow to register private
companies with limited liability similar to offshore structures. Comparing to the
registration on Panama or Seychelles, it costs more for the Ukrainian residents,
however the reputation of such firms is better. They are commonly used as
intermediaries in more complicated offshore schemes, according to the State
Committee on Financial Monitoring.
British Virgin Islands and other offshore zones, except Seychelles (official
offshore according to the Ukrainian legislation) are also under special attention
of OECD. No effect of investment from these offshore countries is found
confirming the OECD’s policy concerning these jurisdictions.
The result which is in line with priori expectations is the positive and
statistically significant effect of the capital coming from developed economies
such as Germany, France, Sweden, Italy, Norway, or Canada. These countries
are co-operative and well-regulated places and whitelisted compliant
jurisdictions. One more country which belongs to this category is Russians
Federation, however the coefficient on investments from Russian Federation
and Moldova (CIS) appears in the regression results with minus sign but is
insignificant.
Negative effect of “transition” ownership (Slovakia, Latvia, Lithuania, Poland,
Estonia, Greece, Hungary, Bulgaria, and Czech Republic) in the specification
when ROA is used as a dependant variable is hard to explain because none of
14 Information accessed at http://www.oecd.org
40
them is blamed in unfair tax malpractices. However, studies investigating the
ownership structures document many problems associated with domestic
ownership in these countries (for instance, Mueller et al. (2003) for the case of
Bulgaria, Hanousek et al. (2004) for the case of Czech Republic, Javorcik (2004)
for the case of Lithuania). Even in middle of 2000’s it has been argued that
positive effects of privatization on performance in transition economies are
premature, and effects of many types of ownership are indistinguishable from
that of state ownership. Thus, there are still on-going debates about the
effectiveness of the privatization programs in these countries. This evidence
may partly serve as the explanation why significant negative effect of this type
ownership is found in one of the specifications.
The results of this study support the idea that the OECD as the international
body has developed more or less sufficient criteria for the determination of
jurisdictions which fall under suspicion of financial fraud and tax avoidance.
There is still open question whether the OECD’s agreements on the
information exchange between countries ensure the improvement of
transparency of ownership structures. However, recent achievements in
internationally agreed standards of financial control must definitely be taken
into account when state policy concerning the foreign ownership in Ukraine is
designed. By this time, no drastic measures concerning the struggle with money-
laundering and tax avoidance through offshore structures and the intermediaries
in “pseudo-offshore” jurisdictions are undertaken.
41
C h a p t e r 6
CONCLUSIONS
This study investigates the effects of different types of foreign ownership on
firm performance of Ukrainian manufacturing companies in 2002 – 2006. It
addresses two important problems widely discussed in the existing literature on
ownership-performance relationship. First, I distinguish between different types
of ownership, namely foreign offshore and foreign non-offshore firms, using
the data on the largest stockholders published by Ukrainian open-joint stock
companies. Secondly, the endogeneity of ownership is dealt with instrumental
variables calculated from the pre-privatization data. Two profitability ratios,
ROA and ROS are used as the performance measures instead of single indicator
in order to mitigate the possible accounting distortions. Additional controls,
such as firm size, leverage and liquidity are used in the analysis.
The distinction between firms of different ownership is observed even when
simple univariate analysis is conducted, and it is confirmed with the regression
analysis. When fixed-effects regression is estimated, no consistent relationship
between foreign ownership and performance is found. When more detailed
classification of foreign ownership including eight types of owners is used, the
negative effect of so-called “pseudo-offshore” ownership is observed.
However, due to the endogenous ownership the results of this benchmark
estimation are put into doubt. IV/GMM estimation provides the evidence that
there is the link between some types of foreign owners and profitability. More
specifically, both offshore and non-offshore owners are found to influence firm
performance positively, however these effects are disseminated when more
ownership types are analyzed. This approach confirms the idea that “a closer

42
look” at owners indeed makes sense. Thus, positive effects of capital from
group of developed countries (Germany, France, Sweden, Italy, Norway, or
Canada), USA, and Cyprus is documented, though the effect of last jurisdiction,
Cyprus, is not in line with the priori expectations. Negative effect of so-called
“transition” ownership is found in one of the specifications. The discussion of
the effects observed in the data is focused on the recent achievements of
different countries in implementing internationally agreed standards of
information exchange. This is related to my study in a way that commitment of
the countries to cooperate on tax issues improves information disclosure and
guarantees more transparent ownership structures.
The coefficients on two control variables, size and liquidity, preserve their signs
across the specifications and significantly impact firm performance in almost all
of them. Leverage is negatively associated with firm performance suggesting
that the bankruptcy costs are serious issue for Ukrainian manufacturing
companies. Firm size increases performance which evidences in favour of the
benefits of economy of scope and scale.
The results of the study contribute to the previous literature on the effects of
foreign ownership on firm performance as they help to understand why the
existing evidence on this issue is not conclusive. In particular, the underlying
assumptions about ownership structure are crucial. The research is also
important in context of recent global initiative of international community to
improve the standards on tax issues and information transparency. The
consequences of these efforts may be detrimental to the economies which do
not comply with the requirements. As a result, the policies of other countries in
relation to jurisdictions labelled as tax havens or suspected in other unfair
practices have to be revised. These changes will probably affect Ukraine which
has to comply with agreed standards in order to establish its reputation on the

43
international level. At this point of time, the impossibility to determine ultimate
owners raises the main concerns about the results obtained, and further
research able to deal with this issue can be conducted in case Ukraine
undertakes sufficient steps concerning the disclosure of ultimate owners.
44
BIBLIOGRAPHY
Abuzar, M.A. Eljelly. 2004. Liquidity-Profitability Trade-Off: An Empirical Investigation in an Emerging Market, International Journal of Commerce and Management 14/2: 48-61.
Akimova, Iryna, and Gerhard Schowödiauer. 2004. Ownership Structure, Corporate Governance, and Enterprise Performance: Empirical Results for Ukraine, International Advances in Economic Research 10/1: 28-42.
Ammar, Abdurahman, Awad S. Hanna, Erik V. Nordheim, and Jeffrey S. Russell. 2003. Indicator Variables Model of Firm’s Size-Profitability Relationship of Electoral Contractors Using Financial and Economic Data, Journal of Construction Engineering and Management 129/2: 192-197.
Aydin, Nurhan, Mustafa Sayim, and Abdullah Yalama. 2007. Foreign Ownership and Firm Performance: Evidence from Turkey, International Research Journal of Finance and Economics 11: 103-111.
Baker, Samuel H. 1973. Risk, Leverage and Profitability: An Industry Analysis, Review of Economics and Statistics 55/4: 503-507.
Barbosa, Natalia, and Helen Louri. 2003. Corporate Performance: Does Ownership Matter? A Comparison of Foreign- and Domestic-Owned Firms in
Greece and Portugal, Review of Industrial Organization 27/1: 73-102.
Baum, Christopher F., Mark E. Shaffer, and Steven Stillman. 2003. Instrumental Variables and GMM: Estimation and Testing, Stata Journal 3/1: 1-31.
Benfratello, Luigi, and Alessandro Sembenelli. 2006. Foreign Ownership and Productivity: Is the Direction of Causality so Obvious?, International Journal of Industrial Organization 24/4: 733 – 751.
Bevan, Alan A., Saul Estrin, and Mark E. Schaffer. 1999. Determinants of Enterprise Performance during Transition, CERT Discussion Paper 9903.
Bishop, Kate, Igor Filatotchev, and Tomasz Mickiewicz. 2002. Endogenous Ownership Structure: Factors Affecting the Post-Privatization Equity in Largest Hungarian Firms SSRN Working Paper 294433.
Claessens, Stijn, and Simeon Djankov. 1997. Politicians and Firms in Seven Central and Eastern European Countries. World Bank Policy Research Working Paper 1954.
Demsetz, Harold, and Belen Villalonga. 2001. Ownership Structure and Corporate Performance, SSRN Working Paper 266101.
Djankov, Simeon, and Peter Murrell. 2002. Enterprise Restructuring in
45
Transition: A Quantitative Survey, Journal of Economic Literature 15: 739-792.
Earle, John S., and and Estrin, Saul. 1997. After Voucher Privatisation: the Structure of Corporate Ownership in Russian Manufacturing Industry, CEPR Discussion Paper 1736.
Estrin, Saul, and Adam Rosevear. 2003. Ownership Changes and Corporate Governance in Ukraine 1995 - 1999, Problems and Perspectives in Management 1: 29-38.
Fama, Eugene F., and Kenneth R. French. 2002. Testing Trade-Off and Pecking-Order Predictions about Dividends and Debt, The Review of Financial Studies 15/1: 1-33.
Ford, Timothy C., Jonathan C. Rork, and Bruce T. Elmslie. 2008. Considering the Source: Does the Country of Origin of FDI Matter to Economic Growth?, Journal of Regional Science 48/2: 329-357.
Grosfeld, Irena, and Iraj Hashi. 2003. Mass Privatization, Corporate Governance and Endogenous Ownership Structure, William Davidson Institute Working Papers Series 596.
Grygorenko, Galyna, and Stefan Lutz. 2004. Firm Performance and Privatization in Ukraine, Economic Change and Restructuring 40/3: 253-266.
Hall, Marshall, and Leonard Weiss. 1967. Firm Size and Profitability, The Review of Economics and Statistics 49: 319-331.
Hanousek, Jan, Evžen Kočenda, and Jan Svejnar. 2004. Ownership, Control and Corporate Performance After Large-Scale Privatization, William Davidson Working Papers Series 652.
Javorcik, Beata S. 2004. Does Foreign Direct Investment Increase the Productivity of Domestic Firms? In Search of Spillovers through Backward Linkages, The American Economic Review 94/3: 605-627.
Jensen, Michael C. 1986. Agency Costs of Free Cash Flow, Corporate Finance, and Takeovers, The American Economic Review 76/2: 323-329.
Joh, Sung Wook. 2003. Corporate Performance and Firm Profitability: Evidence from Korea before the economic crisis, Journal of Financial Economics 68/2: 287-322.
Kočenda, Evžen, and Jan Svejnar. 2002. Ownership and Firm Performance after Large-Scale Privatization, William Davidson Working Paper 471.
Lee, Sanghoon. 2008. Ownership Structure and Financial Performance: Evidence From Panel Data of South Korea, University of Utah Economics Working Paper 17.
Mueller, Dennis C., Helmut Dietl, and Evgenii Peev. 2003. Ownership, Control and Performance in Large Bulgarian Firms, Journal for Institutional Innovation, Development and Transition 7: 71-88.

46
Myers, Stewart C. 2003. Financing of Corporations. Chapter 4 of Handbook of Finance, ed. by G. M. Constantinides, M. Harris, and R. Stulz, 216-253.
Nenovsky, Nikolay, Evgenii Peev, and Todor Yalamov. 2003. Banks-Firms Nexus Under the Currency Board: Empirical Evidence from Bulgaria, William Davidson Institute Working Papers Series 555.
Pfaffermayr, Michael, and Christian Bellak. 2000. Why Foreign-Owned Firms are Different: the Conceptual Framework and Empirical Evidence for Austria, Hamburg Institute of International Economics Discussion Paper Series 26372.
Pivovarsky, Alexander. 2001. How Does Privatization Work? Ownership Concentration and Enterprise Performance in Ukraine, IMF Working Paper 01/42.
Reganati, Filippo, and Edgardo Sica. 2005. Do Domestic Firms Benefit from the Presence of MNEs? The Case of the Italian Manufacturing Sector, Quaderni DSEMS 23.
Shleifer, Andrei, and Robert W. Vishny. 1997. A Survey of Corporate Governance, The Journal of Finance 52/2: 737-783.
Smith, Stephen C., Beom-Cheol Cin, and Milan Vodopivec. 1997.
Privatization Incidence, Ownership Forms, and Firm Performance: Evidence from Slovenia, Journal of Comparative Economics 25/2: 158-179.
Sprenger, Carsten. 2002. Ownership and Corporate Governance in Russian Industry: a Survey, EBRD Working Paper 70.
Svejnar, Jan. 2002. Transition Economies: Performance and Challenges, The Journal of Economic Perspectives 16/1: 3-28.
Xu Xiaonian, and Yan Wang. 1997. Ownership Structure, Corporate Governance, and Firms’ Performance: The Case of Chinese Stock Companies, World Bank Policy Research Working Paper 1794.
Yudaeva, Ksenia, Konstantin Kozlov, Natalia Melentieva, and Natalia Ponomareva. 2003. Does Foreign Ownership Matter? The Russian Experience, Economics of Transition 11/3: 383-409.
Zheka, Vitaliy. 2005. Corporate Governance, Ownership Structure and Corporate Efficiency: The Case of Ukraine, Managerial and Decision Economics 26/7: 451-460.

47
Appendix A. Direct foreign investment in Ukraine1
The cumulative volume of FDI as of
01.04.09 (USD billion)
% share as the ratio to
total TOTAL 36526.6 100.0 Cyprus 7890.2 21.6 Germany 6441.2 17.6 Netherlands 3378.6 9.2 Austria 2448.6 6.7 United Kingdom 2248.6 6.2 Russia 2135.5 5.8 USA 1400.3 3.8 British Virgin Islands 1348.0 3.7 Sweden 1259.9 3.4 France 1221.8 3.3
1Source: http://ukrstat.gov.ua/
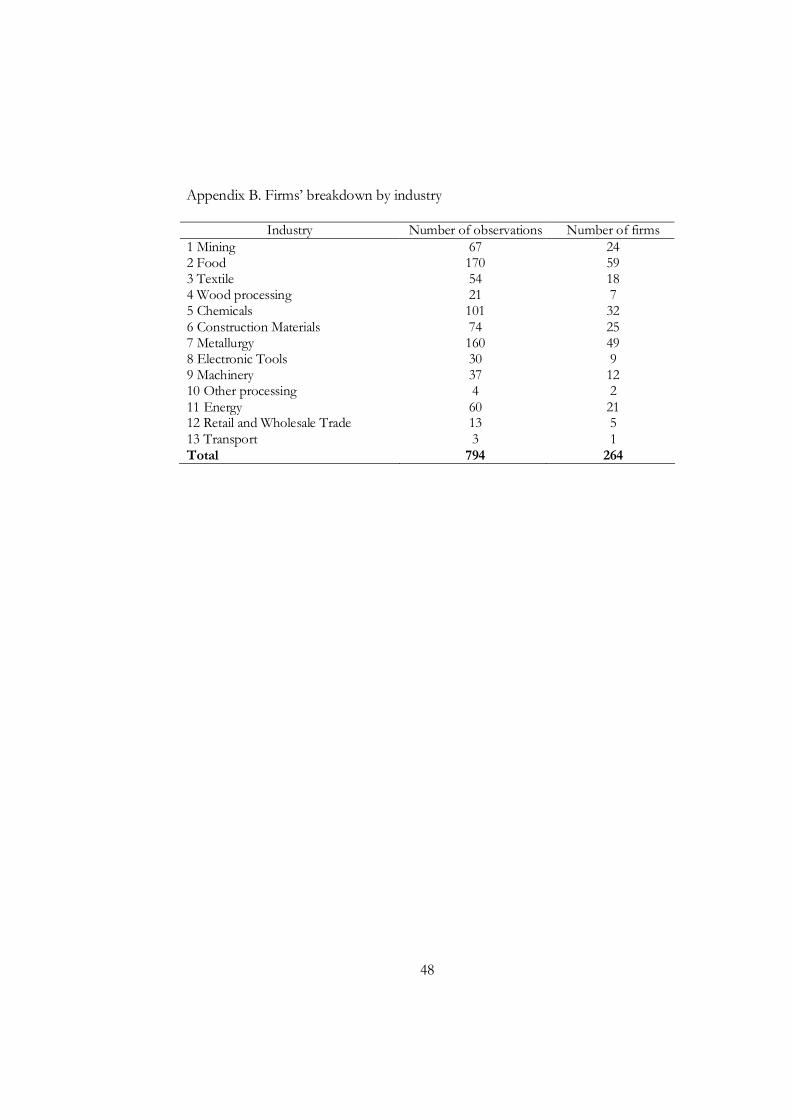
48
Appendix B. Firms’ breakdown by industry
Industry Number of observations Number of firms 1 Mining 67 24 2 Food 170 59 3 Textile 54 18 4 Wood processing 21 7 5 Chemicals 101 32 6 Construction Materials 74 25 7 Metallurgy 160 49 8 Electronic Tools 30 9 9 Machinery 37 12 10 Other processing 4 2 11 Energy 60 21 12 Retail and Wholesale Trade 13 5 13 Transport 3 1 Total 794 264

49
Appendix C: Firms’ breakdown by region
Region Number of observations Number of firms 1 Cherkaska 21 7 2 Chernigivska 23 7 3 Chernivetska 6 2 4 Crimea 22 8 5 Donetska 88 26 6 Dnipropetrovska 85 29 7 Ivano-Frankivska 7 3 8 Kharkivska 29 9 9 Khersonska 9 3 10 Khmelnytska 11 4 11 Kirovogradska 10 4 12 Kyiv 72 18 13 Kyivska 39 14 14 Lvivska 42 16 15 Luganska 38 12 16 Mykolaivska 4 2 17 Odeska 34 11 18 Poltavska 24 7 19 Rivnenska 31 10 20 Sevastopol 3 1 21 Sumska 20 8 22 Ternopilska 4 2 23 Vinnytska 30 11 24Volynska 16 5 25 Zakarpatska 26 8 26 Zaporizka 68 25 27 Zhytomyrska 32 12 Total 794 264

50
Appendix D. Percentage shares of foreign ownership in the sample of Ukrainian
companies
Country Mean Standard deviation
Number of observations
Number of firms
1 Austria 45.919 36.813 22 9 2 Bahamas 16.260 6.088 18 8 3 Belgium 24.000 0.000 2 1 4 Belize 21.880 11.156 23 13 5 British Virgin Islands 24.758 23.877 105 54 6 Bulgaria 45.398 30.523 5 1 7 Canada 47.350 . 1 1 8 Cyprus 39.879 27.716 219 99 9 Czech Republic 43.273 28.567 21 8 10 Denmark 75.070 0.000 4 1 11 Estonia 46.944 22.878 4 2 12 France 62.484 30.214 7 4 13 Germany 62.310 34.045 36 12 14 Gibraltar 26.704 21.072 10 4 15Greece 33.212 6.996 5 1 16 Hungary 37.633 18.470 20 7 17 Isle of Man 20.495 9.984 18 8 18 Italy 26.609 0.000 2 1 19 Latvia 17.804 6.095 7 3 20 Liechtenstein 33.134 14.330 14 5 21 Lithuania 91.002 1.204 2 1 22 Luxembourg 9.000 0.000 2 1 23 Moldova 38.790 26.550 2 1 24 Netherlands 49.244 35.753 54 24 25 Norway 97.502 0.001 5 1 26 Panama 15.516 11.753 5 4 27 Poland 35.149 12.688 11 3 28 Russia 47.206 31.519 65 25 29 Saint Kitts and Nevis 22.339 10.152 9 6 30 Saint Vincent and Grenadines 14.710 7.739 4 3 31 Seychelles 12.499 0.000 2 1 32 Slovakia 52.844 35.075 9 2 33 Sweden 86.448 21.312 22 7 34 Switzerland 32.643 28.058 54 29 35 United Kingdom 31.024 20.905 117 54 36 USA 33.333 23.456 107 47 Total 48.176 29.559 794 264