Foreign investment in the UK - European Commission |...
56
33549 18/2/03 FOREIGN INVESTMENT IN THE UK* By Forrest Capie and Geoffrey Wood With Frank Sensenbrenner City University, London * Preliminary
Transcript of Foreign investment in the UK - European Commission |...

33549 18/2/03
FOREIGN INVESTMENT IN THE UK*
By
Forrest Capie and Geoffrey Wood
With
Frank Sensenbrenner
City University, London
* Preliminary

2
Contents
Introduction
Historical Overview
Approach to Analysis
Hypotheses
Previous Work
Investment in the UK
The Charts Discussed
Special Cases
Employment and Inward Investment
Vast Acceleration
Conclusion
Annex 1 Imperial Preference
Annex 2 Data in HMSO (1993)
Annex 3 Data in Young Hood and Hamil
Annex 4 The London Market and Inward Investment (by Frank Sensenbrenner)
Annex 5 The Motor Car Industry
Annex 6 The Case of Scotland
Bibliography
Charts
Tables
3
FOREIGN INVESTMENT IN THE UK
Introduction
In this paper we examine foreign investment in the UK – a perhaps puzzling, even paradoxical, issue
to explore, since the UK is itself, even before adjusting for the size of the British economy, one of
the world’s biggest overseas investors. This, we would conjecture, may go a long way to explain
what we find. But to go immediately to our conclusions would be distinctly premature. We start by
outlining the rest of the paper. In the first section we provide some historical background, setting
UK investment in a long-run context. Then we turn to some possible approaches to the analysis of
inward investment. Having laid these out, we follow that with some hypotheses based on them.
There is then a review of previous work on inward investment into the UK. Then we set out our
data, and, having discussed its limitations, test our hypotheses against it. Then we seek to draw some
conclusions.
Historical overview
In the two or three hundred years prior to 1800 the prevailing political and economic philosophy was
mercantilism. This means different things to different people at different times and in different
countries. But at is core was a concern with the centrality of the state and with state building. It was
generally believed that the best means of achieving that was by regulation. Regulation extended to
most, even all, parts of the economy and had particular implications for international trade and
payments. The result was that international trade was distorted and so were accompanying capital
movements.
Thus it was the advent of the reaction against this system in the nineteenth century that saw trade
increase hugely and capital flows grow at the same time. Britain was the leading industrial and
financial power in the nineteenth century and therefore played the major role. It was the world’s
largest economy and the greatest trader. From the middle of the century it began exporting capital on
an ever increasing scale. The period 1870 to 1914 was one of extraordinary flows. Britain was
consistently lending several per cent of its national income over these years, culminating in a rate of
around 10 per cent of national income in the few years immediately prior the First World War.

4
These capital flows began by going to Europe and then to further and further afield, to India, North
America, Latin America, Australasia and elsewhere. The capital flowed into all parts of the
infrastructure: ports, railroads, mining, and countless enterprises. It meant that by 1914 Britain was
a creditor on a vast scale, indeed on a scale never since equalled. In 1914 Britain held approximately
£4,000m in foreign assets, mostly portfolio but with quite a lot of direct. This was equal to roughly
twice National income at that point. By comparison Japan, the world’s biggest creditor of the late
twentieth century held foreign assets equal in value approximately to its national income – half the
size. Britain was responsible for almost half of all foreign lending in the late nineteenth and early
twentieth centuries.
Such capital for development purposes was eagerly sought and willingly given. But there were
always those who found fault, and a long-running criticism of the British economy is that it leant too
much abroad and so starved British enterprise of needed funds. Even Keynes in 1924 argued this
when he criticised the Colonial Act of 1900 for allowing certain British trusts to invest broad where
previously they had to invest in Britain.
In the interwar years Britain’s capacity to lend was damaged by its weak current account, and then
the Second World War saw the introduction of exchange controls, which were to last until 1979.
Furthermore, the Bretton Woods arrangement required and allowed capital controls and the period
from the end of the war until the 1970s was one of limited international capital movements. But as
exchange controls were lifted and floating exchange rates proliferated so capital began to flow again
and in the last two decades of the twentieth century these capital flows have been greater than ever.
The abolition of exchange controls in Britain in 1979 revived the opposition to capital flows and the
old arguments began to be heard again. There was by this time a clear political divide between the
Conservative Party which favoured open markets and the Labour Party which was opposed. Indeed
Labour talked in 1980 of re-introducing controls at the next election which they believed they would
win. In a pamphlet ( ) of the time the argument was made that: “since the removal of exchange
controls (1979) institutions have invested far too large a proportion of their funds abroad… The
City’s efforts have not therefore concentrated on the needs of the domestic economy” (p12). They
proposed, then, to prevent and reverse such flows through the establishment of a National Investment
Board which in turn would direct assets into British industry. Pension funds and unit trusts were the
main target and the idea was to cap the overseas content of their portfolios. The ambition was to
repatriate substantial capital which would then be channelled in to British industry.

5
On the other side Britain has also attracted large amounts of foreign investment and although still a
net creditor there is substantial foreign ownernship in Britain. We turn to an examination of the data
below but it is worth remarking here that there has been little evidence in Britain of any public
disquiet over the growing extent of foreign ownership. Similarly, in the United States in the
nineteenth century when there was quite extensive British ownership of assets there appears to have
been little concern – in spite of the antagonism that affected both countries in the late eighteenth and
early nineteenth centuries. However, in the second half of the twentieth century when the US again
became a substantial debtor and Japanese ownership was prominent there did seem to be some public
concern.
Approach to Analysis
When John Stuart Mill called his book on economics, “The principles of Political Economy”, he was,
and one can be absolutely sure this was conscious, using words deriving from classical Greek to
signify that he was dealing with the economy, the management of resources, of a national rather than
of a family. The modern usage of political economy, at least among economists, differs from that.
Economists now try to analyse systematically the effect policy has on the economy; and they do this
not in the once-traditional framework of neo-classical welfare economics, where politicians are
viewed as benevolent, sometimes even omniscient, social planners, but rather in a framework where
policy makers are self interested, responding to political incentives. They are treated, in other words,
just like other economic actors, except that they respond to a different, or sometimes additional, set
of incentives.
The approach has been fairly extensively applied to the analysis of macroeconomic policymaking. It
is one of the ways (although far from the only way) by which it is argued that macroeconomic policy
should be guided by rules, rather than discretion; or that it should be delegated to some body not
affected by the desire to win elections. A case for central bank “independence”1 can be constructed
by this means. But the approach can also be applied elsewhere.
It has been used to help understand why financial regulation often creates problems and stifles
innovation. It can help understand why and when financial regulation will change. This it does by
exposing which groups are benefiting from a particular regulatory framework, and what might
1 See Capie, Mills, and Wood (1993) for discussion of the various meanings of independence in this context.

6
change the balance of forces against them so that new groups can change regulation in order to
capture its benefits for themselves. Thirdly, it can explore how regulation can protect particular
constituencies via its economic effects. The approach when thus applied sees laws and economic
outcomes as jointly determined by politics.
Examples of such applications can be drawn from the study of banking, of corporate control and
corporate governance, and of securities markets. Kroszner and Strachan (1999) analyse changes in
banking regulation in the USA, showing how the timing of branching deregulation was determined
by the relative strengths of the affected interest groups. Roe (1999) maintains that the differences in
corporate governance between the USA and Continental Europe reflect the “social democratic”
political framework of most of continental Europe. Studies (eg Holmsrain and Koplan, 2001) have
shown how workers and managers can unite to protect incumbents and to restrict the market for
corporate control. Rajan and Zingales (2001) explain the erratic, advancing and retreating,
development of securities markets. They suggest that incumbent firms seek to restrict such
development as new entrants need access to capital market while incumbents already have a stream
of profits. But as free trade opens up goods markets, this not only diminishes the influence of the
incumbents but increases the likelihood that they too, will wish access to new sources of capital.
Hence is explained the common relationship between changes in financial market regulation and free
trade.
Despite these examples, it cannot be denied that “new political economy” explanations are hard to
test. This is because they endogenise institutional factors that were previously taken as given,
reducing the set of predictions the models can produce. Further, it can be hard to separate
ideological from economic determinants of political choices. (Some, indeed, argue that ideology is
ultimately economically determined.) Nevertheless, as the approach has proved fruitful in some
areas related to the work being done here, we seek to apply it to the present issue.
Hypotheses
Before setting out our hypotheses, we would note that the “new political economy” or “public
choice” approach has found much more favour in the USA than it has in the UK. Economists and
analysts in the former country are much more willing to accept, until shown otherwise by the
evidence, that politicians and officials are guided by utility maximisation in their public decisions

7
just as they are in their private ones. We would suggest that the reason for this lies in the different
nature of the governmental institutions in the two countries.
Although this is changing a little under Britain’s present government, the British civil service at
every level traditionally sought resolutely to be apolitical. It did try to carry out what elected
politicians wished; but a part of its duty was to encourage caution, to think of an ill-defined but
valuable concept of “the national interest”. There are also institutions (the office of the Auditor
General, for example) with the explicit role of supervising expenditure so that value for money is
obtained, and also ensuring that tax payers’ funds are spent neither on party-political purposes nor on
ways designed to benefit a member or members of that party.
Although unlikely to be infallible these limitations have tended to constrain partisan, as opposed to
political, actions.
With that qualification in mind, can the “new political economy” identify groups or parties that
might be opposed to, or alternatively favour, inward investment into the UK? What conjectives can
be offered?
One can consider the following groups as having an interest: the Conservative, Labour and Liberal
parties (the three main parties – in alphabetical order); trade unions, employers’ organisations, local
governments, and companies that wish simply to sell themselves to the highest bidder.
Unfortunately, when one makes that division what emerges is that the groups have either internally
conflicting interests in this matter, or a clear-cut interest but little influence. To see this, consider the
groups in the above order. First the Conservative Party. The trouble with this party (in the present
context) is that it has no consistent views on what might broadly be termed international economic
policy. The views have of course varied within the party – all political parties in Britain are implicit
coalitions; and they have varied through time. It was, for example, at one time the party of
“Imperial Preference”. (See Annex I for details on this.) But at other times it was close to being a
party of “Manchester Liberals” (a 19th century group which favoured free trade and light if any
regulation markets).

8
Within our data period that latter phase coincides broadly speaking with the period when
Margaret Thatcher was Prime Minister; so one hypothesis we explore is that inward investment was
likely to be unusually high in those years.
What of the Labour Party? Here, too, there has been some inconsistency. It was for many years the
party of state control regulation, of protection of workers. But quiet often that did not differ, in this
respect, much from the “paternalistic” phase of the conservative party – its early post-war years in
particular. We would expect the two parties to differ significantly in the “Thatcher years”; but not
really at other times. Again, reflection suggests that trade unions and employers’ organisation would
not differ a great deal; both, albeit perhaps for different reasons, would prefer local (ie domestic)
ownership of industry. But both would also prefer that firms continue to be active than that they
close down. Unions would like it because it creates employment; employers’ organisations because
one firm’s activities creates business for other firms. (This last point emerges when we touch,
below, on developments in the British motor industry.)
And finally in the interest groups we come to local authorities and firms that are up for sale. These
groups have a clearly identifiable interest. Both want more inward investment, the latter for obvious
and straightforward commercial reasons, the former because more employment brings prosperity
(and popularity for incumbent politicians) and an expanded tax base. So the interest is clear; but so,
too, is the lack of influence. There can be persuasion and lobbying from the groups, but that is all.
Further, there is no reason to expect these motives or the power behind them to vary our time; so we
do not expect much discernible influence on overseas investment from these bodies.
Summarising on interest groups, then, we would expect the Thatcher years to stand out with regard
to inward investment; but no other influence is likely to be notable.
This does not mean that we do not expect politics, broadly defined to matter. Tax rates, for
example, may well be important. But that is to go beyond the domain of “pressure group politics”.
Previous Work
This is a useful point briefly to review previous work on foreign investment in the UK. A notable
feature of this work is how sparse and fragmentary it is – again a pointer to our conclusion. There

9
are only four notable studies. These are HMSO (1983), Stopford and Dunning (1983) Stopford and
Turner (1985) and Young, Hood and Hamil (1988).
The first of these (which was written largely by Hood and Young) focuses on investment by
multinationals in what were that termed “assisted areas” – that is to say, areas in which there was
government encouragement to foreign investors. It is thus a source for information on a particular
kind of foreign investment; although it does not give the total of foreign investment into the UK.
Appendix three lists that data that volume provides. As will be seen, there is a considerable amount
of detail but not always the detail one would wish. We do not discuss this volume beyond referring
to its data; but we would note that its line with regard to multinational investment, when it is critical,
it is critical that there had not been enough of what was, from the point of view of raising both
employment and labour productivity, a good thing. Stopford and Dunning’s work is a part of their
study of multinationals; so it allows comparisons on inward investment in various countries, and of
the kinds of activities the inward investment has been in. But that is as far as it takes us; we do not
refer to it further. The volume by Stopford and Turner is mainly an analysis of the effects
multinationals have had on the British economy, but in its introductory chapter some data on the
extent of overseas investment in the UK are presented. Finally, Young, Hood and Hamil provide a
variety of snapshots of data. Annex three lists their data.
Examination of these Annexes will reveal how fragmentary the data of those early studies were, and
how they are of little use in revealing trends in the data. Be that as it may, however, what general
conclusions did these volumes reach?

10
(i) Stopford and Turner
Like Young et al, this study focuses on multinational firms; but it is concerned more with the firms
and less with the British economy. It addresses such topics as why firms become multinational, the
role of US firms, and the responses of British firms. There is, however, a broader perspective in
three chapters; two look at the impact on the economy; one at political attitudes. Looking first at
employment, they find that there is little evidence that foreign-controlled jobs are ‘more unstable’
than domestically controlled ones. When employment in a sector has declined, the decline has
usually been more in domestic firms. They also very cogently observe (pp 167) the following.
“The removal of exchange controls in 1979 rekindled a debate that had been discussed for decades:
is outward direct investment beneficial or damaging to the health of the economy? Precisely the
same question is asked about inward investment. Were clear answers available, the matter would
have been settled long ago.”
For example, in assessing the effects on trade, it has proved almost impossible to disentangle the
effects of investment from those of openness. Even the Reddaway Report (1968) on British
investment overseas, made progress by assuming that without investment the trade would have been
lost to the UK. Subsequent work indicated that the two go together, but have had little success in
establishing causation or answering counterfactuals.
Answers for employment seem clearer. For example, the following tables supports. Yuong et al’s
conclusion on employment – multinationals provide relatively stable jobs.
1983 Employment
(000 jobs)
Job loss (gain)
1972-83
(000 jobs)
Change %
1972-83
Foreign .Controlled 860 (80) +10
58 UK multinationals 1,336 623 -32
UK .domestic. 3,343 1,558 -32
What did they think the political implications were? Attitudes they describe as being uncoordinated
but broadly supportive. Even when there were restrictions on foreign ownership, they are less
restrictive than elsewhere. There was concern about foreign ownership of major financial
institutions. (We discuss in a separate section developments in the financial sector.) But inward

11
investment was uncontroversial. An interesting item of evidence cited was referrals to the
monopolies and mergers commission. 2.2% of acquisitions by foreign companies were referred to
the Monopolies and Mergers Commission between 1978 and 1981, as opposed to 1.6% of
acquisitions by foreign companies.
Young, Hood, and Hamil
The aim of this study was “.. to examine the impact of multinational companies on the British
economy, and the British Government’s policy responses.” The period covered was the late 1980s.
The authors’ starting point was the British economy’s decline in relation to… its principle
competitors”. Ignoring the economic illiteracy of the use of the term “competitors” in this context,
what questions did these authors ask, how did they seek for answers and what answers did they find?
They saw Britain’s “decline” as due to the decline of its manufacturing industry, and to the extent
this occurred to ask how inward investment (by “foreign multinationals”) could reverse this
manufacturing decline.
Within this intellectual framework there had already been some previous work. One was by a House
of Lords Select Committee on Overseas Trade (1985). This expressed four main points.
(1) There would not be sufficient inward investment to “… sustain a permanent deficit in
manufacturing.”
(2) “Many British firms had much to learn from foreign practices in the drive to be competitive…”
(3) There was concern over the high import content of goods produced by foreign companies.
(4) Government should focus less on the “jobs creating aspects of foreign investment, and more on
“the level of manufacturing and value added”.
Further, possibly inconsistently with their desire for British companies to learn from foreign ones,
they should be careful about encouraging the input of “foreign R&D” as it might discourage
“development of new technologies” by British firms.
The study by Young et al really reflected these varied and sometimes conflicting concerns, and it
shared the mercantilist view point under which nations were seen as “competing” in international
trade. What kind of firms would come to Britain? Would they use the most sophisticated

12
technology in their foreign subsidiaries? Would these technologies somehow “transfer” to domestic
firms? How should the UK adapt to provide the skilled workers needed by these firms?
The desire to import new technology was of course not confined to Britain. In the 1950s and 1960s,
multinational investment was on these grounds generally welcomed. (Dunning, 1974) . But in the
1970s, concerns emerged over ownership of raw materials and the dominance of multinationals in
the high technology sectors.
By the 1980s opinion seemed to have shifted back to a middle ground. Young et al (op. cit) ascribe
this change in part to the recession of the time leading to political focus on reviving employment.
Further by the 1980s the UK was still a bigger overseas investor than recipient of foreign investment
– by a two-to-one ratio by value (Stopford and Dunning (1883)).
Inward investment had been in decline as a share of total (ie World wide) investment by
multinationals. What characteristics did these multinational investors in Britain have? They were,
unsurprisingly, important firms. They employed more workers on average than did British firms.
They were more productive in terms of output per head, (by between 17 and 30%) and they paid
higher average wages (by 15%).
What impact did these firms have? Even before the Thatcher government, British governments, of
either party, had adopted a “laisser faire” attitude to foreign investment in the UK. There were
attempts to encourage domestic firms, but these were notable for their very limited number. The
main examples were the support for Rover (car manufacturing); for Immos (computer chips) the
British National Oil Corporation and Britoil (to exploit North Sea oil); and the limitations on foreign
share ownership in some privatisations.
Despite concerns about poor UK technology, the technology transfer from investment was not great.
The investment had a bias to technology intensive sectors; but of course that did not bring much
transfer. There was encouragement to locate R&D in the UK. But the resulting pattern seemed to
reflect world-wide trends – for example, the tendency to concentrate R&D in a few locations by
pharmaceutical firms – rather than either UK efforts or the lack of them.
Similarly, while in a few sectors multinationals seemed to become dominant, concentration was not
greatly affected by their presence, and no evidence was advanced that competition was affected. No

13
evidence of their having greater success than domestic firms at creating barriers to entry has
emerged.2
The employment effects were not notable even in areas of high unemployment. But the impact of
employment practices was more widespread. Those firms are credited with encouraging if not
introducing reduced union power, more firm as opposed to industry wage bargaining, the decline of
unionisation, more emphasis on communication with employees, and more stringent recruitment
procedures.
Broadly speaking, the effects of investment were seen as sometimes hard to measure, but in broad
terms beneficial. It created employment, helped raise productivity modernised work practices, and
certainly did not reduce the R&D carried on in Britain.
Detailed studies of employment in deprived areas confirmed the overall view that the impact was
favourable. Most studies of this examined the effects of the incentives given to come to these areas
and create jobs. The verdict was distinctly downbeat. Firms came to secure market access, to
diversify production locations, and at times when the exchange rate made the move look good. Once
firms had decided to come to the UK, taxpayer – provided financial assistance was of some
relevance to determining location; but even then, the availability of the right kind and quality of
labour was more important. (M Breck and M Sharp, 1984.) Interestingly, a point supported by our
data for a later period, 1984 changes in subsidies (reducing them, and imposing a “cost for jobs”
limit) had no effect. But although foreign investment had a favourable effect on employment,
productivity, and overall prosperity in areas of high unemployment, the fear was expressed (by
Young et al) that the firms operated in “an antiseptic work environs”. They did not interact with
local firms. That concern was, however, based on a study of the electronics industry in Scotland;
that may well have been a special case.
The conclusion of the study of the effect of investment in the UK by foreign multinationals was that
it was, in every dimension, modest but beneficial. Not surprising, then, that both policy and attitude
have been benign neglect, but to this we turn subsequently.
2 Their effects on the balance of trade were thought to be ‘favourable’.

14
Investment in the UK
Having reviewed the burst of work on FDI in the UK which was focussed on multinationals, we turn
now to reviewing a long run of data. Once that has been set out and discussed, we turn to a series of
special issues, including some unique to the UK, before drawing some conclusions.
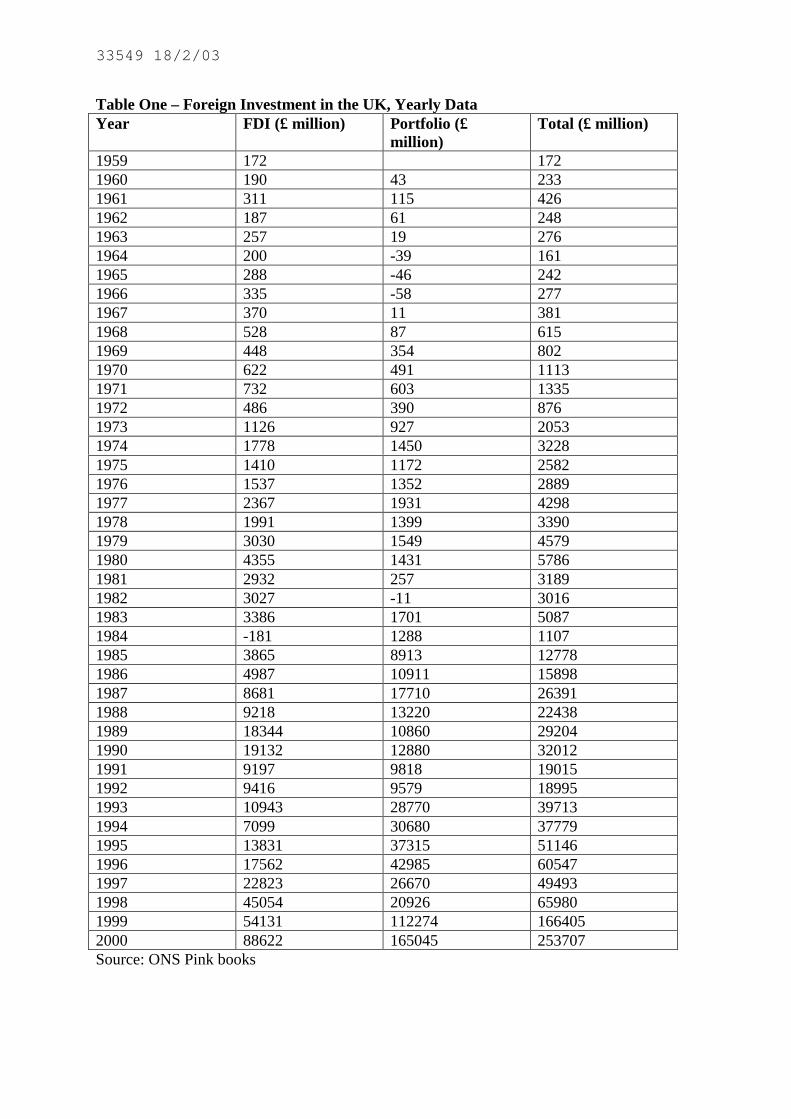
Our data are presented in the text via a series of charts; the underlying data are in tables in the
appendix.
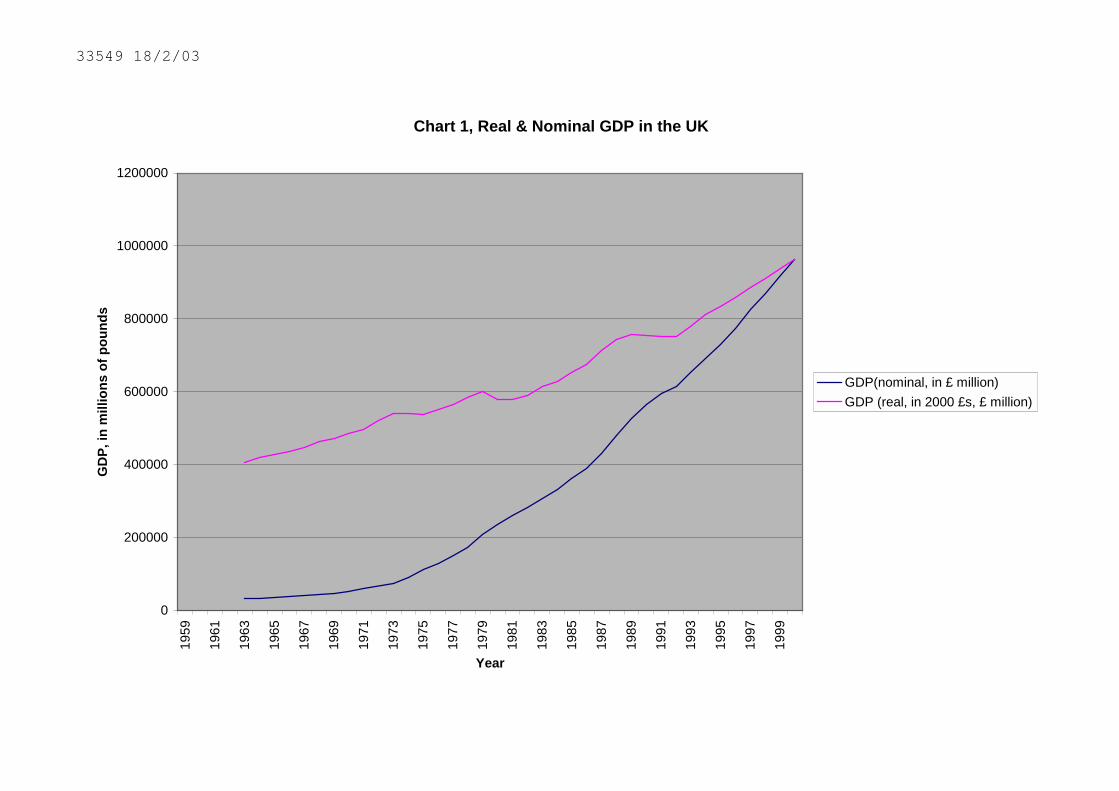
For the record, Chart 1 shows real and nominal GDP. Chart 2 plots the UK inflation rate, Chart 3
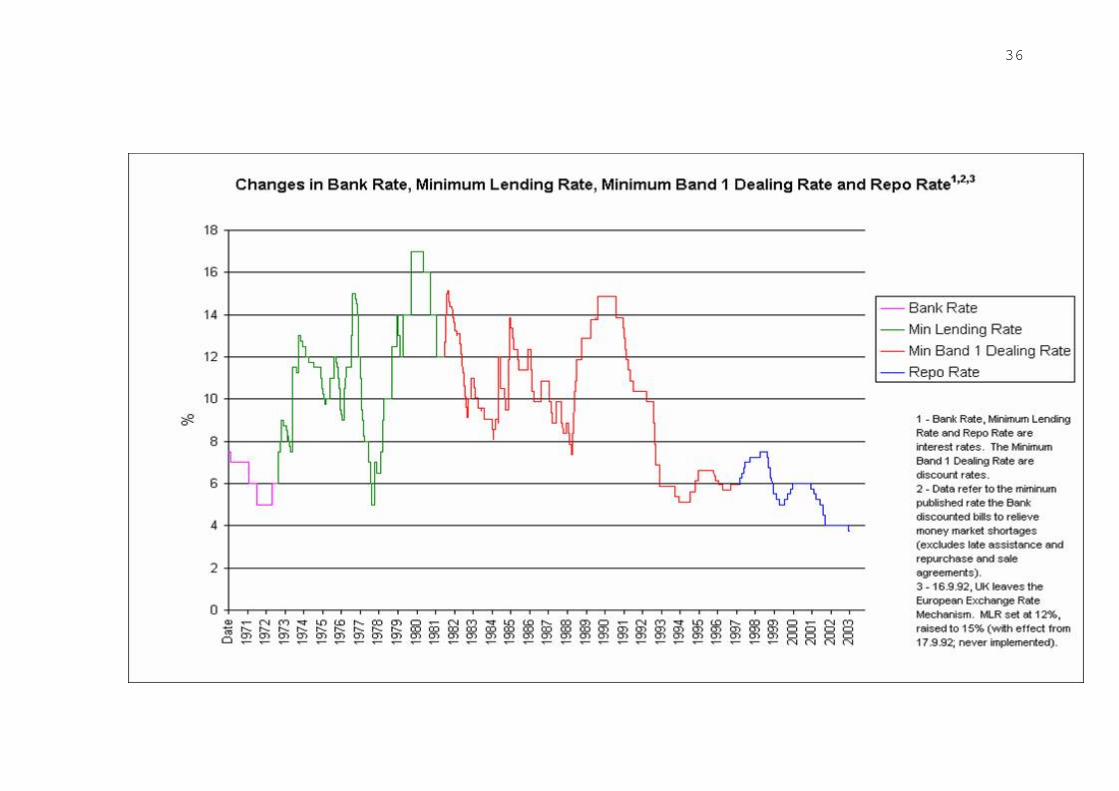
the £ exchange rate (in three series: £/US$; £/DM linked to £/€; and the effective rate. Chart 4
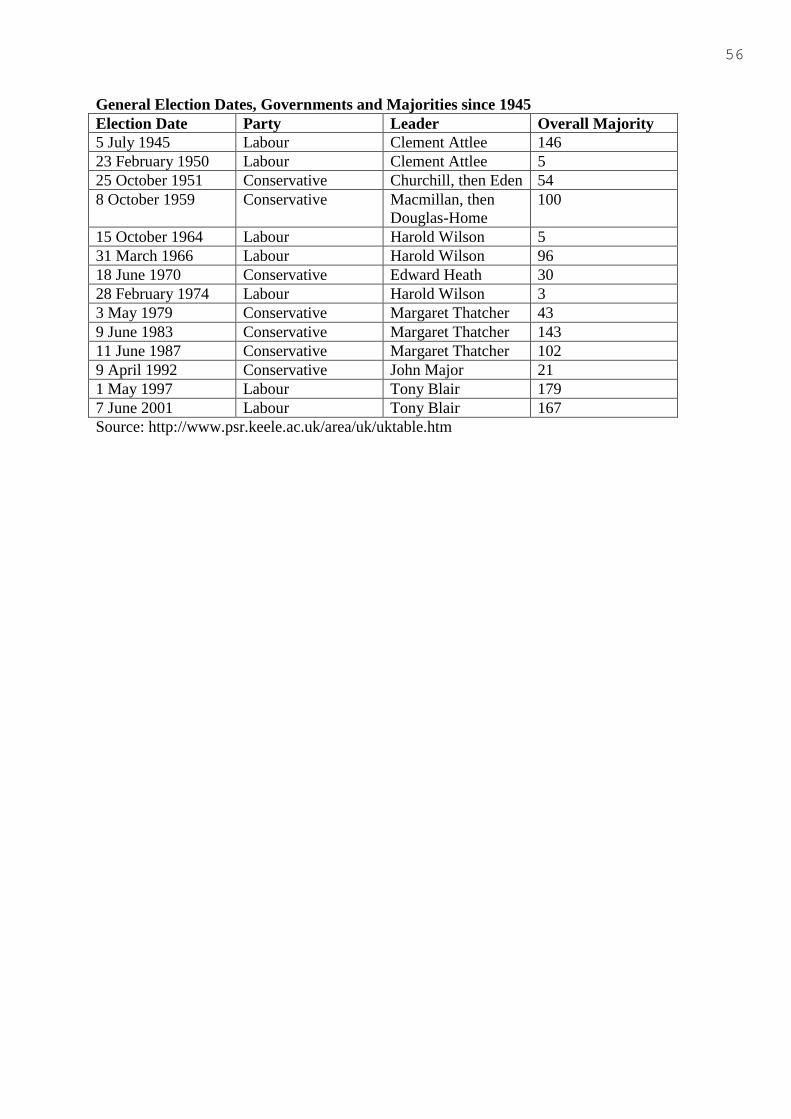
plots a short term and a long-term interest rate. We also report at this point which party was in
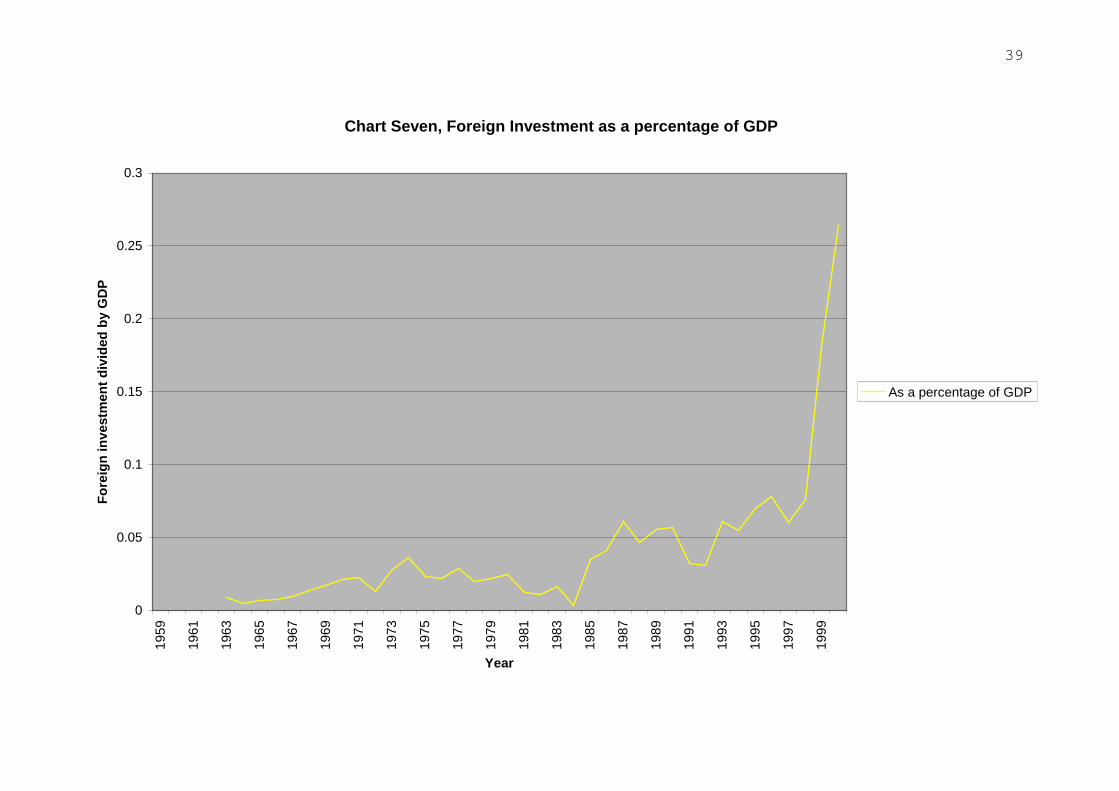
government, and the size of its overall majority (Chart 5). The next two charts are total foreign
investment in the UK; chart 6 contains a nominal and a deflated series and chart 7 a series showing
the ratio to GDP. One immediately notices the truly remarkable surge at the end of the period. This
is not an error, but rather a reflection of a particular aspect of the UK economy; this is discussed
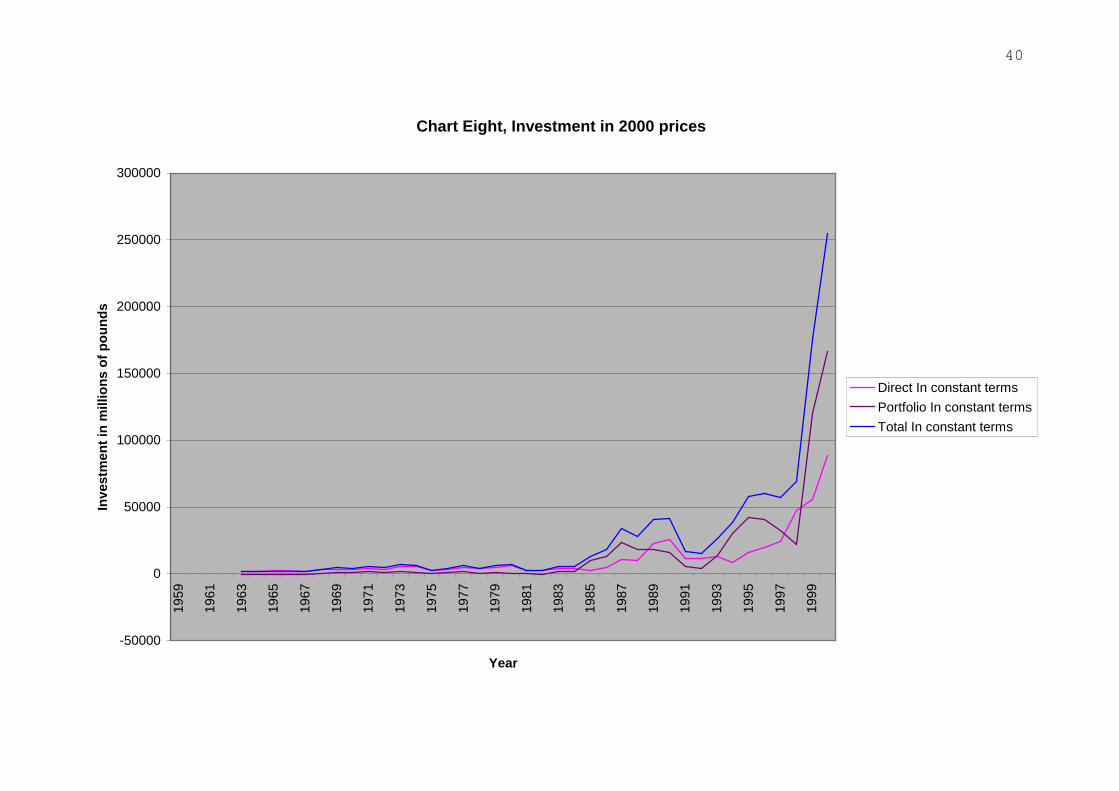
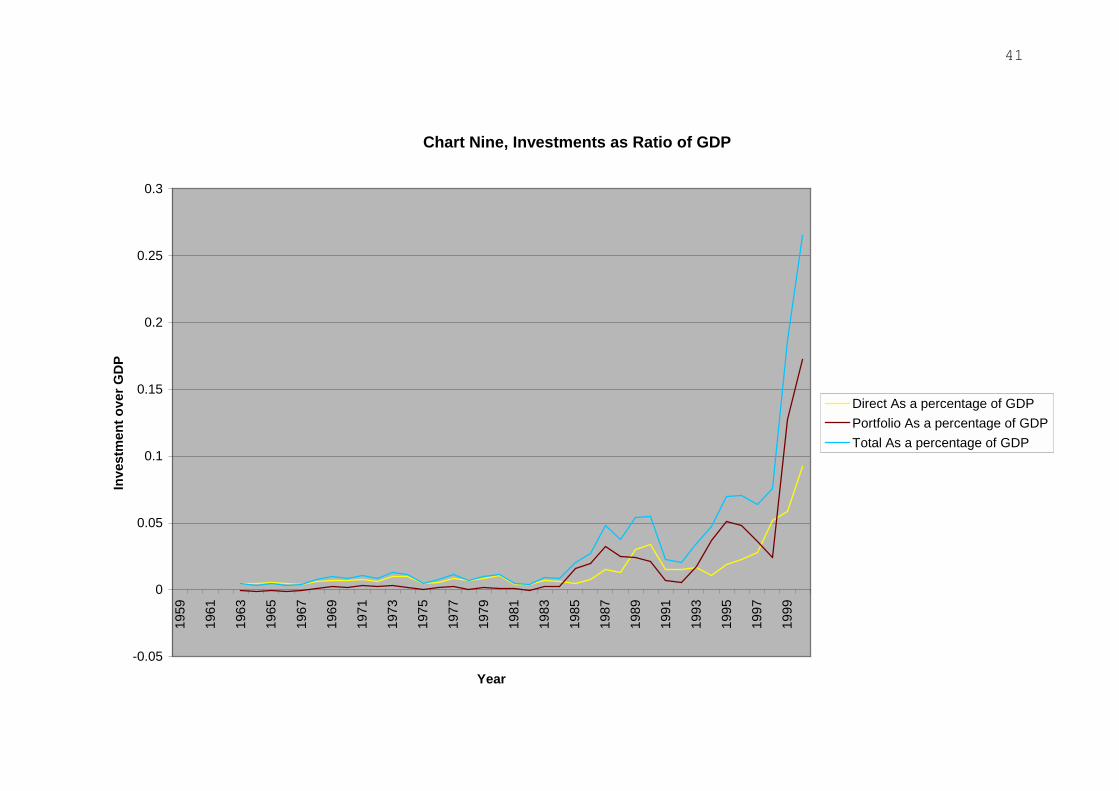
subsequently. We then show various breakdowns of foreign investment. Charts 8 and 9 show the
breakdown between direct and portfolio investment, in real terms and as a ratio to GDP respectively.
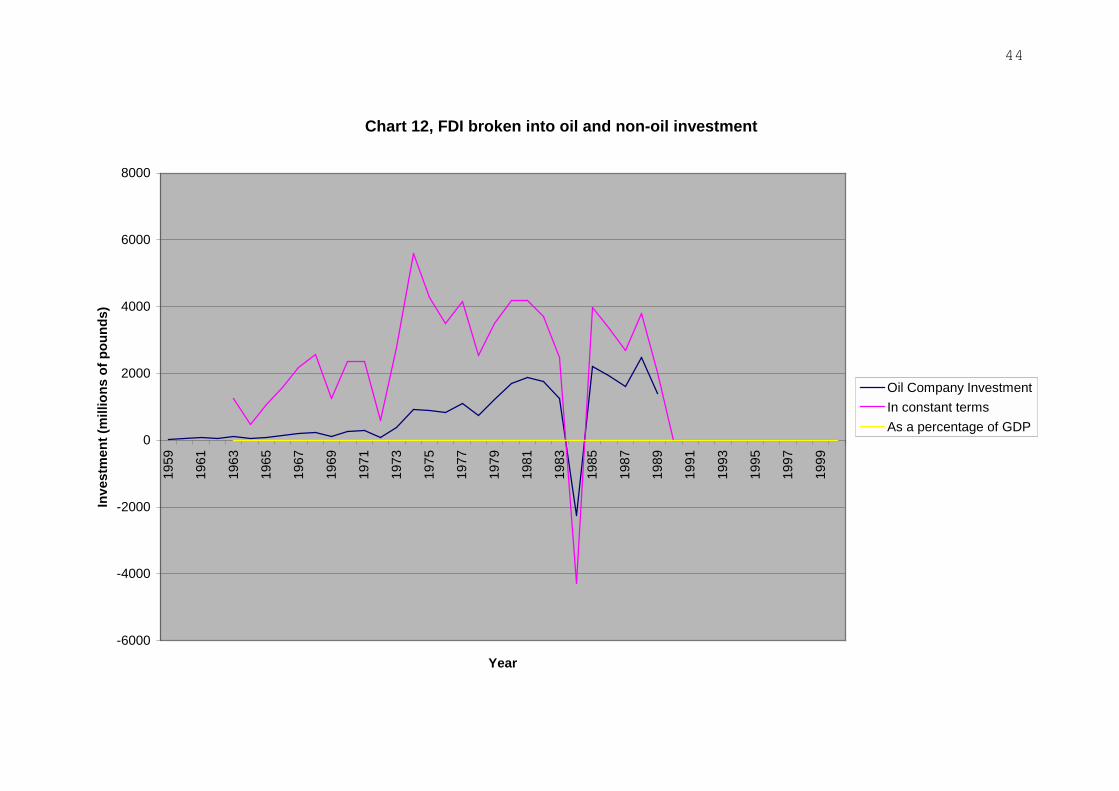
Chart 10, the first to reflect a noteworthy aspect of the UK economy, shows investment by oil
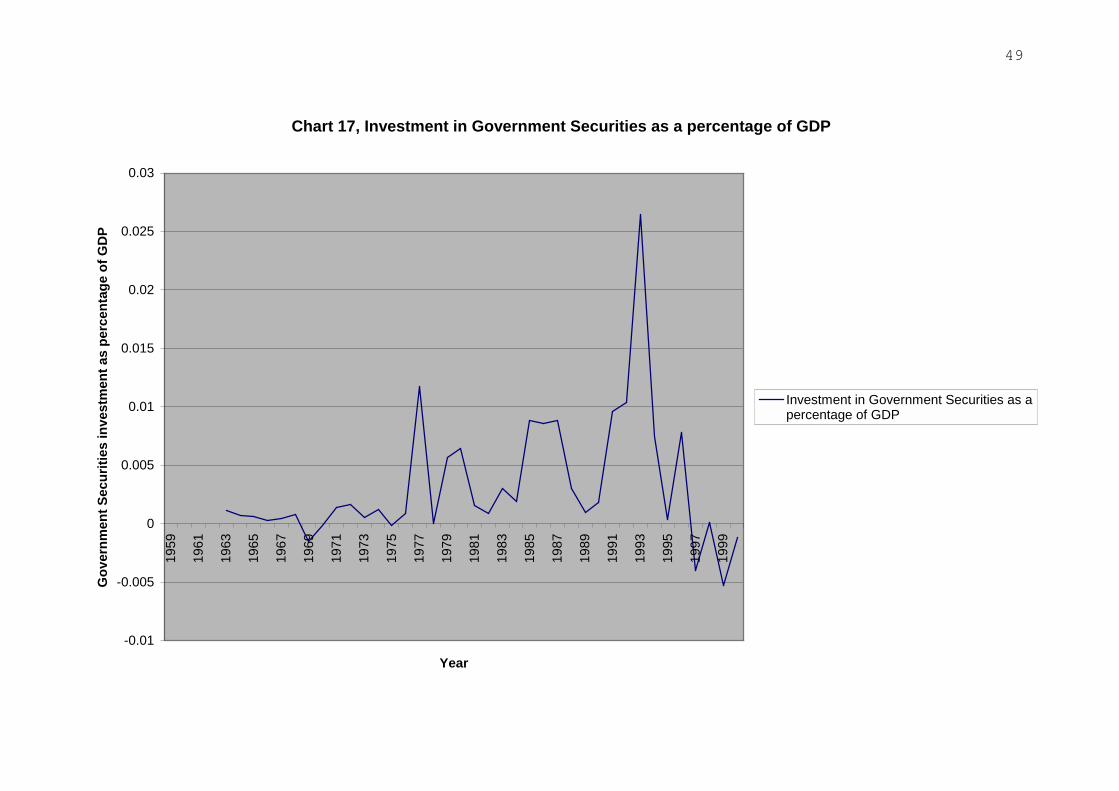
companies. Chart 11 shows, for interest, investment in government securities. Chart 12 shows total
FDI broken down into oil and non-oil, and Chart 13 shows total portfolio investment. Chart 14
shows FDI and portfolio investment together. Charts 15-19 show the same series relation to GDP.
The similarly numbered tables in the appendix show the underlying data.
Before discussing these charts, some definitions are necessary. The first two are of direct and
portfolio investment.
The definitions below are quotations from the “Pink Book”; the quotations are from the glossary to
the 2002 edition.
Direct Investment – Net investment by UK/foreign companies in their foreign/UK branches,subsidiaries, or associated companies. A direct investment in a company means that the investor hasa significant influence on the operations of the company. Investment covers not only acquisition of

15
fixed assets, stock building and stock appreciation, but also other financial transactions such asadditions to or payments of, working capital, other loans and trade credit, and acquisitions ofsecurities. Estimates of investment flows allow for depreciation in any undistributed profits. Fundsraised by the subsidiary or associate company in the economy in which it operates are excluded asthey are locally raised and not sourced from the parent company.
Portfolio Investment – Investment inequity and debt securities issued by foreign registeredcompanies, other than that classed as direct investment, and in equity and debt securities issued byforeign governments. A portfolio investment, unlike a direct investment, does not entitle the investorto any significant influence over the operations of the company or institution and represent less than10% of the equity capital.
A second key issue is how to “scale” the series. Very obviously, in a country such as the UK, which
has had high and variable inflation in part of our data set, nominal values can be misleading. This
would suggest deflation by the measure of the general price level; and we report the series thus
deflated. But this is not our preferred transformation of the series; for there seems to us to be three
problems with it. First, is any one of the deflators appropriate when we are concerned with
investment goods alone? Secondly, are non-UK companies concerned with the real sterling value of
their investment, or rather perhaps the real value of their investment in their home currency? Either
is arguable. Third, and most important, it seems to us that a more appropriate approach to scaling the
variables is available. This is to deflate the nominal investment series by nominal GDP. This is in
our view more appropriate because, insofar as the main focus of the study is attitudes to foreign
investment, there are surely likely to be affected not by the “real” value, however measured, of such
investment, but rather its size relative to a measure of national income. That usually is therefore the
series on which we focus attention.
It should of course be noted that the choice of scaling variable is not very important in affecting the
course of the series in the present data set; but it could well be either for the UK in the future, or for
other countries.
The Charts Discussed
We now briefly discuss the charts, before turning to comment, interpretation, special cases, and some
slightly novel data.
The levels shown of course all just rise; the nominal series (regrettably) rising significantly faster at
times. Chart II shows the variability of the UK inflation rate in part of our data set, and Chart III
shows the considerable fluctuations the UK exchange rate has gone through. The interest rate charts

16
show the behaviour of a short rate (essentially determined by the monetary policy-maker) and a long
rate (determined essentially by expectations of inflation in its larger movements).3 We then show
the behaviour of direct and portfolio investment (as defined above) into the UK; we stress again that
the remarkable surge is not a data error. And our final charts simply scale the series; the remarkable
surge remains.
The first thing to remark is how little there is to remark; the series “bounce around”, so to speak, and
not very vigorously, until the mid 1980s. They then start to rise rapidly.
At this point, we should look at our table of governments. For the first, and most obvious,
hypothesis is that a climate of hostile governments deterred foreign investment. As is clear, and
most notably when one bears in mind our comment on the economic philosophy of Mrs Thatcher’s
government, that does not seem to fit the facts at all. One might conjecture that multinationals
waited to see if the changes she introduced lasted, and thus say the political hypothesis holds with a
time lag. Maybe it does. But at least until there is another change in political climate, the hypothesis
thus amended is not refutable, and is therefore of very limited interest.
Moving on from that we can come to ‘economic’ determinants. First, recollect that restrictions on
support for inward investment were imposed shortly before the big surge in such investment. This
certainly does not show that incentives do not matter; but rather it says that other things matter
more. Does the exchange rate regime matter? It is certainly the conventional wisdom that pegged,
or even fixed, exchange rates encourage international trade, and also international investment.
But although that is the conventional wisdom, a good body of evidence is inconsistent with it.
Bailey, Tavlas, and Ullan (1986) find it does not fit US data; Mills and Wood (1993) find it
inconsistent with a long run of UK data; and Carse, Williamson and Wood (1980), by examining the
microfoundations of trade, suggest reasons for exchange rate volatility not mattering a great deal.
The work of Frankel and Rose (1979) seems inconsistent with that; but several authors have
suggested their results were a special case, produced by a wide variety of factors and not just
exchange rate regime change.
How well does the conventional wisdom fit the present data set? A reasonable answer would be ‘not
at all’. In deed, it is surely rejected by it. Inward investment rises after the abandoning of fixed
3 See for evidence on this.

17
exchange rates, and even further after Britain’s departure from the ERM. One could strain, and
argue that foreign investors are forward looking, and expecting EMU entry. But this would be hard
to reconcile with the caution one must ascribe to them if their behaviour is to be consistent with
political regime.
Similarly (and unsurprisingly) neither short term interest rates nor long term rates seem to matter.
Indeed, apparently perversely but we shall suggest later not, the lower are these rates the more
attractive has Britain been to foreign investment.
Again similarly, economic fluctuations do not seem to matter in the simple sense of booms
encouraging and slumps discouraging inward investment.
There is, however, a more complex hypothesis that can be advanced relating FDI to economic
variables. This relates it not to fluctuations in any one series or set of series, but rather to what might
be termed the ‘economic climate’.
Note that the lower level, and greater stability, of both long term and short term interest rates was
associated with a move first towards and then actually arriving at an institutional framework which
underpinned low and stable inflation. This move was started by Conservative Chancellor Norman
Lamont, in a search for some monetary anchor after Britain left the ERM; and was completed by
Labour Chancellor Gordon Brown when he gave the Bank of England ‘operational independence’ to
achieve an inflation target as his first action on taking office. That same period coincided with a
sustained boom in the real economy. Further, and not apparent in the charts, there is some evidence
of an upward change in the UK’s trend growth rate in the early 1980s, (eg Mills and Wood). When
we add to this that unemployment fell steadily from Britain’s leaving the ERM until the time of
writing (early 2003), it seems reasonable to say that the economic climate in Britain became more
stable, and not only stable but benignly so, from the early 1980s. This may well be seen as a
contributing factor to the increase in FDI.
A further factor to note is the change in exchange control restrictions. These were first suspended,
by Mrs Thatcher’s first chancellor of the exchequer, (then Sir Geoffrey Howe, now Lord Howe) and
then abolished. This surely contributed to a feeling that Britain was becoming economically more
liberal, more open to the world economy – that it was moving back to the kind of situation, described
at the beginning of this paper, which had prevailed when Britain was the major overseas investor.

18
This ‘ climate of opinion’ explanation is very relevant when considering attitudes to investment from
overseas. But before we reach these, there are two special industrial cases to consider, and some data
on jobs to examine.
Finally in this section, what was the impact of tax? Again, it is hard to see any. Of course when
companies are setting up, effective tax rates will vary from company to company. But the period in
the first half of the 1970s, when individual tax rates reached 98% and companies were being taxed
on nominal profits when inflation was high, with the effect that the companies were being steadily
squeezed of capital, did not affect inflows.
Special Cases
(a) Motor Cars
Britain was one of the countries in which motor car production was pioneered; and for some years,
especially in the 1930s, mass-production as well as specialist production flourished. The industry
then went into a long, initially relative and slow but later accelerating, decline. The British
government tempted Chrysler to Scotland; that factory did not prosper. The government promoted
amalgamations among the traditional mass manufacturers. That did not prosper, and nor did the
specialist firms which were merged in the group. Nothing seemed to work – not industrial relations,
not design, and not very reliably the cars themselves.
There is now a thriving motor car industry in Britain once again, and it is largely due to foreign
investment that this has come about. Reactions, however, were both curious and mixed. The curious
aspect is that there should seem to be different attitudes to two different kinds of foreign investment.
When Japanese companies arrived either to set up their own factories (Toyota and Nissan) or
originally in partnership with existing firms (Honda’s chosen route) the reaction was a welcoming
one. They seemed to be about to bring prosperity to areas of high unemployment; and, indeed, so
they did. But that was not the only kind of foreign investment. Other manufacturers tried to save
struggling British car manufacturers. This, couriously, seemed to arouse, not everywhere, but
certainly to an extent, a measure of hostility. The workforces were somewhat resistent; occasionally
the press displayed a little chauvinism. But these companies ended up in foreign hands with the
19
exception of Rover; and the chauvinism has died down, just as the cars they produced, even under
traditional British names, were praised.
We do not go further into the details of the decline and recovery of motor car production in the UK,
for that would take us beyond our brief. (Details can be found in, for example ). What
is interesting about the episode from our point of view is that, first it is the only example of any note
where there have been objections to foreign investment, and second because when asked why they
moved to the UK, the “favourable investment climate was a key part of the answer.
(b) The City
In “the City”, the conventional shorthand for the financial industry, there is occasional reference to
“Wimbledonisation”. By that is meant the phenomenon notable in regard to the famous tennis
tournament played at Wimbledon in south west London, that the facilities are provided in London
but all the notable players come from overseas.
There is something of the appearance of the same thing in the financial industry. Following what
was known as “Big Bang” in 1986, the traditional barriers between various types of firms broke
down. Stock brokers and stock jobbers no longer had to be separate; banks and other financial
institutions could own either or both; merchant banks (the traditional raisers of capital for industry)
were open for taking over; discount houses, the market makers in government securities, were
similarly available. Subsequently building societies, Britain’s traditional, mutually owned, mortgage
providers, were allowed to ‘demutualise’ and diversify. By demutualising they became open to take
over. Banks, meanwhile, went into the business of mortgage lending. Foreign banks poured into
London, taking over businesses, issuing credit cards and so forth.
Britain, because of the euro dollar market, had been an international financial centre already. It then
became an even bigger international financial centre, with a large number of important foreign
participants. This attracted comment (and the above-noted nickname), sometimes the nostalgic
observation that it was a pity the British had lost their dominance, but absolutely no resistance or
complaint. There were no objections at all to this wave of foreign investment.
Some reasons are not hard to find. The prices paid for companies, especially early in the process,
could often be described as startling, bringing wealth to those who had before enjoyed simply solid

20
prosperity. And there is a second part of the story. This relates to the curious earnings structure in
the financial sector. The aspect of this that is relevant to the present discussion is the division
between labour and capital. Employment conditions are very unusual. There is usually a substantial
basic pay with the possibility of a bonus payment several multiples of that should the firms and the
individual do well in a year. There is also acceptance that job security is low. This has all combined
to produce the result that a major part of the profits in good years goes to employees; and in bad
years the losses are borne by the shareholders, who may see the workers lose their jobs but do not
have the option of smoothing jobs and profits. As a good number of the employees are either British
nationals or long-term British residents it is straightforward to see why ”Wimbledonisation” has
attracted comment, but few complaints.
Employment and Inward Investment
It is natural to follow the discussion of employment conditions with a discussion of employment
numbers4.
The table below shows job creation as a result of FDI. The years are financial years, that is to say
from 1 April in one year to 31 March in the next. Thus, for example, 1995-96 refers to the period 1
April 1995 to 31 March 1996.
Year No of projects Total new of jobs Total safe jobs Total associatedjobs
1985-86 425 26,686 22,771 49,5471986-87 359 19,430 13,521 32,9511987-88 380 33,838 30,222 64,0601988-89 356 26,862 16,071 42,9331989-90 379 35,997 41,995 77,9921990-91 365 23,756 60,900 84,6561991-92 354 22,423 31,093 53,5161992-93 332 17,821 43,359 61,1801993-94 431 29,841 69,645 99,4861994-95 455 38,351 53,757 92,1081995-96 492 47,347 51,167 98,5141996-97 497 46,400 51,939 98,3391997-98 631 46,562 82,771 129,3331998-99 669 45,157 75,523 120,6801999-2000 800 54,365 81,587 135,5922000-2001 881 71,178 52,359 123,5372001-2002 835 35,127 24,062 59,189
4 We are grateful to Invest-UK for the data we discuss in this section.

21
Some definitions are in order. But there is also an important qualification to the data to note first.
To quote:
“The attached figures are based on projects notified to Invest-UK ……. There is no requirement tonotify the Department (of Trade, Industry and the regions) and so the figures include only thoseprojects where the Department’s Invest-UK and its regional partners were involved or which came totheir notice.”
The figures are, in other words, an estimate of the lower bound. Other definitional points to note are
new jobs are expansion or a new facility, safe jobs, takeovers, of an existing firm. And, oddly,
associated jobs is the total of the two.
Now, what light can the data shed? It has to be admitted that it is regrettable that the data became
available after the upturn in FDI, thus allowing no comparison with the earlier, pre mid-1980s,
period. But within the period they cover, they show a steady, but much gentler, rise in projects than
the spectacular rise shown in the previous financial data. This apparent discrepancy is resolved
below. The FDI shows constantly favourable employment effects, although the projects–jobs,
relationship is highly variable. Interestingly, the number of projects as well as the number of jobs
created figures continued to rise even as unemployment in the UK continued to fall; a pool of
unemployed labour is not, on these figures, a pre-requisite for inward investment. Again, rather, the
data tell a story of a “favourable climate” being important.
Vast Acceleration
Before summing up, one point remains. What produced the vast acceleration to almost incredible
levels from around 1995 onwards? Here we come to a different aspect of London’s role as a
financial centre. Full details are given in an annex; so here it is possible to be brief, and essentially
make the point by illustration.
When Vodafone took our Mannesman Vodafone paid not in cash but in shares, which were issued in
London. The issuing and taking up of these shares produced a surge in investment in a British-
registered company, and hence inward investment in the UK. In other words, the sudden surge at the
end of our data period reflects M&A activities going on in London; it may well have reversed on
more recent data, but these are not yet available.

22
Conclusion
It is now time to draw our discussion together. Before doing so we would direct attention to the
appendices of the paper where, as well as the various data matters so far noted, there is a brief
discussion of FDI in Scotland, and of FDI and the motor car industry.
Just as Britain was a major overseas investor at the end of the 19th century, so it has become a
significant recipient of inwards investment by the end of the 20th and beginning of the 21st centuries.
Why has this happened? What have attitudes to it been? It is thought to have impinged on or
hampered domestic macro economic policy?
We have suggested that a “climate” comprised of various factors has contributed. The abolition of
exchange controls re-symbolised Britain’s traditional acceptance of the benefits of economic
openness. The liberalisation of the economy made Britain a better place to invest than it had been
for some years. The emergence of a policy framework designed to impart economic stability also
helped. What did not seem to matter very much at least in the absence of these conditions, was party
in government, exchange rate regime, or current state of the economy.
Our verdict on the reasons for overseas investment in Britain thus is very close to what Sir Geoffrey
Owen (1999) advanced for Japanese investment in the British Motor Car industry.
“Britain benefited from the (globalisation) process because, thanks to Margaret Thatcher, it had
become a more attractive location for investment.”
And note the word “benefited”. It was plainly Sir Geoffrey Owen’s view that there had been
benefits. This seems to be the overall view; policy earlier was described as benign neglect. In
general, foreign investment was welcomed, and given modest incentives. It was not seen either as
important to secure or important to repel. One confirmation of this is provided by statistics on
foreign ownership. Figures for foreign ownership of British companies exist; every holding of 3%
in a company has to be notified to the stock exchange, as has every further 1% purchased. But no
running totals are published; it is thus impossible to say from day to day which British registered
companies are owned by British residents. Whether they are owned by British citizens (a somewhat
different group from residents) is probably impossible in many cases to find out. Still further
confirmation is provided by the complete absence from mainstream political discourse is the notion
that “multinationals” have somehow taken over, or impeded the actions of, national government.

23
All this exemplifies, we conjecture, the relaxed attitude of a major foreign investor. At least at
present levels, no-one much worries about “who owns” British industry, so long as British residents
have savings somewhere. Foreign ownership is a non-issue in Britain.

24
ANNEX 1
Details to come

25
ANNEX 2
Stock of overseas Direct Investment in UK Private Sector
Foreign-Owned Manufacturing Enterprises by Country of Origin: enterprises, Establishments andEmployment, 1963-1979
Foreign-Owned and All Manufacturing Unit in UK Regions, 1979
Foreign Ownership in Manufacturing Industry in UK Regions: Share of Employment by Country ofOrigin, 1977
Importance of Major Industry Orders in Foreign-Owned and All Manufacturing Employment, 1977
Foreign-Owned and All Manufacturing Units in UK regions: Share of Employment by SIC Order,1977.
Foreign-Owned and All Manufacturing Units in UK Regions: Share of Employment by Size Groupof Unit, 1979
Trends in Manufacturing Employment in Foreign Enterprises in UK Regions
Regional Shares of Foreign-Owned and All Manufacturing Employment, 1971-79
Net Capital Expenditure, Net Output and Gross Value Added per Employee in Foreign-Owned andAll Manufacturing Enterprises, 1979
Main Characteristics of Foreign Ownership in UK Regions
Foreign Manufacturing Enterprises in Ireland
Foreign Service Enterprises Ireland
Country of Origin of foreign Manufacturing Enterprises in Ireland
Foreign Ownership in Ireland by Industry Sector & Date of Entry
Foreign Ownership in Ireland by Industry Sector & country of Origin
Foreign Ownership in Ireland by Country of Origin & Date of Entry
Appendix: Foreign Openings in UK Regions: Share of Openings by country of Origin, 1966-76

26
ANNEX 3
Crude balance of trade (summary by class)
Structure of UK royalty receipts and payments in 1984
Characteristics of foreign manufacturing enterprises in the UK, by nationality, 1983
Characteristics of foreign manufacturing enterprises I the UK, by major sector, 1983
New foreign direct investment projects in the Republic of Ireland and Scotland, 1975-82
Sector distribution of inward direct investment flows I manufacturing industry in the UK
Ratings of UK affiliate produce and process technology
R&D expenditure and employment in foreign-owned firms
R&D in UK majority-owned affiliates abroad
Foreign-owned shares of employment and five-firm concentration ratios, by industry, 1983
Some balance of payments effects of inward direct investment in the UK, 1972-81
Employment in foreign-owned and all manufacturing enterprises, selected years, 1963-83
Employment change in foreign-owned and UK-owned manufacturing enterprises, 1975-81
Workforce characteristics of foreign owned and all manufacturing enterprises it he chemical, andmechanical and electrical engineering industries
Process plant contracting industry: proportion of UK contractors’ plant procurement from UnitKingdom sources
Ratio of the share of total employment in manufacturing due to first-time inward investors to theshare of total manufacturing employment
Regional selective assistance to foreign-owned companies
Openings of foreign-owned plants, by region
Large plant closures in the UK, 1978-82
Net output per employee in foreign-owned and all manufacturing enterprises, 1983
Net capital expenditure of foreign owned and all manufacturing enterprises in the UK assisted areas
Offers of regional selective assistance to the electronics industry, Scotland and Great Britain
Market destination for Scottish electronics industry production, 1978

27
Purchases of components and subcontract services by Scottish electronics OEMs, 1979
Selected performance indicators for Japanese and all manufacturing plants in Wales, 1981
Sales, profits, exports and employment at IBM UK, 1973-86
28
ANNEX 4
The London Market and Inward Investment
The London market has historically performed as a conduit for portfolio investment across the
Atlantic. The City’s role as a preeminent financial centre allowed Britain to perform as an
intermediary in capital flows both westward across the Atlantic (in the 19th Century), and eastward.
However, these financial flows have rarely settled in the UK. Yet, with the recent merger boom,
exemplified by Vodafone’s takeover of Mannesmann, investment has come to settle in the UK. As
the consideration for Mannesmann was in share capital, share issuance led to an increased foreign
participation in UK financial markets. Several other mergers were funded in this way, leading to a
massive increase in both foreign direct investment as well as foreign portfolio investment over the
past few years. The most recent Pink Book shows that both categories have returned to their pre-
1995 trends. Arguably, therefore, one might conclude that the scale of mergers between UK
companies and foreign firms had increased, as opposed to their number. Furthermore, for an increase
in foreign holdings in the UK, the mergers must be initiated by UK companies. Therefore, the
merger boom displays the increasing international presence of British firms, as opposed to foreign
hordes invading the London market. As such, foreign ownership is an acceptable corollary to
increased British presence abroad. In this sense, British firms have finally adopted a global scope,
which is reflected in increased foreign ownership of their share capital. Given the previous
definitions of direct investment and foreign investment, any merger boom fueled chiefly by equity
capital will provide a similar increase in foreign ownership.
Therefore, spikes in foreign ownership of UK shares recently tend to reflect an active profile on the
part of domestic firms as opposed to foreign capital proactively seeking investment in the UK.

29
ANNEX 5
The Motor Car Industry
In 1960 the British Motor Corporation produced 40% of the vehicles sold in the UK, and produced
more new vehicles than anyone else in Europe except Volkswagen. But, to quote Sir Geoffrey Owen
(1999):
“Fifteen years later as the largest constituent of British Leyland it was on the brink of bankruptcy and
taken over by the government. Fifteen years later still, having changed its name to Rover, it was
taken back into the private sector as a subsidiary of British Aerospace, but too weak to survive
without an alliance with a larger car manufacturer. In 1994 Rover was sold to BMW of Germany,
but this proved no long-term solution.”
Indeed, in 2000 BMW gave up the attempt. Britain’s car industry now owes its success to Japanese
manufacturers; earlier-investingUS companies (Ford and General Motors) have cut back.
The Japanese firms came, as noted in the text, because of the climate initiated by Margaret
Thatcher’s reforms. To continue with another, and more recent, observation from Sir Geoffrey
Owen’s work on this subject (Owen 2002), the liberal regulatory environment in the UK has let it
offer a more favourable environment for the development of the internet and of e-commerce, and has
thus facilitated investment in general.
The generally favourable climate fostered FDI; and it was an aspect of that climate that FDI was
greeted with benevolent neutrality.

30
ANNEX 6
The Case of Scotland
Scotland has been poorer than much of England for at least 50 years. Of the regions into which the
UK is divided, it has the second highest level of government spending per head and the fourth largest
GDP per head.
Successive governments, regardless of party, sought to use state intervention to boost the Scottish
economy. Efforts were made to attract foreign investment. This is striking; if we look at another
region, the South East of England, a regional agency to attract foreign investment was set up only
five years ago – yet around half of US investment in the UK, to take one example, is in the South
East. In contrast to that, government expenditure on industrial assistance in Scotland grew nine-fold
between 1964 and 1973 (Harvie 1981). Much of this went on assistance to foreign companies. New
agencies were also created to plan an economic strategy. The Highlands and Islands Development
Board was established in 1965, and the Scottish Development Agency in 1975. Both were given
bigger budgets by the Thatcher government.
These policies were continued, sometimes under new names, by the devolved Scottish parliament.
Now, it may be hard to argue that these policies were particularly successful. But that is beside the
point of the present discussion. They show very clearly how FDI was looked on favourably.
31
BIBLIOGRAPHY
Bailey, M J Tavlaes, G, and Ulan, M (1986) “Exchange Rate Variability and Trade Performance”Weltwircl Archiv, Vol 122
Breck, M and Sharp M, (1984): Inward Investment: Policy Options for the UK, Routledge, London
Capie, F H, Mills, T C and Wood, G E (1993): “Central Bank Independence: An ExploratoryAnalysis of Historical Data”, in Varieties of Monetary Reform, ed Pierre Siklos, Kluwer, 1993
Carse, S, Williamson, J, and Wood, G E (1980): “Financing Procedures in UK Foreign Trade”
Dunning, J H, (1974): The Future of the Multinational Enterprise”, Lloyds Bank Review
Frankel, J and Rose, A (1979) “The Endogeneity of the optimum Currency Area Criteria” SwedishEconomic Policy Review, 4
Harvie, C (1981): No Gods and Precious Few Heroes: Scotland 1914-81, (Arnold, London)
HMSO (1993): Multinational Investment Strategies in the British Isles (by Neil Hood and StephenYoung, with Alan Reeves and Margaret Milner) HMSO, London
Holmstrom, B, and Kaplan, S, N (2001): Corporate Governance and Merger Activity in the US:Making Sense of the 1980s and 1990s, Journal of Economic Perspectives, 15 (2), 121-44
House of Lords (1985): Report from a Select Committee on Overseas Trade. Session 1984-85,HMSO, London, 30 July
Mills, T C and Wood, G E (1993): “Capital Flows and the Excess Burden of the Exchange RateRegime”, International Capital Markets ed David Sapsford, Edard Elgar, 1993
Mills, T C and Wood, G E (1993): Does the Exchange Rate Regime Matter? Federal Reserve Bankof St Louis Review
Owen, Sir G (2002) “British Industrial Performance – an Historical Prospective”, David HumeInstitute, Edinburgh
Owen, Sir G, (1999): From Empire to Europe: The Decline of and Revival of British Industry,Since the Second World War (Harper Collins, London)
Rajan, R G and Zingales, L (1988), “Financial Dependence and Growth”, American EconomicReview, 88,559-87 – (2001)
Reddaway, W, B, in collaboration with Potter, S J, and Taylor, C, T (1968): UK Direct InvestmentOverseas, Vols I and II, C.U.P.; Cambridge
Roe, M (1999), “Political Preconditions to Separating Ownership from Control: The Incompatibilityof the American Public Firm with Social Democracy”, Working Paper, Columbia Law School
Stoppord, J, M and Turner, L (1985): Britain and the Multinationals, John Wiley and Son,

32
Chichester
Strahan, P E (1999): “What Drives Deregulation? Economics and Politics of the Relaxation of theBank Branching Restrictions”, Quarterly Journal of Economics, 114(4), 1437-67
Young, S; Hood, N, and Hamil, J (1988): Foreign Multinationals and the British Economy,Croom Helm, London
33549 18/2/03
Chart 1, Real & Nominal GDP in the UK
0
200000
400000
600000
800000
1000000
120000019
59
1961
1963
1965
1967
1969
1971
1973
1975
1977
1979
1981
1983
1985
1987
1989
1991
1993
1995
1997
1999
Year
GD
P, in
mill
ions
of p
ound
s
GDP(nominal, in £ million)GDP (real, in 2000 £s, £ million)

34
Chart Two, RPIX - Inflation (in percentage terms)
0
5
10
15
20
25
30
1959
1961
1963
1965
1967
1969
1971
1973
1975
1977
1979
1981
1983
1985
1987
1989
1991
1993
1995
1997
1999
Year
Infla
tion
Rat
e (%
)
RPIX - Inflation (in percentage terms)

35
Chart Three, Exchange Rates
0
2
4
6
8
10
12
14
1959
1961
1963
1965
1967
1968
1970
1972
1974
1976
1978
1980
1982
1984
1986
1988
1990
1992
1994
1996
1998
2000
Year
Cur
renc
y pe
r Brit
ish
Poun
d
USD to GBPDM to GBP
36

37
Chart 5
General Election Dates, Governments and Majorities since 1945Election Date Party Leader Overall Majority5 July 1945 Labour Clement Attlee 14623 February 1950 Labour Clement Attlee 525 October 1951 Conservative Churchill, then Eden 548 October 1959 Conservative Macmillan, then
Douglas-Home100
15 October 1964 Labour Harold Wilson 531 March 1966 Labour Harold Wilson 9618 June 1970 Conservative Edward Heath 3028 February 1974 Labour Harold Wilson 33 May 1979 Conservative Margaret Thatcher 439 June 1983 Conservative Margaret Thatcher 14311 June 1987 Conservative Margaret Thatcher 1029 April 1992 Conservative John Major 211 May 1997 Labour Tony Blair 1797 June 2001 Labour Tony Blair 167Source: http://www.psr.keele.ac.uk/area/uk/uktable.htm

38
Chart Six, Total Foreign Investment
0
50000
100000
150000
200000
250000
30000019
59
1961
1963
1965
1967
1969
1971
1973
1975
1977
1979
1981
1983
1985
1987
1989
1991
1993
1995
1997
1999
Year
Fore
ign
Inve
stm
ent (
in m
illio
ns o
f pou
nds)
Total investmentIn constant terms (based on 2000)
39
Chart Seven, Foreign Investment as a percentage of GDP
0
0.05
0.1
0.15
0.2
0.25
0.319
59
1961
1963
1965
1967
1969
1971
1973
1975
1977
1979
1981
1983
1985
1987
1989
1991
1993
1995
1997
1999
Year
Fore
ign
inve
stm
ent d
ivid
ed b
y G
DP
As a percentage of GDP
40
Chart Eight, Investment in 2000 prices
-50000
0
50000
100000
150000
200000
250000
30000019
59
1961
1963
1965
1967
1969
1971
1973
1975
1977
1979
1981
1983
1985
1987
1989
1991
1993
1995
1997
1999
Year
Inve
stm
ent i
n m
illio
ns o
f pou
nds
Direct In constant termsPortfolio In constant termsTotal In constant terms
41
Chart Nine, Investments as Ratio of GDP
-0.05
0
0.05
0.1
0.15
0.2
0.25
0.319
59
1961
1963
1965
1967
1969
1971
1973
1975
1977
1979
1981
1983
1985
1987
1989
1991
1993
1995
1997
1999
Year
Inve
stm
ent o
ver G
DP
Direct As a percentage of GDPPortfolio As a percentage of GDPTotal As a percentage of GDP

42
Chart 10, Investment by Oil Companies, 1959-1990
-3000
-2000
-1000
0
1000
2000
300019
59
1961
1963
1965
1967
1969
1971
1973
1975
1977
1979
1981
1983
1985
1987
1989
Year
Inve
stm
ent (
mill
ions
of p
ound
s)
Oil Company Investment#REF!

43
Chart 11, Investment in Central government stocks and bonds
-10000
-5000
0
5000
10000
15000
20000
Year
Inve
stm
ent i
n go
v't s
tock
s (in
mill
ions
of p
ound
s)
Central government stocks and bonds
44
Chart 12, FDI broken into oil and non-oil investment
-6000
-4000
-2000
0
2000
4000
6000
800019
59
1961
1963
1965
1967
1969
1971
1973
1975
1977
1979
1981
1983
1985
1987
1989
1991
1993
1995
1997
1999
Year
Inve
stm
ent (
mill
ions
of p
ound
s)
Oil Company InvestmentIn constant termsAs a percentage of GDP

45
Chart 13, Total Portfolio Investment
-20000
0
20000
40000
60000
80000
100000
120000
140000
160000
18000019
59
1961
1963
1965
1967
1969
1971
1973
1975
1977
1979
1981
1983
1985
1987
1989
1991
1993
1995
1997
1999
Year
Port
folio
Inve
stm
ent i
n m
illio
ns o
f pou
nds
Total Portfolio Investment

46
Chart 14, FDI and Portfolio Investment, Nominal Terms
-20000
0
20000
40000
60000
80000
100000
120000
140000
160000
18000019
59
1961
1963
1965
1967
1969
1971
1973
1975
1977
1979
1981
1983
1985
1987
1989
1991
1993
1995
1997
1999
Year
Inve
stm
ent (
mill
ions
of p
ound
s)
Total Portfolio InvestmentTotal FDI (oil + TDI)

47
Chart 15, Oil and FDI as proportion of GDP
-0.02
0
0.02
0.04
0.06
0.08
0.119
59
1961
1963
1965
1967
1969
1971
1973
1975
1977
1979
1981
1983
1985
1987
1989
1991
1993
1995
1997
1999
Year
Inve
stm
ent a
s pr
opor
tion
of G
DP
Total FDI as a percentage of GDPOil company investment as a percentage of GDP

48
Chart 16, Total Portfolio Investment as a percentage of GDP
-0.00000005
0
0.00000005
0.0000001
0.00000015
0.0000002
0.00000025
0.0000003
0 -0 0
0.01
0.01
0.01
0.01
0.01
0.01 0
0.01
0.02
0.04
0.02
0.02
0.04
0.05
0.03
0.12
Year
Port
folio
inve
stm
ent a
s a
perc
enta
ge o
f GD
P
Total Portfolio Investment as a percentage ofGDP
49
Chart 17, Investment in Government Securities as a percentage of GDP
-0.01
-0.005
0
0.005
0.01
0.015
0.02
0.025
0.0319
59
1961
1963
1965
1967
1969
1971
1973
1975
1977
1979
1981
1983
1985
1987
1989
1991
1993
1995
1997
1999
Year
Gov
ernm
ent S
ecur
ities
inve
stm
ent a
s pe
rcen
tage
of G
DP
Investment in Government Securities as apercentage of GDP

50
Chart 18, Oil company investment as a percentage of GDP
-0.008
-0.006
-0.004
-0.002
0
0.002
0.004
0.006
0.008
0.01
0.01219
59
1961
1963
1965
1967
1969
1971
1973
1975
1977
1979
1981
1983
1985
1987
1989
Year
Oil
Com
pany
inve
stm
ent a
s pe
rcen
tage
of G
DP
Oil company investment as a percentage of GDP

51
Chart 19, Investments as percentage of GDP
-0.02
0
0.02
0.04
0.06
0.08
0.1
0.12
0.14
0.16
0.18
0.219
59
1961
1963
1965
1967
1969
1971
1973
1975
1977
1979
1981
1983
1985
1987
1989
1991
1993
1995
1997
1999
Year
Inve
stm
ent,
as p
ropo
rtio
n of
GD
P
Total FDI as a percentage of GDP
Total Portfolio Investment as a percentage ofGDPTotal Investment as a percentage of GDP

52

33549 18/2/03
33549 18/2/03
Table One – Foreign Investment in the UK, Yearly DataYear FDI (£ million) Portfolio (£
million)Total (£ million)
1959 172 1721960 190 43 2331961 311 115 4261962 187 61 2481963 257 19 2761964 200 -39 1611965 288 -46 2421966 335 -58 2771967 370 11 3811968 528 87 6151969 448 354 8021970 622 491 11131971 732 603 13351972 486 390 8761973 1126 927 20531974 1778 1450 32281975 1410 1172 25821976 1537 1352 28891977 2367 1931 42981978 1991 1399 33901979 3030 1549 45791980 4355 1431 57861981 2932 257 31891982 3027 -11 30161983 3386 1701 50871984 -181 1288 11071985 3865 8913 127781986 4987 10911 158981987 8681 17710 263911988 9218 13220 224381989 18344 10860 292041990 19132 12880 320121991 9197 9818 190151992 9416 9579 189951993 10943 28770 397131994 7099 30680 377791995 13831 37315 511461996 17562 42985 605471997 22823 26670 494931998 45054 20926 659801999 54131 112274 1664052000 88622 165045 253707Source: ONS Pink books

55
Table Two – GDP in the UK, Yearly DataYear GDP (£ million)1963 311331934 339511935 364111966 385841967 408581968 443521969 475831970 528841971 591621972 671671973 747071974 892151975 1111361976 1297891977 1510581978 1727841979 2076121980 2364861981 2594541982 2834391983 3080731984 3306971985 3628141986 3881331987 4312441988 4799821989 5251411990 5637351991 5950541992 6154041993 6535821994 6905751995 7290011996 7728561997 8241641998 8686421999 9182022000 962130Source: HM Treasury
56
General Election Dates, Governments and Majorities since 1945Election Date Party Leader Overall Majority5 July 1945 Labour Clement Attlee 14623 February 1950 Labour Clement Attlee 525 October 1951 Conservative Churchill, then Eden 548 October 1959 Conservative Macmillan, then
Douglas-Home100
15 October 1964 Labour Harold Wilson 531 March 1966 Labour Harold Wilson 9618 June 1970 Conservative Edward Heath 3028 February 1974 Labour Harold Wilson 33 May 1979 Conservative Margaret Thatcher 439 June 1983 Conservative Margaret Thatcher 14311 June 1987 Conservative Margaret Thatcher 1029 April 1992 Conservative John Major 211 May 1997 Labour Tony Blair 1797 June 2001 Labour Tony Blair 167Source: http://www.psr.keele.ac.uk/area/uk/uktable.htm