FOREIGN DIRECT INVESTMENT - wtcla.s3.amazonaws.com€¦ · FOREIGN DIRECT INVESTMENT 234-6 TABLE OF...
58
FOREIGN DIRECT INVESTMENT IN SOUTHERN CALIFORNIA
Transcript of FOREIGN DIRECT INVESTMENT - wtcla.s3.amazonaws.com€¦ · FOREIGN DIRECT INVESTMENT 234-6 TABLE OF...
FOREIGN DIRECTINVESTMENTIN SOUTHERN CALIFORNIA

FORE
IGN
DIR
ECT
INVE
STM
ENT
2015
2
The LAEDC Kyser Center for Economic Research and the LAEDC Institute for Applied Economics specialize in objective and unbiased economic and policy research in order to foster informed decision-making and guide strategic planning. Every reasonable effort has been made to ensure that the data contained herein reflect the most accurate and timely information possible and they are believed to be reliable. This report is provided solely for informational purposes and is not to be construed as providing advice, recommendations, endorsements, representations or warranties of any kind whatsoever.
© 2016 Los Angeles County Economic Development Corporation. All rights reserved
444 S. Flower Street, 37th Floor Los Angeles, CA 90071www.LAEDC.orgJune 2016
FOREIGN DIRECTINVESTMENTIN SOUTHERN CALIFORNIA

FOREIGN DIRECT IN
VESTMEN
T 2015
3
This research was made possible with the generous support of Los Angeles County Supervisor Hilda L. Solis, JPMorgan Chase & Co., California State University Dominguez Hills, Japan Business Association, World Trade Center San Diego and the Consulate General of New Zealand in Los Angeles.
SPECIALACKNOWLEDGMENT
FORE
IGN
DIR
ECT
INVE
STM
ENT
2015
4
E X E C U T I V E S U M M A R Y
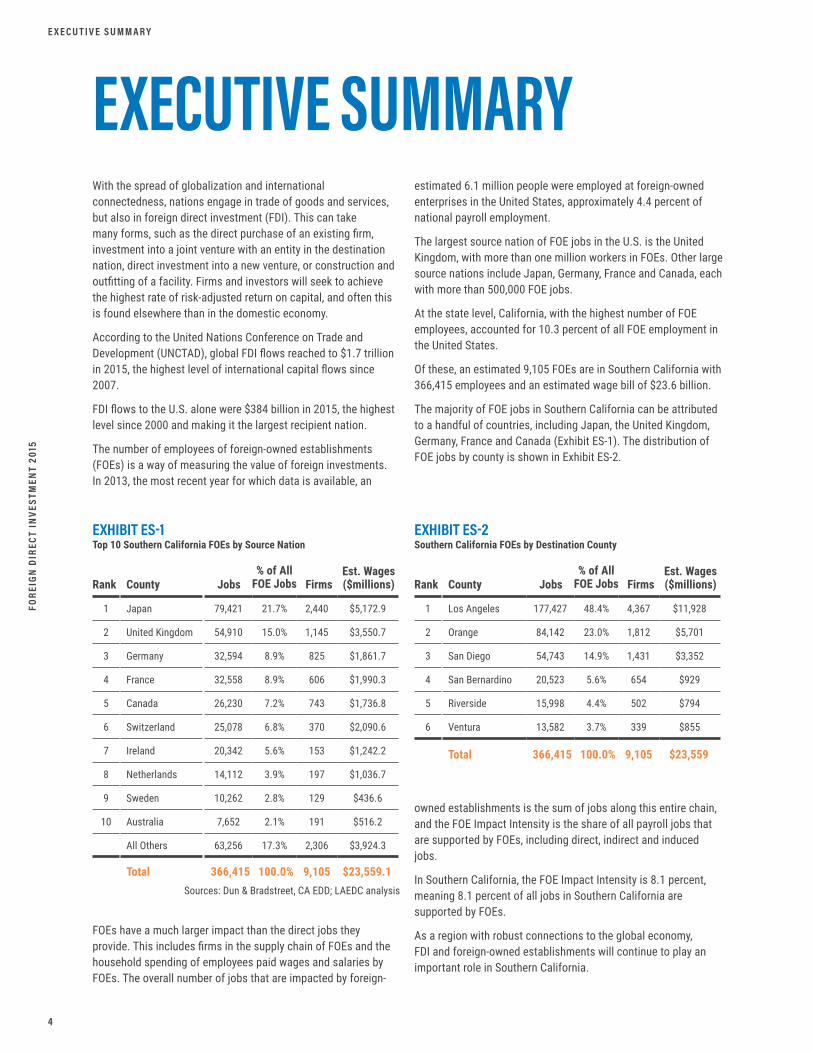
With the spread of globalization and international connectedness, nations engage in trade of goods and services, but also in foreign direct investment (FDI). This can take many forms, such as the direct purchase of an existing firm, investment into a joint venture with an entity in the destination nation, direct investment into a new venture, or construction and outfitting of a facility. Firms and investors will seek to achieve the highest rate of risk-adjusted return on capital, and often this is found elsewhere than in the domestic economy.
According to the United Nations Conference on Trade and Development (UNCTAD), global FDI flows reached to $1.7 trillion in 2015, the highest level of international capital flows since 2007.
FDI flows to the U.S. alone were $384 billion in 2015, the highest level since 2000 and making it the largest recipient nation.
The number of employees of foreign-owned establishments (FOEs) is a way of measuring the value of foreign investments. In 2013, the most recent year for which data is available, an
EXECUTIVE SUMMARYestimated 6.1 million people were employed at foreign-owned enterprises in the United States, approximately 4.4 percent of national payroll employment.
The largest source nation of FOE jobs in the U.S. is the United Kingdom, with more than one million workers in FOEs. Other large source nations include Japan, Germany, France and Canada, each with more than 500,000 FOE jobs.
At the state level, California, with the highest number of FOE employees, accounted for 10.3 percent of all FOE employment in the United States.
Of these, an estimated 9,105 FOEs are in Southern California with 366,415 employees and an estimated wage bill of $23.6 billion.
The majority of FOE jobs in Southern California can be attributed to a handful of countries, including Japan, the United Kingdom, Germany, France and Canada (Exhibit ES-1). The distribution of FOE jobs by county is shown in Exhibit ES-2.
FOEs have a much larger impact than the direct jobs they provide. This includes firms in the supply chain of FOEs and the household spending of employees paid wages and salaries by FOEs. The overall number of jobs that are impacted by foreign-
EXHIBIT ES-1 Top 10 Southern California FOEs by Source Nation
EXHIBIT ES-2 Southern California FOEs by Destination County
1
2
3
4
5
6
Los Angeles
Orange
San Diego
San Bernardino
Riverside
Ventura
177,427 48.4% 4,367 $11,928
84,142 23.0% 1,812 $5,701
54,743 14.9% 1,431 $3,352
20,523 5.6% 654 $929
15,998 4.4% 502 $794
13,582 3.7% 339 $855
County Jobs FirmsRank% of All
FOE JobsEst. Wages ($millions)
Total 366,415 9,105100.0% $23,559
owned establishments is the sum of jobs along this entire chain, and the FOE Impact Intensity is the share of all payroll jobs that are supported by FOEs, including direct, indirect and induced jobs.
In Southern California, the FOE Impact Intensity is 8.1 percent, meaning 8.1 percent of all jobs in Southern California are supported by FOEs.
As a region with robust connections to the global economy, FDI and foreign-owned establishments will continue to play an important role in Southern California.
1
2
3
4
5
6
7
8
9
10
Japan
United Kingdom
Germany
France
Canada
Switzerland
Ireland
Netherlands
Sweden
Australia
All Others
79,421 21.7% 2,440 $5,172.9
54,910 15.0% 1,145 $3,550.7
32,594 8.9% 825 $1,861.7
32,558 8.9% 606 $1,990.3
26,230 7.2% 743 $1,736.8
25,078 6.8% 370 $2,090.6
20,342 5.6% 153 $1,242.2
14,112 3.9% 197 $1,036.7
10,262 2.8% 129 $436.6
7,652 2.1% 191 $516.2
63,256 17.3% 2,306 $3,924.3
County Jobs FirmsRank% of All
FOE JobsEst. Wages ($millions)
Total 366,415 9,105100.0% $23,559.1Sources: Dun & Bradstreet, CA EDD; LAEDC analysis

FOREIGN DIRECT IN
VESTMEN
T 2015
5
FORE
IGN
DIR
ECT
INVE
STM
ENT
2015
6
TABLE OF CONTENTSFOREIGN DIRECT INVESTMENT 2015
EXECUTIVE SUMMARY
1 - INTRODUCTION 8
4
14
20
34
2 - SOUTHERN CALIFORNIA AND FOREIGN INVESTMENT
3 - FDI DESTINATION COUNTIES
4 - SOURCE NATIONS
1.1 Global FDI Inflows1.2 FDI and FOE in the United States1.3 FOE in California1.4 Methodology and Limitations 1.5 FOE Impact Intensity
910111213
151617
20222426283032
464748495051525354555657
343536373839404142434445
2.1 Greenfield Investments2.2 FOEs in Southern California by County2.3 FOE by Source Nation
Southern California Los Angeles County Orange County San Diego County San Bernardino County Riverside County Ventura County
No.01 Japan No.02 United Kingdom No.03 Germany No.04 France No.05 Canada No.06 Switzerland No.07 Ireland No.08 Netherlands No.09 Sweden No.10 Australia No.11 Republic of Korea No.12 Taiwan
No.13 China No.14 Mexico No.15 Luxembourg No.16 Israel No.17 Spain No.18 IndiaNo.19 Italy No.20 Belgium No.21 Hong Kong No.22 New Zealand No.23 Singapore No.24 Finland

FOREIGN DIRECT IN
VESTMEN
T 2015
7

FORE
IGN
DIR
ECT
INVE
STM
ENT
2015
8
With increasing globalization and international connectedness, nations engage in trade of goods and services, but also in capital flows. These can involve central banks, as they purchase foreign government obligations to manage their currency and reserves, but private capital flows, or foreign direct investment, represent a significant share of cross-border monetary transactions.
It can take many forms, such as the direct purchase of an existing firm, investment into a joint venture with an entity in the destination nation, direct investment into a new venture, or construction and outfitting of a facility. Firms and investors will seek to achieve the highest rate of risk-adjusted return on capital, and often this is found elsewhere than in the domestic economy.
Where once most such investments occurred in developed nations, such as the United States or the countries of Europe, the share of foreign direct investment (FDI) into developing nations has increased significantly over time as more investment opportunities become accessible.
INTRODUCTION
I N T R O D U C T I O N

FOREIGN DIRECT IN
VESTMEN
T 2015
9
According to the United Nations Conference on Trade and Development (UNCTAD), global FDI flows reached to US $1.7 trillion in 2015, an increase of 36 percent over the previous year. This is the highest level of international capital flows since 2007.
Growth in capital flows to developed economies was still responsible for most of the overall FDI growth in 2015, receiving 55 percent of global FDI, with the United States the recipient of 23 percent alone.
Cross-border mergers and acquisitions were responsible for the lion’s share of the increase in capital flows in 2015, while greenfield investments remained relatively constant over 2014. Corporate reconfigurations also figured prominently in the value gain in capital flows over last year—however, much of this flow occurred on financial statements, with little in terms of real asset exchange.
GLOBAL FDI INFLOWSINTRODUCTION
I N T R O D U C T I O N : 1 . 1 G L O B A L F D I I N F L O W S
United States$38423%
Other Developed Economies
$55232%
Developing Economies
$74144%
Transition Economies
$251%
Exhibit 1-1Global FDI Inflows in 2015(US$ billions)
Source: UNCTAD
Global FDI Inflows:US$ 1.7 Trillion
Developed Economies: US$ 936 Billion
55 percent share of total
EXHIBIT 1-1Global FDI Inflows in 2015($billions)
$
$

FORE
IGN
DIR
ECT
INVE
STM
ENT
2015
1 0
The United States has many qualities that have made and continue to make it an attractive market for foreign capital investment. Its established legal framework and its relatively stable economic and political environments reduce the risk profile of investments into the U.S. Foreign investors are also drawn to the large consumer market—an attractive target for firms in developed and developing countries alike seeking to increase their exports through establishing a presence, either by investing in an existing American firm or by establishing a new firm.
UNCTAD estimates that FDI flows to the U.S. reached $384 billion in 2015, the highest level since 2000 and making it the largest recipient. Second-ranked Hong Kong received $163 billion, followed by China, which received $136 billion.
The level of a foreign entity’s investment in a domestic firm is an indicator of the amount of control the foreign investor has over the enterprise. In FDI-related statistics monitored by the U.S. Bureau of Economic Analysis (BEA), foreign-owned enterprises (FOE) are identified as those in which the foreign ownership stake is at least ten percent, whether in the in the form of direct management or equity stake.
The BEA provides estimates of the number of employees at FOEs as a way of measuring the value of foreign investments. This data is available at national and state level. In 2013, the most recent year for which data is available, an estimated 6.1 million people were employed at foreign-owned enterprises in the United States, representing approximately 4.4 percent of total payroll employment nationally.
The largest source country for FOE employment in the U.S. is the United Kingdom, with more than one million workers in establishments owned by entities headquartered in the U.K. Other large source countries include Japan, Germany, France and Canada, each with more than 500,000 jobs in their FOEs.
At the state level, California, with the highest number of FOE employees, accounted for 10.3 percent of all FOE employment in the United States. This was followed by Texas, accounting for 8.4 percent and New York, with 6.7 percent. These rankings are not unexpected as these three states are also the largest in terms of population and overall employment.
FDI AND FOE IN THE UNITED STATES
INTRODUCTION
I N T R O D U C T I O N : 1 . 2 F D I A N D F O E I N T H E U N I T E D S TAT E S
$384$163
$136$90
$68$65$59$56$45$44
United StatesHong Kong, China
ChinaNetherlands
United KingdomSingapore
IndiaBrazil
CanadaFrance
Exhibit 1-2Global FDI Inflows: Top 10 Host EconomiesEstimated FDI inflows in 2015 (US$ billions)
Source: UNCTAD
Global FDI Inflows in 2015:US$ 1.7 Trillion
U.S. is 23 % of World Total
United Kingdom
1,029.716.9%
Other European
890.714.6%
Japan 801.113.1%
Germany641.110.5%
France557.29.1%
Canada554.19.1%
Switzerland461.97.6%
Rest of World1,166.319.1%
Exhibit 1-3U.S. FOE Employment by Source 2013 (thousands)
Source: BEA
FOE Employment6.1 million jobs
631.5512.8
411.7290.7287.5
260.8242.9
233.5208.9202.7
CaliforniaTexas
New YorkPennsylvania
IllinoisFlorida
MichiganOhio
GeorgiaNorth Carolina
Exhibit 1-4Top 10 States by Share of U.S. FOE Employment 2013 employment in thousands
Source: BEA
Top Ten States Combined:73,203 employees
54 % of Total U.S. FOE
3.3%3.4%
3.8%4.0%4.3%4.7%4.8%
6.7%
8.4%10.3%
EXHIBIT 1-2Global FDI Inflows: Top 10 Host EconomiesEstimated FDI inflows in 2015 ($billions)
EXHIBIT 1-3U.S. FOE Employment by Source 2013 (thousands)
EXHIBIT 1-4Top 10 States by Share of U.S. FOE Employment 2013 employment in thousands

FOREIGN DIRECT IN
VESTMEN
T 2015
1 1
With almost 15.5 million payroll employees in 2015, the 631,500 FOE employees, while comprising over ten percent of total U.S. FOE employment, represent only 3.7 percent of total payroll employment in the state.
The relative share of FOE employment in California by source country has remained largely unchanged since 2007. Japan is the largest source of FOE employment in the state, followed by the United Kingdom. These two countries respectively represented 19.3 percent and 14.5 percent of total FOE employment in California in 2013. France, Germany and Switzerland round out the top five sources of FOE employment in California, followed by Canada and the Netherlands.
FOE IN CALIFORNIAINTRODUCTION
I N T R O D U C T I O N : 1 . 3 F O E I N C A L I F O R N I A
FOE4.1%
Non-FOE 95.9%
Total Employment
Exhibit 1-5Payroll Employment in California in 2013
Source: BEA
CA FOE : 631,500 empCA Total: 15.5 million emp
EXHIBIT 1-5Payroll Employment in California in 2013
Source: BEA
Japan121.619.3%
United Kingdom
91.714.5%Switzerland
66.510.5%
France65.9
10.4%
Germany64.7
10.2%
Canada39.16.2%
Netherlands25.14.0%
Rest of World156.924.8%
Exhibit 1-6California FOE Employment by Source (In thousands)
Source: BEA
FOE EmploymentAll Sources: 631,500 jobs
Top 7 Source s:474,600 jobs
75 percent of total
EXHIBIT 1-6California FOE Employment by Source(In thousands)

FORE
IGN
DIR
ECT
INVE
STM
ENT
2015
1 2
The remaining sections of this report will look more closely at both FDI and FOEs at the county level. This type of data at the county level is not published by the BEA, hence other sources of data are consulted here.
The primary data source used in this analysis is Dun & Bradstreet (D&B). This private provider of firm level data provides local employment estimates for entities with ultimate ownership in a foreign nation. The data was retrieved in January of 2016.
Exhibits showing FOE jobs from 1991 through 2011 used data generously provided by the Brookings Institution.
While this report uses the broad term foreign direct investment, it should be noted that the D&B data does not indicate whether the domestic firm was acquired by a foreign entity, or whether it was a firm that was newly established with a foreign investment. Nor does it indicate when the investment (whether acquisition or greenfield) may have occurred. Hence the estimated jobs cannot be interpreted as the result of foreign investment in the current year. Rather, the terminology used herein refers to jobs
METHODOLOGY AND LIMITATIONS
INTRODUCTION
of foreign-owned enterprises, or FOE jobs, where the share of foreign ownership meets the ten percent threshold.
Further, it should not be assumed that FOE jobs are dependent on foreign investment or have been created by foreign investment as it cannot be concluded that the absence of such investment would have meant the loss of these jobs.
To supplement FOE data and provide some understanding of actual new foreign investment at the county level, data assembled by the Financial Times organization in its fDi Markets reports were used. As there is no public recording of actual foreign investments, The Financial Times offers a disclaimer indicating that while it employs best efforts to capture details on foreign investments made in the United States, there is no consistent public recording of all investments made by foreign entities and individuals, thus the data is likely not comprehensive.
I N T R O D U C T I O N : 1 . 4 M E T H O D O L O G Y A N D L I M I TAT I O N S
FOREIGN DIRECT IN
VESTMEN
T 2015
1 3
Foreign-owned enterprises employ domestic residents. The number of such direct employees is a metric to demonstrate the value of foreign investment in domestic firms, and these have been quantified in the discussion above. Yet the larger impact of foreign ownership includes firms in the supply chain of FOEs and the household spending of employees paid wages and salaries by FOEs. These are called indirect and induced impacts, respectively, and are estimated using tools and data that trace the connections between firms, supply chains and workers. The overall number of jobs that are impacted by foreign-owned establishments, therefore, is the sum of jobs along this entire chain. For each source nation, this total number of jobs supported by that nation’s FOEs in Southern California is provided.
At the county level, the total number of jobs supported by FOEs in that county is shown in terms of FOE Impact Intensity, which is the share of all payroll jobs in the county that are supported by FOEs, including direct jobs that work for an FOE and the indirect and induced jobs that are supported through the FOE supply chains and the household spending of FOE-related employees.
FOE IMPACT INTENSITY
INTRODUCTION
I N T R O D U C T I O N : 1 . 5 F O E I M PA C T I N T E N S I T Y
FORE
IGN
DIR
ECT
INVE
STM
ENT
2015
1 4
S O U T H E R N C A L I F O R N I A A N D F O R E I G N I N V E S T M E N T
The Southern California six-county region includes the counties of Los Angeles, Orange, Riverside, San Bernardino, San Diego and Ventura. Foreign direct investment (FDI) occurs across all six counties in the region. Greenfield investment and estimated employment in foreign-owned enterprises (FOE) for the region is discussed below. This section is followed by graphical snapshots of the region and of its six individual component counties. These are followed by snapshots of the level of participation in Southern California of the top 24 source nations, measured by FOE employment.
SOUTHERN CALIFORNIA AND FOREIGN INVESTMENT
FOREIGN DIRECT IN
VESTMEN
T 2015
1 5
S O U T H E R N C A L I F O R N I A A N D F O R E I G N I N V E S T M E N T: 2 . 1 G R E E N F I E L D I N V E S T M E N T S
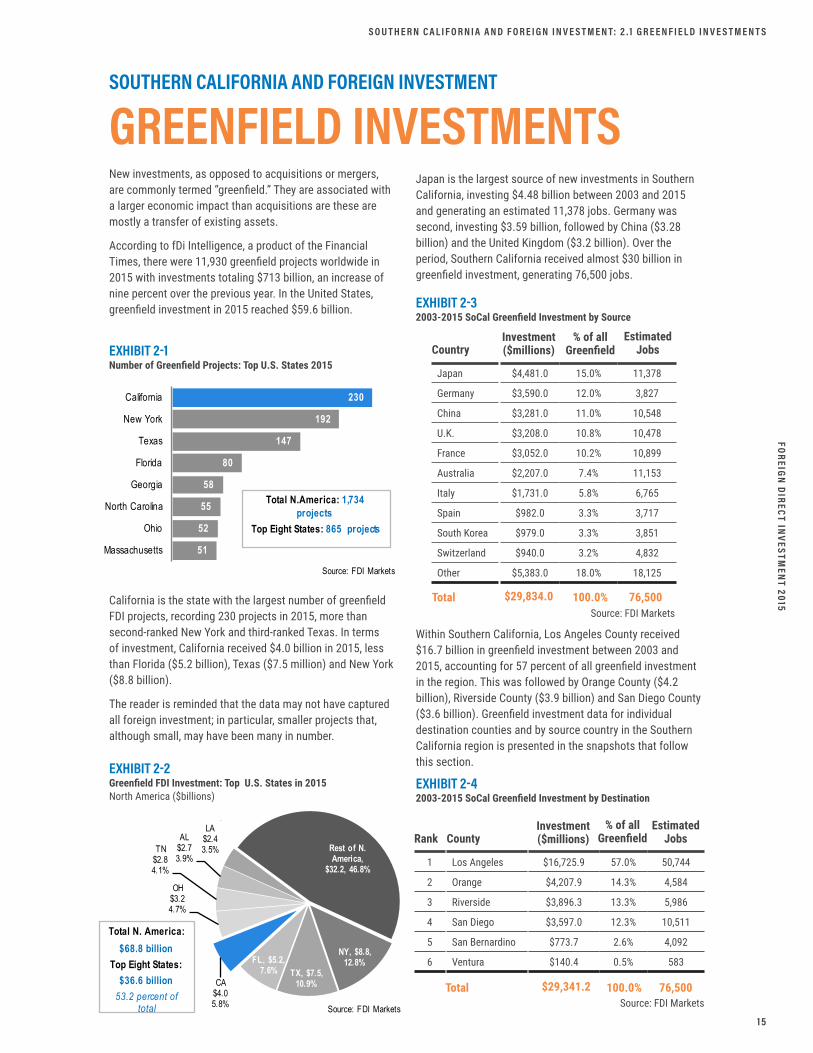
New investments, as opposed to acquisitions or mergers, are commonly termed “greenfield.” They are associated with a larger economic impact than acquisitions are these are mostly a transfer of existing assets.
According to fDi Intelligence, a product of the Financial Times, there were 11,930 greenfield projects worldwide in 2015 with investments totaling $713 billion, an increase of nine percent over the previous year. In the United States, greenfield investment in 2015 reached $59.6 billion.
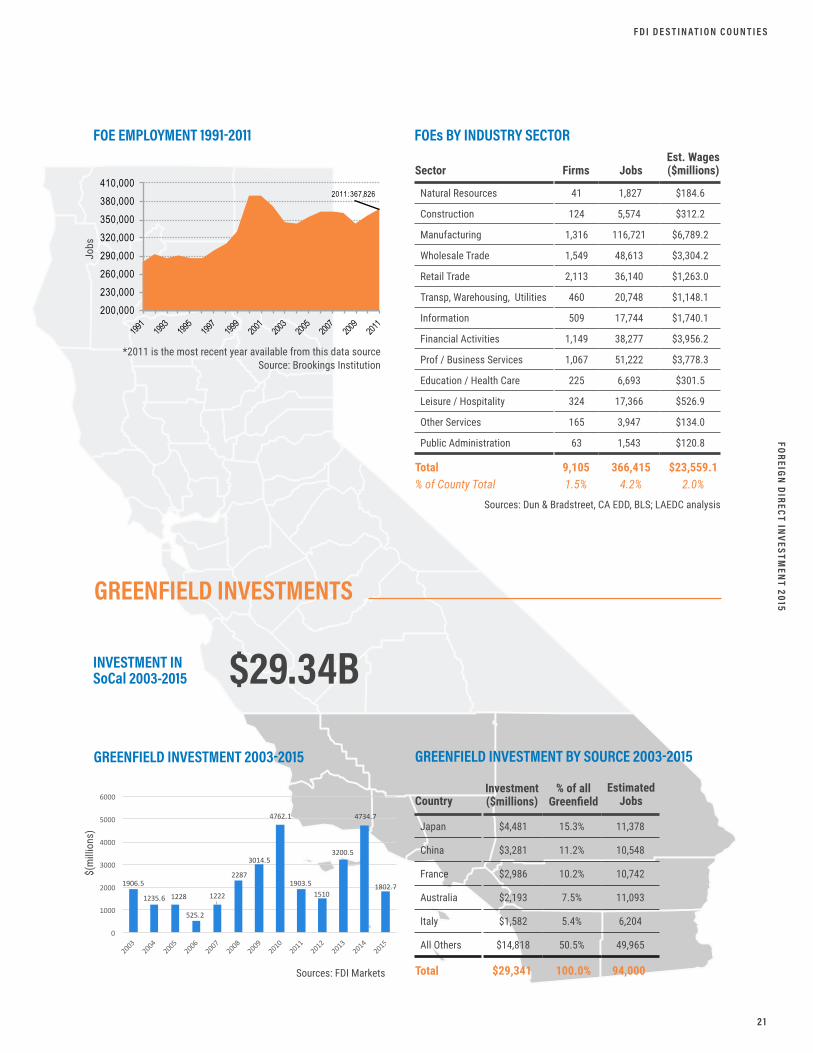
Japan is the largest source of new investments in Southern California, investing $4.48 billion between 2003 and 2015 and generating an estimated 11,378 jobs. Germany was second, investing $3.59 billion, followed by China ($3.28 billion) and the United Kingdom ($3.2 billion). Over the period, Southern California received almost $30 billion in greenfield investment, generating 76,500 jobs.
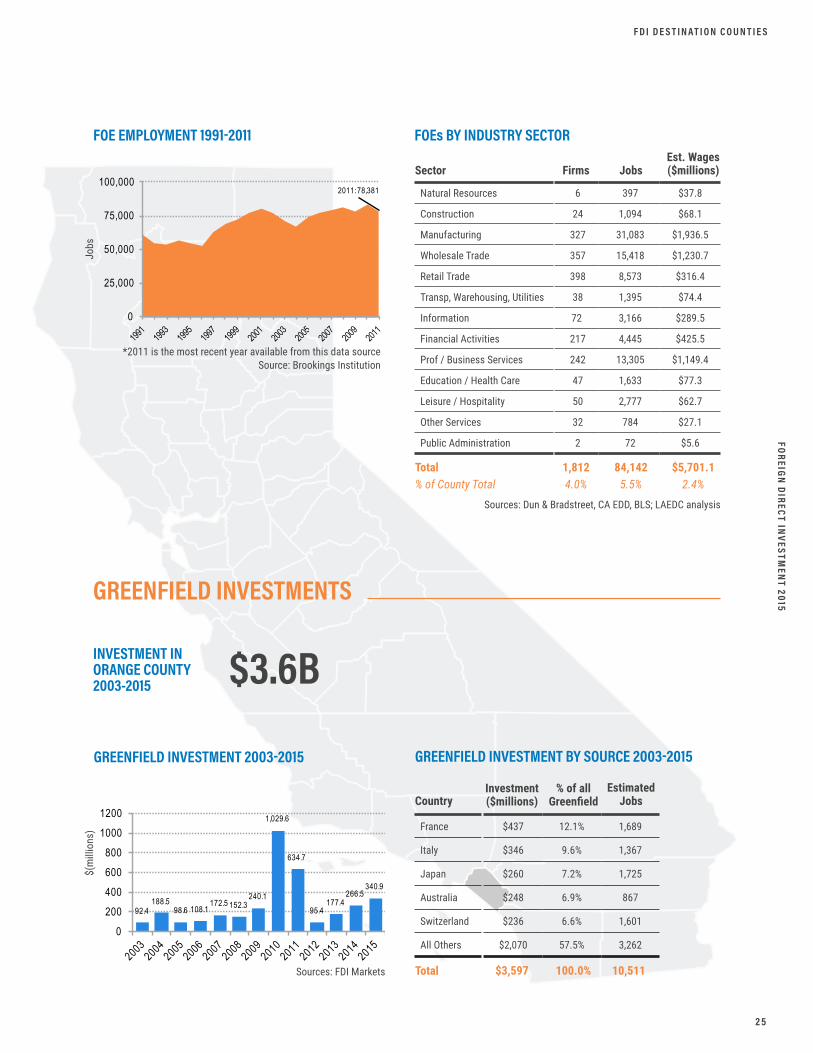
Within Southern California, Los Angeles County received $16.7 billion in greenfield investment between 2003 and 2015, accounting for 57 percent of all greenfield investment in the region. This was followed by Orange County ($4.2 billion), Riverside County ($3.9 billion) and San Diego County ($3.6 billion). Greenfield investment data for individual destination counties and by source country in the Southern California region is presented in the snapshots that follow this section.
GREENFIELD INVESTMENTSSOUTHERN CALIFORNIA AND FOREIGN INVESTMENT
230
192
147
80
58
55
52
51
California
New York
Texas
Florida
Georgia
North Carolina
Ohio
Massachusetts
Exhibit 2-1Number of Greenfield Projects: Top U.S. States 2015
Source: FDI Markets
Total N.America: 1,734 projects
Top Eight States: 865 projects
EXHIBIT 2-1Number of Greenfield Projects: Top U.S. States 2015
EXHIBIT 2-42003-2015 SoCal Greenfield Investment by Destination
NY, $8.8, 12.8%
TX, $7.5, 10.9%
FL, $5.2, 7.6%
CA$4.05.8%
OH$3.24.7%
TN$2.84.1%
AL$2.73.9%
LA$2.43.5% Rest of N.
America, $32.2, 46.8%
Exhibit 2-2Greenfield FDI Investment: Top U.S States in 2015North America (US$ billions)
Source: FDI Markets
Total N. America: $68.8 billion
Top Eight States: $36.6 billion
53.2 percent of total
EXHIBIT 2-2Greenfield FDI Investment: Top U.S. States in 2015 North America ($billions)
EXHIBIT 2-32003-2015 SoCal Greenfield Investment by Source
California is the state with the largest number of greenfield FDI projects, recording 230 projects in 2015, more than second-ranked New York and third-ranked Texas. In terms of investment, California received $4.0 billion in 2015, less than Florida ($5.2 billion), Texas ($7.5 million) and New York ($8.8 billion).
The reader is reminded that the data may not have captured all foreign investment; in particular, smaller projects that, although small, may have been many in number.
Japan
Germany
China
U.K.
France
Australia
Italy
Spain
South Korea
Switzerland
Other
$4,481.0 15.0% 11,378
$3,590.0 12.0% 3,827
$3,281.0 11.0% 10,548
$3,208.0 10.8% 10,478
$3,052.0 10.2% 10,899
$2,207.0 7.4% 11,153
$1,731.0 5.8% 6,765
$982.0 3.3% 3,717
$979.0 3.3% 3,851
$940.0 3.2% 4,832
$5,383.0 18.0% 18,125
CountryInvestment ($millions)
% of all Greenfield
Estimated Jobs
Total $29,834.0 100.0% 76,500Source: FDI Markets
1
2
3
4
5
6
Los Angeles
Orange
Riverside
San Diego
San Bernardino
Ventura
$16,725.9 57.0% 50,744
$4,207.9 14.3% 4,584
$3,896.3 13.3% 5,986
$3,597.0 12.3% 10,511
$773.7 2.6% 4,092
$140.4 0.5% 583
CountyInvestment ($millions)Rank
% of all Greenfield
Estimated Jobs
Total $29,341.2 100.0% 76,500Source: FDI Markets

FORE
IGN
DIR
ECT
INVE
STM
ENT
2015
1 6
S O U T H E R N C A L I F O R N I A A N D F O R E I G N I N V E S T M E N T: 2 . 2 F O E S I N S O U T H E R N C A L I F O R N I A B Y C O U N T Y
There are an estimated 9,105 foreign-owned enterprises (FOEs) in Southern California with 366,415 employees and an estimated wage bill of $23.6 billion.
The bulk of FOEs are located in Los Angeles County, which hosts 4,367 FOEs representing 48.0 percent of the regional total, and more than twice as many firms as Orange County, which is ranked second with 1,812 FOEs.
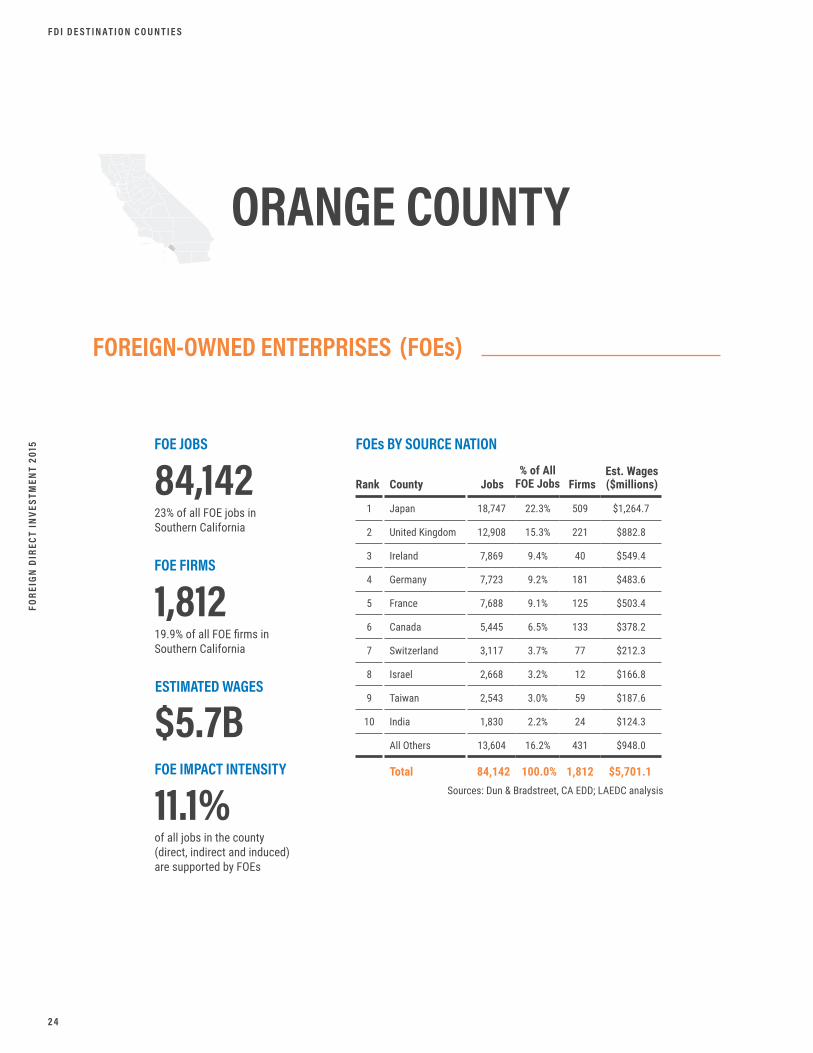
Los Angeles County also leads in terms of the number of FOE jobs in the region, with 48.4 percent of regional FOE employment. Orange County again follows with 84,142 FOE jobs, followed by Riverside with 15,998.
The estimated annual wage bill of FOEs in each destination county was estimated using county average wages paid in each industry. This assumes that wages paid in FOEs reflect the county industry average.
Estimated annual payroll in FOEs in Los Angeles County accounted for half of the regional total, followed by Orange County and San Diego County.
In terms of industry sector, almost 32 percent of FOE jobs, or 116,721, are in manufacturing, the sector with the most FOE jobs. Professional and business services held 51,222 FOE jobs, or 14 percent of all FOE jobs. Wholesale trade held the third position, with 48,613 jobs. These top three industry sectors represent 59 percent of all FOE jobs in the region.
FOES IN SOUTHERN CALIFORNIA BY COUNTY
SOUTHERN CALIFORNIA AND FOREIGN INVESTMENT
EXHIBIT 2-5Southern California FOEs by Destination County
1
2
3
4
5
6
Los Angeles
Orange
San Diego
San Bernardino
Riverside
Ventura
177,427 48.4% 4,367 $11,928
84,142 23.0% 1,812 $5,701
54,743 14.9% 1,431 $3,352
20,523 5.6% 654 $929
15,998 4.4% 502 $794
13,582 3.7% 339 $855
County Jobs FirmsRank% of All
FOE JobsEst. Wages ($millions)
Total 366,415 9,105100.0% $23,559Sources: Dun & Bradstreet, CA EDD, LAEDC Analysis
FOREIGN DIRECT IN
VESTMEN
T 2015
1 7
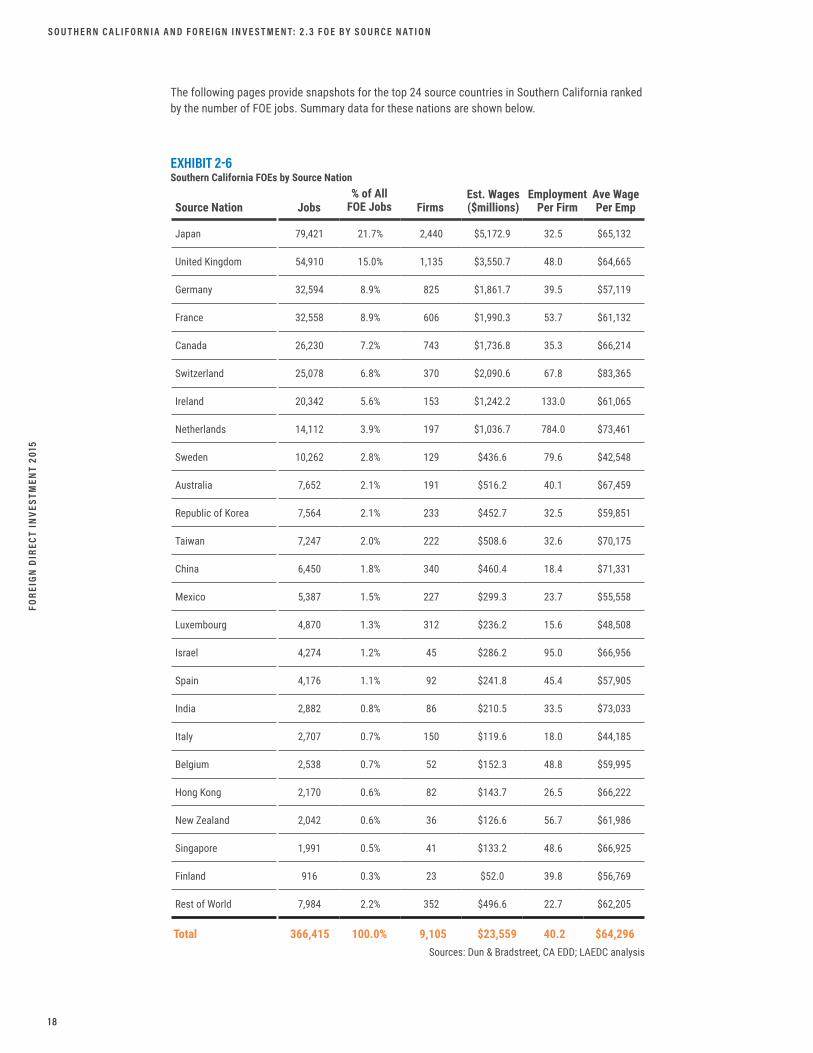
S O U T H E R N C A L I F O R N I A A N D F O R E I G N I N V E S T M E N T: 2 . 3 F O E B Y S O U R C E N AT I O N
The majority of FOE jobs in Southern California can be attributed to a relative handful of countries, including Japan, the United Kingdom, Germany, France and Canada. The top ten source nations account for 83 percent of total FOE jobs and 73 percent of FOEs.
The estimated annual wage bill of FOEs for each source country was estimated using average wages paid in each industry, in each county. This assumes that wages paid in FOEs reflect the regional industry average.
Estimated annual payroll in FOEs for the top ten source countries accounted for 83 percent of total estimated annual payroll at FOEs in the Southern California region. Japan and the United Kingdom, the two largest source countries, accounted for 37 percent of the estimated annual wage bill in the region, with 22 percent and 15 percent, respectively.
FOE BY SOURCE NATIONSOUTHERN CALIFORNIA AND FOREIGN INVESTMENT
FORE
IGN
DIR
ECT
INVE
STM
ENT
2015
1 8
S O U T H E R N C A L I F O R N I A A N D F O R E I G N I N V E S T M E N T: 2 . 3 F O E B Y S O U R C E N AT I O N
EXHIBIT 2-6Southern California FOEs by Source Nation
Sources: Dun & Bradstreet, CA EDD; LAEDC analysis
Japan
United Kingdom
Germany
France
Canada
Switzerland
Ireland
Netherlands
Sweden
Australia
Republic of Korea
Taiwan
China
Mexico
Luxembourg
Israel
Spain
India
Italy
Belgium
Hong Kong
New Zealand
Singapore
Finland
Rest of World
79,421 21.7% 2,440 $5,172.9 32.5 $65,132
54,910 15.0% 1,135 $3,550.7 48.0 $64,665
32,594 8.9% 825 $1,861.7 39.5 $57,119
32,558 8.9% 606 $1,990.3 53.7 $61,132
26,230 7.2% 743 $1,736.8 35.3 $66,214
25,078 6.8% 370 $2,090.6 67.8 $83,365
20,342 5.6% 153 $1,242.2 133.0 $61,065
14,112 3.9% 197 $1,036.7 784.0 $73,461
10,262 2.8% 129 $436.6 79.6 $42,548
7,652 2.1% 191 $516.2 40.1 $67,459
7,564 2.1% 233 $452.7 32.5 $59,851
7,247 2.0% 222 $508.6 32.6 $70,175
6,450 1.8% 340 $460.4 18.4 $71,331
5,387 1.5% 227 $299.3 23.7 $55,558
4,870 1.3% 312 $236.2 15.6 $48,508
4,274 1.2% 45 $286.2 95.0 $66,956
4,176 1.1% 92 $241.8 45.4 $57,905
2,882 0.8% 86 $210.5 33.5 $73,033
2,707 0.7% 150 $119.6 18.0 $44,185
2,538 0.7% 52 $152.3 48.8 $59,995
2,170 0.6% 82 $143.7 26.5 $66,222
2,042 0.6% 36 $126.6 56.7 $61,986
1,991 0.5% 41 $133.2 48.6 $66,925
916 0.3% 23 $52.0 39.8 $56,769
7,984 2.2% 352 $496.6 22.7 $62,205
Source Nation Jobs Firms% of All
FOE JobsEst. Wages ($millions)
EmploymentPer Firm
Ave WagePer Emp
Total 366,415 9,105 40.2100.0% $23,559 $64,296
The following pages provide snapshots for the top 24 source countries in Southern California ranked by the number of FOE jobs. Summary data for these nations are shown below.

FOREIGN DIRECT IN
VESTMEN
T 2015
1 9

FORE
IGN
DIR
ECT
INVE
STM
ENT
2015
2 0
F D I D E S T I N AT I O N C O U N T I E S
FOEs BY SOURCE NATION
1
2
3
4
5
6
7
8
9
10
Japan
United Kingdom
Germany
France
Canada
Switzerland
Ireland
Netherlands
Sweden
Australia
All Others
79,421 21.7% 2,440 $5,172.9
54,910 15.0% 1,145 $3,550.7
32,594 8.9% 825 $1,861.7
32,558 8.9% 606 $1,990.3
26,230 7.2% 743 $1,736.8
25,078 6.8% 370 $2,090.6
20,342 5.6% 153 $1,242.2
14,112 3.9% 197 $1,036.7
10,262 2.8% 129 $436.6
7,652 2.1% 191 $516.2
63,256 17.3% 2,306 $3,924.3
County Jobs FirmsRank% of All
FOE JobsEst. Wages ($millions)
Total 366,415 9,105100.0% $23,559.1Sources: Dun & Bradstreet, CA EDD; LAEDC analysis
SOUTHERN CALIFORNIA
FOREIGN-OWNED ENTERPRISES (FOEs)
FOE JOBS
366,415
ESTIMATED WAGES
$23.6B
FOE FIRMS
9,105
FOE IMPACT INTENSITY
8.1%of all jobs in Southern California (direct, indirect and induced) are supported by FOEs
FOREIGN DIRECT IN
VESTMEN
T 2015
2 1
F D I D E S T I N AT I O N C O U N T I E S
GREENFIELD INVESTMENT BY SOURCE 2003-2015
FOEs BY INDUSTRY SECTOR
Natural Resources
Construction
Manufacturing
Wholesale Trade
Retail Trade
Transp, Warehousing, Utilities
Information
Financial Activities
Prof / Business Services
Education / Health Care
Leisure / Hospitality
Other Services
Public Administration
Japan
China
France
Australia
Italy
All Others
41 1,827 $184.6
124 5,574 $312.2
1,316 116,721 $6,789.2
1,549 48,613 $3,304.2
2,113 36,140 $1,263.0
460 20,748 $1,148.1
509 17,744 $1,740.1
1,149 38,277 $3,956.2
1,067 51,222 $3,778.3
225 6,693 $301.5
324 17,366 $526.9
165 3,947 $134.0
63 1,543 $120.8
$4,481 15.3% 11,378
$3,281 11.2% 10,548
$2,986 10.2% 10,742
$2,193 7.5% 11,093
$1,582 5.4% 6,204
$14,818 50.5% 49,965
Sector
CountryInvestment ($millions)
Firms Jobs
% of all Greenfield
Est. Wages ($millions)
Estimated Jobs
Total% of County Total
Total $29,341
366,4154.2%
100.0%
9,1051.5%
$23,559.12.0%
94,000Sources: FDI Markets
*2011 is the most recent year available from this data source Source: Brookings Institution
Jobs
$(m
illio
ns)
Sources: Dun & Bradstreet, CA EDD, BLS; LAEDC analysis
GREENFIELD INVESTMENTS
$29.34BINVESTMENT IN SoCal 2003-2015
GREENFIELD INVESTMENT 2003-2015
FOE EMPLOYMENT 1991-2011
1906.5
1235.6 1228
525.2
1222
2287
3014.5
4762.1
1903.51510
3200.5
4734.7
1802.7
0
1000
2000
3000
4000
5000
6000
2011: 367,826
200,000230,000260,000290,000320,000350,000380,000410,000
* 2011 is the most recent year available from this data sourceSource: Brookings Institution

FORE
IGN
DIR
ECT
INVE
STM
ENT
2015
2 2
FOEs BY SOURCE NATION
1
2
3
4
5
6
7
8
9
10
Japan
United Kingdom
Switzerland
Germany
France
Canada
Netherlands
Ireland
Sweden
Australia
All Others
42,000 23.7% 1,263 $2,813.8
26,020 14.7% 526 $1,721.1
16,110 9.1% 168 $1,551.1
15,330 8.6% 357 $875.9
14,990 8.4% 314 $964.6
11,580 6.5% 286 $820.2
6,670 3.8% 87 $532.4
5,740 3.2% 49 $332.3
4,840 2.7% 59 $196.6
4,240 2.4% 101 $293.6
29,907 16.8% 1,157 $1,826.4
County Jobs FirmsRank% of All
FOE JobsEst. Wages ($millions)
Total 177,427 4,367100.0% $11,928.0Sources: Dun & Bradstreet, CA EDD; LAEDC analysis
LOS ANGELESCOUNTY
FOREIGN-OWNED ENTERPRISES (FOEs)
FOE JOBS
177,427
4,367
ESTIMATED WAGES
$11.9B
FOE FIRMS
FOE IMPACT INTENSITY
8.4%of all jobs in the county (direct, indirect and induced) are supported by FOEs
48.4% of all FOE jobs in Southern California
48.0% of all FOE firms in Southern California
F D I D E S T I N AT I O N C O U N T I E S

FOREIGN DIRECT IN
VESTMEN
T 2015
2 3
GREENFIELD INVESTMENT BY SOURCE 2003-2015
FOEs BY INDUSTRY SECTOR
Natural Resources
Construction
Manufacturing
Wholesale Trade
Retail Trade
Transp, Warehousing, Utilities
Information
Financial Activities
Prof / Business Services
Education / Health Care
Leisure / Hospitality
Other Services
Public Administration
China
Japan
France
Australia
Italy
All Others
17 916 $119.2
43 1,777 $101.9
481 38,281 $2,192.5
759 23,386 $1,384.3
928 15,495 $540.9
317 16,056 $896.4
315 12,225 $1,270.3
569 26,855 $2,996.7
517 25,424 $1,770.4
82 3,065 $134.1
208 11,142 $393.8
78 2,185 $77.0
53 620 $50.5
$3,207 19.2% 10,297
$2,923 17.5% 7,507
$1,507 9.0% 6,488
$1,398 8.4% 6,609
$924 5.5% 3,623
$6,767 40.5% 16,220
Sector
CountryInvestment ($millions)
Firms Jobs
% of all Greenfield
Est. Wages ($millions)
Estimated Jobs
Total% of County Total
Total $16,725
177,4274.2%
100.0%
4,3671.0%
$11,9282.0%
50,744
*2011 is the most recent year available from this data source Source: Brookings Institution
Jobs
Sources: Dun & Bradstreet, CA EDD, BLS; LAEDC analysis
GREENFIELD INVESTMENTS
$16.72BINVESTMENT IN LOS ANGELES COUNTY 2003-2015
GREENFIELD INVESTMENT 2003-2015
FOE EMPLOYMENT 1991-2011
2011: 192,800
0
50,000
100,000
150,000
200,000
250,000
* 2011 is the most recent year available from this data sourceSource: Brookings Institution
$(m
illio
ns)
1,595.8
907.9643.6
328.2673.3
1,913.5
1,294.1
837.9 713.4995.3
2,383.2
3,146.9
1,292.8
0500
100015002000250030003500
Source: FDI MarketsSources: FDI Markets
F D I D E S T I N AT I O N C O U N T I E S
FORE
IGN
DIR
ECT
INVE
STM
ENT
2015
2 4
FOEs BY SOURCE NATION
1
2
3
4
5
6
7
8
9
10
Japan
United Kingdom
Ireland
Germany
France
Canada
Switzerland
Israel
Taiwan
India
All Others
18,747 22.3% 509 $1,264.7
12,908 15.3% 221 $882.8
7,869 9.4% 40 $549.4
7,723 9.2% 181 $483.6
7,688 9.1% 125 $503.4
5,445 6.5% 133 $378.2
3,117 3.7% 77 $212.3
2,668 3.2% 12 $166.8
2,543 3.0% 59 $187.6
1,830 2.2% 24 $124.3
13,604 16.2% 431 $948.0
County Jobs FirmsRank% of All
FOE JobsEst. Wages ($millions)
Total 84,142 1,812100.0% $5,701.1Sources: Dun & Bradstreet, CA EDD; LAEDC analysis
ORANGE COUNTY
FOREIGN-OWNED ENTERPRISES (FOEs)
FOE JOBS
84,142
1,812
ESTIMATED WAGES
$5.7B
FOE FIRMS
FOE IMPACT INTENSITY
11.1%of all jobs in the county (direct, indirect and induced) are supported by FOEs
23% of all FOE jobs in Southern California
19.9% of all FOE firms in Southern California
F D I D E S T I N AT I O N C O U N T I E S
FOREIGN DIRECT IN
VESTMEN
T 2015
2 5
GREENFIELD INVESTMENT BY SOURCE 2003-2015
FOEs BY INDUSTRY SECTOR
Natural Resources
Construction
Manufacturing
Wholesale Trade
Retail Trade
Transp, Warehousing, Utilities
Information
Financial Activities
Prof / Business Services
Education / Health Care
Leisure / Hospitality
Other Services
Public Administration
France
Italy
Japan
Australia
Switzerland
All Others
6 397 $37.8
24 1,094 $68.1
327 31,083 $1,936.5
357 15,418 $1,230.7
398 8,573 $316.4
38 1,395 $74.4
72 3,166 $289.5
217 4,445 $425.5
242 13,305 $1,149.4
47 1,633 $77.3
50 2,777 $62.7
32 784 $27.1
2 72 $5.6
$437 12.1% 1,689
$346 9.6% 1,367
$260 7.2% 1,725
$248 6.9% 867
$236 6.6% 1,601
$2,070 57.5% 3,262
Sector
CountryInvestment ($millions)
Firms Jobs
% of all Greenfield
Est. Wages ($millions)
Estimated Jobs
Total% of County Total
Total $3,597
84,1425.5%
100.0%
1,8124.0%
$5,701.12.4%
10,511
*2011 is the most recent year available from this data source Source: Brookings Institution
Jobs
Sources: Dun & Bradstreet, CA EDD, BLS; LAEDC analysis
GREENFIELD INVESTMENTS
$3.6BINVESTMENT IN ORANGE COUNTY 2003-2015
GREENFIELD INVESTMENT 2003-2015
FOE EMPLOYMENT 1991-2011
2011: 78,381
0
25,000
50,000
75,000
100,000
* 2011 is the most recent year available from this data sourceSource: Brookings Institution
$(m
illio
ns)
92.4188.5
98.6 108.1172.5 152.3
240.1
1,029.6
634.7
95.4177.4
266.5340.9
0
200
400
600
800
1000
1200
Source: FDI MarketsSources: FDI Markets
F D I D E S T I N AT I O N C O U N T I E S
FORE
IGN
DIR
ECT
INVE
STM
ENT
2015
2 6
FOEs BY SOURCE NATION
1
2
3
4
5
6
7
8
9
10
United Kingdom
Japan
Ireland
Germany
Canada
Netherlands
France
Switzerland
Republic of Korea
Sweden
All Others
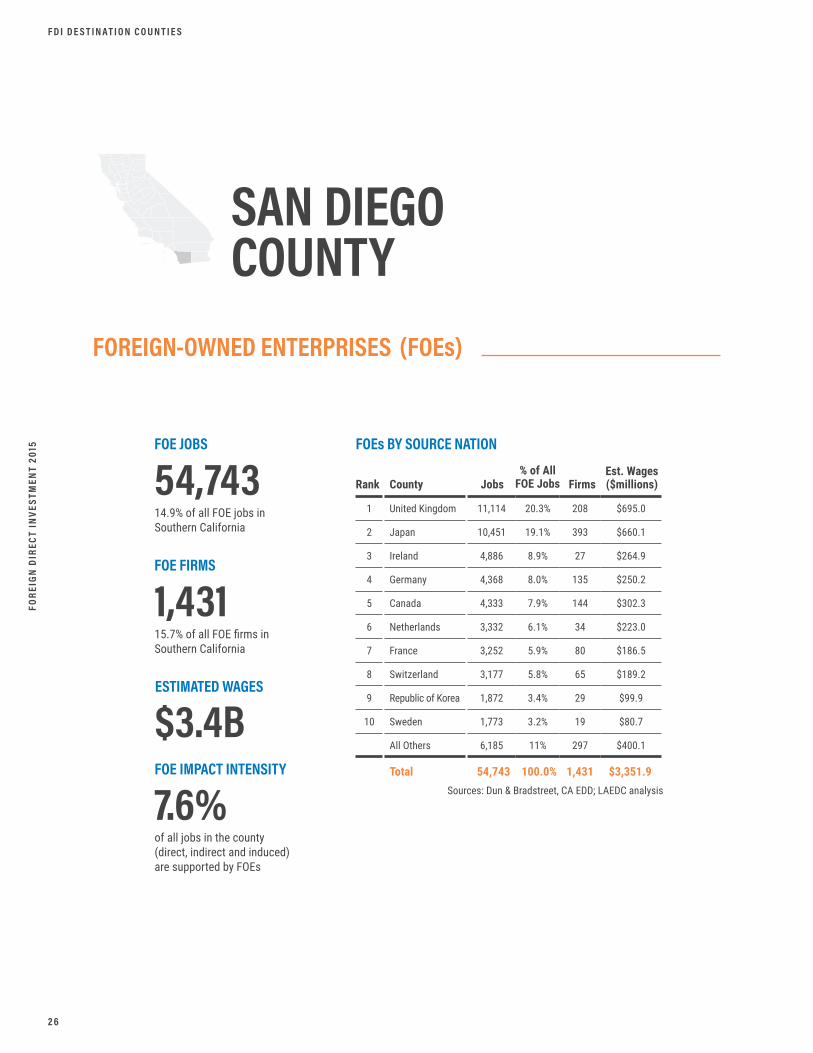
11,114 20.3% 208 $695.0
10,451 19.1% 393 $660.1
4,886 8.9% 27 $264.9
4,368 8.0% 135 $250.2
4,333 7.9% 144 $302.3
3,332 6.1% 34 $223.0
3,252 5.9% 80 $186.5
3,177 5.8% 65 $189.2
1,872 3.4% 29 $99.9
1,773 3.2% 19 $80.7
6,185 11% 297 $400.1
County Jobs FirmsRank% of All
FOE JobsEst. Wages ($millions)
Total 54,743 1,431100.0% $3,351.9Sources: Dun & Bradstreet, CA EDD; LAEDC analysis
SAN DIEGO COUNTY
FOREIGN-OWNED ENTERPRISES (FOEs)
FOE JOBS
54,743
1,431
ESTIMATED WAGES
$3.4B
FOE FIRMS
FOE IMPACT INTENSITY
7.6%of all jobs in the county (direct, indirect and induced) are supported by FOEs
14.9% of all FOE jobs in Southern California
15.7% of all FOE firms in Southern California
F D I D E S T I N AT I O N C O U N T I E S

FOREIGN DIRECT IN
VESTMEN
T 2015
2 7
GREENFIELD INVESTMENT BY SOURCE 2003-2015
FOEs BY INDUSTRY SECTOR
Natural Resources
Construction
Manufacturing
Wholesale Trade
Retail Trade
Transp, Warehousing, Utilities
Information
Financial Activities
Prof / Business Services
Education / Health Care
Leisure / Hospitality
Other Services
Public Administration
Japan
France
Germany
Canada
Spain
All Others
2 114 $3.6
28 833 $47.7
243 23,481 $1,371.4
191 3,959 $283.8
369 6,960 $242.7
40 1,030 $74.4
57 1,433 $126.0
185 4,015 $339.3
201 8,250 $679.8
54 1,171 $54.6
25 1,939 $42.6
28 707 $21.2
8 851 $64.8
$1,065 27.3% 913
$372 9.5% 890
$299 7.7% 626
$227 5.8% 903
$137 3.5% 464
$1,796 46.1% 2,193
Sector
CountryInvestment ($millions)
Firms Jobs
% of all Greenfield
Est. Wages ($millions)
Estimated Jobs
Total% of County Total
Total $3,896
54,7434.0%
100.0%
1,4311.4%
$3,351.91.8%
5,986
*2011 is the most recent year available from this data source Source: Brookings Institution
Jobs
Sources: Dun & Bradstreet, CA EDD, BLS; LAEDC analysis
GREENFIELD INVESTMENTS
$3.9BINVESTMENT IN SAN DIEGO COUNTY 2003-2015
GREENFIELD INVESTMENT 2003-2015
FOE EMPLOYMENT 1991-2011
2011: 48,730
0
25,000
50,000
75,000
100,000
* 2011 is the most recent year available from this data sourceSource: Brookings Institution
$(m
illio
ns)
155.139.5
228.182.5
183.9 167.8
1,374.3
304.4 372.2 352.5 373.6181.8
80.6
0200400600800
1000120014001600
Source: FDI MarketsSources: FDI Markets
F D I D E S T I N AT I O N C O U N T I E S
FORE
IGN
DIR
ECT
INVE
STM
ENT
2015
2 8
FOEs BY SOURCE NATION
1
2
3
4
5
6
7
8
9
10
Japan
Canada
France
Germany
United Kingdom
Mexico
Sweden
Switzerland
Australia
Ireland
All Others
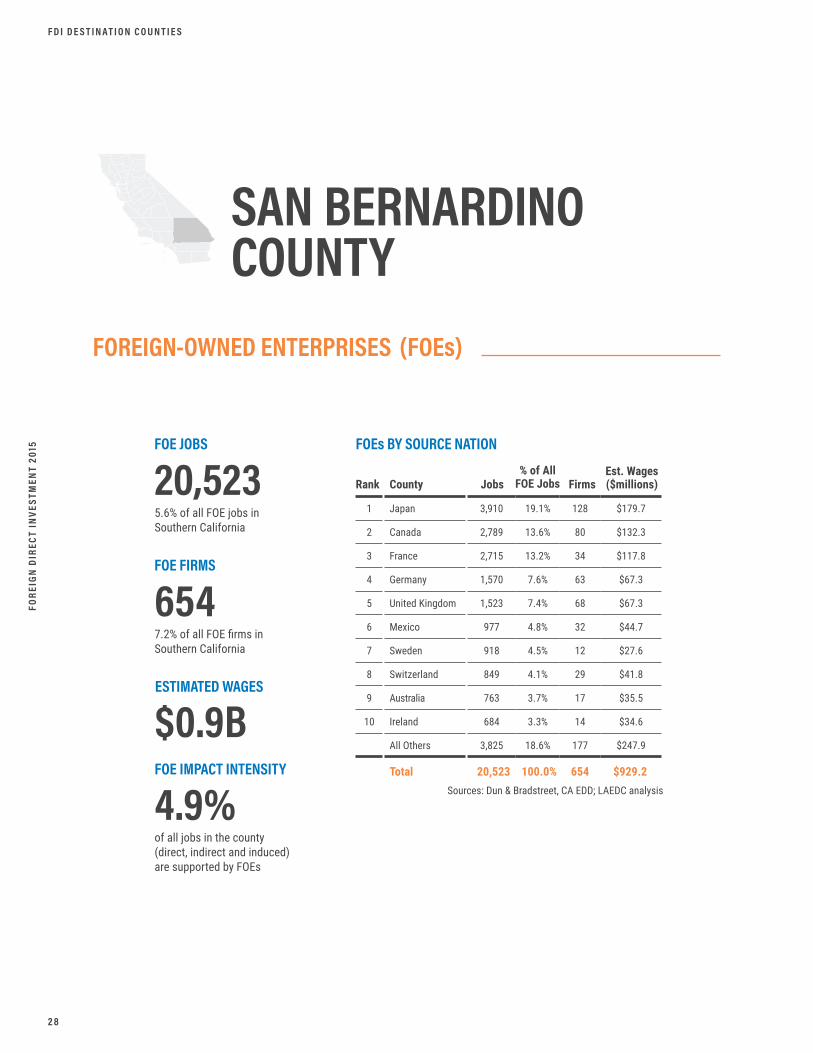
3,910 19.1% 128 $179.7
2,789 13.6% 80 $132.3
2,715 13.2% 34 $117.8
1,570 7.6% 63 $67.3
1,523 7.4% 68 $67.3
977 4.8% 32 $44.7
918 4.5% 12 $27.6
849 4.1% 29 $41.8
763 3.7% 17 $35.5
684 3.3% 14 $34.6
3,825 18.6% 177 $247.9
County Jobs FirmsRank% of All
FOE JobsEst. Wages ($millions)
Total 20,523 654100.0% $929.2Sources: Dun & Bradstreet, CA EDD; LAEDC analysis
SAN BERNARDINO COUNTY
FOREIGN-OWNED ENTERPRISES (FOEs)
FOE JOBS
20,523
654
ESTIMATED WAGES
$0.9B
FOE FIRMS
FOE IMPACT INTENSITY
4.9%of all jobs in the county (direct, indirect and induced) are supported by FOEs
5.6% of all FOE jobs in Southern California
7.2% of all FOE firms in Southern California
F D I D E S T I N AT I O N C O U N T I E S

FOREIGN DIRECT IN
VESTMEN
T 2015
2 9
GREENFIELD INVESTMENT BY SOURCE 2003-2015
FOEs BY INDUSTRY SECTOR
Natural Resources
Construction
Manufacturing
Wholesale Trade
Retail Trade
Transp, Warehousing, Utilities
Information
Financial Activities
Prof / Business Services
Education / Health Care
Leisure / Hospitality
Other Services
Public Administration
Australia
Japan
France
Hong Kong
Germany
All Others
6 137 $6.9
16 422 $22.2
122 8,353 $397.6
113 3,422 $183.2
185 2,570 $81.0
40 1,539 $72.8
28 503 $30.1
52 700 $38.8
45 1,749 $68.4
19 261 $11.5
17 744 $12.7
11 123 $4.0
- - -
$306 39.6% 2,189
$116 15.0% 712
$79 10.2% 324
$64 8.2% 292
$44 5.7% 196
$164.7 21.3% 379
Sector
CountryInvestment ($millions)
Firms Jobs
% of all Greenfield
Est. Wages ($millions)
Estimated Jobs
Total% of County Total
Total $773.7
20,5233.0%
100.0%
6541.3%
$929.21.4%
4,092
*2011 is the most recent year available from this data source Source: Brookings Institution
Jobs
Sources: Dun & Bradstreet, CA EDD, BLS; LAEDC analysis
GREENFIELD INVESTMENTS
$774MMINVESTMENT IN SAN BERNARDINO COUNTY 2003-2015
GREENFIELD INVESTMENT 2003-2015
FOE EMPLOYMENT 1991-2011
2011: 20,682
0
5,000
10,000
15,000
20,000
25,000
30,000
* 2011 is the most recent year available from this data sourceSource: Brookings Institution
$(m
illio
ns)
16.134.7
6.4
101.2
8.6
90.6
40.3
126.3
2.9
331.7
14.9
050
100150200250300350
Source: FDI MarketsSources: FDI Markets
F D I D E S T I N AT I O N C O U N T I E S
FORE
IGN
DIR
ECT
INVE
STM
ENT
2015
3 0
FOEs BY SOURCE NATION
1
2
3
4
5
6
7
8
9
10
Germany
Japan
United Kingdom
Switzerland
Canada
Sweden
France
Spain
Ireland
Belgium
All Others
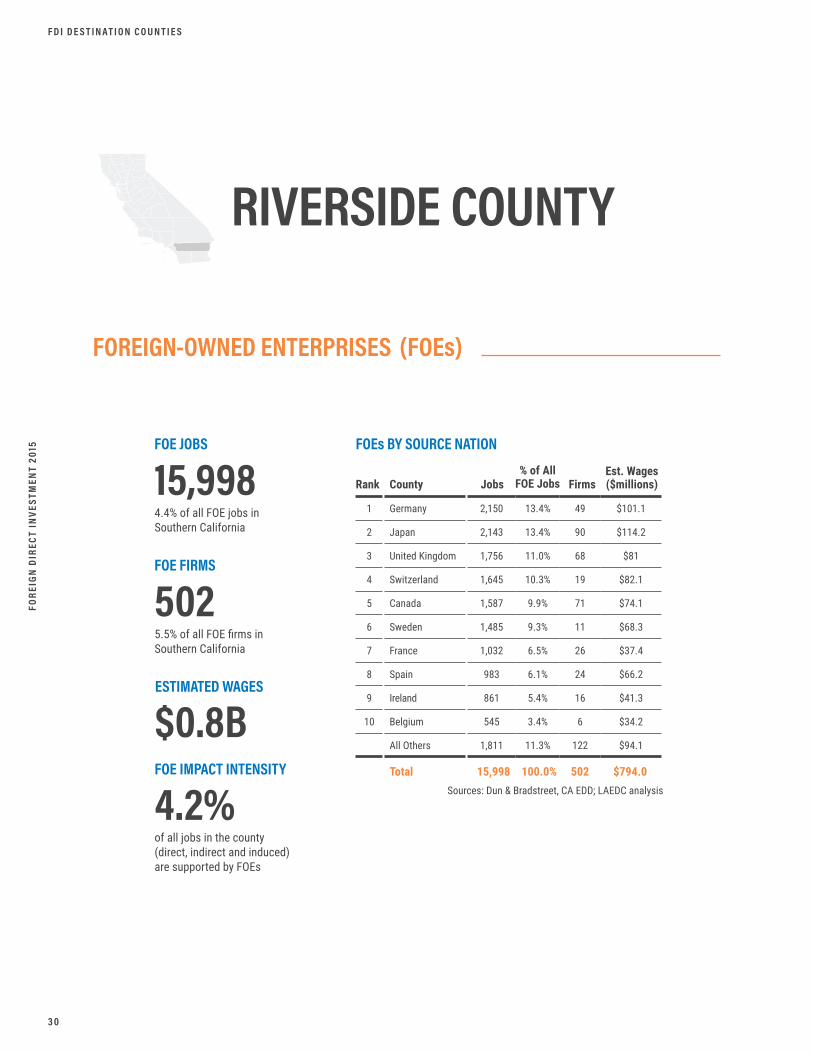
2,150 13.4% 49 $101.1
2,143 13.4% 90 $114.2
1,756 11.0% 68 $81
1,645 10.3% 19 $82.1
1,587 9.9% 71 $74.1
1,485 9.3% 11 $68.3
1,032 6.5% 26 $37.4
983 6.1% 24 $66.2
861 5.4% 16 $41.3
545 3.4% 6 $34.2
1,811 11.3% 122 $94.1
County Jobs FirmsRank% of All
FOE JobsEst. Wages ($millions)
Total 15,998 502100.0% $794.0Sources: Dun & Bradstreet, CA EDD; LAEDC analysis
RIVERSIDE COUNTY
FOREIGN-OWNED ENTERPRISES (FOEs)
FOE JOBS
15,998
502
ESTIMATED WAGES
$0.8B
FOE FIRMS
FOE IMPACT INTENSITY
4.2%of all jobs in the county (direct, indirect and induced) are supported by FOEs
4.4% of all FOE jobs in Southern California
5.5% of all FOE firms in Southern California
F D I D E S T I N AT I O N C O U N T I E S
FOREIGN DIRECT IN
VESTMEN
T 2015
3 1
GREENFIELD INVESTMENT BY SOURCE 2003-2015
FOEs BY INDUSTRY SECTOR
Natural Resources
Construction
Manufacturing
Wholesale Trade
Retail Trade
Transp, Warehousing, Utilities
Information
Financial Activities
Prof / Business Services
Education / Health Care
Leisure / Hospitality
Other Services
Public Administration
Germany
France
Italy
Australia
Japan
All Others
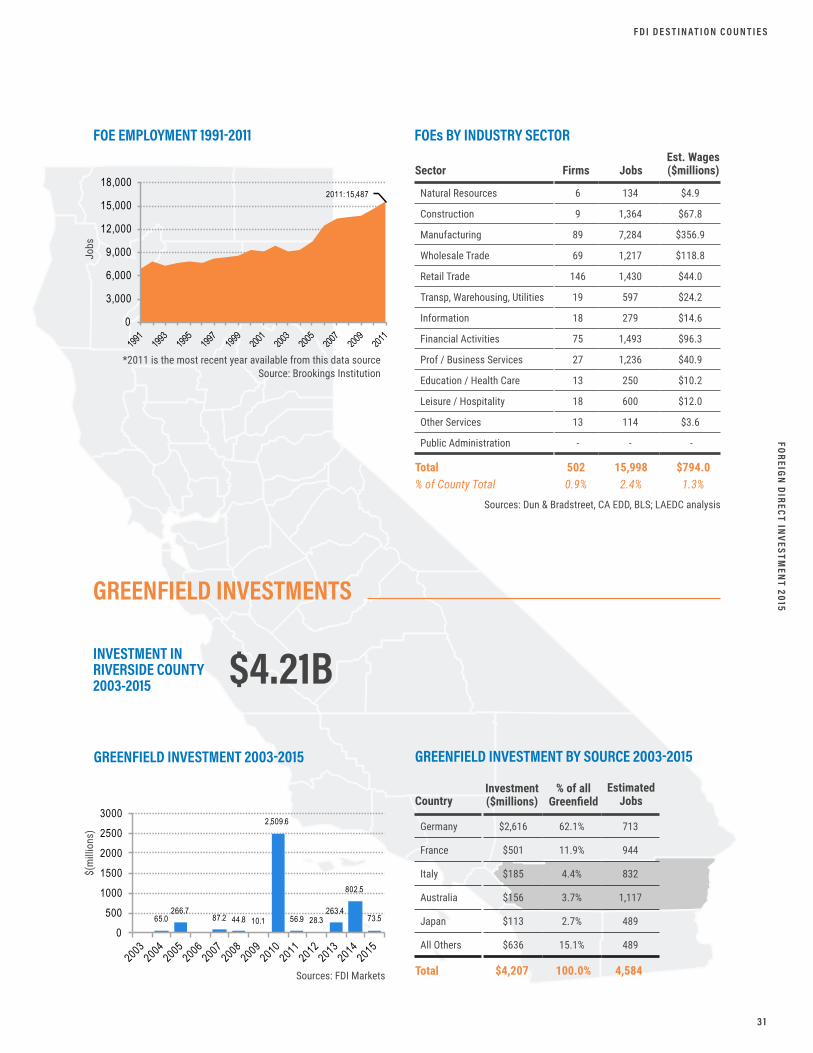
6 134 $4.9
9 1,364 $67.8
89 7,284 $356.9
69 1,217 $118.8
146 1,430 $44.0
19 597 $24.2
18 279 $14.6
75 1,493 $96.3
27 1,236 $40.9
13 250 $10.2
18 600 $12.0
13 114 $3.6
- - -
$2,616 62.1% 713
$501 11.9% 944
$185 4.4% 832
$156 3.7% 1,117
$113 2.7% 489
$636 15.1% 489
Sector
CountryInvestment ($millions)
Firms Jobs
% of all Greenfield
Est. Wages ($millions)
Estimated Jobs
Total% of County Total
Total $4,207
15,9982.4%
100.0%
5020.9%
$794.01.3%
4,584
*2011 is the most recent year available from this data source Source: Brookings Institution
Jobs
Sources: Dun & Bradstreet, CA EDD, BLS; LAEDC analysis
GREENFIELD INVESTMENTS
$4.21BINVESTMENT IN RIVERSIDE COUNTY 2003-2015
GREENFIELD INVESTMENT 2003-2015
FOE EMPLOYMENT 1991-2011
2011: 15,487
0
3,000
6,000
9,000
12,000
15,000
18,000
* 2011 is the most recent year available from this data sourceSource: Brookings Institution
$(m
illio
ns)
65.0266.7
87.2 44.8 10.1
2,509.6
56.9 28.3263.4
802.5
73.5
0
500
1000
1500
2000
2500
3000
Source: FDI MarketsSources: FDI Markets
F D I D E S T I N AT I O N C O U N T I E S
FORE
IGN
DIR
ECT
INVE
STM
ENT
2015
3 2
FOEs BY SOURCE NATION
1
2
3
4
5
6
7
8
9
10
France
Japan
Netherlands
United Kingdom
Germany
Sweden
Canada
Republic of Korea
Belgium
Mexico
All Others
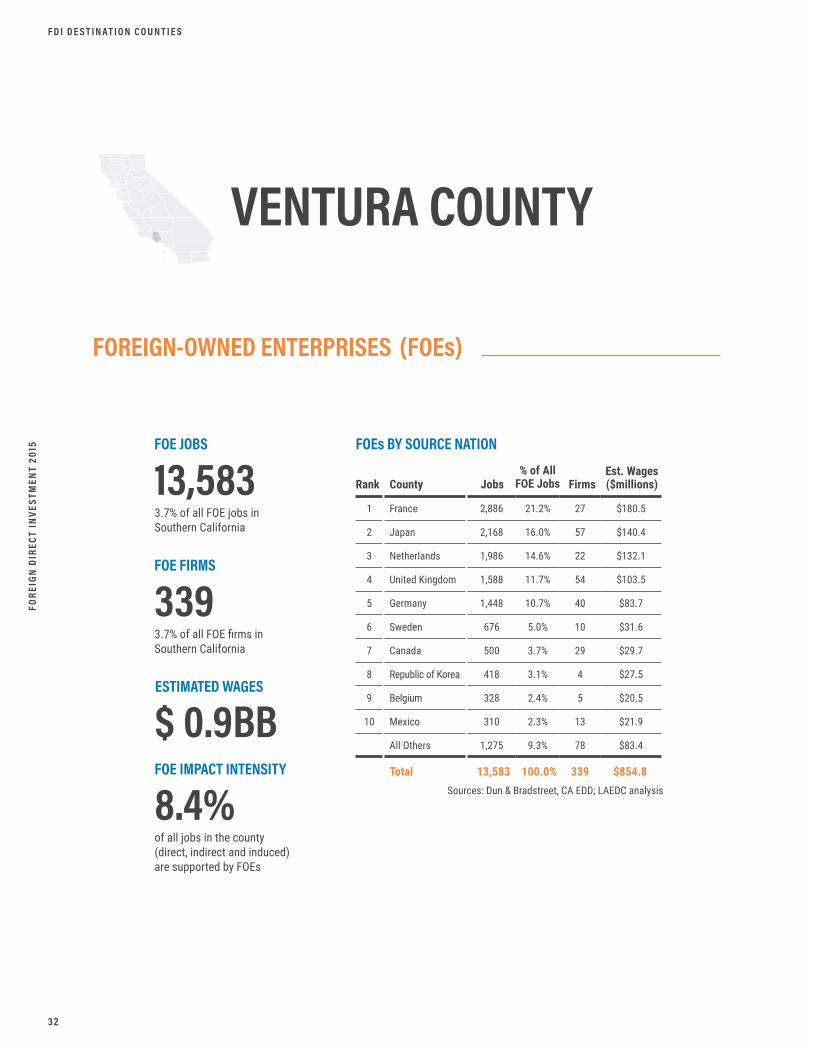
2,886 21.2% 27 $180.5
2,168 16.0% 57 $140.4
1,986 14.6% 22 $132.1
1,588 11.7% 54 $103.5
1,448 10.7% 40 $83.7
676 5.0% 10 $31.6
500 3.7% 29 $29.7
418 3.1% 4 $27.5
328 2.4% 5 $20.5
310 2.3% 13 $21.9
1,275 9.3% 78 $83.4
County Jobs FirmsRank% of All
FOE JobsEst. Wages ($millions)
Total 13,583 339100.0% $854.8Sources: Dun & Bradstreet, CA EDD; LAEDC analysis
VENTURA COUNTY
FOREIGN-OWNED ENTERPRISES (FOEs)
FOE JOBS
13,583
339
ESTIMATED WAGES
$ 0.9BB
FOE FIRMS
FOE IMPACT INTENSITY
8.4%of all jobs in the county (direct, indirect and induced) are supported by FOEs
3.7% of all FOE jobs in Southern California
3.7% of all FOE firms in Southern California
F D I D E S T I N AT I O N C O U N T I E S

FOREIGN DIRECT IN
VESTMEN
T 2015
3 3
GREENFIELD INVESTMENT BY SOURCE 2003-2015
FOEs BY INDUSTRY SECTOR
Natural Resources
Construction
Manufacturing
Wholesale Trade
Retail Trade
Transp, Warehousing, Utilities
Information
Financial Activities
Prof / Business Services
Education / Health Care
Leisure / Hospitality
Other Services
Public Administration
France
Germany
Netherlands
Japan
Sweden
All Others
4 129 $12.2
4 84 $4.4
54 8,239 $534.3
60 1,211 $103.4
87 1,112 $38.0
6 131 $5.9
19 138 $9.7
51 769 $59.6
35 1,258 $69.4
10 313 $13.9
6 164 $3.1
3 34 $1.0
- - -
$89 63.4% 407
$27 19.2% 50
$10 7.1% 38
$4 2.9% 33
$3 2.1% 30
$5.4 5.3% 25
Sector
CountryInvestment ($millions)
Firms Jobs
% of all Greenfield
Est. Wages ($millions)
Estimated Jobs
Total% of County Total
Total $140.1
13,5824.3%
100.0%
3391.5%
$854.82.0%
583
*2011 is the most recent year available from this data source Source: Brookings Institution
Jobs
Sources: Dun & Bradstreet, CA EDD, BLS; LAEDC analysis
GREENFIELD INVESTMENTS
$140MMINVESTMENT IN VENTURA COUNTY 2003-2015
GREENFIELD INVESTMENT 2003-2015
FOE EMPLOYMENT 1991-2011
2011: 11,746
0
3,000
6,000
9,000
12,000
15,000
* 2011 is the most recent year available from this data sourceSource: Brookings Institution
$(m
illio
ns)
47.1
3.9 5.3
40.3 38.5
5.3
0
10
20
30
40
50
Source: FDI MarketsSources: FDI Markets
F D I D E S T I N AT I O N C O U N T I E S

FORE
IGN
DIR
ECT
INVE
STM
ENT
2015
3 4
JAPANESE FOEs BY DESTINATION COUNTY
GREENFIELD INVESTMENT BY DESTINATION 2003-2015
JAPANESE FOE JOBS BY SECTOR
1
2
3
4
5
6
1
2
3
4
5
6
Los Angeles
Orange
San Diego
San Bernardino
Riverside
Ventura
Los Angeles
San Diego
Orange
San Bernardino
Riverside
Ventura
42,002 52.9% 1,263 $2,813.8
18,747 23.6% 509 $1,264.7
10,451 13.2% 393 $660.1
3,910 4.9% 128 $179.7
2,143 2.7% 90 $114.1
2,168 2.7% 57 $140.4
$2,922.5 65.2% 7,507
$1,065.4 23.8% 912
$259.8 5.8% 1,725
$116.4 2.6% 712
$113.5 2.5% 489
$3.9 0.1% 33
County
County
Jobs
Investment ($millions)
FirmsRank
Rank
% of All FOE Jobs
% of all JapaneseGreenfield
Est. Wages ($millions)
Estimated Jobs
Total
Total
79,421
$4,481.5
2,440
100.0%
100.0% $5,172.9
11,378
Sources: FDI Markets
Sources: Dun & Bradstreet, CA EDD; LAEDC analysis
Sources: FDI Markets
S O U R C E N AT I O N S
JAPANNO. 01
FOREIGN-OWNED ENTERPRISES
GREENFIELD INVESTMENTS
(FOEs)TOTAL FOE JOBS
181,650includes direct, indirect & induced jobs
FOE FIRMS
2,44026.8% of all FOE firms in Southern California
JAPAN’S INVESTMENTIN SoCal 2003-2015
GREENFIELD INVESTMENT 2003-2015
$4.48B
DIRECT FOE JOBS
79,42121.7% of all FOE jobs in Southern California
ESTIMATED WAGES
$5,172.9MM
19,652
19,038
9,308
8,151
6,054
- 5,000 10,000 15,000 20,000 25,000
Manufacturing
Wholesale Trade
Retail Trade
Financial Activities
Information
1,024.9
562.8
81.7 146.6 118.5
365.1
1,160.4
206.0 124.1
62.8 136.7
277.5 214.4
0
200
400
600
800
1,000
1,200
1,400
2003
20
04
2005
20
06
2007
20
08
2009
20
10
2011
20
12
2013
20
14
2015
$ milli
ons
Source: FDI Markets
FOREIGN DIRECT IN
VESTMEN
T 2015
3 5
UK FOEs BY DESTINATION COUNTY
GREENFIELD INVESTMENT BY DESTINATION 2003-2015
UK FOE JOBS BY SECTOR
1
2
3
4
5
6
1
2
3
4
5
6
Los Angeles
Orange
San Diego
Riverside
Ventura
San Bernardino
Los Angeles
San Diego
Riverside
Orange
Ventura
San Bernardino
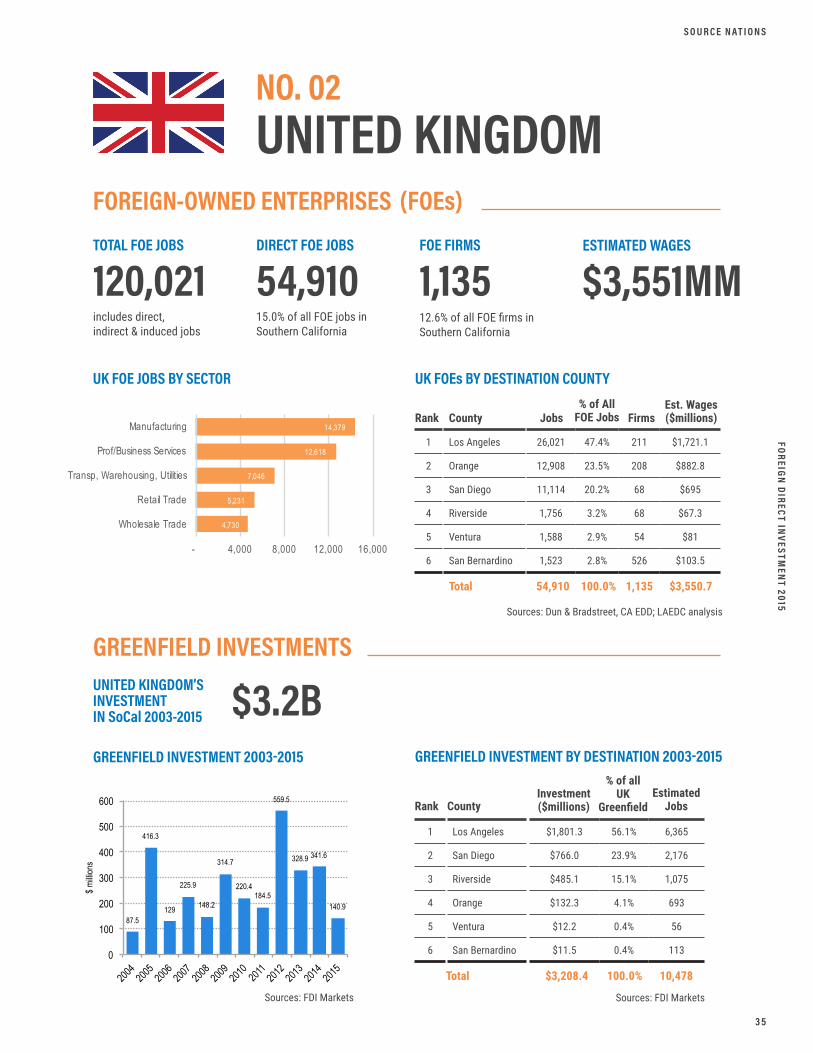
26,021 47.4% 211 $1,721.1
12,908 23.5% 208 $882.8
11,114 20.2% 68 $695
1,756 3.2% 68 $67.3
1,588 2.9% 54 $81
1,523 2.8% 526 $103.5
$1,801.3 56.1% 6,365
$766.0 23.9% 2,176
$485.1 15.1% 1,075
$132.3 4.1% 693
$12.2 0.4% 56
$11.5 0.4% 113
County
County
Jobs
Investment ($millions)
FirmsRank
Rank
% of All FOE Jobs
% of all UK
Greenfield
Est. Wages ($millions)
Estimated Jobs
Total
Total
54,910
$3,208.4
1,135
100.0%
100.0% $3,550.7
10,478
Sources: FDI Markets
Sources: Dun & Bradstreet, CA EDD; LAEDC analysis
Sources: FDI Markets
S O U R C E N AT I O N S
UNITED KINGDOMNO. 02
FOREIGN-OWNED ENTERPRISES
GREENFIELD INVESTMENTS
(FOEs)TOTAL FOE JOBS
120,021includes direct, indirect & induced jobs
FOE FIRMS
1,13512.6% of all FOE firms inSouthern California
UNITED KINGDOM’S INVESTMENTIN SoCal 2003-2015
GREENFIELD INVESTMENT 2003-2015
$3.2B
DIRECT FOE JOBS
54,91015.0% of all FOE jobs inSouthern California
ESTIMATED WAGES
$3,551MM
14,379
12,618
7,046
5,231
4,730
- 4,000 8,000 12,000 16,000
Manufacturing
Prof/Business Services
Transp, Warehousing, Utilities
Retail Trade
Wholesale Trade
87.5
416.3
129
225.9
148.2
314.7
220.4 184.5
559.5
328.9 341.6
140.9
0
100
200
300
400
500
600
2004
2005
2006
2007
2008
2009
2010
2011
2012
2013
2014
2015
$ milli
ons
Source: FDI Markets

FORE
IGN
DIR
ECT
INVE
STM
ENT
2015
3 6
GERMAN FOEs BY DESTINATION COUNTY
GREENFIELD INVESTMENT BY DESTINATION 2003-2015
GERMAN FOE JOBS BY SECTOR
1
2
3
4
5
6
1
2
3
4
5
6
Los Angeles
Orange
San Diego
Riverside
San Bernardino
Ventura
Riverside
Los Angeles
San Diego
Orange
San Bernardino
Ventura
15,335 47.0% 357 $875.9
7,723 23.7% 181 $483.6
4,368 13.4% 135 $250.2
2,150 6.6% 49 $101.0
1,570 4.8% 63 $67.3
1,448 4.4% 40 $83.7
$2,615.7 74.2% 713
$428.6 12.2% 1,525
$298.6 8.5% 624
$111.6 3.2% 562
$44.0 1.2% 196
$27.0 0.8% 50
County
County
Jobs
Investment ($millions)
FirmsRank
Rank
% of All FOE Jobs
% of all German
Greenfield
Est. Wages ($millions)
Estimated Jobs
Total
Total
32,594
$3,525.5
825
100.0%
100.0% $1,861.7
3,670Sources: FDI Markets
Sources: Dun & Bradstreet, CA EDD; LAEDC analysis
Sources: FDI Markets
S O U R C E N AT I O N S
GERMANYNO. 03
FOREIGN-OWNED ENTERPRISES
GREENFIELD INVESTMENTS
(FOEs)TOTAL FOE JOBS
73,772includes direct, indirect & induced jobs
FOE FIRMS
8259.1% of all FOE firms in Southern California
GERMANY’S INVESTMENTIN SoCal 2003-2015
GREENFIELD INVESTMENT 2003-2015
$3.53B
DIRECT FOE JOBS
32,5948.9% of all FOE jobs in Southern California
ESTIMATED WAGES
$1,862MM
13,842
7,469
2,087
1,879
1,737
- 5,000 10,000 15,000
Manufacturing
Retail Trade
Prof/Business Services
Wholesale Trade
Education/Healthcare
79.4 173.0 9.4 23.0 53.7 45.3
2,514.3
108.5 45.5 78.8
361.2
17.3
0
500
1,000
1,500
2,000
2,500
3,000
2004
2005
2006
2007
2008
2009
2010
2011
2012
2013
2014
2015
$ milli
ons
Source: FDI Markets

FOREIGN DIRECT IN
VESTMEN
T 2015
3 7
FRENCH FOEs BY DESTINATION COUNTY
GREENFIELD INVESTMENT BY DESTINATION 2003-2015
FRENCH FOE JOBS BY SECTOR
1
2
3
4
5
6
1
2
3
4
5
6
Los Angeles
Orange
San Diego
Ventura
San Bernardino
Riverside
Los Angeles
Riverside
Orange
San Diego
Ventura
San Bernardino
14,985 46.0% 314 $964.6
7,688 23.6% 125 $503.4
3,252 10.0% 80 $186.5
2,886 8.9% 27 $37.4
2,715 8.3% 34 $117.8
1,032 3.2% 26 $180.5
$1,507.4 50.5% 6,488
$501.4 16.8% 944
$436.8 14.6% 1,689
$371.9 12.5% 890
$89.3 3.0% 407
$79.3 2.7% 324
County
County
Jobs
Investment ($millions)
FirmsRank
Rank
% of All FOE Jobs
% of all French
Greenfield
Est. Wages ($millions)
Estimated Jobs
Total
Total
32,558
$2,986.1
606
100.0%
100.0% $1990.2
10,742 Sources: FDI Markets
Sources: Dun & Bradstreet, CA EDD; LAEDC analysis
Sources: FDI Markets
S O U R C E N AT I O N S
FRANCENO. 04
FOREIGN-OWNED ENTERPRISES
GREENFIELD INVESTMENTS
(FOEs)TOTAL FOE JOBS
74,868includes direct, indirect & induced jobs
FOE FIRMS
6066.7% of all FOE firms in Southern California
FRANCE’S INVESTMENTIN SoCal 2003-2015
GREENFIELD INVESTMENT 2003-2015
$2.99B
DIRECT FOE JOBS
32,5589.0% of all FOE jobs in Southern California
ESTIMATED WAGES
$1,990MM
13,828
4,767
4,401
2,954
1,471
- 5,000 10,000 15,000
Manufacturing
Prof/Business Services
Leisure/Hospitality Transp, Warehousing,
Utilities Information
91.7 49.4
14.8
145.4
305.0
157.6
241.8
360.2
96.4
546.7 544.9
378.1
0
100
200
300
400
500
600
2004
2005
2006
2007
2008
2009
2010
2011
2012
2013
2014
2015
$ milli
ons
Source: FDI Markets

FORE
IGN
DIR
ECT
INVE
STM
ENT
2015
3 8
CANADIAN FOEs BY DESTINATION COUNTY
GREENFIELD INVESTMENT BY DESTINATION 2003-2015
CANADIAN FOE JOBS BY SECTOR
1
2
3
4
5
6
1
2
3
4
Los Angeles
Orange
San Diego
San Bernardino
Riverside
Ventura
Los Angeles
San Diego
Orange
Riverside
11,576 44.1% 286 $820.2
5,445 20.8% 133 $378.2
4,333 16.5% 144 $302.3
2,789 10.6% 80 $132.3
1,587 6.1% 71 $74.1
500 1.9% 29 $29.7
$400.5 52.7% 1,568
$227.0 29.9% 903
$74.6 9.8% 278
$57.4 7.6% 85
County
County
Jobs
Investment ($millions)
FirmsRank
Rank
% of All FOE Jobs
% of all CanadianGreenfield
Est. Wages ($millions)
Estimated Jobs
Total
Total
26,230
$759.5
743
100.0%
100.0% $1,736.8
2,834
Sources: FDI Markets
Sources: Dun & Bradstreet, CA EDD; LAEDC analysis
Sources: FDI Markets
S O U R C E N AT I O N S
CANADANO. 05
FOREIGN-OWNED ENTERPRISES
GREENFIELD INVESTMENTS
(FOEs)TOTAL FOE JOBS
59,130includes direct, indirect & induced jobs
FOE FIRMS
7438.2% of all FOE firms in Southern California
CANADA’S INVESTMENTIN SoCal 2003-2015
GREENFIELD INVESTMENT 2003-2015
$759MM
DIRECT FOE JOBS
26,2307.2% of all FOE jobs in Southern California
ESTIMATED WAGES
$1,737MM
6,171
4,410
4,306
2,767
2,025
- 2,000 4,000 6,000 8,000
Manufacturing
Prof/Business Services
Financial Activities
Wholesale Trade
Retail Trade
34.7
79.7
5.4 5.4
110.1
47.9
36.8
53.0
81.0
110.8
83.3
111.4
0
20
40
60
80
100
120
2004
2005
2006
2007
2008
2009
2010
2011
2012
2013
2014
2015
$ milli
ons
Source: FDI Markets

FOREIGN DIRECT IN
VESTMEN
T 2015
3 9
SWISS FOEs BY DESTINATION COUNTY
GREENFIELD INVESTMENT BY DESTINATION 2003-2015
SWISS FOE JOBS BY SECTOR
1
2
3
4
5
6
1
2
3
4
Los Angeles
San Diego
Orange
Riverside
San Bernardino
Ventura
Los Angeles
Orange
San Diego
Riverside
16,114 64.3% 168 $1,551.1
3,177 12.7% 65 $189.2
3,177 16.5% 77 $212.3
1,645 6.6% 19 $82.1
849 3.3% 29 $41.8
176 0.7% 12 $14.2
$498.7 53.0% 2,766
$236.0 25.1% 1,601
$182.1 19.4% 211
$23.5 2.5% 254
County
County
Jobs
Investment ($millions)
FirmsRank
Rank
% of All FOE Jobs
% of all Swiss
Greenfield
Est. Wages ($millions)
Estimated Jobs
Total
Total
25,078
$940.3
370
100.0%
68.3% $2,090.6
4,832
Sources: FDI Markets
Sources: Dun & Bradstreet, CA EDD; LAEDC analysis
Sources: FDI Markets
S O U R C E N AT I O N S
SWITZERLANDNO. 06
FOREIGN-OWNED ENTERPRISES
GREENFIELD INVESTMENTS
(FOEs)TOTAL FOE JOBS
59,261includes direct, indirect & induced jobs
FOE FIRMS
3704.1% of all FOE firms in Southern California
SWITZERLAND’S INVESTMENTIN SoCal 2003-2015
GREENFIELD INVESTMENT 2003-2015
$940MM
DIRECT FOE JOBS
25,0787.0% of all FOE jobs in Southern California
ESTIMATED WAGES
$2,091MM
11,190
8,062
2,705
1,411
575
- 2,000 4,000 6,000 8,000 10,000 12,000
Financial Activities
Manufacturing
Prof/Business Services
Wholesale Trade
Retail Trade
16.2 36.9
129.0 114.8
50.2 76.9
59.2
243.3
125.3
88.5
0
50
100
150
200
250
300
2004
2005
2006
2007
2008
2009
2010
2011
2012
2013
2014
2015
$ milli
ons
Source: FDI Markets
FORE
IGN
DIR
ECT
INVE
STM
ENT
2015
4 0
IRISH FOEs BY DESTINATION COUNTY
GREENFIELD INVESTMENT BY DESTINATION 2003-2015
IRISH FOE JOBS BY SECTOR
1
2
3
4
5
6
1
2
3
Orange
Los Angeles
San Diego
Riverside
San Bernardino
Ventura
Los Angeles
San Diego
Orange
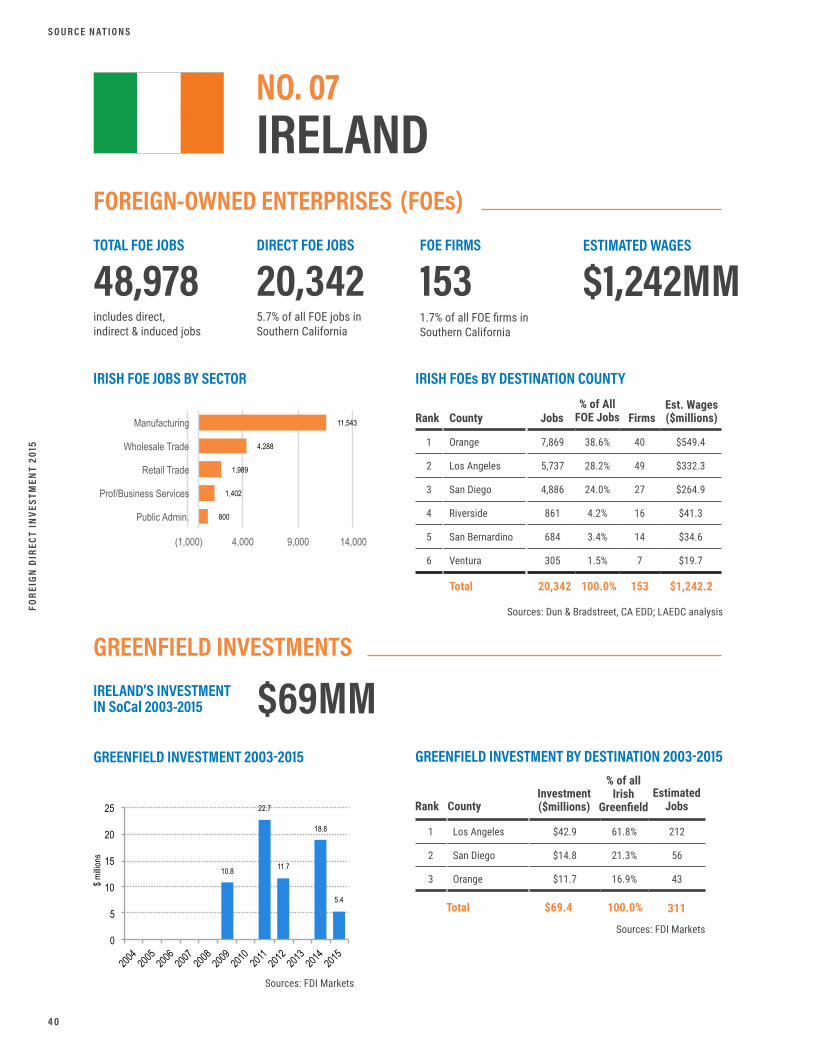
7,869 38.6% 40 $549.4
5,737 28.2% 49 $332.3
4,886 24.0% 27 $264.9
861 4.2% 16 $41.3
684 3.4% 14 $34.6
305 1.5% 7 $19.7
$42.9 61.8% 212
$14.8 21.3% 56
$11.7 16.9% 43
County
County
Jobs
Investment ($millions)
FirmsRank
Rank
% of All FOE Jobs
% of all Irish
Greenfield
Est. Wages ($millions)
Estimated Jobs
Total
Total
20,342
$69.4
153
100.0%
100.0% $1,242.2
311
Sources: FDI Markets
Sources: Dun & Bradstreet, CA EDD; LAEDC analysis
Sources: FDI Markets
S O U R C E N AT I O N S
IRELANDNO. 07
FOREIGN-OWNED ENTERPRISES
GREENFIELD INVESTMENTS
(FOEs)TOTAL FOE JOBS
48,978includes direct, indirect & induced jobs
FOE FIRMS
1531.7% of all FOE firms in Southern California
IRELAND’S INVESTMENTIN SoCal 2003-2015
GREENFIELD INVESTMENT 2003-2015
$69MM
DIRECT FOE JOBS
20,3425.7% of all FOE jobs in Southern California
ESTIMATED WAGES
$1,242MM
11,543
4,288
1,989
1,402
800
(1,000) 4,000 9,000 14,000
Manufacturing
Wholesale Trade
Retail Trade
Prof/Business Services
Public Admin.
10.8
22.7
11.7
18.8
5.4
0
5
10
15
20
25
2004
2005
2006
2007
2008
2009
2010
2011
2012
2013
2014
2015
$ milli
ons
Source: FDI Markets
FOREIGN DIRECT IN
VESTMEN
T 2015
4 1
DUTCH FOEs BY DESTINATION COUNTY
GREENFIELD INVESTMENT BY DESTINATION 2003-2015
DUTCH FOE JOBS BY SECTOR
1
2
3
4
5
6
1
2
3
4
Los Angeles
San Diego
Ventura
Orange
Riverside
San Bernardino
Los Angeles
Orange
San Diego
Ventura
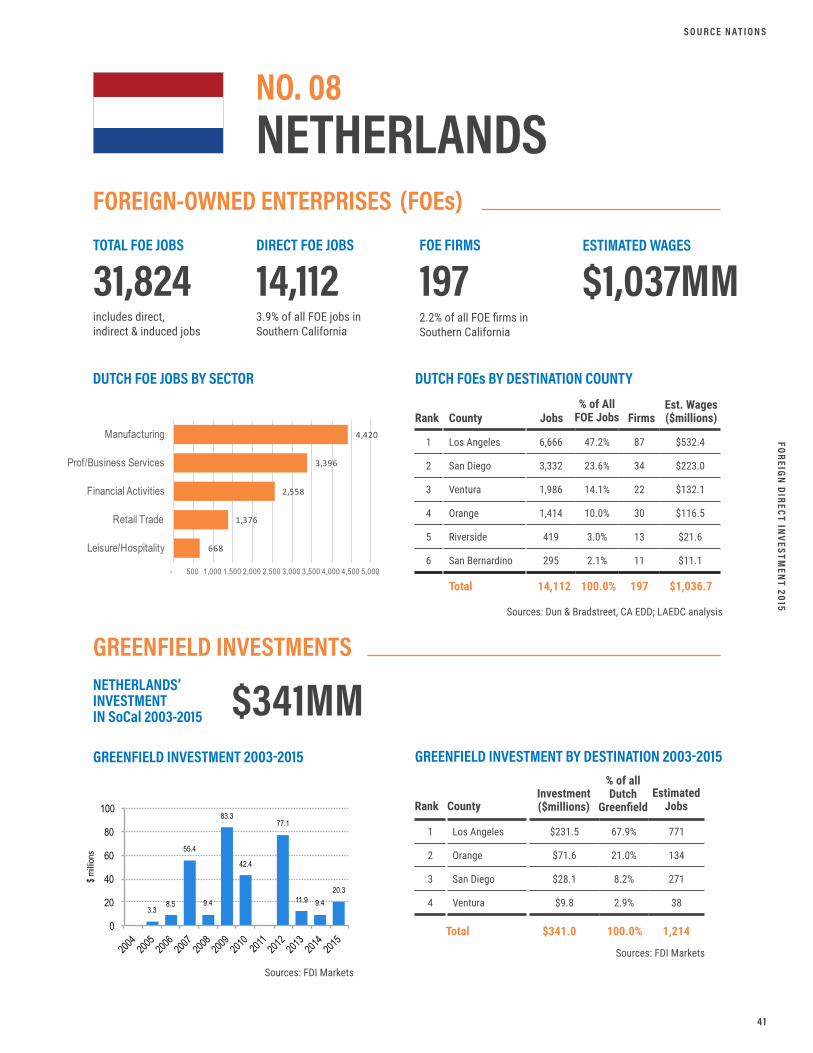
6,666 47.2% 87 $532.4
3,332 23.6% 34 $223.0
1,986 14.1% 22 $132.1
1,414 10.0% 30 $116.5
419 3.0% 13 $21.6
295 2.1% 11 $11.1
$231.5 67.9% 771
$71.6 21.0% 134
$28.1 8.2% 271
$9.8 2.9% 38
County
County
Jobs
Investment ($millions)
FirmsRank
Rank
% of All FOE Jobs
% of all Dutch
Greenfield
Est. Wages ($millions)
Estimated Jobs
Total
Total
14,112
$341.0
197
100.0%
100.0% $1,036.7
1,214
Sources: FDI Markets
Sources: Dun & Bradstreet, CA EDD; LAEDC analysis
Sources: FDI Markets
S O U R C E N AT I O N S
NETHERLANDSNO. 08
FOREIGN-OWNED ENTERPRISES
GREENFIELD INVESTMENTS
(FOEs)TOTAL FOE JOBS
31,824includes direct, indirect & induced jobs
FOE FIRMS
1972.2% of all FOE firms in Southern California
NETHERLANDS’ INVESTMENTIN SoCal 2003-2015
GREENFIELD INVESTMENT 2003-2015
$341MM
DIRECT FOE JOBS
14,1123.9% of all FOE jobs in Southern California
ESTIMATED WAGES
$1,037MM
3.3 8.5
55.4
9.4
83.3
42.4
77.1
11.9 9.4 20.3
0
20
40
60
80
100
2004
2005
2006
2007
2008
2009
2010
2011
2012
2013
2014
2015
$ milli
ons
Source: FDI Markets
4,420
3,396
2,558
1,376
668
- 500 1,000 1,500 2,000 2,500 3,000 3,500 4,000 4,500 5,000
Manufacturing
Prof/Business Services
Financial Activities
Retail Trade
Leisure/Hospitality
FORE
IGN
DIR
ECT
INVE
STM
ENT
2015
4 2
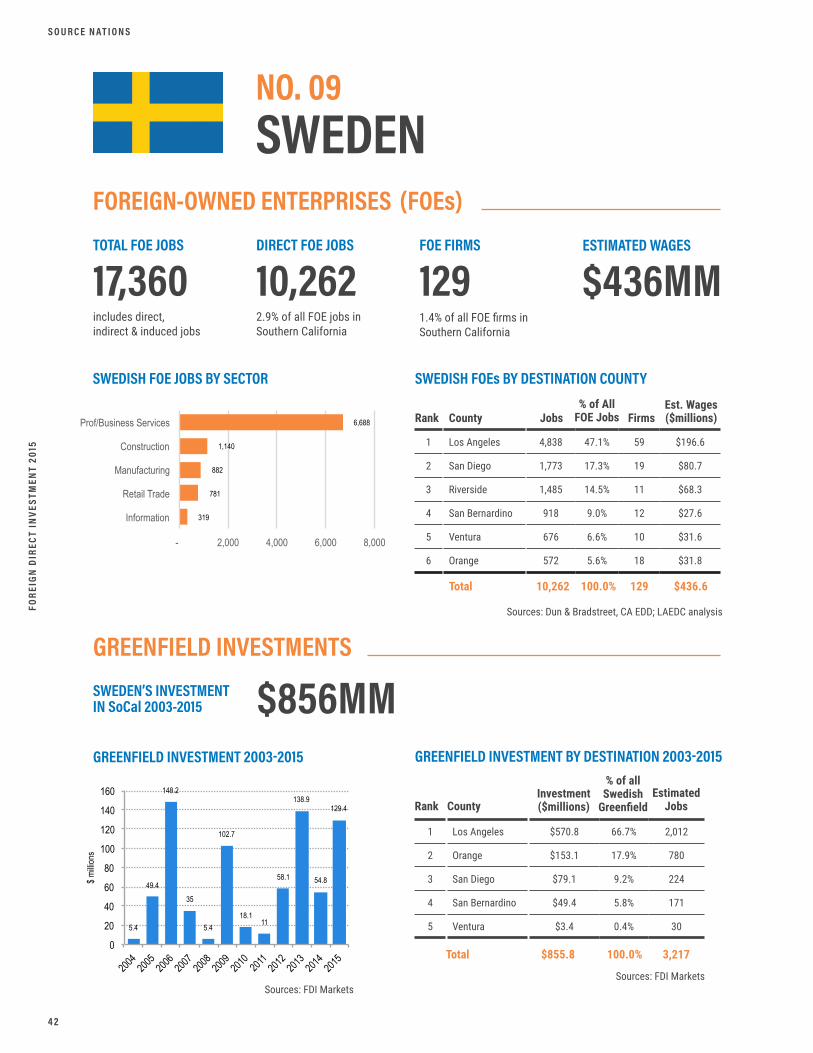
SWEDISH FOEs BY DESTINATION COUNTY
GREENFIELD INVESTMENT BY DESTINATION 2003-2015
SWEDISH FOE JOBS BY SECTOR
1
2
3
4
5
6
1
2
3
4
5
Los Angeles
San Diego
Riverside
San Bernardino
Ventura
Orange
Los Angeles
Orange
San Diego
San Bernardino
Ventura
4,838 47.1% 59 $196.6
1,773 17.3% 19 $80.7
1,485 14.5% 11 $68.3
918 9.0% 12 $27.6
676 6.6% 10 $31.6
572 5.6% 18 $31.8
$570.8 66.7% 2,012
$153.1 17.9% 780
$79.1 9.2% 224
$49.4 5.8% 171
$3.4 0.4% 30
County
County
Jobs
Investment ($millions)
FirmsRank
Rank
% of All FOE Jobs
% of all Swedish
Greenfield
Est. Wages ($millions)
Estimated Jobs
Total
Total
10,262
$855.8
129
100.0%
100.0% $436.6
3,217
Sources: FDI Markets
Sources: Dun & Bradstreet, CA EDD; LAEDC analysis
Sources: FDI Markets
S O U R C E N AT I O N S
SWEDENNO. 09
FOREIGN-OWNED ENTERPRISES
GREENFIELD INVESTMENTS
(FOEs)TOTAL FOE JOBS
17,360includes direct, indirect & induced jobs
FOE FIRMS
1291.4% of all FOE firms in Southern California
SWEDEN’S INVESTMENTIN SoCal 2003-2015
GREENFIELD INVESTMENT 2003-2015
$856MM
DIRECT FOE JOBS
10,2622.9% of all FOE jobs in Southern California
ESTIMATED WAGES
$436MM
6,688
1,140
882
781
319
- 2,000 4,000 6,000 8,000
Prof/Business Services
Construction
Manufacturing
Retail Trade
Information
5.4
49.4
148.2
35
5.4
102.7
18.1 11
58.1
138.9
54.8
129.4
0
20
40
60
80
100
120
140
160
2004
2005
2006
2007
2008
2009
2010
2011
2012
2013
2014
2015
$ milli
ons
Source: FDI Markets

FOREIGN DIRECT IN
VESTMEN
T 2015
4 3
AUSTRALIAN FOEs BY DESTINATION COUNTY
GREENFIELD INVESTMENT BY DESTINATION 2003-2015
AUSTRALIAN FOE JOBS BY SECTOR
1
2
3
4
5
6
1
2
3
4
5
Los Angeles
Orange
San Bernardino
San Diego
Riverside
Ventura
Los Angeles
San Bernardino
Orange
Riverside
San Diego
4,244 55.5% 101 $293.6
1,739 22.7% 38 $132.0
763 10.0% 17 $35.5
424 5.5% 22 $32.3
395 5.2% 8 $18.4
87 1.1% 5 $4.4
$1,397.8 63.7% 6,609
$306.3 14.0% 2,189
$248.3 11.3% 867
$156.3 7.1% 1,117
$84.8 3.9% 311
County
County
Jobs
Investment ($millions)
FirmsRank
Rank
% of All FOE Jobs
% of all AustralianGreenfield
Est. Wages ($millions)
Estimated Jobs
Total
Total
7,652
$2,193.4
191
100.0%
100.0% $516.2
11,093
Sources: FDI Markets
Sources: Dun & Bradstreet, CA EDD; LAEDC analysis
Sources: FDI Markets
S O U R C E N AT I O N S
AUSTRALIANO. 10
FOREIGN-OWNED ENTERPRISES
GREENFIELD INVESTMENTS
(FOEs)TOTAL FOE JOBS
17,071includes direct, indirect & induced jobs
FOE FIRMS
1912.1% of all FOE firms in Southern California
AUSTRALIA’S INVESTMENTIN SoCal 2003-2015
GREENFIELD INVESTMENT 2003-2015
$2.19B
DIRECT FOE JOBS
7,6522.1% of all FOE jobs in Southern California
ESTIMATED WAGES
$516MM
1,910
1,645
1,617
1,272
482
- 500 1,000 1,500 2,000
Manufacturing
Prof/Business Services
Financial Activities
Wholesale Trade
Leisure/Hospitality
8.4 12.1
755.4
116.9 43.2
199.3
59.2 95.5
822.8
80.6
0 100 200 300 400 500 600 700 800 900
2004
2005
2006
2007
2008
2009
2010
2011
2012
2013
2014
2015
$ milli
ons
Source: FDI Markets

FORE
IGN
DIR
ECT
INVE
STM
ENT
2015
4 4
SOUTH KOREAN FOEs BY DESTINATION COUNTY
GREENFIELD INVESTMENT BY DESTINATION 2003-2015
SOUTH KOREAN FOE JOBS BY SECTOR
1
2
3
4
5
6
1
2
3
4
5
Los Angeles
San Diego
Orange
San Bernardino
Ventura
Riverside
Los Angeles
Orange
San Bernardino
San Diego
Riverside
3,022 40.0% 115 $173.9
1,872 24.8% 29 $99.9
1,688 22.3% 64 $123.0
499 6.6% 16 $25.9
418 5.5% 4 $27.5
65 0.9% 5 $2.6
$384.2 44.2% 1,882
$374.1 43.0% 1,137
$64.3 7.4% 519
$40.1 4.6% 158
$6.8 0.8% 25
County
County
Jobs
Investment ($millions)
FirmsRank
Rank
% of All FOE Jobs
% of all Korean
Greenfield
Est. Wages ($millions)
Estimated Jobs
Total
Total
7,564
$869.5
233
100.0%
100.0% $452.7
3,721
Sources: FDI Markets
Sources: Dun & Bradstreet, CA EDD; LAEDC analysis
Sources: FDI Markets
S O U R C E N AT I O N S
REPUBLIC OF KOREANO. 11
FOREIGN-OWNED ENTERPRISES
GREENFIELD INVESTMENTS
(FOEs)TOTAL FOE JOBS
16,997includes direct, indirect & induced jobs
FOE FIRMS
2332.6% of all FOE firms in Southern California
SOUTH KOREA’S INVESTMENTIN SoCal 2003-2015
GREENFIELD INVESTMENT 2003-2015
$869MM
DIRECT FOE JOBS
7,5642.1% of all FOE jobs in Southern California
ESTIMATED WAGES
$453MM
48.7
139.3
15.8
80.7 83.6
228.2
180.4
11.0 2.8 20.5
0
50
100
150
200
250
2004
2005
2006
2007
2008
2009
2010
2011
2012
2013
2014
2015
$ milli
ons
Source: FDI Markets
2,197
1,993
1,058
713
482
- 500 1,000 1,500 2,000 2,500
Manufacturing
Wholesale Trade
Transp, Warehousing, Utilities
Retail Trade
Leisure/Hospitality
FOREIGN DIRECT IN
VESTMEN
T 2015
4 5
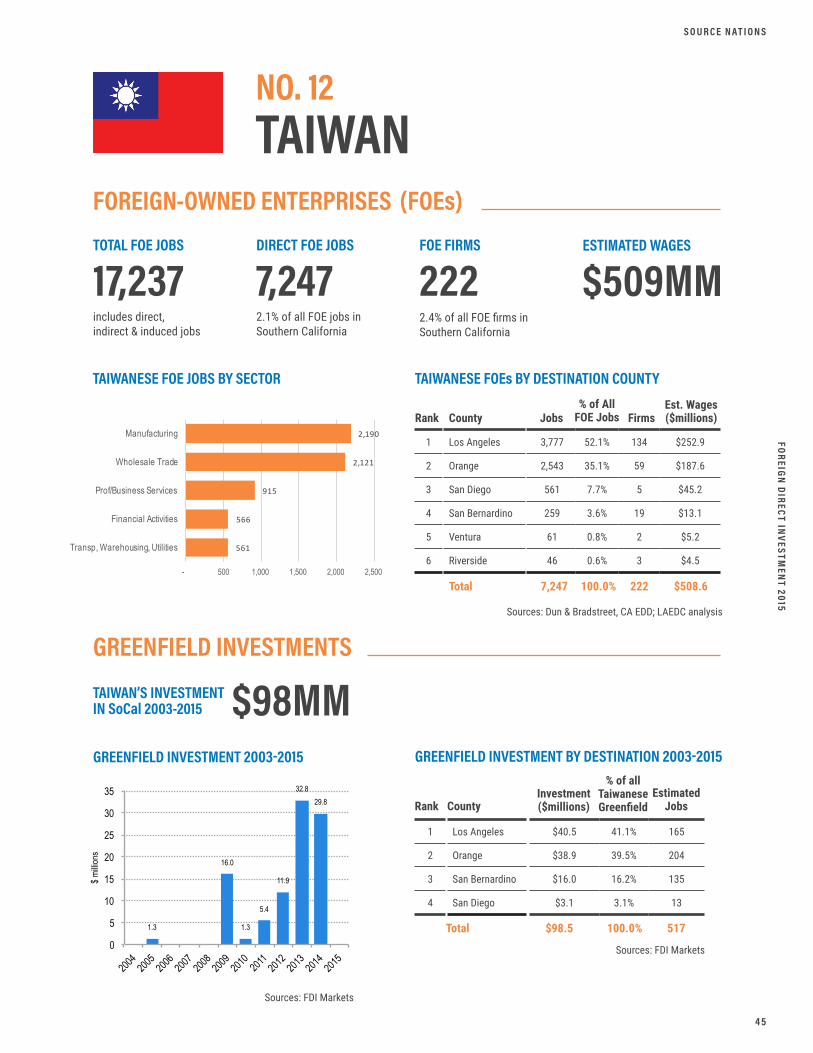
TAIWANESE FOEs BY DESTINATION COUNTY
GREENFIELD INVESTMENT BY DESTINATION 2003-2015
TAIWANESE FOE JOBS BY SECTOR
1
2
3
4
5
6
1
2
3
4
Los Angeles
Orange
San Diego
San Bernardino
Ventura
Riverside
Los Angeles
Orange
San Bernardino
San Diego
3,777 52.1% 134 $252.9
2,543 35.1% 59 $187.6
561 7.7% 5 $45.2
259 3.6% 19 $13.1
61 0.8% 2 $5.2
46 0.6% 3 $4.5
$40.5 41.1% 165
$38.9 39.5% 204
$16.0 16.2% 135
$3.1 3.1% 13
County
County
Jobs
Investment ($millions)
FirmsRank
Rank
% of All FOE Jobs
% of all TaiwaneseGreenfield
Est. Wages ($millions)
Estimated Jobs
Total
Total
7,247
$98.5
222
100.0%
100.0% $508.6
517
Sources: FDI Markets
Sources: Dun & Bradstreet, CA EDD; LAEDC analysis
Sources: FDI Markets
S O U R C E N AT I O N S
TAIWANNO. 12
FOREIGN-OWNED ENTERPRISES
GREENFIELD INVESTMENTS
(FOEs)TOTAL FOE JOBS
17,237includes direct, indirect & induced jobs
FOE FIRMS
2222.4% of all FOE firms in Southern California
TAIWAN’S INVESTMENTIN SoCal 2003-2015
GREENFIELD INVESTMENT 2003-2015
$98MM
DIRECT FOE JOBS
7,2472.1% of all FOE jobs in Southern California
ESTIMATED WAGES
$509MM
1.3
16.0
1.3
5.4
11.9
32.8 29.8
0
5
10
15
20
25
30
35
2004
2005
2006
2007
2008
2009
2010
2011
2012
2013
2014
2015
$ milli
ons
Source: FDI Markets
2,190
2,121
915
566
561
- 500 1,000 1,500 2,000 2,500
Manufacturing
Wholesale Trade
Prof/Business Services
Financial Activities
Transp, Warehousing, Utilities
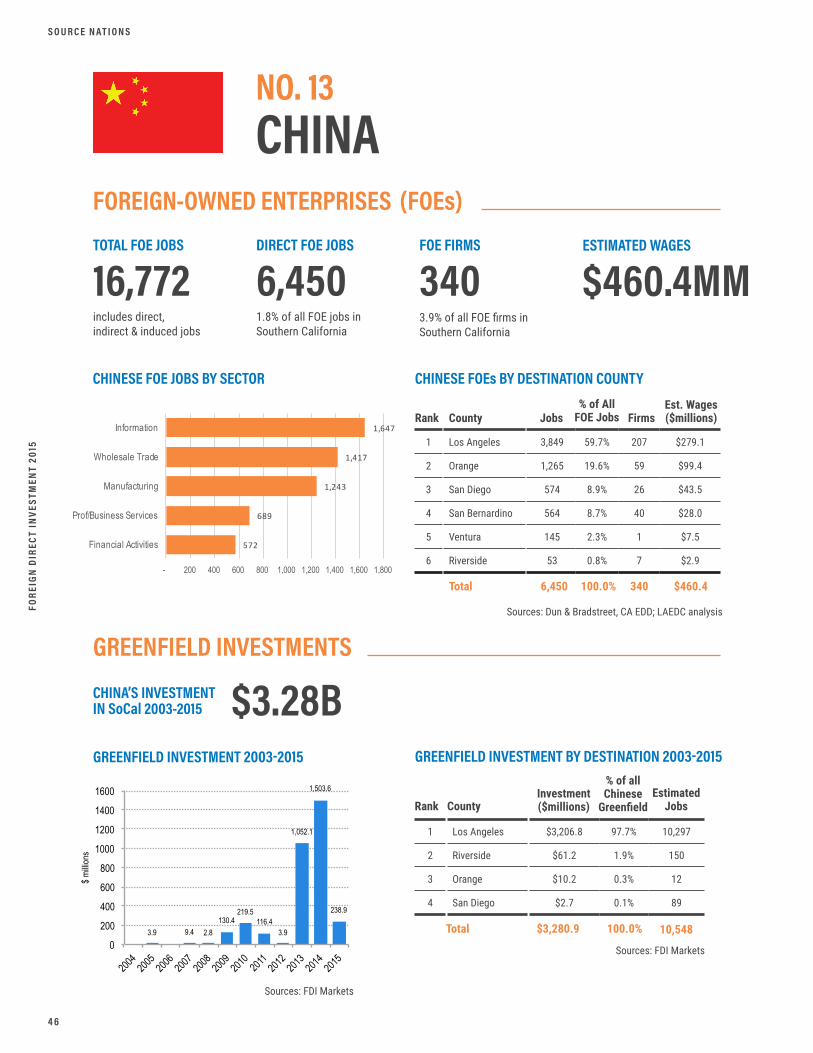
FORE
IGN
DIR
ECT
INVE
STM
ENT
2015
4 6
CHINESE FOEs BY DESTINATION COUNTY
GREENFIELD INVESTMENT BY DESTINATION 2003-2015
CHINESE FOE JOBS BY SECTOR
1
2
3
4
5
6
1
2
3
4
Los Angeles
Orange
San Diego
San Bernardino
Ventura
Riverside
Los Angeles
Riverside
Orange
San Diego
3,849 59.7% 207 $279.1
1,265 19.6% 59 $99.4
574 8.9% 26 $43.5
564 8.7% 40 $28.0
145 2.3% 1 $7.5
53 0.8% 7 $2.9
$3,206.8 97.7% 10,297
$61.2 1.9% 150
$10.2 0.3% 12
$2.7 0.1% 89
County
County
Jobs
Investment ($millions)
FirmsRank
Rank
% of All FOE Jobs
% of all Chinese
Greenfield
Est. Wages ($millions)
Estimated Jobs
Total
Total
6,450
$3,280.9
340
100.0%
100.0% $460.4
10,548
Sources: FDI Markets
Sources: Dun & Bradstreet, CA EDD; LAEDC analysis
Sources: FDI Markets
S O U R C E N AT I O N S
CHINANO. 13
FOREIGN-OWNED ENTERPRISES
GREENFIELD INVESTMENTS
(FOEs)TOTAL FOE JOBS
16,772includes direct, indirect & induced jobs
FOE FIRMS
3403.9% of all FOE firms in Southern California
CHINA’S INVESTMENTIN SoCal 2003-2015
GREENFIELD INVESTMENT 2003-2015
$3.28B
DIRECT FOE JOBS
6,4501.8% of all FOE jobs in Southern California
ESTIMATED WAGES
$460.4MM
1,647
1,417
1,243
689
572
- 200 400 600 800 1,000 1,200 1,400 1,600 1,800
Information
Wholesale Trade
Manufacturing
Prof/Business Services
Financial Activities
3.9 9.4 2.8 130.4
219.5 116.4
3.9
1,052.1
1,503.6
238.9
0
200
400
600
800
1000
1200
1400
1600
2004
2005
2006
2007
2008
2009
2010
2011
2012
2013
2014
2015
$ milli
ons
Source: FDI Markets
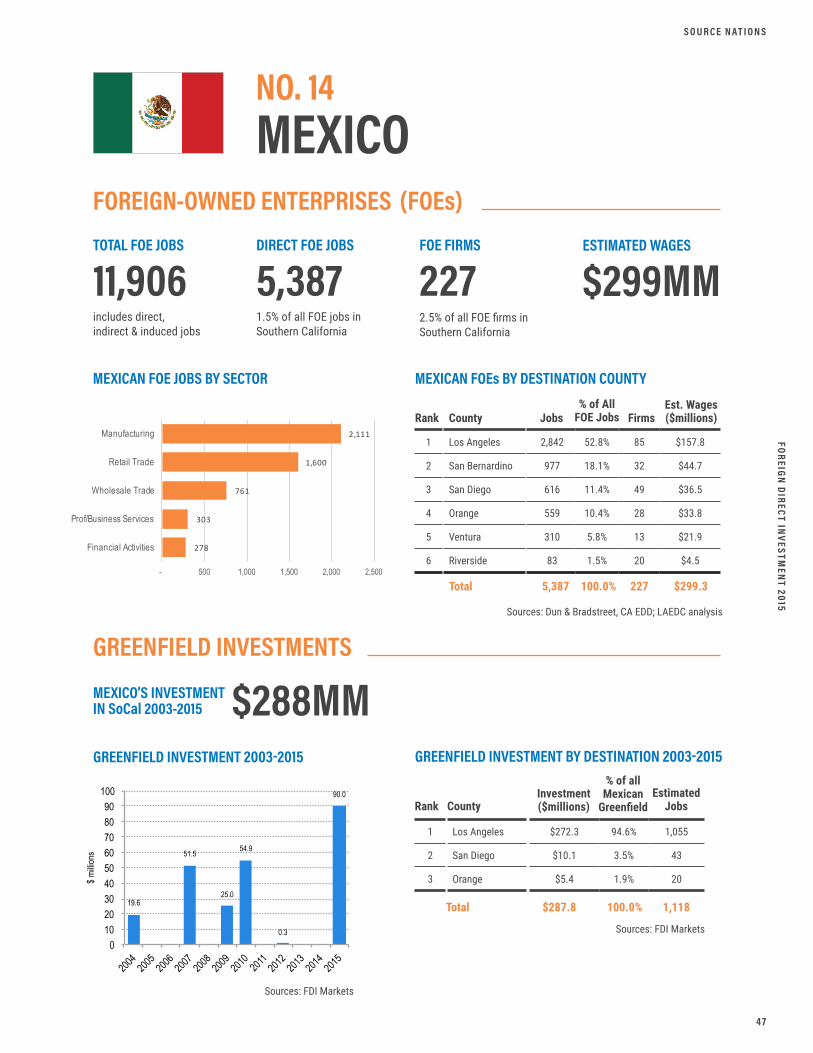
FOREIGN DIRECT IN
VESTMEN
T 2015
4 7
MEXICAN FOEs BY DESTINATION COUNTY
GREENFIELD INVESTMENT BY DESTINATION 2003-2015
MEXICAN FOE JOBS BY SECTOR
1
2
3
4
5
6
1
2
3
Los Angeles
San Bernardino
San Diego
Orange
Ventura
Riverside
Los Angeles
San Diego
Orange
2,842 52.8% 85 $157.8
977 18.1% 32 $44.7
616 11.4% 49 $36.5
559 10.4% 28 $33.8
310 5.8% 13 $21.9
83 1.5% 20 $4.5
$272.3 94.6% 1,055
$10.1 3.5% 43
$5.4 1.9% 20
County
County
Jobs
Investment ($millions)
FirmsRank
Rank
% of All FOE Jobs
% of all Mexican
Greenfield
Est. Wages ($millions)
Estimated Jobs
Total
Total
5,387
$287.8
227
100.0%
100.0% $299.3
1,118
Sources: FDI Markets
Sources: Dun & Bradstreet, CA EDD; LAEDC analysis
Sources: FDI Markets
S O U R C E N AT I O N S
MEXICONO. 14
FOREIGN-OWNED ENTERPRISES
GREENFIELD INVESTMENTS
(FOEs)TOTAL FOE JOBS
11,906includes direct, indirect & induced jobs
FOE FIRMS
2272.5% of all FOE firms in Southern California
MEXICO’S INVESTMENTIN SoCal 2003-2015
GREENFIELD INVESTMENT 2003-2015
$288MM
DIRECT FOE JOBS
5,3871.5% of all FOE jobs in Southern California
ESTIMATED WAGES
$299MM
19.6
51.5
25.0
54.9
0.3
90.0
0 10 20 30 40 50 60 70 80 90
100
2004
2005
2006
2007
2008
2009
2010
2011
2012
2013
2014
2015
$ milli
ons
Source: FDI Markets
2,111
1,600
761
303
278
- 500 1,000 1,500 2,000 2,500
Manufacturing
Retail Trade
Wholesale Trade
Prof/Business Services
Financial Activities
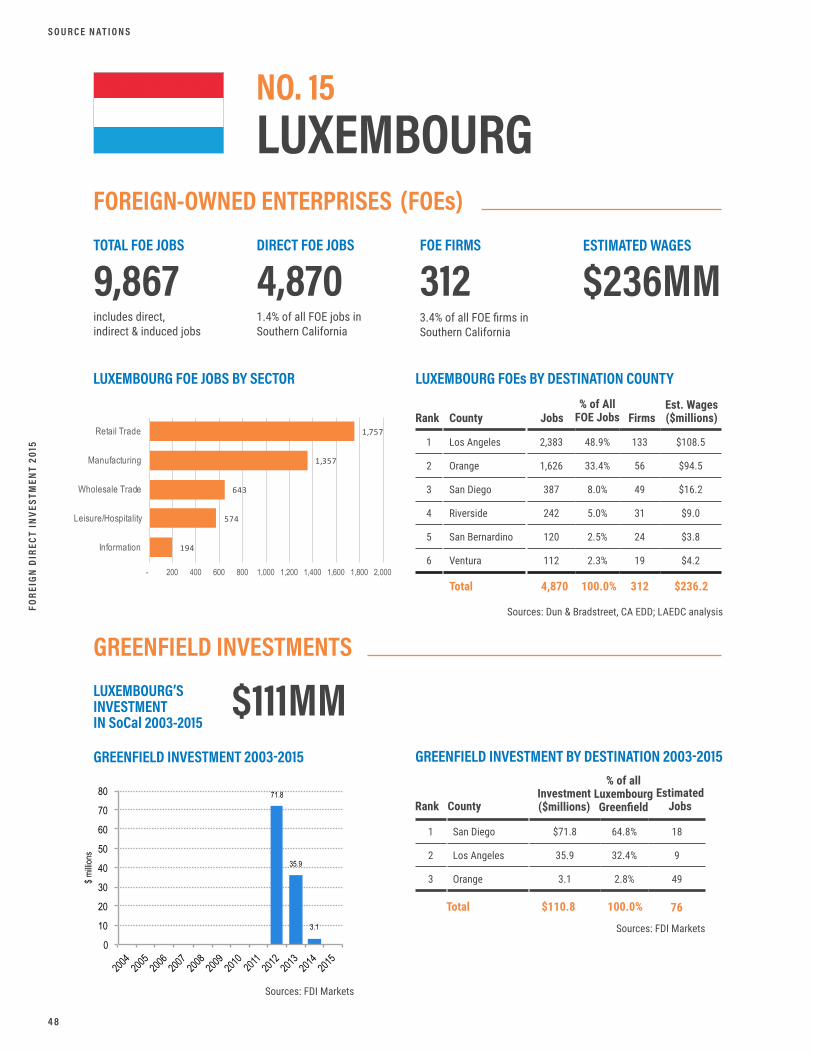
FORE
IGN
DIR
ECT
INVE
STM
ENT
2015
4 8
LUXEMBOURG FOEs BY DESTINATION COUNTY
GREENFIELD INVESTMENT BY DESTINATION 2003-2015
LUXEMBOURG FOE JOBS BY SECTOR
1
2
3
4
5
6
1
2
3
Los Angeles
Orange
San Diego
Riverside
San Bernardino
Ventura
San Diego
Los Angeles
Orange
2,383 48.9% 133 $108.5
1,626 33.4% 56 $94.5
387 8.0% 49 $16.2
242 5.0% 31 $9.0
120 2.5% 24 $3.8
112 2.3% 19 $4.2
$71.8 64.8% 18
35.9 32.4% 9
3.1 2.8% 49
County
County
Jobs
Investment ($millions)
FirmsRank
Rank
% of All FOE Jobs
% of all LuxembourgGreenfield
Est. Wages ($millions)
Estimated Jobs
Total
Total
4,870
$110.8
312
100.0%
100.0% $236.2
76
Sources: FDI Markets
Sources: Dun & Bradstreet, CA EDD; LAEDC analysis
Sources: FDI Markets
S O U R C E N AT I O N S
LUXEMBOURGNO. 15
FOREIGN-OWNED ENTERPRISES
GREENFIELD INVESTMENTS
(FOEs)TOTAL FOE JOBS
9,867includes direct, indirect & induced jobs
FOE FIRMS
3123.4% of all FOE firms in Southern California
LUXEMBOURG’SINVESTMENTIN SoCal 2003-2015
GREENFIELD INVESTMENT 2003-2015
$111MM
DIRECT FOE JOBS
4,8701.4% of all FOE jobs in Southern California
ESTIMATED WAGES
$236MM
71.8
35.9
3.1
0
10
20
30
40
50
60
70
80
2004
2005
2006
2007
2008
2009
2010
2011
2012
2013
2014
2015
$ milli
ons
Source: FDI Markets
1,757
1,357
643
574
194
- 200 400 600 800 1,000 1,200 1,400 1,600 1,800 2,000
Retail Trade
Manufacturing
Wholesale Trade
Leisure/Hospitality
Information
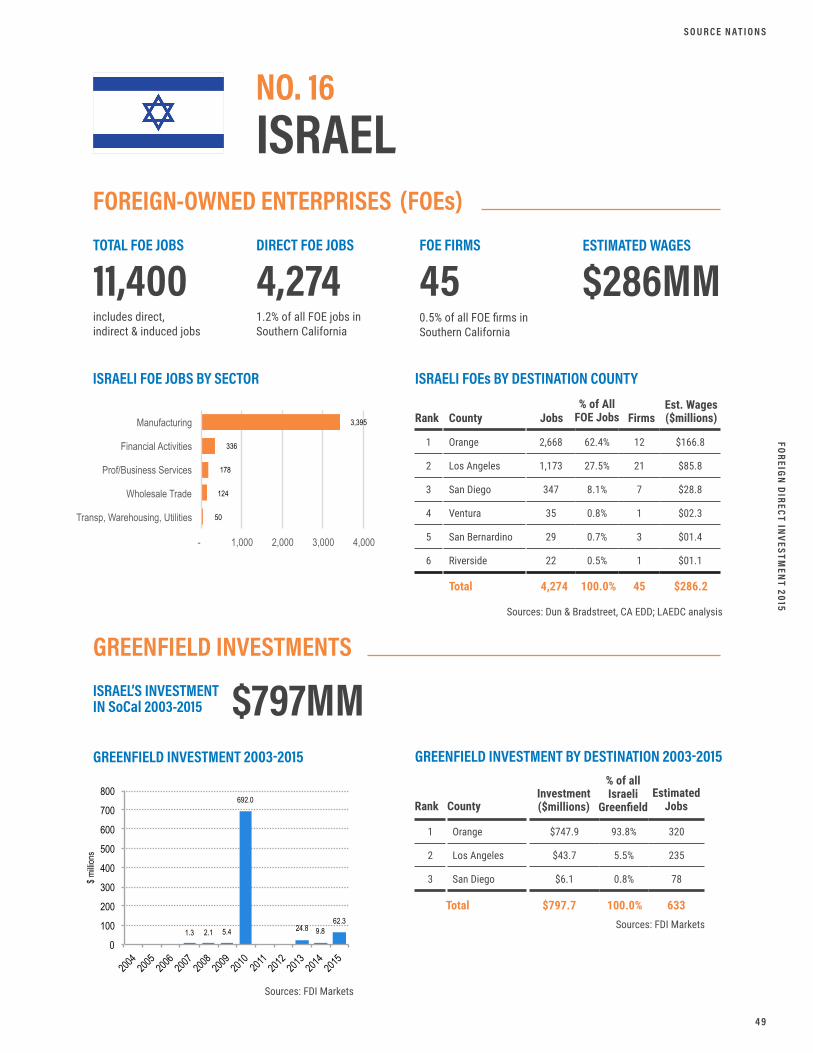
FOREIGN DIRECT IN
VESTMEN
T 2015
4 9
ISRAELI FOEs BY DESTINATION COUNTY
GREENFIELD INVESTMENT BY DESTINATION 2003-2015
ISRAELI FOE JOBS BY SECTOR
1
2
3
4
5
6
1
2
3
Orange
Los Angeles
San Diego
Ventura
San Bernardino
Riverside
Orange
Los Angeles
San Diego
2,668 62.4% 12 $166.8
1,173 27.5% 21 $85.8
347 8.1% 7 $28.8
35 0.8% 1 $02.3
29 0.7% 3 $01.4
22 0.5% 1 $01.1
$747.9 93.8% 320
$43.7 5.5% 235
$6.1 0.8% 78
County
County
Jobs
Investment ($millions)
FirmsRank
Rank
% of All FOE Jobs
% of all Israeli
Greenfield
Est. Wages ($millions)
Estimated Jobs
Total
Total
4,274
$797.7
45
100.0%
100.0% $286.2
633
Sources: FDI Markets
Sources: Dun & Bradstreet, CA EDD; LAEDC analysis
Sources: FDI Markets
S O U R C E N AT I O N S
ISRAELNO. 16
FOREIGN-OWNED ENTERPRISES
GREENFIELD INVESTMENTS
(FOEs)TOTAL FOE JOBS
11,400includes direct, indirect & induced jobs
FOE FIRMS
450.5% of all FOE firms in Southern California
ISRAEL’S INVESTMENTIN SoCal 2003-2015
GREENFIELD INVESTMENT 2003-2015
$797MM
DIRECT FOE JOBS
4,2741.2% of all FOE jobs in Southern California
ESTIMATED WAGES
$286MM
3,395
336
178
124
50
- 1,000 2,000 3,000 4,000
Manufacturing
Financial Activities
Prof/Business Services
Wholesale Trade
Transp, Warehousing, Utilities
1.3 2.1 5.4
692.0
24.8 9.8 62.3
0
100
200
300
400
500
600
700
800
2004
2005
2006
2007
2008
2009
2010
2011
2012
2013
2014
2015
$ milli
ons
Source: FDI Markets
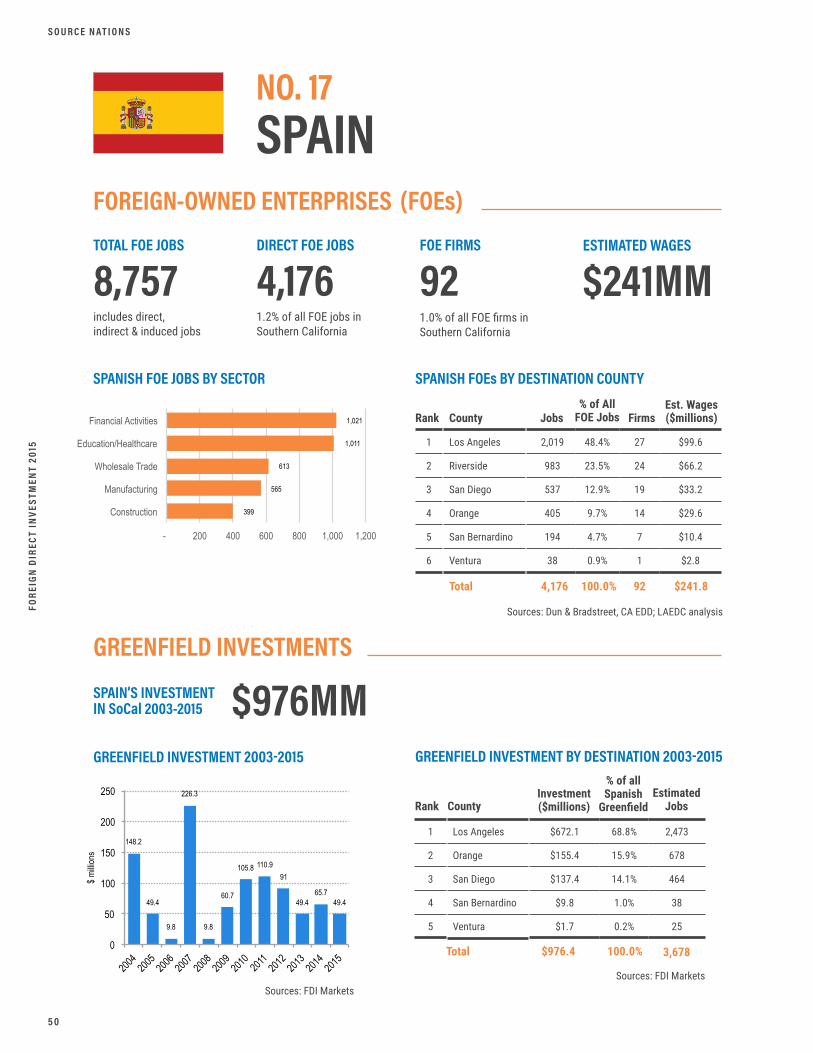
FORE
IGN
DIR
ECT
INVE
STM
ENT
2015
5 0
SPANISH FOEs BY DESTINATION COUNTY
GREENFIELD INVESTMENT BY DESTINATION 2003-2015
SPANISH FOE JOBS BY SECTOR
1
2
3
4
5
6
1
2
3
4
5
Los Angeles
Riverside
San Diego
Orange
San Bernardino
Ventura
Los Angeles
Orange
San Diego
San Bernardino
Ventura
2,019 48.4% 27 $99.6
983 23.5% 24 $66.2
537 12.9% 19 $33.2
405 9.7% 14 $29.6
194 4.7% 7 $10.4
38 0.9% 1 $2.8
$672.1 68.8% 2,473
$155.4 15.9% 678
$137.4 14.1% 464
$9.8 1.0% 38
$1.7 0.2% 25
County
County
Jobs
Investment ($millions)
FirmsRank
Rank
% of All FOE Jobs
% of all Spanish
Greenfield
Est. Wages ($millions)
Estimated Jobs
Total
Total
4,176
$976.4
92
100.0%
100.0% $241.8
3,678
Sources: FDI Markets
Sources: Dun & Bradstreet, CA EDD; LAEDC analysis
Sources: FDI Markets
S O U R C E N AT I O N S
SPAINNO. 17
FOREIGN-OWNED ENTERPRISES
GREENFIELD INVESTMENTS
(FOEs)TOTAL FOE JOBS
8,757includes direct, indirect & induced jobs
FOE FIRMS
921.0% of all FOE firms in Southern California
SPAIN’S INVESTMENTIN SoCal 2003-2015
GREENFIELD INVESTMENT 2003-2015
$976MM
DIRECT FOE JOBS
4,1761.2% of all FOE jobs in Southern California
ESTIMATED WAGES
$241MM
1,021
1,011
613
565
399
- 200 400 600 800 1,000 1,200
Financial Activities
Education/Healthcare
Wholesale Trade
Manufacturing
Construction
148.2
49.4
9.8
226.3
9.8
60.7
105.8 110.9 91
49.4 65.7
49.4
0
50
100
150
200
250
2004
2005
2006
2007
2008
2009
2010
2011
2012
2013
2014
2015
$ milli
ons
Source: FDI Markets
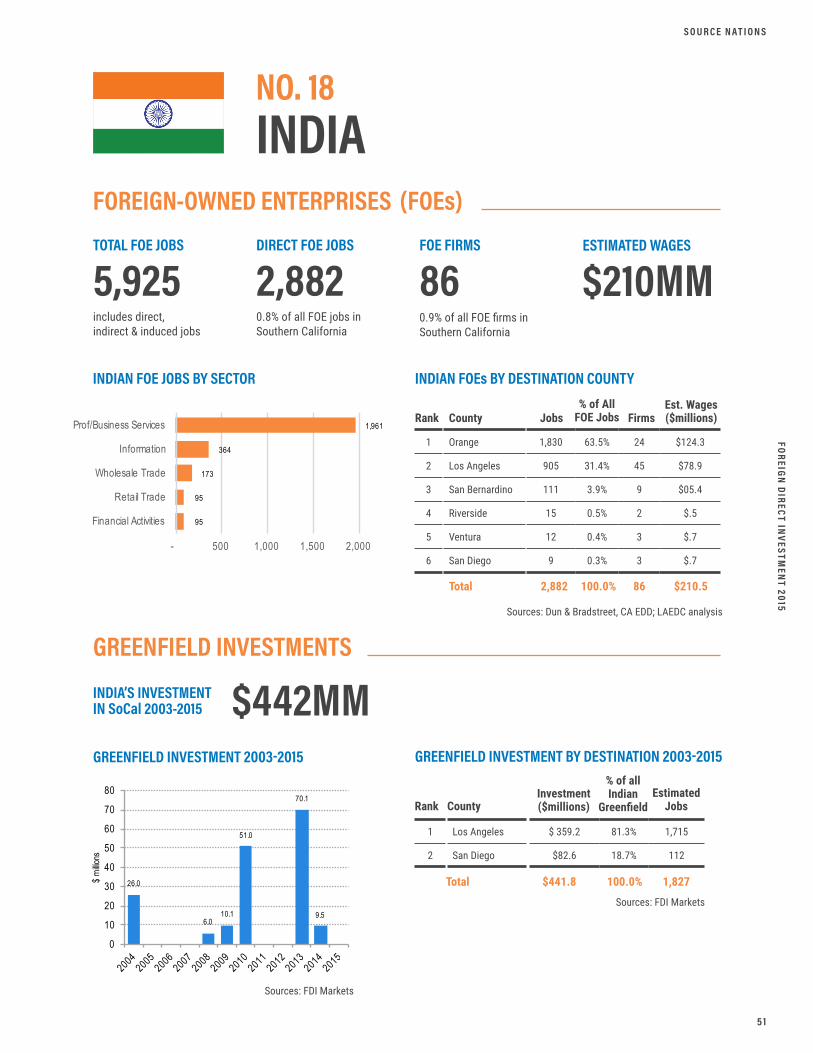
FOREIGN DIRECT IN
VESTMEN
T 2015
5 1
INDIAN FOEs BY DESTINATION COUNTY
GREENFIELD INVESTMENT BY DESTINATION 2003-2015
INDIAN FOE JOBS BY SECTOR
1
2
3
4
5
6
1
2
Orange
Los Angeles
San Bernardino
Riverside
Ventura
San Diego
Los Angeles
San Diego
1,830 63.5% 24 $124.3
905 31.4% 45 $78.9
111 3.9% 9 $05.4
15 0.5% 2 $.5
12 0.4% 3 $.7
9 0.3% 3 $.7
$ 359.2 81.3% 1,715
$82.6 18.7% 112
County
County
Jobs
Investment ($millions)
FirmsRank
Rank
% of All FOE Jobs
% of all Indian
Greenfield
Est. Wages ($millions)
Estimated Jobs
Total
Total
2,882
$441.8
86
100.0%
100.0% $210.5
1,827
Sources: FDI Markets
Sources: Dun & Bradstreet, CA EDD; LAEDC analysis
Sources: FDI Markets
S O U R C E N AT I O N S
INDIANO. 18
FOREIGN-OWNED ENTERPRISES
GREENFIELD INVESTMENTS
(FOEs)TOTAL FOE JOBS
5,925includes direct, indirect & induced jobs
FOE FIRMS
860.9% of all FOE firms in Southern California
INDIA’S INVESTMENTIN SoCal 2003-2015
GREENFIELD INVESTMENT 2003-2015
$442MM
DIRECT FOE JOBS
2,8820.8% of all FOE jobs in Southern California
ESTIMATED WAGES
$210MM
1,961
364
173
95
95
- 500 1,000 1,500 2,000
Prof/Business Services
Information
Wholesale Trade
Retail Trade
Financial Activities
26.0
6.010.1
51.0
70.1
9.5
0
10
20
30
40
50
60
70
80
$ m
illions
Source: FDI Markets

FORE
IGN
DIR
ECT
INVE
STM
ENT
2015
5 2
ITALIAN FOEs BY DESTINATION COUNTY
GREENFIELD INVESTMENT BY DESTINATION 2003-2015
ITALIAN FOE JOBS BY SECTOR
1
2
3
4
5
6
1
2
3
4
Los Angeles
San Diego
Orange
Riverside
San Bernardino
Ventura
Los Angeles
Orange
Riverside
San Diego
1,434 53.0% 65 $50.5
527 19.5% 31 $25.9
505 18.7% 34 $28.2
108 4.0% 10 $7.7
105 3.9% 7 $5.2
28 100.0% 3 $2.2
$924.0 58.4% 3,623
$346.0 21.9% 1,367
$185.1 11.7% 832
$127.3 8.0% 382
County
County
Jobs
Investment ($millions)
FirmsRank
Rank
% of All FOE Jobs
% of all Italian
Greenfield
Est. Wages ($millions)
Estimated Jobs
Total
Total
2,707
$1,582.4
150
100.0%
100.0% $119.7
6,204
Sources: FDI Markets
Sources: Dun & Bradstreet, CA EDD; LAEDC analysis
Sources: FDI Markets
S O U R C E N AT I O N S
ITALYNO. 19
FOREIGN-OWNED ENTERPRISES
GREENFIELD INVESTMENTS
(FOEs)TOTAL FOE JOBS
4,941includes direct, indirect & induced jobs
FOE FIRMS
1501.6% of all FOE firms in Southern California
ITALY’S INVESTMENTIN SoCal 2003-2015
GREENFIELD INVESTMENT 2003-2015
$1.58B
DIRECT FOE JOBS
2,7070.8% of all FOE jobs in Southern California
ESTIMATED WAGES
$199.7MM
931
611
424
279
276
- 200 400 600 800 1,000
Leisure/Hospitality
Retail Trade
Manufacturing
Financial Activities
Wholesale Trade
49.4
98.8
131.3
190.5 195.2
17.5
135.9 143.9
86.3
214.6
107.8
0
50
100
150
200
250
$ m
illions
Source: FDI Markets

FOREIGN DIRECT IN
VESTMEN
T 2015
5 3
S O U R C E N AT I O N S
BELGIAN FOEs BY DESTINATION COUNTY
GREENFIELD INVESTMENT BY DESTINATION 2003-2015
BELGIAN FOE JOBS BY SECTOR
1
2
3
4
5
6
1
2
3
4
Los Angeles
Riverside
San Diego
Orange
Ventura
San Bernardino
San Diego
Los Angeles
Orange
San Bernardino
759 29.9% 21 $43.1
545 21.5% 6 $34.2
373 14.7% 7 $18.8
339 13.4% 9 $26
328 12.9% 5 $20.5
194 7.6% 4 $9.6
$67.5 70.8% 90
$18.9 19.8% 120
$5.8 6.1% 21
$3.2 3.4% 35
County
County
Jobs
Investment ($millions)
FirmsRank
Rank
% of All FOE Jobs
% of all Belgian
Greenfield
Est. Wages ($millions)
Estimated Jobs
Total
Total
2,538
$95.4
52
100.0%
100.0% $152.2
266
Sources: FDI Markets
Sources: Dun & Bradstreet, CA EDD; LAEDC analysis
Sources: FDI Markets
BELGIUMNO. 20
FOREIGN-OWNED ENTERPRISES
GREENFIELD INVESTMENTS
(FOEs)TOTAL FOE JOBS
6,207includes direct, indirect & induced jobs
FOE FIRMS
520.5% of all FOE firms in Southern California
BELGIUM’S INVESTMENTIN SoCal 2003-2015
GREENFIELD INVESTMENT 2003-2015
$95MM
DIRECT FOE JOBS
2,5380.7% of all FOE jobs in Southern California
ESTIMATED WAGES
$152MM
1,432
683
187
115
55
- 500 1,000 1,500
Manufacturing
Wholesale Trade
Prof/Business Services
Transp, Warehousing, Utilities
Other Services
13.5
70.7
5.40.4
5.4
0
10
20
30
40
50
60
70
80
$ m
illions
Source: FDI Markets

FORE
IGN
DIR
ECT
INVE
STM
ENT
2015
5 4
HONG KONG FOEs BY DESTINATION COUNTY
GREENFIELD INVESTMENT BY DESTINATION 2003-2015
HONG KONG FOE JOBS BY SECTOR
1
2
3
4
5
6
1
2
3
4
Los Angeles
San Bernardino
San Diego
Orange
Ventura
Riverside
Los Angeles
San Bernardino
Orange
San Diego
1,394 64.2% 62 $98.9
498 23.0% 6 $23.9
156 7.2% 6 $12.1
74 3.4% 5 $5.9
33 1.5% 2 $2.5
15 0.7% 1 $.4
$109.3 59.3% 435
$64.3 34.9% 292
$5.4 2.9% 19
$5.3 2.9% 19
County
County
Jobs
Investment ($millions)
FirmsRank
Rank
% of All FOE Jobs
% of all Hong KongGreenfield
Est. Wages ($millions)
Estimated Jobs
Total
Total
2,170
$184.3
82
100.0%
100.0% $143.7
765
Sources: FDI Markets
Sources: Dun & Bradstreet, CA EDD; LAEDC analysis
Sources: FDI Markets
S O U R C E N AT I O N S
HONG KONGNO. 21
FOREIGN-OWNED ENTERPRISES
GREENFIELD INVESTMENTS
(FOEs)TOTAL FOE JOBS
5,243includes direct, indirect & induced jobs
FOE FIRMS
820.9% of all FOE firms in Southern California
HONG KONG’S INVESTMENTIN SoCal 2003-2015
GREENFIELD INVESTMENT 2003-2015
$184.3MM
DIRECT FOE JOBS
2,1700.6% of all FOE jobs in Southern California
ESTIMATED WAGES
$143.7MM
5.4
38.8
25.6
49.4
59.7
5.4
0
10
20
30
40
50
60
70
$ m
illions
Source: FDI Markets
790
354
339
210
175
- 100 200 300 400 500 600 700 800 900
Manufacturing
Wholesale Trade
Financial Activities
Prof/Business Services
Transp, Warehousing, Utilities

FOREIGN DIRECT IN
VESTMEN
T 2015
5 5
NEW ZEALAND FOEs BY DESTINATION COUNTY
GREENFIELD INVESTMENT BY DESTINATION 2003-2015
NEW ZEALAND FOE JOBS BY SECTOR
1
2
3
4
5
6
1
2
3
Orange
Los Angeles
Riverside
San Bernardino
San Diego
Ventura
Los Angeles
San Diego
Orange
954 46.7% 6 $60.6
750 36.7% 19 $45.6
149 7.3% 4 $11.3
148 7.3% 3 $7.1
41 2.0% 4 $1.9
- - - -
$172.0 96.0% 471
$4.2 2.3% 64
$2.9 1.6% 103
County
County
Jobs
Investment ($millions)
FirmsRank
Rank
% of All FOE Jobs
% of all New Zealand
Greenfield
Est. Wages ($millions)
Estimated Jobs
Total
Total
2,042
$179.1
36
100.0%
100.0% $126.6
638
Sources: FDI Markets
Sources: Dun & Bradstreet, CA EDD; LAEDC analysis
Sources: FDI Markets
S O U R C E N AT I O N S
NEW ZEALANDNO. 22
FOREIGN-OWNED ENTERPRISES
GREENFIELD INVESTMENTS
(FOEs)TOTAL FOE JOBS
5,282includes direct, indirect & induced jobs
FOE FIRMS
360.4% of all FOE firms in Southern California
NEW ZEALAND’S INVESTMENT IN SoCal 2003-2015
GREENFIELD INVESTMENT 2003-2015
$179MM
DIRECT FOE JOBS
2,0420.6% of all FOE jobs in Southern California
ESTIMATED WAGES
$126MM
1,483
259
156
63
24
- 500 1,000 1,500
Manufacturing
Transp, Warehousing, Utilities
Wholesale Trade
Prof/Business Services
Information
4.29.4
2.9
75.5
11.1 9.4
66.6
0
10
20
30
40
50
60
70
80
$ m
illion)
Source: FDI Markets

FORE
IGN
DIR
ECT
INVE
STM
ENT
2015
5 6
SINGAPOREAN FOEs BY DESTINATION COUNTY
GREENFIELD INVESTMENT BY DESTINATION 2003-2015
SINGAPOREAN FOE JOBS BY SECTOR
1
2
3
4
5
6
1
2
3
Orange
Los Angeles
San Diego
San Bernardino
Riverside
Ventura
Los Angeles
San Diego
Orange
1,088 54.7% 13 $80.0
568 28.5% 17 $36.5
232 11.7% 7 $13.6
93 4.7% 3 $2.7
10 0.5% 1 $0.5
- - - -
$22.5 56.4% 187
$12.0 30.1% 87
$5.4 13.5% 39
County
County
Jobs
Investment ($millions)
FirmsRank
Rank
% of All FOE Jobs
% of all SingaporeanGreenfield
Est. Wages ($millions)
Estimated Jobs
Total
Total
1,991
$39.9
41
100.0%
100.0% $133.2
313
Sources: FDI Markets
Sources: Dun & Bradstreet, CA EDD; LAEDC analysis
Sources: FDI Markets
S O U R C E N AT I O N S
SINGAPORENO. 23
FOREIGN-OWNED ENTERPRISES
GREENFIELD INVESTMENTS
(FOEs)TOTAL FOE JOBS
4,816includes direct, indirect & induced jobs
FOE FIRMS
410.5% of all FOE firms in Southern California
SINGAPORE’S INVESTMENTIN SoCal 2003-2015
GREENFIELD INVESTMENT 2003-2015
$40MM
DIRECT FOE JOBS
1,9910.6% of all FOE jobs in Southern California
ESTIMATED WAGES
$133MM
967
475
374
148
20
- 200 400 600 800 1,000
Manufacturing
Wholesale Trade
Prof/Business Services
Transp, Warehousing, Utilities
Financial Activities
13.2
5.4
15.9
5.4
02468
1012141618
$ m
illions
Source: FDI Markets
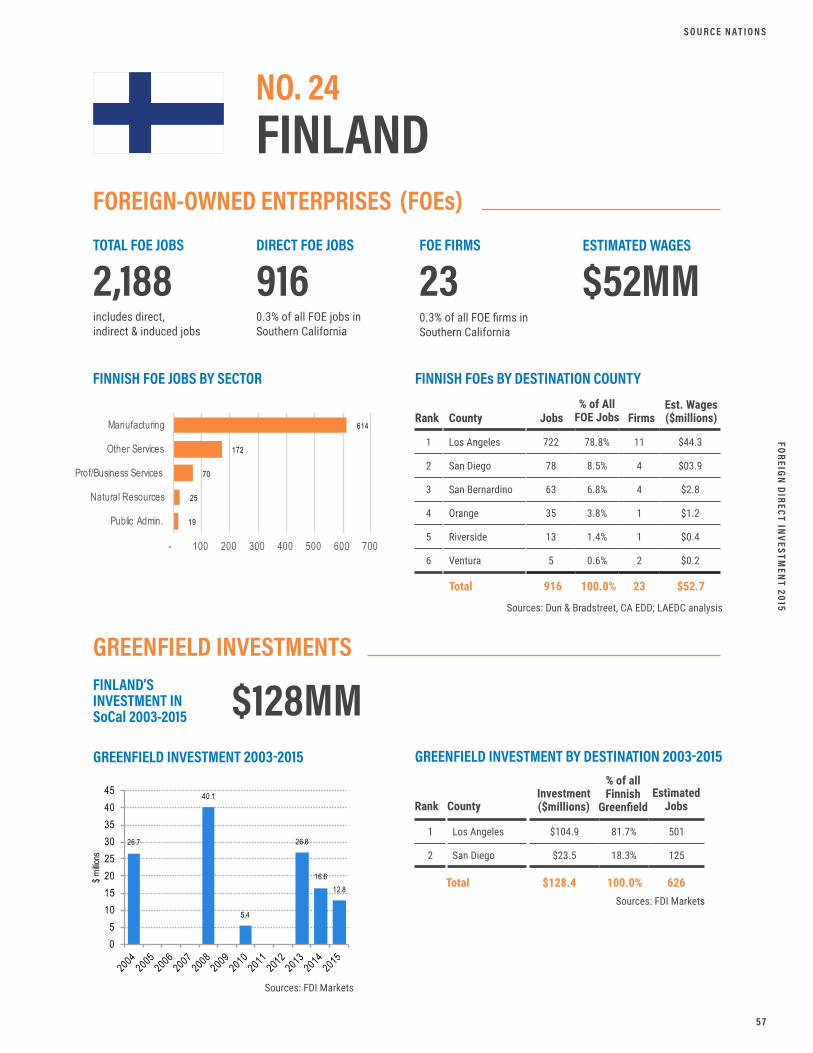
FOREIGN DIRECT IN
VESTMEN
T 2015
5 7
FINNISH FOEs BY DESTINATION COUNTY
GREENFIELD INVESTMENT BY DESTINATION 2003-2015
FINNISH FOE JOBS BY SECTOR
1
2
3
4
5
6
1
2
Los Angeles
San Diego
San Bernardino
Orange
Riverside
Ventura
Los Angeles
San Diego
722 78.8% 11 $44.3
78 8.5% 4 $03.9
63 6.8% 4 $2.8
35 3.8% 1 $1.2
13 1.4% 1 $0.4
5 0.6% 2 $0.2
$104.9 81.7% 501
$23.5 18.3% 125
County
County
Jobs
Investment ($millions)
FirmsRank
Rank
% of All FOE Jobs
% of all Finnish
Greenfield
Est. Wages ($millions)
Estimated Jobs
Total
Total
916
$128.4
23
100.0%
100.0% $52.7
626
Sources: FDI Markets
Sources: Dun & Bradstreet, CA EDD; LAEDC analysis
Sources: FDI Markets
S O U R C E N AT I O N S
FINLANDNO. 24
FOREIGN-OWNED ENTERPRISES
GREENFIELD INVESTMENTS
(FOEs)TOTAL FOE JOBS
2,188includes direct, indirect & induced jobs
FOE FIRMS
230.3% of all FOE firms in Southern California
FINLAND’S INVESTMENT IN SoCal 2003-2015
GREENFIELD INVESTMENT 2003-2015
$128MM
DIRECT FOE JOBS
9160.3% of all FOE jobs in Southern California
ESTIMATED WAGES
$52MM
614
172
70
25
19
- 100 200 300 400 500 600 700
Manufacturing
Other Services
Prof/Business Services
Natural Resources
Public Admin.
26.7
40.1
5.4
26.8
16.612.8
05
1015202530354045
$ m
illions
Source: FDI Markets

www.wtcla.org [email protected]