Foreign Direct Investment Inflows to Ethiopia during 1992...
22
12085 ISSN 2286-4822 www.euacademic.org EUROPEAN ACADEMIC RESEARCH Vol. II, Issue 9/ December 2014 Impact Factor: 3.1 (UIF) DRJI Value: 5.9 (B+) Foreign Direct Investment Inflows to Ethiopia during 1992 to 2012: An Empirical Analysis Dr. DIPTI RANJAN MOHAPATRA Associate Professor (Economics) School of Business and Economics Madawalabu University, Bale Robe Ethiopia Abstract: Foreign Direct Investment (FDI) inflow is important for economic growth of developing nations. The gap between domestic savings and investment is widening in all most all African nations especially in Sub-Saharan Africa as the loans and official developmental assistance by multilateral agencies are gradually declining. Thus, FDI as a catalyst to re-finance the developmental requirement have been lately realized by these nations. Many African economies including Ethiopia started the liberalization process in 1990s. However, still the result of are yet to be realized fully. This is due to the interrelationship between degree of liberalization and FDI. Further, FDI is governed by suitable macro-economic variables in the host country climate. Empirical evidence underlines the importance of gross domestic product, gross capital formation, infrastructure availability, trade openness, export, import, external debt, costs of starting business and etc. These act as potential determinants of FDI inflows to a country. The aim of this paper is to analyze the various potential determinants of FDI inflows to Ethiopia during the period 1992 to 2012. We have used an econometric model used by UNCTAD to determine these potential determinants of FDI equity inflows. The time frame for this analysis is 20-years period, based on data availability. Majority of the explanatory variables specified in the econometric model are seemed to be significant in attracting FDI inflows to
Transcript of Foreign Direct Investment Inflows to Ethiopia during 1992...
12085
ISSN 2286-4822
www.euacademic.org
EUROPEAN ACADEMIC RESEARCH
Vol. II, Issue 9/ December 2014
Impact Factor: 3.1 (UIF)
DRJI Value: 5.9 (B+)
Foreign Direct Investment Inflows to Ethiopia
during 1992 to 2012: An Empirical Analysis
Dr. DIPTI RANJAN MOHAPATRA Associate Professor (Economics)
School of Business and Economics
Madawalabu University, Bale Robe
Ethiopia
Abstract:
Foreign Direct Investment (FDI) inflow is important for
economic growth of developing nations. The gap between domestic
savings and investment is widening in all most all African nations
especially in Sub-Saharan Africa as the loans and official
developmental assistance by multilateral agencies are gradually
declining. Thus, FDI as a catalyst to re-finance the developmental
requirement have been lately realized by these nations. Many African
economies including Ethiopia started the liberalization process in
1990s. However, still the result of are yet to be realized fully. This is
due to the interrelationship between degree of liberalization and FDI.
Further, FDI is governed by suitable macro-economic variables in the
host country climate. Empirical evidence underlines the importance of
gross domestic product, gross capital formation, infrastructure
availability, trade openness, export, import, external debt, costs of
starting business and etc. These act as potential determinants of FDI
inflows to a country. The aim of this paper is to analyze the various
potential determinants of FDI inflows to Ethiopia during the period
1992 to 2012. We have used an econometric model used by UNCTAD to
determine these potential determinants of FDI equity inflows. The time
frame for this analysis is 20-years period, based on data availability.
Majority of the explanatory variables specified in the econometric
model are seemed to be significant in attracting FDI inflows to
Dipti Ranjan Mohapatra- Foreign Direct Investment Inflows to Ethiopia during
1992 to 2012: An Empirical Analysis
EUROPEAN ACADEMIC RESEARCH - Vol. II, Issue 9 / December 2014
12086
Ethiopia. The result of the analysis is in line with most empirical
evidences.
Key words: Foreign Direct Investment, trade openness, gross capital
formation, cost of starting business, regression model.
1. Introduction:
The economic development of a nation depends upon its
investment level. The investment in turn depends on savings.
However, all African nations suffer from the problem of
generation of sufficient gross domestic savings to reorganize the
development process. Thus, the foreign direct investment (FDI)
is imperative for these economies to fill up the gap between
savings and investment. FDI along with financial resources
bring entrepreneurial and technological skills. The importance
of FDI has been given due importance in the development of the
economy by many economists (Todaro, 1992). There is no dearth
of definition and categories of investment in economics
literature. However, an investment is regarded as FDI if the
foreign investor holds at least 10 percent of the ordinary share
or voting rights (IMF, 1993). Here, we have used the following
definition of FDI: Foreign direct investment are the net inflows
of investment to acquire a lasting management interest (10
percent or more of voting stock) in an enterprise operating in an
economy other than that of the investor. It is the sum of equity
capital, reinvestment of earnings, other long-term capital, and
short-term capital as shown in the balance of payments. This
series shows net inflows (new investment inflows less
disinvestment) in the reporting economy from foreign investors
(World Bank, 2010). Most empirical research opines about the
important role of FDI in boosting up the productivity and
efficiency of an economy (OECD, 2002). Many empirical
researches conclude about the pivotal role played by FDI in
enhancing private investments (Douglas et al, 2003). All these
Dipti Ranjan Mohapatra- Foreign Direct Investment Inflows to Ethiopia during
1992 to 2012: An Empirical Analysis
EUROPEAN ACADEMIC RESEARCH - Vol. II, Issue 9 / December 2014
12087
empiricism resulted in increased attention by the developing
nations for policy redesign and macro-economic re-orientation
of the economy in order to encourage the FDI inflows.
The liberalization process in Ethiopia started way back
in 1991. The policy reform included liberalization of foreign
trade, deregulation and decentralization of economy and
devaluation of the national currency. Further many changes in
investment policies were initiated to attract foreign investment.
However, the need for FDI is important for Ethiopia as there
always remain a wide gap between domestic saving and
investment in domestic environment. The saving – investment
gap which could have been filled
up by multilateral agencies loans is firstly declining in Sub-Sah
aran Africa (Asiedu, 2003) including Ethiopia. Thus FDI has
become an alternative source to carry forward the growth
initiatives. However the FDI inflows to a country depend upon
no of macro-economic variables. Both theoretical and empirical
literature underlines the importance of these variables as
determining factors of FDI. FDI play a major role in
determining the economic growth. Recently Ethiopia has
started encouraging the inflow of FDI by creating a suitable
platform for investment climate. Many Sub-Saharan African
nations are realizing higher growth rate and per capita income
for more than two decades. Ethiopian economy needs to grow at
10% per annum for few years to achieve this growth level.
Further, gross domestic saving of Ethiopia is abysmally low to
turn down the economy (EEA, 2000 & 2007). Realizing the
insufficiency of capital at home, Ethiopian government opened
up several sectors of the economy for foreign investment.
Ethiopian Investment Authority has taken adequate initiatives
to rationalize the foreign investment sector. However, the
performance of the country in attracting FDI is not
encouraging. Ethiopia accounts for less than 2% of FDI coming
to Africa. Thus, it is important find out the rationale behind
such lack lustre performance. As empirical evidence shows that
Dipti Ranjan Mohapatra- Foreign Direct Investment Inflows to Ethiopia during
1992 to 2012: An Empirical Analysis
EUROPEAN ACADEMIC RESEARCH - Vol. II, Issue 9 / December 2014
12088
macro-economic variables are the most significant
determinants of FDI inflow to a country. In Ethiopian context
there is a need to find out about these variables.
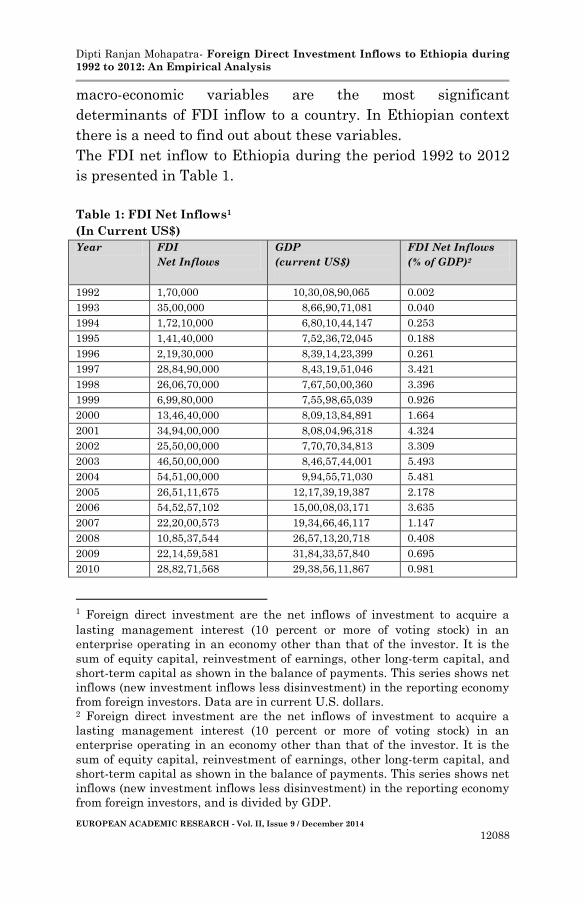
The FDI net inflow to Ethiopia during the period 1992 to 2012
is presented in Table 1.
Table 1: FDI Net Inflows1
(In Current US$)
Year FDI
Net Inflows
GDP
(current US$)
FDI Net Inflows
(% of GDP)2
1992 1,70,000 10,30,08,90,065 0.002
1993 35,00,000 8,66,90,71,081 0.040
1994 1,72,10,000 6,80,10,44,147 0.253
1995 1,41,40,000 7,52,36,72,045 0.188
1996 2,19,30,000 8,39,14,23,399 0.261
1997 28,84,90,000 8,43,19,51,046 3.421
1998 26,06,70,000 7,67,50,00,360 3.396
1999 6,99,80,000 7,55,98,65,039 0.926
2000 13,46,40,000 8,09,13,84,891 1.664
2001 34,94,00,000 8,08,04,96,318 4.324
2002 25,50,00,000 7,70,70,34,813 3.309
2003 46,50,00,000 8,46,57,44,001 5.493
2004 54,51,00,000 9,94,55,71,030 5.481
2005 26,51,11,675 12,17,39,19,387 2.178
2006 54,52,57,102 15,00,08,03,171 3.635
2007 22,20,00,573 19,34,66,46,117 1.147
2008 10,85,37,544 26,57,13,20,718 0.408
2009 22,14,59,581 31,84,33,57,840 0.695
2010 28,82,71,568 29,38,56,11,867 0.981
1 Foreign direct investment are the net inflows of investment to acquire a
lasting management interest (10 percent or more of voting stock) in an
enterprise operating in an economy other than that of the investor. It is the
sum of equity capital, reinvestment of earnings, other long-term capital, and
short-term capital as shown in the balance of payments. This series shows net
inflows (new investment inflows less disinvestment) in the reporting economy
from foreign investors. Data are in current U.S. dollars. 2 Foreign direct investment are the net inflows of investment to acquire a
lasting management interest (10 percent or more of voting stock) in an
enterprise operating in an economy other than that of the investor. It is the
sum of equity capital, reinvestment of earnings, other long-term capital, and
short-term capital as shown in the balance of payments. This series shows net
inflows (new investment inflows less disinvestment) in the reporting economy
from foreign investors, and is divided by GDP.
Dipti Ranjan Mohapatra- Foreign Direct Investment Inflows to Ethiopia during
1992 to 2012: An Empirical Analysis
EUROPEAN ACADEMIC RESEARCH - Vol. II, Issue 9 / December 2014
12089
Year FDI
Net Inflows
GDP
(current US$)
FDI Net Inflows
(% of GDP)2
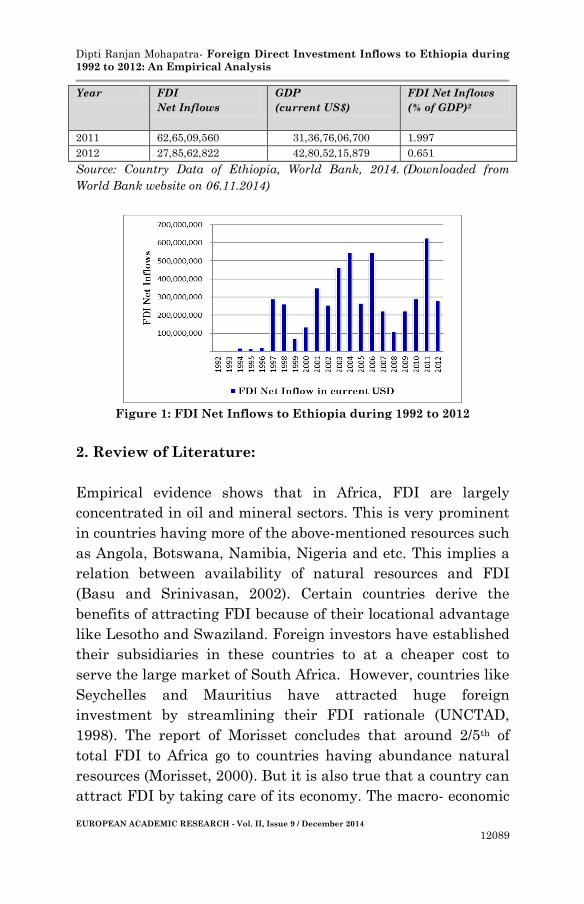
2011 62,65,09,560 31,36,76,06,700 1.997
2012 27,85,62,822 42,80,52,15,879 0.651
Source: Country Data of Ethiopia, World Bank, 2014. (Downloaded from
World Bank website on 06.11.2014)
Figure 1: FDI Net Inflows to Ethiopia during 1992 to 2012
2. Review of Literature:
Empirical evidence shows that in Africa, FDI are largely
concentrated in oil and mineral sectors. This is very prominent
in countries having more of the above-mentioned resources such
as Angola, Botswana, Namibia, Nigeria and etc. This implies a
relation between availability of natural resources and FDI
(Basu and Srinivasan, 2002). Certain countries derive the
benefits of attracting FDI because of their locational advantage
like Lesotho and Swaziland. Foreign investors have established
their subsidiaries in these countries to at a cheaper cost to
serve the large market of South Africa. However, countries like
Seychelles and Mauritius have attracted huge foreign
investment by streamlining their FDI rationale (UNCTAD,
1998). The report of Morisset concludes that around 2/5th of
total FDI to Africa go to countries having abundance natural
resources (Morisset, 2000). But it is also true that a country can
attract FDI by taking care of its economy. The macro- economic

Dipti Ranjan Mohapatra- Foreign Direct Investment Inflows to Ethiopia during
1992 to 2012: An Empirical Analysis
EUROPEAN ACADEMIC RESEARCH - Vol. II, Issue 9 / December 2014
12090
variables that attract FDI are many. Empirical evidence shows
that determinants such as gross capital formation, external
trade, availability of infrastructure, business processing
climate, trade openness, gross national expenditure, GDP
growth, exchange rate, gross savings, external debt, inflation,
GDP per capita, Official development assistance are some of the
variables that have impact on FDI.
Capital formation implies abundance of capital
resources along with less transaction cost to carry out a
business process, better access to potential market, suitable
usage of natural resources as well as suitable climate for
establishment of a business unit. These include creation of
adequate road infrastructures and transportation services,
electricity, telecommunication, water supplies (Birhanu, 1999).
Creation of adequate capital infrastructure is thus basic to
establish any business unit abroad.
Liberalization process in Ethiopia started way back in
1991 in line with World Bank and IMF supported Structural
Adjustment Programme. The rationale behind this programme
was to wipe out structural distortion and macro-economic
imbalances in the economy, improvement of infrastructure,
strengthening of human resources and finally combating
poverty. The government of Ethiopia started number of reforms
major to change the economic orientation from control economy
to free market mechanism so as to make it parallel with World
economy. This was done with a view to give more impetus to
private participation (FDRE, MoFED, 2002). The major
initiatives included deregulation of price, devaluation of
national currencies by 141.6 %, reduction of import duties from
230% to 60%, abolition of export taxes except coffee, easing the
export licensing regulation and procedure, freeing the exchange
market etc. Further government established Ethiopian Private
Agency (EPA) in 1994 with an objective to de-regulate state-
owned enterprises to private enterprises (AfDB, OECD, 2003).
As a result of this many public sector enterprises with poor
Dipti Ranjan Mohapatra- Foreign Direct Investment Inflows to Ethiopia during
1992 to 2012: An Empirical Analysis
EUROPEAN ACADEMIC RESEARCH - Vol. II, Issue 9 / December 2014
12091
performance were made private one for better efficiency. In
order to realise better efficiency of agriculture sector an
industrialization process of agriculture sector was carried out
with an objective to increase the productivity of agriculture
farm sector and enhance the employability of the farm labour
force (Economic Commission for Africa, 2002). All these efforts
brought the fruit with an average growth rate jumped to 5 %
(Andrews et. al. , 2005), decline in inflation from 21% to less
than 5%, increase in income per capita by 2.4%, increase in
investment by 16 % of GDP during this period (Geda and
Degefe, 2002). About the investment frontier 64 % of total
investment in Ethiopia comes from domestic sector. However,
government initiatives and the liberalization process of 1991
played a major role in converting the FDI from meagre 0.04% in
1992 to 27% in 1997. Major FDI to Ethiopia comes from middle-
east followed by European Union.
In Ethiopia, foreign investment can come either by
setting up a branch or by making joint investment with local
company. FDI can be made in any sector except few which has
been kept exclusively for public investment or for domestic
investors. The continuous revision by government is gradually
unshackling many sectors for private participation. For
example, defence, hydro-electric plants and telecommunication
which were exclusively coming under government domain is
now freed for foreign investment participation. However, the
government has underlined there are certain minimum criteria
for foreign investment such as minimum capital entry criterion,
holding of 27% equity share by local firm in case of joint
venture, submission of progress report in every six month both
by foreign investors and local firms. But there are certain
relaxations like there is no requirement to meet local content
requirements or operational guidelines, cent percent exemption
from import duties and import tax on capital equipment,
relaxation from export tax, one year to five years exemption
from payment of income tax, tax exemption on R & D
Dipti Ranjan Mohapatra- Foreign Direct Investment Inflows to Ethiopia during
1992 to 2012: An Empirical Analysis
EUROPEAN ACADEMIC RESEARCH - Vol. II, Issue 9 / December 2014
12092
expenditure, no tax on remittance, opportunity to carry forward
initial operation losses, freedom on choosing capital assets
depreciation model by investor, permission of 100 %
repatriation of capital, profits, dividend and interest on foreign
loans or on payments for technology transfer, 100% repatriation
of proceeds from sales, transfer of shares and winding up the
units. Further, EIA has been conferred with the responsibilities
of coordinating and facilitating foreign investment in the
country. Ethiopian government has established other
organisations such as Ethiopian Privatization Agency (EPA),
Regional Investment Promotion Agency to boost up the FDI. It
has delegated authority to various ministries and departments
such as Ministry of Trade and Industry, Ministry of Foreign
Affairs, Ministry of Taxation and Ministry dealing with
customs to attract FDI on priority basis.
There is no dearth of empirical researches on
determinants of FDI. However, these studies conclude that
these determinants of FDI are country specific. So it is difficult
to delineate determinants of FDI. Further, some determinants
applicable at certain time period may not be applicable in other
time (UNCTAD, 1998). Determinant also varies from country to
country and variables applicable in Africa may not be suitable
in country in Asia, Europe or Latin America (Batra et. al.,
2003). This view was also confirmed by Asiedu (2004). The
research conducted by Asiedu on 32 Sub-Saharan African and
39 non Sub-Saharan nations during 1988-98 came up with
conclusion that market size, market locations, natural
resources, macro-economic and political stability, human
resources, efficient legal and nepotism practices affects the FDI
inflows to Africa, where as market locations is one the major
determinant for Sub-Saharan Africa (Asiedu, 2002). With their
research on 80 developing countries, Schneider and Frey (1985)
found out that the degree of economic development and political
stability in the country are two major determinants of FDI
inflows. However, higher GDP per capita, urbanization,
Dipti Ranjan Mohapatra- Foreign Direct Investment Inflows to Ethiopia during
1992 to 2012: An Empirical Analysis
EUROPEAN ACADEMIC RESEARCH - Vol. II, Issue 9 / December 2014
12093
availability of suitable infrastructure facilities brings more FDI
to a country opined Root and Ahmed (1979) in their research
with 70 developing countries. In labour- intensive and export
oriented firms human resources and quality designs are
important determinants opined Noorbakhsh (2001). The macro-
economic and political stability in Africa are two important
determinants of FDI inflow to Africa (UNCTAD, 1999). Suitable
business environment is one of the main determinants of FDI in
Sub-Saharan Africa (Morisset, 2000). Size of the market,
privatization, natural resources, historical relations with
nations attracts FDI inflow in Africa particularly Sub-Saharan
Africa, opined Jenkin and Thomas (2002). The study conducted
by Linda and Said (2007) in North Africa and Middle East
countries revealed that openness of the economy, natural
resources and return on investments are chief determinants of
FDI in these regions. A study by Getenet and Hirut (2006) in
Ethiopia found that GDP growth, liberalization process
encourage FDI inflows, whereas macro-economic instability and
poor infrastructure discourage FDI.
In this study we have selected the following variables
such as gross capital formation, trade as percent of GDP,
imports and exports of goods and services, trade openness,
transport services, cost of business start- up procedure (% of
GNI per capita), official exchange rate, gross national
expenditure, GDP growth, gross savings, external debt, GDP
per capita, and inflation as major macro-economic variables
that attract FDI inflows to Ethiopia. A proxy value is used for
other determinants such as natural resources, geographical
location, market proximity etc.
3. Variables used:
Gross Capital Formation: Gross capital formation involve
creation of capital infrastructures such as roads, rails, ports,
telecommunication services, electricity generation etc.
Dipti Ranjan Mohapatra- Foreign Direct Investment Inflows to Ethiopia during
1992 to 2012: An Empirical Analysis
EUROPEAN ACADEMIC RESEARCH - Vol. II, Issue 9 / December 2014
12094
Availability of well-developed infrastructure reduces the cost of
doing business and ensures highest returns to investment
(Morisset, 2000). The study has taken into account only existing
infrastructure in the form gross capital formation. The
potential gross capital formation has been left out. Gross
capital formation (formerly gross domestic investment) consists
of outlays on additions to the fixed assets of the economy plus
net changes in the level of inventories. Fixed assets include
land improvements (fences, ditches, drains, and so on); plant,
machinery, and equipment purchases; and the construction of
roads, railways, and the like, including schools, offices,
hospitals, private residential dwellings, and commercial and
industrial buildings. Inventories are stocks of goods held by
firms to meet temporary or unexpected fluctuations in
production or sales, and "work in progress." According to the
1993 SNA, net acquisitions of valuables are also considered
capital formation. Data used here are in current U.S. dollars.
Exports and Imports in goods and services: Export and
import position of a country are important from the point of
view of balance of payment position. A favourable balance of
payment position creates conducive atmosphere for foreign
investors from the point of view of foreign trade policy whereas
a highly unfavourable balance of payment position hinder FDI.
Here the export of goods, services and income is the sum of
goods (merchandise) exports, exports of (nonfactor) services and
income (factor) receipts. Data are in current U.S. dollars.
Similarly, import of goods, services and income is the sum of
goods (merchandise) imports, imports of (nonfactor) services
and income (factor) payments. Data used are in current U.S.
dollars.
Trade: Total trade of the country determines the
likelihood of going for foreign investment by any nation. Here
the trade is the sum of exports and imports of goods and
services measured as a share of gross domestic product. Data
used are in current U.S. dollars.
Dipti Ranjan Mohapatra- Foreign Direct Investment Inflows to Ethiopia during
1992 to 2012: An Empirical Analysis
EUROPEAN ACADEMIC RESEARCH - Vol. II, Issue 9 / December 2014
12095
Trade openness: Trade openness determines the degree
of liberalization process in the economy. Trade openness is
measured by the sum of imports and exports to the total GDP of
the country. Data used are in current U.S. dollars.
Transport services: Transport service is one important
determinant of FDI. Transport services (% of commercial
service imports) covers all transport services (sea, air, land,
internal waterway, space, and pipeline) performed by residents
of one economy for those of another and involving the carriage
of passengers, movement of goods (freight), rental of carriers
with crew, and related support and auxiliary services. Excluded
are freight insurance, which is included in insurance services;
goods procured in ports by non-resident carriers and repairs of
transport equipment, which are included in goods; repairs of
railway facilities, harbours, and airfield facilities, which are
included in construction services; and rental of carriers without
crew, which is included in other services.
Cost of business start-up procedures (% of GNI per
capita): Cost to register a business is normalized by presenting
it as a percentage of gross national income (GNI) per capita.
The costs incurred on initial business start-up involve huge
administrative and regulatory costs. Sometime these cost acts
as deterrent in setting up a business.
Official exchange rate (LCU per US$, period average):
Official exchange rate refers to the exchange rate determined
by national authorities or to the rate determined in the legally
sanctioned exchange market. It is calculated as an annual
average based on monthly averages (local currency units
relative to the U.S. dollar). The stability of domestic currency in
relation to hard currencies brings more FDI than the frequent
large variations. Frequent large variations erode the values of
foreign investor assets (Goldberg and Klien, 1997).
Gross National Expenditure: Gross national expenditure
(formerly domestic absorption) is the sum of household final
Dipti Ranjan Mohapatra- Foreign Direct Investment Inflows to Ethiopia during
1992 to 2012: An Empirical Analysis
EUROPEAN ACADEMIC RESEARCH - Vol. II, Issue 9 / December 2014
12096
consumption expenditure (formerly private consumption),
general government final consumption expenditure (formerly
general government consumption), and gross capital formation
(formerly gross domestic investment). Increases in gross
national expenditure always have positive impact on FDI as it
imply a strong consumption force in the economy.
GDP growth (annual %): Annual percentage growth rate
of GDP at market prices based on constant local currency.
Aggregates are based on constant 2000 U.S. dollars. GDP is the
sum of gross value added by all resident producers in the
economy plus any product taxes and minus any subsidies not
included in the value of the products. It is calculated without
making deductions for depreciation of fabricated assets or for
depletion and degradation of natural resources. GDP growth
indicates the performance of the economy. Higher economic
growth means better performance and vice-versa.
Lower the GDP growth, the value of the investment get affected
so as the FDI.
Gross savings: Gross savings are the difference between
gross national income and public and private consumption, plus
net current transfers. More the saving, more is the investment.
Higher the investment higher is the growth rate of the
economy.
External debt stock (% of GNI): Total external debt
stocks to gross national income. Total external debt is debt
owed to non-residents repayable in foreign currency, goods, or
services. Total external debt is the sum of public, publicly
guaranteed, and private nonguaranteed long-term debt, use of
IMF credit, and short-term debt. Short-term debt includes all
debt having an original maturity of one year or less and
interest in arrears on long-term debt. GNI (formerly GNP) is
the sum of value added by all resident producers plus any
product taxes (less subsidies) not included in the valuation of
output plus net receipts of primary income (compensation of
employees and property income) from abroad. Increase in
Dipti Ranjan Mohapatra- Foreign Direct Investment Inflows to Ethiopia during
1992 to 2012: An Empirical Analysis
EUROPEAN ACADEMIC RESEARCH - Vol. II, Issue 9 / December 2014
12097
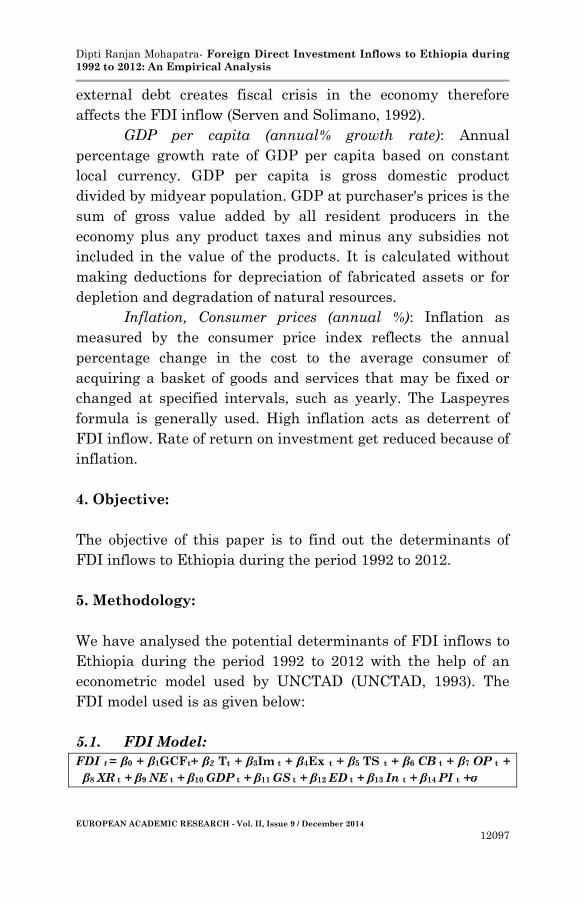
external debt creates fiscal crisis in the economy therefore
affects the FDI inflow (Serven and Solimano, 1992).
GDP per capita (annual% growth rate): Annual
percentage growth rate of GDP per capita based on constant
local currency. GDP per capita is gross domestic product
divided by midyear population. GDP at purchaser's prices is the
sum of gross value added by all resident producers in the
economy plus any product taxes and minus any subsidies not
included in the value of the products. It is calculated without
making deductions for depreciation of fabricated assets or for
depletion and degradation of natural resources.
Inflation, Consumer prices (annual %): Inflation as
measured by the consumer price index reflects the annual
percentage change in the cost to the average consumer of
acquiring a basket of goods and services that may be fixed or
changed at specified intervals, such as yearly. The Laspeyres
formula is generally used. High inflation acts as deterrent of
FDI inflow. Rate of return on investment get reduced because of
inflation.
4. Objective:
The objective of this paper is to find out the determinants of
FDI inflows to Ethiopia during the period 1992 to 2012.
5. Methodology:
We have analysed the potential determinants of FDI inflows to
Ethiopia during the period 1992 to 2012 with the help of an
econometric model used by UNCTAD (UNCTAD, 1993). The
FDI model used is as given below:
5.1. FDI Model:
FDI t = β0 + β1GCFt+ β2 Tt + β3Im t + β4Ex t + β5 TS t + β6 CB t + β7 OP t +
β8 XR t + β9 NE t + β10 GDP t + β11 GS t + β12 ED t + β13 In t + β14 PI t +σ
Dipti Ranjan Mohapatra- Foreign Direct Investment Inflows to Ethiopia during
1992 to 2012: An Empirical Analysis
EUROPEAN ACADEMIC RESEARCH - Vol. II, Issue 9 / December 2014
12098
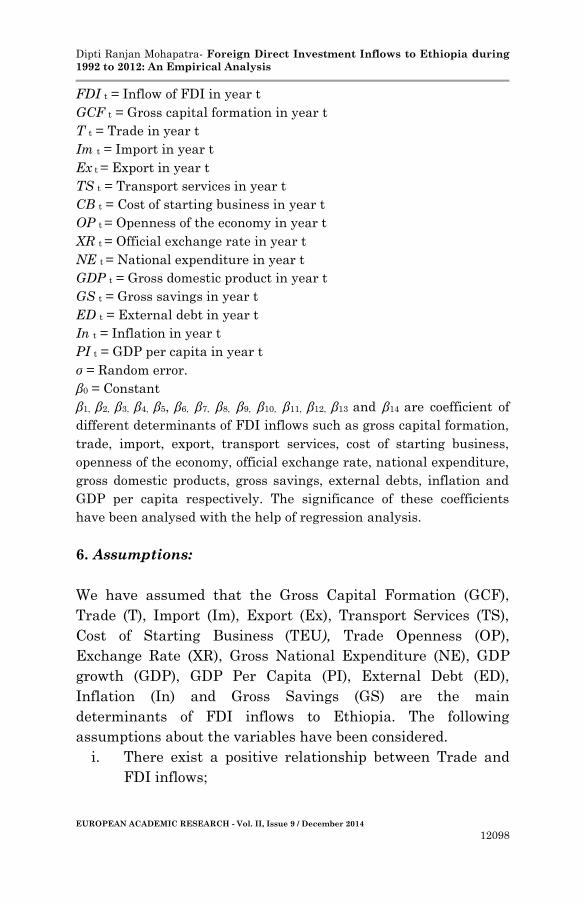
FDI t = Inflow of FDI in year t
GCF t = Gross capital formation in year t
T t = Trade in year t
Im t = Import in year t
Ex t = Export in year t
TS t = Transport services in year t
CB t = Cost of starting business in year t
OP t = Openness of the economy in year t
XR t = Official exchange rate in year t
NE t = National expenditure in year t
GDP t = Gross domestic product in year t
GS t = Gross savings in year t
ED t = External debt in year t
In t = Inflation in year t
PI t = GDP per capita in year t
σ = Random error.
β0 = Constant
β1, β2, β3, β4, β5, β6, β7, β8, β9, β10, β11, β12, β13 and β14 are coefficient of
different determinants of FDI inflows such as gross capital formation,
trade, import, export, transport services, cost of starting business,
openness of the economy, official exchange rate, national expenditure,
gross domestic products, gross savings, external debts, inflation and
GDP per capita respectively. The significance of these coefficients
have been analysed with the help of regression analysis.
6. Assumptions:
We have assumed that the Gross Capital Formation (GCF),
Trade (T), Import (Im), Export (Ex), Transport Services (TS),
Cost of Starting Business (TEU), Trade Openness (OP),
Exchange Rate (XR), Gross National Expenditure (NE), GDP
growth (GDP), GDP Per Capita (PI), External Debt (ED),
Inflation (In) and Gross Savings (GS) are the main
determinants of FDI inflows to Ethiopia. The following
assumptions about the variables have been considered.
i. There exist a positive relationship between Trade and
FDI inflows;
Dipti Ranjan Mohapatra- Foreign Direct Investment Inflows to Ethiopia during
1992 to 2012: An Empirical Analysis
EUROPEAN ACADEMIC RESEARCH - Vol. II, Issue 9 / December 2014
12099
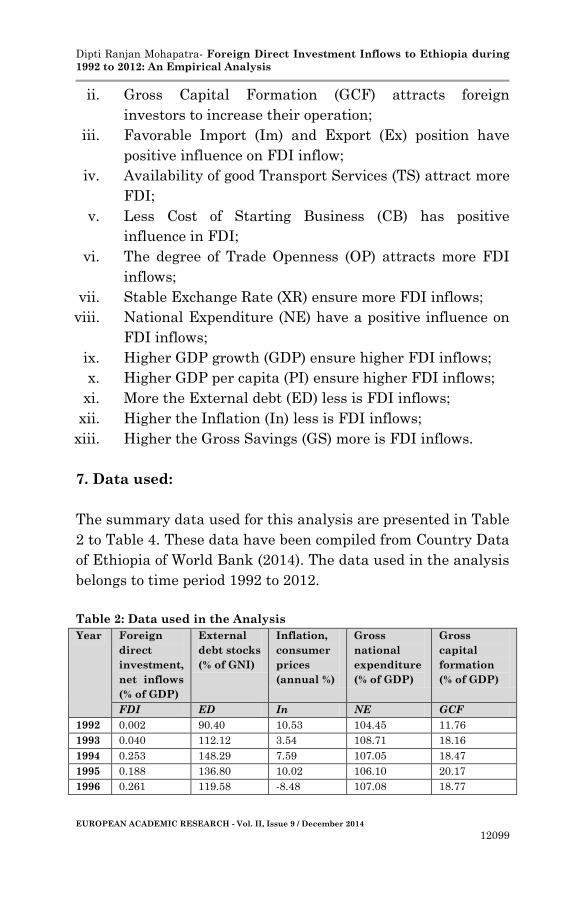
ii. Gross Capital Formation (GCF) attracts foreign
investors to increase their operation;
iii. Favorable Import (Im) and Export (Ex) position have
positive influence on FDI inflow;
iv. Availability of good Transport Services (TS) attract more
FDI;
v. Less Cost of Starting Business (CB) has positive
influence in FDI;
vi. The degree of Trade Openness (OP) attracts more FDI
inflows;
vii. Stable Exchange Rate (XR) ensure more FDI inflows;
viii. National Expenditure (NE) have a positive influence on
FDI inflows;
ix. Higher GDP growth (GDP) ensure higher FDI inflows;
x. Higher GDP per capita (PI) ensure higher FDI inflows;
xi. More the External debt (ED) less is FDI inflows;
xii. Higher the Inflation (In) less is FDI inflows;
xiii. Higher the Gross Savings (GS) more is FDI inflows.
7. Data used:
The summary data used for this analysis are presented in Table
2 to Table 4. These data have been compiled from Country Data
of Ethiopia of World Bank (2014). The data used in the analysis
belongs to time period 1992 to 2012.
Table 2: Data used in the Analysis
Year Foreign
direct
investment,
net inflows
(% of GDP)
External
debt stocks
(% of GNI)
Inflation,
consumer
prices
(annual %)
Gross
national
expenditure
(% of GDP)
Gross
capital
formation
(% of GDP)
FDI ED In NE GCF
1992 0.002 90.40 10.53 104.45 11.76
1993 0.040 112.12 3.54 108.71 18.16
1994 0.253 148.29 7.59 107.05 18.47
1995 0.188 136.80 10.02 106.10 20.17
1996 0.261 119.58 -8.48 107.08 18.77
Dipti Ranjan Mohapatra- Foreign Direct Investment Inflows to Ethiopia during
1992 to 2012: An Empirical Analysis
EUROPEAN ACADEMIC RESEARCH - Vol. II, Issue 9 / December 2014
12100
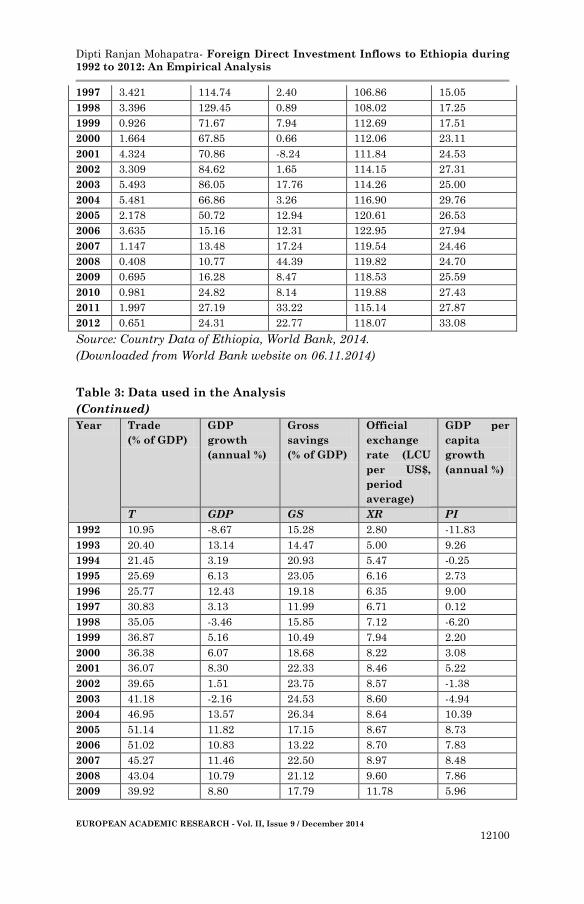
1997 3.421 114.74 2.40 106.86 15.05
1998 3.396 129.45 0.89 108.02 17.25
1999 0.926 71.67 7.94 112.69 17.51
2000 1.664 67.85 0.66 112.06 23.11
2001 4.324 70.86 -8.24 111.84 24.53
2002 3.309 84.62 1.65 114.15 27.31
2003 5.493 86.05 17.76 114.26 25.00
2004 5.481 66.86 3.26 116.90 29.76
2005 2.178 50.72 12.94 120.61 26.53
2006 3.635 15.16 12.31 122.95 27.94
2007 1.147 13.48 17.24 119.54 24.46
2008 0.408 10.77 44.39 119.82 24.70
2009 0.695 16.28 8.47 118.53 25.59
2010 0.981 24.82 8.14 119.88 27.43
2011 1.997 27.19 33.22 115.14 27.87
2012 0.651 24.31 22.77 118.07 33.08
Source: Country Data of Ethiopia, World Bank, 2014.
(Downloaded from World Bank website on 06.11.2014)
Table 3: Data used in the Analysis
(Continued)
Year Trade
(% of GDP)
GDP
growth
(annual %)
Gross
savings
(% of GDP)
Official
exchange
rate (LCU
per US$,
period
average)
GDP per
capita
growth
(annual %)
T GDP GS XR PI
1992 10.95 -8.67 15.28 2.80 -11.83
1993 20.40 13.14 14.47 5.00 9.26
1994 21.45 3.19 20.93 5.47 -0.25
1995 25.69 6.13 23.05 6.16 2.73
1996 25.77 12.43 19.18 6.35 9.00
1997 30.83 3.13 11.99 6.71 0.12
1998 35.05 -3.46 15.85 7.12 -6.20
1999 36.87 5.16 10.49 7.94 2.20
2000 36.38 6.07 18.68 8.22 3.08
2001 36.07 8.30 22.33 8.46 5.22
2002 39.65 1.51 23.75 8.57 -1.38
2003 41.18 -2.16 24.53 8.60 -4.94
2004 46.95 13.57 26.34 8.64 10.39
2005 51.14 11.82 17.15 8.67 8.73
2006 51.02 10.83 13.22 8.70 7.83
2007 45.27 11.46 22.50 8.97 8.48
2008 43.04 10.79 21.12 9.60 7.86
2009 39.92 8.80 17.79 11.78 5.96
Dipti Ranjan Mohapatra- Foreign Direct Investment Inflows to Ethiopia during
1992 to 2012: An Empirical Analysis
EUROPEAN ACADEMIC RESEARCH - Vol. II, Issue 9 / December 2014
12101
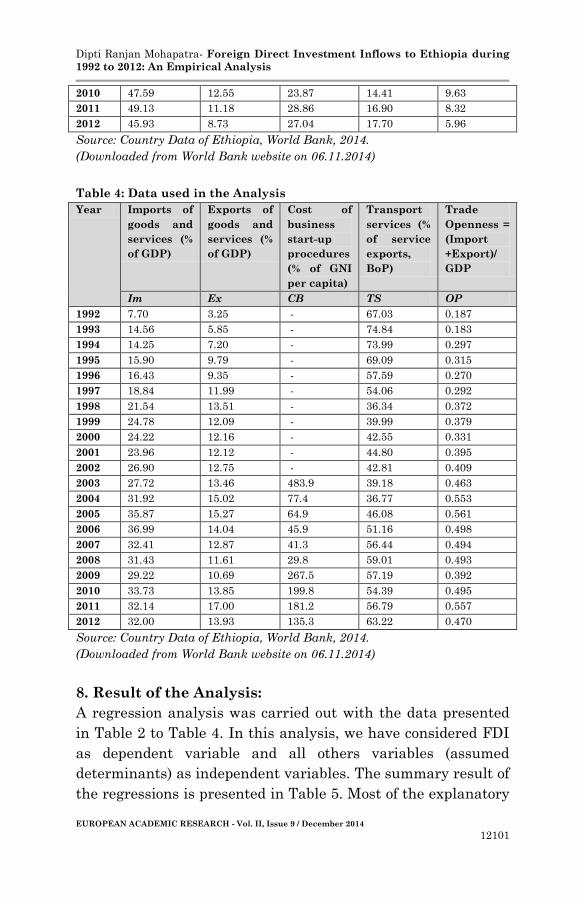
2010 47.59 12.55 23.87 14.41 9.63
2011 49.13 11.18 28.86 16.90 8.32
2012 45.93 8.73 27.04 17.70 5.96
Source: Country Data of Ethiopia, World Bank, 2014.
(Downloaded from World Bank website on 06.11.2014)
Table 4: Data used in the Analysis
Year Imports of
goods and
services (%
of GDP)
Exports of
goods and
services (%
of GDP)
Cost of
business
start-up
procedures
(% of GNI
per capita)
Transport
services (%
of service
exports,
BoP)
Trade
Openness =
(Import
+Export)/
GDP
Im Ex CB TS OP
1992 7.70 3.25 - 67.03 0.187
1993 14.56 5.85 - 74.84 0.183
1994 14.25 7.20 - 73.99 0.297
1995 15.90 9.79 - 69.09 0.315
1996 16.43 9.35 - 57.59 0.270
1997 18.84 11.99 - 54.06 0.292
1998 21.54 13.51 - 36.34 0.372
1999 24.78 12.09 - 39.99 0.379
2000 24.22 12.16 - 42.55 0.331
2001 23.96 12.12 - 44.80 0.395
2002 26.90 12.75 - 42.81 0.409
2003 27.72 13.46 483.9 39.18 0.463
2004 31.92 15.02 77.4 36.77 0.553
2005 35.87 15.27 64.9 46.08 0.561
2006 36.99 14.04 45.9 51.16 0.498
2007 32.41 12.87 41.3 56.44 0.494
2008 31.43 11.61 29.8 59.01 0.493
2009 29.22 10.69 267.5 57.19 0.392
2010 33.73 13.85 199.8 54.39 0.495
2011 32.14 17.00 181.2 56.79 0.557
2012 32.00 13.93 135.3 63.22 0.470
Source: Country Data of Ethiopia, World Bank, 2014.
(Downloaded from World Bank website on 06.11.2014)
8. Result of the Analysis:
A regression analysis was carried out with the data presented
in Table 2 to Table 4. In this analysis, we have considered FDI
as dependent variable and all others variables (assumed
determinants) as independent variables. The summary result of
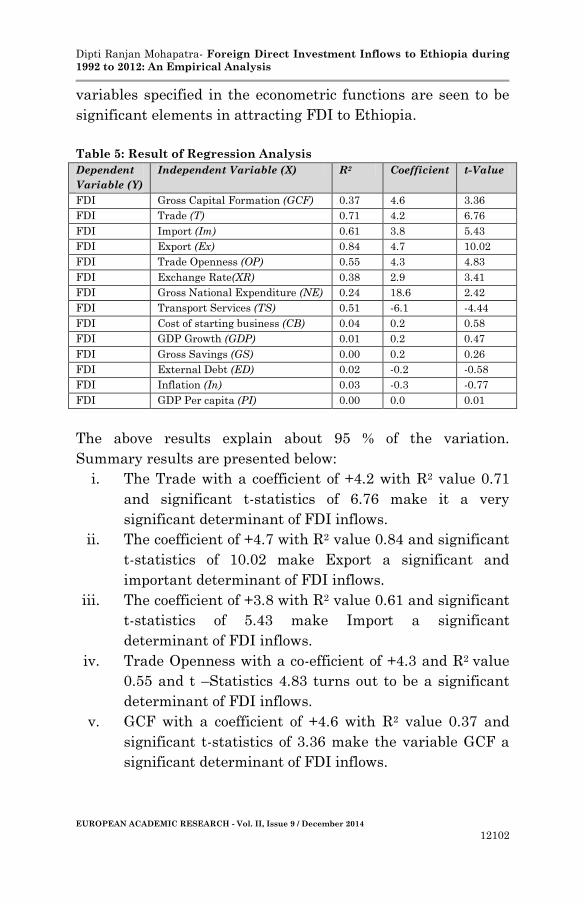
the regressions is presented in Table 5. Most of the explanatory
Dipti Ranjan Mohapatra- Foreign Direct Investment Inflows to Ethiopia during
1992 to 2012: An Empirical Analysis
EUROPEAN ACADEMIC RESEARCH - Vol. II, Issue 9 / December 2014
12102
variables specified in the econometric functions are seen to be
significant elements in attracting FDI to Ethiopia.
Table 5: Result of Regression Analysis
Dependent
Variable (Y)
Independent Variable (X) R2 Coefficient t-Value
FDI Gross Capital Formation (GCF) 0.37 4.6 3.36
FDI Trade (T) 0.71 4.2 6.76
FDI Import (Im) 0.61 3.8 5.43
FDI Export (Ex) 0.84 4.7 10.02
FDI Trade Openness (OP) 0.55 4.3 4.83
FDI Exchange Rate(XR) 0.38 2.9 3.41
FDI Gross National Expenditure (NE) 0.24 18.6 2.42
FDI Transport Services (TS) 0.51 -6.1 -4.44
FDI Cost of starting business (CB) 0.04 0.2 0.58
FDI GDP Growth (GDP) 0.01 0.2 0.47
FDI Gross Savings (GS) 0.00 0.2 0.26
FDI External Debt (ED) 0.02 -0.2 -0.58
FDI Inflation (In) 0.03 -0.3 -0.77
FDI GDP Per capita (PI) 0.00 0.0 0.01
The above results explain about 95 % of the variation.
Summary results are presented below:
i. The Trade with a coefficient of +4.2 with R2 value 0.71
and significant t-statistics of 6.76 make it a very
significant determinant of FDI inflows.
ii. The coefficient of +4.7 with R2 value 0.84 and significant
t-statistics of 10.02 make Export a significant and
important determinant of FDI inflows.
iii. The coefficient of +3.8 with R2 value 0.61 and significant
t-statistics of 5.43 make Import a significant
determinant of FDI inflows.
iv. Trade Openness with a co-efficient of +4.3 and R2 value
0.55 and t –Statistics 4.83 turns out to be a significant
determinant of FDI inflows.
v. GCF with a coefficient of +4.6 with R2 value 0.37 and
significant t-statistics of 3.36 make the variable GCF a
significant determinant of FDI inflows.
Dipti Ranjan Mohapatra- Foreign Direct Investment Inflows to Ethiopia during
1992 to 2012: An Empirical Analysis
EUROPEAN ACADEMIC RESEARCH - Vol. II, Issue 9 / December 2014
12103
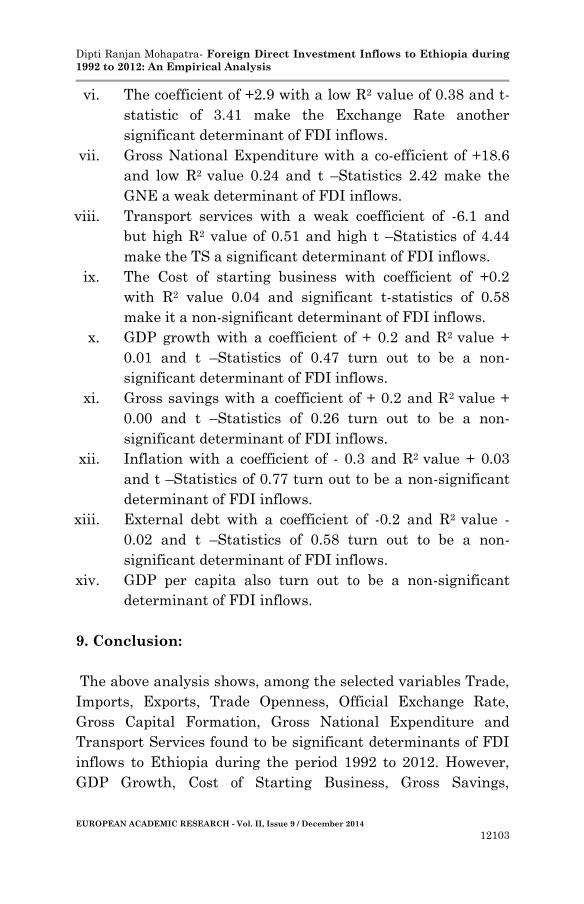
vi. The coefficient of +2.9 with a low R2 value of 0.38 and t-
statistic of 3.41 make the Exchange Rate another
significant determinant of FDI inflows.
vii. Gross National Expenditure with a co-efficient of +18.6
and low R2 value 0.24 and t –Statistics 2.42 make the
GNE a weak determinant of FDI inflows.
viii. Transport services with a weak coefficient of -6.1 and
but high R2 value of 0.51 and high t –Statistics of 4.44
make the TS a significant determinant of FDI inflows.
ix. The Cost of starting business with coefficient of +0.2
with R2 value 0.04 and significant t-statistics of 0.58
make it a non-significant determinant of FDI inflows.
x. GDP growth with a coefficient of + 0.2 and R2 value +
0.01 and t –Statistics of 0.47 turn out to be a non-
significant determinant of FDI inflows.
xi. Gross savings with a coefficient of + 0.2 and R2 value +
0.00 and t –Statistics of 0.26 turn out to be a non-
significant determinant of FDI inflows.
xii. Inflation with a coefficient of - 0.3 and R2 value + 0.03
and t –Statistics of 0.77 turn out to be a non-significant
determinant of FDI inflows.
xiii. External debt with a coefficient of -0.2 and R2 value -
0.02 and t –Statistics of 0.58 turn out to be a non-
significant determinant of FDI inflows.
xiv. GDP per capita also turn out to be a non-significant
determinant of FDI inflows.
9. Conclusion:
The above analysis shows, among the selected variables Trade,
Imports, Exports, Trade Openness, Official Exchange Rate,
Gross Capital Formation, Gross National Expenditure and
Transport Services found to be significant determinants of FDI
inflows to Ethiopia during the period 1992 to 2012. However,
GDP Growth, Cost of Starting Business, Gross Savings,
Dipti Ranjan Mohapatra- Foreign Direct Investment Inflows to Ethiopia during
1992 to 2012: An Empirical Analysis
EUROPEAN ACADEMIC RESEARCH - Vol. II, Issue 9 / December 2014
12104
Inflation, External Debt and GDP Per Capita found to be non-
significant determinants of FDI inflows to Ethiopia during the
above-mentioned period.
REFERENCES:
African Development Bank, African Economic Outlook, OECD,
Paris, 2003.
Andrews, D., Erasmus, L., and Powell, R., Ethiopia: Scaling
Up, Finance and Development, Vol. 42, No. 3, 2005.
Asiedu, Elizabeth, On the Determinants of Foreign Direct
Investment to Developing Countries: Is Africa Different?
World Development, Vol.30, No.1, pp.107-119, 2002.
Asiedu, Elizabeth, Foreign Direct Investment to Africa: The
Role of Government Policy, Governance and Political
Instability, Department of Economics, University of
Kansas, 2003.
Asiedu, Elizabeth (2004). Policy Reform and Foreign Direct
Investment in Africa: Absolute Progress but Relative
Decline, Development Policy Review, 22(1): 41-48, 2004.
Basu, Anupam and Srinivasan, Krishna, Foreign Direct
Investment in Africa -Some Case Studies, IMF Working
Paper 61, 2002.
Batra, Geeta, Daniel Kaufmann and Andrew Stone, Investment
Climate around the World: Voices of the Firms from the
World Business Environment Survey, World Bank,
Washington, D.C, 2003.
Berhanu N., Foreign Direct Investment in Ethiopia. In
Alemayehu Geda(ed.). Economic Focus Vol. 2, no.3,
1999.
Douglas H.Brooks, Emma Xiaoqin Fan, Lea R.Sumulong,
Foreign direct investment in developing Asia: Trends,
effects, and likely issues for the forthcoming WTO
negotiations, Asian Development Bank, Manila, 2003.
Dipti Ranjan Mohapatra- Foreign Direct Investment Inflows to Ethiopia during
1992 to 2012: An Empirical Analysis
EUROPEAN ACADEMIC RESEARCH - Vol. II, Issue 9 / December 2014
12105
http://www.adb.org/Documents/ERD/Working_Papers/w
p038.pdf.
Ethiopian Economic Association, Annual Report on the
Ethiopian Economy, Vol.1. 1999-2000, Addis Ababa,
Ethiopia: United printers, 2001.
Ethiopian Economic Association, Report on the Ethiopian
Economy. Vol.5.2005-2006. Addis Ababa, Ethiopia:
United printers, 2007.
Federal Democratic Republic of Ethiopia (FDRE), Ethiopia:
Sustainable Development and Poverty Reduction
Program, Ministry of Finance and Economic
Development (MOFED), 2002.
Geda A. and Degefe B., Explaining African Growth
performance: The case of Ethiopia, Paper to be
presented on AERC Growth Research Workshop,
Nairobi, Kenya, 2002.
Getenet Astatike and Hirut Assefa, Determinants of Foreign Di
rect Investment in Ethiopia: A time Series Analysis.
Policy Studies Institute, London, 2006
Goldberg, Linda S. and Kelin Michaeal W., Foreign Direct
Investment, Trade and Real Exchange Rate Linkages in
South East Asia and Latin America, NBER
Working Paper No.6344. Massachusetts, USA, 1997.
International Monetary Fund, Balance of Payment Manual (5t
h edition), Washington D.C., 1993.
(http://www.imf.org/external/np/sta/bop/BOPman.pdf.).
Jenkins, Carolyn and Thomas, Lynne, Foreign Direct
Investment in Southern African: Determinants,
Characteristics and Implications for Economic
Growth and Poverty Alleviation, 2002.
Linda, M. Matar and Said M. Elfakhani, Foreign direct
investment in the Middle- East and North Africa Region.
J. Global Business Advancement, Vol. 1, No. 1, 2007.
Dipti Ranjan Mohapatra- Foreign Direct Investment Inflows to Ethiopia during
1992 to 2012: An Empirical Analysis
EUROPEAN ACADEMIC RESEARCH - Vol. II, Issue 9 / December 2014
12106
Morisset, Jacques, Foreign Direct Investment in Africa: Policies
also Matter., Transnational Corporation, 9(2), 107-125,
2000.
Noorbakhsh, F., Paloni, A. and Youssef, A., Human Capital and
FDI Inflows to Developing countries: New Empirical Evi
denceWorld Development, Vol.29, No. 9, pp. 1593-1601,
2001.
OECD, Foreign Direct Investment for Development: Maximizing
Benefits and
Minimizing Cost, OECD Publishing Service, Paris, 2002.
http://www.oecd.org/dataoecd/47/51/1959815.pdf.
Serven, L. and Solimano A., Private Investment and
Macroeconomic Adjustments, Observer, Vol.7, no.5,
1992.
Todaro, Michael P., Economics for Developing World (3rd Ed.),
Longman Limited, New Delhi, 1992.
UNCTAD, World Investment Report: Trends and Determinants,
United Nations Conference on Trade and Development,
New York and Geneva, United Nations, 1998.