Foreign Direct Investment (FDI) in Bangladesh: Prospects ...

JOURNAL OF ECONOMIC DEVELOPMENT
FOREIGN DIRECT INVESTMENT IN POST-REFORM INDIA:
LIKELY TO WORK WONDERS FOR REGIONAL DEVELOPMENT?
PETER NUNNENKAMP AND RUDI STRACKE*
Kiel Institute for the World Economy and University of St. Gallen
We make use of a new and detailed database on FDI approvals since the early 1990s to address two major issues related to FDI and regional development in India in the post-reform period. First, we analyze the location choices of foreign investors. The evidence indicates that the concentration of FDI in a few relatively advanced regions may have prevented FDI effects from spreading across the Indian economy. Second, we evaluate whether the link between FDI and economic growth has become stronger in the aftermath of reforms. Various categories of FDI are indeed positively correlated with per-capita income growth across Indian states. However, it is only for the richer states that FDI appears to be associated with higher growth. FDI is thus likely to increase regional income disparity in India. Keywords: FDI Approvals, Sub-Categories of FDI, Location Choice, Economic
Growth, Regional Divergence JEL classification: F23, O18, O53
1. INTRODUCTION The stock of foreign direct investment (FDI) in India soared from less than US$ 2
billion in 1991, when the country undertook major reforms to open up the economy to world markets, to more than US$ 50 billion in 2006 (UNCTAD (2007), p. 257). Policymakers in India as well as external observers attach high expectations to FDI. According to the Minister of Finance, P. Chidambaram, “FDI worked wonders in China and can do so in India” (Indian Express, November 11, 2005). Bajpai and Sachs (2000, p. 1) advise policymakers in India to throw wide open the doors to FDI which is supposed to bring “huge advantages with little or no downside.”
The major objective of this paper is to analyze whether the currently prevailing euphoria with respect to FDI effects in India is supported by empirical facts. In Section 2
* We would like to thank Florian Mölders for his support in performing the regression analysis in Section 4. Critical comments and helpful suggestions by an anonymous referee are gratefully acknowledged.

PETER NUNNENKAMP AND RUDI STRACKE 56
we summarize major arguments in the previous literature why FDI may fall short of high expectations in promoting growth and alleviating poverty. In particular, FDI effects on regional development in India are open to question, i.e., whether FDI helps poorer regions in India to catch up with more advanced regions. Evidence available for China rather suggests that FDI contributed to widening income gaps between prospering coastal regions and provinces in the hinterland (e.g., Fujita and Hu (2001), Zhang and Zhang (2003)).
The present paper draws on a new and unpublished database on FDI approvals since the early 1990s. In Section 3 we explain why this detailed database can help resolve at least some of the disputed issues concerning FDI in the post-reform era. In Section 4, we analyze the location choices of foreign investors. In particular, we argue that the concentration of FDI in a few relatively advanced locations may have prevented FDI effects from spreading across the Indian economy. We take the sectoral composition of FDI into account, which offers additional insights even though a finer disaggregation would be required to differentiate clearly between different FDI motivations.
Section 5 turns to the question whether FDI has been associated with higher growth and less poverty in Indian states. The lack of regionally disaggregated data on possible growth determinants other than FDI constrains us in assessing the relative importance of FDI. Moreover, intricate questions about causality are almost impossible to resolve. Yet the available evidence suggests that FDI has led to regional divergence, rather than convergence. We outline some directions for future research in the concluding section.
2. EARLIER FINDINGS AND OPEN QUESTIONS Indian policymakers are in good company when expecting wonders from FDI. The
so-called Monterrey Consensus, achieved at the UN Conference on Financing for Development in 2002, famously declared: “Foreign direct investment contributes toward financing sustained economic growth over the long term. It is especially important for its potential to transfer knowledge and technology, create jobs, boost overall productivity, enhance competitiveness and entrepreneurship, and ultimately eradicate poverty through economic growth and development” (UN (2002), p. 5) However, the empirical evidence supporting this view across developing host countries of FDI is weak at best (e.g., Nunnenkamp (2004)).
Likewise, earlier studies on India typically failed to find a robust and positive link between inward FDI and economic growth, including Agrawal (2005) and Pradhan (2002).1 The evidence is particularly weak as concerns causation running from FDI to
1 By contrast, Sahoo and Mathiyazhagan (2003) conclude that FDI inflows have played a vital role in the Indian economy. These authors apply co-integration methods developed by Johansen, using annual time series data on FDI and GDP from 1980 to 2001. Interestingly, Sahoo and Mathiyazhagan (2002) came to

FOREIGN DIRECT INVESTMENT IN POST-REFORM INDIA 57
economic growth in India, pointing to a wide gap between political rhetoric and economic reality.2 Several arguments have been advanced in the literature to explain why FDI may have fallen short of high expectations:
First of all, FDI flows to India may still be too low to make a big difference (Bhat et al. (2004)). The recent boom notwithstanding, FDI inflows in 2004-2006 amounted to just 5.2 percent of gross fixed capital formation in India, compared to about 13 percent for all developing economies (UNCTAD (2007), Annex Table B.3). However, this gap can be attributed at least partly to a “large-country bias,” according to which international trade and investment relations typically play a smaller role for larger countries. Comparing India and China, i.e., similarly large countries, FDI still accounts for a smaller share of overall capital formation in India than in China (8.3 percent), but the gap is substantially reduced.
Second, economy-wide growth effects may have been compromised by the type of FDI India has attracted. Growth effects largely depend on whether firm-specific assets that foreign investors are supposed to have spill over to local firms (Lipsey (2002), Görg and Greenaway (2004)). Spillovers tend to be more pronounced if (backward and forward) linkages between foreign and local companies are strong. However, the Asian Development Bank expressed concerns about “the apparently limited linkages between MNEs and local firms” in India (ADB (2004), p. 228).3
Third, economy-wide growth effects of FDI in India may be hindered if FDI is concentrated in relatively advanced locations (Aggarwal (2005)). To the extent that greater openness to FDI in the post-reform era has lead to further agglomeration, FDI may have fuelled regional divergence, rather than promoting convergence. The Schumpeterian growth model presented by Aghion et al. (2006) provides an explanation why more FDI may promote growth in relatively advanced regions, while leaving growth almost unaffected in poorer regions.4
One reason for the scarcity of recent empirical studies addressing these issues is the lack of sufficiently disaggregated FDI data. In addition, it continues to be disputed how to measure FDI in order to capture growth effects. According to Blonigen and Wang (2005, p. 234), “theory would suggest that FDI stock is the appropriate measure of FDI.” Caves (1996, p. 235-236) takes the opposite view: While “no overall theoretical prediction connects the stock of foreign investment in the LDC to the rate at which its
exactly the opposite conclusion when employing the same methodology, but using quarterly data for 1991-2000 in their earlier working paper version. 2 Studies accounting for the possibility that the relationship between FDI and growth may be bi-directional include: Dua and Rashid (1998), Chakraborty and Basu (2002), Bhat et al. (2004), Kumar and Pradhan (2005), Herzer et al. (2006), and Chakraborty and Nunnenkamp (2008). 3 For instance, foreign companies in the software industry are said to operate as “export enclaves” (Kumar (2003), p. 27). 4 We return to this model in the concluding section.

PETER NUNNENKAMP AND RUDI STRACKE 58
national income grows”, …, “an inflow of MNE capital, of course, enlarges the rate of growth as it affects gross domestic investment.” Most reasonably perhaps, both FDI flows and stocks are flawed measures as economic effects in the host country stem from FDI-related activities such as sales, employment and R&D (Lipsey (2002), Mayer-Foulkes and Nunnenkamp (2005)). The widespread use of flow data in recent cross-study studies on the growth effects of FDI, including Blonigen and Wang (2005), is largely due to data constraints with respect to FDI-related activities in the host country. While this limitation also applies to the present study, we make use of an unpublished database providing disaggregated information on various aspects of FDI in India that the previous literature has hardly addressed.
3. WHAT THE DATA CAN(NOT) TELL? We draw on a detailed account of FDI approvals in India during the period
1991-2005. By using most recent FDI data, we also take into account that earlier findings may no longer apply, considering that India’s reform program of 1991 has changed considerably the rules and conditions under which FDI operates in the country. Restrictive FDI and trade regimes are widely believed to have seriously impeded higher FDI inflows until the 1990s, even though some FDI and trade restrictions had been relaxed in the mid-1980s already (Balasubramanyam and Mahambare (2003)).
The economic reforms constituted a break with the dirigisme of the past. The removal of controls over FDI represented the reform element most obviously suited to stimulate FDI in India. The list of FDI projects placed under the automatic approval route was progressively expanded during the 1990s (Singh (2005)). Performance requirements such as export obligations were gradually dismantled. New sectors (e.g., mining, financial services, telecommunication, etc.) were opened up to FDI and foreign majority holdings were allowed in various industries (Kumar (2003)). Full foreign ownership was allowed in most manufacturing industries. The relaxation of ownership restrictions is not only likely to have induced more FDI; at the same time, the incentives of foreign investors to transfer modern technologies were strengthened in this way.5
The lowering of trade barriers constituted another cornerstone of the reform program. For instance, the highest import tariff rate dwindled from 355 percent in 1990/91 to 25 percent in 2003/04 (Panarariya (2005)). Principally, lower trade barriers have ambiguous effects on FDI. On the one hand, import liberalization weakened previous incentives to use FDI as a tariff-jumping device, i.e., serve protected Indian
5 Athreye and Kapur (2001) note that, according to surveys conducted in the early 1990s, almost half of foreign direct investors did not transfer up-to-date technologies to India. Kumar and Aggarwal (2005) find that foreign companies were more inclined to undertake R&D in India in response to the economic liberalization program.

FOREIGN DIRECT INVESTMENT IN POST-REFORM INDIA 59
markets by local production. On the other hand, import liberalization strengthened the incentives to use India as an export platform and a cost effective location for intermediate production. It should be noted in this context that import licensing of intermediate inputs and capital goods was largely abolished (Panagariya (2005)). By encouraging a better alignment of FDI inflows with India’s comparative advantage, the chances of India should have improved to benefit from FDI-induced technical and knowledge spillovers.6
According to Sachs et al. (2002), the reform-mindedness of Indian states has rendered them more attractive to FDI. Some observers have doubted, however, that economic reforms went far enough to remove the distinct anti-export bias of India’s trade policy and, thus, induce types of FDI that may have more favorable growth effects (Balasubramanyam and Mahambare (2003), Fischer (2002)).7 Moreover, factor and product market distortions persisted at least in parts of India. Aggarwal (2005) finds that stricter labor market rigidities at the state level discouraged FDI in 1991-2001, especially in the case of export-oriented FDI.
To address the determinants and effects of FDI since the reform program of 1991, we use detailed information on the number and amount of approved FDI projects, the share of foreign equity, the state and district where FDI projects take place, and the country of origin.8 Moreover, the database offers information on planned activities which allows us to classify FDI projects according to broad sectors (primary, secondary and tertiary). Finally, the database also covers technology licensing arrangements (so-called technical cases) that do not involve FDI inflows.
Admittedly, approved FDI may deviate considerably from realized FDI. Figure 1 indicates that only about one third of approved FDI amounts were realized in the 1990s. Nevertheless, this gap does not seriously constrain the subsequent analysis. The increase in realized FDI was largely in line with the increase in approved FDI until recently. Consequently, the analysis of the effects of booming FDI on subsequent economic development in Section 5 is unlikely to be distorted by using approval data. Only recently, the development of realized and approved FDI diverged. Approved FDI dropped substantially after its peak in the late 1990s. This may be due to changes in the approval procedure. Given that the list of FDI projects placed under the automatic approval route has been progressively expanded, the database on approved FDI may
6 Gupta (2005) argues that India’s earlier import substitution strategy impaired the economic benefits to be derived from FDI. Bhat et al. (2004) suspect economic spillovers to have remained weak due to a lack of local skills. 7 Agarwal (2001) suspects FDI in India to be still domestic market seeking. 8 The data were kindly made available by the Department of Industrial Promotion and Policy (DIPP) of the Ministry of Commerce and Industry. While the database covers the period 1991-2005, we do not use the data for 1991 and 1992 in the subsequent sections. Specific information on FDI projects, notably the state in which projects are located, is largely lacking for these years.

PETER NUNNENKAMP AND RUDI STRACKE 60
understate actual FDI inflows in recent years. This is even though automatic route approvals are included in the database until October 2004, according to information received from India’s Ministry of Commerce and Industry. It should be noted, however, that the data on realized FDI suffer from inconsistency, too. Most importantly, it is only since 2000 that the Reserve Bank of India offers a revised series of FDI inflows that includes reinvested earnings and debt transactions between related entities (to be counted as FDI according to international standards).
Approved Realized (US$ million) aAnnual average. bleft-hand scale. cright-hand scale.
0
200
400
600
800
1000
1200
1400
1600
1800
2000
Number of cases
number
b0
1000
2000
3000
4000
5000
6000
7000
8000
9000
10000
US $ million Min. of Com. RBI
1991-931994-961997-992000-022003-05
US$ million
c c c
Source: Unpublished database on FDI approvals, Ministry of Commerce and Industry (2007), Reserve Bank of India (RBI) (2006).
Figure 1. Approved and Realized FDI Flows to India, 1991-2005a
Moreover, differences in the level of FDI approvals and realized FDI are unlikely to
significantly affect our results since the subsequent analysis is largely based on FDI shares, e.g., the share of a particular region in approved FDI in all India. Accordingly, results would only be distorted if approved and realized FDI differed to a considerably larger extent in one region than in another region.9 Finally, we focus on the number of approved FDI projects, rather than the amounts of approved FDI. The former measure is
9 Note also that the analysis of FDI shares is unaffected by missing data for FDI projects automatically approved most recently, unless missing cases are distributed unevenly across states, districts or sectors.

FOREIGN DIRECT INVESTMENT IN POST-REFORM INDIA 61
unaffected by the gap between approved and realized amounts for particular FDI projects.
In addition to overall FDI, we take into account that the sectoral structure of FDI in India has changed dramatically since the early 1990s. Figure 2 portrays the development of the share of three major sectors in the overall number of FDI cases. Very similar to what Chakraborty and Nunnenkamp (2008) observed for (realized) FDI stocks, there is a clear trend towards FDI in services which accounted for about 60 percent of all approved FDI cases in recent years. In sharp contrast, FDI in manufacturing clearly dominated in the first half of the 1990s. FDI in the primary sector remained marginal throughout the period of observation. We employ the sector-wise FDI data, in addition to overall FDI, when assessing major FDI determinants in the subsequent section and also with respect to the FDI - growth correlations reported in Section 5.
0
0.1
0.2
0.3
0.4
0.5
0.6
0.7
0.8
0.9
1991 1992 1993 1994 1995 1996 1997 1998 1999 2000 2001 2002 2003 2004 2005
primary sector secondary sector tertiary sector
Source: Unpublished database on FDI approvals.
Figure 2. Sector-wise Structure of FDI Approvals in India, 1991-2005 (share in total number of FDI cases)

PETER NUNNENKAMP AND RUDI STRACKE 62
4. WHERE DID FDI GO IN POST-REFORM INDIA? 4.1. Regional Concentration of FDI FDI flows to India are heavily concentrated in a few states.10 Measured by the
amount of approved FDI in 2001-2005, almost 26 percent of overall FDI was located in Maharashtra, followed by Delhi (13.6 percent), Karnataka (11.3 percent), Gujarat (8.3 percent) and Tamil Nadu (6.3 percent).11 The concentration of FDI in these top-5 states was still more pronounced with respect to the number of FDI projects (74 percent versus 65 percent).
However, these simple concentration measures offer limited insights at best. FDI has to be “normalized” in order to reflect the states’ attractiveness to FDI. In the following, we relate FDI to the population of states to control for their size.12 FDI per capita for each state is then related to FDI per capita for all India to reflect a state’s relative attractiveness. Moreover, the interesting question in the context of the present paper is whether the concentration in a few states has become stronger in the course of economic reforms. Therefore, we calculate the above measure for three time intervals (i.e., 1993-1996, 1997-2000, and 2001-2005) to determine possible trends.
We focus on the number of approved FDI projects (“FDI cases” for short) in the remainder of this section. Unlike the distribution of the amount of FDI, the distribution of FDI cases is not affected by single, exceptionally large FDI approvals.13 Nevertheless, the amount and the number of FDI projects are strongly correlated across Indian states. The correlation coefficient amounts to 0.88 for the whole period of observation (1993-2005).
10 Whenever the data situation allows us to do so, we consider all Indian states, including Union Territories as well as Jharkhand, Uttaranchal and Chhattisgarh (which were part of Bihar, Uttar Pradesh and Madhya Pradesh, respectively, up to 2000). However, in several instances we had to refer to the older state boundaries for consistency reasons. For similar findings on the concentration of FDI in India, see Aggarwal (2005), Basu (2005), and Purfield (2006). 11 These shares in FDI in all India are understated somewhat as the state is not indicated for about 15 percent of approved FDI in 2001-2005. For the whole period of observation (1993-2005), the state in which FDI is located remains unknown for 27.6 percent of approved amounts and 17.4 percent of approved cases. 12 Population figures refer to census years closest to the beginning of the period under consideration, e.g., 1991 for the period 1993-1996 and 2001 for the period 2001-2005. However, we refer to estimated population data below whenever census years and the initial year of the period under consideration deviate by more than two years. 13 For instance, Delhi attracted one project of US$ 1.3 billion in 1995. This project boosted Delhi’s share in FDI amounts approved in all India in the period 1993-1996 by more than five percentage points to 19.1 percent.

FOREIGN DIRECT INVESTMENT IN POST-REFORM INDIA 63
Figure 3. Relative Attractiveness of Indian States to FDI
For a start, we compare the attractiveness of Indian states to FDI, measured in the
way just described, for the whole period of observation. Most of the Union Territories clearly stand out in that FDI per capita was between 5.3 to 20.8 times higher than the average for India as a whole (Figure 3).14 This is not surprising as Union Territories are typically cities without a less developed, rural hinterland. Another relatively small group of five states attracted significantly more FDI per capita than India as a whole (Goa, Haryana, Karnataka, Maharashtra and Tamil Nadu). In sharp contrast, 20 states appear to be fairly unattractive to FDI, with ratios of FDI per capita below 0.5 and sometimes close to zero.
Next, we assess whether traditionally attractive states have become still more attractive in the aftermath of economic reforms (Figure 4). Concerning the Union
14 Exceptions are Lakshadweep as well as Andaman and Nicobar, which both are small islands far off the coast.

PETER NUNNENKAMP AND RUDI STRACKE 64
Territories, the picture is ambiguous: some of them managed to increase their relative share over time, whereas others failed to do so. Among the remaining Indian states, it was mainly the attractive states (except for Haryana) which further increased their FDI inflows in the aftermath of reforms. By contrast, out of the group of states with ratios well below the national average, only Kerala improved its position steadily, though just slightly from 0.43 to 0.57. All other states in this group failed to improve their relative attractiveness.
Figure 4. Trends in FDI Concentration
Taken together, India is a highly divided country with respect to the distribution of
FDI across states. FDI is concentrated in two regions, namely in the area around Delhi and in the southern part of India, especially along the west coast. The region around Delhi seems to have lost some of its importance, whereas the south-western part of India

FOREIGN DIRECT INVESTMENT IN POST-REFORM INDIA 65
further increased its share in total FDI. The increasing concentration of FDI may imply that many large states and, therefore, a large part of the Indian population were left unaffected by booming FDI in the post-reform period. Before returning to this question in Section 5, we will re-assess the concentration issue at the level of districts within selected states, and discuss major factors that may be underlying the uneven distribution of FDI.
The distribution of FDI within major states is portrayed in Table 1. We focus on large states at a considerably different stage of economic development, proxied by initial per-capita income in 1993.15 The concentration on the single most important district as well as the top-3 districts is based on the number of FDI projects located in these districts. In four out of the eleven states listed in Table 1, the most important district accounted for more than 60 percent of all FDI projects the respective state attracted in 1993-2005. Most notably, almost 90 percent of FDI projects in Karnataka went to Bangalore - followed by Kolkata in West Bengal, Chennai in Tamil Nadu, and Mumbai in Maharashtra.
At first sight, the concentration on the top district appears to be much weaker in less developed states such as Madhya Pradesh, Rajasthan, Uttar Pradesh and Bihar. However, the concentration is fairly similar in richer and poorer states once the share of top districts in FDI cases is related to the population living in these districts. For instance, the concentration on the top district in Uttar Pradesh was only slightly less than that in Maharashtra when FDI shares are related to population shares. In Rajasthan this relative measure reveals a somewhat higher concentration of FDI on the top district than in Karnataka. The relative concentration on the top district turns out to be particularly high in Kerala (23.3), Madhya Pradesh (22.9) and Bihar (21.8), even though the share of FDI projects per se was lowest in Madhya Pradesh, and the average per-capita income was lowest by far in Bihar.
The high concentration of FDI on a few economic centers within the states under consideration is corroborated when looking at the top-3 districts. With few exceptions, the top-3 districts attracted more than two thirds of the states’ total number of FDI projects in 1993-2005. In Karnataka, the three districts (urban and rural Bangalore plus Mysore) accounted for almost all FDI projects. And again, Madhya Pradesh is not really an exception: Rather, the concentration on the top-3 districts was particularly pronounced in this state when taking into account that more than half of all FDI projects went to districts with a combined population of less than three percent of the state’s total population.
15 Except Kerala, all states listed in Table 1 have a population of more than 40 million.

PETER NUNNENKAMP AND RUDI STRACKE 66
Table 1. Selected States: Concentration of FDI (number of projects) at the District Levela, 1993-2005 (percent)
Statesb Top districtc Top-3 districtsc
Maharashtra (12200) 60.1 (3.4) 85.9 (19.3) Gujarat (9800) 32.4 (11.5) 65.7 (21.4) Tamil Nadu (9000) 63.8 (7.0) 86.7 (18.4) Kerala (8000) 44.3 (1.9) 78.0 (5.4) Karnataka (7800) 89.3 (12.4) 97.6 (20.9) Andhra Pradesh (7400) 57.0 (4.9) 76.2 (13.0) West Bengal (6800) 70.2 (5.7) 82.1 (26.3) Madhya Pradesh (6600) 22.9 (1.0) 50.9 (2.8) Rajasthan (6200) 31.6 (3.2) 68.4 (6.3) Uttar Pradesh (5100) 30.7 (2.0) 68.5 (4.5) Bihar (3000) 52.4 (2.4) 83.3 (10.9)
Notes: a Total number of projects in the particular state excludes projects for which the location at the district level is not disclosed. The share of undisclosed projects ranges from 2.8 percent (Karnataka) to 14.3 percent (Bihar). b States ranked according to per-capita income in 1993 (as given in parentheses). c In parenthesis is a percent of the state’s population in 2001 Sources: Unpublished database on approvals, Central Statistical Organisation (var. iss.).
4.2. Major FDI Determinants In this section, we present regression results to provide insights on major factors
underlying the distribution of FDI approvals across Indian states in 1993-2005. This also offers indirect evidence with respect to the chances of less advanced states to improve their attractiveness to FDI and, thereby, foster economic growth. As noted by the World Bank (2004), differences in business conditions are far more pronounced within India than the much discussed differences between all India and competing China. At the same time, the World Bank’s Investment Climate Assessment in 2004 suggests that those states attracting the bulk of FDI are characterized by better business conditions.
The dependent variable is defined as the natural logarithm of the number of FDI cases in a particular state. We treat zero observations for FDI cases in two ways: in the preferred specification, we set the log of FDI equal to minus one when a state had no FDI case in the period under consideration.16 The advantage of this approach is that we do not lose any observations for the FDI variable. Alternatively, we dropped zero observations for FDI in order to assess whether the results depend on the above choice.
16 While this is a somewhat arbitrary choice, the resulting difference in the logged dependent variable between FDI cases=1 and FDI cases=0 (-1) is similar to the corresponding difference between FDI cases=2 and FDI cases=1 (-0.69).

FOREIGN DIRECT INVESTMENT IN POST-REFORM INDIA 67
As concerns the possible driving forces underlying the distribution of FDI, we account for various factors that have been used in the cross-country literature on FDI determinants (see, e.g., Chakrabarti (2001)). The focus is on structural characteristics of Indian states that may impede their attractiveness to FDI in the long run. Notably, we include indicators on the economic development of Indian states, their size, the quality of infrastructure, and the level of education. Whenever possible, the data on the indicators used refer to the initial year of the two sub-periods, 1993-1998 and 1999-2005, in order to minimize any reverse causation that might exist.17
Possible FDI determinants considered in all estimations include the per-capita income and the population of states, population density, financial development, as well as a dummy variable set equal to one for Union Territories. Population is included as an explanatory variable to control for the size of states. As concerns education-related variables, we enter either the literacy rate or student enrolment in higher than primary education. Likewise, we consider either roads or electricity as an additional indicator of the quality of infrastructure in Indian states. All variables are logged.
Even though variables related to education and infrastructure enter alternatively in the regressions, we may still encounter multicollinearity problems. The per-capita income of states is highly correlated with literacy rates (0.69) and financial development (0.81); the same applies to the correlation between population density and roads (0.85). In principle, multicollinearity could be mitigated by first regressing specific determinants on per-capita income and then using the residuals in the FDI equation. We refrained from doing so for several reasons. In the case of population density and roads, it would be somewhat arbitrary to decide on the variable for which to take residuals. Moreover, in several instances (see below for details), both variables turned out to be significant even though they are correlated.
The regressions are performed by pooling the observations for the two sub-periods of 1993-1998 and 1999-2005. We include a time dummy, with D=1 for the second sub-period, in order to account for the structural break in our dependent variable resulting from liberalized approval procedures (see Section 3).18 Depending on missing values for explanatory variables, we end up with 43-52 observations.
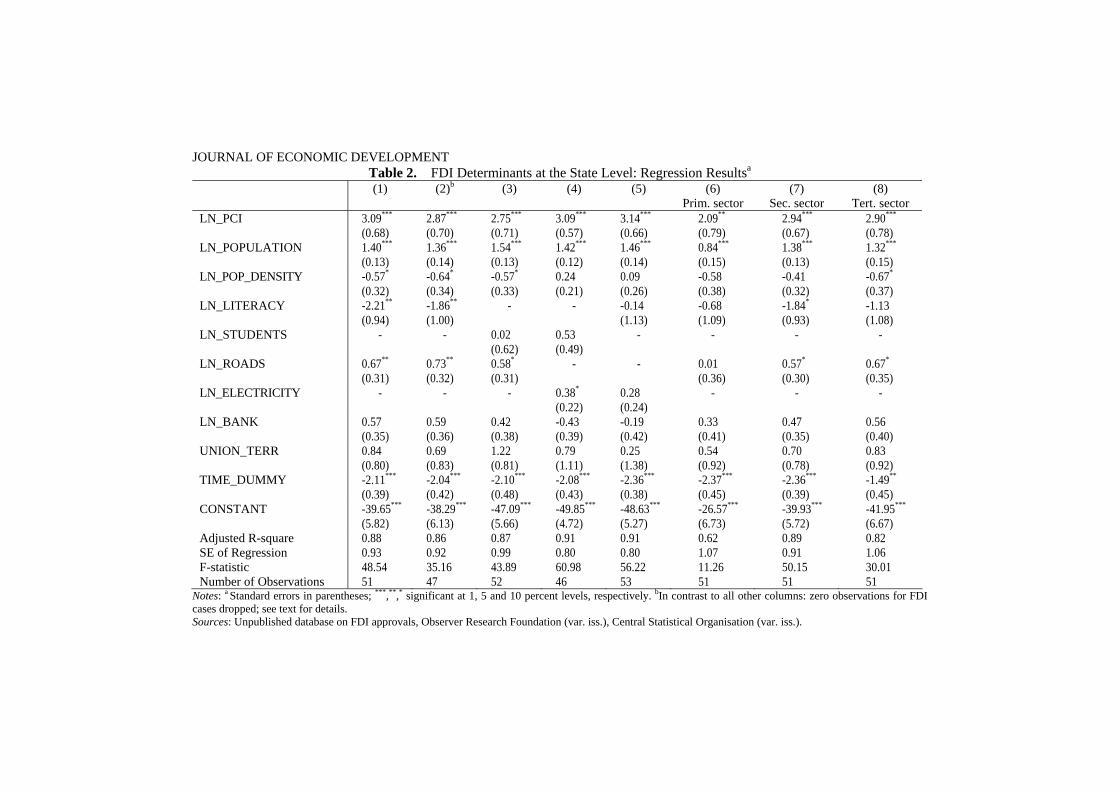
The results summarized in Table 2 clearly show that more advanced Indian states attract more FDI. In all estimations with overall FDI as the dependent variable, the coefficient of per-capita income (LN_PCI) is significant at the one percent level. At the same time, the effect of per-capita income on the number of FDI cases is quantitatively
17 For some indicators, data are lacking for 1993 and 1999. In these cases, we chose the closest year available. See Appendix table for exact definitions and summary statistics of state characteristics used in the regression analysis. 18 It would be interesting to interact the time dummy with possible FDI determinants to assess whether they have become more or less important over time. However, the limited number of observations renders this exercise rather futile.

PETER NUNNENKAMP AND RUDI STRACKE 68
important, with a one percent increase in per-capita income being associated with an increase in the number of FDI cases of about three percent. The same applies to population (LN_POPULATION): All coefficients are highly significant and positive as expected, consistently showing an elasticity of about 1.4-1.5.
The coefficient of the dummy variable for Union Territories (UNION_TERR) remains statistically insignificant. In some contrast to Sachs et al. (2002), according to whom FDI located mainly in urbanized states, more densely populated states no longer attract more FDI once other FDI determinants are controlled for. In some regressions, the coefficient of LN_POP_DENSITY is even significantly negative, though only weakly so. This may suggest that foreign investors prefer less congested regions once the stage of economic development and the quality of infrastructure are controlled for. The time dummy accounting for the break in the time series on FDI approvals is consistently negative and highly significant. This is not surprising given the above noted liberalization of approval procedures.
The treatment of zero observations for FDI cases does not affect our results. The significance as well as the size of coefficients is hardly affected when comparing columns (1) and (2) in Table 2. Hence, it is only for our preferred model with zero observations included in the way described above, that we report different specifications with respect to variables related to infrastructure and education as well as estimations with sector-specific FDI as the dependent variable.
The evidence for the indicators related to infrastructure and education turns out to be ambiguous. This is in line with the previous literature where the role of infrastructure as a determinant of FDI in India has remained disputed. While the World Bank (2004) claims that deficient infrastructure represents an important bottleneck to investment even in relatively advanced states such as Maharashtra and Gujarat, Chakravorty (2003) finds that infrastructure had little influence in determining the location or quantity of new industrial investment. The infrastructure index used by Singh and Srinivasan (2004) is only weakly correlated with FDI per capita approved in 1991-2001.
Our regression results suggest that the impact of infrastructure on FDI depends on the specific indicator chosen. FDI is more strongly correlated with transport infrastructure, as measured by the length of roads (LN_ROADS), than with the supply of electricity (LN_ELECTRICITY). The coefficient of roads is significant in all three estimations for overall FDI including this variable (at the 10 percent level or better) with an elasticity of 0.6-0.7. Electricity enters significantly (at the 10 percent level) in column (4), while it remains insignificant in column (5). The weaker evidence for electricity seems to be due to the shortcomings of the indicator used here (i.e., the supply of kW per capita) as well as the reduced number of available observations.19
19 Survey results of the World Bank (2004) suggest that the availability and the cost of electricity are among the most important determinants of where companies locate. Kochhar et al. (2006) use transmission and distribution losses of state level electricity boards, in order to account for generated power that is not paid for.
OURNAL OF ECONOMIC DEVELOPMENT
Table 2. FDI Determinants at the State Level: Regression Resultsa
(1) (2)b (3) (4) (5) (6) Prim. sector
(7) Sec. sector
(8) Tert. sector
LN_PCI 3.09***
(0.68) 2.87***
(0.70) 2.75***
(0.71) 3.09***
(0.57) 3.14***
(0.66) 2.09**
(0.79) 2.94***
(0.67) 2.90***
(0.78) LN_POPULATION 1.40***
(0.13) 1.36***
(0.14) 1.54***
(0.13) 1.42***
(0.12) 1.46***
(0.14) 0.84***
(0.15) 1.38***
(0.13) 1.32***
(0.15) LN_POP_DENSITY -0.57*
(0.32) -0.64*
(0.34) -0.57*
(0.33) 0.24 (0.21)
0.09 (0.26)
-0.58 (0.38)
-0.41 (0.32)
-0.67*
(0.37) LN_LITERACY -2.21**
(0.94) -1.86**
(1.00) - - -0.14
(1.13) -0.68 (1.09)
-1.84*
(0.93) -1.13 (1.08)
LN_STUDENTS - - 0.02 (0.62)
0.53 (0.49)
- - - -
LN_ROADS 0.67**
(0.31) 0.73**
(0.32) 0.58*
(0.31) - - 0.01
(0.36) 0.57*
(0.30) 0.67*
(0.35) LN_ELECTRICITY - - - 0.38*
(0.22) 0.28 (0.24)
- - -
LN_BANK 0.57 (0.35)
0.59 (0.36)
0.42 (0.38)
-0.43 (0.39)
-0.19 (0.42)
0.33 (0.41)
0.47 (0.35)
0.56 (0.40)
UNION_TERR 0.84 (0.80)
0.69 (0.83)
1.22 (0.81)
0.79 (1.11)
0.25 (1.38)
0.54 (0.92)
0.70 (0.78)
0.83 (0.92)
TIME_DUMMY -2.11***
(0.39) -2.04***
(0.42) -2.10***
(0.48) -2.08***
(0.43) -2.36***
(0.38) -2.37***
(0.45) -2.36***
(0.39) -1.49**
(0.45) CONSTANT -39.65***
(5.82) -38.29***
(6.13) -47.09***
(5.66) -49.85***
(4.72) -48.63***
(5.27) -26.57***
(6.73) -39.93***
(5.72) -41.95***
(6.67) Adjusted R-square 0.88 0.86 0.87 0.91 0.91 0.62 0.89 0.82 SE of Regression 0.93 0.92 0.99 0.80 0.80 1.07 0.91 1.06 F-statistic 48.54 35.16 43.89 60.98 56.22 11.26 50.15 30.01 Number of Observations 51 47 52 46 53 51 51 51
Notes: a Standard errors in parentheses; ***,**,* significant at 1, 5 and 10 percent levels, respectively. bIn contrast to all other columns: zero observations for FDI cases dropped; see text for details. Sources: Unpublished database on FDI approvals, Observer Research Foundation (var. iss.), Central Statistical Organisation (var. iss.).
J

JOURNAL OF ECONOMIC DEVELOPMENT
The coefficient of LN_BANK, our indicator of financial development of Indian states, remains insignificant in all estimations reported in Table 2. Nonetheless, it might be unwarranted to conclude that financial development does not play any role in attracting FDI. Respondents to the World Bank’s recent investment climate assessment often rated access to finance to be a major obstacle to business operations. Furthermore, financial development and FDI turn out to be strongly correlated across Indian states in bivariate correlations, suggesting that the insignificance of LN_BANK in Table 2 may be due to multicollinearity.20 Note also that in columns (1) and (2), the positive coefficient of LN_BANK just fails to pass the 10 percent level of significance.
Most strikingly, we do not find that better education attracts FDI in Indian states. Rather, higher literacy rates (LN_LITERACY) are associated with less FDI according to columns (1) and (2). This implausible result seems to be driven by some exceptional cases of extremely small states and Union Territories. The Andaman & Nicobar Islands as well as Mizoram (with populations of less than one million) report literacy rates well above 80 percent, while the number of FDI cases was either zero or one. Once these outliers are not included (as in column (5) because data on electricity are lacking), literacy turns insignificant, which is reasonable if FDI in India increasingly draws on more skilled labor.
Student enrolment (LN_STUDENTS) also remains insignificant. Regrettably, we cannot differentiate between medium and higher levels of education in the regression analysis.21 This differentiation is possible, however, in bivariate correlations performed separately for the first sub-period 1993-1998 and the second sub-period 1999-2005. The results (not shown) suggest that the correlation between FDI and student enrolment at higher levels of education is significantly positive, and has become stronger recently. This might imply that FDI in India increasingly depends on the availability of skilled local labor.
In columns (6)-(8), we replicate the estimation of the basic specification in column (1) with sector-specific FDI cases in manufacturing, services and the primary sector (instead of the overall number of FDI cases) as alternative dependent variables. The findings on various FDI determinants are surprisingly robust for sector-specific FDI. This applies especially when comparing the results for FDI in manufacturing and in the services sector. In both sectors, the per-capita income of Indian states as well as their size (measured by population) enters significantly positive at the one percent level.
20 Bivariate correlations are not reported here in any detail, but are available from the earlier working paper version of this article (http://www.ifw-members.ifw-kiel.de/publications/foreign-direct-investment-in -post-reform-india-likely-to-work-wonders-for-regional-development-1/kap1375.pdf). The working paper also presents correlations with respect to telecommunications, the inclusion of which in the regressions is prevented by data constraints. 21 This is because we pool two sub-periods for which the data on student enrolment beyond the primary level are not comparable due to changes in the classification.

FOREIGN DIRECT INVESTMENT IN POST-REFORM INDIA 71
States with better transport infrastructure also attract more FDI in both sectors. Most of the other coefficients remain statistically insignificant - as was the case for overall FDI. The pattern for FDI in the primary sector differs in two respects. The size and the significance of the coefficient on per-capita income are less than for other sectors, and transport infrastructure turns out to be insignificant. These peculiarities are not surprising as the attraction of raw materials to foreign investors tends to dominate over concerns related to the stage of economic development and the quality of infrastructure in the host state.
All in all, the regression analysis supports the view that more advanced Indian states had considerably better chances to attract FDI.
5. FDI AND ECONOMIC PERFORMANCE OF INDIAN STATES 5.1. Overall FDI, Growth and Poverty Alleviation As noted in Section 2, previous studies typically failed to find a positive link
between inward FDI and economic growth. However, earlier findings may no longer apply if the changed policy environment has resulted in a fundamental shift in the behavior of foreign investors and, thus, in the benefits India may derive from FDI. Based on FDI approvals (in per-capita terms) in 14 major states in 1991-2001, Singh and Srinivasan (2004, p. 33) indeed find a significantly positive impact of FDI on per-capita income growth at the state level.
Similar to Singh and Srinivasan (2004), we do not attempt to estimate a well specified growth equation in this section. Rather, we proceed in several steps: For a start, we perform bivariate correlations between different FDI measures on the one hand, and growth and poverty-related performance variables on the other hand. Subsequently, we account for initial income and the FDI intensity at the state level to assess whether FDI may have helped poorer states to catch up with richer states. The possible problem of reverse causation running from growth to FDI is mitigated by employing FDI measures for the period 1993-1998 while performance variables extend to the more recent past.
Table 3 reports the correlation results for three FDI-related measures: In addition to our preferred measure of the number of FDI projects, we use the amount of approved FDI as well as the number of so-called technical cases (i.e., technology licensing arrangements). All measures are in per-capita terms of the states’ population, relative to the Indian average.
With few exceptions, the correlations turn out to be significant at the five percent level or better. Both the number of FDI cases and the number of technical cases are not only associated with higher per-capita income growth over the whole period of observation (1994-2005), but also with reduced poverty (measured by the percentage change in the share of people below the poverty line). Most strikingly perhaps, FDI and technical cases are correlated with poverty alleviation in rural areas, too. This appears to

PETER NUNNENKAMP AND RUDI STRACKE 72
be in contrast to the view that the rural population was hardly affected by FDI in India (Singh (2005), p. 5). Given that FDI tends to locate primarily in more developed areas (Section 4), the effects on rural poverty may be rather indirect, e.g., by inducing poor workers to migrate to urban centers. Earlier studies found net migration from poor to richer regions in India to respond only weakly to income differentials (Cashin and Sahay (1996), see also Sachs et al. (2002)). During the reform period, however, migration rates increased and “medium to long-term migration seems to be responding to the signal of economic opportunities” (Mahendra Dev and Evenson (2003), p. 20). Empirical evidence available for Mexico suggests that this recent development may have helped rural poverty reduction through FDI-induced employment opportunities in more advanced regions (Aroca and Maloney (2005)).
The data situation does not allow testing the robustness of the poverty-related results by considering only the recent past, in order to mitigate problems of reverse causation.22 However, such a test can be performed with respect to performance in terms of growth. As shown in Table 3, the results weaken considerably once we correlate the FDI-related measures with subsequent growth in 1999-2005, but the coefficients remain significantly positive at the ten percent level or better except for technical cases.
In summary, the correlations indicate that FDI may well have supported economic growth and poverty alleviation at the level of Indian states. It remains open to question, however, whether favorable effects were confined to a few states which were fairly advanced already.
Table 3. FDI, Economic Growth and Poverty Alleviationa: Correlation Results across Indian Statesb
Per-capital Income Growth Change in Poverty, 1994-2001 FDI Measure 1994-2005 1999-2005 Total Urban Rural
Number of FDI Cases
0.70*** 0.31* -0.46** -0.56*** -0.53***
FDI Amounts 0.66*** 0.39** -0.16 -0.25 -0.40** Number of Technical Cases
0.62*** 0.24 -0.46** -0.52*** -0.44**
Notes: a Percentage change of the share of people below the poverty line; all FDI measures are in per-capita terms, relative to the Indian average. *, **, and *** denote significance at the 10, 5 and 1 percent level, respectively. b Lakshadweep, Daman & Diu, Mizoram as well as Dadra & Nagar Haveli are missing due to lack of data. Sources: Unpublished database on FDI approvals, Reserve Bank of India (2006).
22 This is even though Dev and Ravi (2007) present data on changes in poverty-related indicators for the two sub-periods 1993-2000 and 1999-2005, respectively. However, these data are available for 19 states only.

FOREIGN DIRECT INVESTMENT IN POST-REFORM INDIA 73
5.2. Specific Categories of FDI and Growth Before returning to this issue, we explore the possibility that the growth effects of
FDI may differ depending on (i) where FDI is coming from, (ii) in which sector it is taking place, and (iii) the extent to which local Indian partners participate in FDI projects (joint ventures). In order to assess whether the structure of FDI matters, we replicate the above FDI-growth correlations for specific categories of FDI. As before, FDI is defined in per-capita terms for the period 1993-1998. The analysis is restricted to our preferred FDI measure, i.e., the number of FDI projects. Growth rates are for the period 1999-2005, excluding Nagaland and Tripura.23
To begin with, we use the information on the source of FDI projects that is included in the database on FDI approvals. The proposition that FDI effects may differ between source countries goes back to Kojima’s (1978) claim that Japanese FDI in developing countries is distinct in that it fosters trade and economic development.24 More recently, Harzing and Sorge (2003) argued that the source country of FDI matters as the strategies of multinational companies tend to be shaped by market conditions, business systems and the institutional background prevailing at home. Therefore, we calculate the correlation with growth for selected groups of foreign direct investors that contributed significantly to overall FDI projects in all India. The most important source countries are: the United Kingdom (16.3 percent of all FDI projects in 1993-2005), the United States (10.8), Germany (9.8), and Japan (6.2). In addition, we consider FDI projects undertaken by non-resident Indians (NRI), which the database identifies as a separate FDI category; NRI accounted for six percent of all FDI projects in 1993-2005.25
As concerns the four major home countries of foreign investors, there is at best weak evidence supporting the view that FDI from particular sources is superior to FDI from other sources. The correlations with growth are somewhat stronger for FDI from Japan and the United Kingdom than for FDI from Germany and the United States (Table 4). However, the correlation remains significant at the five percent level even for the two latter sources. This result is hardly surprisingly once it is taken into account that the
23 The differences between major sources of FDI as well as the sectors in which FDI takes place are hardly affected by the treatment of these two outliers, while all correlations tend to be weaker if Nagaland and Tripura are included. 24 The analysis across the host countries of Japanese and US FDI by Kumar (2000) lends some support to this view; Japanese companies are shown to move a larger part of the value chain to the host countries. In the Indian context, Banga (2003) shows that the export effects of FDI differed between the home countries of foreign investors. In contrast to the Kojima hypothesis, however, it turned out that FDI from the United States had a positive impact on the export intensity of non-traditional export industries, whereas Japanese FDI had not. 25 Taken together, the four source countries under consideration plus NRI accounted for about half of all FDI projects in 1993-2005. Their joint contribution to total approved FDI amounts was slightly less (44 percent).

PETER NUNNENKAMP AND RUDI STRACKE 74
location choices of foreign investors based in these four countries closely resemble each other.26 If a superior type of FDI exists at all, it tends to come from non-resident Indians. FDI by non-resident Indians is less closely aligned with other sources of FDI in terms of location choices.27 One may also suspect FDI by non-resident Indians to promote growth through stronger linkages with the local economy.
The results for FDI in specific sectors support the widely held belief that resource-seeking FDI in the primary sector is unlikely to be associated with significant growth effects (e.g., Chakraborty and Nunnenkamp (2008)). Most obviously, this is because FDI in India’s primary sector plays a marginal role in quantitative terms. In 1993-1998, FDI projects in the primary sector accounted for just four percent of all FDI projects. In addition, growth-promoting spillovers of FDI to local companies and workers tend to be relatively weak in the primary sector (UNCTAD (2001), p. 138).
Table 4. Structural Characteristics of FDI and Economic Growth: Correlation Results across Indian States
FDI characteristics Sub-category Per-capita income growth, 1999-2005 Source of FDI Germany 0.43**
Japan 0.51***
United Kingdom 0.50***
United States 0.42**
Non-resident Indians 0.55***
Sector Primary 0.01 Secondary 0.39**
Tertiary 0.48***
Foreign equity share Foreign minority 0.41**
Foreign majority 0.52***
Wholly foreign owned 0.44**
Note: *, **, and *** denote significance at the 10, 5 and 1 percent level, respectively. Sources: Unpublished database on FDI approvals, Reserve Bank of India (2006).
More interestingly, the correlation with growth is at least as strong for FDI in the
tertiary sector as it is for FDI in the secondary sector. FDI in Indian manufacturing was dominated by relatively (physical and human) capital intensive items such as transport equipment and chemicals, whereas labor intensive items such as textiles and leather
26 The pair-wise correlation between FDI from the four countries across Indian states in 1993-1998 ranges from 0.79 (Japan - United States) to 0.98 (Germany - United Kingdom). 27 For instance, the correlation between FDI from NRI and that from Germany amounts to just 0.56; the highest correlation is that with Japanese FDI (0.69).

FOREIGN DIRECT INVESTMENT IN POST-REFORM INDIA 75
goods rank far down the list of approved FDI provided by the Ministry of Commerce and Industry (2007). This pattern suggests that FDI hardly drew on India’s comparative advantage in labor intensive manufacturing industries, which may have prevented stronger growth-promoting spillovers in this sector (see Section 2). By contrast, Chakraborty and Nunnenkamp (2008) found FDI in Indian manufacturing to be superior to FDI in services in terms of growth effects. However, the panel cointegration approach of these authors does not cover the state level, which is the focus of the present paper. Across Indian states, the location choices of foreign investors were fairly similar for FDI in the secondary and tertiary sector.28
Finally, the correlation between FDI and growth is only weakly affected when FDI projects are differentiated according to the degree of foreign equity participation. All three sub-categories of FDI are significantly correlated with growth. It is thus difficult to decide whether the liberalization of foreign equity restrictions helped positive growth effects by improving the incentives to transfer up-to-date technologies, or whether spillovers to local joint venture partners were impaired in this way. Possibly, these two opposing effects canceled out each other. It fits into this reasoning that the correlation with growth is somewhat stronger for FDI projects with majority foreign equity shares: While the incentives for technology transfers tend to be stronger for this sub-category in comparison to projects with foreign minority shares, majority-owned projects may have offered better chances of spillovers than wholly foreign owned projects. However, the weaker correlation shown for wholly foreign owned projects may also result from the still minor importance of this sub-category of FDI projects during the period of observation.29
5.3. FDI, Initial Income and Growth We now return to the question whether positive growth effects of FDI may have
helped poorer Indian states to catch up economically with richer states. Several studies suggest that income discrepancies have widened in the post-reform period. For example, Sachs et al. (2002) find a tendency towards divergence across Indian states.30 Kochhar
28 The correlation between FDI in the secondary sector and FDI in the tertiary sector is 0.64. By contrast, FDI in the primary sector is only weakly correlated with FDI in other sectors (0.33 and 0.29 with FDI in the secondary and tertiary sector, respectively). 29 The share of wholly foreign owned projects in all projects (excluding projects for which the foreign equity share is unknown) increased considerably from 8 percent in 1993 to 35 percent in 1998. Nevertheless, projects with foreign minority shares were clearly dominant during the period 1993-1998; on average, they accounted for more than half of all FDI projects, compared to 29 and 19 percent for majority-owned and wholly foreign owned projects, respectively. 30 Chakravorty (2003) uses district data on industrial location and finds inter-regional divergence, but intra-regional convergence.

PETER NUNNENKAMP AND RUDI STRACKE 76
et al. (2006), Purfield (2006) as well as Veeramani and Goldar (2006) all refer to growing concerns that economic progress is leaving some states behind. Economic reforms have changed the nature of central government control of the economy in a way that increases the potential for greater disparities across states (Singh and Srinivasan (2004), p. 30). Likewise, Kochhar et al. (2006, p. 36) argue that state-level capabilities as well as state-level policies and institutions matter more since the 1990s, with the center no longer enforcing inter-state equity, divergences in growth rates between states increased.
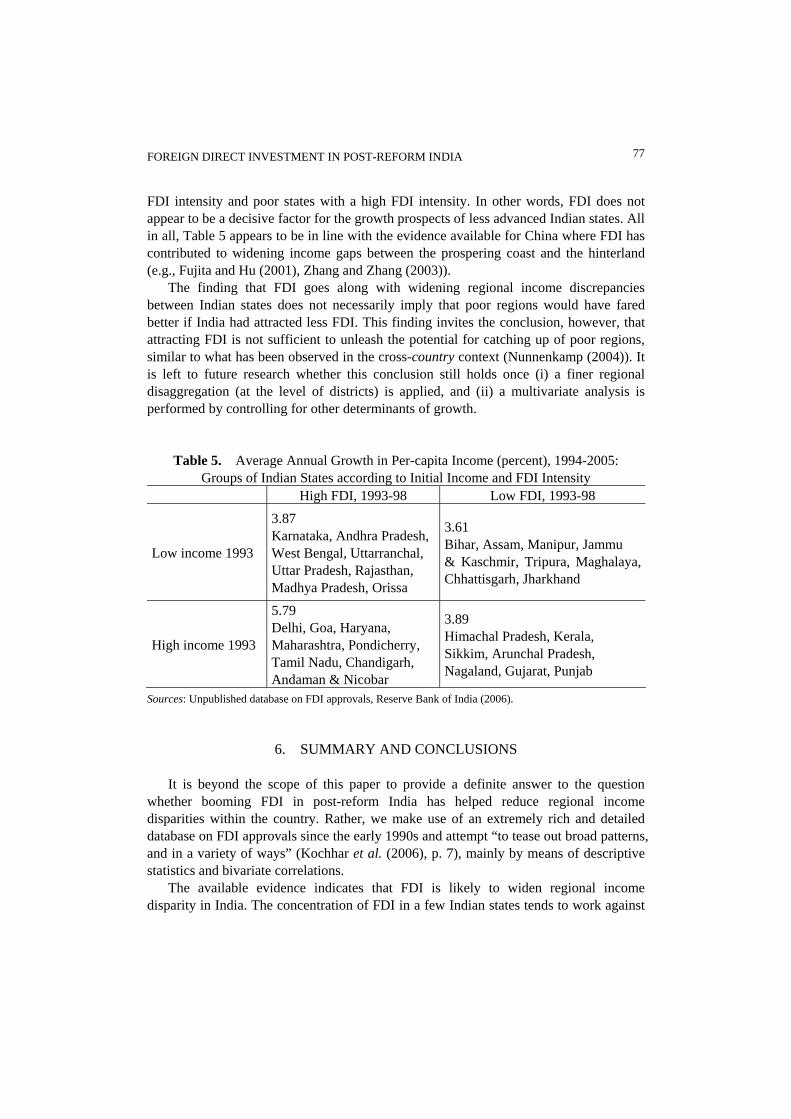
According to Purfield (2006), labor and capital flows have done little to close income gaps. Nevertheless, it remains open to debate whether FDI has contributed to divergence across Indian states, rather than helping convergence. In Section 4, we provided some indirect evidence pointing in the former direction by showing that FDI located primarily in richer states. In the following, we address this issue in a more direct way. First, we classify all Indian states (including Union Territories) into two groups of relatively rich and poor states, taking the median of average per-capita income in the initial year 1993 as the dividing line.31 Both groups are then further divided into two sub-groups of relatively high and low FDI intensity. The criterion applied is the number of FDI projects per head of the state’s population (relative to the national average) in 1993-1998. Hence, we end up with four sub-groups of eight states each.32 Second, we calculate the average annual growth rate of per-capita income in constant prices for each of the four sub-groups during the period 1994-2005 (Table 5).33
Catching up of relatively poor Indian states would obviously require that their average growth rate should have exceeded the average growth rate of the relatively rich states. This is not the case: While the difference in average growth rates between poor and rich states is marginal in the low FDI category, the substantially higher average growth rate of rich states in the high FDI category points to divergence rather than convergence.
More interestingly in the present context, it is only for relatively rich states that a higher FDI intensity is associated with a significantly higher growth rate. By contrast, the difference in growth rates remains marginal between relatively poor states with a low
31 Lakshadweep, Daman & Diu as well as Dadra & Nagar Haveli are not included because of missing data. 32 Table 5 lists only seven states in the sub-group with low FDI and high income. In addition, Mizoram belongs to this sub-group, but the data situation does not allow meaningful calculation of the annual average growth rate in this case. Nevertheless, the results reported in the table are hardly affected if Mizoram is included. 33 Due to incomplete data, growth rates for most recent years could not be calculated for several states. Therefore, we checked the robustness of the results reported in Table 5 by limiting the period for which annual average growth rates are calculated to 1994-2002. While growth rates turned out to be somewhat lower for all sub-groups, the differences in growth rates between sub-groups were hardly affected. Considering that we focus on differences here, the results for the shorter period are not presented.
FOREIGN DIRECT INVESTMENT IN POST-REFORM INDIA 77
FDI intensity and poor states with a high FDI intensity. In other words, FDI does not appear to be a decisive factor for the growth prospects of less advanced Indian states. All in all, Table 5 appears to be in line with the evidence available for China where FDI has contributed to widening income gaps between the prospering coast and the hinterland (e.g., Fujita and Hu (2001), Zhang and Zhang (2003)).
The finding that FDI goes along with widening regional income discrepancies between Indian states does not necessarily imply that poor regions would have fared better if India had attracted less FDI. This finding invites the conclusion, however, that attracting FDI is not sufficient to unleash the potential for catching up of poor regions, similar to what has been observed in the cross-country context (Nunnenkamp (2004)). It is left to future research whether this conclusion still holds once (i) a finer regional disaggregation (at the level of districts) is applied, and (ii) a multivariate analysis is performed by controlling for other determinants of growth.
Table 5. Average Annual Growth in Per-capita Income (percent), 1994-2005:
Groups of Indian States according to Initial Income and FDI Intensity
High FDI, 1993-98 Low FDI, 1993-98
Low income 1993
3.87 Karnataka, Andhra Pradesh,West Bengal, Uttarranchal, Uttar Pradesh, Rajasthan, Madhya Pradesh, Orissa
3.61 Bihar, Assam, Manipur, Jammu & Kaschmir, Tripura, Maghalaya, Chhattisgarh, Jharkhand
High income 1993
5.79 Delhi, Goa, Haryana, Maharashtra, Pondicherry, Tamil Nadu, Chandigarh, Andaman & Nicobar
3.89 Himachal Pradesh, Kerala, Sikkim, Arunchal Pradesh, Nagaland, Gujarat, Punjab
Sources: Unpublished database on FDI approvals, Reserve Bank of India (2006).
6. SUMMARY AND CONCLUSIONS It is beyond the scope of this paper to provide a definite answer to the question
whether booming FDI in post-reform India has helped reduce regional income disparities within the country. Rather, we make use of an extremely rich and detailed database on FDI approvals since the early 1990s and attempt “to tease out broad patterns, and in a variety of ways” (Kochhar et al. (2006), p. 7), mainly by means of descriptive statistics and bivariate correlations.
The available evidence indicates that FDI is likely to widen regional income disparity in India. The concentration of FDI in a few Indian states tends to work against

PETER NUNNENKAMP AND RUDI STRACKE 78
favorable FDI effects spreading across the Indian economy. The regional dissemination of FDI-induced growth is further impaired by the increasing concentration of FDI at the state level since the early 1990s. FDI is heavily concentrated even within Indian states: Typically, the three most attractive districts account for more than two thirds of all FDI projects located in the state as a whole. Furthermore, the regression analysis of possible determinants of FDI reveals that it is fairly difficult for less developed states to induce economic catching-up processes by drawing on FDI. Foreign investors strongly prefer locations in India that are relatively advanced in terms of per-capita income and (transport) infrastructure.
In some contrast to earlier studies, we find FDI to be positively correlated with per-capita income growth across Indian states, and negatively correlated with the share of people with incomes below the poverty line. This finding holds for different specifications of the FDI variable as well as for different sub-categories of FDI, including sector-specific FDI. This may indicate that the link between FDI and growth has become stronger in the aftermath of economic reforms so that earlier, much more skeptical assessments may no longer apply.
Nevertheless, FDI is unlikely to work wonders for India’s regional development. It is only for relatively rich states that a higher FDI intensity is associated with a significantly higher growth rate in the post-reform era. By contrast, FDI does not appear to be a decisive factor for the growth prospects of less advanced states.
All in all, it appears to be unreasonable to expect that booming FDI in India will lead to regional convergence. Our empirical findings fit well into the theoretical reasoning of Aghion et al. (2006). The Schumpeterian growth model presented by Aghion et al. suggests that local conditions are essential for the effects of FDI in host countries like India. In particular, FDI tends to leave growth unaffected in poor regions where local companies operate far off the technological frontier. Under such conditions, FDI-induced spillovers are impaired by lacking incentives of local companies to innovate, as well as their weak capacity to absorb superior foreign technology. Similarly, Blomström and Kokko (1998) as well as Blomström et al. (2001) conclude from reviews of the literature that spillovers depend on the absorptive capacity of local firms, with small gaps encouraging spillovers and large gaps inhibiting them. Findlay (1978, p. 2) argued in the late 1970s already that economic backwardness encourages technology transfers provided that the technology gap “must not be too wide.”
At the same time, the tentative findings presented above suggest several directions for future empirical research on the effects of FDI on economic growth and poverty alleviation in India. First of all, the data on the regional distribution of FDI need to be complemented with similarly disaggregated data on control variables that might be relevant in the context of economic growth and regional development. Second, the state-level analysis in the present paper may be refined by a more detailed regional disaggregation. The above noted concentration of FDI within individual states provides first hints that regional development may diverge even at the level of districts. Yet, it remains open to question whether the dissemination of FDI effects is more pronounced

FOREIGN DIRECT INVESTMENT IN POST-REFORM INDIA 79
at the district level than at the level of Indian states, the population of many of which by far exceeds the population of various countries. Finally, it would be desirable to account for additional aspects of the heterogeneity of FDI in India. For instance, it is widely believed that greenfield FDI generates stronger investment and growth effects than mergers and acquisitions (M&As), which, at least in the first round, amount to little more than a change in ownership and do not add to overall investment. Pursuing all these research directions meets with considerable data constraints, however.
Appendix. Major State Characteristics a
States PCIb Population(mill.)
Density of populationc
Literacy rate (%) Educationd Roadse Electricityf
Financial develop-
mentg
Andaman & Nicobar Islands 22262 0.3 42 83 11.6 14 - 8.13 Andhra Pradesh 15049 74.9 272 54 7.0 65 83.5 4.18 Arunchal Pradesh 13669 1.1 13 55 8.2 22 - 4.07 Assam 10080 26.0 332 71 9.9 109 23.9 2.41 Bihar 4794 79.1 840 46 6.0 51 25.1 3.44 Chandigarh 42942 0.8 5868 82 11.8 1604 - 53.30 Chhattisgarh 10405 20.4 151 - - - - - Delhi 37065 13.0 8754 - 17.0 1862 47.5 45.93 Goa 44349 1.3 354 84 11.3 264 - 38.61 Gujarat 18831 48.7 249 69 8.3 48 148.2 7.85 Haryana 21105 20.2 457 65 9.0 65 88.1 6.60 Himachal Pradesh 18160 5.9 106 75 12.1 53 50.8 8.39 Jammu & Kashmir 12373 9.7 43 66 7.1 11 42.3 2.85 Jharkhand 7238 26.0 327 - - - - - Karnataka 16345 51.4 268 63 10.2 79 84.9 5.54 Kerala 18117 31.5 810 91 10.7 382 67.7 7.23 Madhya Pradesh 11764 58.4 190 56 10.2 46 74.5 4.07 Maharashtra 22975 93.8 305 74 10.7 124 132.3 9.71 Manipur 11059 2.3 102 73 9.8 51 5.7 1.43 Meghalaya 13088 2.2 100 78 7.1 41 85.4 4.95 Mizoram 14909 0.9 41 94 10.3 23 - 3.35 Nagaland 12594 1.8 110 86 6.0 123 3.3 3.25 Orissa 9486 36.0 231 57 7.5 169 55.6 2.46 Pondicherry 29383 1.0 1945 81 12.6 511 - 10.79

PETER NUNNENKAMP AND RUDI STRACKE 80
Punjab 22745 23.6 468 68 8.5 128 166.7 13.35 Rajasthan 12765 54.1 158 53 8.6 41 46.0 3.07 Sikkim 14761 0.5 72 75 8.0 26 74.5 7.75 Tamil Nadu 18337 61.2 471 71 9.8 118 98.9 5.60 Tripura 13195 3.2 302 78 8.6 148 26.8 2.49 Uttaranchal 11443 8.2 154 - - - - - Uttar Pradesh 8970 159.8 663 55 5.9 97 35.1 3.85 West Bengal 14817 78.6 886 - 6.6 89 55.5 5.38
Notes: a FDI determinants at the state level used in the regressions reported in Table 2, all figures refer to 1999/2000. Not listed due to data constraints; Dadra & Haveli, Daman & Diu, and Lakshadweep. b Per-capita income in Rs., based on net state domestic product at factor cost. c Number per square km. d Student enrolment in % of population at all levels higher than primary schooling. e Km per 100 square km of state area. f kW per 1000 inhabitants. g Bank deposits, 1000 Rs. per capita. Sources: Observer Research Foundation (var. iss.), Central Statistical Organisation (var. iss.).
REFERENCES
ADB (2004), “Part 3: Foreign Direct Investment in Developing Asia,” Asian Development Outlook 2004, Asian Development Bank, Manila.
Agarwal, D.R. (2001), “Foreign Direct Investment and Economic Development: A Comparative Case Study of China, Mexico and India,” in R.K. Sen ed., Socio-Economic Development in the 21st Century, New Delhi, 257-288.
Aggarwal, A. (2005), “The Influence of Labour Markets on FDI: Some Empirical Explorations in Export Oriented and Domestic Market Seeking FDI Across Indian States,” University of Delhi, http://knowledgeforum.tifac.org.in/IndexServer/tifac. article/22.doc.
Aghion, P., R. Burgess, S.J. Redding, and F. Zilibotti (2006), “The Unequal Effects of Liberalization: Evidence from Dismantling the License Raj in India,” Discussion Paper, 5492, Centre for Economic Policy Research, London.
Agrawal, P. (2005), “Foreign Direct Investment in South Asia: Impact on Economic Growth and Local Investment,” in E.M. Graham ed., Multinationals and Foreign Investment in Economic Development, Basingstoke (Palgrave Macmillan), 94-118.
Aroca, P., and W.F. Maloney (2005), “Migration, Trade, and Foreign Direct Investment in Mexico,” World Bank Economic Review, 19(3), 449-472.
Athreye, S., and S. Kapur (2001), “Private Foreign Investment in India: Pain or Panacea?” The World Economy, 24(3), 399-424.
Bajpai, N., and J.D. Sachs (2000), “Foreign Direct Investment in India: Issues and Problems,” Development Discussion Paper, 759, Harvard Institute for International Development, Harvard University, Cambridge, MA.

FOREIGN DIRECT INVESTMENT IN POST-REFORM INDIA 81
Balasubramanyam, V.N., and V. Mahambare (2003), “FDI in India,” Transnational Corporations, 12(2), 45-72.
Banga, R. (2003), “The Differential Impact of Japanese and U.S. Foreign Direct Investments on Exports of Indian Manufacturing. Indian Council for Research on International Economic Relations,” New Delhi, http://econpapers.repec.org/RAS/ pba255.htm.
Basu, P. (2005), “India’s Investment Climate: What Do the Data Tell Us about State-level Performance?” The World Bank, Washington, D.C., http://siteresources. worldbank.org/INTINDIA/Resources/PriyaBasu_DBIC_presentation.pdf.
Bhat, K.S., T.C.U. Sundari, and K.D. Raj (2004), “Causal Nexus between Foreign Direct Investment and Economic Growth in India,” Indian Journal of Economics, 85(337), 171-185.
Blomström, M., and A. Kokko (1998), “Multinational Corporations and Spillovers,” Journal of Economic Surveys, 12(3), 247-277.
Blomström, M., A. Kokko, and S. Globerman (2001), “The Determinants of Host Country Spillovers from Foreign Direct Investment: A Review and Synthesis of the Literature,” in N. Pain ed., Inward Investment, Technological Change, and Growth, Basingstoke, 34-65.
Blonigen, B.A., and M.G. Wang (2005), “Inappropriate Pooling of Wealthy and Poor Countries in Empirical FDI Studies,” in T. Moran et al. eds., Does Foreign Direct Investment Promote Development? Institute for International Economics, Washington, D.C.
Cashin, P., and R. Sahay (1996), “Internal Migration, Center-State Grants, and Economic Growth in the States of India,” IMF Staff Papers, 43(1), 123-171.
Caves, R.E. (1996), Multinational Enterprise and Economic Analysis, 2nd edition, Cambridge: Cambridge University Press.
Central Statistical Organisation (CSO) (various issues), Statistical Pocket Book, India, New Delhi.
Chakrabarti, A. (2001), “The Determinants of Foreign Direct Investment: Sensitivity Analyses,” Kyklos, 54(1), 89-113.
Chakraborty, C., and P. Basu (2002), “Foreign Direct Investment and Growth in India: A Cointegration Approach,” Applied Economics, 34(9), 1061-1073.
Chakraborty, C., and P. Nunnenkamp (2008), “Economic Reforms, FDI and Economic Growth in India: A Sector Level Analysis,” World Development, 36(7), 1192-1212.
Chakravorty, S. (2003), “Industrial Location in Post-Reform India: Patterns of Inter-regional Divergence and Intra-regional Convergence,” Journal of Development Studies, 40(2), 120-152.
Dev, S., and C. Ravi (2007), “Poverty and Inequality: All-India and States, 1983-2005,” Economic and Political Weekly, February 10, 509-521.
Dua, P., and A.I. Rashid (1998), “FDI and Economic Activity in India,” Indian Economic Review, 33(2), 153-168.

PETER NUNNENKAMP AND RUDI STRACKE 82
Findlay, R. (1978), “Relative Backwardness, Direct Foreign Investment, and the Transfer of Technology: A Simple Dynamic Model,” Quarterly Journal of Economics, 92(1), 1-16.
Fischer, S. (2002), “Breaking Out of the Third World: India’s Economic Imperative,” http://www.imf.org/external/np/speeches/2002/012202.htm.
Fujita, M., and D. Hu (2001), “Regional Disparity in China 1985-1994: The Effects of Globalization and Economic Liberalization,” Annals of Regional Science, 35, 3-37.
Görg, H., and D. Greenaway (2004), “Much Ado about Nothing? Do Domestic Firms Really Benefit from Foreign Direct Investment?” World Bank Research Observer, 19(2), 171-197.
Gupta, S. (2005), “Multinationals and Foreign Direct Investment in India and China,” in E.M. Graham ed., Multinationals and Foreign Investment in Economic Development, Palgrave Macmillan, Basingstoke, 198-211.
Harzing, A-W., and A. Sorge (2003), “The Relative Impact of Country of Origin and Universal Contingencies on Internationalization Strategies and Corporate Control in Multinational Enterprises: Worldwide and European Perspectives,” Organization Studies, 24(2), 187-214.
Herzer, D., S. Klasen, and F. Nowak-Lehmann (2006), “In Search of FDI-led Growth in Developing Countries,” University of Goettingen, Goettingen, http://ideas.repec.org/ p/got/iaidps/150.html.
Kochhar, K., U. Kumar, R. Rajan, A. Subramanian, and I. Tokatlidis (2006), “India’s Pattern of Development: What Happened, What Follows?” IMF Working Paper, WP/06/22, International Monetary Fund, Washington, D.C.
Kojima, K. (1978), Japanese Foreign Direct Investment, Tuttle Publishing, Tokyo. Kumar, N. (2000), “Explaining the Geography and Depth of International Production:
The Case of US and Japanese Multinational Enterprises,” Review of World Economics, 136(3), 442-477.
_____ (2003), “Liberalization, Foreign Direct Investment Flows and Economic Development: The Indian Experience in the 1990s,” RIS Discussion Paper, 65, Research and Information System for the Non-Aligned and Other Developing Countries, New Delhi.
Kumar, N., and A. Aggarwal (2005), “Liberalization, Outward Orientation and In-house R&D Activity of Multinational and Local Firms: A Quantitative Exploration for Indian Manufacturing,” Research Policy, 34(4), 441-460.
Kumar, N., and J.P. Pradhan (2005), “Foreign Direct Investment, Externalities and Economic Growth in Developing Countries: Some Empirical Explorations,” in E.M. Graham ed., Multinationals and Foreign Investment in Economic Development, Palgrave Macmillan, Basingstoke, 42-84.
Lipsey, R.E. (2002), “Home and Host Country Effects of FDI,” NBER Working Paper, 9293, National Bureau of Economic Research,. Cambridge, MA.
FOREIGN DIRECT INVESTMENT IN POST-REFORM INDIA 83
Mahendra Dev, S., and R.E. Evenson (2003), “Rural Development in India: Rural, Non-Farm, and Migration,” Working Paper, 187, Stanford Center for International Development, Stanford, CA.
Mayer-Foulkes, D., and P. Nunnenkamp (2005), “Do Multinational Enterprises Contribute to Convergence or Divergence? A Disaggregated Analysis of US FDI,” Working Paper, 1242, (revised version forthcoming in Review of Development Economics), Kiel Institute for the World Economy.
Ministry of Commerce and Industry, Department of Industrial Policy & Promotion (2007), Fact Sheet on Foreign Direct Investment, January 2007, New Delhi, http:// dipp.gov.in/fdi_statistics/india_fdi_jan_2007.pdf.
Nunnenkamp, Peter (2004), “To What Extent Can Foreign Direct Investment Help Achieve International Development Goals?” The World Economy, 27(5), 657-677.
Observer Research Foundation (various issues), India: Observer Statistical Handbook, New Delhi.
Panagariya, A. (2005), “The Triumph of India’s Market Reforms: The Record of the 1980s and 1990s,” Policy Analysis, 554, CATO Institute.
Pradhan, J.P. (2002), “Foreign Direct Investment and Economic Growth in India: A Production Function Analysis,” Indian Journal of Economics, 82(327), 582-586.
Purfield, C. (2006), “Mind the Gap - Is Economic Growth in India Leaving Some States Behind?” IMF Working Paper, WP/06/13, International Monetary Fund, Washington, D.C.
Reserve Bank of India (2006), Handbook of Statistics on the Indian Economy, http:// www.rbi.org.in/scripts/AnnualPublications.aspx?head=Handbook%20of%20Statistics%20on%20Indian%20Economy.
Sachs, J.D., N. Bajpai, and A. Ramiah (2002), “Understanding Regional Economic Growth in India.,” Asian Economic Papers, 1(3), 32-62.
Sahoo, D., and M.K. Mathiyazhagan (2002), “Economic Growth in India: Does Foreign Direct Investment Inflow Matter?” Working Paper, 115, Institute for Social and Economic Change, Bangalore.
_____ (2003), “Economic Growth in India: Does Foreign Direct Investment Inflow Matter?” Singapore Economic Review, 48(2), 151-171.
Singh, K. (2005), “Foreign Direct Investment in India: A Critical Analysis of FDI from 1991-2005,” Centre for Civil Society, New Delhi, http://papers.ssrn.com/sol3/papers. cfm?abstract_id=822584.
Singh, N., and T.N. Srinivasan (2004), “Indian Federalism, Economic Reform and Globalization,” University of California Santa Cruz and Yale University, mimeo, http://ideas.repec.org/p/wpa/wuwppe/0412007.html.
UN (2002), Final Outcome of the International Conference on Financing for Development, United Nations, New York.
UNCTAD (2001), World Investment Report 2001, United Nations, New York. _____ (2007), World Investment Report 2007, United Nations, New York.

PETER NUNNENKAMP AND RUDI STRACKE 84
Veeramani, C., and B. Goldar (2006), “Manufacturing Productivity in Indian States: Does Investment Climate Matter?” Indian Council for Research on International Economic Relations (ICRIER), New Delhi, http://www.gdnet.org/pdf2/gdn_library/ annual_conferences/seventh_annual_conference/Veeramani_Parallel_1_2.pdf.
World Bank (2004), India: Investment Climate Assessment 2004, Improving Manufacturing Competitiveness. Washington, D.C.
Zhang, X., and K.H. Zhang (2003), “How Does Globalisation Affect Regional Inequality Within a Developing Country? Evidence from China,” Journal of Development Studies, 39(4), 47-67.
Mailing Address: Peter Nunnenkamp, Kiel Institute for the World Economy, D-24100 Kiel,Germany. Tel: 49-431-8814-209. E-mail: [email protected]
Manuscript received August 2007; final revision received July 2008.