
Local Spillovers from Foreign Direct Investment in the Ethiopian Manufacturing Sector

OECD Journal: Economic Studies
Volume 2014
© OECD 2015
129
Foreign direct investmentand reverse technology spillovers:
The effect on total factor productivity
byEdmund Amann and Swati Virmani*
The paper analyses the “feedback effect” of Foreign Direct Investment (FDI) on TotalFactor Productivity (TFP) growth in emerging economies via technology spilloversacross borders. We study the effect of R–D spillovers resulting from outwardFDI flows from 18 emerging economies into 34 OECD countries over the1990-2010 period, comparing the impact with that of spillovers resulting frominward FDI flows. The result confirms that FDI enhances productivity growth;however the impact is much larger when R-D-intensive developed countries investin the emerging economies than the other way round. Country-specific bilateralelasticities also support this outcome.
JEL classification: F21, F43, F62, O47.
Keywords: Outward FDI, Inward FDI, Reverse technology spillovers, Total factorproductivity.
* The authors are Reader in Development Economics and Head of Economics (Teaching andOperations); and PhD Student, Economics, School of Social Sciences, respectively, at the Universityof Manchester, UK. They would like to thank Bruno Van Pottelsberghe de la Potterie and GiuseppeNicoletti for comments on a previous version. The opinions expressed and arguments employed inthis paper are the responsibility of the authors and do not necessarily reflect the official views of theOECD or of the governments of its member and partner countries.Email: [email protected]; [email protected].

FOREIGN DIRECT INVESTMENT AND REVERSE TECHNOLOGY SPILLOVERS: THE EFFECT ON TOTAL FACTOR PRODUCTIVITY
OECD JOURNAL: ECONOMIC STUDIES - VOLUME 2014 © OECD 2015130
1. IntroductionThe term “knowledge spillover” refers to the process by which one inventor learns
from the research outcomes of others’ projects and is able to enhance their own research
productivity without fully compensating the other inventors for the value of such learning
(Branstetter, 2006). True knowledge spillovers have the potential to allow for further
innovation. In pursuit of such spillovers, it is possible that firms may take investment
decisions so as to learn from other firms’ research activities. This is especially true for a
developing and emerging country undertaking Outward Foreign Direct Investment (OFDI)
in R-D intensive developed countries. While the advanced country firms, such as those of
Japan and Korea, have set up their own technological profiles and brands over long periods
of time, newly emerging nations often tend to leapfrog by acquiring a well-established
corporation, or setting up R-D centres in areas of excellence.
The literature identifies two waves of outward investment: the first during the 1960s
and 1970s, and the second from 1980 onwards (UNCTAD, 2007). In the second wave, a
diversified pattern of investment was emerging, with an increasing participation of
developing nations undertaking OFDI in developed nations. The aim here was to attain
strategic assets and markets, acquiring brands, and accessing technologies. Such an OFDI
played a mediating role in the “knowledge spillover”, that was traditionally unidirectional,
taking place from an innovation-driven developed nation investing in a developing
country. In other words, outward investment from a less capital intensive developing
nation was now acting as a channel for transferring technology. Dunning recognises this
second wave of OFDI as resulting from liberalisation of markets, globalisation of economic
activity and dramatic technological advancement within sectors; factors that have affected
the structure of the world economy. He also postulates that during this period the
countries that came out in front were those that had moved along the Investment
Development Path (IDP),1 and experienced rapid economic growth and restructuring
(UNCTAD, 2005b).
In the case of India, for example, the second wave began in the 1990s when enterprises
were mostly using Mergers and Acquisitions (M&A) to venture abroad in order to access
technology. The lion’s share of such investment was in developed countries, dominated by
the United States (24%) and the United Kingdom (27%) (UNCTAD, 2007). Indian companies
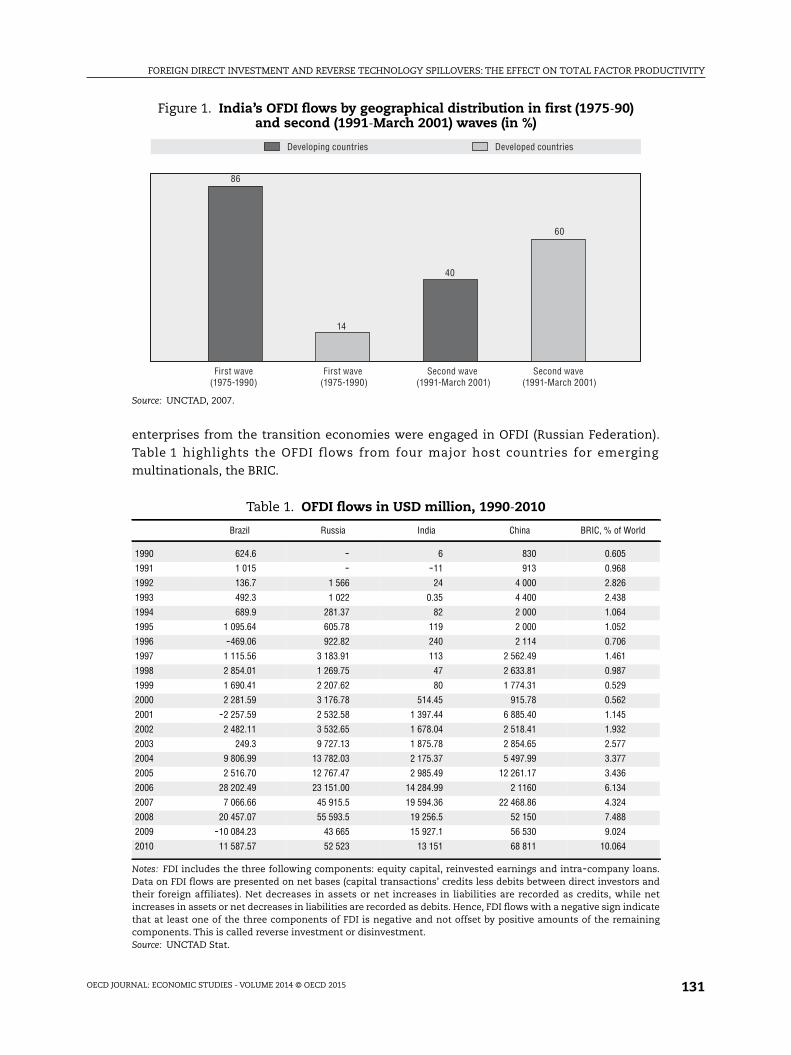
such as Infosys, Aditya Birla and HCL Technologies invested in the United States. Figure 1
shows the diversity between the first and second phase of India’s investment in terms of
the geographical distribution.
Overall, during this period, OFDI from emerging economies rose from USD 149 billion
in 1990 to USD 1.4 trillion in 2005, accounting for 13% of world OFDI stock in 2005
(UNCTAD, 2007). More economies became global players, and among the strongest were
from Asia. Enterprises from East Asia (China), South-East Asia (Malaysia, Thailand and
Singapore), and South Asia (India) were the most active. Following them were the
developing regions of Latin America and the Caribbean (Brazil and Argentina). Also,
FOREIGN DIRECT INVESTMENT AND REVERSE TECHNOLOGY SPILLOVERS: THE EFFECT ON TOTAL FACTOR PRODUCTIVITY
OECD JOURNAL: ECONOMIC STUDIES - VOLUME 2014 © OECD 2015 131
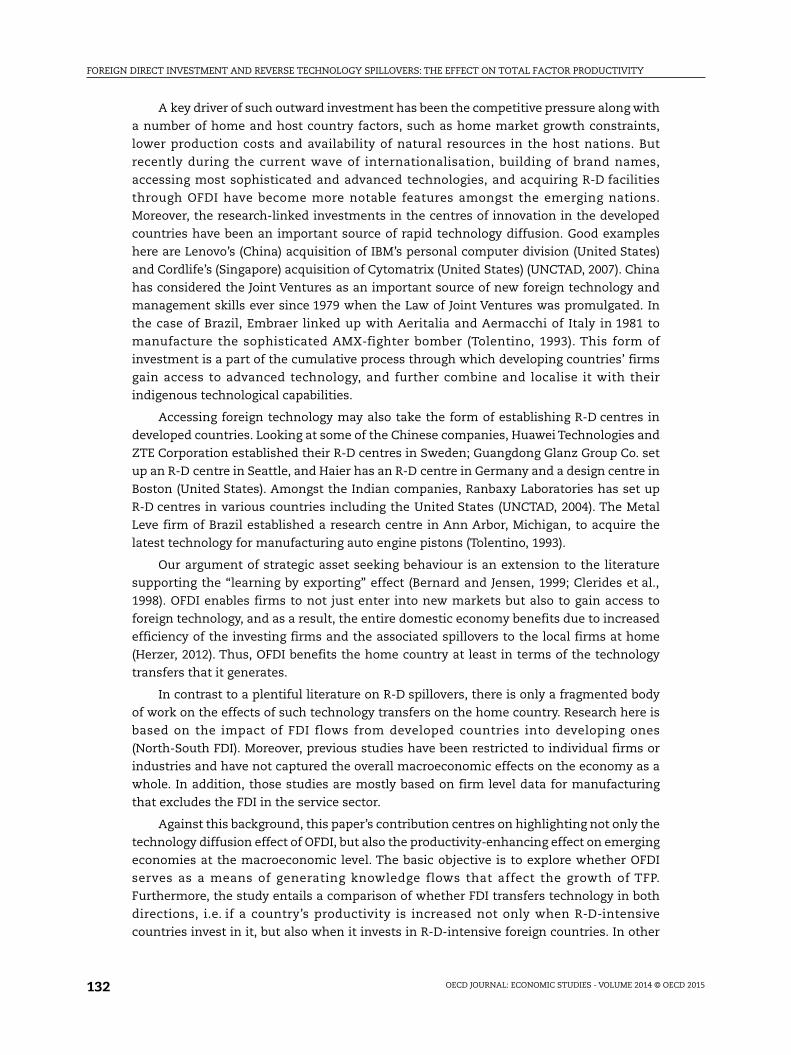
enterprises from the transition economies were engaged in OFDI (Russian Federation).
Table 1 highlights the OFDI flows from four major host countries for emerging
multinationals, the BRIC.
Figure 1. India’s OFDI flows by geographical distribution in first (1975-90)and second (1991-March 2001) waves (in %)
Source: UNCTAD, 2007.
Table 1. OFDI flows in USD million, 1990-2010
Brazil Russia India China BRIC, % of World
1990 624.6 - 6 830 0.605
1991 1 015 - -11 913 0.968
1992 136.7 1 566 24 4 000 2.826
1993 492.3 1 022 0.35 4 400 2.438
1994 689.9 281.37 82 2 000 1.064
1995 1 095.64 605.78 119 2 000 1.052
1996 -469.06 922.82 240 2 114 0.706
1997 1 115.56 3 183.91 113 2 562.49 1.461
1998 2 854.01 1 269.75 47 2 633.81 0.987
1999 1 690.41 2 207.62 80 1 774.31 0.529
2000 2 281.59 3 176.78 514.45 915.78 0.562
2001 -2 257.59 2 532.58 1 397.44 6 885.40 1.145
2002 2 482.11 3 532.65 1 678.04 2 518.41 1.932
2003 249.3 9 727.13 1 875.78 2 854.65 2.577
2004 9 806.99 13 782.03 2 175.37 5 497.99 3.377
2005 2 516.70 12 767.47 2 985.49 12 261.17 3.436
2006 28 202.49 23 151.00 14 284.99 2 1160 6.134
2007 7 066.66 45 915.5 19 594.36 22 468.86 4.324
2008 20 457.07 55 593.5 19 256.5 52 150 7.488
2009 -10 084.23 43 665 15 927.1 56 530 9.024
2010 11 587.57 52 523 13 151 68 811 10.064
Notes: FDI includes the three following components: equity capital, reinvested earnings and intra-company loans.Data on FDI flows are presented on net bases (capital transactions’ credits less debits between direct investors andtheir foreign affiliates). Net decreases in assets or net increases in liabilities are recorded as credits, while netincreases in assets or net decreases in liabilities are recorded as debits. Hence, FDI flows with a negative sign indicatethat at least one of the three components of FDI is negative and not offset by positive amounts of the remainingcomponents. This is called reverse investment or disinvestment.Source: UNCTAD Stat.
Developing countries Developed countries
First wave (1975-1990)
First wave(1975-1990)
86
14
Second wave (1991-March 2001)
40
Second wave (1991-March 2001)
60
FOREIGN DIRECT INVESTMENT AND REVERSE TECHNOLOGY SPILLOVERS: THE EFFECT ON TOTAL FACTOR PRODUCTIVITY
OECD JOURNAL: ECONOMIC STUDIES - VOLUME 2014 © OECD 2015132
A key driver of such outward investment has been the competitive pressure along with
a number of home and host country factors, such as home market growth constraints,
lower production costs and availability of natural resources in the host nations. But
recently during the current wave of internationalisation, building of brand names,
accessing most sophisticated and advanced technologies, and acquiring R-D facilities
through OFDI have become more notable features amongst the emerging nations.
Moreover, the research-linked investments in the centres of innovation in the developed
countries have been an important source of rapid technology diffusion. Good examples
here are Lenovo’s (China) acquisition of IBM’s personal computer division (United States)
and Cordlife’s (Singapore) acquisition of Cytomatrix (United States) (UNCTAD, 2007). China
has considered the Joint Ventures as an important source of new foreign technology and
management skills ever since 1979 when the Law of Joint Ventures was promulgated. In
the case of Brazil, Embraer linked up with Aeritalia and Aermacchi of Italy in 1981 to
manufacture the sophisticated AMX-fighter bomber (Tolentino, 1993). This form of
investment is a part of the cumulative process through which developing countries’ firms
gain access to advanced technology, and further combine and localise it with their
indigenous technological capabilities.
Accessing foreign technology may also take the form of establishing R-D centres in
developed countries. Looking at some of the Chinese companies, Huawei Technologies and
ZTE Corporation established their R-D centres in Sweden; Guangdong Glanz Group Co. set
up an R-D centre in Seattle, and Haier has an R-D centre in Germany and a design centre in
Boston (United States). Amongst the Indian companies, Ranbaxy Laboratories has set up
R-D centres in various countries including the United States (UNCTAD, 2004). The Metal
Leve firm of Brazil established a research centre in Ann Arbor, Michigan, to acquire the
latest technology for manufacturing auto engine pistons (Tolentino, 1993).
Our argument of strategic asset seeking behaviour is an extension to the literature
supporting the “learning by exporting” effect (Bernard and Jensen, 1999; Clerides et al.,
1998). OFDI enables firms to not just enter into new markets but also to gain access to
foreign technology, and as a result, the entire domestic economy benefits due to increased
efficiency of the investing firms and the associated spillovers to the local firms at home
(Herzer, 2012). Thus, OFDI benefits the home country at least in terms of the technology
transfers that it generates.
In contrast to a plentiful literature on R-D spillovers, there is only a fragmented body
of work on the effects of such technology transfers on the home country. Research here is
based on the impact of FDI flows from developed countries into developing ones
(North-South FDI). Moreover, previous studies have been restricted to individual firms or
industries and have not captured the overall macroeconomic effects on the economy as a
whole. In addition, those studies are mostly based on firm level data for manufacturing
that excludes the FDI in the service sector.
Against this background, this paper’s contribution centres on highlighting not only the
technology diffusion effect of OFDI, but also the productivity-enhancing effect on emerging
economies at the macroeconomic level. The basic objective is to explore whether OFDI
serves as a means of generating knowledge flows that affect the growth of TFP.
Furthermore, the study entails a comparison of whether FDI transfers technology in both
directions, i.e. if a country’s productivity is increased not only when R-D-intensive
countries invest in it, but also when it invests in R-D-intensive foreign countries. In other
FOREIGN DIRECT INVESTMENT AND REVERSE TECHNOLOGY SPILLOVERS: THE EFFECT ON TOTAL FACTOR PRODUCTIVITY
OECD JOURNAL: ECONOMIC STUDIES - VOLUME 2014 © OECD 2015 133
words, the paper tries to distinguish between the impact of R-D spillovers resulting from
North-South and South-North FDI flows.2
The analysis involves looking at the OFDI flows from 18 emerging economies into
34 OECD countries over the 1990-2010 period and Inward FDI (IFDI) flows into those
18 emerging economies from the OECD nations. We apply the methodology suggested by
Van Pottelsberghe de la Potterie and Lichtenberg (2001). However, unlike their study
– which looks at FDI flows between 13 industrialised countries (i.e. North-North FDI only) –
our paper contributes more extensively by studying both South-North and North-South FDI
flows. We also extend the analysis by including catalytic factors that affect TFP, such as
human capital, in order to get better estimates of output elasticity of foreign R-D spillovers.
According to the UNESCO (1993) Statistical Year Book, R-D-expenditures in OECD member
countries amounted to 96% of the entire R-D world expenditures in 1990, thus justifying
the choice of OECD nations as the investing partners for our analysis.
The paper is structured as follows: Section 2 describes how FDI is linked to technology
spillovers. It also discusses the mechanisms that drive the spillovers. Section 3 then
provides an overview of the “feedback effect”, i.e. the impact on TFP growth. Section 4
highlights the methodology and data, Section 5 outlines the results, and finally, Section 6
concludes the study with policy implications.
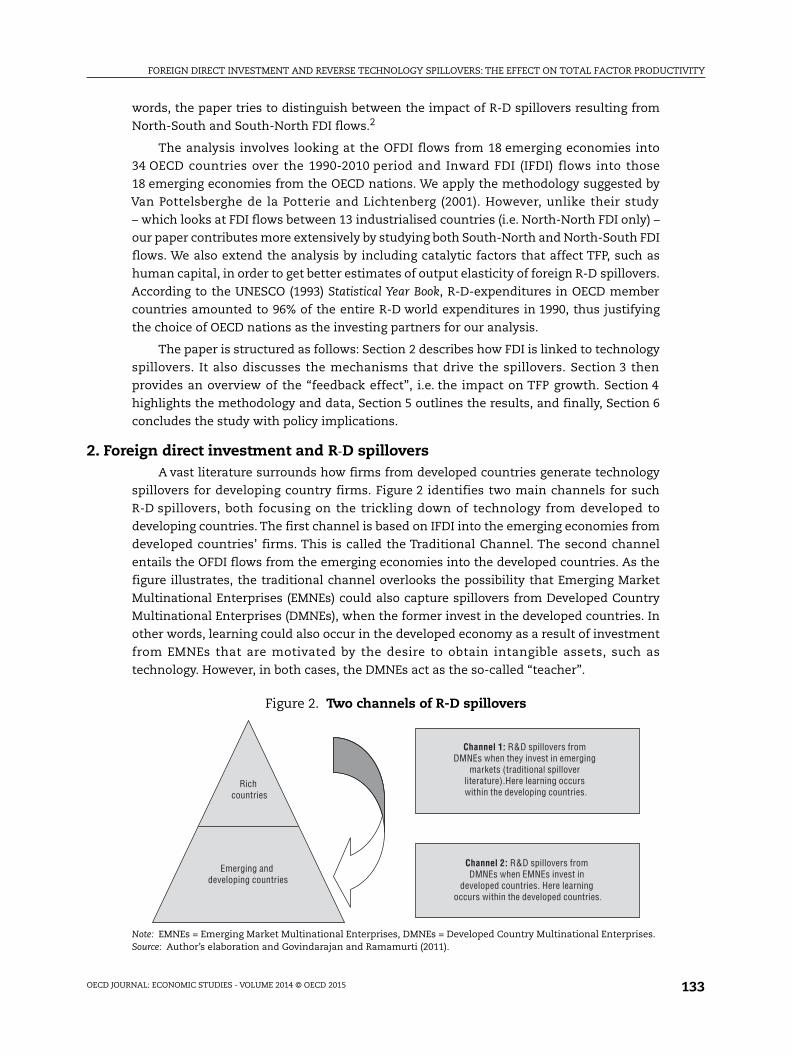
2. Foreign direct investment and R-D spilloversA vast literature surrounds how firms from developed countries generate technology
spillovers for developing country firms. Figure 2 identifies two main channels for such
R-D spillovers, both focusing on the trickling down of technology from developed to
developing countries. The first channel is based on IFDI into the emerging economies from
developed countries’ firms. This is called the Traditional Channel. The second channel
entails the OFDI flows from the emerging economies into the developed countries. As the
figure illustrates, the traditional channel overlooks the possibility that Emerging Market
Multinational Enterprises (EMNEs) could also capture spillovers from Developed Country
Multinational Enterprises (DMNEs), when the former invest in the developed countries. In
other words, learning could also occur in the developed economy as a result of investment
from EMNEs that are motivated by the desire to obtain intangible assets, such as
technology. However, in both cases, the DMNEs act as the so-called “teacher”.
Figure 2. Two channels of R-D spillovers
Note: EMNEs = Emerging Market Multinational Enterprises, DMNEs = Developed Country Multinational Enterprises.Source: Author’s elaboration and Govindarajan and Ramamurti (2011).
Emerging and developing countries
Rich countries
Channel 1: R&D spillovers from DMNEs when they invest in emerging
markets (traditional spillover literature).Here learning occurs within the developing countries.
Channel 2: R&D spillovers from DMNEs when EMNEs invest in
developed countries. Here learning occurs within the developed countries.
FOREIGN DIRECT INVESTMENT AND REVERSE TECHNOLOGY SPILLOVERS: THE EFFECT ON TOTAL FACTOR PRODUCTIVITY
OECD JOURNAL: ECONOMIC STUDIES - VOLUME 2014 © OECD 2015134
This new spillover channel is based on the recent identification of the investing
country learning from local firms in the host country and acquiring knowledge spillovers
at the host sites. This could be especially true in the case of an outward investment into a
host country that is more capital or R&D-intensive than the home country. The
technology-sourcing occurs mainly when firms try to gain access to foreign technology by
either acquiring foreign firms or establishing R-D facilities in “Foreign Centers of
Excellence” (Herzer, 2012). These firms then acquire new technological know-how and
transfer it to the parent company in the home country.
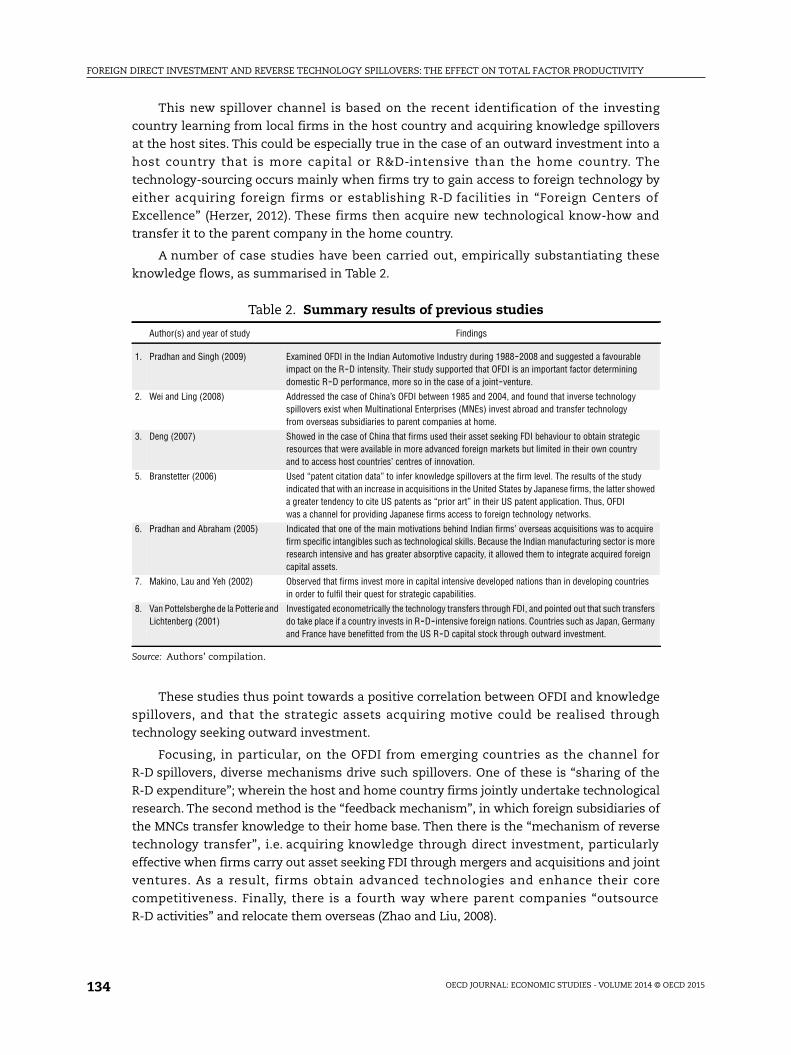
A number of case studies have been carried out, empirically substantiating these
knowledge flows, as summarised in Table 2.
These studies thus point towards a positive correlation between OFDI and knowledge
spillovers, and that the strategic assets acquiring motive could be realised through
technology seeking outward investment.
Focusing, in particular, on the OFDI from emerging countries as the channel for
R-D spillovers, diverse mechanisms drive such spillovers. One of these is “sharing of the
R-D expenditure”; wherein the host and home country firms jointly undertake technological
research. The second method is the “feedback mechanism”, in which foreign subsidiaries of
the MNCs transfer knowledge to their home base. Then there is the “mechanism of reverse
technology transfer”, i.e. acquiring knowledge through direct investment, particularly
effective when firms carry out asset seeking FDI through mergers and acquisitions and joint
ventures. As a result, firms obtain advanced technologies and enhance their core
competitiveness. Finally, there is a fourth way where parent companies “outsource
R-D activities” and relocate them overseas (Zhao and Liu, 2008).
Table 2. Summary results of previous studies
Author(s) and year of study Findings
1. Pradhan and Singh (2009) Examined OFDI in the Indian Automotive Industry during 1988-2008 and suggested a favourableimpact on the R-D intensity. Their study supported that OFDI is an important factor determiningdomestic R-D performance, more so in the case of a joint-venture.
2. Wei and Ling (2008) Addressed the case of China’s OFDI between 1985 and 2004, and found that inverse technologyspillovers exist when Multinational Enterprises (MNEs) invest abroad and transfer technologyfrom overseas subsidiaries to parent companies at home.
3. Deng (2007) Showed in the case of China that firms used their asset seeking FDI behaviour to obtain strategicresources that were available in more advanced foreign markets but limited in their own countryand to access host countries’ centres of innovation.
5. Branstetter (2006) Used “patent citation data” to infer knowledge spillovers at the firm level. The results of the studyindicated that with an increase in acquisitions in the United States by Japanese firms, the latter showeda greater tendency to cite US patents as “prior art” in their US patent application. Thus, OFDIwas a channel for providing Japanese firms access to foreign technology networks.
6. Pradhan and Abraham (2005) Indicated that one of the main motivations behind Indian firms’ overseas acquisitions was to acquirefirm specific intangibles such as technological skills. Because the Indian manufacturing sector is moreresearch intensive and has greater absorptive capacity, it allowed them to integrate acquired foreigncapital assets.
7. Makino, Lau and Yeh (2002) Observed that firms invest more in capital intensive developed nations than in developing countriesin order to fulfil their quest for strategic capabilities.
8. Van Pottelsberghe de la Potterie andLichtenberg (2001)
Investigated econometrically the technology transfers through FDI, and pointed out that such transfersdo take place if a country invests in R-D-intensive foreign nations. Countries such as Japan, Germanyand France have benefitted from the US R-D capital stock through outward investment.
Source: Authors’ compilation.
FOREIGN DIRECT INVESTMENT AND REVERSE TECHNOLOGY SPILLOVERS: THE EFFECT ON TOTAL FACTOR PRODUCTIVITY
OECD JOURNAL: ECONOMIC STUDIES - VOLUME 2014 © OECD 2015 135
For example, looking at the Indian case, the main mechanism of acquiring technology
has been to engage in strategic asset seeking investment, mostly directed towards
developed nations, and enhance one’s own technological innovation capacity. Pradhan and
Singh (2009) explored the Indian firm’s OFDI in the auto industry and suggested a
significant impact of OFDI on auto firm’s R-D intensity. Also, NIIT Ltd., a leading service
sector Indian MNE, has been involved in strategic asset seeking investment through brown
field investment. In 2002-03, it undertook several acquisitions such as Osprey Systems in
March 2002 and Cognitive Arts in February 2003. With these acquisitions, NIIT gained
strategic advantage in the US corporate knowledge solution market (Pradhan, 2006).
Given this background about R-D spillovers resulting from FDI, the following section
highlights the main objective of our study – the “feedback effect” of such technology
spillovers on the growth of domestic productivity of emerging economies.
3. The impact on total factor productivity growthRecent trends show that the emerging and developing economies have been
experiencing rapid TFP growth3 since the early 2000s. Compared with the advanced
economies where the growth rate dropped from 0.4% per year between 1995 and 2005 to
-0.1% between 2005 and 2008, the emerging economies have witnessed an improvement
from 1.0% in 1995-2005 to 2.2% in 2005-2008 (the Conference Board, Total Economy Database).
However, the level of productivity in developing countries is still much lower than
advanced countries, indicating scope for strengthening and catching up. Looking at the
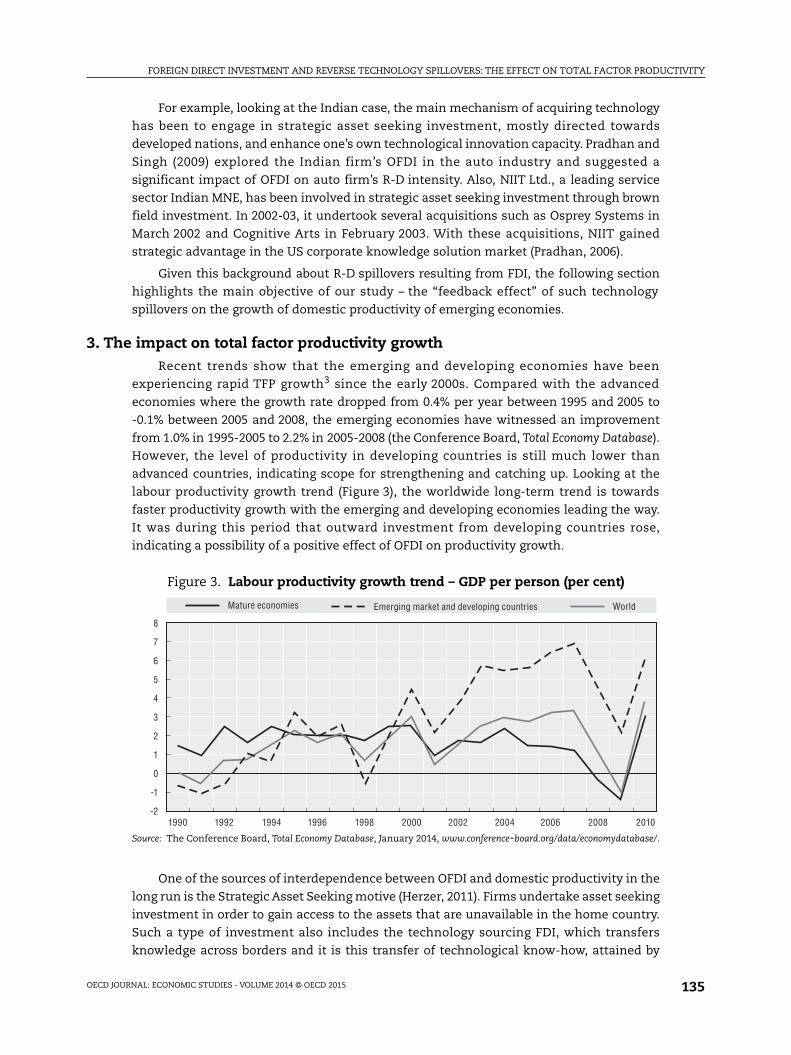
labour productivity growth trend (Figure 3), the worldwide long-term trend is towards
faster productivity growth with the emerging and developing economies leading the way.
It was during this period that outward investment from developing countries rose,
indicating a possibility of a positive effect of OFDI on productivity growth.
One of the sources of interdependence between OFDI and domestic productivity in the
long run is the Strategic Asset Seeking motive (Herzer, 2011). Firms undertake asset seeking
investment in order to gain access to the assets that are unavailable in the home country.
Such a type of investment also includes the technology sourcing FDI, which transfers
knowledge across borders and it is this transfer of technological know-how, attained by
Figure 3. Labour productivity growth trend – GDP per person (per cent)
Source: The Conference Board, Total Economy Database, January 2014, www.conference-board.org/data/economydatabase/.
8
7
6
5
4
3
2
1
0
-1
-21990 1992 1994 1996 1998 2000 2002 2004 2006 2008 2010
Mature economies WorldEmerging market and developing countries
FOREIGN DIRECT INVESTMENT AND REVERSE TECHNOLOGY SPILLOVERS: THE EFFECT ON TOTAL FACTOR PRODUCTIVITY
OECD JOURNAL: ECONOMIC STUDIES - VOLUME 2014 © OECD 2015136
foreign affiliates, to the parent companies, that facilitates the increase in productivity at
home. Thus OFDI affects TFP growth through R-D spillovers, as productivity changes are
critical signals of technology upgrading.
Moreover, it is important to note that OFDI not only affects the productivity of the
investing firm but also of the economy as a whole (Blomstrom and Kokko, 1998). The
investing firms could well be a source of advanced technology to local firms, which may
benefit by copying or through labour turnover. Also, the benefit could be from the high
quality intermediate goods produced by the investing firm that may now be available to the
local firms at lower prices. Domestic firms may even take the advantage of economies of
scale, as OFDI opens up the opportunity for the investing firm to grow larger than would
have been possible with production in just one nation. In addition, it is obvious that the
increased competition between the MNCs and the domestic firms would be an impetus for
the latter to run more efficiently.
However, there are a few considerations related to the impact of knowledge spillovers
resulting from OFDI. First of all, the learning ability of the investing firm matters. If the
firms have low technological capacity, as is true for firms in developing countries, it may be
difficult to effectively exploit the foreign technology. Furthermore, OFDI could reduce
domestic capital accumulation and hence productivity when the investors invest the
scarce domestic resources abroad. Finally, it may well be argued that significant spillovers
to developing nations take place only if a substantial portion of investment goes to more
developed countries, which have a higher technological expertise.
A number of studies provide empirical evidence for the possible impact of OFDI on
domestic productivity. Kimura and Kiyota (2006) analysed panel data on Japanese firms for
the period 1994-2000, and suggested that OFDI increases productivity. Their key finding
was that, on average, firms that invest abroad have 1.8% higher growth than those that do
not engage in FDI. Barba and Castellani (2004) considered a sample of Italian firms
between 1993 and 1998, and reported a positive causal effect of outward investment on the
home country’s TFP growth, output and employment. They also compared the
multinational firms that invested abroad with the domestic firms, and found that the
former outperform.
Herzer (2011) examined the long-run relationship between OFDI and TFP for a sample
of 33 developing countries over the period 1980-2005 and found that on average a positive
effect is prevalent. However there is considerable heterogeneity explained by the
cross-country differences, mainly due to labour market regulations. Bitzer and Gorg (2009),
on the other hand, found an overall negative effect of OFDI on TFP, using panel data for
17 OECD countries over 1973-2001. But there were large country differences, for example,
South Korea observed the largest negative effect, though countries such as France, the
United Kingdom and the United States witnessed higher factor productivity due to OFDI.
Therefore, the impact of OFDI on domestic productivity could be mixed, differing
significantly across countries. It may be particularly true that the effect does not
necessarily depend on the motive of investment but on a number of other factors such as
technological capacity, government policies, and level of financial development. More
importantly, human capital stock is a crucial factor. Benefits from international
R-D spillovers could be greater when the labour force in developing countries is more
educated and skilled, termed as the “absorptive capacity” by Keller (1996). Also, how well
the diffused technology is absorbed and implemented could be reflected in the increase in
number of patent applications filed by the residents.

FOREIGN DIRECT INVESTMENT AND REVERSE TECHNOLOGY SPILLOVERS: THE EFFECT ON TOTAL FACTOR PRODUCTIVITY
OECD JOURNAL: ECONOMIC STUDIES - VOLUME 2014 © OECD 2015 137
We now attempt to provide evidence of the effect of OFDI from EMNEs into the
developed countries on the productivity growth of the home country through
R-D spillovers using an empirical model. We also evaluate and compare this effect with
that of spillovers resulting from IFDI from resource rich countries into the emerging
economies – the traditional channel.
4. Empirical frameworkIn this study we assess the impact of FDI on TFP growth through technology flows
across borders by employing a generalised version of the methodology suggested by Van
Pottelsberghe de la Potterie and Lichtenberg (2001).4 Our paper contributes constructively
to the literature by focusing on the impact of FDI generated R-D spillovers from developed
to developing countries during recent years, i.e. technology transfers through North-South
bilateral FDI. We consider panel data for 18 emerging economies over the 1990-2010 period,
and investigate the impact of R-D spillovers resulting from FDI flows to and from the
34 OECD member countries as the investing partners (Appendix A and B, respectively, list
the 18 emerging and the 34 OECD nations). We also extend the specification by including
catalyst terms, such as human capital, as control variables.
4.1. Model specificationEquation [1] is the basic econometric model; it states that the domestic TFP growth of
a country is a function of its domestic R-D capital stock and of foreign R-D capital stock:
[1]
where i = 1 … 18 is a country index; t = 1990 … 2010 is a time index; lnTFP is the natural
logarithm of TFP;5 RDf represents the foreign R-D capital stock; RDd represents the
domestic R-D capital stock; αi is a country-specific intercept; αf is the elasticity with respect
to the foreign R-D capital stock; αd is the elasticity with respect to the domestic R-D capital
stock; and ε is the error term.
The two different foreign R-D capital stock terms are constructed as follows. The first
one, the foreign R-D capital stock embodied in OFDI from country i to country j, , is
given as:
[2]
here, i = 1 … 18 emerging economies and j = 1 … 34 OECD countries. is the OFDI flow
from country i into country j in year t, is the GDP of country j in year t, is the
domestic R-D capital stock of country j in year t, i.e. is the degree of
R-D intensity of country j in year t. Thus, is the foreign R-D spillover for each
country i, given as the weighted average of R-D intensity of its investing partner j with OFDI
flow from country i into country j.
The second one, the foreign R-D capital stock embodied in IFDI to country i from
country j, , is computed as:
[3]
here, is the IFDI flow into country i from country j in year t, hence is the foreign
R-D spillover for each country i, given as the weighted average of R-D intensity of its
investing partner j with IFDI flow into country i from country j.
lnTFP lnRD lnRDit if
itf d
itd
it
RDitfo
RDOFDI
GDPRDit
fo
j
ijt
jtjtd
1
34
OFDIijtGDPjt RDjt
d
RD GDPjtd
jt/RDit
fo
RDitfi
RDIFDI
GDPRDit
fi
j
ijt
jtjtd
1
34
IFDIijt RDitfi

FOREIGN DIRECT INVESTMENT AND REVERSE TECHNOLOGY SPILLOVERS: THE EFFECT ON TOTAL FACTOR PRODUCTIVITY
OECD JOURNAL: ECONOMIC STUDIES - VOLUME 2014 © OECD 2015138
A further specification, Equation [4], includes “Human Capital” and “Number of Patent
Applications filed by Residents” as two catalyst terms included with the purpose of getting
better estimates of output elasticities of domestic and foreign R-D capital terms. These two
variables are not only important channels of productivity growth, but also capture the level
of indigenous capacity of the home country. We therefore include these control variables in
order to avoid any bias in the estimation.
[4]
where = number of patent applications filed by residents in country i in year t, and
= human capital, proxied as “Average years of total schooling (age 25+)” in year t.
Thus, the two main hypotheses that would be examined are:
1. Whether the growth of an economy’s productivity is affected by foreign R-D efforts when
it undertakes OFDI in technologically-advanced countries. This can then be compared
with the impact of spillovers generated when R-D-intensive countries invest in it.
2. Whether the inclusion of the economy’s indigenous technological capability measured in
terms of skilled workforce and level of innovation, the latter reflected by number of patent
applications, results in improved estimation of the effect of foreign R-D spillovers.
4.2. Data Sources
The data source for OFDI and IFDI flows6 to and from, respectively, the 34 OECD
countries under study between 1990 and 2010 is the OECD International Direct Investment
Database. Data on GDP and number of patent applications filed by residents7is drawn from
the World Bank data series (www.databank.worldbank.org) and data on R-D intensity is
drawn from the OECD Factbook 2010. We have collected data on TFP from the Conference
Board: Total Economy Database. For the average years of total schooling (age 25+), we
interpolate from the five yearly data given by Barro and Lee, extracted from the education
statistics of the World Bank data series (www.databank.worldbank.org).
Before we discuss the results, an important issue must be addressed. As we are
looking at the overall macroeconomic picture, it is necessary to show a match-up between
the FDI flows into major sectors and the R-D intensity in the respective sectors in order to
justify the R-D spillovers approach. This is important to rule out the criticism that FDI
could possibly be going into those sectors where there is minimal R-D expenditure, and
also to support the rationale behind creating the R-D spillover term and the motivation for
developing countries investing to acquire strategic assets. Such accordance is essential,
more in the case of OFDI from developing economies into the R-D intensive countries,
aimed at attaining technological knowledge, than in the case of IFDI from technology
intensive DMNEs. This is so because DMNEs are themselves advanced, and when they
invest in emerging economies to enhance their own technological base, they also diffuse
knowledge to the local EMNEs in the process.
Therefore, to substantiate this argument, we take the example of OFDI flows from
eight major emerging economies under study, and look at the major destination/host
countries where they invest. We further classify the investment on the basis of major
sectors, and then focus on how much R-D expenditure the host countries undertake in
those specific sectors (Table 3).
Looking, for example, at the case of China (Table 3), its major destinations are the
United States, Japan, Germany and Australia and the major sectors are Trade and Services,
lnTFP lnRD lnRD lnPA lnHit if
itf d
itd
it it it 1 2
PAit
Hit

FOREIGN DIRECT INVESTMENT AND REVERSE TECHNOLOGY SPILLOVERS: THE EFFECT ON TOTAL FACTOR PRODUCTIVITY
OECD JOURNAL: ECONOMIC STUDIES - VOLUME 2014 © OECD 2015 139
Manufacturing, and Resource Extraction. Calculating the percentage of R-D expenditure in
these sectors, the United States spends 75.28% of its total R-D expenditure in these three
sectors only. Japan spends 90.31%, Germany spends 92.82%, and Australia spends 61.55%.
The last column expresses R-D expenditure in these three major sectors as a percentage of
GDP of host countries, i.e. the R-D intensity of those sectors. These figures clearly
demonstrate that FDI from developing and emerging economies does take place in those
sectors where the host countries are primarily undertaking R-D, and justify the asset
seeking behaviour of emerging economies. In other words, host country sectors that have
higher R-D intensity attract significant levels of FDI from home countries.
Table 3. Matching sectoral distribution of OFDI with the sectorspecific R-D expenditure in the major destinations
Investing/home country
Majorsectors
Major destinations(host country)
R-D expenditure in majorsectors as a %of total sectoralR-D expenditure
in the host country
R-D expenditurein the major sectors
as a % of GDPin the host country
India Pharmaceuticals, agriculturalinputs, software,IT and broadcasting
US, Russia, Sri Lanka,Southeast Asia, UK
US: 19.97 US: 0.36 (1.89)
UK: 29.24 UK: 0.31 (1.13)
China Trade and services,manufacturing, resourceextraction (oil, gasand minerals), IT
Hong Kong, US, Japan,Australia, Germany
US: 75.28 US: 1.36 (1.89)
Japan: 90.31 Japan: 1.55 (1.73)
Germany: 92.82 Germany: 1.28 (1.53)
Australia: 61.55 Australia: 0.51 (0.93)
Brazil Energy, mining, services US, UK, Portugal,Netherlands
US: 29.04 US: 0.52 (1.89)
UK: 19.24 UK: 0.20 (1.13)
Portugal: 41.83 Portugal: 0.17 (0.35)
Netherlands: 17.54 Netherlands: 0.15 (0.98)
Russia Resource extraction (oil, gasand metal), manufacturing,telecommunication
European Union, US, CEE US: 71.40 US: 1.28 (1.89)
Germany: 92.65 Germany: 1.27 (1.52)
Hungary: 77.54 Hungary: 0.46 (0.60)
Netherlands: 81.77 Netherlands: 0.68 (0.98)
Portugal: 56.92 Portugal: 0.18 (0.35)
Argentina Oil and gas, iron and steel,food, pharmaceuticals,telecommunications
US, Europe, Japan US: 11.77 US: 0.21 (1.89)
Japan: 11.97 Japan: 0.21 (1.73)
Malaysia Oil and gas, finance, realestate, construction, trade,hotels and restaurants
US, Singapore, ASEAN US: 13.12 US: 0.24 (1.89)
Singapore Finance, transport,manufacturing, real estate,construction
UK, Netherlands, Germany,Australia
UK: 94.02 UK: 1.01 (1.13)
Netherlands: 91.07 Netherlands: 0.76 (0.98)
Germany: 98.34 Germany: 1.36 (1.53)
Australia: 76.33 Australia: 0.64 (0.93)
South Africa Mining and natural resources,trade, finance, businessactivities, wood and woodproducts, machinery
US, UK, Netherlands,Germany, Australia
US: 9.85 US: 0.18 (1.89)
UK: 8.99 UK: 0.09 (1.13)
Netherlands: 16.75 Netherlands: 0.14 (0.98)
Germany: 11.77 Germany: 0.16 (1.53)
Australia: 30.43 Australia: 0.27 (0.93)
Notes: CEE = Central and Eastern Europe, ASEAN = Association of Southeast Asian Nations. Parentheses in column 5= Total sectoral R-D expenditure/GDP. All figures in columns 4 and 5 are averaged across the 1990-2010 period.Source: OECD STAN Database, World Bank Data Series, UNCTAD 2007.
FOREIGN DIRECT INVESTMENT AND REVERSE TECHNOLOGY SPILLOVERS: THE EFFECT ON TOTAL FACTOR PRODUCTIVITY
OECD JOURNAL: ECONOMIC STUDIES - VOLUME 2014 © OECD 2015140
5. ResultsWe use a Fixed-Effects (FE) regression8 to analyse the impact of variables that vary over
time. We also estimate the model based on a change specification (1st difference), in order
to take into account trend and non-stationarity. Further, to check whether there is a
long-run cointegration between the variables under study and that the estimated
regression is non-spurious, we carry out Pedroni’s (1999) cointegration tests for panel data.
The seven tests, as suggested by Pedroni, are applied to the basic specification in level and
in 1st difference.
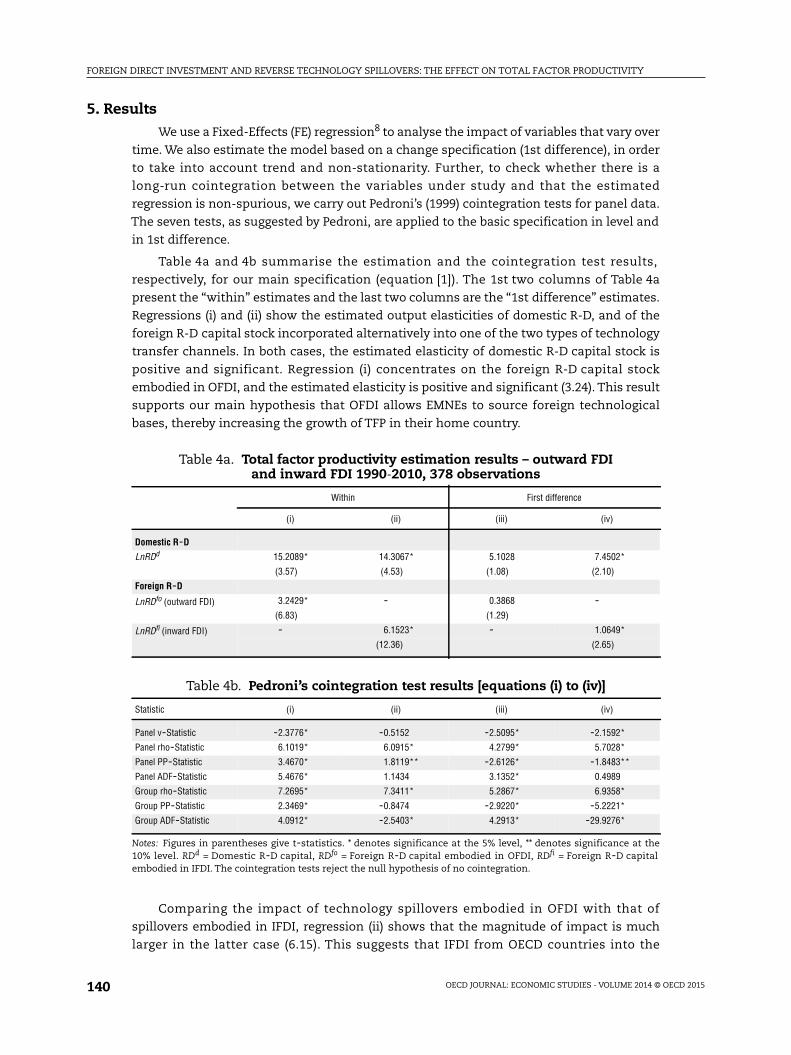
Table 4a and 4b summarise the estimation and the cointegration test results,
respectively, for our main specification (equation [1]). The 1st two columns of Table 4a
present the “within” estimates and the last two columns are the “1st difference” estimates.
Regressions (i) and (ii) show the estimated output elasticities of domestic R-D, and of the
foreign R-D capital stock incorporated alternatively into one of the two types of technology
transfer channels. In both cases, the estimated elasticity of domestic R-D capital stock is
positive and significant. Regression (i) concentrates on the foreign R-D capital stock
embodied in OFDI, and the estimated elasticity is positive and significant (3.24). This result
supports our main hypothesis that OFDI allows EMNEs to source foreign technological
bases, thereby increasing the growth of TFP in their home country.
Comparing the impact of technology spillovers embodied in OFDI with that of
spillovers embodied in IFDI, regression (ii) shows that the magnitude of impact is much
larger in the latter case (6.15). This suggests that IFDI from OECD countries into the
Table 4a. Total factor productivity estimation results – outward FDIand inward FDI 1990-2010, 378 observations
Within First difference
(i) (ii) (iii) (iv)
Domestic R-D
LnRDd 15.2089* 14.3067* 5.1028 7.4502*
(3.57) (4.53) (1.08) (2.10)
Foreign R-D
LnRDfo (outward FDI) 3.2429* - 0.3868 -(6.83) (1.29)
LnRDfi (inward FDI) - 6.1523* - 1.0649*
(12.36) (2.65)
Table 4b. Pedroni’s cointegration test results [equations (i) to (iv)]
Statistic (i) (ii) (iii) (iv)
Panel v-Statistic -2.3776* -0.5152 -2.5095* -2.1592*
Panel rho-Statistic 6.1019* 6.0915* 4.2799* 5.7028*
Panel PP-Statistic 3.4670* 1.8119** -2.6126* -1.8483**
Panel ADF-Statistic 5.4676* 1.1434 3.1352* 0.4989
Group rho-Statistic 7.2695* 7.3411* 5.2867* 6.9358*
Group PP-Statistic 2.3469* -0.8474 -2.9220* -5.2221*
Group ADF-Statistic 4.0912* -2.5403* 4.2913* -29.9276*
Notes: Figures in parentheses give t-statistics. * denotes significance at the 5% level, ** denotes significance at the10% level. RDd = Domestic R-D capital, RDfo = Foreign R-D capital embodied in OFDI, RDfi = Foreign R-D capitalembodied in IFDI. The cointegration tests reject the null hypothesis of no cointegration.
FOREIGN DIRECT INVESTMENT AND REVERSE TECHNOLOGY SPILLOVERS: THE EFFECT ON TOTAL FACTOR PRODUCTIVITY
OECD JOURNAL: ECONOMIC STUDIES - VOLUME 2014 © OECD 2015 141
18 emerging economies induces more substantial technology transfers compared with
OFDI from those 18 emerging economies into OECD countries. One possible explanation for
such diversity could be that when MNEs from R-D intensive countries invest in developing
countries, the former aim at exploiting their own technological innovations and in this
process they diffuse the technological knowledge to the host country firms either through
“copying” or “labour turnover”. Also, when developed countries undertake offshore
production to take advantages of factors such as lower wages in developing countries, the
host countries benefit more from externalities emanating from foreign companies.
However, when firms from emerging countries invest in R-D intensive developed countries,
their low technological capacity may not allow them to fully exploit the knowledge
spillovers, hence resulting in a comparatively lower impact on the growth of TFP. But
nonetheless, OFDI from EMNEs has a positive effect, thus supporting the premise that if
foreign companies intend to copy domestic knowledge in the host countries, their home
country is likely to benefit from potential spillovers (Van Pottelsberghe de la Potterie and
Lichtenberg, 2001).
Looking at the 1st difference estimates, in equations (iii) and (iv), they broadly confirm
the level estimates in terms of the sign of coefficients, though the magnitudes are much
lower. Also, the elasticities are now significant only in the case of regression equation (iv)
that takes into account the R-D spillovers embodied in IFDI. Almost all the cointegration
tests suggest that each of the regression equation is cointegrated in the long run (Table 4b).
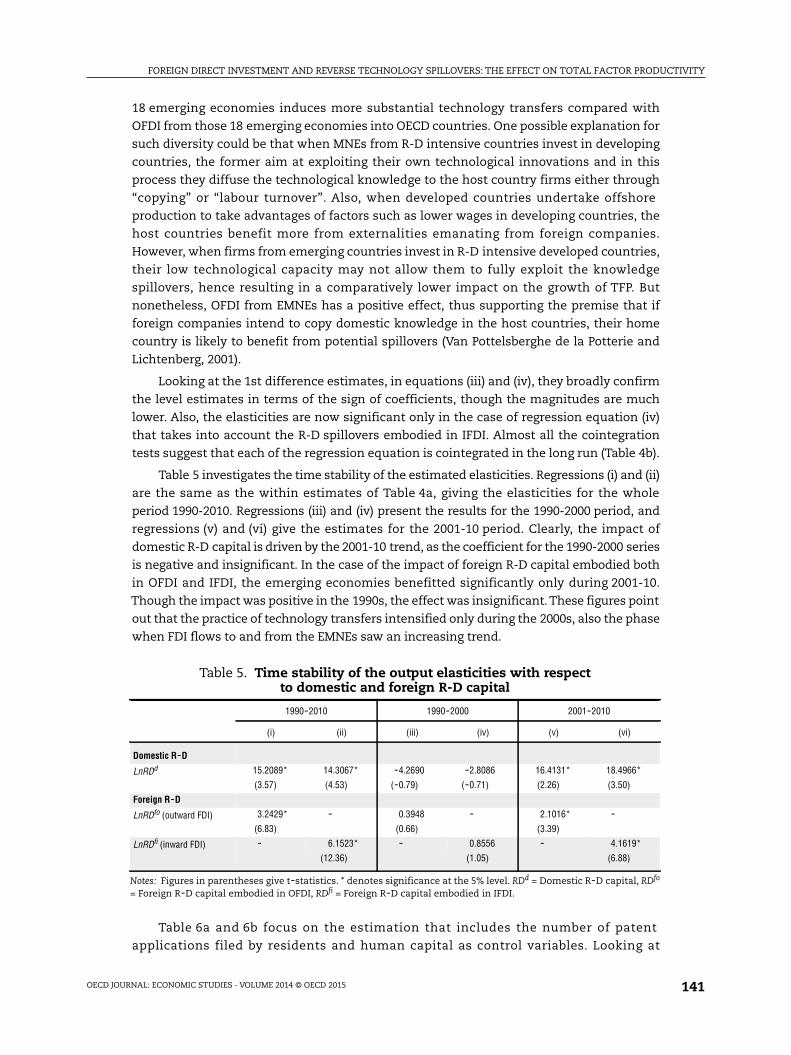
Table 5 investigates the time stability of the estimated elasticities. Regressions (i) and (ii)
are the same as the within estimates of Table 4a, giving the elasticities for the whole
period 1990-2010. Regressions (iii) and (iv) present the results for the 1990-2000 period, and
regressions (v) and (vi) give the estimates for the 2001-10 period. Clearly, the impact of
domestic R-D capital is driven by the 2001-10 trend, as the coefficient for the 1990-2000 series
is negative and insignificant. In the case of the impact of foreign R-D capital embodied both
in OFDI and IFDI, the emerging economies benefitted significantly only during 2001-10.
Though the impact was positive in the 1990s, the effect was insignificant.These figures point
out that the practice of technology transfers intensified only during the 2000s, also the phase
when FDI flows to and from the EMNEs saw an increasing trend.
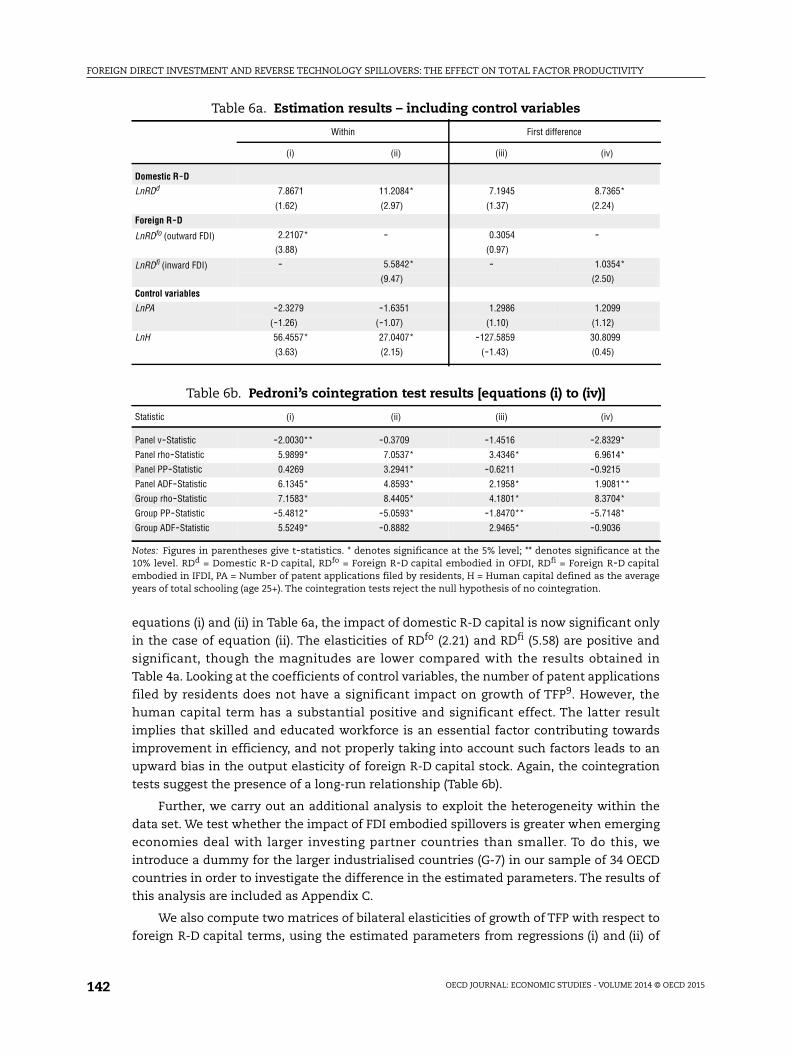
Table 6a and 6b focus on the estimation that includes the number of patent
applications filed by residents and human capital as control variables. Looking at
Table 5. Time stability of the output elasticities with respectto domestic and foreign R-D capital
1990-2010 1990-2000 2001-2010
(i) (ii) (iii) (iv) (v) (vi)
Domestic R-D
LnRDd 15.2089* 14.3067* -4.2690 -2.8086 16.4131* 18.4966*
(3.57) (4.53) (-0.79) (-0.71) (2.26) (3.50)
Foreign R-D
LnRDfo (outward FDI) 3.2429* - 0.3948 - 2.1016* -(6.83) (0.66) (3.39)
LnRDfi (inward FDI) - 6.1523* - 0.8556 - 4.1619*
(12.36) (1.05) (6.88)
Notes: Figures in parentheses give t-statistics. * denotes significance at the 5% level. RDd = Domestic R-D capital, RDfo
= Foreign R-D capital embodied in OFDI, RDfi = Foreign R-D capital embodied in IFDI.
FOREIGN DIRECT INVESTMENT AND REVERSE TECHNOLOGY SPILLOVERS: THE EFFECT ON TOTAL FACTOR PRODUCTIVITY
OECD JOURNAL: ECONOMIC STUDIES - VOLUME 2014 © OECD 2015142
equations (i) and (ii) in Table 6a, the impact of domestic R-D capital is now significant only
in the case of equation (ii). The elasticities of RDfo (2.21) and RDfi (5.58) are positive and
significant, though the magnitudes are lower compared with the results obtained in
Table 4a. Looking at the coefficients of control variables, the number of patent applications
filed by residents does not have a significant impact on growth of TFP9. However, the
human capital term has a substantial positive and significant effect. The latter result
implies that skilled and educated workforce is an essential factor contributing towards
improvement in efficiency, and not properly taking into account such factors leads to an
upward bias in the output elasticity of foreign R-D capital stock. Again, the cointegration
tests suggest the presence of a long-run relationship (Table 6b).
Further, we carry out an additional analysis to exploit the heterogeneity within the
data set. We test whether the impact of FDI embodied spillovers is greater when emerging
economies deal with larger investing partner countries than smaller. To do this, we
introduce a dummy for the larger industrialised countries (G-7) in our sample of 34 OECD
countries in order to investigate the difference in the estimated parameters. The results of
this analysis are included as Appendix C.
We also compute two matrices of bilateral elasticities of growth of TFP with respect to
foreign R-D capital terms, using the estimated parameters from regressions (i) and (ii) of
Table 6a. Estimation results – including control variables
Within First difference
(i) (ii) (iii) (iv)
Domestic R-D
LnRDd 7.8671 11.2084* 7.1945 8.7365*
(1.62) (2.97) (1.37) (2.24)
Foreign R-D
LnRDfo (outward FDI) 2.2107* - 0.3054 -(3.88) (0.97)
LnRDfi (inward FDI) - 5.5842* - 1.0354*
(9.47) (2.50)
Control variables
LnPA -2.3279 -1.6351 1.2986 1.2099
(-1.26) (-1.07) (1.10) (1.12)
LnH 56.4557* 27.0407* -127.5859 30.8099
(3.63) (2.15) (-1.43) (0.45)
Table 6b. Pedroni’s cointegration test results [equations (i) to (iv)]
Statistic (i) (ii) (iii) (iv)
Panel v-Statistic -2.0030** -0.3709 -1.4516 -2.8329*
Panel rho-Statistic 5.9899* 7.0537* 3.4346* 6.9614*
Panel PP-Statistic 0.4269 3.2941* -0.6211 -0.9215
Panel ADF-Statistic 6.1345* 4.8593* 2.1958* 1.9081**
Group rho-Statistic 7.1583* 8.4405* 4.1801* 8.3704*
Group PP-Statistic -5.4812* -5.0593* -1.8470** -5.7148*
Group ADF-Statistic 5.5249* -0.8882 2.9465* -0.9036
Notes: Figures in parentheses give t-statistics. * denotes significance at the 5% level; ** denotes significance at the10% level. RDd = Domestic R-D capital, RDfo = Foreign R-D capital embodied in OFDI, RDfi = Foreign R-D capitalembodied in IFDI, PA = Number of patent applications filed by residents, H = Human capital defined as the averageyears of total schooling (age 25+). The cointegration tests reject the null hypothesis of no cointegration.
FOREIGN DIRECT INVESTMENT AND REVERSE TECHNOLOGY SPILLOVERS: THE EFFECT ON TOTAL FACTOR PRODUCTIVITY
OECD JOURNAL: ECONOMIC STUDIES - VOLUME 2014 © OECD 2015 143
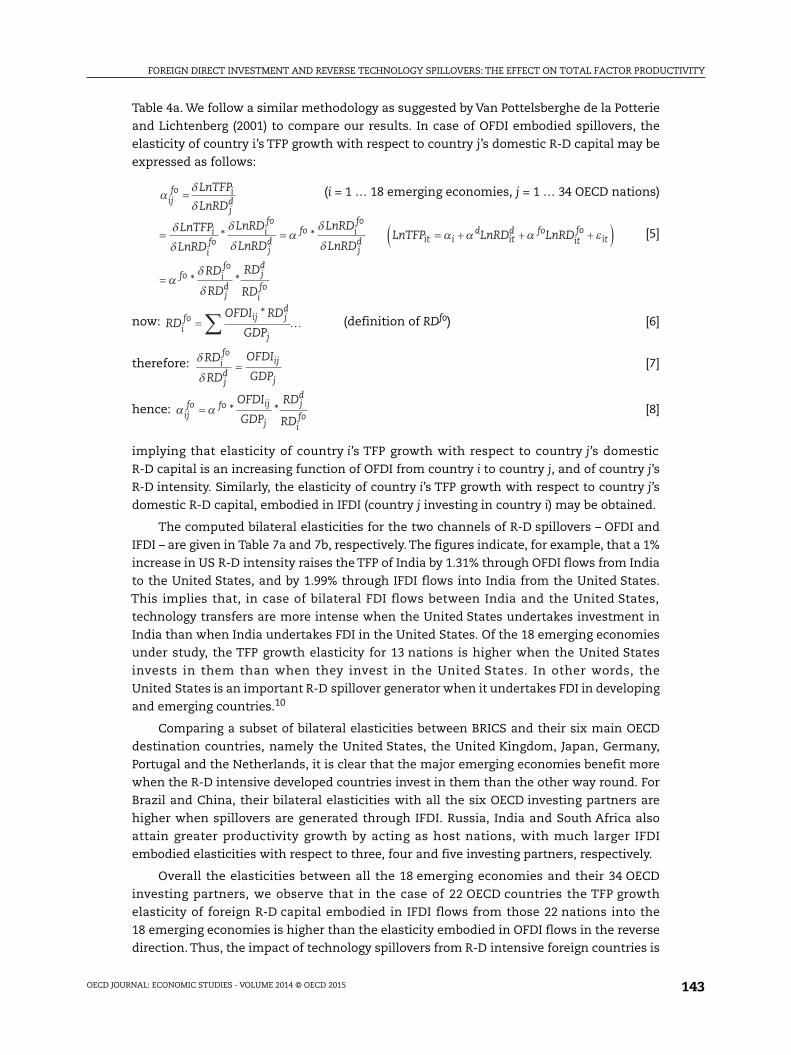
Table 4a. We follow a similar methodology as suggested by Van Pottelsberghe de la Potterie
and Lichtenberg (2001) to compare our results. In case of OFDI embodied spillovers, the
elasticity of country i’s TFP growth with respect to country j’s domestic R-D capital may be
expressed as follows:
(i = 1 … 18 emerging economies, j = 1 … 34 OECD nations)
[5]
now: (definition of RDfo) [6]
therefore: [7]
hence: [8]
implying that elasticity of country i’s TFP growth with respect to country j’s domestic
R-D capital is an increasing function of OFDI from country i to country j, and of country j’s
R-D intensity. Similarly, the elasticity of country i’s TFP growth with respect to country j’s
domestic R-D capital, embodied in IFDI (country j investing in country i) may be obtained.
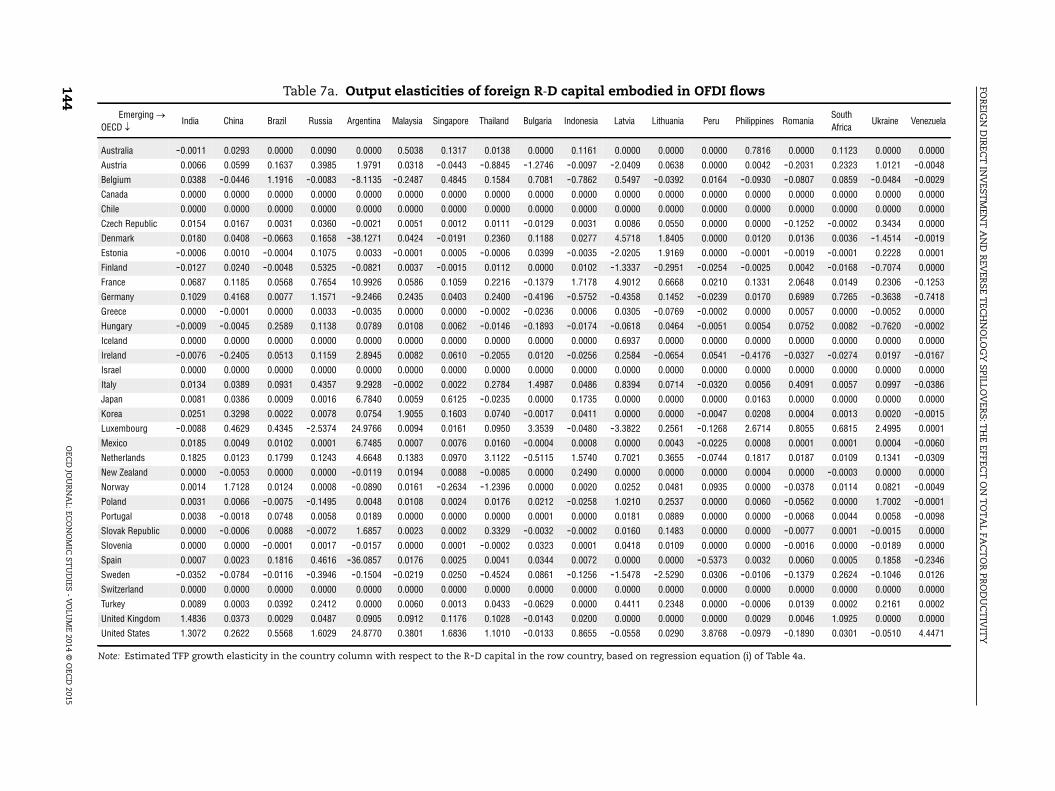
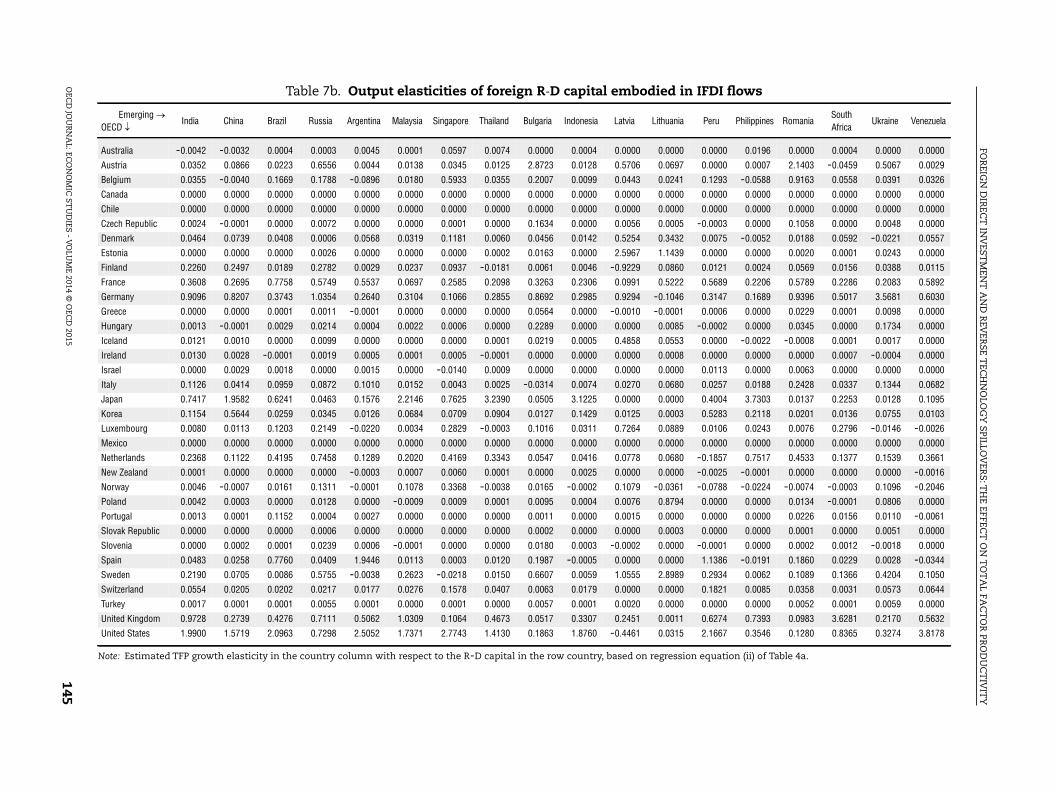
The computed bilateral elasticities for the two channels of R-D spillovers – OFDI and
IFDI – are given in Table 7a and 7b, respectively. The figures indicate, for example, that a 1%
increase in US R-D intensity raises the TFP of India by 1.31% through OFDI flows from India
to the United States, and by 1.99% through IFDI flows into India from the United States.
This implies that, in case of bilateral FDI flows between India and the United States,
technology transfers are more intense when the United States undertakes investment in
India than when India undertakes FDI in the United States. Of the 18 emerging economies
under study, the TFP growth elasticity for 13 nations is higher when the United States
invests in them than when they invest in the United States. In other words, the
United States is an important R-D spillover generator when it undertakes FDI in developing
and emerging countries.10
Comparing a subset of bilateral elasticities between BRICS and their six main OECD
destination countries, namely the United States, the United Kingdom, Japan, Germany,
Portugal and the Netherlands, it is clear that the major emerging economies benefit more
when the R-D intensive developed countries invest in them than the other way round. For
Brazil and China, their bilateral elasticities with all the six OECD investing partners are
higher when spillovers are generated through IFDI. Russia, India and South Africa also
attain greater productivity growth by acting as host nations, with much larger IFDI
embodied elasticities with respect to three, four and five investing partners, respectively.
Overall the elasticities between all the 18 emerging economies and their 34 OECD
investing partners, we observe that in the case of 22 OECD countries the TFP growth
elasticity of foreign R-D capital embodied in IFDI flows from those 22 nations into the
18 emerging economies is higher than the elasticity embodied in OFDI flows in the reverse
direction. Thus, the impact of technology spillovers from R-D intensive foreign countries is
ij
fo i
jd
LnTFP
LnRD
LnTFP
LnRD
LnRD
LnRD
LnRD
LnRDi
ifo
ifo
jd
fo ifo
jd
* * LnTFP LnRD LnRDit id
itd fo
itfo
it
fo i
fo
jd
jd
ifo
RD
RD
RD
RD* *
*RD
OFDI RD
GDPifo ij j
d
j
RD
RD
OFDI
GDPifo
jd
ij
j
ijfo fo ij
j
jd
ifo
OFDI
GDP
RD
RD * *
FOR
EIGN
DIR
ECT
INV
ESTM
ENT
AN
DR
EVER
SET
ECH
NO
LOG
YSPILLO
VER
S:TH
EEFFEC
TO
NT
OT
AL
FAC
TO
RPR
OD
UC
TIV
ITY
OEC
DJO
UR
NA
L:ECO
NO
MIC
STU
DIES
-V
OLU
ME
2014©
OEC
D2015
144 Table 7a. Output elasticities of foreign R-D capital embodied in OFDI flows
Emerging OECD
India China Brazil Russia Argentina Malaysia Singapore Thailand Bulgaria Indonesia Latvia Lithuania Peru Philippines RomaniaSouthAfrica
Ukraine Venezuela
Australia -0.0011 0.0293 0.0000 0.0090 0.0000 0.5038 0.1317 0.0138 0.0000 0.1161 0.0000 0.0000 0.0000 0.7816 0.0000 0.1123 0.0000 0.0000
Austria 0.0066 0.0599 0.1637 0.3985 1.9791 0.0318 -0.0443 -0.8845 -1.2746 -0.0097 -2.0409 0.0638 0.0000 0.0042 -0.2031 0.2323 1.0121 -0.0048
Belgium 0.0388 -0.0446 1.1916 -0.0083 -8.1135 -0.2487 0.4845 0.1584 0.7081 -0.7862 0.5497 -0.0392 0.0164 -0.0930 -0.0807 0.0859 -0.0484 -0.0029
Canada 0.0000 0.0000 0.0000 0.0000 0.0000 0.0000 0.0000 0.0000 0.0000 0.0000 0.0000 0.0000 0.0000 0.0000 0.0000 0.0000 0.0000 0.0000
Chile 0.0000 0.0000 0.0000 0.0000 0.0000 0.0000 0.0000 0.0000 0.0000 0.0000 0.0000 0.0000 0.0000 0.0000 0.0000 0.0000 0.0000 0.0000
Czech Republic 0.0154 0.0167 0.0031 0.0360 -0.0021 0.0051 0.0012 0.0111 -0.0129 0.0031 0.0086 0.0550 0.0000 0.0000 -0.1252 -0.0002 0.3434 0.0000
Denmark 0.0180 0.0408 -0.0663 0.1658 -38.1271 0.0424 -0.0191 0.2360 0.1188 0.0277 4.5718 1.8405 0.0000 0.0120 0.0136 0.0036 -1.4514 -0.0019
Estonia -0.0006 0.0010 -0.0004 0.1075 0.0033 -0.0001 0.0005 -0.0006 0.0399 -0.0035 -2.0205 1.9169 0.0000 -0.0001 -0.0019 -0.0001 0.2228 0.0001
Finland -0.0127 0.0240 -0.0048 0.5325 -0.0821 0.0037 -0.0015 0.0112 0.0000 0.0102 -1.3337 -0.2951 -0.0254 -0.0025 0.0042 -0.0168 -0.7074 0.0000
France 0.0687 0.1185 0.0568 0.7654 10.9926 0.0586 0.1059 0.2216 -0.1379 1.7178 4.9012 0.6668 0.0210 0.1331 2.0648 0.0149 0.2306 -0.1253
Germany 0.1029 0.4168 0.0077 1.1571 -9.2466 0.2435 0.0403 0.2400 -0.4196 -0.5752 -0.4358 0.1452 -0.0239 0.0170 0.6989 0.7265 -0.3638 -0.7418
Greece 0.0000 -0.0001 0.0000 0.0033 -0.0035 0.0000 0.0000 -0.0002 -0.0236 0.0006 0.0305 -0.0769 -0.0002 0.0000 0.0057 0.0000 -0.0052 0.0000
Hungary -0.0009 -0.0045 0.2589 0.1138 0.0789 0.0108 0.0062 -0.0146 -0.1893 -0.0174 -0.0618 0.0464 -0.0051 0.0054 0.0752 0.0082 -0.7620 -0.0002
Iceland 0.0000 0.0000 0.0000 0.0000 0.0000 0.0000 0.0000 0.0000 0.0000 0.0000 0.6937 0.0000 0.0000 0.0000 0.0000 0.0000 0.0000 0.0000
Ireland -0.0076 -0.2405 0.0513 0.1159 2.8945 0.0082 0.0610 -0.2055 0.0120 -0.0256 0.2584 -0.0654 0.0541 -0.4176 -0.0327 -0.0274 0.0197 -0.0167
Israel 0.0000 0.0000 0.0000 0.0000 0.0000 0.0000 0.0000 0.0000 0.0000 0.0000 0.0000 0.0000 0.0000 0.0000 0.0000 0.0000 0.0000 0.0000
Italy 0.0134 0.0389 0.0931 0.4357 9.2928 -0.0002 0.0022 0.2784 1.4987 0.0486 0.8394 0.0714 -0.0320 0.0056 0.4091 0.0057 0.0997 -0.0386
Japan 0.0081 0.0386 0.0009 0.0016 6.7840 0.0059 0.6125 -0.0235 0.0000 0.1735 0.0000 0.0000 0.0000 0.0163 0.0000 0.0000 0.0000 0.0000
Korea 0.0251 0.3298 0.0022 0.0078 0.0754 1.9055 0.1603 0.0740 -0.0017 0.0411 0.0000 0.0000 -0.0047 0.0208 0.0004 0.0013 0.0020 -0.0015
Luxembourg -0.0088 0.4629 0.4345 -2.5374 24.9766 0.0094 0.0161 0.0950 3.3539 -0.0480 -3.3822 0.2561 -0.1268 2.6714 0.8055 0.6815 2.4995 0.0001
Mexico 0.0185 0.0049 0.0102 0.0001 6.7485 0.0007 0.0076 0.0160 -0.0004 0.0008 0.0000 0.0043 -0.0225 0.0008 0.0001 0.0001 0.0004 -0.0060
Netherlands 0.1825 0.0123 0.1799 0.1243 4.6648 0.1383 0.0970 3.1122 -0.5115 1.5740 0.7021 0.3655 -0.0744 0.1817 0.0187 0.0109 0.1341 -0.0309
New Zealand 0.0000 -0.0053 0.0000 0.0000 -0.0119 0.0194 0.0088 -0.0085 0.0000 0.2490 0.0000 0.0000 0.0000 0.0004 0.0000 -0.0003 0.0000 0.0000
Norway 0.0014 1.7128 0.0124 0.0008 -0.0890 0.0161 -0.2634 -1.2396 0.0000 0.0020 0.0252 0.0481 0.0935 0.0000 -0.0378 0.0114 0.0821 -0.0049
Poland 0.0031 0.0066 -0.0075 -0.1495 0.0048 0.0108 0.0024 0.0176 0.0212 -0.0258 1.0210 0.2537 0.0000 0.0060 -0.0562 0.0000 1.7002 -0.0001
Portugal 0.0038 -0.0018 0.0748 0.0058 0.0189 0.0000 0.0000 0.0000 0.0001 0.0000 0.0181 0.0889 0.0000 0.0000 -0.0068 0.0044 0.0058 -0.0098
Slovak Republic 0.0000 -0.0006 0.0088 -0.0072 1.6857 0.0023 0.0002 0.3329 -0.0032 -0.0002 0.0160 0.1483 0.0000 0.0000 -0.0077 0.0001 -0.0015 0.0000
Slovenia 0.0000 0.0000 -0.0001 0.0017 -0.0157 0.0000 0.0001 -0.0002 0.0323 0.0001 0.0418 0.0109 0.0000 0.0000 -0.0016 0.0000 -0.0189 0.0000
Spain 0.0007 0.0023 0.1816 0.4616 -36.0857 0.0176 0.0025 0.0041 0.0344 0.0072 0.0000 0.0000 -0.5373 0.0032 0.0060 0.0005 0.1858 -0.2346
Sweden -0.0352 -0.0784 -0.0116 -0.3946 -0.1504 -0.0219 0.0250 -0.4524 0.0861 -0.1256 -1.5478 -2.5290 0.0306 -0.0106 -0.1379 0.2624 -0.1046 0.0126
Switzerland 0.0000 0.0000 0.0000 0.0000 0.0000 0.0000 0.0000 0.0000 0.0000 0.0000 0.0000 0.0000 0.0000 0.0000 0.0000 0.0000 0.0000 0.0000
Turkey 0.0089 0.0003 0.0392 0.2412 0.0000 0.0060 0.0013 0.0433 -0.0629 0.0000 0.4411 0.2348 0.0000 -0.0006 0.0139 0.0002 0.2161 0.0002
United Kingdom 1.4836 0.0373 0.0029 0.0487 0.0905 0.0912 0.1176 0.1028 -0.0143 0.0200 0.0000 0.0000 0.0000 0.0029 0.0046 1.0925 0.0000 0.0000
United States 1.3072 0.2622 0.5568 1.6029 24.8770 0.3801 1.6836 1.1010 -0.0133 0.8655 -0.0558 0.0290 3.8768 -0.0979 -0.1890 0.0301 -0.0510 4.4471
Note: Estimated TFP growth elasticity in the country column with respect to the R-D capital in the row country, based on regression equation (i) of Table 4a.
FOR
EIGN
DIR
ECT
INV
ESTM
ENT
AN
DR
EVER
SET
ECH
NO
LOG
YSPILLO
VER
S:TH
EEFFEC
TO
NT
OT
AL
FAC
TO
RPR
OD
UC
TIV
ITY
OEC
DJO
UR
NA
L:ECO
NO
MIC
STU
DIES
-V
OLU
ME
2014©
OEC
D2015
145
Table 7b. Output elasticities of foreign R-D capital embodied in IFDI flows
Emerging OECD
India China Brazil Russia Argentina Malaysia Singapore Thailand Bulgaria Indonesia Latvia Lithuania Peru Philippines RomaniaSouthAfrica
Ukraine Venezuela
Australia -0.0042 -0.0032 0.0004 0.0003 0.0045 0.0001 0.0597 0.0074 0.0000 0.0004 0.0000 0.0000 0.0000 0.0196 0.0000 0.0004 0.0000 0.0000
Austria 0.0352 0.0866 0.0223 0.6556 0.0044 0.0138 0.0345 0.0125 2.8723 0.0128 0.5706 0.0697 0.0000 0.0007 2.1403 -0.0459 0.5067 0.0029
Belgium 0.0355 -0.0040 0.1669 0.1788 -0.0896 0.0180 0.5933 0.0355 0.2007 0.0099 0.0443 0.0241 0.1293 -0.0588 0.9163 0.0558 0.0391 0.0326
Canada 0.0000 0.0000 0.0000 0.0000 0.0000 0.0000 0.0000 0.0000 0.0000 0.0000 0.0000 0.0000 0.0000 0.0000 0.0000 0.0000 0.0000 0.0000
Chile 0.0000 0.0000 0.0000 0.0000 0.0000 0.0000 0.0000 0.0000 0.0000 0.0000 0.0000 0.0000 0.0000 0.0000 0.0000 0.0000 0.0000 0.0000
Czech Republic 0.0024 -0.0001 0.0000 0.0072 0.0000 0.0000 0.0001 0.0000 0.1634 0.0000 0.0056 0.0005 -0.0003 0.0000 0.1058 0.0000 0.0048 0.0000
Denmark 0.0464 0.0739 0.0408 0.0006 0.0568 0.0319 0.1181 0.0060 0.0456 0.0142 0.5254 0.3432 0.0075 -0.0052 0.0188 0.0592 -0.0221 0.0557
Estonia 0.0000 0.0000 0.0000 0.0026 0.0000 0.0000 0.0000 0.0002 0.0163 0.0000 2.5967 1.1439 0.0000 0.0000 0.0020 0.0001 0.0243 0.0000
Finland 0.2260 0.2497 0.0189 0.2782 0.0029 0.0237 0.0937 -0.0181 0.0061 0.0046 -0.9229 0.0860 0.0121 0.0024 0.0569 0.0156 0.0388 0.0115
France 0.3608 0.2695 0.7758 0.5749 0.5537 0.0697 0.2585 0.2098 0.3263 0.2306 0.0991 0.5222 0.5689 0.2206 0.5789 0.2286 0.2083 0.5892
Germany 0.9096 0.8207 0.3743 1.0354 0.2640 0.3104 0.1066 0.2855 0.8692 0.2985 0.9294 -0.1046 0.3147 0.1689 0.9396 0.5017 3.5681 0.6030
Greece 0.0000 0.0000 0.0001 0.0011 -0.0001 0.0000 0.0000 0.0000 0.0564 0.0000 -0.0010 -0.0001 0.0006 0.0000 0.0229 0.0001 0.0098 0.0000
Hungary 0.0013 -0.0001 0.0029 0.0214 0.0004 0.0022 0.0006 0.0000 0.2289 0.0000 0.0000 0.0085 -0.0002 0.0000 0.0345 0.0000 0.1734 0.0000
Iceland 0.0121 0.0010 0.0000 0.0099 0.0000 0.0000 0.0000 0.0001 0.0219 0.0005 0.4858 0.0553 0.0000 -0.0022 -0.0008 0.0001 0.0017 0.0000
Ireland 0.0130 0.0028 -0.0001 0.0019 0.0005 0.0001 0.0005 -0.0001 0.0000 0.0000 0.0000 0.0008 0.0000 0.0000 0.0000 0.0007 -0.0004 0.0000
Israel 0.0000 0.0029 0.0018 0.0000 0.0015 0.0000 -0.0140 0.0009 0.0000 0.0000 0.0000 0.0000 0.0113 0.0000 0.0063 0.0000 0.0000 0.0000
Italy 0.1126 0.0414 0.0959 0.0872 0.1010 0.0152 0.0043 0.0025 -0.0314 0.0074 0.0270 0.0680 0.0257 0.0188 0.2428 0.0337 0.1344 0.0682
Japan 0.7417 1.9582 0.6241 0.0463 0.1576 2.2146 0.7625 3.2390 0.0505 3.1225 0.0000 0.0000 0.4004 3.7303 0.0137 0.2253 0.0128 0.1095
Korea 0.1154 0.5644 0.0259 0.0345 0.0126 0.0684 0.0709 0.0904 0.0127 0.1429 0.0125 0.0003 0.5283 0.2118 0.0201 0.0136 0.0755 0.0103
Luxembourg 0.0080 0.0113 0.1203 0.2149 -0.0220 0.0034 0.2829 -0.0003 0.1016 0.0311 0.7264 0.0889 0.0106 0.0243 0.0076 0.2796 -0.0146 -0.0026
Mexico 0.0000 0.0000 0.0000 0.0000 0.0000 0.0000 0.0000 0.0000 0.0000 0.0000 0.0000 0.0000 0.0000 0.0000 0.0000 0.0000 0.0000 0.0000
Netherlands 0.2368 0.1122 0.4195 0.7458 0.1289 0.2020 0.4169 0.3343 0.0547 0.0416 0.0778 0.0680 -0.1857 0.7517 0.4533 0.1377 0.1539 0.3661
New Zealand 0.0001 0.0000 0.0000 0.0000 -0.0003 0.0007 0.0060 0.0001 0.0000 0.0025 0.0000 0.0000 -0.0025 -0.0001 0.0000 0.0000 0.0000 -0.0016
Norway 0.0046 -0.0007 0.0161 0.1311 -0.0001 0.1078 0.3368 -0.0038 0.0165 -0.0002 0.1079 -0.0361 -0.0788 -0.0224 -0.0074 -0.0003 0.1096 -0.2046
Poland 0.0042 0.0003 0.0000 0.0128 0.0000 -0.0009 0.0009 0.0001 0.0095 0.0004 0.0076 0.8794 0.0000 0.0000 0.0134 -0.0001 0.0806 0.0000
Portugal 0.0013 0.0001 0.1152 0.0004 0.0027 0.0000 0.0000 0.0000 0.0011 0.0000 0.0015 0.0000 0.0000 0.0000 0.0226 0.0156 0.0110 -0.0061
Slovak Republic 0.0000 0.0000 0.0000 0.0006 0.0000 0.0000 0.0000 0.0000 0.0002 0.0000 0.0000 0.0003 0.0000 0.0000 0.0001 0.0000 0.0051 0.0000
Slovenia 0.0000 0.0002 0.0001 0.0239 0.0006 -0.0001 0.0000 0.0000 0.0180 0.0003 -0.0002 0.0000 -0.0001 0.0000 0.0002 0.0012 -0.0018 0.0000
Spain 0.0483 0.0258 0.7760 0.0409 1.9446 0.0113 0.0003 0.0120 0.1987 -0.0005 0.0000 0.0000 1.1386 -0.0191 0.1860 0.0229 0.0028 -0.0344
Sweden 0.2190 0.0705 0.0086 0.5755 -0.0038 0.2623 -0.0218 0.0150 0.6607 0.0059 1.0555 2.8989 0.2934 0.0062 0.1089 0.1366 0.4204 0.1050
Switzerland 0.0554 0.0205 0.0202 0.0217 0.0177 0.0276 0.1578 0.0407 0.0063 0.0179 0.0000 0.0000 0.1821 0.0085 0.0358 0.0031 0.0573 0.0644
Turkey 0.0017 0.0001 0.0001 0.0055 0.0001 0.0000 0.0001 0.0000 0.0057 0.0001 0.0020 0.0000 0.0000 0.0000 0.0052 0.0001 0.0059 0.0000
United Kingdom 0.9728 0.2739 0.4276 0.7111 0.5062 1.0309 0.1064 0.4673 0.0517 0.3307 0.2451 0.0011 0.6274 0.7393 0.0983 3.6281 0.2170 0.5632
United States 1.9900 1.5719 2.0963 0.7298 2.5052 1.7371 2.7743 1.4130 0.1863 1.8760 -0.4461 0.0315 2.1667 0.3546 0.1280 0.8365 0.3274 3.8178
Note: Estimated TFP growth elasticity in the country column with respect to the R-D capital in the row country, based on regression equation (ii) of Table 4a.

FOREIGN DIRECT INVESTMENT AND REVERSE TECHNOLOGY SPILLOVERS: THE EFFECT ON TOTAL FACTOR PRODUCTIVITY
OECD JOURNAL: ECONOMIC STUDIES - VOLUME 2014 © OECD 2015146
much greater when the developing and emerging economies act as host countries for the
IFDI flows than as home countries undertaking OFDI. These country specific figures are
consistent with our overall result given in Table 4a, showing a higher impact of RDfi
compared with RDfo.
6. Conclusion and policy implicationsAn important dimension of the “going-out” strategy is provided by reverse technology
spillovers through various mechanisms, one of which is the “strategic asset seeking”
motive of OFDI. In this study, we examine the impact of such technology spillovers on the
growth of TFP of the home country and, in contrast with some of the previous studies, the
paper deals with the overall macro-effect of OFDI. We then compare the effect of spillovers
embodied in OFDI with that of spillovers embodied in IFDI, and also analyse the role of
human capital and the number of patent applications filed by residents as control variables
to improve the estimation of output elasticity. To carry out the analysis, we apply the
generalised version of Van Pottelsberghe de la Potterie and Lichtenberg Model (2001). We
create the foreign R-D spillover variable based on outward and inward investment,
focusing on the OFDI flows from 18 emerging economies into 34 OECD countries over the
1990-2010 period, along with the IFDI flows into the 18 emerging economies from the
34 OECD countries.
The results confirm that OFDI from the emerging economies into OECD countries has
a positive and significant impact on the TFP growth of the former. The effect here is
mitigated through a transfer of foreign R-D capital, but the magnitude of the impact is
smaller than that of R-D spillovers resulting from IFDI flows in the opposite direction. This
result is also confirmed by our country-specific bilateral elasticities, showing that
developing countries benefit more when technology-rich nations invest in them than the
other way round. However, our results are contrary to what Van Pottelsberghe de la Potterie
and Lichtenberg (2001) suggested.11 They found that IFDI is more intended to take
advantage of the technological base of the home country than to diffuse the technology
that originates in the home country. Thus, there is an insignificant impact on the growth
rate of host countries’ productivity. Such a contrast might occur because of the difference
in the coverage of countries. Van Pottelsberghe de la Potterie and Lichtenberg focus on FDI
flows between 13 industrialised nations, whereas our study concentrates on IFDI flows
from technologically-rich OECD countries into the emerging and developing economies. As
a result, it may well be the case that technology transfers are more visible and have a
significant impact for North-South FDI rather than North-North FDI.
Overall, the study provides evidence of a productivity-enhancing effect of FDI felt
through foreign R-D spillovers. Further, the cointegration tests suggest the presence of a
long-run relationship between TFP growth and the R-D spillovers through two channels
– OFDI and IFDI. The inclusion of control variables highlights the importance of catalyst
terms, such as human capital, in reducing the upward bias in the output elasticity of
foreign R-D capital stock. We thus address two main subjects concerning the impact of FDI:
the cross border flow of technology – through the traditional channel when DMNEs invest
in emerging economies, and the more recent channel when EMNEs invest in advanced
economies. Next, and more importantly, our analysis combines this flow of technology to
explain the effect on TFP growth of emerging economies.
The theoretical framework of this paper therefore has much in common with the
Schumpeterian premise that the economic growth of a nation depends upon the creation

FOREIGN DIRECT INVESTMENT AND REVERSE TECHNOLOGY SPILLOVERS: THE EFFECT ON TOTAL FACTOR PRODUCTIVITY
OECD JOURNAL: ECONOMIC STUDIES - VOLUME 2014 © OECD 2015 147
of new technology or diffusion of technology (Tolentino, 1993). Since developing countries
have limited technological capabilities, the transfer of technology across borders through
direct investment provides the initial basis for technological development. Such transfers
therefore assist the developing countries in narrowing down the technological gap, and
hence attain profitable improvements in productivity and efficiency. However, the success
of technology transfer depends on a number of factors. On the one hand, factors such as
the ability of the country to adapt and develop the transferred technology could pose a
challenge. This requires the development of human resources and a better absorption and
implementation of advanced techniques through innovation. On the other hand, adequate
infrastructure, such as scientific and technical training institutions, R-D facilities, and
socio-economic environment play an important role in influencing the absorption of new
and advanced technology. It is therefore imperative that government policies directed
towards effective assimilation of foreign technology are set in motion.
It is often considered that OFDI enhances the interests of multinational corporations
only; however the paper brings out opportunities for the economy as a whole by way of
factors such as technology and productivity spillovers. With the understanding that OFDI
has a positive impact for developing economies, the study encourages a high quality
institutional environment to offer favourable conditions for running business, and hence
make the business entities strong and competitive for foreign expansion. Given that OFDI
constantly adds to the knowledge stock through reverse technology spillovers, and thereby
affects productivity, the link between institutions and OFDI could be seen as a channel
through which institutions promote productivity growth. In other words, the research
suggests the need to devise strategies to develop a common lobby of interests between
MNEs and policymakers in enhancing the positive effects of globalisation for growth and
development of the country.
Notes
1. Dunning’s IDP model suggests that a country’s outward and inward FDI are partly a function of itslevel of development, and that countries go through different stages as their economy develops.
2. We consider technology transfers from resource rich to emerging economies. A number of reasonscould be identified for why we take into account only FDI embodied spillovers, and not importembodied spillovers. First of all, it may be difficult to validate that the emerging economies areimporting from advanced countries mainly to acquire strategic assets. Also, emerging economiessuch as India and China are rising exporters. Therefore by taking into account only FDI, we haveconcentrated on the increasing levels of outward investment from developing countries mainlyaimed at fulfilling their asset-seeking motive. Further, two countries could import homogeneousgoods from another country j, and such imports may benefit one country more than another. Itmay be difficult to ensure that goods sold by country j to country i were embodied by R-D intensitysubstantially different from the R-D intensity of goods sold to another country (Griliches andLichtenberg, 1984). However, the FDI based weighting matrix that we attach embodies differentR-D intensity for different i and j (as M&As, Greenfield investment, Joint Ventures are countryspecific). Also, even if FDI is classified as a technology flow matrix (rent spillover), the hierarchicalclustering analysis shown in studies such as Van Pottelsberghe de la Potterie (1997) reflects that itis more likely to catch up knowledge spillovers than the Input-Output (IO) matrices because of amuch closer clustering of the former to the technology proximity matrices. Lastly, studies haveshown that knowledge spillover matrices yield higher returns than the IO matrix (Goto and Suzuki,1989; Vuori, 1997; Verspagen, 1997).
3. TFP growth – measured as the change in GDP growth over the compensation-share weightedgrowth of combined factor inputs (labour and capital inputs, adjusted for change in their quality).
4. Modified versions of this methodology have also been tested and employed by Coe and Helpman(1995), Lichtenberg and Van Pottelsberghe de la Potterie (1998), and Zhu and Jeon (2007).
FOREIGN DIRECT INVESTMENT AND REVERSE TECHNOLOGY SPILLOVERS: THE EFFECT ON TOTAL FACTOR PRODUCTIVITY
OECD JOURNAL: ECONOMIC STUDIES - VOLUME 2014 © OECD 2015148
5. We use the TFP index values. These values are generated using the growth rates obtained from theTotal Economy Database (the Conference Board). We do so to avoid the loss of observations [as ln(X)is undefined for X < 0] in using TFP growth rates.
6. Statistical data on FDI flows are more readily available than stocks. It is difficult to construct thestock values due to missing data and heterogeneous methodologies adopted in different countries.
7. Our source of data on Patent Applications is the World Bank Database, defined as – “Patentapplications are worldwide patent applications filed through the Patent Cooperation Treaty (PCT)procedure or with a national patent office for exclusive rights for an invention”. PCT is aninternational treaty providing a unified procedure for filing patent applications, and incorporatesboth priority and second filings. Statistics based on PCT applications are less subject to geographicbias, eliminate any institutional bias, and the timeliness of the indicator is also good. Also asdefined, in addition to PCT, the World Bank data also incorporate data from the National PatentOffice. But as we are looking at emerging economies the bias of using domestic filings is subsided.This is because the home offices attract the majority of priority filings, as in the case of patents byinventors from developing countries such as Brazil, China, Russia (de Rassenfosse et al., 2013).
8. We carried out the Hausman test to select between the Fixed and Random Effects Model. TheHausman Test tests the null hypothesis that the coefficients estimated by the Random EffectsEstimator are the same as the ones estimated by the Fixed Effects Estimator. If they are(insignificant P-value) then it is safe to use the Random Effects Model. However, if the P-value issignificant, then the Fixed Effects Model is used. We obtain a significant P-value for the estimatedequation, therefore justifying the use of the Fixed Effects Regression Model for our analysis.
9. A few drawbacks could be identified about the Patent Applications series used in this study. Firstof all, under PCT applications usually are of higher value, thus filtering out low value patents. As aresult, it may put developing economies at a disadvantage. Also, companies (particularly smallcompanies) are less likely to target foreign markets and mainly carry out inventions of localrelevance. Overlooking these local patents therefore precludes a full view of the inventive activityof developing countries. This could also be a possible reason for an insignificant coefficient in ourresult. Further, PCT counts could be highly correlated with other counts such as USPTO, EPO andtriadic. Therefore, as suggested by de Rassenfosse et al. (2013), the worldwide indicator thatimproves the measurement of inventive activity, especially in the case of emerging economies(because of no geographic bias and no filter on patent value) could be used to improve theestimation. However, as the main aim of this paper is not to focus on a detailed examination ofpatent counts, we tried to stick to using World Bank data to maintain a consistency for thecountries under study.
10. The United States is a large industrialised country, and greater magnitudes of output elasticities ofR-D spillovers embodied in OFDI and IFDI flows signify a much higher impact compared with othersmaller OECD investing partners. This is consistent with the findings of previous studies (VanPottelsberghe de la Potterie and Lichtenberg, 2001) that suggest a larger effect of FDI inducedR-D spillovers for larger economies such as G7 countries.
11. Other than studying a different set of countries, our paper also differs from Van Pottelsberghe dela Potterie and Lichtenberg (2001) in terms of the definition of the key spillover variable. Unlike ourstudy, they use a four year moving average of the flow of FDI. Also, the denominator of theirspillover term is gross fixed capital formation of country j, whereas we use GDP of country j. Thesefactors also explain differences in our results.
References
Aw, B.Y., X. Chen and M.J. Roberts (2001), “Firm-Level Evidence on Productivity Differentials, Turnover,and Exports in Taiwanese Manufacturing”, Journal of Development Economics 66, pp. 51-86.
Barba, N.G. and D. Castellani (2004), “Does Investing Abroad Affect Performance at Home? ComparingItalian Multinational and National Enterprises”, Centre for Economic Policy Research Discussion Paper,No. 4284.
Barro, R.J. and J.W. Lee (2001), “International Data on Educational Attainment: Updates andImplications”, Oxford Economic Papers 53, pp. 541-563.
Bera, Subhasis and Shikha Gupta (2009), “South-South FDI vs North-South FDI: A ComparativeAnalysis in the Context of India”, ICRIER Working Paper No. 238.
Bernard, A.B. and B.J. Jensen (1999), “Exceptional Exporter Performance: Cause, Effect, or Both?”, Journalof International Economics 47, pp. 1-25.
FOREIGN DIRECT INVESTMENT AND REVERSE TECHNOLOGY SPILLOVERS: THE EFFECT ON TOTAL FACTOR PRODUCTIVITY
OECD JOURNAL: ECONOMIC STUDIES - VOLUME 2014 © OECD 2015 149
Bitzer, J. and H. Gorg (2009), “Foreign Direct Investment, Competition and Industry Performance”, TheWorld Economy 32, pp. 21-233.
Bitzer, J. and M. Kerekes (2008), “Does Foreign Direct Investment Transfer Technology Across Borders?New Evidence”, Economics Letters 100, pp. 355-358.
Blomstrom, M. and A. Kokko (1998), “Multinational Corporations and Spillovers”, Journal of EconomicSurveys 12, pp. 1-31.
Bosworth, B., S.M. Collins and A. Virmani (2007), “Sources of Growth in the Indian Economy”, NBERWorking Paper Series, No. 12901.
Branstetter, L. (2006), “Is Foreign Direct Investment a Channel of Knowledge Spillovers? Evidence fromJapan’s FDI In The United States”, Journal of International Economics 68, pp. 325-344.
Clerides, S.K., S. Lach and J.R. Tybout (1998), “Is Learning by Exporting Important? Micro-DynamicEvidence from Colombia, Mexico, and Morocco”, Quarterly Journal of Economics 113, pp. 903-948.
Coe, D.T. and E. Helpman (1995), “International R-D Spillovers”, European Economic Review 39, pp. 859-887.
Coe, D.T., E. Helpman and A.W. Hoffmeister (1997), “North-South R-D Spillovers”, Economic Journal 107,pp. 134-149.
De Rassenfosse, G., H. Dernis, D. Guellec, L. Picci and B. van Pottelsberghe de la Potterie (2013), “TheWorldwide Count of Priority Patents: A New Indicator of Inventive Activity”, Research Policy 42,pp. 720-737.
Dernis, H., D. Guellec and B. Van Pottelsberghe de la Potterie (2001), “Using Patent Counts forCross-Country Comparisons of Technology Output”, STI Review 27, OECD Publishing, pp. 129-146.
Engelbrecht, H.J. (1997), “International R-D Spillovers, Human Capital and Productivity in OECDEconomies: An Empirical Investigation”, European Economic Review 41, pp. 1479-1488.
Goto, A. and K. Suzuki (1989), “R-D Capital, Rate of Return on R-D Investment and Spillovers of R-D inJapanese Manufacturing Industries”, Review of Economics and Statistics 71, pp. 555-564.
Govindarajan, V. and R. Ramamurti (2011), “Reverse Innovation, Emerging Markets, and GlobalStrategy”, Global Strategy Journal 1, pp. 191-205.
Griliches, Z. and F.R. Lichtenberg (1984), “Interindustry Technology Flows and Productivity Growth:A Reexamination”, Review of Economics and Statistics 65, pp. 324-329.
Guellec, D. and B. Van Pottelsberghe de la Potterie (2004), “From R-D to Productivity Growth: Do theInstitutional Settings and the Source of Funds of R-D Matter?”, Oxford Bulletin of Economics andStatistics 66, pp. 353-378.
Herzer, D. (2012), “Outward FDI, Total Factor Productivity and Domestic Output: Evidence fromGermany”, International Economic Journal 26, pp. 155-174.
Herzer, D. (2011), “The Long-Run Relationship between Outward FDI and Total Factor Productivity:Evidence for Developing Countries”, Proceedings of the German Development EconomicsConference, Berlin, No. 41, http://hdl.handle.net/10419/48299.
Huang, S. and Q. Wang (2009), “Reverse Technology Spillover from Outward FDI: The Case of China”,Proceedings of the International Conference on Management of e-Commerce and e-Government,pp. 550-553.
Keller, W. (1996), “Absorptive Capacity: On the Creation and Acquisition of Technology inDevelopment”, Journal of Development Economics 49, pp. 199-227.
Kimura, F. and K. Kiyota (2006), “Exports, FDI and Productivity: Dynamic Evidence from JapaneseFirms”, Review of World Economics 127, pp. 695-719.
Kwark, N.S. and Y.S. Shyn (2006), “International R-D Spillovers Revisited: Human Capital as anAbsorptive Capacity for Foreign Technology”, International Economic Journal 20, pp. 179-196.
Lall, S. (ed.) (1983), The New Multinationals: The Spread of Third World Enterprises, New York, John Wileyand Sons.
Lichtenberg, F.R. and B. Van Pottelsberghe de la Potterie (1998), “International R-D Spillovers:A Comment”, European Economic Review 42, pp. 1483-1491.
Makino, S., C.M. Lau and R.S. Yeh (2002), “Asset-Exploitation versus Asset-Seeking: Implications forLocation Choice of Foreign Direct Investment from Newly Industrialized Economies”, Journal ofInternational Business Studies 33, pp. 403-421.
FOREIGN DIRECT INVESTMENT AND REVERSE TECHNOLOGY SPILLOVERS: THE EFFECT ON TOTAL FACTOR PRODUCTIVITY
OECD JOURNAL: ECONOMIC STUDIES - VOLUME 2014 © OECD 2015150
Narula, R. and J. Michel (2009), “Reverse Knowledge Transfer and its Implications for European Policy”,UNU-Merit Working Paper Series, No. 2009-035.
Pedroni, P. (1999), “Critical Values for Cointegration Tests in Heterogeneous Panels with MultipleRegressors”, Oxford Bulletin of Economics and Statistics 61, pp. 653-670.
Pesaran, M.H., Y. Shin and R.J. Smith (2001), “Bound Testing Approaches to the Analysis of LevelRelationships”, Journal of Applied Econometrics 16, pp. 289-326.
Pradhan, J.P. and N. Singh (2009), “Outward FDI and Knowledge Flows: A Study of the IndianAutomotive Sector”, International Journal of Institutions and Economies 1, pp. 156-187.
Pradhan, J.P. (2006), “Rise of Service Sector and Outward Foreign Direct Investment from IndianEconomy: Trends, Patterns, and Determinants”, GITAM Journal of Management 4, pp. 70-97.
Tolentino, E.P. (1993), Technological Innovation and Third World Multinationals, London, Routledge.
UNCTAD (2007), Global Players from Emerging Markets: Strengthening Enterprise Competitiveness throughOutward Investment, New York and Geneva, United Nations.
UNCTAD (2006), World Investment Report 2006: FDI from Developing and Transition Economies: Implicationsfor Development, New York and Geneva, United Nations.
UNCTAD (2005), Issues note “Internationalization of Developing country Enterprises through OutwardForeign Direct Investment” (TD/B/COM.3/EM.26/2) prepared for the Expert Meeting on “Enhancingthe Productive Capacity of Developing Country Firms through Internationalization”, Geneva.
UNCTAC (2005), “Linkages, Value Chains and Outward Investment: Internationalization Patterns ofDeveloping Countries’ SMEs”, TD/B/COM.3/69.
UNCTAD (2005), “Policy Issues Related to Investment and Development: Emerging FDI from DevelopingCountries”, UNCTAD/TD/B/COM.2/64.
UNCTAD (2004), “India’s Outward FDI: A Giant Awakening?”, UNCTAD/DITE/IIAB/2004/1.
UNCTAD (2003), “China: An Emerging FDI Outward Investor”, UNCTAD/PRESS/EB/2003/08.
UNESCO (1993), Statistical Year Book.
Van Pottelsberghe de laPotterie, B. and F.R. Lichtenberg (2001), “Does Foreign Direct InvestmentTransfer Technology across Borders?”, The Review of Economics and Statistics 83, pp. 490-497.
Van Pottelsberghe de laPotterie, B. (1997), “Issues in Assessing the Effect of InterindustryR-D Spillovers”, Economic Systems Research 9, pp. 331-356.
Verma, R. (2008), “The Service Sector Revolution in India”, UNU-WIDER Research Paper, No. 2008/72.
Verspagen, B. (1997), “Measuring Intersectoral Spillovers: Estimates from the European and US PatentOffice Databases”, Economic Systems Research 9, pp. 47-66.
Vuori, S. (1997), “Interindustry Technology Flows and Productivity in Finnish Manufacturing”, EconomicSystems Research 9, pp. 67-80.
Wells, L.T. (1983), Third World Multinationals: The Rise of Foreign Investments from Developing Countries,Cambridge, MIT Press.
Zhao, W. and L. Liu (2008), “Outward Direct Investment and R-D Spillovers: China’s Case”, ConferenceProceeding of “Emerging Multinationals”: Outward Foreign Direct Investment from Emerging andDeveloping Economies.
Zhu, L. and B.N. Jeon (2007), “International R-D Spillovers: Trade, FDI, and Information Technology asSpillover Channels”, Review of International Economics 15, pp. 955-976.

FOREIGN DIRECT INVESTMENT AND REVERSE TECHNOLOGY SPILLOVERS: THE EFFECT ON TOTAL FACTOR PRODUCTIVITY
OECD JOURNAL: ECONOMIC STUDIES - VOLUME 2014 © OECD 2015 151
APPENDIX A
List of 18 emerging economies
Argentina
Brazil
Bulgaria
China
India
Indonesia
Latvia
Lithuania
Malaysia
Peru
Philippines
Romania
Russia
Singapore
South Africa
Thailand
Ukraine
Venezuela

FOREIGN DIRECT INVESTMENT AND REVERSE TECHNOLOGY SPILLOVERS: THE EFFECT ON TOTAL FACTOR PRODUCTIVITY
OECD JOURNAL: ECONOMIC STUDIES - VOLUME 2014 © OECD 2015152
APPENDIX B
List of 34 OECD countries
Australia
Austria
Belgium
Canada
Chile
Czech Republic
Denmark
Estonia
Finland
France
Germany
Greece
Hungary
Iceland
Ireland
Israel
Italy
Japan
Korea
Luxembourg
Mexico
Netherlands
New Zealand
Norway
Poland
Portugal
Slovak Republic
Slovenia
Spain
Sweden
Switzerland
Turkey
United Kingdom
United States
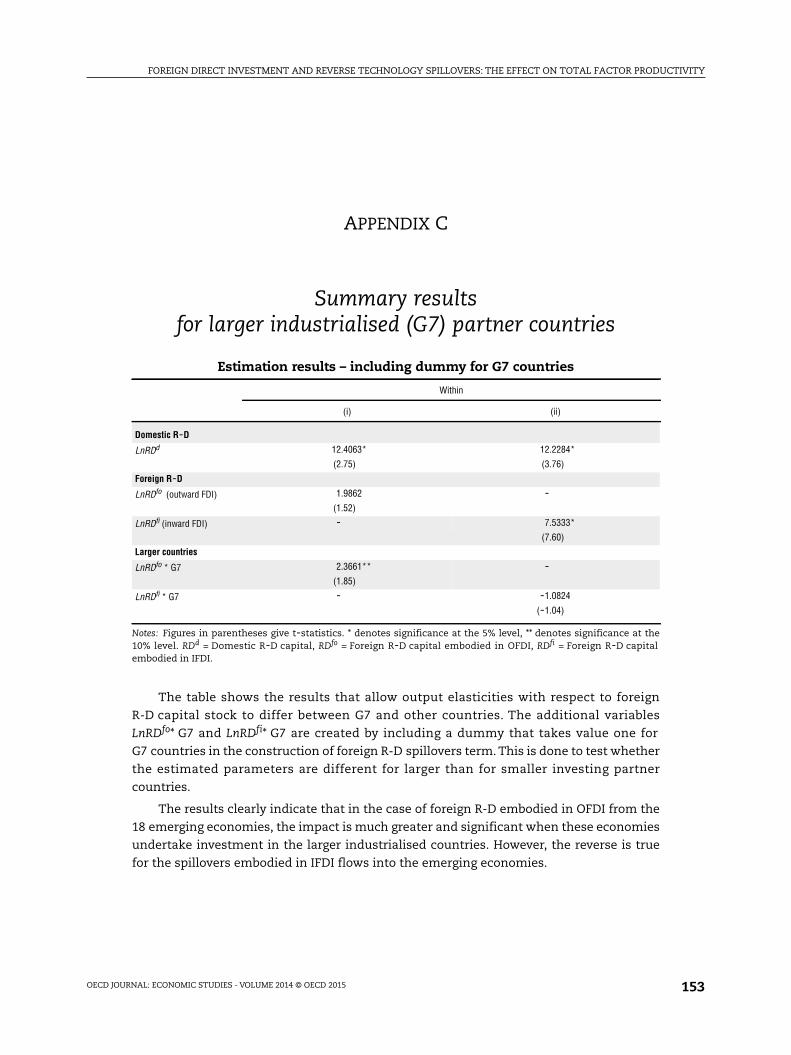
FOREIGN DIRECT INVESTMENT AND REVERSE TECHNOLOGY SPILLOVERS: THE EFFECT ON TOTAL FACTOR PRODUCTIVITY
OECD JOURNAL: ECONOMIC STUDIES - VOLUME 2014 © OECD 2015 153
APPENDIX C
Summary resultsfor larger industrialised (G7) partner countries
The table shows the results that allow output elasticities with respect to foreign
R-D capital stock to differ between G7 and other countries. The additional variables
LnRDfo* G7 and LnRDfi* G7 are created by including a dummy that takes value one for
G7 countries in the construction of foreign R-D spillovers term. This is done to test whether
the estimated parameters are different for larger than for smaller investing partner
countries.
The results clearly indicate that in the case of foreign R-D embodied in OFDI from the
18 emerging economies, the impact is much greater and significant when these economies
undertake investment in the larger industrialised countries. However, the reverse is true
for the spillovers embodied in IFDI flows into the emerging economies.
Estimation results – including dummy for G7 countries
Within
(i) (ii)
Domestic R-D
LnRDd 12.4063* 12.2284*
(2.75) (3.76)
Foreign R-D
LnRDfo (outward FDI) 1.9862 -(1.52)
LnRDfi (inward FDI) - 7.5333*
(7.60)
Larger countries
LnRDfo * G7 2.3661** -(1.85)
LnRDfi * G7 - -1.0824
(-1.04)
Notes: Figures in parentheses give t-statistics. * denotes significance at the 5% level, ** denotes significance at the10% level. RDd = Domestic R-D capital, RDfo = Foreign R-D capital embodied in OFDI, RDfi = Foreign R-D capitalembodied in IFDI.


