Forecasts in the line of balance - Lean Construction - DK
23
2003© Prof. Jouko kankainen, Olli Seppänen Presented at the 11th Annual Meeting of the International Group for Lean Construction Blacksburg, Virginia. July 2003 Authors and background System overview Case: The Kamppi Center Future research
Transcript of Forecasts in the line of balance - Lean Construction - DK
2003© Prof. Jouko kankainen, Olli Seppänen
Presented at the 11th Annual Meeting of the International Group for Lean Construction
Blacksburg, Virginia. July 2003
������������� ����������������������������������
� Authors and background
� System overview
� Case: The Kamppi Center
� Future research

2003© Prof. Jouko kankainen, Olli Seppänen
Presented at the 11th Annual Meeting of the International Group for Lean Construction
Blacksburg, Virginia. July 2003
���������� ��������
Development background:
� Before DYNAProject™, there was a Line-of-Balance software on market which allowed conversion of Gantt Chart into Line-of-Balance
� DYNAProject™ was developed to replace the previous scheduling software
� Four big Finnish construction companies participated in the development work (June 2001 – August 2002)
References:
� More than 200 new users in year 2003
� All leading construction companies in Finland, many small ones too
� Previous scheduling software is being replaced
Research background:
� Use of Line-of-Balance began in Finland in 1980s (HUT)
� Wide adoption in Finland by 1985
� Now used by almost every construction company
Authors:
Professor Jouko Kankainen:
� Helsinki University of Technology
� Construction Economics and Management
� http://www.cem.hut.fi
Olli Seppänen (Ph.D. student):
� Operations research background
� Technology manager / DSS Inc.
� http://www.dynassol.com
DYNAProjectLine-of-Balance based schedule planning and control system
2003© Prof. Jouko kankainen, Olli Seppänen
Presented at the 11th Annual Meeting of the International Group for Lean Construction
Blacksburg, Virginia. July 2003
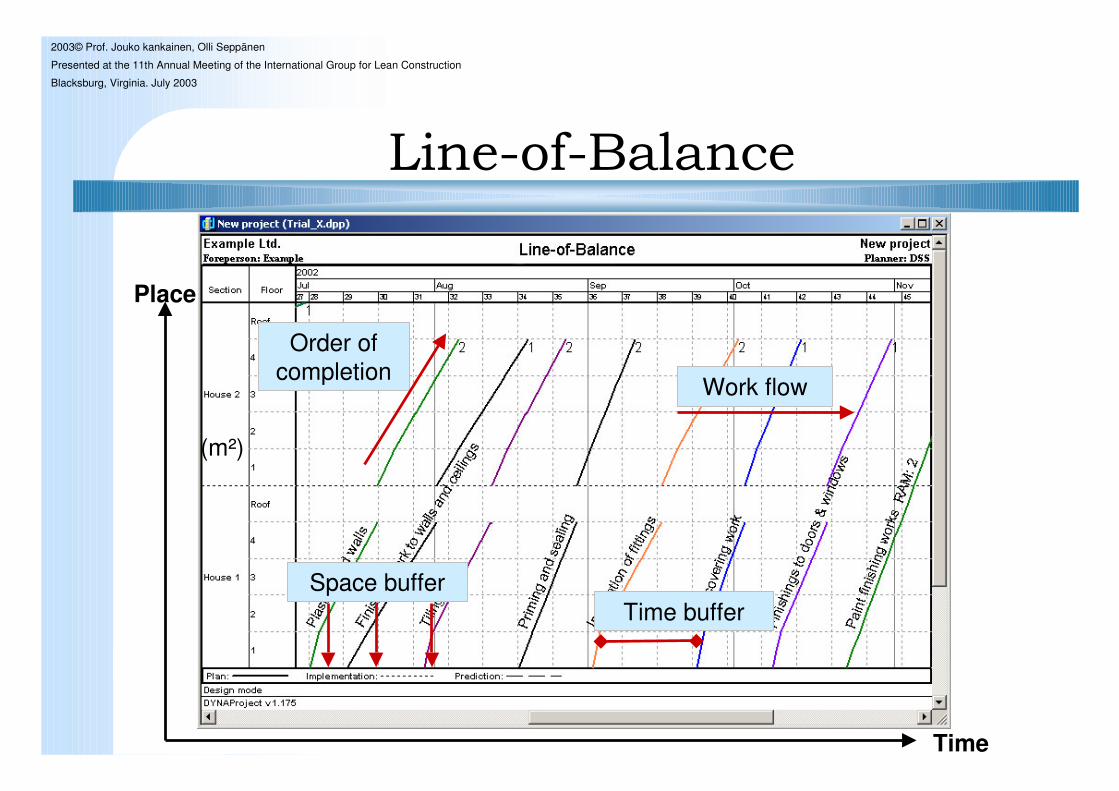
������������
Place
Work flow
Order of completion
(m²)
Space buffer
Time
Time buffer

2003© Prof. Jouko kankainen, Olli Seppänen
Presented at the 11th Annual Meeting of the International Group for Lean Construction
Blacksburg, Virginia. July 2003
������������ !
A comprehensive time management system for construction projects� Schedule planning
� Risk analysis
� Monitoring and control
� Reuse of completion data

2003© Prof. Jouko kankainen, Olli Seppänen
Presented at the 11th Annual Meeting of the International Group for Lean Construction
Blacksburg, Virginia. July 2003
"��#�$���%�����"������&�'��'��(
� Site location: Helsinki, Finland
� Project management by SRV ViitosetLtd.
� One of the largest single city centerprojects in Europe
� Cost estimate: �2.5 billion
� Schedule: 2002-2006
� DYNAProject is currently being usedin schedule planning and control of the Kamppi Center
6th of June 2003

2003© Prof. Jouko kankainen, Olli Seppänen
Presented at the 11th Annual Meeting of the International Group for Lean Construction
Blacksburg, Virginia. July 2003
"��#�$���%�����"������&�'��'��(
Retail offices and shops
Kamppi Park square
Pedestrian walkways for hotel
Kamppi market square
Lasipalatsi square
Pedestrian street
Bus station (city of Espoo)
Street level: Underground:
Central bus station
Retail outlets
Walk ways to city centre
Connection to subway
Department store
2003© Prof. Jouko kankainen, Olli Seppänen
Presented at the 11th Annual Meeting of the International Group for Lean Construction
Blacksburg, Virginia. July 2003
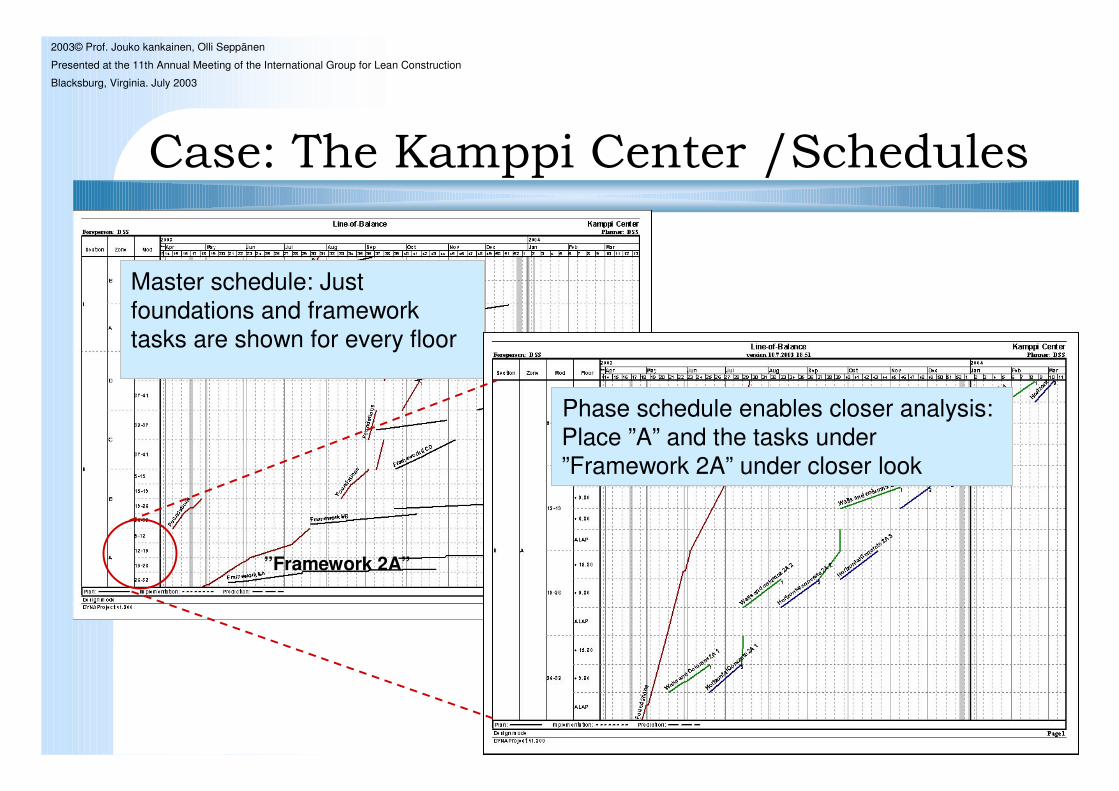
"��#�$���%�����"������&)�������
Master schedule: Just foundations and framework tasks are shown for every floor
”Framework 2A”
Phase schedule enables closer analysis: Place ”A” and the tasks under”Framework 2A” under closer look

2003© Prof. Jouko kankainen, Olli Seppänen
Presented at the 11th Annual Meeting of the International Group for Lean Construction
Blacksburg, Virginia. July 2003
"��#�$���%�����"������&�"�����
Control chart shows task status: ”Foundations” task is running late in some floors
Forecasts show the expected delay of ”Foundations”
Alarm symbols show places where control actions are needed
2003© Prof. Jouko kankainen, Olli Seppänen
Presented at the 11th Annual Meeting of the International Group for Lean Construction
Blacksburg, Virginia. July 2003
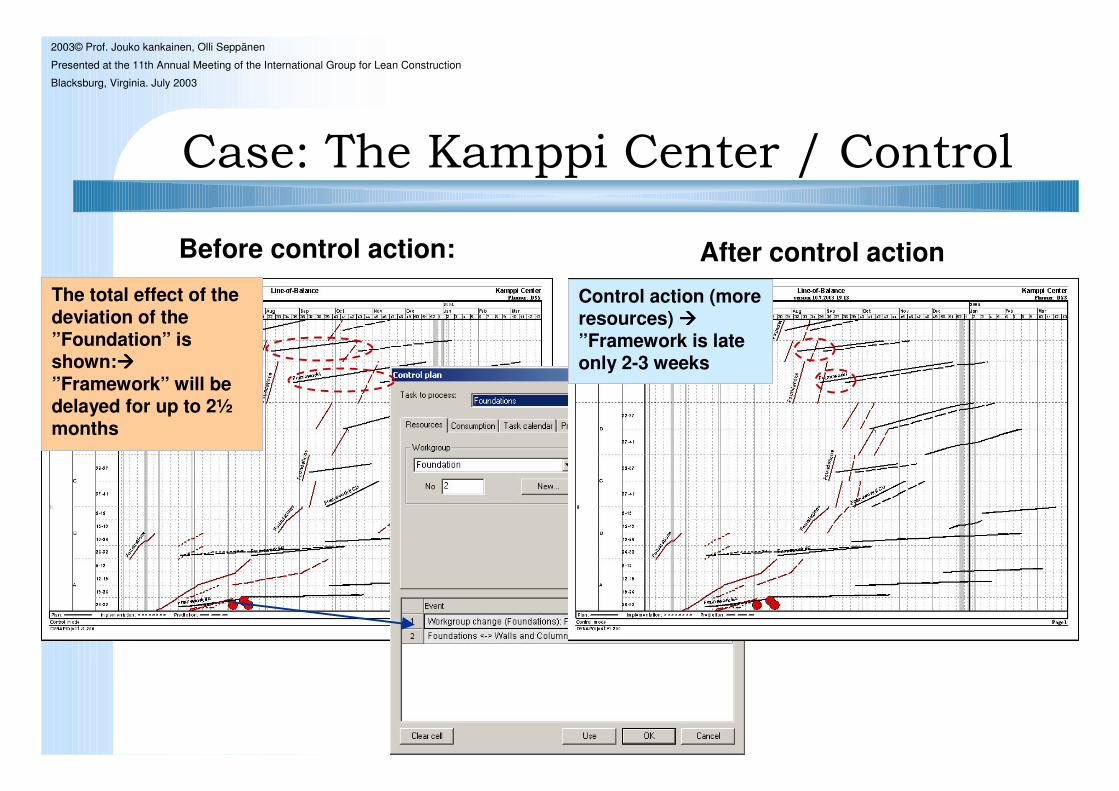
"��#�$���%�����"������&�"�����
Before control action:
Control action (more resources) ����”Framework is late only 2-3 weeks
The total effect of the deviation of the ”Foundation” is shown:����”Framework” will be delayed for up to 2½months
After control action

2003© Prof. Jouko kankainen, Olli Seppänen
Presented at the 11th Annual Meeting of the International Group for Lean Construction
Blacksburg, Virginia. July 2003
��������
Improved schedule planning� Control of work groups
� Evaluation of low cost / risk alternatives
� Continuous tasks
� Schedule compression � less overhead costs
� Integrated procurement schedule
� Less risk in the schedule
� Time and cost savings
Effective project control� Graphical control features
� Total effects of deviations shown
� Optimal control actions in case of deviations
� More effective project control� Increased productivity
� Less hurried work or waiting hours
� Schedule can be implemented as planned
Software benefits� All the tools needed in planning and controlling the schedule
� Easy to use graphical features
� Designed by industry experts, tested and used by project personnel

2003© Prof. Jouko kankainen, Olli Seppänen
Presented at the 11th Annual Meeting of the International Group for Lean Construction
Blacksburg, Virginia. July 2003
*���������
More than 200 new users during 2003! “DYNAProject1.2™ improves project control and thus increases productivity. The schedule situation of the project can be seen at a glance!”
Vesa Tähti, Vice President, Skanska Finland
“DYNAProject1.2™ is an innovation, which benefits the whole construction industry. Better schedule planning and control enables substantial cost savings.”
Jukka Pekkanen, Technology manager, RT (Confederation of Finnish Construction industries)
2003© Prof. Jouko kankainen, Olli Seppänen
Presented at the 11th Annual Meeting of the International Group for Lean Construction
Blacksburg, Virginia. July 2003
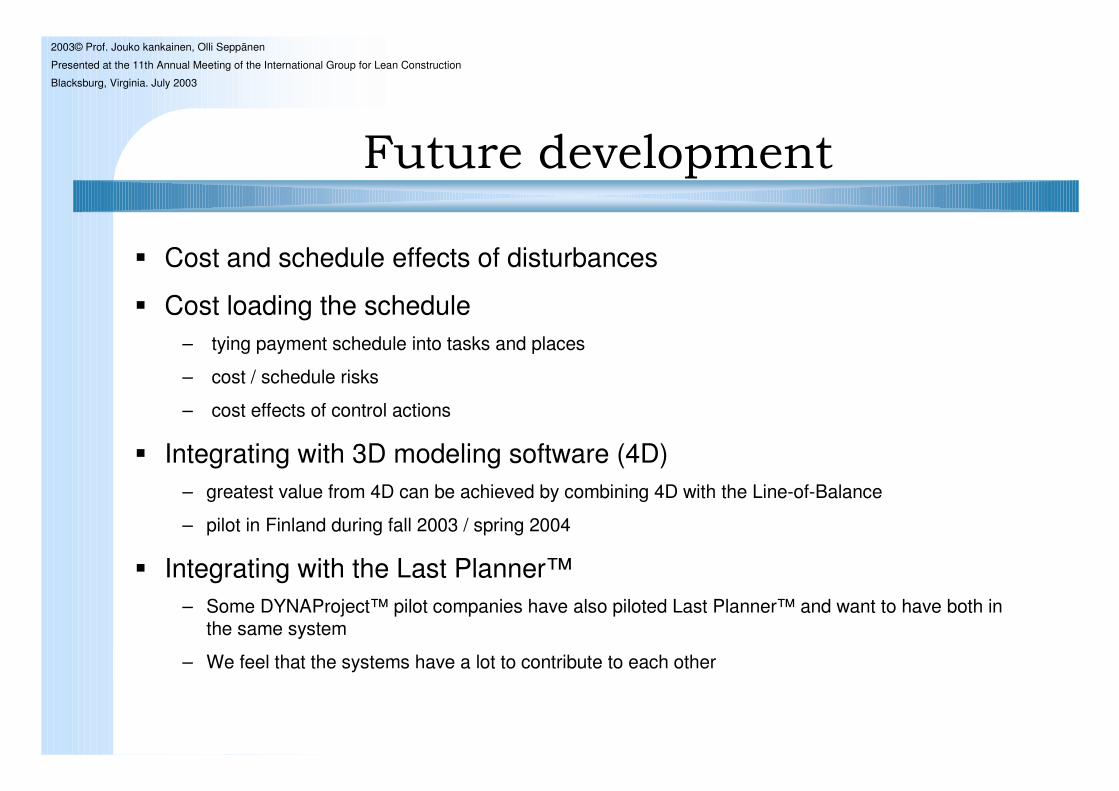
+��������'���� ���
� Cost and schedule effects of disturbances
� Cost loading the schedule– tying payment schedule into tasks and places
– cost / schedule risks
– cost effects of control actions
� Integrating with 3D modeling software (4D)– greatest value from 4D can be achieved by combining 4D with the Line-of-Balance
– pilot in Finland during fall 2003 / spring 2004
� Integrating with the Last Planner™– Some DYNAProject™ pilot companies have also piloted Last Planner™ and want to have both in
the same system
– We feel that the systems have a lot to contribute to each other

2003© Prof. Jouko kankainen, Olli Seppänen
Presented at the 11th Annual Meeting of the International Group for Lean Construction
Blacksburg, Virginia. July 2003
������������
� Complete system demonstration during the conference on request
� Q & A

2003© Prof. Jouko kankainen, Olli Seppänen
Presented at the 11th Annual Meeting of the International Group for Lean Construction
Blacksburg, Virginia. July 2003
Bill of materials
,�������)��������������
Total control of work and workgroups
Planning based on the graphical Line-of-Balance� Tasks under construction at any time
� Location of tasks
� Effects of tasks on each other
Line-of-Balance schedule
Task information
2003© Prof. Jouko kankainen, Olli Seppänen
Presented at the 11th Annual Meeting of the International Group for Lean Construction
Blacksburg, Virginia. July 2003
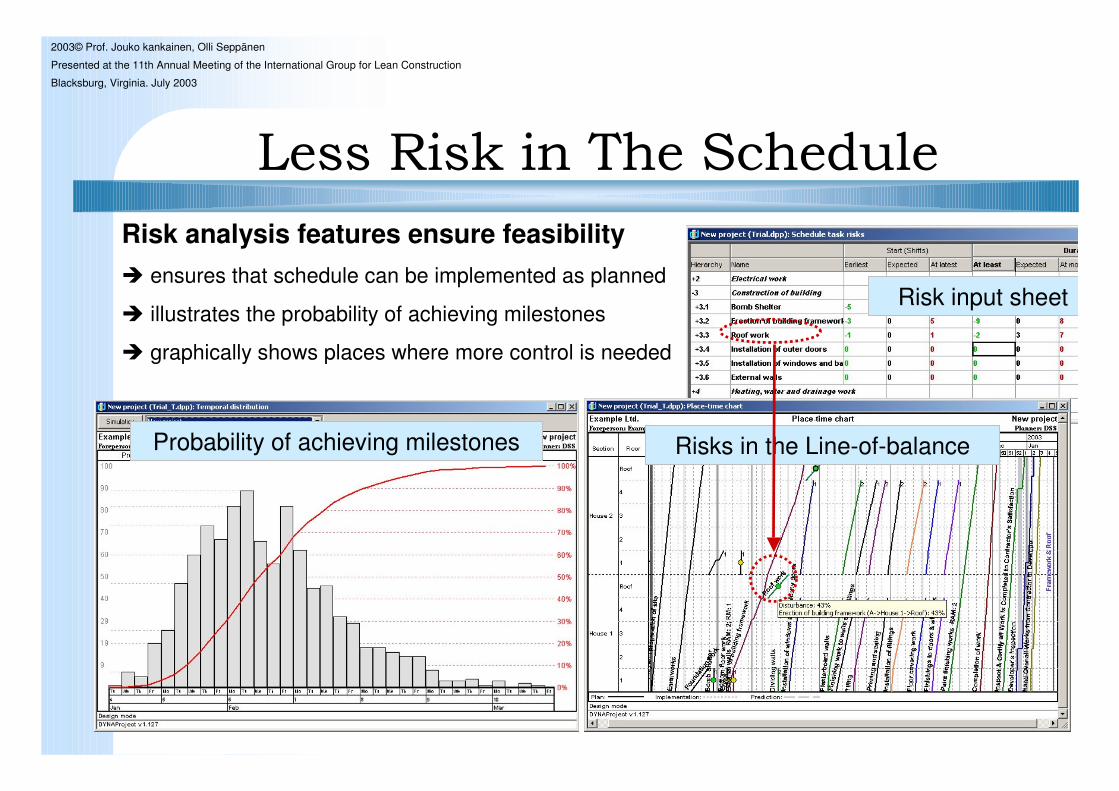
�����*�������$���)�������
Risk analysis features ensure feasibility� ensures that schedule can be implemented as planned
� illustrates the probability of achieving milestones
� graphically shows places where more control is needed
Risk input sheet
Risks in the Line-of-balanceProbability of achieving milestones

2003© Prof. Jouko kankainen, Olli Seppänen
Presented at the 11th Annual Meeting of the International Group for Lean Construction
Blacksburg, Virginia. July 2003
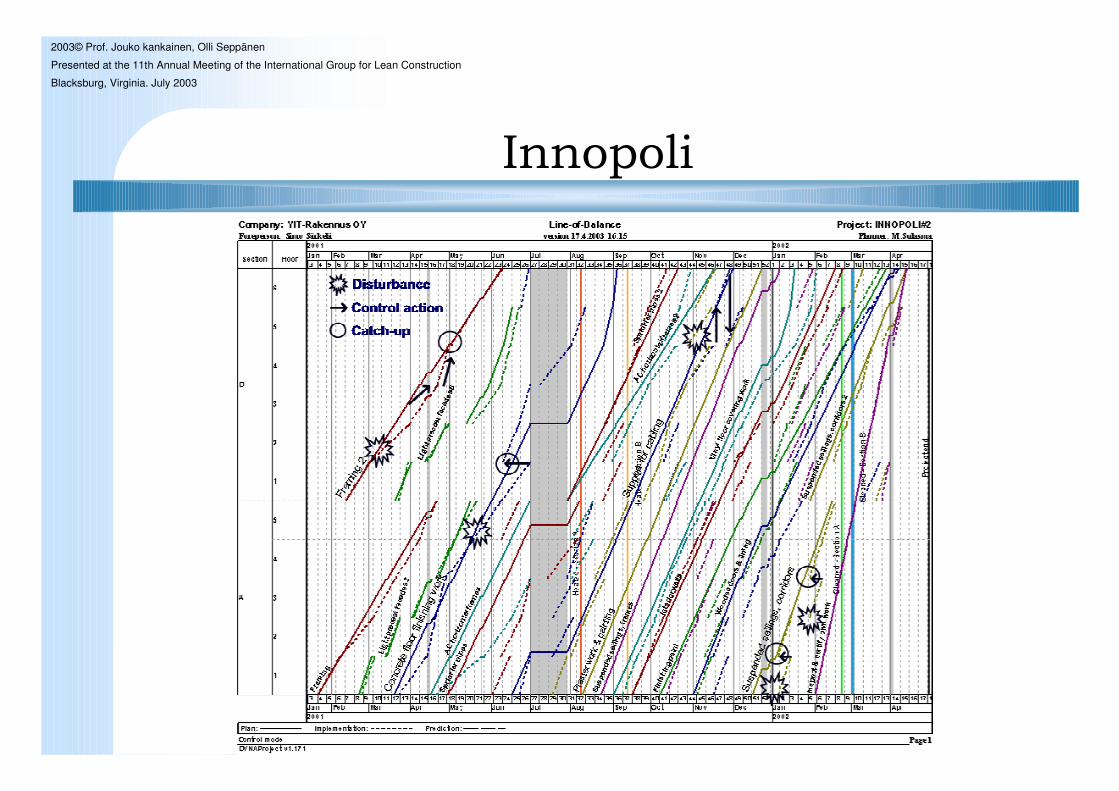
*������������������������
Risk analysis indicates places where more control is needed

2003© Prof. Jouko kankainen, Olli Seppänen
Presented at the 11th Annual Meeting of the International Group for Lean Construction
Blacksburg, Virginia. July 2003
,������'����������"������
The use of control charts � makes monitoring and control easy and effective
Forecasts in the line of balance � graphically illustrate the total effects of deviation
� prompt for corrective measures
The control chart for completions input, also works as a status report
Alarm
Forecast
Actual

2003© Prof. Jouko kankainen, Olli Seppänen
Presented at the 11th Annual Meeting of the International Group for Lean Construction
Blacksburg, Virginia. July 2003
"������"���
Task status shown in different colors in
the control chart
Completion based forecasts are shown in the Line-of-Balance.

2003© Prof. Jouko kankainen, Olli Seppänen
Presented at the 11th Annual Meeting of the International Group for Lean Construction
Blacksburg, Virginia. July 2003
"��������������������
Optimal control actions are planned to achieve the original schedule if deviations occur
Control actions
Plan
Forecast: task is late due to delay in previous task
Alarm: control action needed
2003© Prof. Jouko kankainen, Olli Seppänen
Presented at the 11th Annual Meeting of the International Group for Lean Construction
Blacksburg, Virginia. July 2003
-������

2003© Prof. Jouko kankainen, Olli Seppänen
Presented at the 11th Annual Meeting of the International Group for Lean Construction
Blacksburg, Virginia. July 2003
$�������������
� In the Finnish system there are three features with which the fulfillment of starting prerequisites are ensured
– schedule’s sensitivity to disturbance
– procurement schedule
– task plan» cost objective» master schedule task exploded» quality objectives and checking of design» resources» safety
� By combining task plans, it is possible to do look-ahead planning with DYNAProject (for example all the task plans for the next 6 weeks)

2003© Prof. Jouko kankainen, Olli Seppänen
Presented at the 11th Annual Meeting of the International Group for Lean Construction
Blacksburg, Virginia. July 2003
$���������
Master schedule task ”Floor covering works” exploded

2003© Prof. Jouko kankainen, Olli Seppänen
Presented at the 11th Annual Meeting of the International Group for Lean Construction
Blacksburg, Virginia. July 2003
�������� �����������
Procurement events that have not been completed are shown with red color