W · IOUISHELLI~, SR It ('~h2-- 1942) Louis and Lena Helling Iived on Pike St. in Mar
date post
21-Dec-2015Category
view
214download
0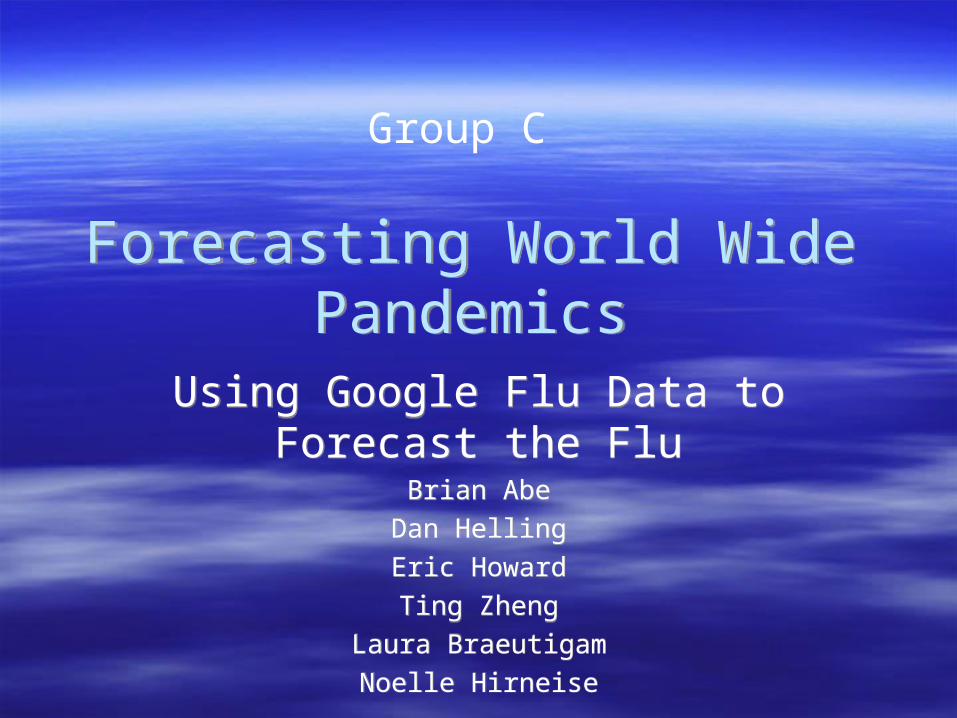
Forecasting World Wide Pandemics
Forecasting World Wide Pandemics
Using Google Flu Data to Forecast the Flu
Brian Abe
Dan Helling
Eric Howard
Ting Zheng
Laura Braeutigam
Noelle Hirneise
Using Google Flu Data to Forecast the Flu
Brian Abe
Dan Helling
Eric Howard
Ting Zheng
Laura Braeutigam
Noelle Hirneise
Group C

Preview of Coming AttractionsPreview of Coming Attractions
Introduction The Data Our Best Model Verifying The Model Comparing Our Model with Real Data Conclusions
Introduction The Data Our Best Model Verifying The Model Comparing Our Model with Real Data Conclusions

BackgroundBackground
The Flu– Generalization for multiple different viruses– Responsible for
Respiratory illness Up to 500,000 deaths world wide per year
– Virus is able to flourish in those with weaker immune systems Young Elderly Sick
The Flu– Generalization for multiple different viruses– Responsible for
Respiratory illness Up to 500,000 deaths world wide per year
– Virus is able to flourish in those with weaker immune systems Young Elderly Sick

BackgroundBackground
Conventional methods for forecasting possible medical catastrophes– Step 1 – Patient realizes they are sick– Step 2 – Patient makes a medical appt.– Step 3 – Patient goes to appointment and is
diagnosed– Step 4 – Medical professional sends data to
CDC
Conventional methods for forecasting possible medical catastrophes– Step 1 – Patient realizes they are sick– Step 2 – Patient makes a medical appt.– Step 3 – Patient goes to appointment and is
diagnosed– Step 4 – Medical professional sends data to
CDC
The Future is GoogleThe Future is Google
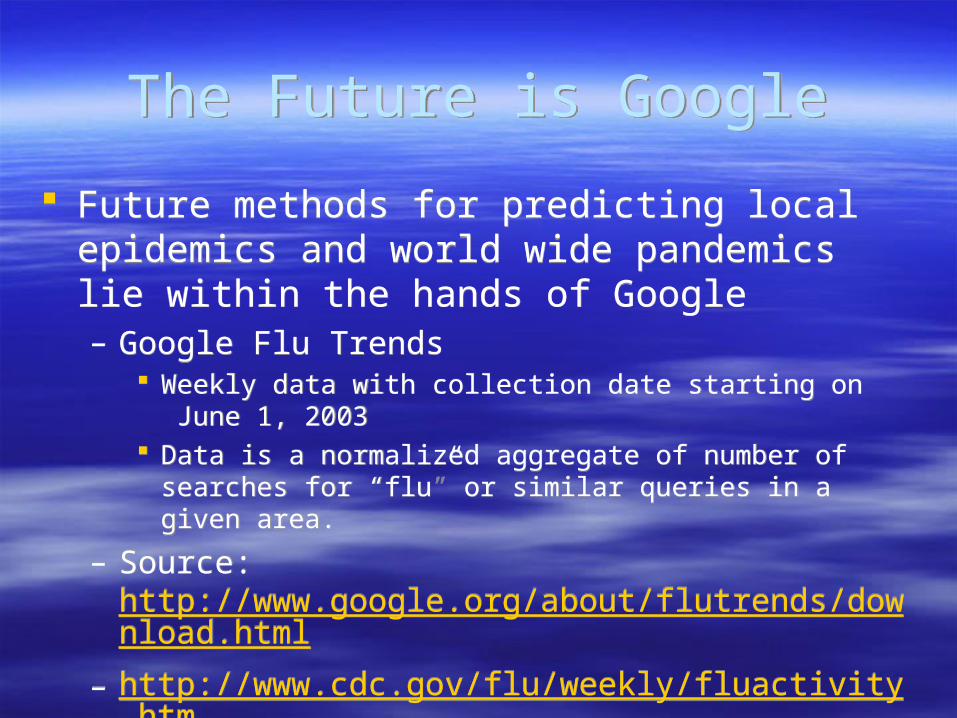
Future methods for predicting local epidemics and world wide pandemics lie within the hands of Google– Google Flu Trends
Weekly data with collection date starting on June 1, 2003 Data is a normalized aggregate of number of searches for “flu”
or similar queries in a given area.
– Source: http://www.google.org/about/flutrends/download.html
– http://www.cdc.gov/flu/weekly/fluactivity.htm

Google Flu TrendsGoogle Flu Trends
Idea behind the project was to predict pandemics and epidemics faster than conventional methods
Early detection could lead to a lower rate of infection and subsequent number of deaths
Could save you and your families lives someday
Idea behind the project was to predict pandemics and epidemics faster than conventional methods
Early detection could lead to a lower rate of infection and subsequent number of deaths
Could save you and your families lives someday
Google Flu TrendsGoogle Flu Trends
The Future of Forecasting– Step 1: The sick realize they are sick– Step 2: Patient “Googles” their symptoms– Step 3: Data is aggregated and sent to the
CDC
The Future of Forecasting– Step 1: The sick realize they are sick– Step 2: Patient “Googles” their symptoms– Step 3: Data is aggregated and sent to the
CDC
Pitfalls of the DataPitfalls of the Data
Everyone does not have the internet Everyone does not know how to use the
internet Everyone does not use Google (≈18%) New strains of virus, such as H1N1 may not
behave similarly to former strains– This may or may not be an issue
Everyone does not have the internet Everyone does not know how to use the
internet Everyone does not use Google (≈18%) New strains of virus, such as H1N1 may not
behave similarly to former strains– This may or may not be an issue
HypothesisHypothesis
Google data on the flu can be used to forecast future outbreaks of the flu
Google data on the flu can be used to forecast future outbreaks of the flu

The DataThe Data Trace shows serious seasonality Notice the spike in 2003 from increased
number of searches due to bird flu scare
Trace shows serious seasonality Notice the spike in 2003 from increased
number of searches due to bird flu scare

The DataThe Data Histogram of the data – definitely not
normally distributed with huge Jarque-Bera Stat
Histogram of the data – definitely not normally distributed with huge Jarque-Bera Stat
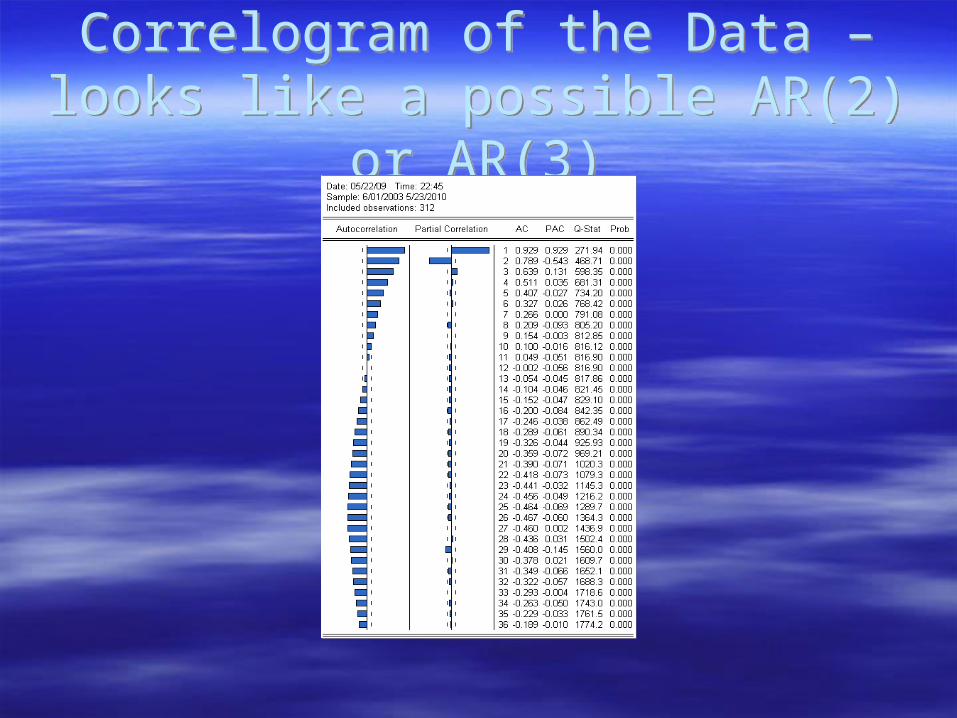
Correlogram of the Data – looks like a possible AR(2) or AR(3)
Correlogram of the Data – looks like a possible AR(2) or AR(3)

The DataThe Data Unit-Root test – significant at the 1% level
but not conclusive Unit-Root test – significant at the 1% level
but not conclusive

Seasonal Differencing was done to make the data more stationary:
Seasonal Differencing was done to make the data more stationary:
SDUS=US-US(-52)
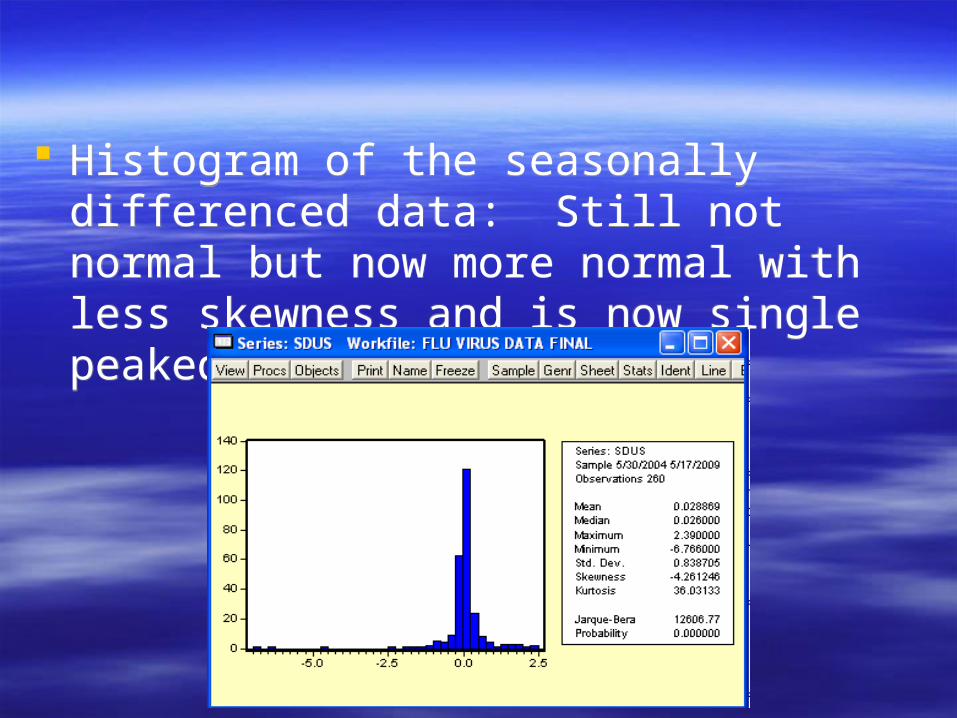
Histogram of the seasonally differenced data: Still not normal but now more normal with less skewness and is now single peaked.
Histogram of the seasonally differenced data: Still not normal but now more normal with less skewness and is now single peaked.

The DataThe Data Correlogram of the seasonal difference –
looks like an AR(2) Correlogram of the seasonal difference –
looks like an AR(2)
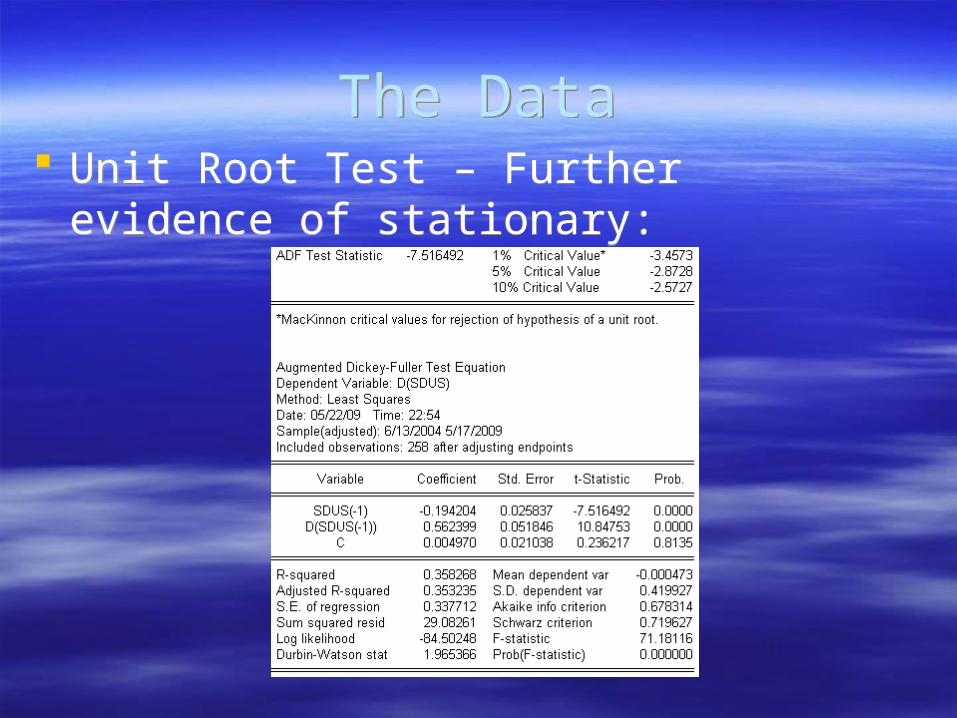
The DataThe Data Unit Root Test – Further evidence of
stationary: Unit Root Test – Further evidence of
stationary:
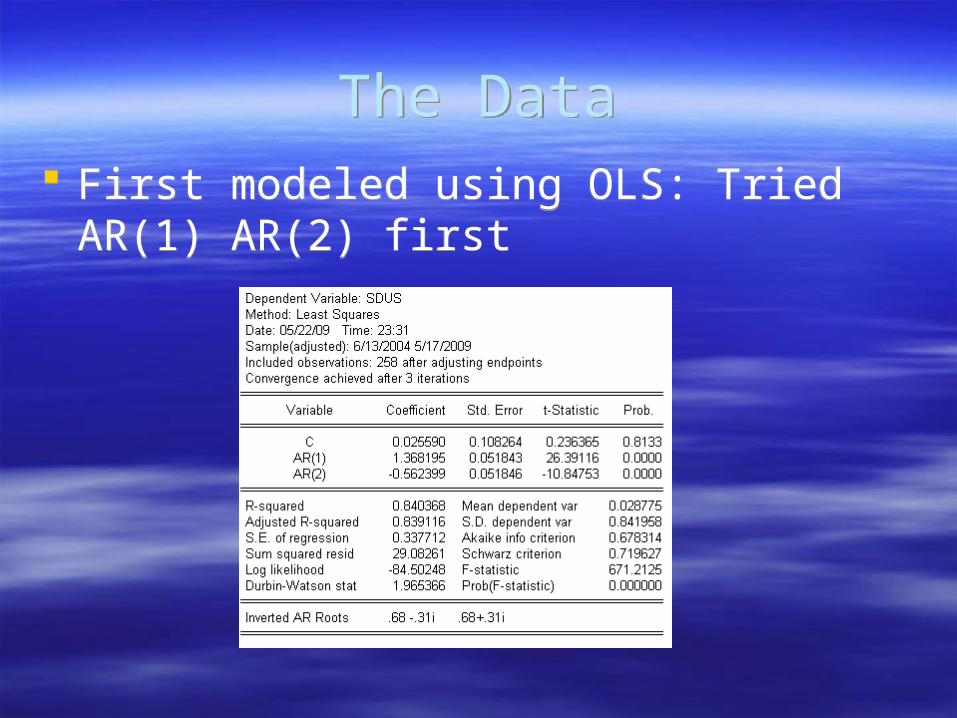
The DataThe Data First modeled using OLS: Tried AR(1) AR(2)
first First modeled using OLS: Tried AR(1) AR(2)
first

The DataThe Data Correlogram – orthogonal Correlogram – orthogonal

The DataThe Data Histogram of the residuals – highly kurtotic
and negatively skewed. Histogram of the residuals – highly kurtotic
and negatively skewed.

The DataThe Data Serial correlation test – no serial correlation
detected. Serial correlation test – no serial correlation
detected.

The DataThe Data Correlogram of SQ residuals – shows some
significance: Correlogram of SQ residuals – shows some
significance:

The DataThe Data Test for Autoregressive Heteroskedasticity –
positive for ARCH: Test for Autoregressive Heteroskedasticity –
positive for ARCH:

The DataThe Data Trace of the squared residuals – shows
spikes meaning ARCH is present: Trace of the squared residuals – shows
spikes meaning ARCH is present:

The DataThe Data ARCH GARCH model used: ARCH GARCH model used:

The DataThe Data Correlogram of the residuals – now not
orthogonal: Correlogram of the residuals – now not
orthogonal:

The DataThe Data Correlogram of squared residuals – now
orthogonal: Correlogram of squared residuals – now
orthogonal:

The DataThe Data Histogram of ARCH GARCH residuals – far
less kurtosis and skewness and closer to being normally distributed than before:
Histogram of ARCH GARCH residuals – far less kurtosis and skewness and closer to being normally distributed than before:

The DataThe Data
Test for ARCH is no longer significant: Test for ARCH is no longer significant:

The DataThe Data
Looking back at the OLS estimates and correlogram, there is a spike at lag 9 which could be significant so we added an MA(9) term to see if it would orthogonalize the correlogram in the ARCH GARCH model.
Looking back at the OLS estimates and correlogram, there is a spike at lag 9 which could be significant so we added an MA(9) term to see if it would orthogonalize the correlogram in the ARCH GARCH model.
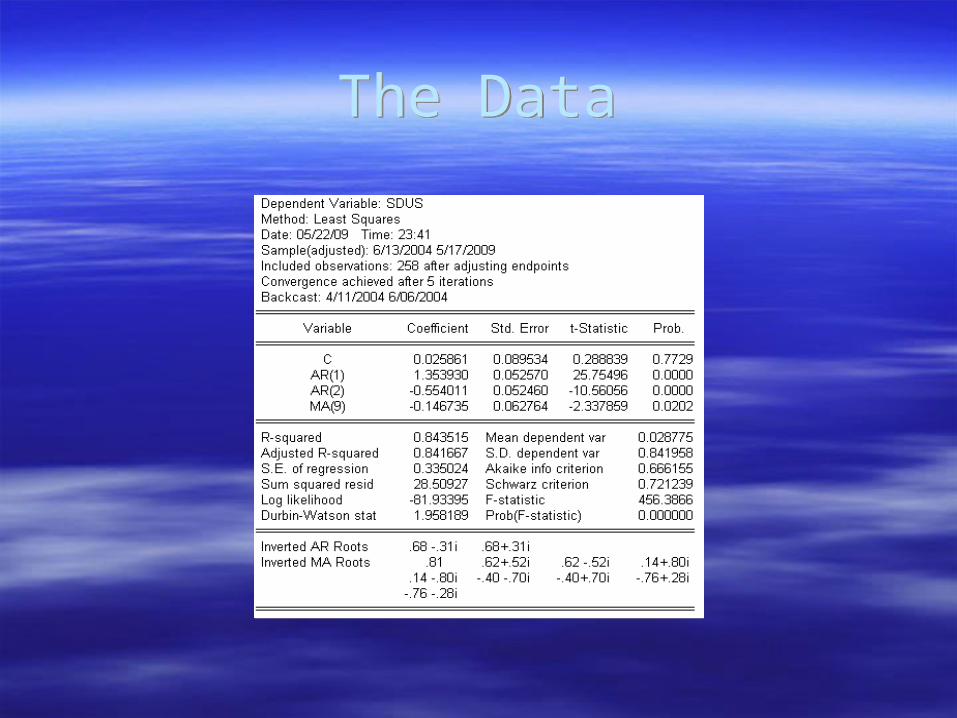
The DataThe Data
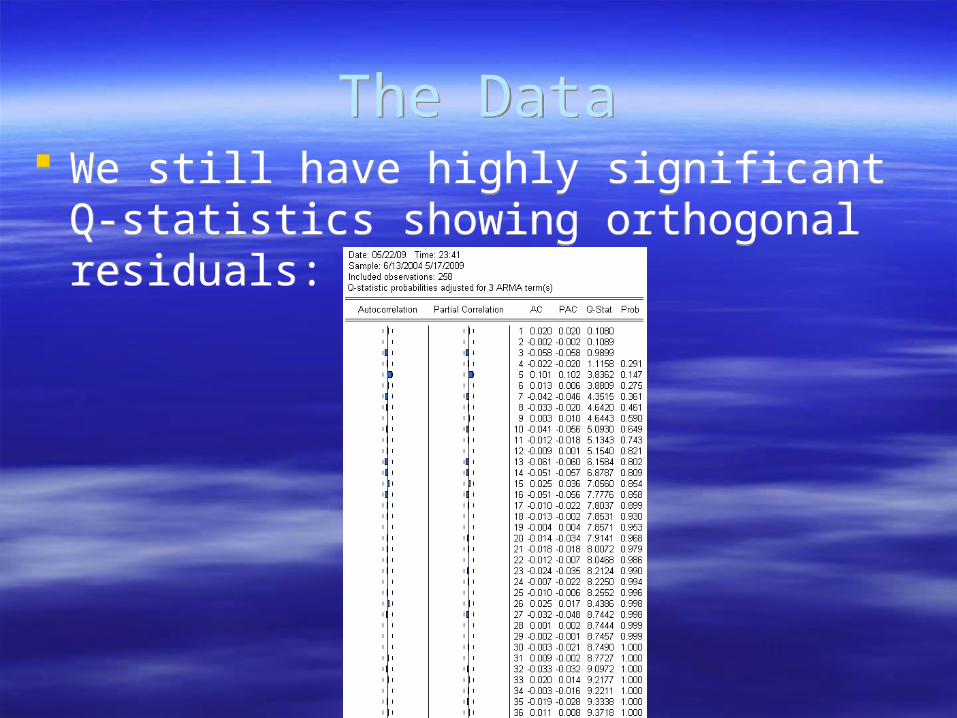
The DataThe Data We still have highly significant Q-statistics
showing orthogonal residuals: We still have highly significant Q-statistics
showing orthogonal residuals:

The DataThe Data Still a positive test for ARCH: Still a positive test for ARCH:

The DataThe Data ARCH GARCH model estimated: ARCH GARCH model estimated:

The DataThe Data Now the residuals are orthogonal at all
visible lags: Now the residuals are orthogonal at all
visible lags:

The DataThe Data Squared residual correlogram is also
significant: Squared residual correlogram is also
significant:

The DataThe Data
Histogram of the residuals – still single peaked, slightly skewed and kurtotic:
Histogram of the residuals – still single peaked, slightly skewed and kurtotic:

The DataThe Data
No longer a positive test for ARCH: No longer a positive test for ARCH:
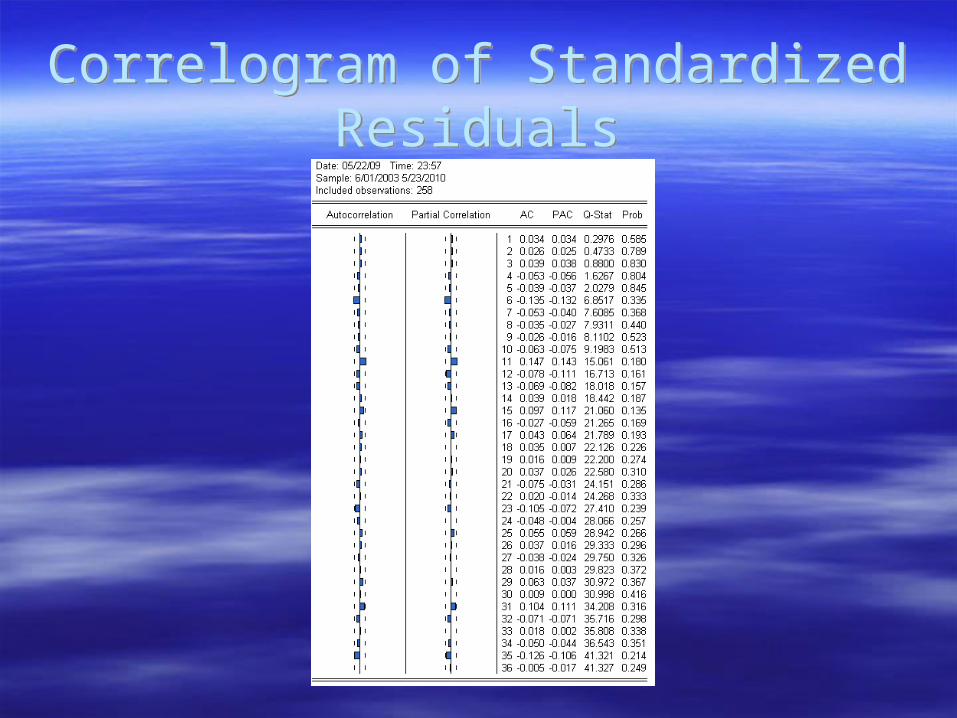
Correlogram of Standardized Residuals
Correlogram of Standardized Residuals

Correlogram of Resid SquaredCorrelogram of Resid Squared

Garch TraceGarch Trace

Garch HistogramGarch Histogram
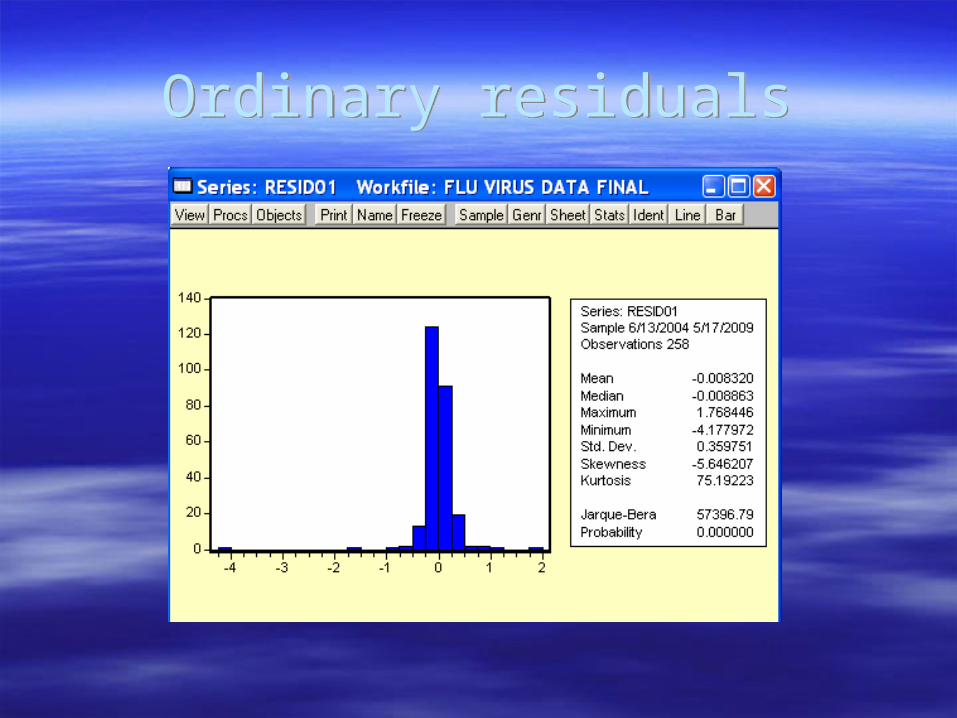
Ordinary residualsOrdinary residuals

Standardized residualsStandardized residuals Lower Kurtosis Lower Kurtosis

1 Forecast with 1 Year Time Saved 1 Forecast with 1 Year Time Saved Good fit Good fit

95% Confidence Interval Included95% Confidence Interval Included

Recolored Forecast With One Year Saved
Recolored Forecast With One Year Saved
Looks like a really good fit! Looks like a really good fit!
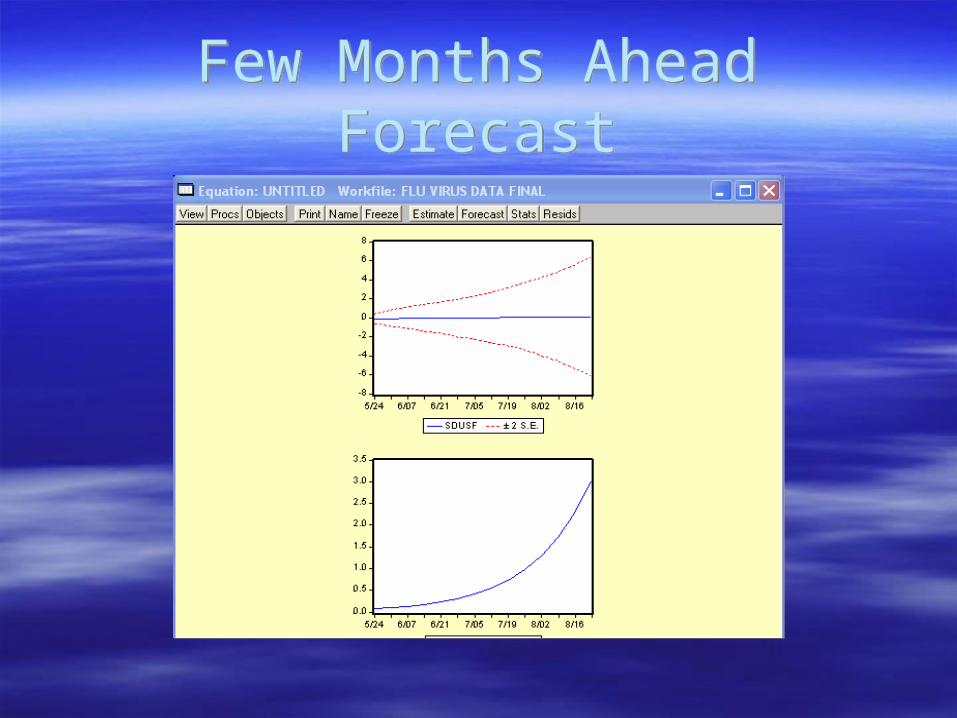
Few Months Ahead ForecastFew Months Ahead Forecast

Few months ahead forecast with 95% confidence interval included:Few months ahead forecast with 95% confidence interval included:

Recolored forecast with confidence interval included:
Recolored forecast with confidence interval included:
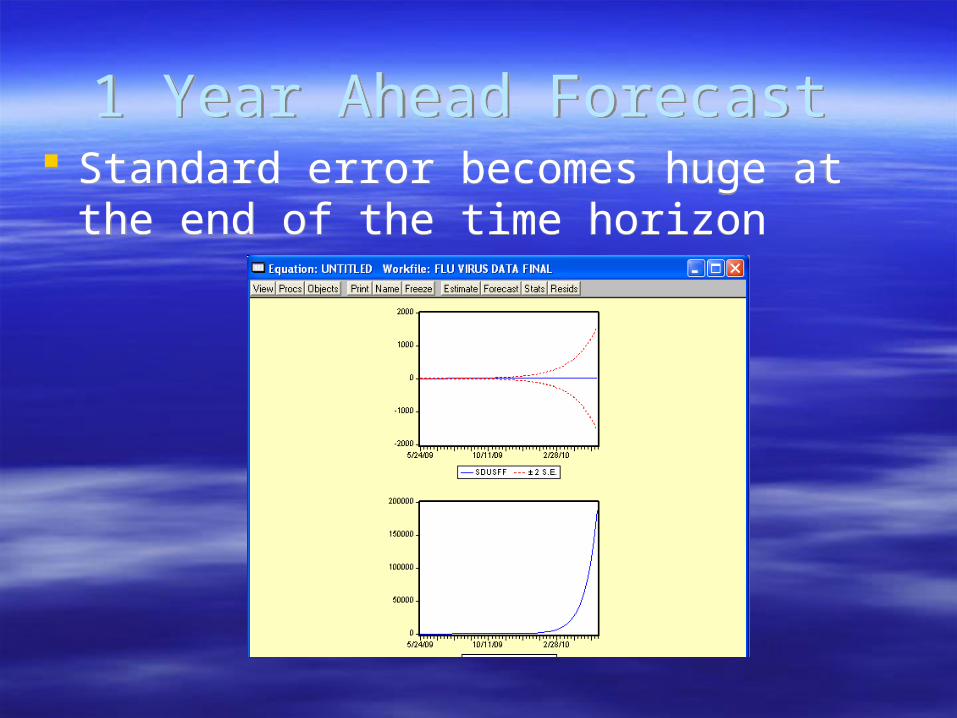
1 Year Ahead Forecast 1 Year Ahead Forecast Standard error becomes huge at the end of
the time horizon Standard error becomes huge at the end of
the time horizon
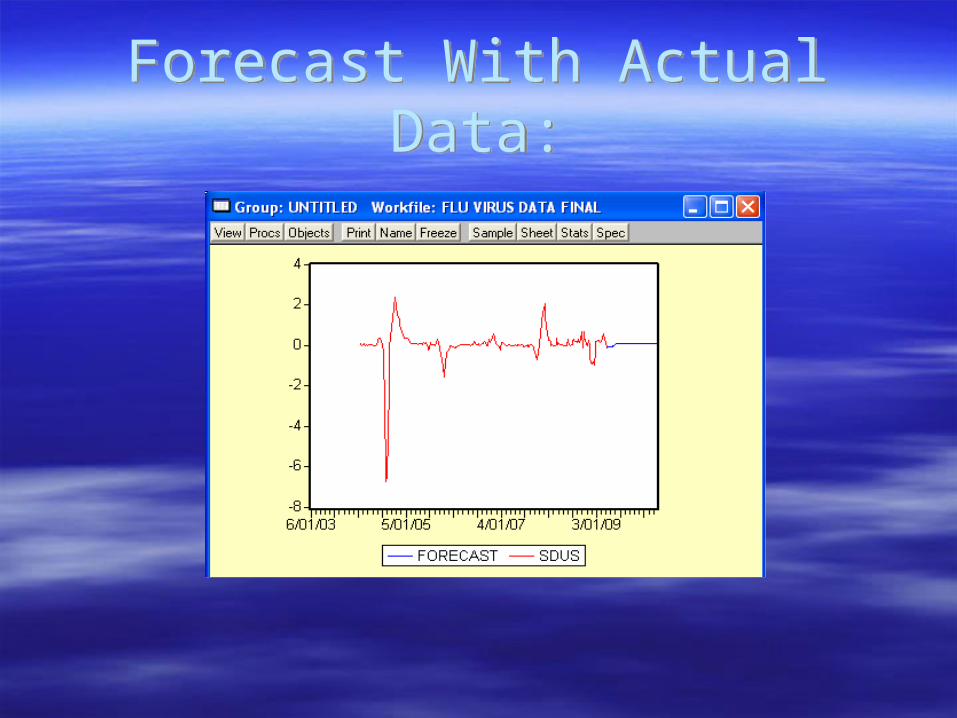
Forecast With Actual Data:Forecast With Actual Data:
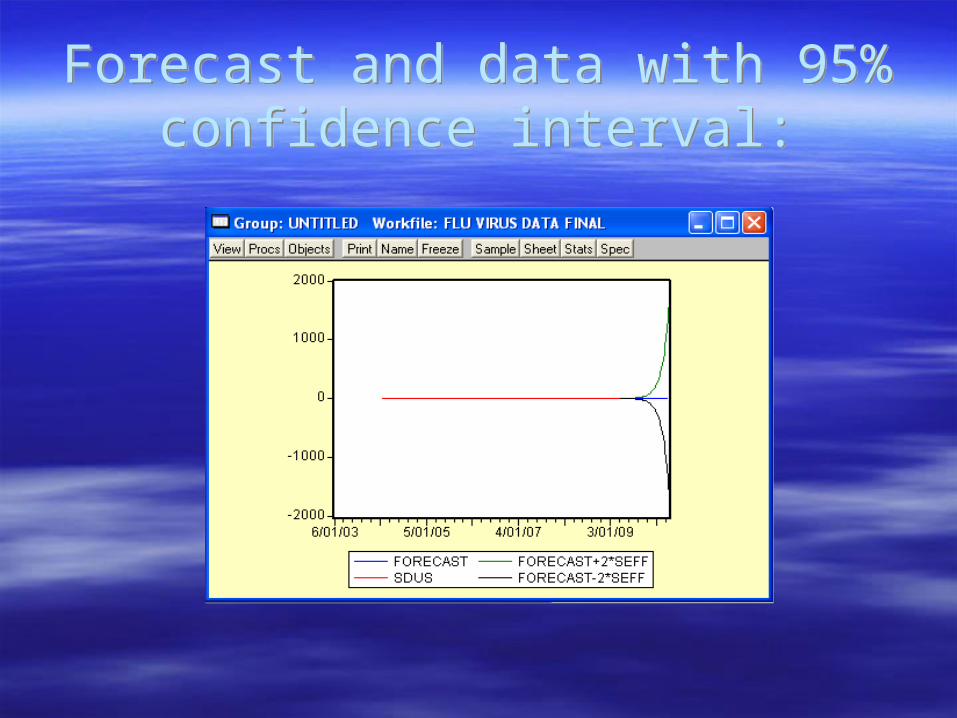
Forecast and data with 95% confidence interval:
Forecast and data with 95% confidence interval:

Recolored forecast Recolored forecast Looks the same as the previous year but is
actually slightly different: Looks the same as the previous year but is
actually slightly different:

The google search data and actual flu cases
The google search data and actual flu cases
The trace of Google search data and actual cases:
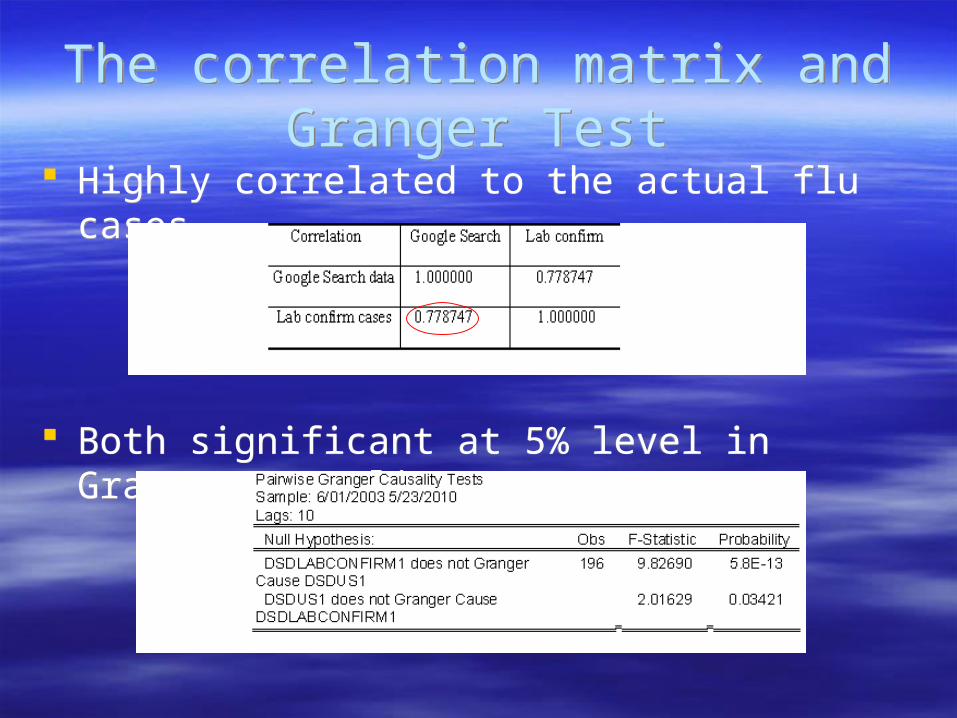
The correlation matrix and Granger Test
The correlation matrix and Granger Test
Highly correlated to the actual flu cases
Both significant at 5% level in Granger Causality Test
Highly correlated to the actual flu cases
Both significant at 5% level in Granger Causality Test

Vector Autoregression ModelVector Autoregression Model Lab Confirm cases cause the Google
Search -Significant at lag 1, 3, 4, 6, 7, 8, 9
The Google Search causes the Lab Confirm cases-only significant at lag 2
Lab Confirm cases cause the Google Search -Significant at lag 1, 3, 4, 6, 7, 8, 9
The Google Search causes the Lab Confirm cases-only significant at lag 2

The response graphThe response graph
ConclusionsConclusions
Model fits very well Forecast can be used for more than just the
flu, but any medical ailment that is easily contracted.– Could be especially useful in coming months
when H1N1 mutates and returns this coming Fall.
Model fits very well Forecast can be used for more than just the
flu, but any medical ailment that is easily contracted.– Could be especially useful in coming months
when H1N1 mutates and returns this coming Fall.