FORECASTING THE PROPAGATION OF THUNDERSTORM ANVIL CLOUDS...
15
NASA - USAF - NOAA Applied Meteorology Unit Slide 1 FORECASTING THE PROPAGATION OF THUNDERSTORM ANVIL CLOUDS OVER FLORIDA USING NCEP MODEL DATA Mark M. Wheeler David A. Short ENSCO, Inc. Applied Meteorology Unit NASA/KSC/CCAFS NWA Annual Meeting 22 October 2003 Jacksonville, Florida
Transcript of FORECASTING THE PROPAGATION OF THUNDERSTORM ANVIL CLOUDS...

NASA - USAF - NOAA Applied Meteorology Unit
Slide 1
FORECASTING THE PROPAGATION OF THUNDERSTORM ANVIL CLOUDS OVER FLORIDA
USING NCEP MODEL DATA
Mark M. WheelerDavid A. Short
ENSCO, Inc.Applied Meteorology Unit
NASA/KSC/CCAFS
NWA Annual Meeting22 October 2003
Jacksonville, Florida

NASA - USAF - NOAA Applied Meteorology Unit
Slide 2
OUTLINE
MotivationNatural & Triggered Lightning:
Threat to Space Launch & Landing
Empirical Study Florida Anvil Clouds
Lifetime & Propagation Characteristics
Nowcast Tool Used During Countdown
Wind Speed/Direction (300 to 150 mb)
Forecast Tool24 to 48 Hour Scrub Forecast
Eta-Model Forecast Winds

NASA - USAF - NOAA Applied Meteorology Unit
Slide 3
Anvil Cloud Rule
Rule 3a1
DON’T launch if the flight path will carry the vehicle throughnontransparent parts of attached anvil clouds
OK
Attached Anvil

NASA - USAF - NOAA Applied Meteorology Unit
Slide 4
STS-105 Post-Mission Summary Spaceflight Meteorology Group
Johnson Space Center (JSC/SMG)
Aug. 9, 2001 SCRUB Aug. 10, 2001 LAUNCH
“… Although no rain wasreported at KSC, thunderstormswere close enough to the Return-To-Launch-Site (RTLS)emergency landing approachesto halt the launch countdown.In addition, the anvil cloud fromthe thunderstorms had movedoverhead of both the SLF andthe launch pad violating boththe Flight Rules for emergencylandings and the Launch CommitCriteria.”
NASA - USAF - NOAA Applied Meteorology Unit
Slide 5
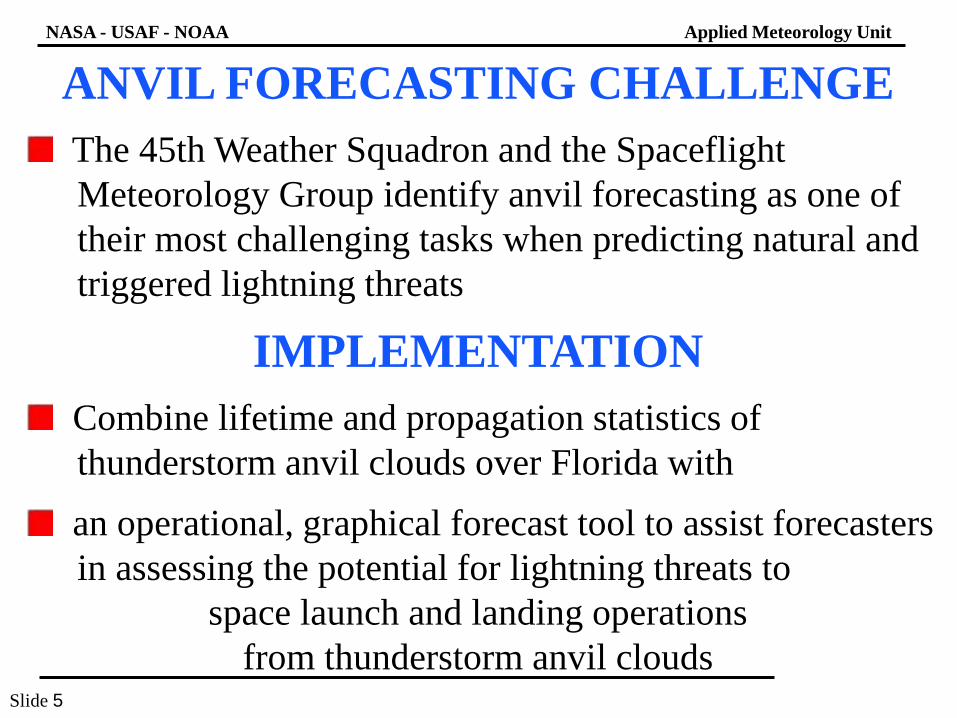
ANVIL FORECASTING CHALLENGEThe 45th Weather Squadron and the Spaceflight Meteorology Group identify anvil forecasting as one of their most challenging tasks when predicting natural and triggered lightning threats
IMPLEMENTATIONCombine lifetime and propagation statistics of thunderstorm anvil clouds over Florida withan operational, graphical forecast tool to assist forecasters in assessing the potential for lightning threats to
space launch and landing operations from thunderstorm anvil clouds

NASA - USAF - NOAA Applied Meteorology Unit
Slide 6
Anvil Layer:(Warm Season)
150 mb (46 000’)
300 mb (31 000’)
Anvil Transport by Upper-Level Winds
Anvil Transport Distance
ParentThunderstorm
Complex
Greatest Extent ofNon-Transparent Edge
NASA - USAF - NOAA Applied Meteorology Unit
Slide 7
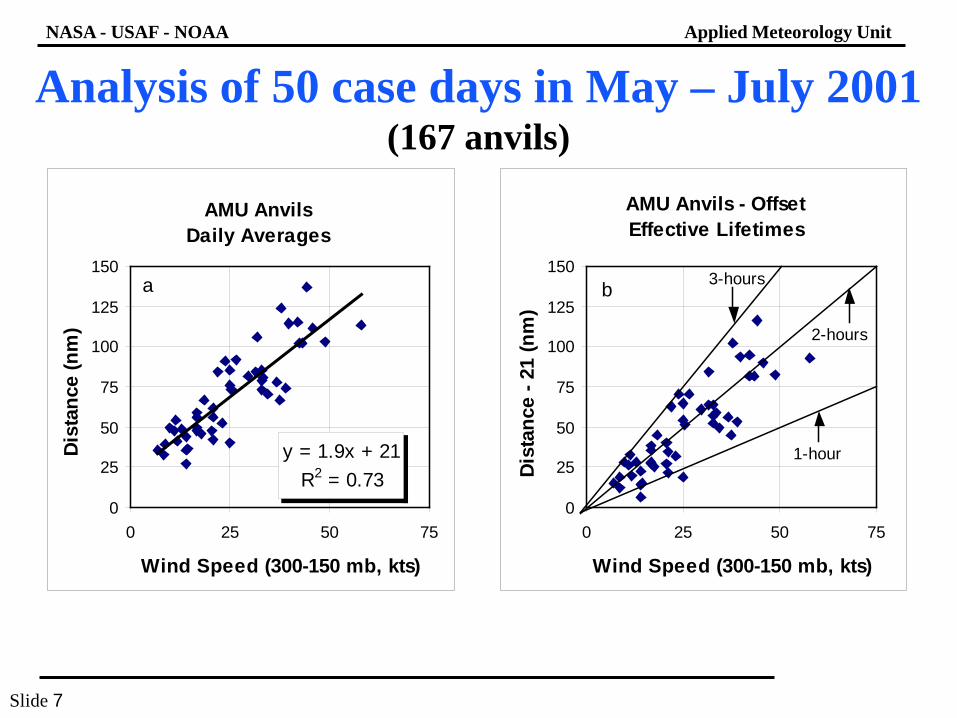
AMU AnvilsDaily Averages
y = 1.9x + 21R2 = 0.73
0
25
50
75
100
125
150
0 25 50 75
Wind Speed (300-150 mb, kts)
Dist
ance
(nm
)
a
AMU Anvils - OffsetEffective Lifetimes
0
25
50
75
100
125
150
0 25 50 75
Wind Speed (300-150 mb, kts)
Dist
ance
- 21
(nm
)
1-hour
2-hours
3-hoursb
Analysis of 50 case days in May – July 2001(167 anvils)

NASA - USAF - NOAA Applied Meteorology Unit
Slide 8
http://www.auf.asn.au/meteorology/section3.html
Australian Anvil: Diameter ~ 20 n mi

NASA - USAF - NOAA Applied Meteorology Unit
Slide 9
Daily Anvil Orientation
0
60
120
180
240
300
360
0 60 120 180 240 300 360
Wind Direction (300-150 mb)
Anvi
l Orie
ntat
ion
Direction DifferenceAnvil - Wind
-90
-60
-30
0
30
60
90
0 20 40 60
Wind Speed (300-150 mb, kts)
Anvi
l Orie
n. -
Win
d Di
r.
Anvil Orientation and Wind Direction(300 to 150 mb Layer)
NASA - USAF - NOAA Applied Meteorology Unit
Slide 10
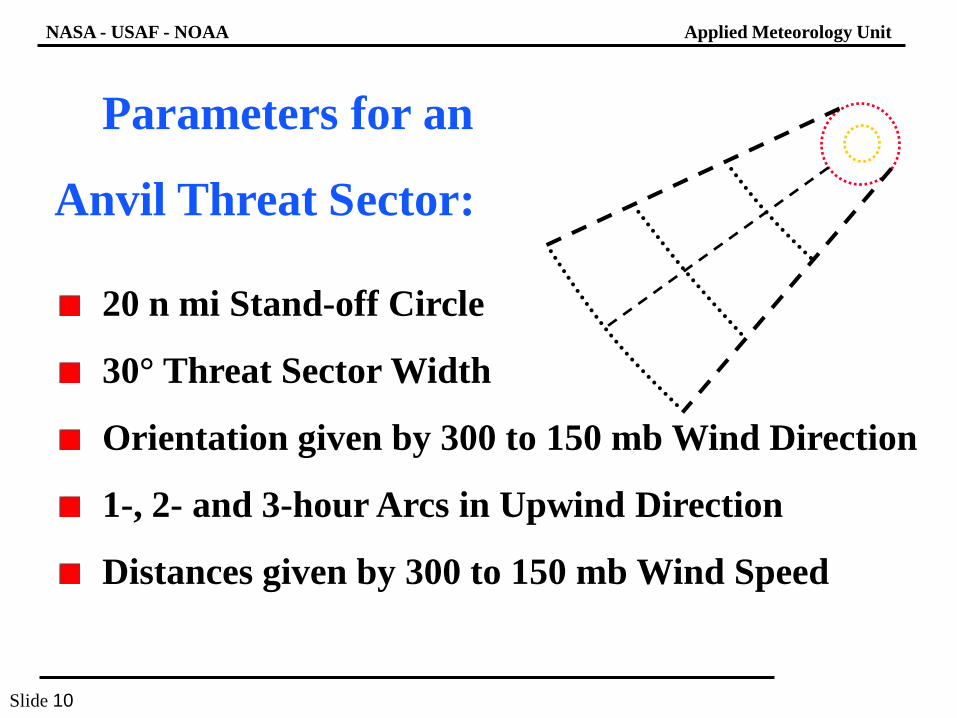
Parameters for an
Anvil Threat Sector:
20 n mi Stand-off Circle
30° Threat Sector Width
Orientation given by 300 to 150 mb Wind Direction
1-, 2- and 3-hour Arcs in Upwind Direction
Distances given by 300 to 150 mb Wind Speed

NASA - USAF - NOAA Applied Meteorology Unit
Slide 11
EXAMPLETSTM GUIDANCE:
ETA-MOS 12-HR PROBABILITY OF THUNDERSTORMS (LTNG): The probability that a thunderstorm will occur in a 40 km grid box during the 12 hour period ending at the specified time. A thunderstorm is defined as 1 or more cloud-to-ground lightning strikes.
Anvil Threat Sectors Observed
36-hr Forecast
McIDAS-type Display: Anvil Tool written in McBASI

NASA - USAF - NOAA Applied Meteorology Unit
Slide 12
SUMMARY:
Thunderstorm Anvil Threat Sector:Delineates potential area of concern
Nowcast Threat Sector: Based on observed 300 to 150 mb winds
Forecast Threat Sector:Based on Eta or MRF point data (winds)
[Other guidance needed for thunderstorm probability]
AMU Quarterly Reports:http://science.ksc.nasa.gov/amu/home.html

NASA - USAF - NOAA Applied Meteorology Unit
Slide 13
Blank

NASA - USAF - NOAA Applied Meteorology Unit
Slide 14
Ocean Anvil case from 45 WS Pilot Study

Slide 15
NASA - USAF - NOAA Applied Meteorology Unit
Slide 15
GOES-8; May 13, 2001
Prototype Threat Sector Tool (McBASI)