Forecasting the impacts of oilsands expansion · 1 Forecasting the impacts of oilsands expansion...
13
1 Forecasting the impacts of oilsands expansion www.pembina.org Forecasting the impacts of oilsands expansion Measuring the land disturbance, air quality, water use, greenhouse gas emissions, and tailings production associated with each barrel of bitumen production By Jennifer Grant, Eli Angen and Simon Dyer June 2013 In the debate over the environmental impacts of oilsands development, you’ll oſten hear industry proponents cite one set of statistics, and critics another. at’s because proponents oſten talk in the present tense — pointing, for instance, to the fact that oilsands emissions today represent a fraction of global greenhouse gas emissions — while critics point to the future, measuring today’s environmental concerns against industry’s growth projections. It’s common to hear critics state, for example, that oilsands emissions matter because their rapid growth is cancelling out the progress made in other sectors, and because this growth is the main reason Canada is unlikely to meet its global climate commitments. While both perspectives may be accurate, when it comes to managing the impacts of oilsands develop- ment the long view is the one that counts. Last year, the oilsands industry produced 1.9 million barrels of bitumen each day. 1 A decade from now, total bitumen production is projected to reach 3.8 million barrels per day, 2 and the Canadian Association of Petroleum Producers expects the industry will surpass 5 million barrels a day by the end of 2030. 3 (In fact, regulators have already approved this level of produc- tion based on today’s technology — despite industry’s own forecasts 4 showing that critical ecosystem and air quality limits are likely to be exceeded in some areas.) In total, the industry has announced or disclosed plans to produce more than 9 million barrels of bitumen per day. 5 While it’s challenging to project how the impacts of oilsands development will change over time, there are two key elements that shape the overall footprint of oilsands development: the pace and scale of oilsands production (barrels of bitumen produced each day) and per barrel environmental impacts of oilsands production. Many forces determine the pace and scale of oilsands production, including access to finance, key markets, oilsands resources, and critical inputs such as labour and materials. Equally important are the limits Canadian regulators establish on environmental impacts — because these limits, if designed properly, could set the ground rules for responsible oilsands development. Why consider per-barrel impacts e oilsands industry’s growth plans have significant implications for environmental management, but it can be challenging to understand production on such TERMS AND MEASUREMENTS Intensity: this is a measure of the amount of consumption, emissions or waste per unit of production. For example, water intensity is presented in “barrels of water used per barrel of bitumen produced” Cubic metres vs. barrels: e oilsands sector uses both sets of units for fluid volume measurement. One cubic metre (1000 litres) is equivalent to 6.29 barrels.
Transcript of Forecasting the impacts of oilsands expansion · 1 Forecasting the impacts of oilsands expansion...

1 Forecasting the impacts of oilsands expansion www.pembina.org
Forecasting the impacts of oilsands expansionMeasuring the land disturbance, air quality, water use, greenhouse gas emissions, and tailings production associated with each barrel of bitumen productionBy Jennifer Grant, Eli Angen and Simon Dyer June 2013
In the debate over the environmental impacts of oilsands development, you’ll often hear industry proponents cite one set of statistics, and critics another. That’s because proponents often talk in the present tense — pointing, for instance, to the fact that oilsands emissions today represent a fraction of global greenhouse gas emissions — while critics point to the future, measuring today’s environmental concerns against industry’s growth projections. It’s common to hear critics state, for example, that oilsands emissions matter because their rapid growth is cancelling out the progress made in other sectors, and because this growth is the main reason Canada is unlikely to meet its global climate commitments.
While both perspectives may be accurate, when it comes to managing the impacts of oilsands develop-ment the long view is the one that counts.
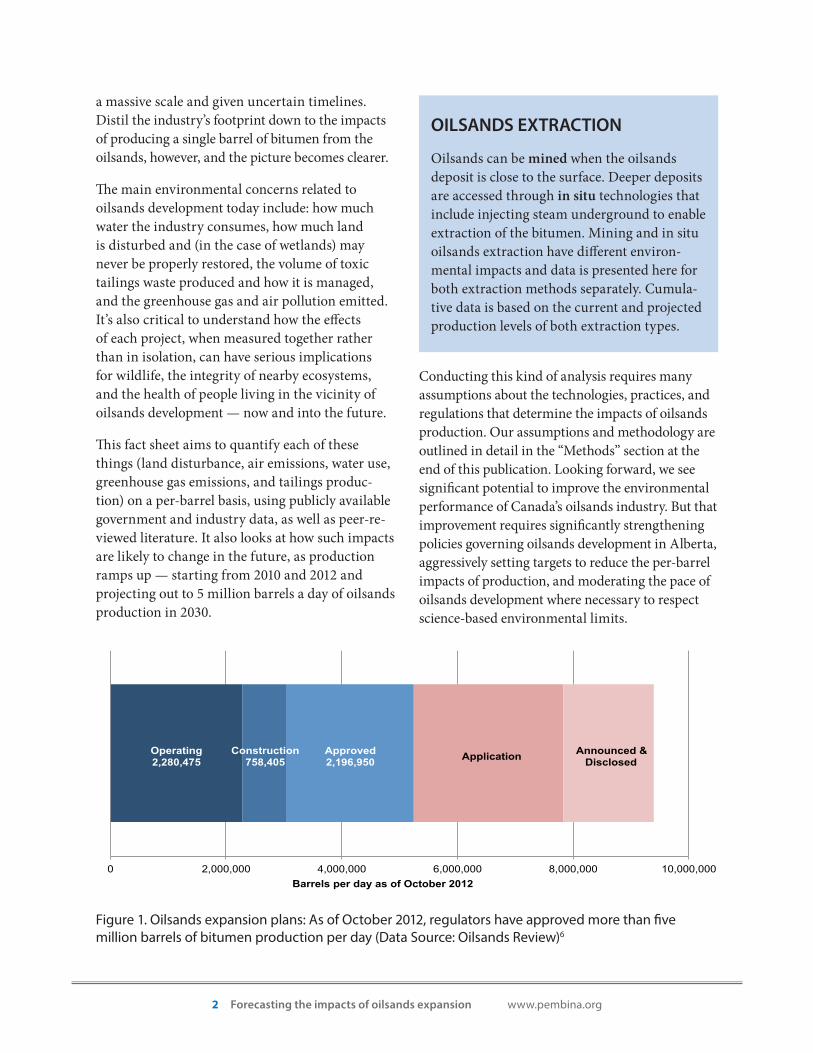
Last year, the oilsands industry produced 1.9 million barrels of bitumen each day.1 A decade from now, total bitumen production is projected to reach 3.8 million barrels per day,2 and the Canadian Association of Petroleum Producers expects the industry will surpass 5 million barrels a day by the end of 2030.3 (In fact, regulators have already approved this level of produc-tion based on today’s technology — despite industry’s own forecasts4 showing that critical ecosystem and air quality limits are likely to be exceeded in some areas.) In total, the industry has announced or disclosed plans to produce more than 9 million barrels of bitumen per day.5
While it’s challenging to project how the impacts of oilsands development will change over time, there are two key elements that shape the overall footprint of oilsands development: the pace and scale of oilsands production (barrels of bitumen produced each day) and per barrel environmental impacts of oilsands production.
Many forces determine the pace and scale of oilsands production, including access to finance, key markets, oilsands resources, and critical inputs such as labour and materials. Equally important are the limits Canadian regulators establish on environmental impacts — because these limits, if designed properly, could set the ground rules for responsible oilsands development.
Why consider per-barrel impacts
The oilsands industry’s growth plans have significant implications for environmental management, but it can be challenging to understand production on such
TERMS AND MEASUREMENTS
Intensity: this is a measure of the amount of consumption, emissions or waste per unit of production. For example, water intensity is presented in “barrels of water used per barrel of bitumen produced”
Cubic metres vs. barrels: The oilsands sector uses both sets of units for fluid volume measurement. One cubic metre (1000 litres) is equivalent to 6.29 barrels.
2 Forecasting the impacts of oilsands expansion www.pembina.org
a massive scale and given uncertain timelines. Distil the industry’s footprint down to the impacts of producing a single barrel of bitumen from the oilsands, however, and the picture becomes clearer.
The main environmental concerns related to oilsands development today include: how much water the industry consumes, how much land is disturbed and (in the case of wetlands) may never be properly restored, the volume of toxic tailings waste produced and how it is managed, and the greenhouse gas and air pollution emitted. It’s also critical to understand how the effects of each project, when measured together rather than in isolation, can have serious implications for wildlife, the integrity of nearby ecosystems, and the health of people living in the vicinity of oilsands development — now and into the future.
This fact sheet aims to quantify each of these things (land disturbance, air emissions, water use, greenhouse gas emissions, and tailings produc-tion) on a per-barrel basis, using publicly available government and industry data, as well as peer-re-viewed literature. It also looks at how such impacts are likely to change in the future, as production ramps up — starting from 2010 and 2012 and projecting out to 5 million barrels a day of oilsands production in 2030.
Conducting this kind of analysis requires many assumptions about the technologies, practices, and regulations that determine the impacts of oilsands production. Our assumptions and methodology are outlined in detail in the “Methods” section at the end of this publication. Looking forward, we see significant potential to improve the environmental performance of Canada’s oilsands industry. But that improvement requires significantly strengthening policies governing oilsands development in Alberta, aggressively setting targets to reduce the per-barrel impacts of production, and moderating the pace of oilsands development where necessary to respect science-based environmental limits.
Operating 2,280,475
Construction 758,405
Approved 2,196,950 Application Announced &
Disclosed
0 2,000,000 4,000,000 6,000,000 8,000,000 10,000,000 Barrels per day as of October 2012
Figure 1. Oilsands expansion plans: As of October 2012, regulators have approved more than five million barrels of bitumen production per day (Data Source: Oilsands Review)6
OILSANDS EXTRACTION
Oilsands can be mined when the oilsands deposit is close to the surface. Deeper deposits are accessed through in situ technologies that include injecting steam underground to enable extraction of the bitumen. Mining and in situ oilsands extraction have different environ-mental impacts and data is presented here for both extraction methods separately. Cumula-tive data is based on the current and projected production levels of both extraction types.
3 Forecasting the impacts of oilsands expansion www.pembina.org
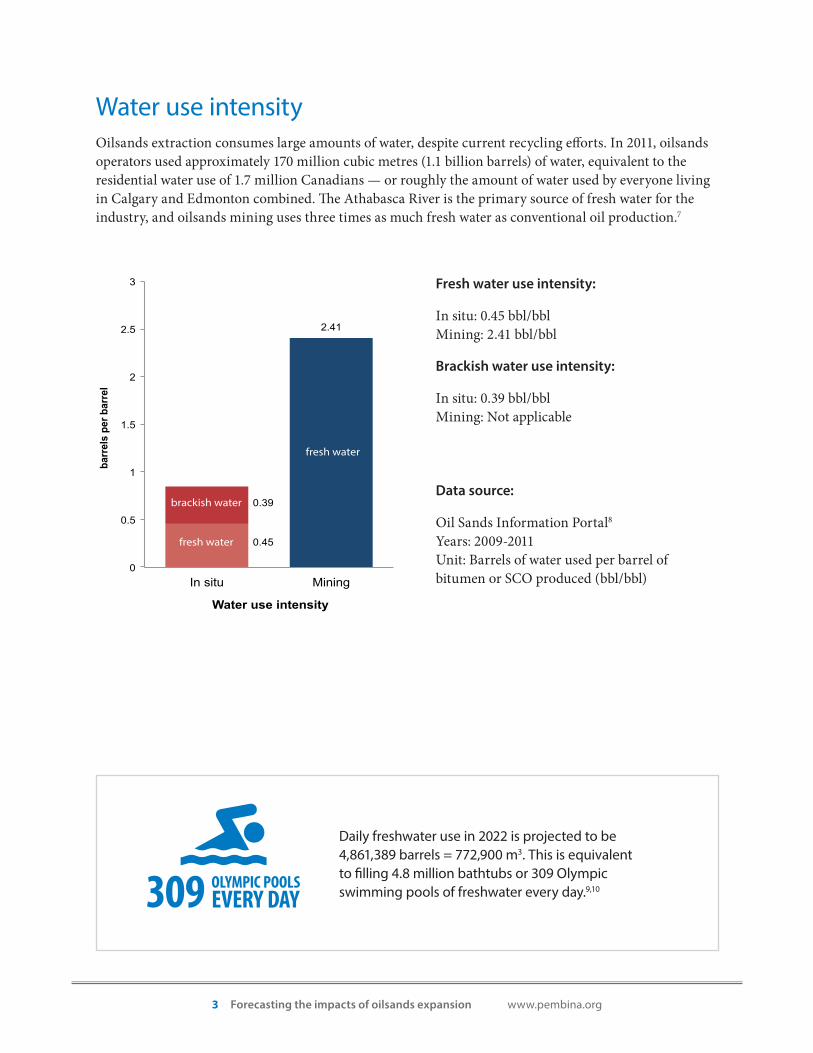
Water use intensityOilsands extraction consumes large amounts of water, despite current recycling efforts. In 2011, oilsands operators used approximately 170 million cubic metres (1.1 billion barrels) of water, equivalent to the residential water use of 1.7 million Canadians — or roughly the amount of water used by everyone living in Calgary and Edmonton combined. The Athabasca River is the primary source of fresh water for the industry, and oilsands mining uses three times as much fresh water as conventional oil production.7
0.39
2.41
0
0.5
1
1.5
2
2.5
3
In situ Mining
barr
els
per b
arre
l
Water use intensity
brackish water
fresh water
fresh water
0.45
Daily freshwater use in 2022 is projected to be 4,861,389 barrels = 772,900 m3. This is equivalent to filling 4.8 million bathtubs or 309 Olympic swimming pools of freshwater every day.9,10
Data source:
Oil Sands Information Portal8
Years: 2009-2011Unit: Barrels of water used per barrel of bitumen or SCO produced (bbl/bbl)
Fresh water use intensity:
In situ: 0.45 bbl/bbl Mining: 2.41 bbl/bbl
Brackish water use intensity:
In situ: 0.39 bbl/bbl Mining: Not applicable
22.6 MILLION CARS ADDED TO THE ROAD
309 OLYMPIC POOLS EVERY DAY 11ft
EVERY MONTH
NYC CENTRAL PARK
34.5 FOOTBALL FIELDS
EVERY DAY
4 Forecasting the impacts of oilsands expansion www.pembina.org
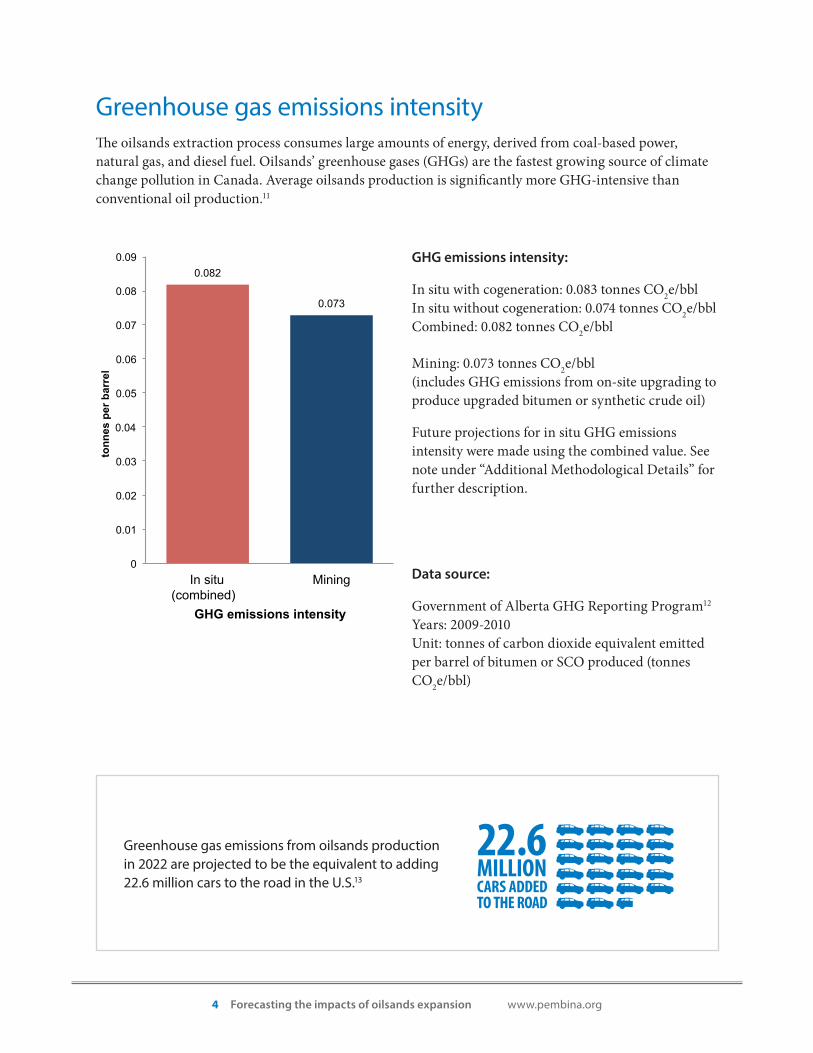
Greenhouse gas emissions intensityThe oilsands extraction process consumes large amounts of energy, derived from coal-based power, natural gas, and diesel fuel. Oilsands’ greenhouse gases (GHGs) are the fastest growing source of climate change pollution in Canada. Average oilsands production is significantly more GHG-intensive than conventional oil production.11
Greenhouse gas emissions from oilsands production in 2022 are projected to be the equivalent to adding 22.6 million cars to the road in the U.S.13
Data source:
Government of Alberta GHG Reporting Program12
Years: 2009-2010Unit: tonnes of carbon dioxide equivalent emitted per barrel of bitumen or SCO produced (tonnes CO2e/bbl)
0.082
0.073
0
0.01
0.02
0.03
0.04
0.05
0.06
0.07
0.08
0.09
In situ(combined)
Mining
tonn
es p
er b
arre
l
GHG emissions intensity
GHG emissions intensity:
In situ with cogeneration: 0.083 tonnes CO2e/bblIn situ without cogeneration: 0.074 tonnes CO2e/bblCombined: 0.082 tonnes CO2e/bbl
Mining: 0.073 tonnes CO2e/bbl (includes GHG emissions from on-site upgrading to produce upgraded bitumen or synthetic crude oil)
Future projections for in situ GHG emissions intensity were made using the combined value. See note under “Additional Methodological Details” for further description.
22.6 MILLION CARS ADDED TO THE ROAD
309 OLYMPIC POOLS EVERY DAY 11ft
EVERY MONTH
NYC CENTRAL PARK
34.5 FOOTBALL FIELDS
EVERY DAY

5 Forecasting the impacts of oilsands expansion www.pembina.org
Air emissions intensityOilsands extraction is a major point source of air pollutants such as nitrogen dioxide and sulphur dioxide. Forecasted growth in oilsands will present challenges for meeting ambient air quality standards in north-eastern Alberta. While there have been some improvements in reducing the volumes of air pollutants produced per barrel, the overall growth in the industry means that absolute growth in air emissions will impact air quality for communities who reside in the region.
Data source:
National Pollution Release Inventory14
Years: 2009-2010Unit: grams of air pollutant emitted per barrel of
bitumen or SCO produced (g/bbl)
Nitrogen oxides (NOx) emissions intensity:
In situ: 61.57 g/bblMining: 81.32 g/bbl
Sulphur dioxide (SO2) emissions intensity:
In situ: 41.4 g/bblMining: 449.4 g/bbl
Particulate matter (PM2.5) emissions intensity:
In situ: 1.5 g/bblMining: 4.4 g/bbl
61.6
81.3
0
10
20
30
40
50
60
70
80
90
In situ Mining
gram
s pe
r bar
rel
NO2 emissions intensity
41.4
449.4
0
50
100
150
200
250
300
350
400
450
500
In situ Mining
gram
s pe
r bar
rel
SO2 emissions intensity
1.54
4.42
0
0.5
1
1.5
2
2.5
3
3.5
4
4.5
5
In situ Mining
gram
s pe
r bar
rel
PM2.5 emissions intensity

6 Forecasting the impacts of oilsands expansion www.pembina.org
Tailings production intensityTailings are a waste by-product of the oilsands mining extraction process that consist of water, clay, sand and residual bitumen, along with various salts, heavy metals and other compounds that can be toxic if concentrations are high enough. These “ponds” currently cover 176 square kilometres of the landscape, and contain 830 million cubic metres of tailings waste. There remains considerable uncertainty as to whether the tailings ponds can be reclaimed to a level that sustains functional ecosystems equivalent to those that were in existence prior to mining, and no method for regenerating displaced peatlands has been developed.15
In 2010, the total volume of mature fine tailings in northeastern Alberta was 830 million cubic metres.18 That’s enough tailings waste to cover the entire city of Vancouver to a depth of over 7 metres.19 But regulators have already approved 2.4 million barrels per day of oilsands mining,20 and each barrel of bitumen produced from mining results in the production of about 1.5 barrels of mature fine tailings.21 Accordingly, approved minable production would produce 1.4 billion barrels of mature fine tailings22 and by 2022, oilsands mining is expected to produce enough toxic liquid tailings to submerge New York’s Central Park to a depth of just over 11 feet every month.23
Data source:
Mikula (2012)17
Years: N/AUnit: Barrels of mature fine tailings (MFT)
produced per barrel of bitumen or SCO (bbl/bbl)
Tailings production intensity:
In situ: Not ApplicableMining: 1.5 bbl/bbl16
0.0
1.5
0
0.2
0.4
0.6
0.8
1
1.2
1.4
1.6
In situ Mining
barr
els
per b
arre
l
Tailings production intensity
22.6 MILLION CARS ADDED TO THE ROAD
309 OLYMPIC POOLS EVERY DAY 11ft
EVERY MONTH
NYC CENTRAL PARK
34.5 FOOTBALL FIELDS
EVERY DAY

7 Forecasting the impacts of oilsands expansion www.pembina.org
Land disturbance intensityDetermining the exact impact of each facility requires specific knowledge of where it is being built and the techniques used for forest clearing and construction. However, because any clearing will have some impact on wildlife, the following calculations are based on the total project footprint.
Footprint = the total land disturbance over the life of the project Bitumen production = the total expected production associated with that footprint
In situ
In situ oilsands extraction requires the devel-opment of a dense network of roads, pipelines, wellpads and processing facilities across the boreal forest. A typical deep oilsands project may clear more than eight per cent of the forest in a lease. The forest is fragmented by an average of 3.2 kilometres of roads, pipelines and other distur-bances for every single square kilometer of forest. The surface disturbance associated with in situ oilsands development is many times greater than the disturbance associated with conventional oil or gas fields, to which in situ is often compared.24
Previous analysis by the Pembina Institute has demonstrated that average in situ land use intensity is equal to the project land use intensity (based on footprint area and bitumen production volumes) over the total project lifetime. This equals 1.4 hectares (ha) per million barrels 25 or 1.4x10⁻⁶ ha per barrel of bitumen produced. Additionally, academic research has concluded in situ oilsands devel-opment has a land use intensity of 1.8x10⁻⁶ ha per barrel.26,27 Therefore, for the purposes of this analysis we estimate that in situ oilsands production has an
average land use intensity of 1.6x10⁻⁶ ha per barrel. It is important to note that this metric measures surface disturbance only, and not habitat fragmen-tation adjacent to in situ operations.
Mining
Mining operations result in the disturbance of large areas to produce bitumen. Before mining can begin, the forest, wetlands and soil are cleared, drained and removed. Rivers and streams are diverted and forests are clear cut, with merchant-able timber being harvested and the remainder being piled and burned. In addition, wetlands must be drained and excavated.
There is limited publicly available information on the land use intensity of oilsands mine operations.
The recent proposed Shell Jackpine Mine Expansion project has a total lease size of 12,723 hectares,28 a forecasted production rate of 100,000 barrels of bitumen per day29 and a project lifetime of 40 years.30 Total produc-tion over the life of the project is therefore 1.5 billion barrels of bitumen. For this project, Shell would disturb 0.094 m2 of land per barrel of bitumen produced or 9.4 hectares of disturbance per million barrels of production.
1.6 x10⁻⁶
9.4 x10⁻⁶
0
1 x10⁻⁶
2 x10⁻⁶
3 x10⁻⁶
4 x10⁻⁶
5 x10⁻⁶
6 x10⁻⁶
7 x10⁻⁶
8 x10⁻⁶
9 x10⁻⁶
1 x10⁻⁵
In situ Mining
hect
ares
per
bar
rel
Land disturbance intensity

8 Forecasting the impacts of oilsands expansion www.pembina.org
By 2022, it is projected that mining and in situ oilsands development will result in the daily clearing of 18.6 hectares of forest, or the equivalent of 34.5 football fields, every day.31
22.6 MILLION CARS ADDED TO THE ROAD
309 OLYMPIC POOLS EVERY DAY 11ft
EVERY MONTH
NYC CENTRAL PARK
34.5 FOOTBALL FIELDS
EVERY DAY
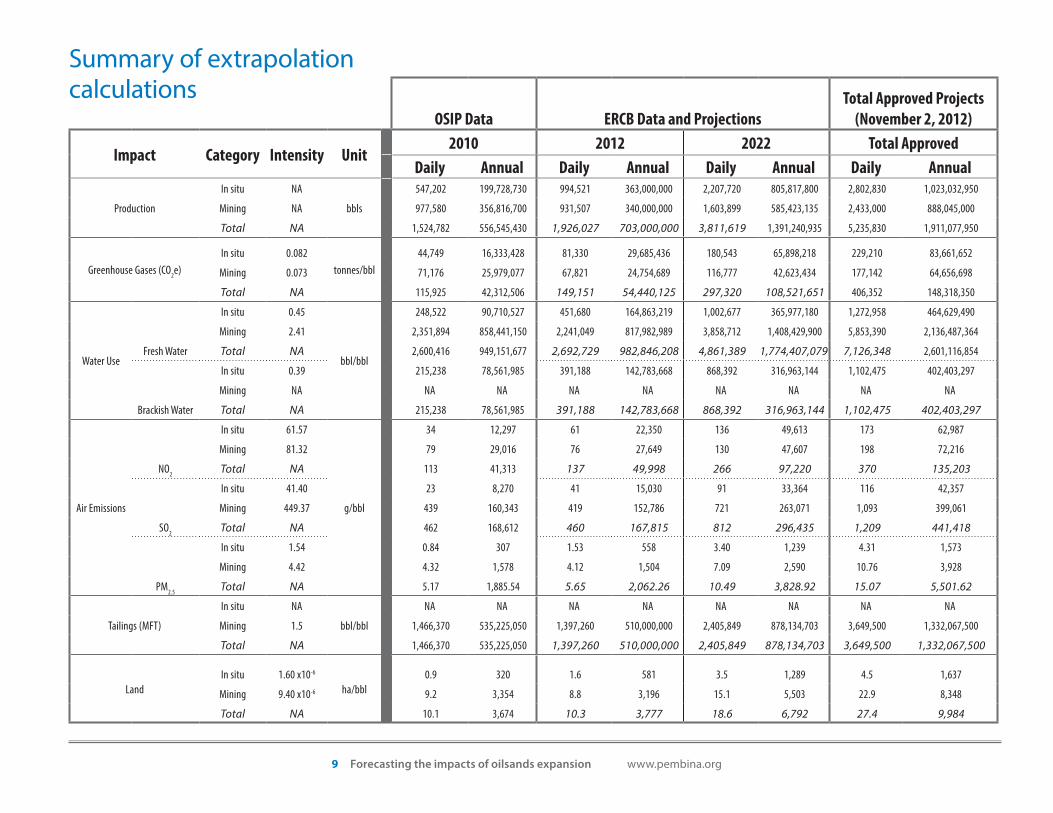
OSIP Data ERCB Data and ProjectionsTotal Approved Projects
(November 2, 2012)
Impact Category Intensity Unit2010 2012 2022 Total Approved
Daily Annual Daily Annual Daily Annual Daily Annual
Production
In situ NA
bbls
547,202 199,728,730 994,521 363,000,000 2,207,720 805,817,800 2,802,830 1,023,032,950
Mining NA 977,580 356,816,700 931,507 340,000,000 1,603,899 585,423,135 2,433,000 888,045,000
Total NA 1,524,782 556,545,430 1,926,027 703,000,000 3,811,619 1,391,240,935 5,235,830 1,911,077,950
Greenhouse Gases (CO2e)In situ 0.082
tonnes/bbl 44,749 16,333,428 81,330 29,685,436 180,543 65,898,218 229,210 83,661,652
Mining 0.073 71,176 25,979,077 67,821 24,754,689 116,777 42,623,434 177,142 64,656,698
Total NA 115,925 42,312,506 149,151 54,440,125 297,320 108,521,651 406,352 148,318,350
Water UseFresh Water
In situ 0.45
bbl/bbl
248,522 90,710,527 451,680 164,863,219 1,002,677 365,977,180 1,272,958 464,629,490
Mining 2.41 2,351,894 858,441,150 2,241,049 817,982,989 3,858,712 1,408,429,900 5,853,390 2,136,487,364
Total NA 2,600,416 949,151,677 2,692,729 982,846,208 4,861,389 1,774,407,079 7,126,348 2,601,116,854
Brackish Water
In situ 0.39 215,238 78,561,985 391,188 142,783,668 868,392 316,963,144 1,102,475 402,403,297
Mining NA NA NA NA NA NA NA NA NA
Total NA 215,238 78,561,985 391,188 142,783,668 868,392 316,963,144 1,102,475 402,403,297
Air Emissions
NO2
In situ 61.57
g/bbl
34 12,297 61 22,350 136 49,613 173 62,987
Mining 81.32 79 29,016 76 27,649 130 47,607 198 72,216
Total NA 113 41,313 137 49,998 266 97,220 370 135,203
SO2
In situ 41.40 23 8,270 41 15,030 91 33,364 116 42,357
Mining 449.37 439 160,343 419 152,786 721 263,071 1,093 399,061
Total NA 462 168,612 460 167,815 812 296,435 1,209 441,418
PM2.5
In situ 1.54 0.84 307 1.53 558 3.40 1,239 4.31 1,573
Mining 4.42 4.32 1,578 4.12 1,504 7.09 2,590 10.76 3,928
Total NA 5.17 1,885.54 5.65 2,062.26 10.49 3,828.92 15.07 5,501.62
Tailings (MFT)
In situ NA
bbl/bbl
NA NA NA NA NA NA NA NA
Mining 1.5 1,466,370 535,225,050 1,397,260 510,000,000 2,405,849 878,134,703 3,649,500 1,332,067,500
Total NA 1,466,370 535,225,050 1,397,260 510,000,000 2,405,849 878,134,703 3,649,500 1,332,067,500
LandIn situ 1.60 x10⁻⁶
ha/bbl 0.9 320 1.6 581 3.5 1,289 4.5 1,637
Mining 9.40 x10⁻⁶ 9.2 3,354 8.8 3,196 15.1 5,503 22.9 8,348
Total NA 10.1 3,674 10.3 3,777 18.6 6,792 27.4 9,984
Summary of extrapolation calculations
9 Forecasting the impacts of oilsands expansion www.pembina.org

10 Forecasting the impacts of oilsands expansion www.pembina.org
METHODSSummary
We report the average upstream oilsands production impact intensities (per barrel of bitumen or SCO produced) for air emissions, greenhouse gas emissions, water use, and tailings production using publicly available historical data from 2009 onwards.
• Intensity calculations used project-specific data from publicly available sources including: the Oilsands Information Portal (OSIP), Canadian Association of Petroleum Producers (CAPP), National Pollution Release Inventory (NPRI), the Government of Alberta’s Green-house Gas Reporting Program, the Energy Resources Conservation Board, and academic papers.
• Project-specific annual emissions data and project-specific annual production volumes (bitumen or synthetic crude oil) were combined for each project and year with data. We weighted intensity averages by the produc-tion volumes of the projects included in the calculations for each average. This excludes projects that have already begun operations, but have not yet produced oil (e.g. Imperial Oil’s Kearl mine was excluded (production began in end of March 2013) because it was an outlier that skews the water consump-tion data upwards considerably. In addition, Nexen’s Long Lake in situ facility was excluded because no other operator has announced plans to replicate this technology approach).
• We used the production volume data reported in the Alberta Oil Sands Information Portal (OSIP) as the denominators for all impact intensity calculations.
• To the best of our knowledge, neither project-specific nor year-specific tailings production volume data is publicly available. Although OSIP reports the area of each tailings lake, this data does not lend itself to quanti-fying the production volume intensity. The tailings production volume intensity we report is taken from a peer-reviewed academic study.
• Where available, we compared the intensities that we calculated to those that we calculated using industry-wide (i.e., not project-specific) historical impact and production history reported by the Canadian Association of Petroleum Producers (CAPP).
• We used the intensities calculated to extrap-olate absolute daily and annual oilsands production impacts associated with 2010 and 2012 actual production, 2022 ERCB production forecasts, and the total produc-tion capacity of all oilsands projects that had received regulatory approval as of November 2, 2012 (includes all operating, under-con-struction, and approved projects).
Additional Methodological Details
Exclusion of Nexen Long Lake In Situ Project
We considered Nexen’s Long Lake in situ project to be an outlier and excluded it from our calcula-tions of the intensity averages. Sensitivity analyses indicated that inclusion of this project raised the average in situ intensity for all types of impacts with the exception of brackish water use. For brackish water use the inclusion of Long Lake resulted in a slight [3.2%] decrease in the average intensity. To the best of our knowledge, no other planned in situ projects intend to use Nexen’s proprietary OrCrude technology, hydrocracking, and gasification upgrading process to produce Premium Synthetic Crude; thus, extrapolating future absolute impacts from current average impact intensities that include Long Lake would likely result in an upward bias. We therefore excluded Long Lake’s contributions to average impact intensities in order to provide more realistic and/or conservative estimates of future cumulative impacts.

11 Forecasting the impacts of oilsands expansion www.pembina.org
Uncertainty
The impact intensities that we report should be considered averages based on recent industry performance history, not precise forecasts of future impact intensities. Intensities may decrease in the future due to stricter regulations, innovation and implementation of new technologies or increased efficiencies (e.g., increased use of power co-gen-eration or increased recycle-water availability). Conversely, impact intensities may increase in the future as remaining resource deposits become more and more marginal (i.e., requiring more energy and effort to extract a lower-quality resource). It is difficult to quantify whether improvements in performance will outweigh the effect of increasingly marginal resources on the oilsands industry’s environmental performance, especially since unknown future policy and economic scenarios are also likely to be influential variables in this relationship. As such, while the impact intensities we report here are relatively accurate reflections of recent performance history, they are a projection of future impacts based on the assumptions described herein.
Data availability
At the time of writing this report, there was no publicly available historical data for oilsands greenhouse gas emissions or air emissions (NO2, SO2, and PM2.5) for the year 2011 or later, and data on the annual volume of tailings produced was not available for any year. Thus, the tailings produc-tion intensity we report is taken from another study, and the greenhouse gas and air emission intensities we report are derived from 2009-2010 production and emission data. Oilsands historical water use (fresh and brackish) data was available for the year 2011; the water use intensities we report are derived from 2009-2011 production and water use data in order to reflect the most recent oilsands water use trends.
Greenhouse gas emissions associated with cogeneration of electricity
Some oilsands projects use a combined process to generate steam and electricity on site, whereas other projects purchase electricity from the Alberta electricity grid and utilize on-site boilers for steam. The combined process is known as cogeneration or combined heat and power. Facilities that employ cogeneration typically produce more electricity than they need and sell the surplus into the grid for use elsewhere. The inclusion of cogeneration emissions therefore overestimates the average GHG emission inten-sities associated with oilsands production in those facilities. Conversely, excluding the GHG grid emissions emitted by external providers of electricity to oilsands projects that do not employ cogeneration (instead having standalone boilers and purchasing power from Alberta’s grid) results in an underestimation of GHG emission intensities associated with oilsands production from non-co-generation facilities. Because of this complexity, we chose to use full facility emissions for all projects in our analyses of GHG and air emissions. Thus, we neither credited projects for cogeneration contributions to the grid nor penalized projects for electricity consumed from the grid.
Full data tables are available upon request.
12 Forecasting the impacts of oilsands expansion www.pembina.org
Endnotes1 Energy Resource Conservation Board, Alberta’s Energy Reserves 2012 and Supply/Demand Outlook 2013-2022 (2013), 10.
http://www.aer.ca/documents/sts/ST98/ST98-2013.pdf
2 Alberta’s Energy Reserves 2012 and Supply/Demand Outlook 2013-2022, 10.
3 Canadian Association of Petroleum Producers, Crude Oil: Forecast, Markets and Transportation (2013), 6. http://www.capp.ca/forecast/Pages/default.aspx
4 Oil Sands Environmental Coalition, Submission to Joint Review Panel for the Shell Jackpine Mine Expansion Project, October 1, 2012, 26. http://pubs.pembina.org/reports/osec-submission-jackpine-expansion-oct-2012-corrected.pdf
5 Oilsands Review, “Statistics: Oilsands Production.” http://www.oilsandsreview.com/statistics/production.asp
6 Oilsands Review, “Statistics: Oilsands Production.”
7 The RCE 2010 progress report notes that about 0.6 barrels of fresh water was used to produce each barrel of oil produced from conventional oil operations in Alberta in 2010. Responsible Canadian Energy, 2010 Progress Report. http://www.rce2010.ca/western-canada/water/water-usage/
8 Alberta Environment and Sustainable Resource Development, “Oil Sands Information Portal: Oil Sands Operators’ Water Use History,” http://environment.alberta.ca/apps/OSIPDL/Dataset/Details/56 (accessed April 19, 2013). Water use volumes are reported in m3, therefore converted to barrels as needed (1 m3 = 6.29 barrels).
9 Federation Internationale de Natation specifications for Olympic swimming pool are 25 meters wide, 50 meters long and 2 metres deep, for a volume of 2,500 m3. Dimensions Info, “Olympic Swimming Pool Dimensions.” http://www.dimension-sinfo.com/olympic-swimming-pool-dimensions/.
10 A typical bathtub contains approximately 160 litres of water.
11 In a comparison of production emissions only, the per-barrel greenhouse gas emissions associated with oilsands extraction and upgrading are estimated to be 3.2 to 4.5 times as high as than conventional crude oil produced in Canada or the United States. National Energy Technology Laboratory, Development of Baseline Data and Analysis of Life Cycle Green-house Gas Emissions of Petroleum-Based Fuels, DOE/NETL-2009/1346 (2008), 12. http://www.netl.doe.gov/energy-anal-yses/pubs/NETL LCA Petroleum-Based Fuels Nov 2008.pdf
12 Alberta Environment and Sustainable Resource Development, “Greenhouse Gas Reporting Program,” http://environ-ment.alberta.ca/02166.html, 2009 and 2010 Greenhouse Gas Summary Reports (datasets) (accessed April 19, 2013). Emission totals used in intensity calculations include emissions from co-generation but do not include grid emissions from electricity consumption by oilsands projects that do not employ co-generation.
13 Projected 2022 annual GHG emissions is 108,521,651 tonnes. The average U.S. passenger vehicle emissions in 2010 was 4.8 tonnes CO2e per year. U.S. Environmental Protection Agency, “Calculations and References.“ http://www.epa.gov/cleanen-ergy/energy-resourc”es/refs.html
14 Environment Canada, “National Pollution Release Inventory (NPRI) Downloadable Datasets: Facility Data”, http://www.ec.gc.ca/inrp-npri/default.asp?lang=en&n=0EC58C98-, 2009 and 2010 datasets (accessed April 19, 2013).
15 S. M. Rowland,C. E. Prescott, S. J. Grayston, S. A. Quideau and G. E. Bradfield, “Recreating a Functioning Forest Soil in Reclaimed Oil Sands in Northern Alberta: An Approach for Measuring Success in Ecological Restoration,” Journal of Environmental Quality 48 (2009). https://www.agronomy.org/publications/jeq/abstracts/38/4/1580 ; Simon Dyer, Jennifer Grant, Marc Huot, Nathan Lemphers, Beneath the Surface: A review of key facts in the oilsands debate (Pembina Institute, 2013), 42. http://www.pembina.org/pub/2404
16 Mining tailings production intensity refers to what’s known as “mature fine tailings”. The sand particles in tailings settle to form a stable deposit fairly quickly, while the finer clay particles take decades to settle (these are known as fluid fine tailings). In three to five years, the fluid fine tailings will concentrate to about 30 or 35 per cent solids at which time they are referred to as mature fine tailings (MFT). Because these mature tailings don’t settle out and cannot be reclaimed without substantial processing, more and larger tailings ponds have been required over the years as production has increased.
17 R.J. Mikula, “Advances in oil sands tailings handling: building the base for reclamation,” In Restoration and Reclamation of Boreal Ecosystems: Attaining Sustainable Development, D.H. Vitt and J.H. Bhatti, editors (Cambridge University Press, 2012).
18 Alberta Environment and Sustainable Resource Development, “Oil Sands Information Portal.”

13 Forecasting the impacts of oilsands expansion www.pembina.org
19 The City of Vancouver is 114.9 km2 in size or 114,900,000 m2. The volume of tailings (m3) was divided by the surface area to find a depth of 7 metres.
20 This value is approved oilsands production only. However, should industry and government projections be accurate, production levels of this magnitude may be realized by 2025. Oilsands Review, “Statistics: Oilsands Production.”
21 Mikula, “Advances in oil sands tailings handling.”
22 2.4 million barrels of mineable production/day x 1.57 bbl of MFT/bbl of bitumen = 3.77 million barrels of MFT/day. 3.77 million barrels of MFT per day is equivalent to 1.4 billion barrels of MFT per year.
23 Area of New York’s Central Park is 339 ha, or 3,339,000 m2. Daily production of tailings in 2022 is projected to be 2,405,849 barrels or 382,500 m3, which gives a covering of 0.115 m per day or 3.45 metres (11.3 feet) per month.
24 Simon Dyer and Richard Schneider, Death by a Thousand Cuts: The Impacts of In Situ Oilsands Development on Alberta’s Boreal Forest (Pembina Institute, 2006), 10. http://www.pembina.org/pub/1262
25 Simon Dyer, Jeremy Moorhouse and Marc Huot, Drilling Deeper: the In Situ Oil Sands Report Card (Pembina Institute, 2010), 30. http://www.pembina.org/pub/1981
26 Sarah Jordaan, David W. Keith and Brad Stelfox, “Quantifying land use of oil sands production: a life cycle perspective,” Environmental Research Letters 4 (2009).
27 In situ land intensity average value of 0.115 m2/m3 SCO (from Jordaan et al.) is equivalent to 0.0000018 ha per barrel. According to CAPP, in situ production in 2011 is 833,000 barrels per day. 833,000 barrels per day*0.0000018 ha per barrel results in 1.5 ha of land disturbance per day. This is approximately equal to 3 football fields per day.
28 Shell Canada Limited, “Application for Approval of the Jackpine Mine Expansion Project - Environmental Impact Assess-ment.” Vol. 1, Project Description, 2007, 19-6. http://www.shell.ca/en/aboutshell/our-business-tpkg1/upstream0/oil-sands/jackpine-mine-expansion.html
29 Bob Dunbar, Existing and Proposed Canadian Commercial Oil Sands Projects (Strategy West Inc., 2008). http://www.strate-gywest.com/downloads/StratWest_OSProjects.pdf
30 “Application for Approval of the Jackpine Mine Expansion Project,” Vol. 1, P-iii.
31 Area of an American football field = 120 x 53.3 yards = 6,396 sq yards = 0.54 hectares. http://en.wikipedia.org/wiki/American_football