Forecasting System at IKEA Jönköping - Simple437863/FULLTEXT01.pdf · Master´s Thesis in...
57
J ÖNKÖPING I NTERNATIONAL B USINESS S CHOOL JÖNKÖPING UNIVERSITY Forecasting System at IKEA Jönköping Master thesis within International Logistics and Supply Chain Management Author: Mahir Dugic Daniel Zaulich Tutor: Susanne Hertz Hamid Jafari Jönköping May 2011
Transcript of Forecasting System at IKEA Jönköping - Simple437863/FULLTEXT01.pdf · Master´s Thesis in...
J Ö N K Ö P I N G I N T E R N A T I O N A L B U S I N E S S S C H O O L JÖNKÖPING UNIVERSITY
Forecasting System at IKEA Jönköping
Master thesis within International Logistics and Supply
Chain Management
Author: Mahir Dugic
Daniel Zaulich
Tutor: Susanne Hertz
Hamid Jafari
Jönköping May 2011
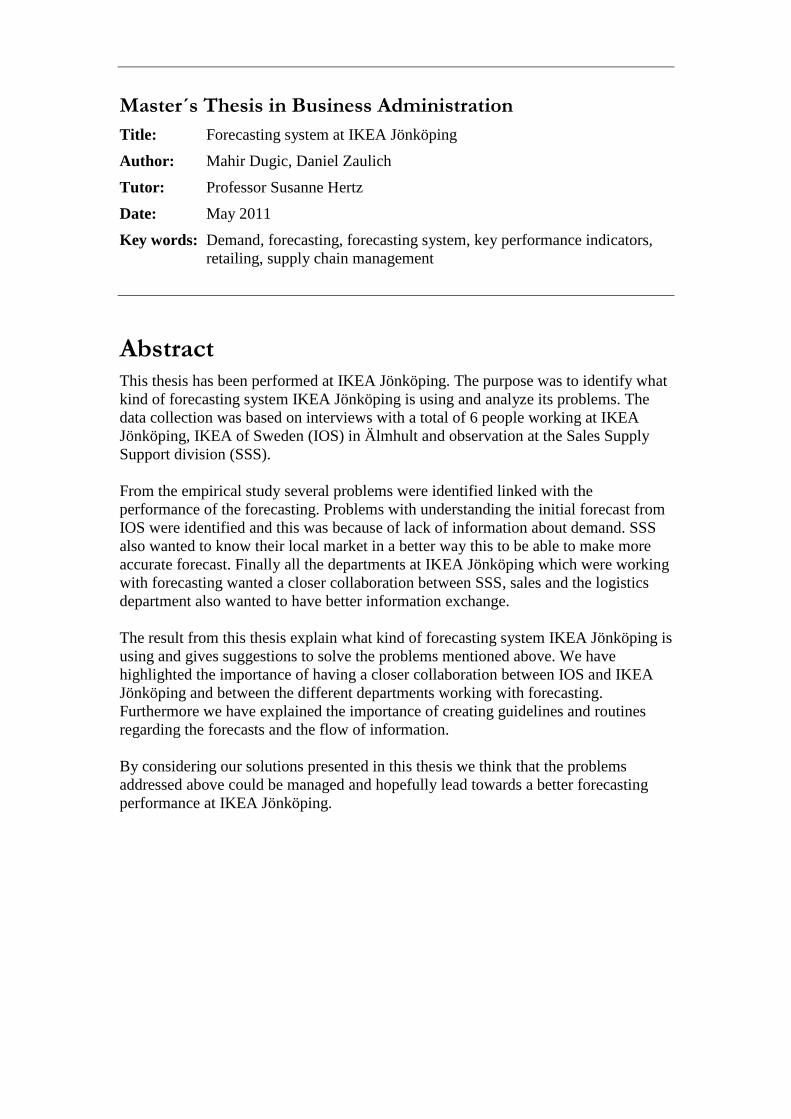
Master´s Thesis in Business Administration
Title: Forecasting system at IKEA Jönköping
Author: Mahir Dugic, Daniel Zaulich
Tutor: Professor Susanne Hertz
Date: May 2011
Key words: Demand, forecasting, forecasting system, key performance indicators,
retailing, supply chain management
Abstract
This thesis has been performed at IKEA Jönköping. The purpose was to identify what
kind of forecasting system IKEA Jönköping is using and analyze its problems. The
data collection was based on interviews with a total of 6 people working at IKEA
Jönköping, IKEA of Sweden (IOS) in Älmhult and observation at the Sales Supply
Support division (SSS).
From the empirical study several problems were identified linked with the
performance of the forecasting. Problems with understanding the initial forecast from
IOS were identified and this was because of lack of information about demand. SSS
also wanted to know their local market in a better way this to be able to make more
accurate forecast. Finally all the departments at IKEA Jönköping which were working
with forecasting wanted a closer collaboration between SSS, sales and the logistics
department also wanted to have better information exchange.
The result from this thesis explain what kind of forecasting system IKEA Jönköping is
using and gives suggestions to solve the problems mentioned above. We have
highlighted the importance of having a closer collaboration between IOS and IKEA
Jönköping and between the different departments working with forecasting.
Furthermore we have explained the importance of creating guidelines and routines
regarding the forecasts and the flow of information.
By considering our solutions presented in this thesis we think that the problems
addressed above could be managed and hopefully lead towards a better forecasting
performance at IKEA Jönköping.
Contents
1 Introduction ............................................................................... 1
1.1 BACKGROUND .......................................................................................................... 1 1.2 PROBLEM DEFINITION .............................................................................................. 2 1.3 PURPOSE ................................................................................................................... 2 1.4 RESEARCH QUESTIONS .............................................................................................. 2 1.5 DELIMITATIONS ........................................................................................................ 3 1.6 OUTLINE OF THE THESIS ........................................................................................... 3
2 Frames of Reference ................................................................... 4
2.1 SUPPLY CHAIN MANAGEMENT IN RETAILING ...................................................................... 4 2.1.1 Retailing ............................................................................................................................ 5 2.1.2 Stockout ............................................................................................................................. 6 2.1.3 Demand management ......................................................................................................... 6 2.1.4 Inventory management ........................................................................................................ 8 2.1.5 Warehousing cost ................................................................................................................ 8 2.1.6 Classification of customers and products .............................................................................. 8
2.2 POSTPONEMENT AND SPECULATION .................................................................................... 9 2.3 FORECASTING ........................................................................................................................ 10
2.3.1 Data collection for forecasting ............................................................................................ 11 2.3.2 Working with forecasts ..................................................................................................... 12 2.3.3 Forecasting techniques ....................................................................................................... 14
2.4 CHOOSING FORECASTING METHOD .................................................................................... 15 2.5 PERFORMANCE MEASUREMENT AND KEY PERFORMANCE INDICATORS ........................ 16
2.5.1 Forecasting performance and accuracy ................................................................................ 17 2.6 SUMMARY OF THE FRAME OF REFERENCE .......................................................................... 18
3 Methodology ............................................................................ 20
3.1 CHOICE OF METHOD ............................................................................................... 20 3.2 CASE STUDY ............................................................................................................ 20 3.3 DATA COLLECTION ................................................................................................. 20
3.3.1 Primary and secondary data ................................................................................. 21 3.3.2 Observations ..................................................................................................... 21 3.3.3 Interview ........................................................................................................... 22
3.4 DATA ANALYSIS ...................................................................................................... 22 3.5 THE INTERVIEW AND OBSERVATION PROCESS ......................................................... 22 3.6 RELIABILITY AND VALIDITY .................................................................................... 23
4 Empirical study ........................................................................ 25
4.1 HISTORY & FACTS ................................................................................................................. 25 4.1.1 Home furniture market in Sweden .................................................................................... 25 4.1.2 IKEA in southern Sweden ............................................................................................... 25
4.2 IKEA JÖNKÖPING ................................................................................................................ 26 4.3 IKEA OF SWEDEN ................................................................................................................ 27
4.3.1 Working with forecasts ..................................................................................................... 28 4.3.2 Initial forecast for new products ......................................................................................... 28 4.3.3 Key performance indicators ................................................................................................ 29
4.4 FORECASTING SYSTEMS AT IKEA JÖNKÖPING ................................................................. 29 4.4.1 Maintaining Stock levels .................................................................................................. 30
4.4.2 Initial forecast for new products ......................................................................................... 31 4.4.3 Working with SRS .......................................................................................................... 31
4.5 PERFORMANCE MEASUREMENTS ......................................................................................... 32 4.6 PROBLEMS ............................................................................................................................... 32
5 Analysis .................................................................................... 34
5.1 WHAT KIND OF FORECASTING SYSTEM IS IKEA JÖNKÖPING USING TODAY? ............. 34 5.2 WHAT ARE THE PROBLEMS WITH THE CURRENT FORECASTING? .................................... 34
5.2.1 Sale Supply Support and IKEA of Sweden ...................................................................... 35 5.2.2 Sale Supply Support and the local market ......................................................................... 35 5.2.3 Sale Supply Support and the department of sales and logistics ............................................ 36
5.3 WHAT KIND OF SOLUTIONS COULD BE INDICATED TO IMPROVE THE FORECASTING
SYSTEM? ............................................................................................................................................ 37 5.3.1 Sale Supply Support and IKEA of Sweden ...................................................................... 37 5.3.2 Sale Supply Support and the local market ......................................................................... 38 5.3.3 Sale Supply Support and the department of sales and logistics ............................................ 38
5.4 PERFORMANCE ANALYSIS AT IKEA JÖNKÖPING ............................................................. 39 5.4.1 Service levels ..................................................................................................................... 40
6 Discussion ................................................................................ 41
6.1 FUTURE RESEARCH AREAS .................................................................................................... 42
7 Conclusion ............................................................................... 43
8 References ................................................................................ 44
Appendices APPENDIX 1 INTERVIEW QUESTIONS
APPENDIX 2 IKEA JÖNKÖPING KPI
Figures
FIGURE 1.TCI SERVICE TO THE RETAILING SECTOR (AGARWAL, 2007) 4
FIGURE 2. MAP OF IKEA STORES IN SWEDEN (INTER IKEA SYSTEMS, B.V, 2011) 26
FIGURE 3. IKEA JÖNKÖPING AND A6 CENTER 27
FIGURE 4. GLOBAL FORECASTS AT IKEA 28
FIGURE 5. FORECAST ACCURACY AT IKEA 29
FIGURE 6. SERVICE LEVELS AT IKEA 30
FIGURE 7. IKEA JÖNKÖPING AVERAGE KPI 40
Tables
TABLE 1. EVALUATION OF DIFFERENT FORECASTING METHODS (OLHAGER, 2000). 16
1
1 Introduction This chapter has the aim of explaining general information that leads to the purpose
of the thesis. First presented in this chapter is the background, problem definition and
the purpose of the thesis. Finally delimitations and outlines of the thesis are stated.
1.1 Background The retailers role of the supply chain is to connect the customer with the manufacturer
in order to create value to products and services by providing an assortment, breaking
bulk, holding inventory and providing services. Furthermore retailers have created an
increasing role of the supply chain management activities (Levy & Weitz, 2009).
Van Hoek, Commandeur, & Vos (1998, p.33) explain that “Demand is becoming
increasingly variable and uncertain in time and place … there are still differences in
local culture, demand and taste”. Today´s market is in general more obvious and less
disordered; this is because of steady removal of barriers which affects the trade and
investments by actors in foreign countries (ibid). To meet the customer requirements
the products need to have a special character of qualities and that these qualities need
to fit in relation to its future area of use, furthermore these qualities must be available
at the time when the customer needs it (Alderson, 1950).
Supply chain management is a concept that has been developed to meet the customers
demand. Harland (1996) describes the supply chain as the distribution of physical
goods and information between nodes in the chain. To manage all the business
activities in the supply chain the term supply chain management is widely used.
Douglas et al (1996, p.1) define the activities as “Supply chain management is the
management of material and information flows both in and between facilities, such as
vendors, manufacturing and assembly plants and distribution centers” An important
part within the supply chain process is demand management and Lambert & Cooper
(2000, p.73) define the process as “managing demand involves attempting to
determine what and when customers will purchase”. Furthermore Langley et al
(2009) explain that demand management is a focus effort to approximate and handle
customers demand and using the information to make organizational decisions.
Supply chain activities such as postponement and speculation strategies are different
methods to meet the customer requirements. When using the speculation concept a
company is performing the required activities at the earliest possible time in the
supply chain, this to gain benefits such economies of scale and reduce the risk of
stockouts. Within the speculation strategy a company is ordering larger quantities
instead of using minor and more regular orders, by doing so a company will also
lower its cost for transportation and cost related for sorting the goods (Bucklin, 1965).
Twede, Clarke, & Tait (2000, p. 106) describes that “Speculation is the basis for
traditional logistics model” and that this kind of strategy is based on using forecasting
methods.
Bureau of Justice Assistance (2011) explain forecasting as “Estimating the likelihood
of an event taking place in the future, based on available data from the past”. According to Arnold, Chapman, & Clive (2007) there are several reasons to forecast
the future demand. One of them is that it helps the company to plan its production and
resources in a better way, to be more cost efficient and also to be able to offer right
2
products at the right time when the customer wants it. Benefits from forecasting are
according to Bucklin (1965) lower production cost since no modification is needed
after customer order has been received and the possibility to offer higher customer
service since the products are already in stock, meaning to have the possibility to offer
shorter delivery time.
1.2 Problem definition Retailers have the pressure from the market to meet the customer demand, if the
retailers do not meet this demand there is a large possibility that the customer would
not go back to the retailer. Retailers do not always know how much that should be put
in inventory to meet customer requirements (Levy & Weitz, 2008). Some of the
problems that can occur are that, the retailers are keeping low inventory levels and in
that way increase the risk for having a stockout. On the other hand having too high
inventory levels will increase the cost related for handling the inventory. Simchi-Levi
et al (2003) explain that by having inaccurate predictions about the demand it can
affect the overall performance of the supply chain, this in turn can result inefficient
use of resources and obsolete inventory.
To help the whole supply chain with predicting the correct demand there are several
different systems to work with forecasting. Arnold, Chapman, & Clive (2007)
mention that one of the principles about forecasting is that forecasts are usually
wrong. Retailers can minimize the errors of forecasting by working with the
appropriate forecasting systems for their market. This can help retailers supply and
storing the right goods to meet the requirements from their customers.
The problem about predicting a fully accurate demand is also something that IKEA is
facing. One of the challenges for IKEA which affects their forecasting system is to
have a better understanding about their customers and knowing their local market in a
better way. This makes it an interesting area to study and analyze what kind of
forecasting system IKEA Jönköping is using and what kind of problem it is facing.
1.3 Purpose The purpose of this thesis is to identify the forecasting system which IKEA Jönköping
is using and analyze its problems.
1.4 Research questions To be able to solve the purpose these different research question needs to be
answered.
1. Identify what kind of forecasting system is IKEA Jönköping using today?
2. What are the problems with the current forecasting?
3. What kind of solutions could be indicated to improve the forecasting system?

3
1.5 Delimitations We have focused on IKEA Jönköping and the departments related with forecasting.
This study will not make a comparison towards other companies or other IKEA
stores; instead it is a single case. Furthermore we have not implemented anything; this
study will only indentify and give indicators for improvements.
1.6 Outline of the thesis The thesis is divided into four parts, first the theory that is relevant to understand the
study. The second part presents the methodology used to conduct the study. The data
collected forms the basis of the third part with empirical study and analysis. In the last
part we discuss our findings, problems and indicators to solve the problems.
4
2 Frames of Reference This chapter focuses on theories related to demand forecasting. The chapter starts
with supply chain management, continues with the strategies of postponement and
speculation in brief and finally presents forecasting techniques, methods and
performance measurements.
2.1 Supply chain management in retailing Retailers have traditionally been small-sized and the large manufactures have
traditionally decided how the supply chain would be managed, but now retailers have
an increasing role in supply chain management activities. The size of the retailers has
made them more powerful than the manufactures (Levy & Weitz, 2008).
Christopher (2005, p.5) define supply chain management as "the management of
upstream and downstream relationships with suppliers and customers to deliver
superior customer value at less cost to the supply chain as a whole”.
The supply chain is a distribution of physical goods and information between nodes in
the chain. The work of managing the supply chain is about performance for customer
satisfaction as delivery reliability, cost, price and time (Harland, 1996).
Supply chain management is according to Levy & Weitz (2008, p.278) “a set of
approaches and techniques firms employ to efficiently and effectively integrate their
suppliers, manufactures, warehouses, stores and transportation intermediaries to
efficiently have the right quantities, at the right location, and at the right time”
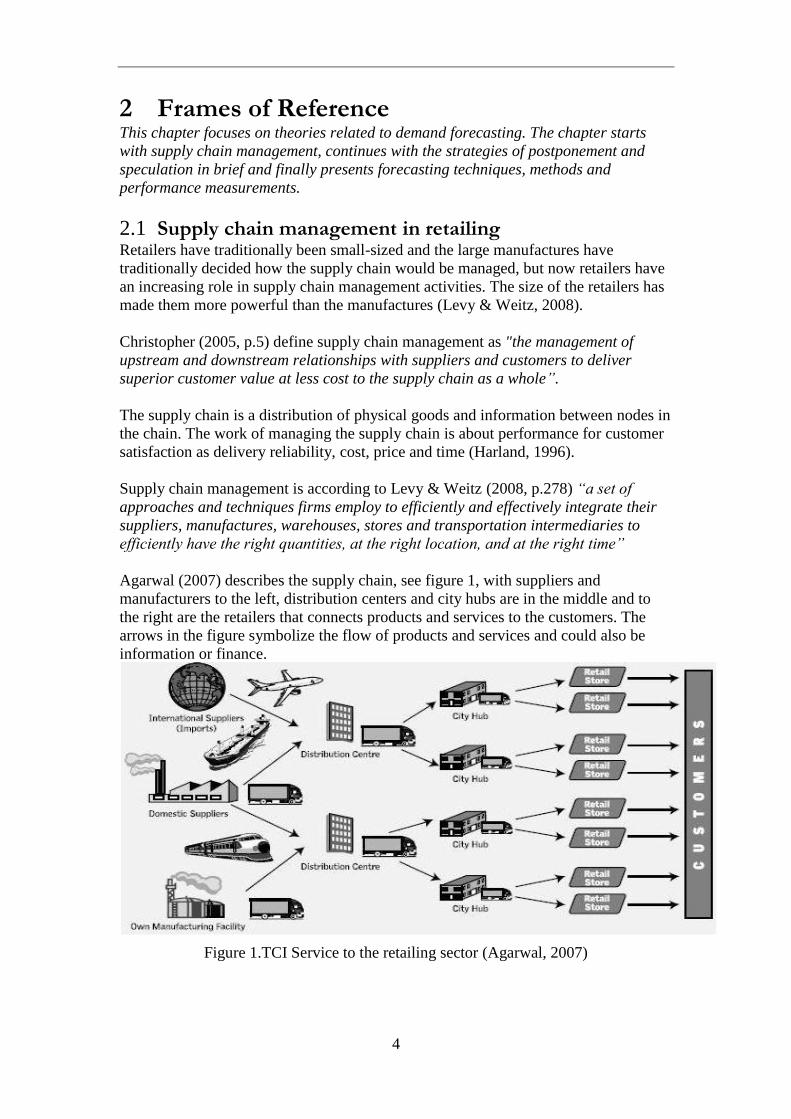
Agarwal (2007) describes the supply chain, see figure 1, with suppliers and
manufacturers to the left, distribution centers and city hubs are in the middle and to
the right are the retailers that connects products and services to the customers. The
arrows in the figure symbolize the flow of products and services and could also be
information or finance.
Figure 1.TCI Service to the retailing sector (Agarwal, 2007)
5
Harland (1996) mention that supply chain management are the supervision of a
network with connected businesses. Within this area the task are to provide services
and products to the end customers.
Furthermore the author explains that supply chain management is the internal supply
chain that integrates business functions involved in the flow of materials and
information. It is the management of a twofold relationship with suppliers and also
with suppliers‟ supplier.
2.1.1 Retailing
The final business in the supply chain is the retailer that connects the manufacturer to
the customers. The supply chain starts with the manufacturer that send the products to
the wholesaler that distribute the products to various retailers (Levy & Weitz, 2009).
Risch (1991, p.2) defines retailing as “the sale of small quantities of commodities to
the ultimate consumer”. Furthermore the author explain that the retailer has the
objective to split large quantities into more suitable quantities for the customers. The
author presents five goals for retailing; the first is to be able to forecast what the
customer wants, when and in which quantity. The retailer needs to be able to buy
merchandise in the best economical way as possible and know what to buy that will
generate in sales. To be able to sell the merchandise it is important to have useful
promotion and advertising strategies. The last goal for retailers is to build a permanent
clientele and image of goodwill (Risch, 1991).
Business activities that adds value to the products and services sold to consumers is
related with retailing. Retailing also includes sales of services and retailing does not
have to be conducted in stores, internet is an example where retailing can take place
(Levy & Weitz, 2009).
There are manufacturers that perform both production and retailing, they sell directly
to customers. A wholesaler buys goods from manufacturers in large quantity, store the
goods and resell the goods in smaller quantities. Supply chains that are vertical
integrated is according to Levy & Weitz (2008) an organization that performs more
than one set of activities in the supply chain, such as wholesaling and retailing.
According to Simchi-Levi, Kaminsky, & Simchi-Levi (2003, p.190) customer value is
“the way the customer perceives the entire company’s offerings, including products,
services, and other intangibles”. The customers‟ perception can be divided into
several parts. The first is conformance to requirements, meaning to have the right
products with the right requirements. Product selection is the variety of products, for
example colors and shapes. Price and brand is the acceptable price range for a product
or service, meaning that more luxury or well known brands can have higher prices
which are accepted by the customers. Value-added services are support and
maintenance that can be an important way to attract and satisfy the customers. The
final part is the relationships and experiences between the customer and the firm. By
creating good customer relationship the customer will return to the firm since it will
be time consuming for the customer to switch to another retailer (ibid).
6
Retailers can increase value of products and services they sell to customers by provide
important functions. The value-creating function includes;
1. Providing an assortment of products and services
2. Breaking bulk
3. Holding inventory
4. Providing services (Levy & Weitz, 2009).
Providing assortment means that the retailer offers a wide selection of example
brands, design and seizes. This will make it more convenient for the customers to buy
many different types of products at one place. To reduce transportation cost
wholesalers and manufacturers send large quantities. This is not convenient for
customers so retailers use a process called breaking bulk and divides products to more
manageable quantities. Holding inventory is a value-creating function for customers
so they do not need to have large quantities of goods at home. Customers know that
the retailer have goods in inventory and available for sale. Providing services for
customers is for an example; store credit for those who want to pay later, display and
test products before buying and information about product in store or online (Levy &
Weitz, 2009).
2.1.2 Stockout
Retailers connect customers with suppliers and their product. The retailers have a
responsibility to know what the customers wants, needs and make it available when
they want it. To do this, retailers need to work with suppliers, distributors and
transportation firms, all members of the supply chain (Levy & Weitz, 2009).
When a customer wants a product that the retailer does not have available a stock out
occurs. There are a number of effects on the customer and retailer when a stock out
occurs. The customer visits the retailer and finds out that the product is out of stock.
The retailer could give a rain check that enables the customer to come back and pay
full price for the product when it is available again, but the first trip was unnecessary
for the customer. The customer might buy another product or model instead. There is
a possibility that the customer will go to another retailer nearby and buy the product
there. In the future the customer might become reluctant to the retailer and tell other
customers about the negative experience, all because of the stock out. Data shows that
experience of a stock out for the first time, customers buys a substitute product 70
percent of the time. The second time a stock out occurs for a customer the rate drops
to 50 percent, with the customer going to competitors half of the time. If the customer
experience a third stock out at the same retailer, the sale is lost entirely 70 percent of
the time and almost certainly, the customer‟s loyalty to the retailer (ibid). Christopher
(2005) points to a research that suggest that more than 66 percent of the customers
made the shopping decision at the point of purchase, this means that if the product is
not on the shelf the purchase will not occur. If stock outs continue to happens,
customers will drive away from the brand or the retailer permanently, the loss of
business for the whole supply chain is clearly significant (ibid).
2.1.3 Demand management
Demand management is a focus effort to approximate and handle customers demand
and using the information to make organizational decisions (Langley, Coyle, Gibson,
7
Novack, & Bardi, 2009). Mentzer (2004, p.126) define the concept as “the creation
across the supply chain and its markets of a coordinated flow of demand”.
There are a number of ways that effective demand management will help
organizations satisfying and solving customer‟s problems. Organizations should
gather and analyze knowledge about customers‟ problems and needs. Identifying
partners to perform the functions needed in the demand chain and move these
functions to members in the supply chain so they can perform the most efficient and
effective. Organizations can share knowledge about consumers, technology, logistics
challenges and opportunities with other member in the supply chain to better solve
customers' problems. With these demand management the supply chain can develop
products and services that solves customers‟ problems and later on develop and
implement the best logistics, transportation and distribution methods to meet
consumers demand (Langley et al, 2009).
It is important that the marketing and the logistics functions shares information about
demand. If the marketing function implements a promotional plan and do not share
information about this to the logistics managers that schedules orders to the store, the
demand is increased but not the inventory levels. This will result in dissatisfied
customers and a failed promotional plan because there were not enough products to
sell. This is called “advertising for the competition” because of the stock out the
disappointed customers‟ buys products from competitors and creates demand there
instead (Mentzer, 2004). Furthermore the author explain that an important role of
demand management is to decrease demand, this is because of some products are less
profitable and demand management can make an assessment of the most profitable
products and emphasize demand on these while decreasing demand for the
unprofitable ones (Mentzer, 2004).
There are number of problems demand management has to handle within an
organization. First problem is the lack of synchronization between departments; this
make no or little coordinated response to information about demand. Second is that
too much emphasis is placed on forecasts of demand, with little or no thought on the
joint efforts and operational and strategic plans that are based on forecasts. Third
problem is that information of demand is used more for tactical and operational rather
than strategic purposes (Langley et al, 2009). Furthermore the author explain that the
supply-demand misalignment as an incident that occurs when there is little or no
collaboration between the manufacturer and the retailer when it comes to real demand.
When launching a new product demand is high and short afterwards the retailers have
a problem to meet the demand, there is a true shortage of the product. At this time
distributors, resellers and retailers tend to “over-order” to reduce the risk of stockouts,
this is creating a substantial “phantom” demand instead. When production starts to
increase and retailers begin to fill inventories a price competition starts, as do product
overages and returns. All this lowers the real demand and retailers become over-
supplied by the product. This is basically because of the supply chains planning
processes and the forecasting system that are made to use historical data of demand as
a measurement with no or little understanding of the changes in demand over time
(ibid).
8
2.1.4 Inventory management
There are two basic decisions for managing inventory; how much to reorder and
when. To determine a suitable solution for this, manager could use a few simple
calculations. Today these decisions are added with where and what inventory should
be held. Inventory decision has become more complex, this is because organizations
are working to manage inventories more effectively and lower cost. There are
different approaches for inventory demand and the most suitable approach depends in
what market the organization operates in. Basically, the more complex the situation is
for the organization, the inventory approach has to be more sophisticated (Langley et
al, 2009).
2.1.5 Warehousing cost
By holding inventory, different cost related for storing the goods will be obtained.
Some part of the cost is fixed, for example the rent of the warehouse meanwhile other
costs are variable such as the personnel cost, insurance cost and cost related for
handling the goods. The reason why some of the cost is variable is because the more
inventories a company is storing then more of the variable cost will be needed
(Mattsson & Jonsson, 2003).
Langley et al (2009, p.44) explain that “Carrying cost include interest expense (or the
opportunity cost associated with the investment in inventory), risk related cost
(obsolescence, depreciation), and service-related costs (insurances, taxes)”,
furthermore the authors explain that warehousing cost is the cost which all can be
connected with storing the goods. Christopher (2005) also agrees that the true cost of
inventory is connected to the cost of capital, storage and handling, obsolescence,
damages, shrinkage, insurance and management cost.
2.1.6 Classification of customers and products
To be able to offer the best possible customer service a company needs to decide
which products or customer it should put more effort on, this because if a company
wants to offer high customer service for all its customer and products a high total cost
will be achieved. There is a risk that products and customers which are important for
the company can obtain lower customer service meanwhile products and customer
that are not that valuable for the company can achieve high customer service. Other
effects that can be result from trying to deliver high customer service in all areas is the
opposite meaning low service performance (Jonsson & Mattsson, 2005).
By categorizing its customer and products, a company can identify which ones are
creating value and focusing on providing them higher customer service (Arnold,
Chapman, & Clive, 2007). Furthermore the authors explain that categorizing helps the
company to have better control of the customer and products that are important for the
company.
Olhager (2000) explain that the purpose of classification needs to be identified by the
company before the works is being implemented. The author explain that classifying
customer and products can have different objects and goals, such as to ease the
forecasting, keeping inventories at predetermined levels and to be able to make
analysis of the company‟s assortment.
Jonsson & Mattsson (2005) mentions that usually a small amount of a company‟s
products or customer is a major part of the company‟s total revenue ration. The
9
authors explain that usually 20% of company‟s customer or products are covering
about 80% of the company‟s total revenue. By categorizing the products and
customer for example after their revenue ratio, a company can identify their most
profitable ones. Arnold, Chapman, & Clive (2007) explain that this method is called
ABC Analysis or even sometimes referred as to Pareto‟s law.
By using the ABC Analysis products are usually divided into three categories, A, B
and C, sometimes even more categories (Arnold, Chapman, & Clive, 2007). The focus
for the company lies on concentrating on products or customers in the A category
because this category is the one that generates most profit for the company (Flores &
Whybark, 1986)
2.2 Postponement and Speculation There are different types of strategies to meet customer demand; one of them is to use
postponement strategy (Bucklin, 1965). In 1950 Alderson started the discussion about
the postponement concept and from observations it was noticed that products became
differentiated the closer it came to purchase point (Ernst & Kamrad, 2000).
According to Christopher (2005, p.134) “Postponement refers to the process by which
the commitment of a product to it’s finally form or location is delayed for as long as
possible”. Furthermore the author explain that there is always a risk that the customer
doesn‟t want the finalized product, therefore by using postponement the final
customization of the product is being delayed.
A simplified explanation of postponement could be that the activities in the supply
chain are being delayed until customers‟ orders are received. Postponement can be
used through the complete supply chain and also in different-sized production or
logistics operations (van Hoek, 2001).
Another strategy to meet customer demand is to use speculation strategy and Twede,
Clarke, & Tait (2000, p. 106) describes that “Speculation is the basis for traditional
logistics model” and that this kind of strategy is based on using forecasting methods.
When using the speculation concept a company is doing the required activities at the
earliest possible time in the supply chain, this to gain benefits such economies of scale
and reduce the risk of stockouts (Bucklin, 1965).
Waller, Dabholkar, & Gentry (2000) mention that by using speculation strategy a
company adds value to the order before it is received and Pagh & Cooper (1998)
explains that speculation is the opposite system towards postponement.
Speculation can be linked to the assembly process make-to-stock (MTS) since
Langley et al (2009, p. 553) explain that “MTS is the traditional production method
where end-item products are usually finished before receipt of customer order. By
using this process products are already finished and stored in the inventory and
refilled by forecasting the future demand. Furthermore the author explain that this
process is based on previous sales data and that it works well with products of high-
volume (ibid).
10
A company can gain economies of scale by using speculation strategy because the
company is ordering larger quantities instead of using smaller and more frequent
orders. This will also lead to lower cost for transportation and sorting the goods.
Speculation strategy reduces also the risk of losing sales this due that the inventories
are being pushed forward within the supply chain at the earliest possible time
(Bucklin, 1965).
The benefits that can be obtained by using speculation are that the production cost
will be lower since there is no modification or customization on the products after
customer order has been received. Higher customer service will be obtained since the
company using speculation strategy can offer shorter lead times since the products
already are on stock. Lower distribution cost since larger quantities are being ordered
which can lower the handling and delivery cost (Bucklin, 1965) (Langley, Coyle,
Gibson, Novack, & Bardi, 2009) meanwhile one of the disadvantages of using
speculation strategy is according to Pagh & Cooper, (1998) an increased inventory
cost.
2.3 Forecasting Jonsson & Mattsson (2005) mention that forecasting is being used for a company to
plan its resources and its capacity to be able to meet the customer demand in the best
possible way. Forecasting have also daily impacts on different levels within a
company, levels such as strategic, operational and tactical. The most important
demand is the primary demand. The primary demand is affecting the rest of the supply
chain since they are anticipating its production towards it (Langley, Coyle, Gibson,
Novack, & Bardi, 2009).
There are several reasons for forecasting and one of them is to meet the future
customer demand. Since some companies cannot wait until they receive orders from
their customers, they instead need to plan or predict what they need to produce.
Customers do not want to wait too long for their orders; therefore producers need to
plan their capacity and operations to satisfy their customers (Arnold, Chapman, &
Clive, 2007).
By having accurate forecasts retailers can create value towards its customers. Forecast
creates value by having, place, quantity and possession utility. Place utility is the role
for moving goods from the manufacturer to where the demand is, usually to a retailer
within the market area. Place utility leads to increased product availability and to
lower prices. Place utility moves goods to where demand is but time utility points to
when customers demands goods. Value is added by having goods and services
available at specific time when there is a demand. The importance of time utility has
increased considerably; today organizations are focusing on reducing lead time and
keep inventory levels to a minimum. Quantity utility is determined as the proper
amount of an item to where it is demanded. To create quantity utility organizations
use production forecasting, scheduling and inventory control. Possession utility is the
customers wanting goods or a service, basically this is demand (Langley et al, 2009)
By having inaccurate forecast it can have different effects on the company. By
forecasting too many products or to high volumes it can affect the different cost
aspects, such as; transshipment cost, inventory holding cost, and obsolescence cost.
From the other point of view by forecasting too little products, the result for the
11
company can be lost sales, higher expediting costs and missed opportunity to sell
companion products (Handfield, 2006).
Arnold, Chapman, & Clive (2007) mention some principles about forecasting which
needs to be considered; by doing this a more effective forecast will be achieved.
Forecasts are usually wrong, it is impossible to look in the future and know the level
of demand for a product, therefore forecast will be wrong to some level. Every
forecast should include an estimate of error, as mentioned above, forecast will not
always be correct; a company needs to include an error margin to their forecasts.
Forecasts are more accurate for families or group, means that it is more difficult to
predict the demand for a single product then it is for a group of products. Forecasts are
more accurate for nearer time periods, this is because it is more difficult to plan the
long future demand then the near future (ibid).
Handfield (2006) mention also some laws that are similar to principles mentioned
above; Law 1 means that forecasts are intrinsically imperfect and it is important to
know that forecast can be incorrect and it could be risky to make large impact
decision based on it. Law 2 means that forecast which are based on short-range
periods are more accurate than the ones on longer periods. This since it could be
difficult to predict the demand for one product for the next year meanwhile it is easier
to calculate the demand for the next week. Law 3 describes that forecast are more
precise and accurate when forecasting for a larger group of product instead of making
forecast for every single product.
2.3.1 Data collection for forecasting
The data input for forecast is an important area; therefore there are some practices
which need to be remembered when predicting the demand.
Establish an owner for the forecasting process; meaning that there should be a person
who is responsible for handling the inputs for the forecast. Document the forecasting
process; it is important to document what kind of inputs has been used for the
forecast, the assumptions and how the forecast was calculated. This is vital from
several points of view; the employees can always go back and see how the forecast
was handled and use the same method for future forecasts. It is also easier to improve
a forecast if it has been documented since it is easier to identify which areas that can
be improved. Analyze the variability of demand for your products and services;
meaning to analyze the factors which are affecting the variability within the demand.
Furthermore it is important to understand the assumptions which the forecast is based
on. Update the forecast weekly; the annual forecast shall be updated every week this
so that every parties that are being affected by the forecast, such as supplier and other
departments, should be updated about the current situation. Establish information
systems to support the forecasting process; it is important to have a system which
shares information that can affect and help the employees working with forecasting to
make even more accurate calculations (Handfield, 2006).
Arnold, Chapman, & Clive (2007) mention also some important principles regarding
the collection of data which the forecast is based on:
1. Record data in the same terms as needed for the forecast. By this principle it
is meant that only relevant information is needed to be gathered. An example
12
is that its not necessary to gather information about number of shipments if the
forecast is regarding the production demand. The forecast should also be in
same time period as the production schedule. Another important aspect to
remember is that if a product have several different customization options,
these options should be included in the forecast
2. Record the circumstances relation to the data. The customer demand can by
affected by different types of actions, an example is that actions such as
promotions, weather changes, competitors actions.
3. Record the demand separately for different customer groups. This principle
explain the importance of forecasting the demand for every customer itself
instead of forecasting the overall demand, this because a producer uses
different types of distribution channels.
The first principle regarding forecasting and why they are usually wrong and also
deficient has according to Jonsson & Mattsson (2003) several reasons. One of them is
that the current forecasting method which a company is using is not efficient enough.
Forecasting can be done by either using computers who use automatic forecasting
methods or by using manual human methods. A way to create better forecasting is to
implement new routines for manual methods and get better reliable information for
the automatic methods and also to combine these two different methods.
2.3.2 Working with forecasts
When working with forecasting it is important to check that the data which is being
used as input is correct and valid. By comparing the new forecast with previous one
combined with researches to get conformity of the demand a more reliable forecast
will be achieved. When using the previous forecast history as an input to the new
one, the factors which were affecting the demand needs to be updated. For example,
the company needs to identify if threat from competitors and the overall health of the
economy is the same since the last forecast. This can all be done by making
researches on the internet or gathering information from managers within sales and
marketing department (Handfield, 2006).
Furthermore Chopra & Meindl (2007) mention some important factors which needs to
be remembered when working with forecast. Understand and identify customer
segments; it is important for a company to map its different customer segments. This
can be done by categorizing them after similarities, demand volumes, order frequency
etc, and further on a company can use different forecasting techniques for these
different customer groups. By indentifying the different customer groups which the
company serves a more precise forecasting can be obtained. Identify major factors
that influence the demand forecast; Simplified meaning that the company should
indentify the factors which are affecting the demand. An example could by if a
company is promoting a certain product and the demand is being higher this special
event should be noted and the company should also identify how the promotion has
affected the demand of the product.
13
Kahn (1998) points out the importance for employees working with forecasting to
know the basics of business forecasting, this because they will appreciate the forecasts
in a better way. The users also need to understand how forecasts are prepared like
basic concepts and not necessarily need to know the algorithms. They also need to
know the factors that are affecting the forecasts and past patterns. To do this a cause
and effect model can be used to better understand the factors affecting the forecasts.
The users need to understand that forecast are based on a plan and are not the plan or
goal itself.
Furthermore Kahn (1998) explains six rules for users when reporting forecasts.
Forecasts have to be in as much detail as needed. Specify the assumptions that are
used in the forecast. Give response to deviations in forecasts. Sometimes forecast
need to be under different scenarios. Make sure forecasts are internally consistent,
users often have own suspicion about forecast and if one thing is wrong the whole
forecast will be considered wrong. Give forecasts along with actuals, users will then
see where they are and where they are going and also to standardize the forecast
format so the user can find what they are looking for.
2.3.2.1 Lumpy demand One of the problems for some companies is that the demand for some of their
products has randomly variation in demand, which in turn can affect the forecasting
system if the system is based on seasonality and trends. An example of lumpy
demand is when rare large order occurs because of unusual or not foreseen reasons or
when seasonality has not been included in the forecast (Ballou, 2004).
There are some ways to be better prepared when predicting the demand which has
irregular demand. First of all it is important to analyze the reasons behind the
lumpiness. When this is done the forecast can be divided so that products whit lumpy
demand has their own forecasting method or technique meanwhile those product whit
a more regular demand has their own method (ibid).
Furthermore forecast methods which react slowly on changes in market could be more
suitable to use, such as exponential smoothing. Finally carrying extra inventory for
products with lumpy demand could be more cost efficient than focusing on correcting
the forecast accuracy (ibid).
2.3.2.2 Collaborative forecasting Another method to handle irregular and lumpy demand is by making collaborative
forecasting. Ballou (2004, p.315) explain that “multiple parties have the likelihood of
producing more accurate forecast that a single party”. This method is being
performed by using information from other departments, organizations, suppliers
within the supply chain, with the common objective to reduce the risk of creating
inaccurate forecasts.
By collaborating with other actors within the supply chain and share information a
higher level of accurate forecasts can be achieved. Even though implementing
collaboration could be complex and time consuming, the level of benefits is higher
than the total cost invested (Chopra & Meindl, 2007).
Before the work with collaborative forecasting can start there are several different
areas which need to be handled. First of all the employees working with the
14
forecasting needs together to identify what kind of information during the information
exchange process is necessary to have and create schedules regarding when the
meetings and information exchange should occur. Even though collaborative
forecasting can be difficult to implement because it requires coordination, sharing,
consideration, compromise and commitment, the result from implementing a
successful collaboration can result in a more accurate forecasting (Ballou, 2004).
2.3.3 Forecasting techniques
There are several different forecasting methods and techniques, but basically they can
be divided into three different categories: qualitative, extrinsic, and intrinsic (Arnold,
Chapman, & Clive, 2007).
Olhager (2000) have instead divided forecasting techniques into two categories,
qualitative and quantitative were the quantitative technique includes causal methods.
2.3.3.1 Qualitative techniques: This kind of technique is basing the customer demand on judgment and perception
(Arnold, Chapman, & Clive, 2007). Olhager (2000) mention that this technique is a
subjective method and that the demand is based for example upon, experts opinion,
market research‟s and a method called Delphi. The Delphi-method means that a jury
of experts makes assumptions regarding the demand were the goal or objective is to
conclude a united decision. Qualitative techniques are mostly used for large product
categories for a longer time period (Arnold, Chapman, & Clive, 2007).
2.3.3.2 Extrinsic techniques: “Examples of such data would be housing starts, birth rates, and disposable income”
(Arnold, Chapman, & Clive, 2007, p.223).When using this technique, the forecast is
based upon external events and information which regulates the demand for the actual
product (ibid).
Olhager (2000) has named this forecasting technique for causal method. The author
explain that a number of variables have the possibility to affect each other‟s
development. To clarify his statement he mention an example, meaning that if the
gasoline price is being raised, people will start to buy more fuel-efficient cars than
before.
Arnold, Chapman, & Clive (2007) mention extrinsic forecasting is mainly suitable for
forecasting a product group or product families instead of only forecasting single
products.
2.3.3.3 Intrinsic techniques: This method uses historical data to predict its forecast (Arnold, Chapman, & Clive,
2007). Olhager (2000) who calls this method quantitative, explain that the method is
based on quantitative models. An example of quantitative technique is a method
called time-series components. By using this method companies are including
different components which effects then demand.
Average demand
Arnold, Chapman, & Clive (2007) mention a type of technique within this category,
average demand. Simply meaning that a company is calculating its monthly demand

15
by dividing its previously year product sales with twelve. Even though it is a simple
method some rules need to be remembered, an example is if a product has a large
variation in its demand then using average demand it is not suitable.
Moving averages
This method is suitable to use when a company is expecting that the demand will
probably be the same during a longer time of period (Olhager, 2000).
For an example, by using the last three months average demand, a company can use
these numbers and calculate the next month demand. The principle is always to
exclude to first month demand and replace it with the demand for the latest month
when calculating for a new month (Arnold, Chapman, & Clive, 2007).
According to Olhager (2000) the disadvantage with this method is that it responds
slowly on the changes in the market. Another disadvantage is that a company needs a
lot of data for using this method, since perhaps a company want to calculate the
demand for the next couple of months.
Exponential smoothing
Olhager (2000) explain that exponential smoothing is an easy method to use and in
difference from moving averages it requires less data to forecast the demand. Within
this method a variable is being used, which is a value for the predicted demand for the
next period, together with latest demand and the previous forecast, all this is then used
to calculate the new demand.
Exponential smoothing is most suitable for forecasting demand within a short-range
and also the fact that it identifies trends easier then moving average, but the
disadvantage for this method is that it doesn‟t work well when the demand for a
product is low (Arnold, Chapman, & Clive, 2007).
Seasonal index
Since some products are more affected from seasonal demand, for example during
summer, winter and weekends, it is important to use a variable that helps the company
to forecast the demand in a better way (Arnold, Chapman, & Clive, 2007)
Arnold, Chapman & Clive (2007, p.229) mention that “A useful indication of the
degree of seasonal variation for a product is the seasonal index. This index is an
estimate of how much the demand during the season will be above or below the
average demand for the product”
2.4 Choosing forecasting method Since there are several different forecasting methods, it is not always easy for a
company to choose the right one. Olhager (2000) has made a table, see table 1, where
he rates different forecasting methods on how well they works depending on the
forecast horizon. Based on their functionality he has rated them on a scale from 1-5,
where 1 is poor and 5 is excellent.

16
Table 1. Evaluation of different forecasting methods (Olhager, 2000).
Forecast horizon
Short
Medium
Long
Possibility to
identify market
changes
Moving
average
2-3 2 1 2
Exponential
smoothing
2-4 2-3 1 2
Seasonal
index
2-4 2-4 2 2-3
Olhager (2000) mention that one of the most important attributes when choosing a
forecasting method are reliability, time, cost and the ability to identify market
changes. The difference between quantitative and qualitative forecasting techniques is
the amount of time and resources needed to forecast the demand and according to
Olhager (2000) the qualitative one is the more demanding. The authors mention also
that there is a difference in reliability between different quantitative methods and also
that quantitative methods are based more on routines and standardize methods.
2.5 Performance measurement and key performance indicators To be able to improve parts of a company‟s functions, it is important to have some
kind of performance measurement. Slack & Lewis (2008, p.171) mention that
“Traditionally, performance measurement has been seen as a means of quantifying
the efficiency and effectiveness of action”.
According to Chan (2003) performance measurement can be used to analyze the
feedback of activities and how well they are performing towards the predetermined
goals and objectives. Furthermore the same measurements have the possibility to
inform which areas need to be improved.
Performance measurement that has a detailed character is usually measured on a more
frequent and in a more detailed level. Even though the detailed performance
measurement only shows a specific number, they illustrate the general picture and
status of how the current activity is performing (Slack & Lewis, 2008).
Slack & Lewis (2008) mention also the importance of finding the right balance of
having a few measurements, which are easy to manage, towards having several
complex measurements, which is more difficult to handle.
According to Slack & Lewis (2008, p175.) they mention that “Whatever the
individual measures of performance which we extract from an operation, the meaning
we derive from them will depend on how we compare them against some kind of
standard”.
A way to compare the performance measurement from a company is to analyze it
towards previous data in the same area and see if an improvement has been
established. Another method is to perform a benchmark, this to compare a company‟s
17
performance within one area or department with a another company„s department in
the same area. By comparing towards another company or department a company can
learn new methods or adopt new ways of performing activities (Slack & Lewis, 2008).
According to Christopher (2005), key performance indicators (KPI) are needed when
benchmarking towards another department or company. KPI is a tool to measure the
main objective and the performance in the current department. Furthermore the author
explain that KPI is useless if it is not compared towards another department or
company. By measuring KPIs within an organization, the employees will be more
focused on the main objectives and to reach a more responsive supply chain. Finally
Christopher (2005, p.279) explain that “What gets measured, gets managed”,
meaning that if a KPI is missing the current objective cannot be managed.
Arnold, Chapman, & Clive (2007) mention that when talking about performance
measurements, the term performance standards is also being introduced. According to
the authors, performance measurement is both objective and quantified and needs to
include at minimum two different parameters. For example the performance
measurement number of customers served needs to include both the number of
customers and the time it took to serve all of the customers. Performance standards
are a company‟s objectives transformed into specific goals which a company should
try to reach.
2.5.1 Forecasting performance and accuracy Jacob, Lys, & Neale (1999) mention some important aspects that needs to been taken
into consideration regarding the performance of forecasting. First of all forecasting
can sometimes be very complex and hard to understand, therefore a company needs to
take into consideration that every person working with forecasting has different level
of understanding or as the authors explain it; a different level of aptitude.
Furthermore Hultsch et al (1990) in Jacob, Lys, & Neale (1999, p 54) explain that
“aptitude predicts about half the variance in the performance of various cognitive
tasks”. To be able to improve the performance within the forecasting area Jacob, Lys,
& Neale (1999) mention that the persons involved need to have some basic skills
related to their work to be able to improve their knowledge by doing repetitions and
receiving feedback of their work. By using and studying the previous forecasts and
understanding the errors within them the personnel can identify what needs to be
improved for the future forecasts (ibid).
Liker & Meier (2006) explain that to be able to improve a work task it needs to have a
clear guideline or to be standardized. A way to create guidelines could be by
implementing documentations where it explain how the work task should be
performed. The authors explain that by not knowing or having any structure about the
work process it is difficult to identify what needs or can be improved.
Furthermore it is important for the personnel to have awareness about the company‟s
operations. By knowing how they are being handled it will help the forecasting
department to have an even deeper understanding about their role in the chain and to
know which departments to further contact to receive the most accurately information
(Jacob, Lys, & Neale, 1999).
18
Simchi-Levi et al (2003) explain that by having poor performance within the
forecasting area it will affect the whole supply chain performance. The result would
be lost sales, inefficient use of resources and obsolete inventory. To improve the
forecast performance and accuracy the authors mention some aspects that are
important to take into consideration. First of all it is important to perform analysis of
the company‟s markets and customer and indentify trends that affect the forecast.
Another important aspect to improve the forecast performance and accuracy is
according Simchi-Levi et al (2003, p. 52) “Incorporate collaborative planning and
forecasting processes with customers so as to achieve a better understanding of
market demand and the impact of promotions, pricing events and advertising”.
Mentzer (2004) explain that people who are involved with forecasting needs to
receive personal feedback of their performance, to be able to improve every single
persons forecasting accuracy. Furthermore the author explain the importance of
understanding the objectives and goal with forecasting for the people working with it.
First of all the employees need to understand what kind of impact the forecast has on
the company and towards its customers. They also need to understand and appreciate
what kind of negative consequences it can have on the company by not making
accurate forecasts and what kind of impact it has on for example capacity planning,
inventory, production planning and other economics. Finally Mentzer (2004) explain
that training is vital to be able to improve the performance of the employees working
with forecast. By training the employees they should develop a better understanding
for the company‟s forecasting system (ibid).
2.6 Summary of the frame of reference To be able to understand what and why a forecasting system is used and how it is
developed, general theory and definitions about supply chain management in retailing
and inventory management has been introduced. Basic theory within supply chain
management in retailing has been presented by Levy & Weitz (2008), Harland (1996),
Risch (1991) and Langley et al (2009). The authors explain the role of retailers and
how the supply chain can be managed in order to provide services and meet
customers‟ demand, one important service for retailers that the authors mention is
holding inventory.
Furthermore Levy & Weitz (2008) and Christopher (2005) clarify the effect when
retailers fail to hold inventory and a stock out occurs. Langley et al (2009) and
Mentzer (2004) explain general theories about how retailers should work with demand
and inventory management, the authors agrees that the key to success is accurate
information about real demand. Mattsson & Jonsson (2003) and Christopher (2005)
explain the cost linked with holding inventory and Olhager (2000) and Arnold,
Chapman & Clive (2007) present classification of customers and products for
retailers. The authors agrees that it is important for the retailer to know which
products and customers that generate most profit for the company.
The frame of reference continues with different types of strategies to meet customers
demand. Postponement and speculation are presented by Ernst & Kamrad (2000),
Christopher (2005), Bucklin (1965) and Pagh & Cooper (1998). The authors clarifies
strength and weaknesses with both the strategies and Bucklin (1965) and Langley,
Coyle, Gibson, Novack, & Bardi (2009) explain the benefits that can be obtained by
using speculation such as, lower production cost, higher customer service and lower
distribution.
19
Forecasting is introduced as a method for the supply chain that is working with
speculation strategies. Jonsson & Mattsson (2005) explain how retailers can collect
information about demand and how this is affecting the rest of the supply chain and
Arnold, Chapman, & Clive (2007) mention four principles about forecasting which
needs to be considered, Handfield (2006) mention three laws that are similar to these
principles. The authors agree that forecasts are usually wrong or imperfect and that
forecast are more accurate on short-range periods. Handfield (2006) and Arnold,
Chapman, & Clive (2007) explain the data collection for forecasting and how retailers
should work with demand forecasting to minimize errors. Furthermore Kahn (1998)
points out the importance for employees working with forecasting to know the basics
of business forecasting. Ballou (2004) explain the problem with lumpy demand and
how retailers could handle the problem by distinguishing the products and use their
own forecasting method. Ballou (2004) and Chopra & Meindl (2007) also presents
collaborative forecasting as another solution for lumpy demand, by collaborating with
other actors within the supply chain and share information more accurate forecasts
can be achieved. Furthermore Olhager (2000) have divided forecasting techniques
into two categories, qualitative and quantitative but Arnold, Chapman, & Clive (2007)
presents three different categories: qualitative, extrinsic, and intrinsic.
Slack & Lewis (2008), Chan (2003) and Christopher (2005) present general theory
about performance measurement and key performance indicators. Jacob, Lys, & Neale
(1999), Liker & Meier (2006), Simchi-Levi et al (2003) and Mentzer (2004) explain
how forecasting performance can be measured and what aspects that needs to been
taken into consideration. The authors mention that employees need to have awareness
about the company's operations, understand the underlying problems and get feedback
on their work performance. Finally Liker & Meier (2006) explain that employees
working with forecasting need have standardized work task and clear guideline in
order to improve the work performance.
20
3 Methodology This chapter presents the methods and approaches used in the implementation of this
study. Further on the process of data collection, such as observations and interviews
are presented.
3.1 Choice of method The purpose of this thesis is to identify the forecasting system which IKEA Jönköping
is using and analyze its problems; furthermore solutions will be indicated to improve
the forecasting system. To achieve the purpose of the thesis qualitative data has to be
collected and interpret, as well quantitative data should be collected but are not as
important in this case study. This is because the analysis of forecasting system will be
on macro-level more than on micro-level.
To identify the current forecasting system and routines at IKEA the case study was
divided into two parts. The first part was to collect secondary data by accessing
documents from IKEA about the structure of IKEAs organization and general
information. Yin & Nilsson (2007) mention the benefits of collecting data from
documents as strict, stable and discrete. The methods that were chosen for collecting
primary data about the forecasting and the routines were observation and interviews.
The strengths of these methods are according to Yin & Nilsson (2007) that interviews
are targeted on the related subject and help the investigators to identify causal
connections. Observation has the possibility to describe the real time situation and
gives the observers insights about employee‟s behaviors (Yin & Nilsson, 2007).
By using the methods mentioned above and the benefits the can be obtained, we can
achieve the purpose of this thesis in a better way.
3.2 Case study This approach gives the researchers an opportunity to study a problem in a single
aspect (Bell, 1999) & (Blaxter et al, 2001). It makes the researcher understand events
that are unknown and contains a lot of variables and connections that are very
complex to overview. A case study can be both qualitative and quantitative; this
depends on the complexity of the case study however the majority is qualitative
(Gustavsson, 2004). The strength of a case study is the opportunity for the researcher
to concentrate on a specific situation and identify various events and processes linked
with it. A series of case studies can be used to identified issues and problems that can
be further analyzed but the most common is stand-alone case studies. A case study is
much more than just describe an event or a state, data is collected and analyzed, most
used in a case study are observations and interviews (Bell, 1999).
The reasons why we choose a case study was because we wanted to study a specific
company and one of its process, in this case the forecasting process at IKEA
Jönköping. A reason for the specific interest of IKEA Jönköping is because at the time
being of this study we were working at IKEA Jönköping.
3.3 Data collection In a case study the preparing for data collection can be difficult and complicated. If
this is done wrong the whole case study can be at risk. When preparing for a good
21
case study the investigators should have desired skills in the subject and Yin R. (2003)
explain the skills further. One of the skills the investigators should have is some
training in the specific case study and makes a protocol for the investigation.
Furthermore the investigators should develop a screening of nominations and make a
pilot case study. The investigators should have the skills to be able to ask good
questions and be able to interpret the answers. They need to avoid own
preconceptions and be adaptive and flexible to new information or situations (Yin,
2003). The author explain that the investigator must have a firm grasp of the issues
being studied to reduce the relevant information and events to manageable
proportions. The last attribute is the ability to be unbiased by preconceived notions.
Qualitative data is almost all information that is not numerical in nature. This data can
be collected by in-depth interviews, direct observations and written documents (Yin,
2003). Quantitative data is information that is numerical in some form (Trochim,
2006). The difference between qualitative and quantitative data can be defined as
“Data that can be quantified and verified, and is amenable to statistical
manipulation. Quantitative data defines whereas qualitative data describes"
(Business Dictionary, 2011).
3.3.1 Primary and secondary data
Data observed or collected in first-hand experience by the researcher is called primary
data and published data or data collected in the past are called secondary data
(Business Dictionary, 2011 & Larsen, 2007). Primary data can be collected from
interviews, surveys and observations. Secondary data is often data from previous
studies such as reports, books and theses (Larsen, 2007). Huge amount of secondary
data has in the last few years become easily accessible online this makes it sometimes
simple to find the primary data the researcher needs (Bell, 1999). It is important to use
secondary data although the study is based on primary data collected by the
researcher. The researcher can critically review secondary data and compare results
from previous findings against the primary data; this could help the researcher to
further interpret the results (Larsen, 2007).
The primary data collected for this study is presented in the methods in the sections
below. The secondary data was collected from documents accessed at IKEA
Jönkoping's intranet and homepage.
3.3.2 Observations
Yin & Nilsson (2007) explain that there are two different forms of observations, direct
and participant observation.
Direct observation means that activities are being performed being either formal or
using temporary data collection. When an observation is being performed formal,
forms like time measuring, being participant of a meeting, studying the work at a
department or notifying the structure of a workplace are being used. Furthermore
direct observations usually can be complemented by using other methods for
collecting data, for example interviews and by photographing the workplace. To get
the best reliable observation it is important to use more than one observer, this to have
the possibility notify as much as possible (ibid).
22
Yin & Nilsson (2007) explain that participant observation is when the participant is
being active in different roles within the study and also the participant can be included
in the activities that are being measured. The method provides valuable information
about the company, information which otherwise can be difficult to access from the
outside. Participant observation has historically being used for the study of human
behaviors in different situations, but this method works also well for studies that is
going to be performed in big organizations. Problems that can be related to this
method are that the participant is making assumptions or showing sympathies for
different groups within the company or that the participant has limited time for his
observation which in turn can affect the result from the observation (ibid).
3.3.3 Interview
According to Yin & Nilsson (2007) interviews is a major source of information which
can be used for different types of projects.
The interview process has mainly two objectives, roughly translated as; “to follow the
order of the predetermined questions set out in the case study protocol and to
formulate the specific questions without creating any distortion and ensure that the
goal of the issues is achieved” (Yin & Nilsson, 2007, p. 117)
The process of the interview can be performed in different ways, open character,
focused interview or by performing the interview based on structured questions. The
open character interview means that the person that is being interview is asked to
formulate his answers and from this point continue further questions based on his
answers. The focused interview is more time limited, and the questions are more
based on the predetermined question being set in the study protocol but still it is
possible to start a dialog regarding the answers. The third type of interview is strictly
focused on the predetermined questions and no rooms for discussion related to the
answers are given (Yin & Nilsson, 2007).
3.4 Data analysis To make it easier to understand what data is the researcher has to summarize and
simplify all the collected data (Larsen, 2007). Analysis of data is an ongoing process
and may start as soon the researcher collects some data Blaxter et al (2001). This is a
weak point for a researcher to interpret data into results and conclusions. Data is
compared with theory, analyzed and interpreted, this will result into conclusions or
recommendations (Gustavsson, 2004). Data analysis is often sorted into three groups‟
univariate, bivariate and multivariate analysis the method used is based on the
collected data. Univariate is the easiest way to analyze data, the researcher divide data
into groups based on one variable. Bivariate analysis makes it possible for the
researcher to analyze the connection between two variables and multivariate analysis
is more complex and adds even more variables (Larsen, 2007).
3.5 The interview and observation process We choose to contact SSS because they were working with local forecast at IKEA
Jönköping; we also wanted to observe SSS work processes. We contacted IKEA
Jönköping and the division of Sales Supply Support (SSS) to set up a meeting with
two employees currently working with the forecasting at IKEA Jönköping. Since we
23
were working at IKEA Jönköping we knew in advance which division we should
contact for the purpose of this thesis. We booked a meeting with two of the employees
working as demand planners at SSS since these two employees was available at the
time of this thesis. The interview took place at their office at IKEA Jönköping.
At the beginning of the interview we explained the purpose of the thesis and what
kind of information we needed. The demand planers were asking questions about the
thesis such as delimitation and time frame. After introducing the thesis the demand
planners started to explain what they were working with on a daily basis. The
employees explained the computer system that manages the forecast and how it is
using extrinsic and intrinsic forecasting techniques. We started a direct observation of
the workflow linked with forecasting and later on started the open character interview
with the two demand planners. During the whole meeting we took turns noted the
answers and drawing figures for our own observations. The interview as a whole took
about two hours to conduct.
In order to complete or purpose we needed to contact IKEAs headquarter in Älmhult
to identify the basis of the forecast. The headquarter referred us to the department
which were working with global forecasts at IKEA, the department IKEA of Sweden
(IOS). We contacted the manager of the department who referred us to a demand
planner working with forecasts. Later on we booked a meeting with the employee for
conducting a interview. The interview started with us presenting the thesis followed
by the demand planner explaining about IOS and the role of the department. The
demand planner asked about the role IOS would have in our thesis and what kind of
information we wanted. We followed up the presentation with an open character
interview and prepared questions about forecasting. From the first interview with SSS,
we used the previously notes to follow up some questions and noted the answers. The
interview was slightly no longer than two hours.
After interviewing SSS and IOS we wanted opinions from other employees working
at sales and logistics department linked with demand at IKEA Jönköping. We called
different departments and booked interviews. The first interview was with a team
leader working at the sales department. The interview was conducted on a afternoon
at the team leaders‟ workplace and we asked questions about the collaboration
between SSS and sales department. The process of the interview was by using
structured questions (see appendix 1).
The interview with the employee working with incoming deliveries at the logistics
department was conducted after the interview with the team leader of the sales
department. The interview was performed at the workplace of the warehouse worker
and the process of the interview was by using structured questions (see appendix 1).
3.6 Reliability and Validity Data should always be examined critically to ensure it is reliable and valid. Reliability
is when the same test is repeated and similar results occurs. An interview with factual
questions done at one occasion produce one type answers but different answers at
another time is considered unreliable. One method to ensure reliability is to use test-
retest which is to administering the same test again at another occasion (Bell, 1999).
24
Validity is more complex, it tells if an item measures or describes what it is supposed
to. If an item is unreliable it will also lack validity, but not the other way around. Just
because an item is reliable it is not necessary valid (Bell, 1999).
It is important to understand the difference between deduction, induction and
abduction used in quantitative research, these are styles of reasoning. It allows
researchers to understand the nature of the evidence and the findings that are being
made from the study. Traditional deductive reasoning means that conclusions are
drawn from logic of the evidence and no wild guesses are made. Abduction and
induction are not logically self-contained and they need to be tested by others to be
validated (Balnaves & Caputi, 2001).
To ensure the reliability of the information we gathered during the interviews, we
compared the answer towards the departments to identify contradictions and
misunderstandings. Further on we compared each other‟s notes from the interviews
and observations. If there were any contradictions, we contacted the source and
updated the data. We also sent a copy of our empirical study to the persons and
departments which were used in the study, in this way we ensured that the collected
information was correct.
The validity of this study was ensure by contacting the managers of the different
departments and receive their feedback on who to contact and conduct interview with.
By this way we were in contact with the persons that was working with forecasting.

25
4 Empirical study This chapter starts with the presentation of IKEA corporate history and the IKEA
Jönköping store. Later on, the forecasting system used in IKEA Jönköping is
presented and in the end some problems are stated.
4.1 History & Facts IKEA was founded in 1943 by Ingvar Kamprad in the village Agunnaryd in Sweden.
IKEA is for Ingvar Kamprad Elmtaryd Aggunaryd, and Elmtnaryd was the farm
where Kamprad was born and raised. During the first years of IKEA Kamprad sold
accessories like pencils and watches. The next ten years he introduced home furniture
and opened up a furniture store in Älmhult (Inter IKEA Systems, 2011).
In 1956 IKEA started to design and manufacture their own home furniture. During
this time IKEA developed a new way of shipping goods to their customers. Instead of
shipping assembled furniture, which is more expensive due to larger space needed
during transportation, IKEA shipped the furniture in flat package which saved a lot of
space and reduced the risk of damaging the goods during transport. When the
customer receives the goods he will need to assembly the furniture himself. In the
beginning of the 60s IKEA opens the first store outside Sweden, in Oslo, Norway. In
the next 30 years IKEA expands to Europe, North America, Australia and Asia (Inter
IKEA Systems, 2011).
In 2011 IKEA have 280 stores in 26 countries over the world with over 127000
employees. The annual sales for 2010 were the best so far with 23.1 billion Euros and
the net income was 2,688 billion euro. The most important markets for IKEA are
Germany with 16% of total annual sales, USA 11% and France 10%. IKEA provides
wide assortment of design and functional home furniture products for low prices to be
able attract as many customers as possible (Inter IKEA Systems, B.V;, 2011).
4.1.1 Home furniture market in Sweden
Retailers within the home furniture market in Sweden are on a growing phase. In the
last 12 years the cost for consumption in the market has raised about 67%, also the
cost for export and import has raised 65% and 46%. The home furniture market in
Sweden had in 2010 a yearly production cost of 21.5 billion SEK and its future looks
to be growing (TMF, 2010).
4.1.2 IKEA in southern Sweden
In Sweden there are 17 IKEA stores, and three of them, Jönköping, Kalmar and
Älmhult are located in the region of Småland. Småland has a population of 720 000
and Jönköping municipality has 127 000 citizens of those (SCB, 2010). IKEA
Jönköping is close to four other IKEA stores in Sweden. Linköping and Göteborg are
the closest and Kalmar and Älmhult are a little further away. Since the stores in
Kalmar and Älmhult are covering the southern part of Småland, the store in
Jönköping covers the northern region of Småland and east of Västergötland, see figure
2.
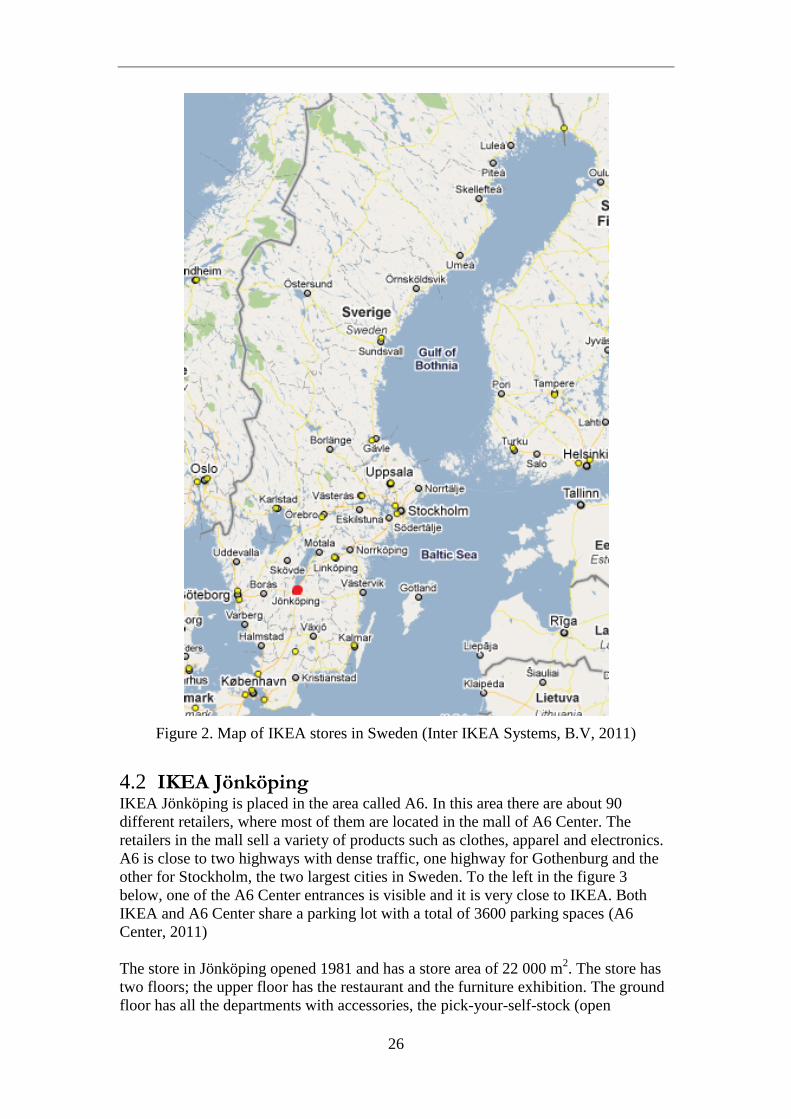
26
Figure 2. Map of IKEA stores in Sweden (Inter IKEA Systems, B.V, 2011)
4.2 IKEA Jönköping IKEA Jönköping is placed in the area called A6. In this area there are about 90
different retailers, where most of them are located in the mall of A6 Center. The
retailers in the mall sell a variety of products such as clothes, apparel and electronics.
A6 is close to two highways with dense traffic, one highway for Gothenburg and the
other for Stockholm, the two largest cities in Sweden. To the left in the figure 3
below, one of the A6 Center entrances is visible and it is very close to IKEA. Both
IKEA and A6 Center share a parking lot with a total of 3600 parking spaces (A6
Center, 2011)
The store in Jönköping opened 1981 and has a store area of 22 000 m2. The store has
two floors; the upper floor has the restaurant and the furniture exhibition. The ground
floor has all the departments with accessories, the pick-your-self-stock (open
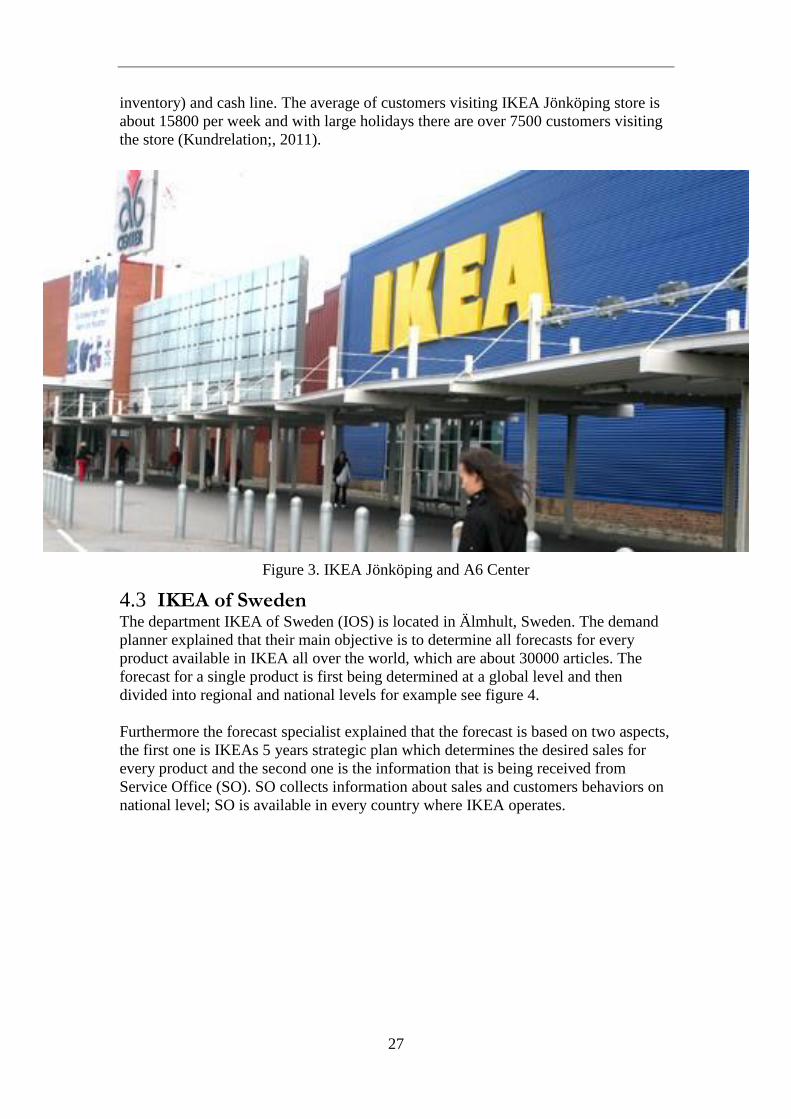
27
inventory) and cash line. The average of customers visiting IKEA Jönköping store is
about 15800 per week and with large holidays there are over 7500 customers visiting
the store (Kundrelation;, 2011).
Figure 3. IKEA Jönköping and A6 Center
4.3 IKEA of Sweden The department IKEA of Sweden (IOS) is located in Älmhult, Sweden. The demand
planner explained that their main objective is to determine all forecasts for every
product available in IKEA all over the world, which are about 30000 articles. The
forecast for a single product is first being determined at a global level and then
divided into regional and national levels for example see figure 4.
Furthermore the forecast specialist explained that the forecast is based on two aspects,
the first one is IKEAs 5 years strategic plan which determines the desired sales for
every product and the second one is the information that is being received from
Service Office (SO). SO collects information about sales and customers behaviors on
national level; SO is available in every country where IKEA operates.
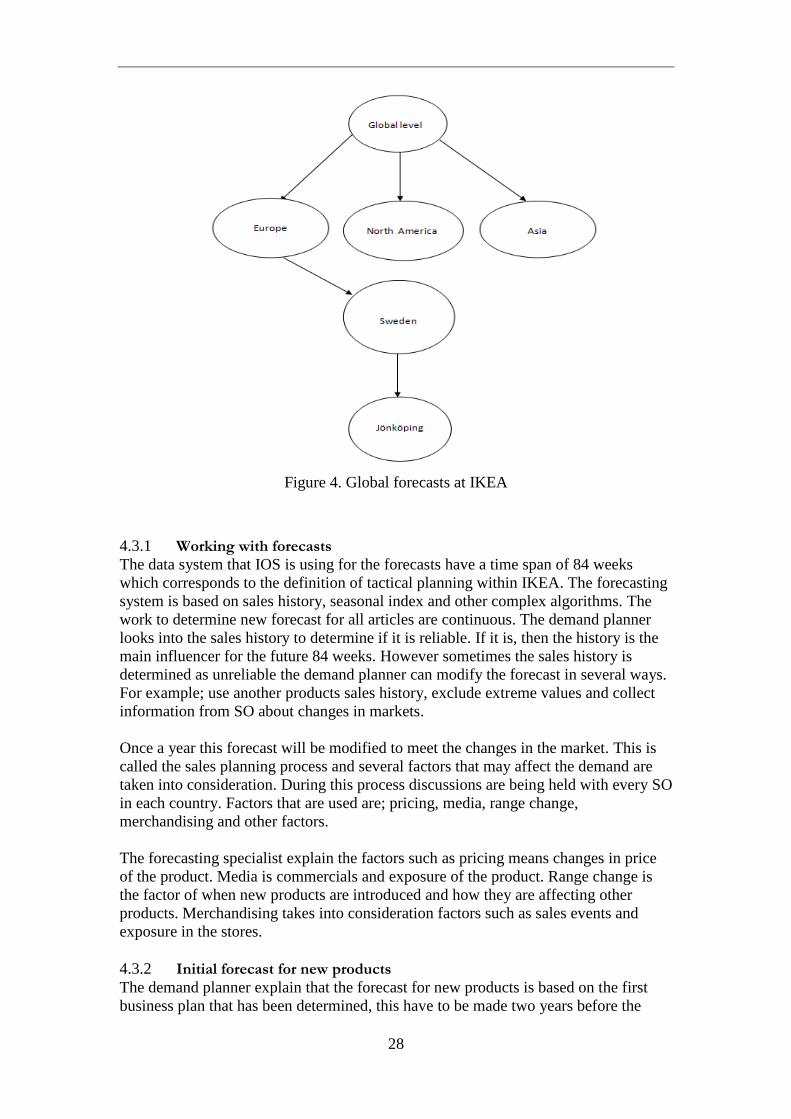
28
Figure 4. Global forecasts at IKEA
4.3.1 Working with forecasts
The data system that IOS is using for the forecasts have a time span of 84 weeks
which corresponds to the definition of tactical planning within IKEA. The forecasting
system is based on sales history, seasonal index and other complex algorithms. The
work to determine new forecast for all articles are continuous. The demand planner
looks into the sales history to determine if it is reliable. If it is, then the history is the
main influencer for the future 84 weeks. However sometimes the sales history is
determined as unreliable the demand planner can modify the forecast in several ways.
For example; use another products sales history, exclude extreme values and collect
information from SO about changes in markets.
Once a year this forecast will be modified to meet the changes in the market. This is
called the sales planning process and several factors that may affect the demand are
taken into consideration. During this process discussions are being held with every SO
in each country. Factors that are used are; pricing, media, range change,
merchandising and other factors.
The forecasting specialist explain the factors such as pricing means changes in price
of the product. Media is commercials and exposure of the product. Range change is
the factor of when new products are introduced and how they are affecting other
products. Merchandising takes into consideration factors such as sales events and
exposure in the stores.
4.3.2 Initial forecast for new products
The demand planner explain that the forecast for new products is based on the first
business plan that has been determined, this have to be made two years before the

29
product can be sold. One and a half year before sale start IOS makes the initial
forecast of the new product. IOS collects information from the business plan, range
plan, commercial input, and strategy of the article, budget and sales statistics. Seven
months before the product will be released for sale IOS make the initial forecast for
the product. Before sales starts the demand planner divides the global initial forecast
to country level mainly by looking at sales history and similar articles or by
discussion with the concerned retail countries. At the same time an expected
seasonality of the article is attached on article/country/region perspective.
4.3.3 Key performance indicators
To measure the forecast performance the forecasting specialist are using forecast
accuracy as their indicator of performance. This indicator is divided into two areas of
measure; gross and net. Gross have the time span of one week; while net have a time
span of a quarter of a year. The indicator measure three different areas of product
forecasts; active, new and discontinued, see figure 5. IOS have forecast accuracy
goals for gross 80% and net 100%, which means that 100% of the forecasts should be
correct in the longer term meanwhile 80% accuracy is for the shorter term.
Figure 5. Forecast accuracy at IKEA
4.4 Forecasting systems at IKEA Jönköping The division of Sale Supply Support is a part of the Logistics department. SSS has
employees that works with demand forecasting. The employees explain that their
objectives linked with demand forecasting are to keeping the stock levels at
predetermined levels and to reduce the risk of stock outs without exceeding the stock
levels.
SSS receives initial forecasting from IOS for each of the products available at the
warehouse. This forecast is predetermined for a period of 84 weeks and the current
availability of the product in the whole supply chain.
IKEA has divided their products in four different service-levels this is done on a
global level, see figure 6. The service levels are based on a products importance
regarding the sales and customer service. For example, service-level 1 means that the
product should always be available in stock. The products within this category are
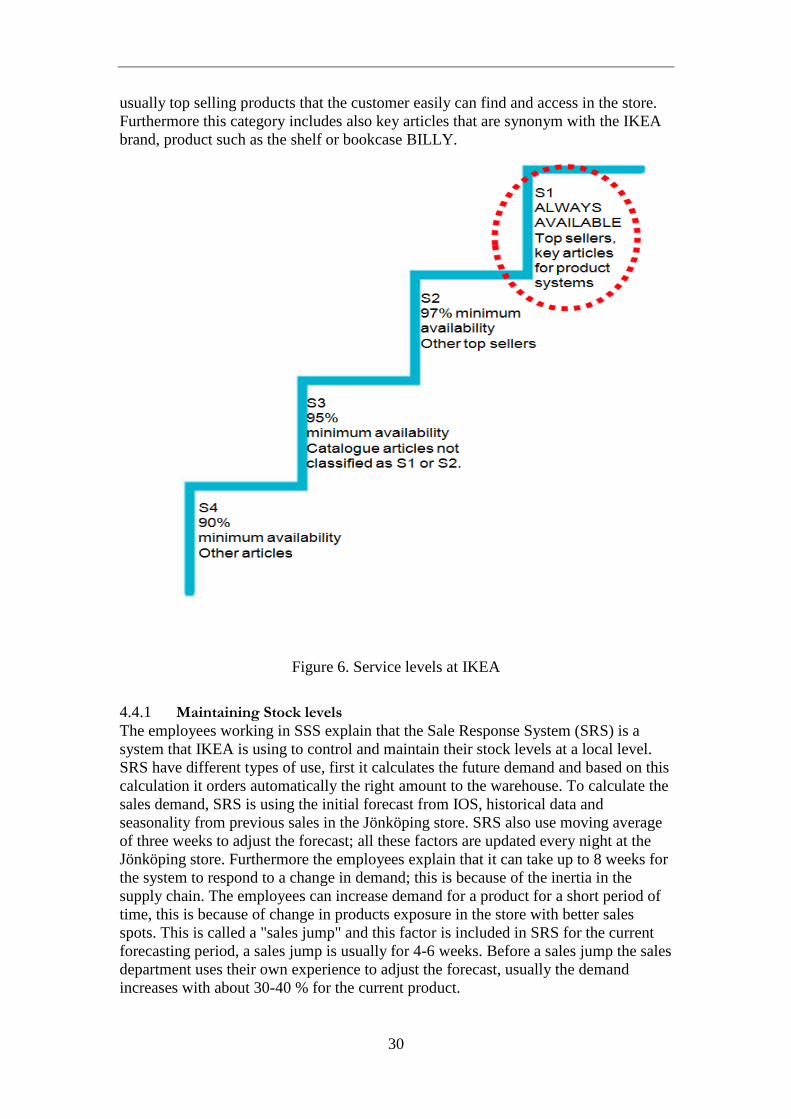
30
usually top selling products that the customer easily can find and access in the store.
Furthermore this category includes also key articles that are synonym with the IKEA
brand, product such as the shelf or bookcase BILLY.
Figure 6. Service levels at IKEA
4.4.1 Maintaining Stock levels
The employees working in SSS explain that the Sale Response System (SRS) is a
system that IKEA is using to control and maintain their stock levels at a local level.
SRS have different types of use, first it calculates the future demand and based on this
calculation it orders automatically the right amount to the warehouse. To calculate the
sales demand, SRS is using the initial forecast from IOS, historical data and
seasonality from previous sales in the Jönköping store. SRS also use moving average
of three weeks to adjust the forecast; all these factors are updated every night at the
Jönköping store. Furthermore the employees explain that it can take up to 8 weeks for
the system to respond to a change in demand; this is because of the inertia in the
supply chain. The employees can increase demand for a product for a short period of
time, this is because of change in products exposure in the store with better sales
spots. This is called a "sales jump" and this factor is included in SRS for the current
forecasting period, a sales jump is usually for 4-6 weeks. Before a sales jump the sales
department uses their own experience to adjust the forecast, usually the demand
increases with about 30-40 % for the current product.
31
If the product does not sell as planned, the sales personnel has the opportunity to
expose the products more or even lower the price for the actual product, meanwhile
storing it at the extra warehouse. According to the logistics department this is not a
problem since they will sell these products anyway, the extra warehousing cost for
storing the goods is negligible since customer service is more important. According to
the logistics department working with incoming deliveries, if too much is ordered, the
employees does not have enough time to put the goods in inventory. This means that
the goods will remain at the loading bay and will not have the opportunity to be sold.
Every day SSS and the logistics department give feedback about incoming deliveries
and indentify faulty orders.
SSS have a meeting with the sales department once a week to discuss previous and
future demand. During this meeting discussions are being held about a products
inventory level and analyze if the current forecast should be adjusted. Sometimes
discussions about inaccurate forecast are being held and together these departments
try to find solutions for the future.
4.4.2 Initial forecast for new products
IKEA is launching a number of new products four times every year. The employees
working with forecasting at IKEA Jönköping explain that IOS sets the initial forecast
on a national level and IKEA Jönköping automatically get 5.7% share of the total
products. This information is being received eight weeks before the release of the
product and this makes it possible for the department of logistics to adjust the forecast
in advance, adjustments like changing the order level and predicted sales. If they to
choose to increase the demand, the logistics department need to check the availability
within the supply chain and this is basically being done by contacting IOS. The
routine for the employees to adjust the initial forecast is based on their experience, the
market and information from the sales department.
SSS explain the importance of having the right level of the product available at the
warehouse, otherwise there is a risk that a stockout will occur and the product will
have problems to recover on the market.
4.4.3 Working with SRS
The employees of SSS are making inputs and adjustments in the SRS daily.
Furthermore the employees explain that the products that are within service-level 1
are being examined on weekly basis to find deviations in demand or other factors
affecting it, this is because products within this level should always be available.
The factors that are reasons for the daily inputs and adjustment are weather, events,
paydays, child benefits, pensions and holidays. The level of adjustment is based on
the employee‟s experience of the local market and weather forecast.
The employees are using a calendar which has been designed and developed by the
logistics and sales department. The calendar includes events that happen in
Jönköping, holidays, product seasonality and sales jumps. This calendar applies only
on the store in Jönköping.
IKEA Jönköping has an open inventory where customers can pick their own goods
and products directly from the shelf. This contributes to more damaged goods and
32
inaccurate inventories since customers‟ brakes and moves the products within the
store. The sales personal working in the store which controls the inventory levels does
not have the authority to adjust the inventory levels; instead they have to contact SSS.
4.5 Performance measurements To measure the performance of the forecasting IKEA Jönköping use several different
measurements see appendix 2 for all KPI´s. A few KPI are further examined, such as;
Concrete
Overstock
Service-level
SRS%
SRS forecast accuracy
SRS Reliability
SRS Trend
Stock value
Concrete shows the amount of products that has sold less than one item in 5 weeks or
more. The overstock KPI shows a quote of products that exceeds 15 weeks of
predicted sales. Service-level tells in percentage the availability of the product, this
Key Performance Indicator (KPI) can also be calculated by product category and by
service-level S1 to S4. SRS% KPI show the amount of products handled by the SRS.
The SRS forecast accuracy describes how well SRS and the manually adjusted
forecast combined with each other has predicted the demand. SRS Reliability shows
the amount of articles that has a reliability signal, this is the difference between the
forecast and the actual sales history. SRS Trend shows the amount of products that
has a trend signal, this is the difference between average sales and actual sales. Stock
value is showing the value of the products current in stock at IKEA Jönköping store.
4.6 Problems Employees in the logistics department working with manually adjusting the demand
in the SRS have noticed some problems that are related with their work task. The
employees highlight some problems with the forecasting liked with SRS;
SRS has a long response time, 6-8 weeks. During this time the employees needs to
manually monitor the demand and stock level for a particular product. Otherwise SRS
will show inaccurate forecast.
A very extreme and rare order can affect the moving average in such way that the
SRS cannot understand it is a one-time event. For an example, the average week sale
for a product is 10 items and then a customer buys 50 items at once. This in turn
makes the SRS to automatically increase the overall demand for the current product
for the future three weeks. This will drastically raise the inventory levels for the
current product and by so increasing the warehousing cost. Another example is when
a product that is linked with a particular event or holiday. When the event or holiday
ends the demand majorly decreases and SRS cannot respond fast enough. This will
keep inventory at a high level when in fact demand is low.
33
IKEA Jönköping has an open inventory in their store which makes it possible for the
customer to direct pick products from the shelf. The customers move around product
from one shelf to another or breaks the products. This makes it difficult to acquire
accurate inventory information. Further on this affects SSS forecasting accuracy and
performance.
The employees of the logistics department want to know their local market and
customers in a better way to make more accurate forecast. By not knowing local
events and factors SSS find it harder to meet actual demand. This could result in
unnecessary inventory levels and in some cases create stockouts.
SSS does not get any information in advance why some products have drastically
increased in demand and sold out. By not completely understand the cause of the
increased demand SSS cannot be able identify factors that affects the demand.
SSS experience too many workarounds related to the work with forecasts. This is
becoming ineffective when the problems reoccur. This increase the workload for SSS
when making forecast. By not having any clear guidelines to solve problems it is
difficult for SSS to improve the current work task.
Both IOS and SSS want a more integrated relationship regarding the information
exchange about forecasting. Since SSS does not always understand the initial forecast,
that makes it more difficult for SSS to adjust their local forecasts. If the initial forecast
is not proper adjusted to the local demand, the product has a increased risk of a
stockout or unnecessary inventory.
34
5 Analysis This chapter addresses the purpose and research questions stated for this study. The
research questions are answered one by one, divided by the department or division of
IKEA. Finally an analysis of IKEA Jönköping KPIs is being included in this chapter.
5.1 What kind of forecasting system is IKEA Jönköping using today? From our empirical part we identified the forecasting system IKEA Jönköping is
using. It was identified that all forecast for the products in the world was created at
IKEA of Sweden in Älmhult. However these forecast are only determined on a global,
regional and nation level, all IKEA stores in the world have to adjust the IOS
forecasts. In IKEA Jönköping the division Sale Supply Support adjust and manage the
forecast at a local level. The forecasts are managed manually by the demand planners
and automatic by the Sales Response System. SRS forecast demand and automatically
order a proper amount of the products. The forecast are based on historical data,
seasonality from previous sales and combined with a moving average. The demand
planners makes daily inputs and adjustments about demand and forecast to SRS to
increase forecast accuracy.
IKEA has chosen the speculation concept for most of the products in the supply chain.
This makes it possible for IKEA to make the products before an order is made and
according to Bucklin (1965) a company is doing the required activities at the earliest
possible time in the supply chain. The benefits from speculation concept is that a
company can use economies of scale to produce larger quantities to lower production
cost, this will in turn make transportation cost and cost for handling the goods lower.
The company is less likely to losing sales since the product are already in inventory
(ibid). However, there are a problem linked with speculation, the two basic decisions
for inventory management are; how much to reorder and when (Langely et al, 2009).
A retailer do not want to order too few products and risk a stockout, Christopher
(2005) list a few effects such as, customers buys something else, visit a competitor or
never visit the retailer again. If the retailer orders too much in order to avoid a
stockout warehousing costs will increase instead (Mattsson & Jonsson, 2003). The
retailer wants to order the right amount of products that has a low stockout risk and
does not increase warehousing cost more than necessary. IKEA uses demand
forecasting to tackle the problem and according to Mattsson & Jonsson (2003)
forecasting enables the company to plan its resources and its capacity to meet the
demand in the best possible way.
5.2 What are the problems with the current forecasting? In the section the problems with the current forecasting at IKEA Jönköping is being
analyzed. The problems are divided into three different areas where the problems
occur.
35
5.2.1 Sale Supply Support and IKEA of Sweden
One of the issues with the current forecasting system is that SSS does not always
understand the initial forecast from IOS, which in turn is affecting their own
performance because SSS do not know what the forecasts are based on. One of the
problems is when IOS sets the initial forecast for a new product. Within the initial
forecast, SSS receives only the predicted sales for the product but not the reason
behind these numbers. Kahn (1998) explain the importance of reporting forecasts in
the proper way, meaning that forecast need to be as detailed as possible, explain
reasons why there are deviations, specify the assumptions in the forecast and make
sure that that forecast are internally consistent. Harland (2006) mentions also the
importance of documenting what kind of inputs has been used within the forecast.
According to SSS they need to analyze the initial forecast by using their own
experience, matching the business plan and additional information from the sales
department. SSS have no guidelines or tools to solve this problem; instead every
single initial forecast requires different amount of information. SSS explain that this
leads to a high workload and it is time consuming for the SSS to find all necessary
sources of information to find the appropriate demand. According to SSS many times
the information needed to the initial forecast are not collected because of high amount
of new products and the lack of time to calculate the new demand. Instead the SSS
only uses their experience for the initial forecast.
5.2.2 Sale Supply Support and the local market
A problem that SSS is experiencing is that they want to know and understand the local
market in a better way. Since IKEA is offering a wide range of home furniture
products it is difficult for SSS to understand large deviations in demand, meaning why
some products has sold more or less during a time of period, this type of demand is
also called lumpy demand (Ballou, 2004). The reason why this type of demand is a
problem is because IKEA want to sell the right products to their customer, having the
appropriate inventory levels and avoid stock outs. This problem which IKEA is
experiencing is also one of the goals and responsibilities for retailers, meaning to
know what the customer wants, when and in which quantity (Risch, 1991). By not
having the right products available IKEA Jönköping will miss the opportunity to offer
value within the service area they are operating in (Levy & Weitz, 2009). Since IKEA
is using speculation strategy for its products, the benefit that can be obtain by using
this type of strategy, such as increase customer service, can be lost if they do not
identify the demand correctly (Bucklin, 1965).
By not having the appropriate inventory level or having the right products available,
the customer could buy a substitute product, go to a competitors store or even worse
never come back to the retailer (Levy & Weitz, 2009). In this case IKEAs customer
could choose another competitor to buy their products if the products are not available
on stock. Christopher (2005) refers to a research that shows that more than two thirds
of the customers make the decision to buy the product when they see it on the shelf,
meaning that by not having the product on shelf the customer will not even consider
buying it. Simchi-Levi et al (2003) explain that the by not having the goods available
the company will miss the oppurtunity to offer value to their customers. By not having
the right products available, IKEA Jönköping will not only miss the opportunity the
sell the current product but also miss the opportunity to sell companion products
(Handfield, 2006)
36
5.2.3 Sale Supply Support and the department of sales and logistics
From the interviews with SSS, sales and logistics department some issues related to
communication was identified.
The logistics department working with deliveries experienced lack of communication
with SSS. They felt that some forecast was not optimized and that contributed to a
higher workload and ineffective operations with deliveries. Inaccurate forecast can
increase the inventory cost, this because different cost variables such as handling the
goods will be higher if the inventory level gets higher (Mattsson & Jonsson, 2003).
Bucklin (1965) explain that by using speculation strategy correctly, cost benefits such
as lower handling cost, but in this case there is a risk that these benefits will not be
obtained.
The logistics department has a meeting every day to identify problems and issues but
still the problems related to forecast reoccur. This leads to some of the product will
not be in stock and miss the opportunity to be sold. Both of the logistics department
and SSS experience that there are too many workarounds related to this issue.
During the interview SSS explained a problem related to long response time in the
SRS. The problem occurs when demand is changed to fast for a product and the SRS
does not adjust the proper demand in time, this leads to the SSS to manually adjust the
demand.
SSS highlights that they want more information about predicted sales and changes in
demand from the sales department in advance this to be able to make more accurate
forecasts. Furthermore SSS wants that the sales department be more proactive and
inform about other factors which can affect the demand. If the sales department do not
inform SSS about upcoming promotions or changes in demand it could result as
Mentzer (2004) calls it “advertising for the competition”. This meaning that SSS will
not be able to make accurate forecast which in turn can affect inventories levels
resulting in lower customer service. In this way the customer can choose to buy the
same or similar product from a competitor.
IKEA Jönköping has an open inventory for the customers to directly pick products
from stock. This increases the deviation of products inventory levels and makes the
SRS do faulty assumptions.
All these issues affect the forecast accuracy negative since SSS do not have all the
sufficient information; this tends to make the forecast less reliable
37
5.3 What kind of solutions could be indicated to improve the forecasting system? In the section we have indicated some solutions that could help IKEA Jönköping
improve their forecasting system.
5.3.1 Sale Supply Support and IKEA of Sweden
For SSS to be able to make more accurate initial forecasts, IOS could send
information about what the forecast are based on. As Mentzer (2004) explain, it is
important that the different departments within a company shares information
regarding demand, this to have a higher level of synchronization and to be able to
keep inventories at the right level. Jacob, Lys, & Neale (1999) explain that if the
employees understand the different departments operations and purpose within the
company, they will easier understand their own role within the company. If IOS sends
some input information on which assumptions has been included in the forecast, it can
help SSS make more accurate forecast (Handfield, 2006)
An example of the information could include the goal for the product, predicted
promotion, type of customer segment and how IOS compiled and calculated the initial
forecast. This will make it easier for the SSS to understand, analyze and adjust the
forecast.
Since SSS do not have any guidelines regarding the initial forecast; SSS could
introduce new clear guidelines about the work processes. The guidelines could
include tips, principles and advices about adjusting initial forecasts. Arnold, Chapman
& Clive (2007) has listed some principles regarding forecasting which are important
to take into consideration, such as to remember that forecasts are usually wrong, every
forecast should include an estimate of error, forecast are more accurate for families or
groups and that forecast are more accurate for nearer time periods. These principles
could also be adopted and implemented at the SSS department so that the employees
working with forecast always have these principles into consideration.
Jonsson & Matsson (2003) also highlights the importance of creating routines and to
receive more reliable information when working with forecast. A way to create
routines could be by having a predetermined method or technique when working with
forecasts. One of these method or techniques could be one of those presented in
chapter 2.3.3. By knowing how manually handle forecast, Kahn (1998) explain that
the employees will appreciate the forecasts in a better way. Furthermore if the
employees‟ working at SSS department uses a predetermined method or technique for
forecasting, they can according to Jacob et al (1999) after some repetitions better
understand the previous forecast and in this way be able to improve the future
forecasts. Also by documenting the forecasting process SSS could easier improve
their forecast since it is easier to identify which areas could be improved (Handfield,
2006)
38
5.3.2 Sale Supply Support and the local market
At the moment SSS is using a calendar which includes information about IKEA
Jönköping customers and local events. A way for IKEA to know the local market
better and be even more prepared to the lumpy demand could be by update the
calendar with more detailed information about the customers and local events.
Langley et al (2009) and Handfield (2006) highlights the importance within demand
management to know and analyze the customer‟s problems and needs, and also solve
them, this to be able to predict the demand in a better way. The factors which identify
events and deviations in the calendar could be developed at a broader scale to include
even more aspects. Another way for IKEA Jönköping to meet this type of demand in a
better way could be by implementing other types of forecasting techniques for those
products whit lumpy demand, forecasting techniques which slowly react on market
changes (Ballou, 2004).
Furthermore Langley et al (2009) explain that to easier solve customer‟s problems
organizations can share information about customer‟s needs and problems to be better
prepared for changes in demand. For example the calendar which IKEA Jönköping is
using could be shared and compared with all the other IKEA stores in Sweden to
acknowledge new and update old factors within the calendar. An example could be to
implement a closer relationship with the IKEA store in Linköping and compare each
other calendars to see which factors are being included or not. By collaborating with
other IKEA stores and share information a higher level of accurate forecasts can be
achieved (Chopra & Meindl, 2007). Ballou (2004, p.315) mentions also the same
benefits as he explain it by “multiple parties have the likelihood of producing more
accurate forecast that a single party”. To understand the customers even better IKEA
Jönköping could also make customers surveys during special occasions about why the
customers are visiting IKEA today. In these way customers perception about the
company could be even better since IKEA Jönköping is meeting the customer demand
and offering the right products in a better way (Simchi-Levi et al, 2003).
5.3.3 Sale Supply Support and the department of sales and logistics
To handle the issue about lack of communication between logistic department
working with deliveries and SSS, they need to improve the flow of information. If
SSS and the department of sales and logistics creates a system which shares
information about demand, it can according Handfield (2006) result in more accurate
forecast. An example of how the information can be exchanged could be done by
implement clear guidelines about when and what information should be shared. Both
departments need to identify and solve problems together so they can avoid them in
the future. An example is that the sales and logistics personnel in the warehouse
working at the Pick-your-self-stock can more frequently inform SSS about the current
stock levels and correct them. This will help the SRS and SSS to make more accurate
forecast. Liker & Meier (2006) explain to be able to improve a certain area or work
task clear guidelines needs to be implemented. According to the authors,
documentation could be a tool where the guidelines are stated, and in this case for
IKEA Jönköping, documentation could be used to explain how the information flow
and exchange should be managed.
SSS need also to know what kind of negative consequences inaccurate forecasting has
on the logistics department working with deliveries, this to be able improve their
behavior linked with forecast and constantly strive to improve their forecast. This is
39
something that Mentzer (2004) highlight when he explain the importance of people
knowing what kind of negative effects poor performance has on other departments.
Furthermore SSS also need to receive feedback on their work performance to be able
to improve themselves. Mentzer (2004) explain that it is important to receive personal
feedback on the performance this to be able to improve the forecasting accuracy. For
the employees working with forecasting in IKEA Jönköping this could be done by
implement KPIs, for example forecasting accuracy. Furthermore it could be important
to compare these KPIs towards other employees at other IKEA stores working with
the same work task. This because Slack & Lewis (2008) explain that KPI are not
useable unless they are being compared towards another standard. Furthermore, by
implementing KPIs the employees will be more focused on their main objectives
(Christopher, 2005)
5.4 Performance analysis at IKEA Jönköping SSS in IKEA Jönköping measure the forecasts with KPI´s shown in appendix 2. Total
average stock value for this four weeks is about 53.8 million SEK (see figure 7), the
two largest divisions are kitchen with an average stock value of more than 6.5 million
SEK and the division of bedroom furniture has more than 5 million SEK for these
four weeks.
The KPI concrete measure the amount of products that sells less than one in five
weeks. According to SSS this is products that should be removed from inventory to
make space to other better selling products. The Jönköping store has a goal of less
than 9% of all the products to be labeled as concrete and the store reach this goal with
an average of 7.5% concrete for this time span. However there are number of sales
divisions that have a higher concreter level of 15 %. The reason why this KPI is not
fair is because there a larger deviations between the different sales divisions. For
example the decoration division with over 700 articles has an average concrete KPI of
about 0,6% during this time span, meanwhile living room division with over 600
articles has a average concrete KPI of about 22%. Even though IKEA Jönköping
reaches their concrete goal they still can improve those divisions with high levels of
concrete.
The overstock KPI measure the amount of unnecessary products that are placed in
inventory since the current stock level is forecasted to supply the demand. The store in
Jönköping has the goal of a total product overstock of maximum 22% and the average
for these four weeks is 22.5%. There are sales divisions with more than 30% of
overstock and divisions with lower than 20%. One reason why this happen could be
that the demand forecasts have been inaccurate and the SRS has ordered too much
products that has not sold fast as planned.
According to the logistics department working with deliveries, when too much is
ordered the employees does not always have time to place all the products in stock.
By having inaccurate forecast which results in higher inventory levels, it will affect
the warehousing cost negatively. According to Mattsson & Jonsson (2003) the
warehousing cost will increase if the level of inventory increases, this since the level
of personal, insurance and handling cost will be higher.
40
Figure 7. IKEA Jönköping average KPI
5.4.1 Service levels
The goal for all products within service levels 2 (97%) and 3 (95%) at IKEA
Jönköping are being achieved, this due to accurate forecasts. Meanwhile the goal for
service level 1 (99%) is not being achieved. An example is the sales division of
kitchen which has over 1200 products and with an average service level of about 93%.
A reason for the failure within this service level could be the problems that were
mentioned before, such as the lack of integration between the different departments,
the lack of structure and guidelines and knowledge about the local market. The
demand planner at SSS explain that it may be because there are shortages of several
key products in the supply chain.
Furthermore the sales division with the average service level of about 93% has an
overstock level of 22%. By this information it means that even though this division
has a low service level it still has almost exceeded its limit of allowed overstock. This
means that this division has not optimized its forecast accuracy and by that having
inaccurate inventory levels which affect the customer service. One reason for this
problem could be that the kitchen division has more than 1200 different articles and
this makes it more difficult to have all that articles in stock.
Retailers should focus on the products that are categorized as the most profitable ones
(Flores & Whybark 1986, Mentzer 2004). An important task for demand management
is to decrease demand on products that are less profitable (Mentzer 2004). SSS could
decrease demand for S1-producst when they know there are a shortage in the supply
chain or when forecast are inaccurate, an example to decrease demand is to give a
product a less exposed sales spot or remove the product from the shelf and only sell to
customers that asks for it. On the other hand SSS could emphasize demand on
products that are considered concrete.
41
6 Discussion We think that it would be hard to establish a close integration between IOS and all
stores in the world. If IKEA Jönköping and IOS create a close relationship IOS will
probably also need to include all other stores in the world. This will probably create a
higher workload and be more time consuming for IOS, since IKEA have over 30000
articles and about 280 stores. The level of information shared about demand should be
balanced so that the information is not to complex or too simple. However we think
this will increase the forecast accuracy at IKEA Jönköping.
SSS need to develop structures and guidelines in order to be able to improve their
work performance. By repeating the work processes SSS can learn and improve future
demand forecasts. SSS has to develop the guidelines by them self otherwise there
could be a problem with following them. In the future this will lead to less workload
and more accurate forecast.
SSS is using a calendar with information about local demand and we think this tool is
great for identifying local events and to be better prepared when predicting the
demand. As mention in the analysis we suggested that the calendar should include
more factors about local demand and create a closer relationship with other IKEA
stores. There is a risk that too many aspects that are not necessary are being included
in the calendar and that SSS is putting too much emphasis on this tool. By including
the right aspects that captures the local demand, this tool could be very useful for SSS.
As mention in the analysis chapter, sales department and SSS can be more integrated
when it comes to information exchange about demand; by doing so it could lead to
better forecast accuracy. The information sharing between departments could lead to
higher workload, be time consuming and create problems with the integration. We
think that if SSS wants more information about demand they have to use the sales
department further and integrate more. If both departments understand the benefits by
having integrated information exchange we think that it would be easier to implement
a closer collaboration. By having better information exchange between departments
SSS could obtain better performance in their work tasks.
We suggested in the analysis that employees of sales and logistics working with the
Pick-your-self-stock should make more and faster inventory control. This will help
SSS to collect more accurate data about inventory levels and facilitate their work tasks
linked with forecasting. This could increase workload on the employees and is time
consuming, there is also a risk this task will not be prioritized. It is important that the
employees working with inventory control find a balance between the work tasks,
maybe one more extra inventory will be sufficient.
Personal KPIs and feedback on SSS work performance could be implemented for the
employees to be able to improve themselves. It could be sensitive to have individual
KPIs or feedback for the employees because of integrity. To solve this problem KPIs
and feedback could be anonyms and only shared between the employee and the
manager. By not knowing how well the employee is performing there is little chance
to improvement so we think SSS need something to measure linked with individual
forecast performance.
42
Finally after analyzing IKEA Jönköping KPIs we see that IKEA Jönköping and SSS
are performing well on macro level since most of the KPI goals are being reached.
When analyzing each division against the KPI goals we can see that there are large
deviations where some of the divisions are above the allowed limit. We think that by
implementing some of our solutions such as the level of integration, flow of
information and creating structures and guidelines IKEA Jönköping could improve
these divisions and performing better at micro level.
6.1 Future research areas To make this thesis more reliable a benchmarking analysis could be conducted at a
similar organization or another SSS division within the IKEA organization, this to
compare similarities and differences in the forecasting system towards the one used in
IKEA Jönköping.
A deeper investigation between all of the departments that are linked with SSS work
performance could be performed to make the case study more reliable.
Furthermore it could be suitable to help SSS develop and implement solutions
regarding the guidelines and structures.
43
7 Conclusion Our first research question was to identify what kind of forecasting system IKEA
Jönköping is using. From the empirical study it was identified that IKEA Jönköping is
using both automatically and manually forecasting systems. First of all IOS sets the
initial global forecast for all IKEA stores, then on national level and finally on local
level. From this point SSS manually and automatically adjust the forecast to meet the
local demand. SSS uses a calendar that maps local events and holidays which affects
the level of demand. Furthermore SSS uses a system to maintain the stock levels
which is called SRS. This system helps the employees at SSS to predict the demand
by using initial forecast from IOS, sales history and local events combined with the
employees own adjustment in the system based on their experience about the market.
The second research question was to identify the problems with the current
forecasting. From our empirical study we identified problems in different areas; such
as between IOS and SSS, SSS and the local market and SSS and the department of
sales and logistics. The problems within these areas are a combination of insufficient
information regarding the demand and lack of guidelines and principles to handle
forecast and information exchange.
The third research question was to indicate solutions that could improve the
forecasting system. Within this research question we highlighted the importance of a
closer integration between IOS and SSS. This were mostly regarding the exchange
and flow of information, by doing so we think that it will ease the understanding of
initial forecast for SSS.
We suggested also that SSS needed to create and implement clear guidelines to better
structure their work, this in order to be able to identify which areas within their work
tasks that could be improved.
Further on we gave suggestion on how IKEA Jönköping could be better prepared for
changes in the demand. We suggested that SSS could develop their calendar by
creating a closer relationship to other IKEA stores and by so include more factors
which affect the demand. SSS could also incorporate a closer integration with the
sales and logistics department, this to get more accurate information about demand
and solve problems related with forecasting. SSS could also implement personal KPI,
so the employees can receive feedback on their work performance, this to be able to
improve themselves.
Finally we analyzed IKEA Jönköping KPIs and it was identified that IKEA Jönköping
reached most of the KPI goals linked with forecasting, but more focus should be
directed to the large deviations between the different divisions
44
8 References A6 Center. (2011). Information. From A6 Center: http://a6center.se/information/
den 20 03 2011
Agarwal, V. (den 12 Mars 2007). The Hindu Business Line: Supply chain and retail:
The means to the end. From BusinessLine:
http://www.thehindubusinessline.in/2007/03/12/stories/2007031201160
600.htm den 10 Mars 2011
Alderson, W. (1950). Marketing efficiency and the principle of postponement.
Marketing Behavior and Executive Action , 109-113.
Arnold, T. J., Chapman, S. N., & Clive, L. M. (2007). Introduction to Materials
Management (6th uppl.). Upper Saddle River: Pearson Education.
Ballou, R. H. (2004). Business Logistics/Supply Chain Management. Upper Saddle
River: Person Education.
Balnaves, M., & Caputi, P. (2001). Introduction to quantitative research methods, An
invetigative approach. London: SAGE Publications Ltd.
Bell, J. (1999). Doing your research project, A guide for first-time researchers in
education and social science, 3rd edition. Buckingham: Open
University Press.
Blaxter, L., Hughes, C., & Tight, M. (2001). How to research, second edition.
Buckingham: Open University Press.
Bucklin, P. L. (1965). Postponement, Speculation and the Structure of Distribution
Channels. Journal of Marketing Research , 26-31.
Bureau of Justice Assistance. (2011). Office of Justice Programs. From Center of
Program Evaluation and Performance Measurement:
http://www.ojp.usdoj.gov/BJA/evaluation/glossary/glossary_f.htm den
11 04 2011
Business Dictionary. (2011). Business Dictionary. From Quantitative Data:
http://www.businessdictionary.com/definition/quantitative-data.html den
21 03 2011
Chan, F. (2003). Performance Measurement in Supply Chain. Advanced
Manufacturing Technology , 534-548.
Chopra, S., & Meindl, P. (2007). Supply Chain Management; Strategy, Planning &
Operaions. Upper Saddle River: Person Education.
Christopher, M. (2005). Logistics and Supply Chain Management; Creating Value-
Adding Networks. Harlow : Prentice Hall/Financial Times.

45
Ernst, R., & Kamrad, B. (2000). Evaluation of supply chain structures through
modularization and postponement. European Journal of Operational
Research , 495-510.
Flores, B. E., & Whybark, D. C. (1986). Multiple Criteria ABC Analysis.
International Journal of Operations & Production Management , 38-46.
Gustavsson, B. (2004). Kunskapande metoder inom samhällsvetenskapen. Lund:
Studentlitteratur .
Handfield, R. (2006). Supply Market Inteligence; A Managerial Handbook for
Building Sourcing Strategies. Boca Ranton, FL: Taylor & Francis
Group.
Harland, C. M. (1996). Supply Chain Management: Relationships, Chains and
Network. Brtittish Journal of Management , 63-80.
Hultsch, D., Hertzog, C., & Dixon, R. (1990). Ability correlates of memory
performance in adulthood and aging. Psychology and Aging 5 , 356-368.
Inter IKEA Systems, B. (2011). 1940-1950. From IKEA:
http://www.ikea.com/ms/sv_SE/about_ikea/the_ikea_way/history/1940_
1950.html den 20 03 2011
Inter IKEA Systems, B.V. (2011). Varuhusen på världskartan. From IKEA:
http://www.ikea.com/ms/sv_SE/about_ikea/facts_and_figures/store_ope
nings.html den 20 03 2011
Inter IKEA Systems, B.V. (2011). Welcome inside, Yearly Summary FY10 IKEA
Group. The IKEA Group of Companys.
Inter IKEA Systems, B.V;. (2011). Vårt sortiment. From IKEA:
http://www.ikea.com/ms/sv_SE/about_ikea/the_ikea_way/our_business
_idea/our_product_range.html den 20 03 2011
Jacob, J., Lys, T. Z., & Neale, M. A. (1999). Expertise in forecasting performance of
security analysts. Journal of Accounting and Economics 28 , 51-82.
Jonsson, P., & Mattsson, S.-A. (2005). Logistik: läran om effektiva materialflöden.
Studentlitteratur.
Kahn, K. B. (1998). Benchmarking sales forecasting performance measures. The
Journal of Business , 19-23.
Kundrelation;. (2011). Kundrelationsbladet. Jönköping: IKEA Jönköping.
Langley, J. J., Coyle, J. J., Gibson, B. J., Novack, R. A., & Bardi, E. J. (2009).
Managing Supply Chains: A logistics approach. Mason, OH: South-
Western, Division of Thomson Learning.
46
Larsen, A. K. (2007). Metod helt enkelt, En introduktion till samhällsvetenskaplig
metod. Malmö: Gleerups Utbildning AB.
Levy, M., & Weitz, B. A. (2009). Retailing Management. London: McGraw-Hill
Higher Education.
Liker, J. K., & Meier, D. (2006). The toyota way fieldbook a practical guide for
implementing Toyota's 4Ps. New York; London: McGraw-Hill.
Mattsson, S.-A., & Jonsson, P. (2003). Produktionslogistik. Lund: Studentlitteratur
AB.
Mentzer, J. T. (2004). Fundamentals of Supply Chain Management: Twelwe Drivers
of Competitive Advantage. Thousand Oaks: Sage Publications Inc.
Olhager, J. (2000). Produktionsekonomi. Lund: Studentlitteratur.
Pagh, J. D., & Cooper, M. C. (1998). Supply chain postponement and speculation
strategies: How to choose the right strategy. Journal of Business
Logistics , 19, 13-32.
Risch, E. H. (1991). Retail Merchandising Second Edition. New York: Macmillian
Publishing Company.
SCB;. (den 11 05 2010). Befolkningsstatistik. From Statistiska centralbyrån:
http://www.scb.se/Pages/TableAndChart____293162.aspx den 20 03
2011
Simchi-Levi, D., Kaminsky, P., & Simchi-Levi, E. (2003). Managing the supply
chain: the definite guide for the business professional. New York:
McGraw-Hill.
Slack, N., & Lewis, M. (2008). Operations Strategy. Harlow: Finacial Times/Prentice
Hall.
TMF. (2010). Fakta: Statistik. From www.tmf.se:
http://www.tmf.se/web/Mobler_1.aspx den 12 02 2011
Trochim, W. (den 20 10 2006). Research Methods Knowledge Base. Hämtat från
Qualitative Measures :
http://www.socialresearchmethods.net/kb/qualdata.php den 21 03 2011
Twede, D., Clarke, R. H., & Tait, J. A. (2000). Packaging Postponement: A Global
Packaging Strategy. Packaging technology and science , 105-115.
Waller, M. A., Dabholkar, P. A., & Gentry, J. J. (2000). Postponement, Product
customization, and market-oriented supply chain management. Journal
of Business Logistics , 133-159.

47
Van Hoek, R. I., Commandeur, H. R., & Vos, B. (1998). Reconfiguring logistics
systems through postponement strategies. Journal of Business Logistics ,
33-54.
van Hoek, R. (2001). The rediscovery of postponement a litterature review and
directions for research. Journal of Operations Management , 161-184.
Yin, R. (2003). Case study research : design and methods. Thousand Oaks: Sage
Publications.
Yin, R. K., & Nilsson, B. (2007). Fallstudier : design och genomförande / Robert K.
Yin ; i översättning av Björn Nilsson ; [fackgranskning: Jan Teorell].
Malmö: Liber.
48
Appendix 1 Interview questions
Frågor Logistik
1. Hur påverkar det er när ni har mycket inleveranser?
2. Om ni inte hinner klart vad gör ni med de produkter som kvar i lastbilen?
3. Tar ni reda på varför ni inte hann? Har ni kontakt med SSS?
4. Open inventory, hur hanterar ni det? Felaktiga lagersaldon, feedback?
Frågor Sälj
1. Hur arbetar ni med SSS?
2. Hur ofta får/ger ni info om efterfrågan?
3. Identifierar ni problem kopplat till efterfrågan?
4. Får/ger ni återkoppling på efterfrågan?
Questions Logistics
1. How does it affect you when you have a lot of deliveries?
2. If you do not manage the deliveries what do you do
with the products remained in the truck?
3. Do you find out why you did not have time enough? Do you have any
collaboration with SSS?
4. Open inventory, how do you handle it? Inaccurate inventory levels, feedback?
Questions Sales
1. How does the collaboratation with SSS work?
2. How often do / give you info on demand?
3. Do you identify problems linked with demand?
4. Can/do you give feedback about demand?
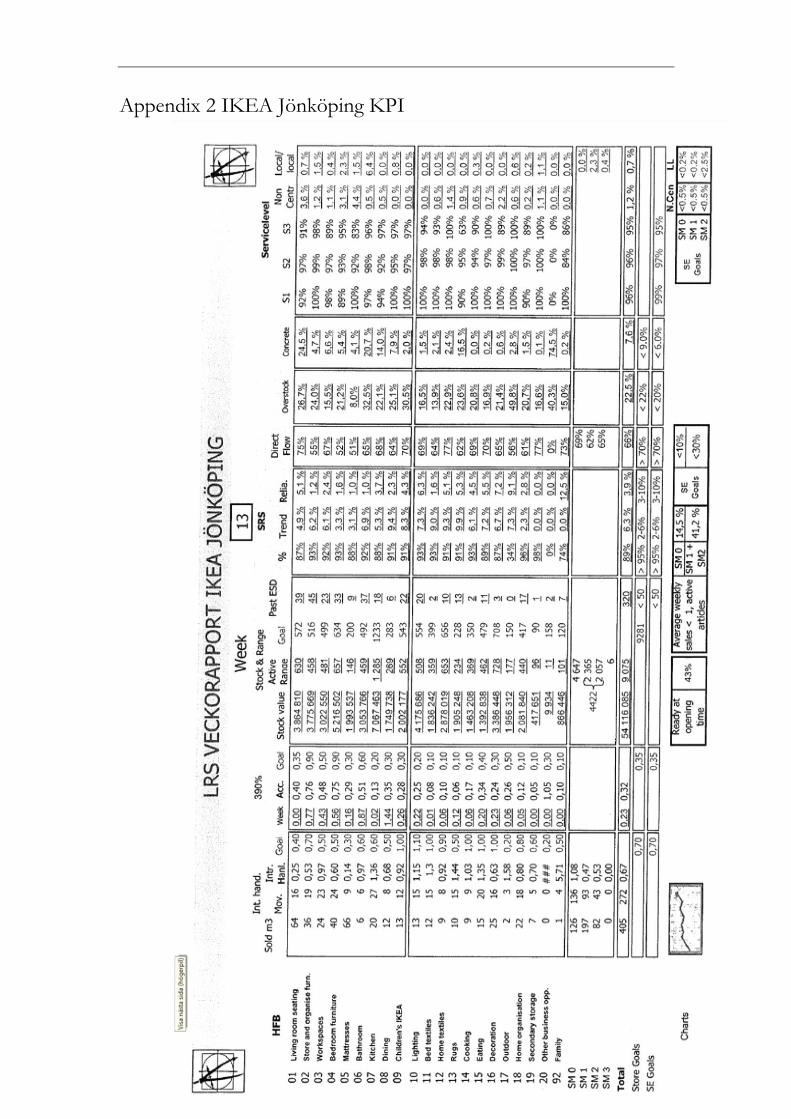
49
Appendix 2 IKEA Jönköping KPI
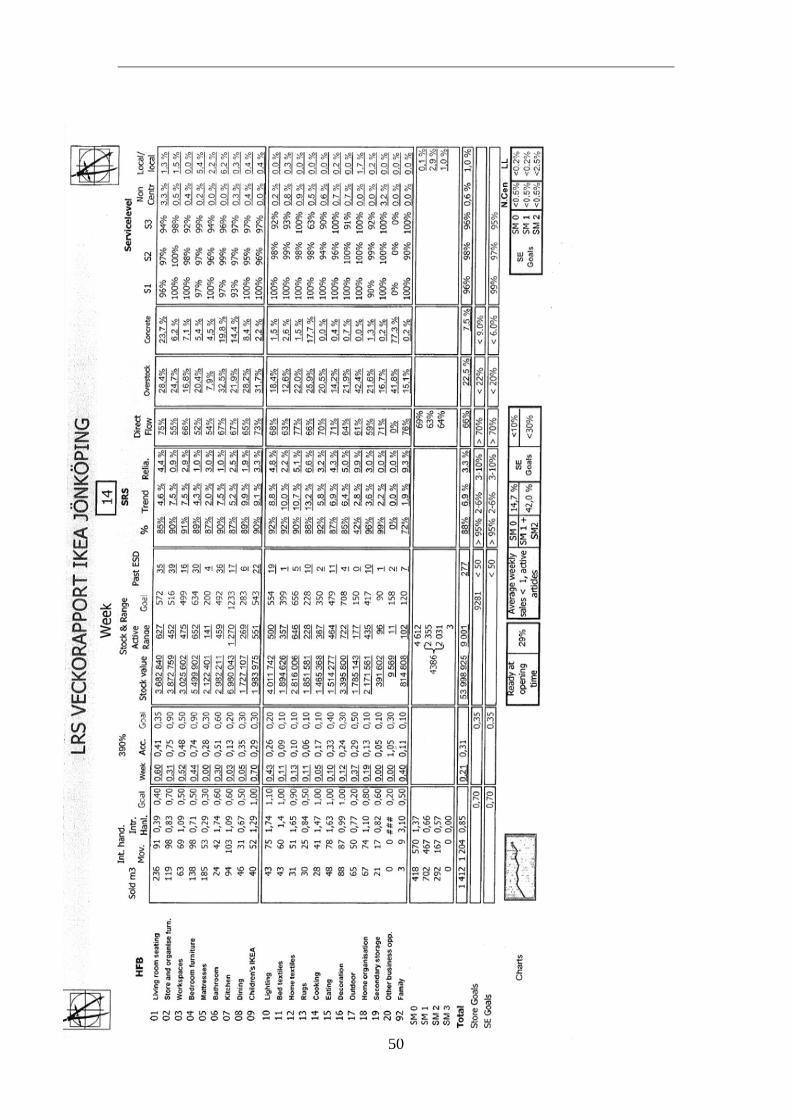
50
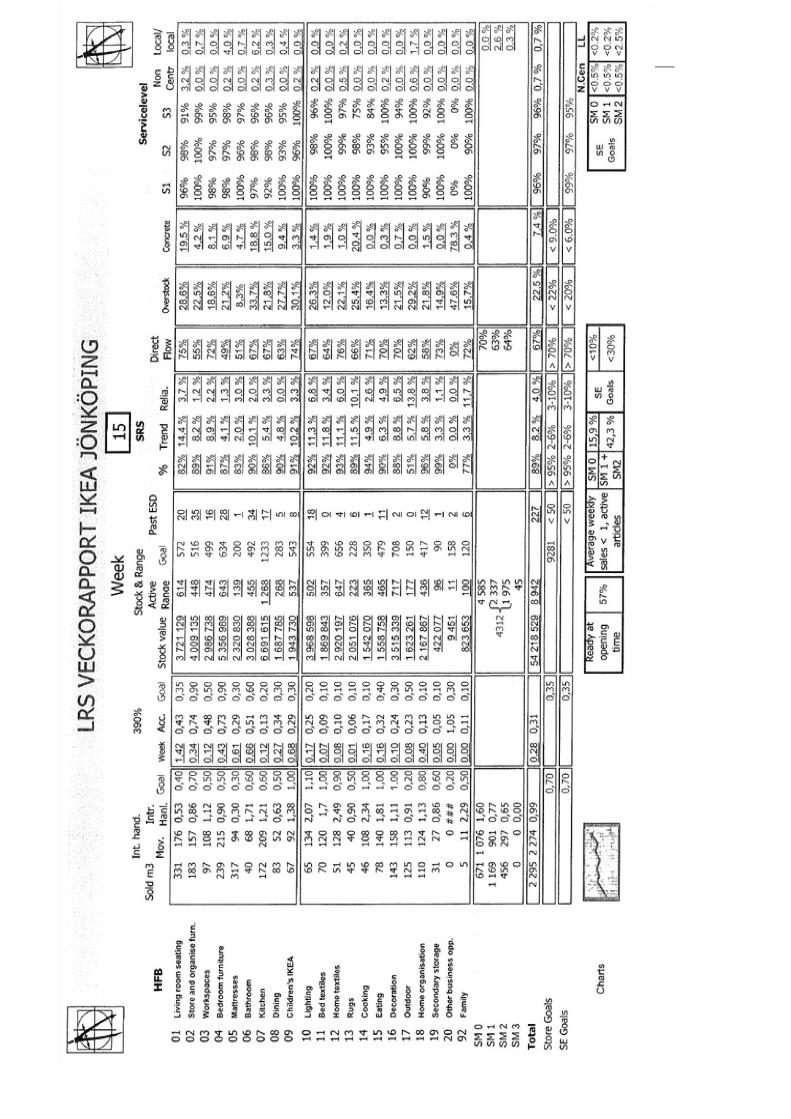
51
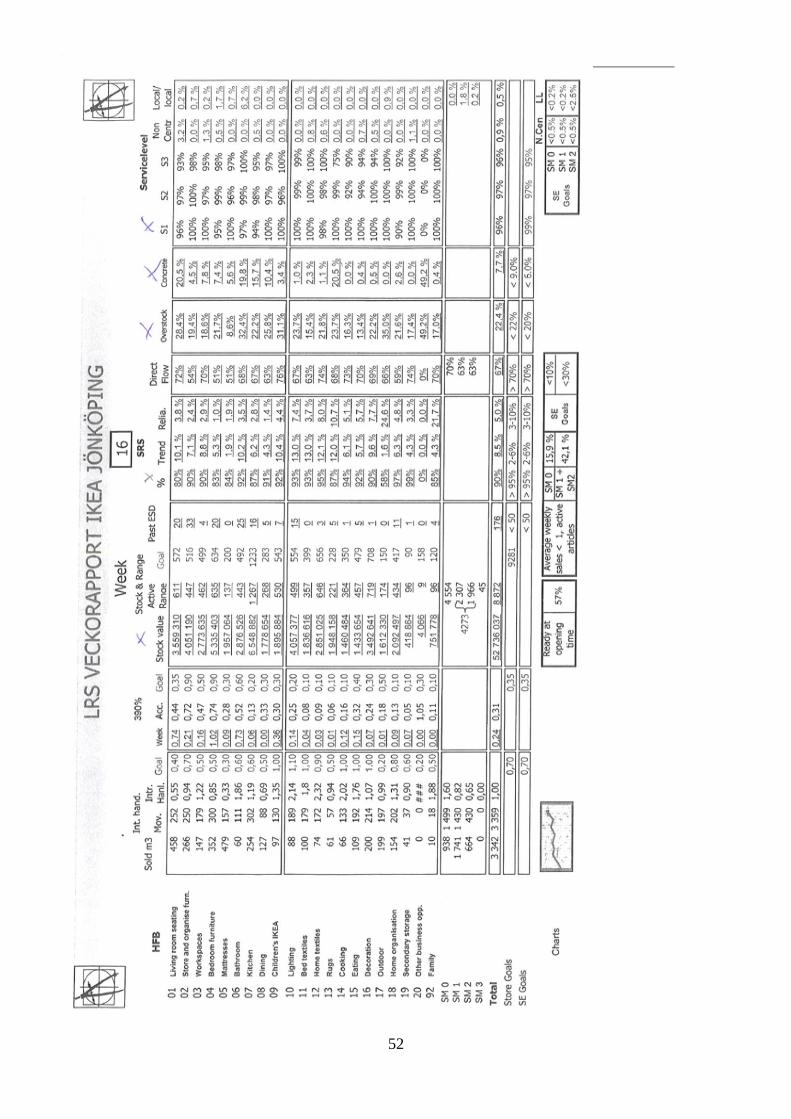
52