Forecasting students future academic performance using big ...
21
Score Forecasting with Machine Learning Models NCME 2019 1 2 3 4 5 Forecasting students’ future academic 6 performance using big data analytics 7 8 9 10 Zhen Li, Steven Tang 11 12 eMetric LLC 13 14 15 16 17 18 Paper written for the 2019 meeting of the National Council on Measurement in 19 Education, Toronto, Canada. The views expressed in this paper are solely those of the 20 authors and they do not necessarily reflect the positions of eMetric LLC. 21 Correspondence concerning this paper should be addressed to Zhen Li, eMetric, 211 N 22 Loop 1604 E, Suite 170, TX 78232. Email: [email protected]. 23
Transcript of Forecasting students future academic performance using big ...

Score Forecasting with Machine Learning Models NCME 2019
1
2
3
4
5
Forecasting students’ future academic 6
performance using big data analytics 7
8
9
10
Zhen Li, Steven Tang 11
12
eMetric LLC 13
14
15
16
17
18
Paper written for the 2019 meeting of the National Council on Measurement in 19
Education, Toronto, Canada. The views expressed in this paper are solely those of the 20
authors and they do not necessarily reflect the positions of eMetric LLC. 21
Correspondence concerning this paper should be addressed to Zhen Li, eMetric, 211 N 22
Loop 1604 E, Suite 170, TX 78232. Email: [email protected]. 23

Score Forecasting with Machine Learning Models NCME 2019
Abstract 24
In education, big data analytics methods have become increasingly popular 25
(Romero & Ventura, 2010). This article illustrates how we use XGBoost regression trees 26
for predicting students’ future performance in state summative tests. Bayesian networks 27
and linear regression model are applied for comparison. Results show that XGBoost 28
regression trees perform the best, with higher prediction accuracy and computation 29
efficiency. The XGBoost regression tree also works better with incomplete data sets. 30
Keywords: XGBoost regression tree, Bayesian networks, K-12 assessment 31
32
Year after year, students take high stakes summative tests, and the results of 33
these tests can have far-reaching consequences for students, teachers, and other 34
stakeholders. In this study, we investigate the possibility of using the XGBoost 35
statistical framework, which implements gradient boosted regression trees, in order to 36
make potentially useful forecasts of student scores on high stakes summative tests. 37
Given the current and prior scores of a particular student, we seek to forecast how that 38
student will do on next year’s tests. This type of information could be useful to many 39
stakeholders; teachers and schools could draft a plan to create targeted interventions for 40
at-risk students, for example. The underlying hypothesis is that modern methods such 41
as XGBoost regression have proven to be statistically accurate and operationally easy to 42
use and may be able to provide a feasible statistical framework to provide score 43

Score Forecasting with Machine Learning Models NCME 2019
forecasts, and such predictions could eventually be disseminated via reporting to 44
various stakeholders. We seek to compare XGBoost results to other commonly used 45
statistical frameworks in education literature, namely Bayesian networks and linear 46
regression. The statistical frameworks will be evaluated using overall predictive 47
accuracy (root-mean -square error) as well as robustness to missing data. 48
49
The Big Data Analytics Models 50
XGBoost regression tree (XGBoost). This approach relies on iteratively building a 51
collection of simple regression trees; regression trees are decision trees that predict 52
continuous outcomes (Chen & Guestrin, 2016). The iterative process starts by first 53
creating an extremely simple predictive regression tree; such a tree might only have 54
between 2 to 16 leaf nodes. This initial regression tree is constructed by searching 55
through a large number of potential split values among all input variables and finding 56
the splits that minimize prediction error. The iterative process continues by constructing 57
an additional regression tree of the same structure, but this time constructed to 58
minimize the residual errors of the first regression tree. The next iterative tree is then 59
constructed to minimize the residuals of the full model thus far, and the process of 60
iteratively creating new trees continues until stopping criteria is met. As the name 61
implies, gradient boosting uses gradient descent to find the next regression tree to add 62
to the ensemble. At the end of the building process, the predictions are given by the 63

Score Forecasting with Machine Learning Models NCME 2019
sum of the outputs of all trees. This process of building a gradient boosted regression 64
tree was optimized in the XGBoost package allowing for very fast computation of 65
gradient boosted trees as well as many opportunities for additional model tuning 66
(Benjamin, Fernandes, Tomlinson, Ramkumar, VerSteeg, Miller, & Kording, 2014). 67
For a predictive model �̂�1 = 𝑓1(𝑋), where X indicates input variables, �̂�1 68
indicates predications by the first tree and y indicates the observed output variable, a 69
loss function can be defined between the prediction and the observed outcome: 𝑙(�̂�1, 𝑦). 70
During training, the first tree can be estimated by minimizing the following objective: 71
𝐿1 = ∑ 𝑙(�̂�1, 𝑦) + Ω(𝑓1) (1)
Ω is a regularizing function to avoid overfitting. Then a second tree 𝑓2(𝑋) will be 72
constructed by predicting the residuals of the first tree. The objective to minimize is as 73
follows: 74
𝐿2 = ∑ 𝑙(�̂�1 + 𝑓2(𝑋), 𝑦) + Ω(𝑓2) (2)
The process continued sequentially for a fixed number of trees (N). Total loss will be 75
progressively decreased with each additional tree. In the end, the prediction for y will 76
be the sum of the predictions of all trees: 77
�̂� = ∑ 𝑓𝑘(𝑋)
𝑁
𝑘
(3)
Compared to linear regression and quantile regression, XGBoost regression tree 78
require completely different assumptions. For example, linear regression has a basic 79
Score Forecasting with Machine Learning Models NCME 2019
assumption that the sum of its residuals is 0. XGBoost regression tree, through its 80
boosting process, instead attempts to find and model patterns in the residuals and 81
strengthen the model with weak learners that exploit these patterns. This approach has 82
shown to be extremely powerful in big data tasks, winning a variety of competitions 83
where predictions need to be made based on a wide set of predictors. 84
Bayesian networks (BN). Based upon a joint distribution for a directed acyclic graph, 85
Bayesian networks can estimate conditional probability of one variable given other 86
variables in the net. As we know, building a Bayesian net consists of two parts: 87
structure learning and parameter learning. The structure of a net can be either freely 88
estimated or pre-defined. In this study, we compared results from a learned structure 89
and a fixed structure and found the prediction results very close to each other. With a 90
large number of input variables, structure learning is very time demanding. Therefore, 91
a simple fixed structure was applied for all the Bayesian networks modeling. 92
𝑃(𝑦|𝑿) = 𝑃(𝑦) ∏ 𝑃(𝑥𝑘|𝑦)
𝑛
𝑘=1
(1)
Where 𝑿 = (𝑥1, … , 𝑥𝑘, … , 𝑥𝑛) indicates the input variables, y indicates the score field to 93
be predicted. The number if input variables is n. The net only has edges from all the 94
input variables to the target variables, which means that the target variable is 95
dependent on all the input variables. Furthermore, all the input variables are assumed 96

Score Forecasting with Machine Learning Models NCME 2019
to be independent. The parameters of the structure (conditional probabilities) were 97
freely estimated by maximum likelihood estimation. The R package "bnlearn" is used 98
for parameter calibration (Scutari, 2010). As all functions in “bnlearn” require complete 99
data, the training data only contains students with complete observations. For the test 100
data, we impute the input variables with the learned net at the first step and predict the 101
target variables at the second step. 102
Bayesian networks (Pearl & Scutari, 2000; Scutari, 2010) have been thoroughly 103
studied for several decades and is also popular in the psychometrics field (Pearl & 104
Scutari, 2000; Mislevy, Almond, Yan & Steinberg, 2000; Tsamardinos, Brown, & Aliferis, 105
2006; Sinharay, 2006; Scanagatta, de Campos, Corani, & Zaffalon, 2015). Comparing to 106
other machine learning models, Bayesian networks have shown several advantages. 107
First, expert knowledge of the net structure and conditional probabilities can be 108
incorporated. Second, all the parameters in Bayesian networks are interpretable and can 109
be presented clearly in a graph. Third, no specific input and output variables need to be 110
defined. That is to say, once the net is learned and calibrated, the values of any variable 111
can be predicted using the other variables. Fourth, Bayesian networks have also been 112
found to be robust to missing data (Friedman, 1997). Fifth, likelihoods can be provided 113
to predicted scores. Finally, Bayesian networks have been applied in psychometrics for 114
decades. For example, Mislevy et al. (2000) applied Bayesian networks to model 115
relationships between latent cognitive variables; Sinharay (2006) applied the posterior 116
Score Forecasting with Machine Learning Models NCME 2019
predictive model checking method to evaluate model fit of Bayesian nets. Therefore, we 117
select Bayesian networks as our second method. 118
Methodology 119
Data 120
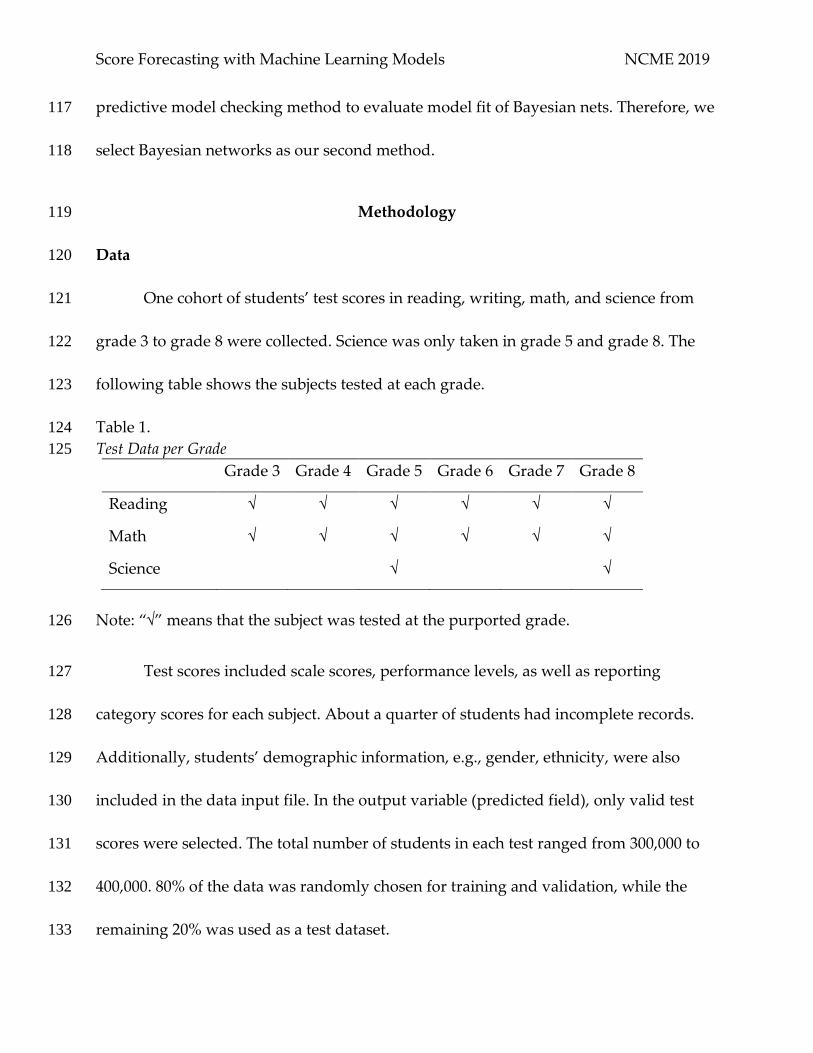
One cohort of students’ test scores in reading, writing, math, and science from 121
grade 3 to grade 8 were collected. Science was only taken in grade 5 and grade 8. The 122
following table shows the subjects tested at each grade. 123
Table 1. 124
Test Data per Grade 125
Grade 3 Grade 4 Grade 5 Grade 6 Grade 7 Grade 8
Reading √ √ √ √ √ √
Math √ √ √ √ √ √
Science √ √
Note: “√” means that the subject was tested at the purported grade. 126
Test scores included scale scores, performance levels, as well as reporting 127
category scores for each subject. About a quarter of students had incomplete records. 128
Additionally, students’ demographic information, e.g., gender, ethnicity, were also 129
included in the data input file. In the output variable (predicted field), only valid test 130
scores were selected. The total number of students in each test ranged from 300,000 to 131
400,000. 80% of the data was randomly chosen for training and validation, while the 132
remaining 20% was used as a test dataset. 133

Score Forecasting with Machine Learning Models NCME 2019
Study Design 134
The aim of this study is to evaluate XGB in predicting students’ next-year 135
academic performance in summative tests. We compare XGB with two popular 136
approaches: Bayesian networks and linear regression. In the prediction model 137
framework, the input variables include all previous years’ test scores and students’ 138
demographic information (2013-2017). The output variables are test scores at the most 139
recent year (2018). For students in a lower grade, e.g., grade 4, only one previous-year 140
data exist (e.g., grade 3 in 2017); However, students in a higher grade, e.g., grade 8, have 141
many more previous years of test data (e.g., grade 3 in 2013 - grade 7 in 2017). In this 142
study, we also explore how the prediction accuracy of XGB could improve when more 143
previous years of test data are used as input variables. In the end, we compare the 144
performance of XGB and Bayesian networks with regard to their prediction accuracy for 145
students with incomplete data. 146
Evaluation Criteria 147
We used root mean squared error (RMSE), mean errors (ME) and classification 148
consistency to evaluate the performance of the prediction models. 149
𝑅𝑀𝑆𝐸 = √∑(𝑆𝑆𝑓𝑜𝑟𝑒𝑐𝑎𝑠𝑡 − 𝑆𝑆𝑜𝑏𝑠𝑒𝑟𝑣𝑒𝑑)2
𝑁
𝑖=1
𝑁⁄ , (2)
Score Forecasting with Machine Learning Models NCME 2019
𝑀𝐸 = ∑(𝑆𝑆𝑓𝑜𝑟𝑒𝑐𝑎𝑠𝑡 − 𝑆𝑆𝑜𝑏𝑠𝑒𝑟𝑣𝑒𝑑)
𝑁
𝑖=1
𝑁⁄ , (3)
where N is the total number of students for a test; 𝑆𝑆𝑓𝑜𝑟𝑐𝑎𝑠𝑡 indicates predicted scale 150
scores; 𝑆𝑆𝑜𝑏𝑠𝑒𝑟𝑣𝑒𝑑 indicates the observed scale scores. 151
Classification consistency is defined as the probability that the predicted scores 152
and real scores classify students into the same performance level group, based on the 153
given performance level cuts for each test. 154
Results 155
The three above-mentioned methods for predicting students’ academic 156
performance were applied to a longitudinal data set, consisting of students’ test scores 157
for 6 years in a state assessment. We predicted students’ scale scores of different 158
subjects at Grades 4-8 by all their corresponding previous-year data. Results are 159
presented in this section. 160
Model fit 161
Psychometric models commonly report one or several model fit indices when applied to 162
real data. However, machine learning packages do not produce model fit indices 163
directly. Usually, machine learning models are evaluated using different training, 164
validation and test datasets. The prediction errors on the validation and test data set are 165
Score Forecasting with Machine Learning Models NCME 2019
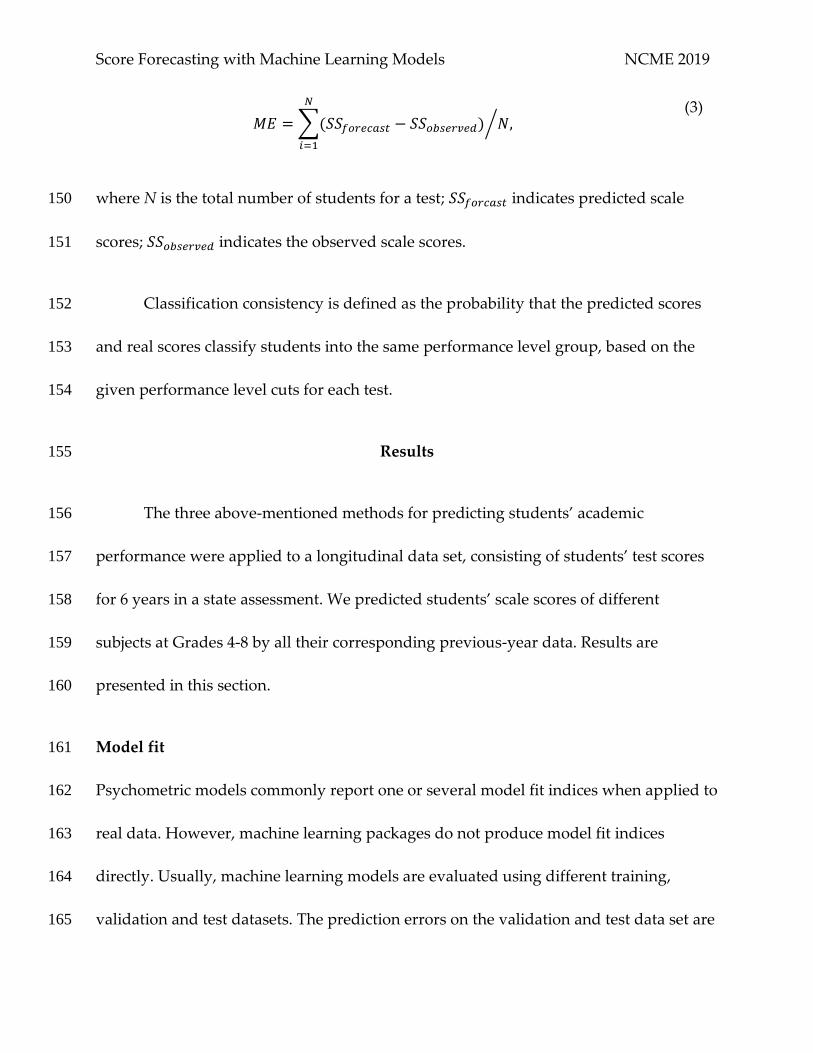
the major criteria of evaluation. XGBoost also produce the loss functions across training. 166
Figure 1 shows an example of the training and validation loss function across iterations 167
by XGBoost regression tree. Prediction errors for the training and validation data 168
decrease at the same time with more iterations, which provides evidence that 169
overfitting doesn’t happen. More complex model evaluation, such as cross validation, 170
could also be carried out for both methods. But as our sample size is very large while 171
the number of input variables is relatively small, it is evident that the training, 172
validation and test data in our study are all representative of the full data. 173
174
Figure 1 Loss over training iterations by XGBoost 175
Classification Consistency 176

Score Forecasting with Machine Learning Models NCME 2019
Using the predicted scores, classification consistency indices were calculated 177
based on known cut-off scores. From 2012-17, this test has two fixed cut-off standards: 178
“Performance Level Cut 1” and “Performance Level cut 2”. Table 2 presents the 179
classification consistency at each performance level cut respectively. 180
Table 2 181
Comparison of classification consistency index for two performance level cuts 182
Performance Level Cut 1 Performance Level Cut 2
Target Field Linear
regression
Bayesian
networks
Regression
tree
Linear
regression
Bayesian
networks
Regression
tree
G8 Math 0.698 0.742 0.788 0.882 0.896 0.901
G8 Reading 0.822 0.815 0.845 0.858 0.863 0.874
G8 Science 0.802 0.804 0.818 0.856 0.878 0.885
G7 Math 0.832 0.839 0.853 0.899 0.903 0.909
G7 Reading 0.820 0.819 0.842 0.856 0.866 0.876
G6 Math 0.780 0.831 0.845 0.882 0.910 0.915
G6 Reading 0.786 0.832 0.847 0.846 0.884 0.889
G5 Math 0.784 0.818 0.822 0.863 0.882 0.885
G5 Reading 0.787 0.828 0.833 0.853 0.877 0.880
G5 Science 0.759 0.808 0.810 0.898 0.910 0.911
G4 Math 0.797 0.823 0.826 0.857 0.884 0.885
G4 Reading 0.803 0.820 0.834 0.830 0.871 0.871
Table 2 shows that classification consistencies for the predicted scale scores by 183
XGBoost are higher in all conditions. Mostly, the classification consistencies for the 184

Score Forecasting with Machine Learning Models NCME 2019
predicted scale scores by Bayesian networks are close to those by XGBoost regression 185
tree, and much higher than those by linear regression. One exception is for Grade 8 186
reading test, the classification consistency index for the predicted score by Bayesian 187
networks at the first performance level cut standard is lower than that by the linear 188
regression. 189
Prediction Errors 190
The precision of predicted scores by three models was further evaluated using 191
RMSE. Figure 2 presents RMSE results of three methods. 192
193
Figure 2 RMSE for all tests by three methods 194
0
50
100
150
200
250
300
350
400
450
RMSE
Linear Regression Bayesian Networks XGBoost Regression Tree

Score Forecasting with Machine Learning Models NCME 2019
Figure 2 shows that the XGBoost regression tree has the smallest RMSE among 195
the three methods. Bayesian networks are slightly worse than XGBoost and better than 196
linear regression for most subjects and grades, except for grade 8 mathematics. In 197
addition, we also compute the mean errors and find that XGBoost has the most stable 198
and lowest mean absolute errors across all tests (see Figure 3). 199
200
Figure 3 Mean absolute errors for all tests by three methods 201
The reason why Bayesian networks don't perform well might be that quite a few 202
students have missing values for their previous-year scores, and Bayesian networks 203
would provide bad predictions for these students. On the contrary, XGBoost provides 204
-6.00
-4.00
-2.00
0.00
2.00
4.00
6.00
8.00
10.00
Mean Errors Linear RegressionBayesian NetXGB Regression Tree

Score Forecasting with Machine Learning Models NCME 2019
better predictions for students with missing data. In the next section, we conducted 205
some further analysis to test our hypotheses. 206
The Prediction for Students with Incomplete Data 207
Generally speaking, students with incomplete inputs have less accurate 208
predicted scores than the students who have complete input variables. Among the three 209
methods, XGBoost regression trees can handle missing data the best, with the highest 210
efficiency. It is able to train models with incomplete datasets and make predictions for 211
incomplete data; The trained model remains stable with or without missing values. 212
Table 3 shows the RMSE for complete and incomplete test datasets respectively, when 213
the XGBoost model was trained with both complete and incomplete data. 214
As a comparison, incomplete data needs to be attended more carefully in 215
Bayesian networks modeling. First, as mentioned above, all functions in ‘bnlearn’ 216
requires complete data, thus only students with complete data are included in the 217
training data set; Second, variables with only one constant value are removed from the 218
inputs, otherwise parameters will contain zeros and predictions cannot be generated; 219
Third, for students with incomplete data in the test dataset, imputation needs to be 220
carried out for all students to get a prediction; Fourth, when the number of input 221
variables is large (e.g., 117 input variables for Grade 6), the structure learning process 222
becomes extremely computationally demanding. This was one of the reasons why the 223

Score Forecasting with Machine Learning Models NCME 2019
net structure was fixed in our study, which might not be the best model for imputation 224
and prediction. Nonetheless, as shown in Table 4, with all the above issues considered, 225
Bayesian networks can provide adequate predicted scale scores. The model is also very 226
stable with incomplete data. The existence of incomplete data doesn’t exert an influence 227
on the prediction of students with complete data. 228
Table 3 229
RMSE for students with complete or incomplete data using XGBoost 230
Target Field
Complete
Incomplete
N_Train N_Test RMSE
N_Test RMSE
Grade 8 Math 259282 42506 78.4
22315 112.3
Grade 8 Reading 304416 57770 66.7
18335 84.3
Grade 7 Math 263172 52388 67.7
13405 101.0
Grade 7 Reading 290297 58034 67.1
14541 92.9
Grade 6 Math 279032 59056 69.4
10702 93.3
Grade 6 Reading 286567 59875 67.3
11767 98.0
Grade 5 Math 287105 63300 80.2
8477 110.8
Grade 5 Reading 288978 63815 70.6
8430 105.9
Grade 4 Math 287388 67590 82.9
4258 128.5
Grade 4 Reading 287653 67401 78.4
4513 132.5
231
Table 4 232
RMSE for students with complete or incomplete data using Bayesian Networks 233
Target Field
Complete
Incomplete
N_Train N_Test RMSE
N_Test RMSE

Score Forecasting with Machine Learning Models NCME 2019
Grade 8 Math 136283 42722 79.2
22099 164.6
Grade 8 Reading 185521 58041 66.7
18064 121.7
Grade 7 Math 168379 52624 68.2
13169 118.8
Grade 7 Reading 187311 58334 67.4
14241 143.5
Grade 6 Math 189761 59329 70.9
10429 129.6
Grade 6 Reading 192992 60187 67.6
11455 154.6
Grade 5 Math 204358 63650 80.6
8127 122.9
Grade 5 Reading 205342 64130 70.9
8115 129.1
Grade 4 Math 217450 67965 83.9
3883 153.4
Grade 4 Reading 217133 67816 79.5
4098 160.0
234
Figure 4 The average RMSE across grades and subjects 235
As shown in Figure 4, students with incomplete inputs have less accurately 236
predicted scores than the students who have complete input variables. XGBoost handles 237
missing data innately. Specifically, it is able to train models with incomplete datasets; 238
0
50
100
150
Complete Data Incomplete Data
Average RMSE
XGBoost Bayesian Networks

Score Forecasting with Machine Learning Models NCME 2019
the trained model remains stable with or without missing values. As a comparison, 239
Bayesian networks provide less accurate predicted scale scores for students with 240
incomplete data, even though the missing values were attended more carefully. 241
Nonetheless, the existence of incomplete data doesn’t exert an influence on the 242
prediction of students with complete data for both methods. 243
How Many Previous Years of Data Are Needed? 244
The prediction errors of XGBoost regression trees using different number of previous-245
year scale scores are computed. Figure 5 shows that when the number of previous years 246
increased, the prediction accuracy also increased. 247
248
Figure 5 Decreasing prediction errors with more previous years of data 249
80
82
84
86
88
90
92
94
G8 Math - UsingG7 Data
G8 Math - UsingG6,7 Data
G8 Math - UsingG5,6,7 Data
G8 Math - UsingG4,5,6,7 Data
G8 Math - UsingG3,4,5,6,7 Data
RMSE

Score Forecasting with Machine Learning Models NCME 2019
Conclusion 250
The practical purpose of this research is to investigate the practicality of using a 251
statistical framework like XGBoost to forecast scores for next year’s tests. The hope is 252
that forecasted scores could then be acted upon by stakeholders, perhaps to identify 253
areas of weakness or focus on at-risk students. In this study, we only predicted future 254
overall scale scores, but the XGBoost statistical framework should be capable of 255
predicting other more specific outcomes, such as more specific test subjects (known as 256
reporting categories in many states). 257
The results indicate that among the 3 statistical approaches (XGBoost, Bayesian 258
Networks, Linear Regression), XGBoost had the best predictive accuracy. This can be 259
expected given the expressive and robust nature of XGBoost, which has proven itself 260
across many big data predictive tasks. In this study, we tuned the XGBoost algorithm 261
specifically for longitudinal test data and were able to successfully create accurate 262
forecasted results. Operationally, XGBoost is very easy to use, as it handles data with 263
missing and incomplete values inherently. Unlike other big data methods, XGBoost 264
offers good interpretive properties as well, enumerating exactly how the model arrives 265
at its output. On the contrary, Bayesian networks require additional considerations in 266
handling missing data, and provide less accurate predictions for students with 267
incomplete data. 268

Score Forecasting with Machine Learning Models NCME 2019
There are many possible statistical frameworks that could underly models that 269
forecast future performance, and there are almost certainly many additional 270
refinements we could have made to the Bayesian Networks and linear regression 271
models in this study. Our overarching hypothesis, though, is that methods like XGBoost 272
will be able to provide the most accurate predictions even as the number of explanatory 273
variables expand, as expressive models like XGBoost have shown to be very successful 274
across many big data prediction tasks. The results presented in this study can contribute 275
to a fuller understanding of how modern statistical methods can solve or improve on 276
problems of prediction in large-scale measurement. 277
278
279
Score Forecasting with Machine Learning Models NCME 2019
Reference 280
Benjamin, A.S., Fernandes, H.L., Tomlinson, T., Ramkumar, P., VerSteeg, C., Miller, L., 281
& Kording, K.P. (2018). Modern machine learning far outperforms GLMs at predicting 282
spikes. Frontiers in Computational Neuroscience, 12 (56), 1-13. 283
Chen, T. & Guestrin, C. (2016). XGBoost: A Scalable Tree Boosting System. Paper presented 284
in Proceedings of the 22nd ACM SIGKDD International Conference on Knowledge 285
Discovery and Data Mining, San Francisco. 286
Friedman, N. (1997). Learning Belief Networks in the Presence of Missing Values and Hidden 287
Variables. Paper presented in Proceedings of the 14th International Conference on 288
Machine Learning, San Francisco, pp. 125–133. 289
Pearl, J., & Russell, S. (2000). Bayesian networks. [online]. Retrieved from 290
https://escholarship.org/uc/item/53n4f34m 291
Mislevy R. J., Almond R. G., Yan D., Steinberg L. S. (2000). Bayes nets in educational 292
assessment: Where do the numbers come from? (Tech. Rep. No. 518). Los Angeles, CA: 293
National Center for Research on Evaluation, Standards, and Student Testing. 294
Romero, C. & Ventura, S. (2010). Educational data mining: a review of the state-of-the-295
art. IEEE Transactions on Systems Man and Cybernetics Part C (Applications and 296
Reviews), 40(6):601-618. 297
Scanagatta, M., de Campos, C. P., Corani, G., & Zaffalon, M. (2015). Learning Bayesian 298
networks with thousands of variables. Paper presented at 29th Conference on Neural 299
Information Processing Systems, Montreal, Canada. 300
Scutari, M. (2010). Learning Bayesian Networks with the bnlearn R package. Journal of 301
Statistical Software, 35(3): 1-22. 302

Score Forecasting with Machine Learning Models NCME 2019
Sinharay, S. (2006). Model diagnostics for Bayesian networks. Journal of Educational and 303
Behavioral Statistics, 31, 1-33. 304
Tsamardinos, I., Laura E. B., & Constantin F. A. (2006). The max-min hill-climbing 305
Bayesian network structure learning algorithm. Machine Learning, 65(1): 31-78. 306