Forecasting Resilience of Social Ecological Landscapes Some Tools to Help Us Understand This Thing...
50
Forecasting Resilience of Social Ecological Landscapes Some Tools to Help Us Understand This Thing Called “Sustainability” Lilian Alessa, Andrew Kliskey, Mark Altaweel Resilience and Adaptive Management Group, Water and Environmental Research Center, University of Alaska; Center for Social Dynamics and Complexity, Arizona State University, University of Chicago, Argonne National Lab
-
date post
19-Dec-2015 -
Category
Documents
-
view
213 -
download
0
Transcript of Forecasting Resilience of Social Ecological Landscapes Some Tools to Help Us Understand This Thing...
Forecasting Resilience of Social Ecological Landscapes
Some Tools to Help Us Understand This Thing Called “Sustainability”
Lilian Alessa, Andrew Kliskey, Mark Altaweel
Resilience and Adaptive Management Group, Water and Environmental Research Center, University of
Alaska; Center for Social Dynamics and Complexity, Arizona State University, University of Chicago,
Argonne National Lab
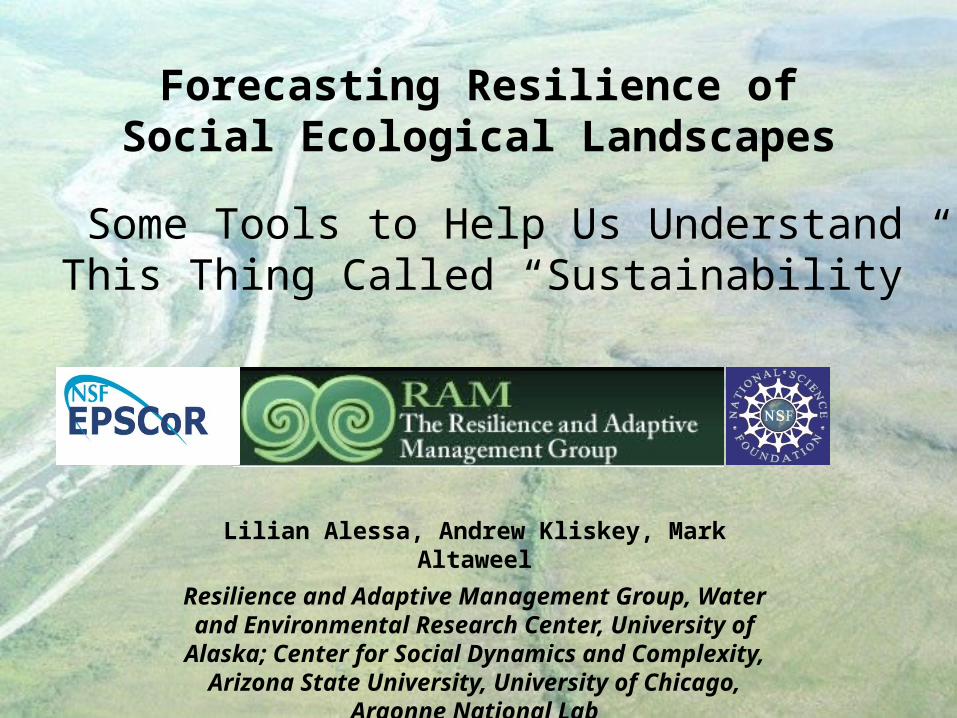
A Few Sustainability Myths
1. Sustainability is about the environment.
2. Consumer choices and grassroots activism works.
3. There is no single critical piece of the sustainability challenge.
Lemonik, 2009. Princeton, New Jersey.
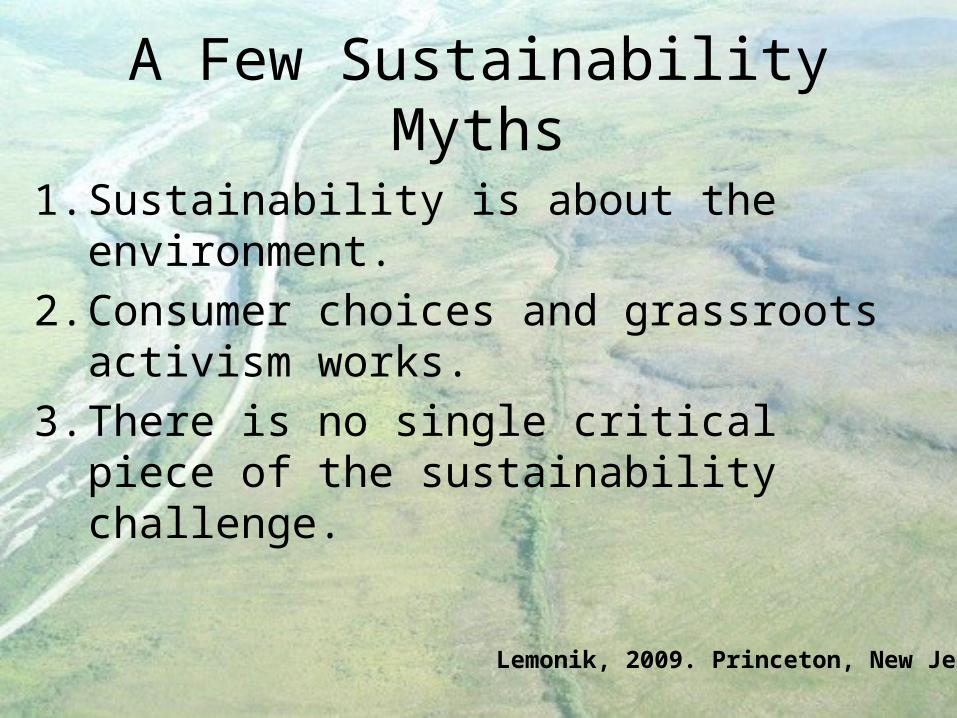
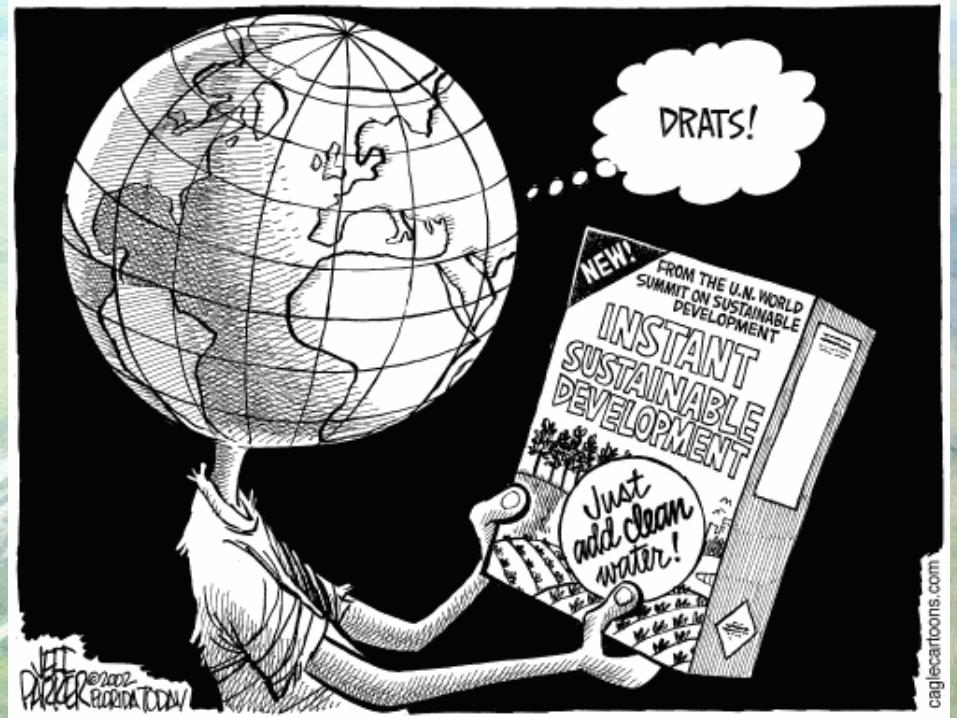
Humour Me…..
• Sustainability is possibly one of the most misunderstood words in common usage.
• Social structure, particularly agent types, are powerful determinants of emergent SES patterns.
• The environment has become synonymous with “green” but we are more of a STS than an SES (something I’d like you to jot down for your Immersion Experience tomorrow).
Water is the Critical Piece
• Entering the “Century of Water”• Most issues depend on water availability,
distribution and/or quality.• Transitions from common pool resource to
trade commodity.• Several “solutions” are not possible
unless water is factored in.
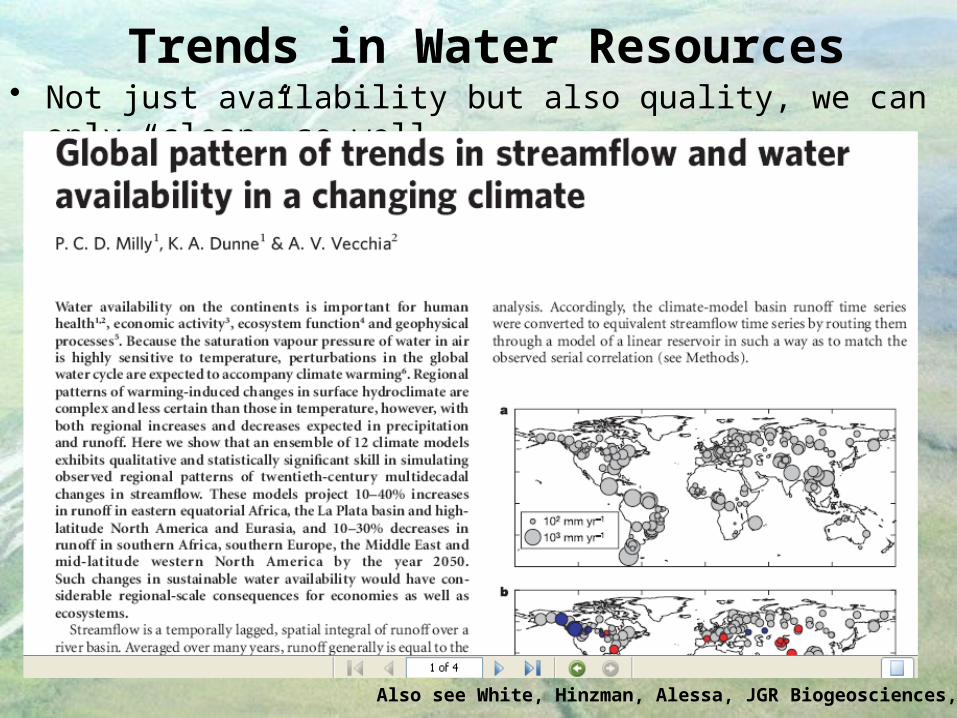
Trends in Water Resources
Also see White, Hinzman, Alessa, JGR Biogeosciences, 2007
• Not just availability but also quality, we can only “clean” so well.
FishR_SP
0
100
200
300
400
500
600
1960 1965 1970 1975 1980 1985 1990 1995
Year
Disc
harg
e (ft
3)
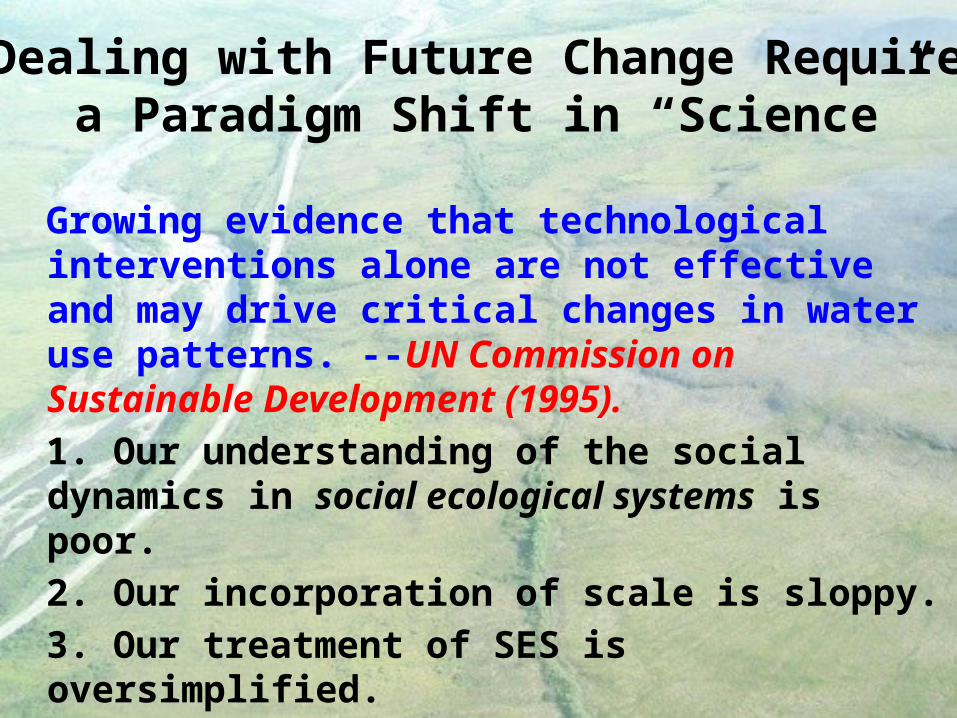
Dealing with Future Change Requires a Paradigm Shift in “Science”
Growing evidence that technological interventions alone are not effective and may drive critical changes in water use patterns. --UN Commission on Sustainable Development (1995).
1. Our understanding of the social dynamics in social ecological systems is poor.
2. Our incorporation of scale is sloppy.
3. Our treatment of SES is oversimplified.
These may represent some of our greatest vulnerabilities to effectively coping with change.
ArcticRIMS_UNH
Scale
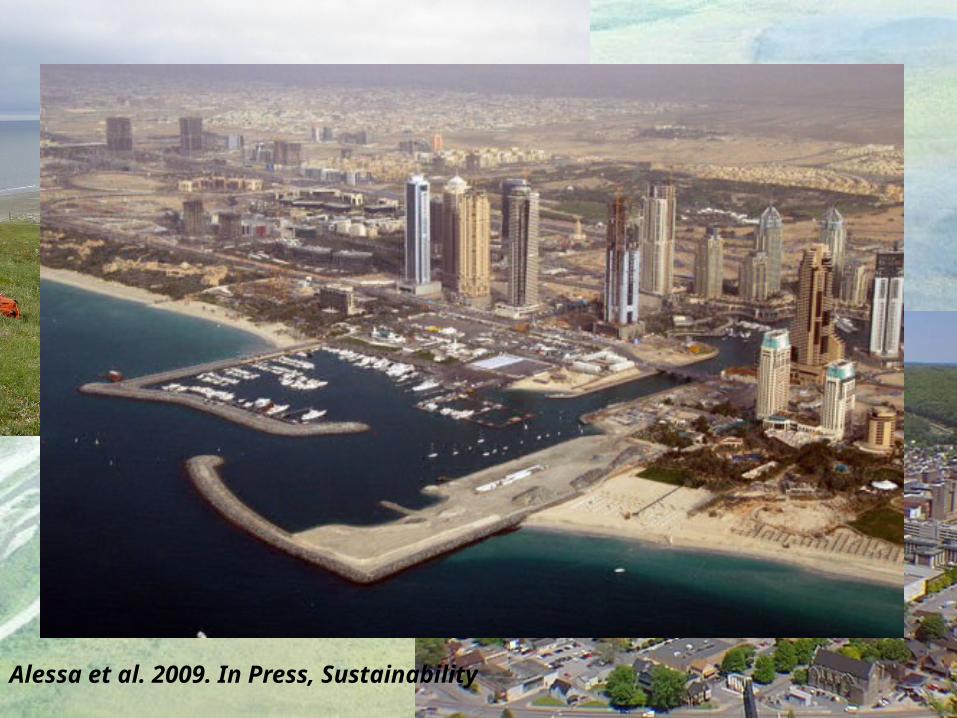
Alessa et al. 2009. In Press, Sustainability
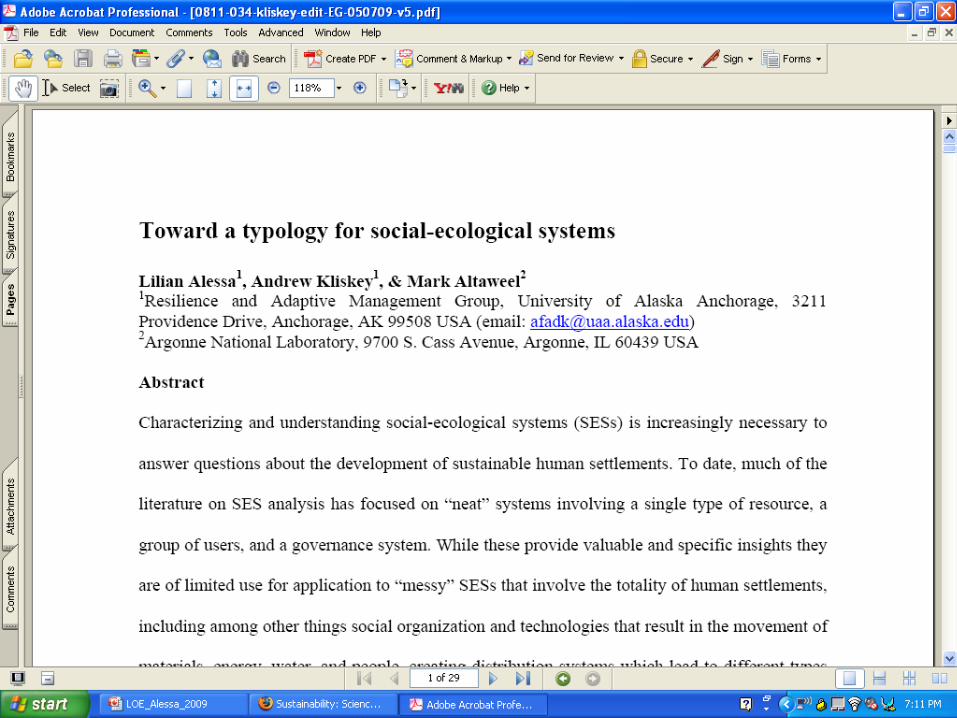
Screen shot of SES types paper
How Could We Possibly Fail?
• Scale• Messy Social Ecological Systems• Underestimation of Social Dynamics • Hubris: we will engineer a solution or
‘sustainability as a hobby’
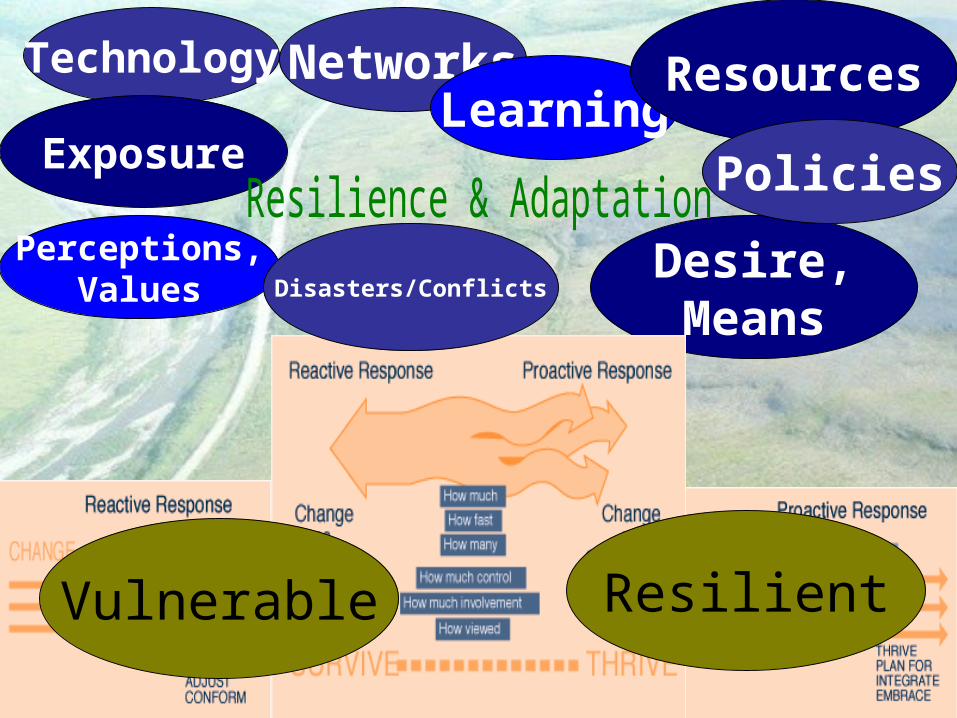
Desire,Means
Technology
Perceptions,Values
Exposure
NetworksLearning
Vulnerable Resilient
Resources
Disasters/Conflicts
Policies
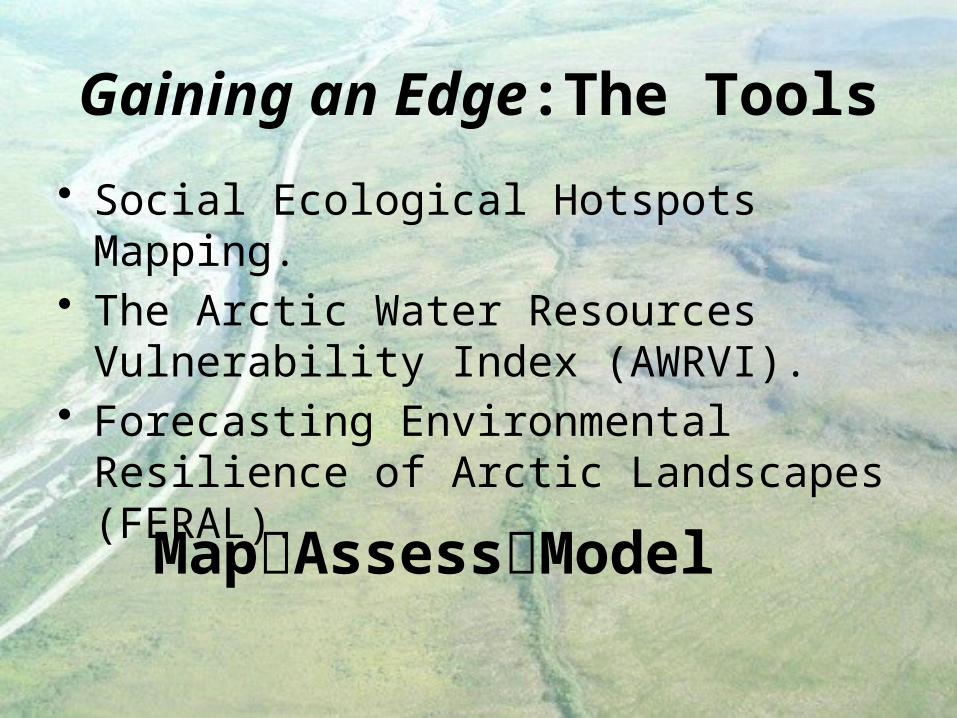
Gaining an Edge:The Tools
• Social Ecological Hotspots Mapping.• The Arctic Water Resources Vulnerability
Index (AWRVI).• Forecasting Environmental Resilience of
Arctic Landscapes (FERAL).
MapAssessModel
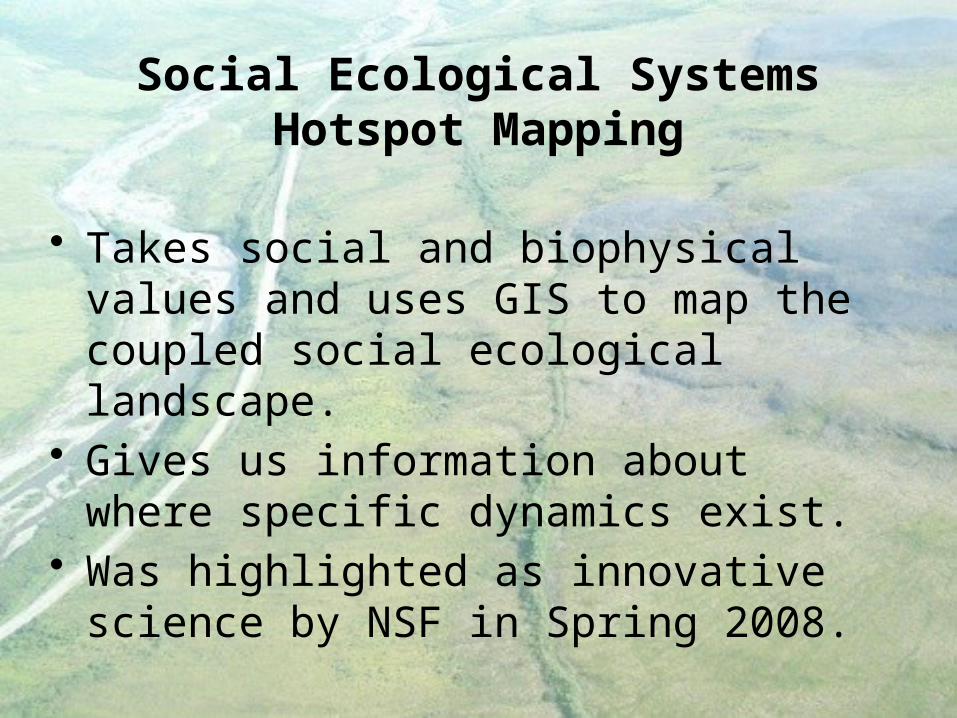
Social Ecological Systems Hotspot Mapping
• Takes social and biophysical values and uses GIS to map the coupled social ecological landscape.
• Gives us information about where specific dynamics exist.
• Was highlighted as innovative science by NSF in Spring 2008.
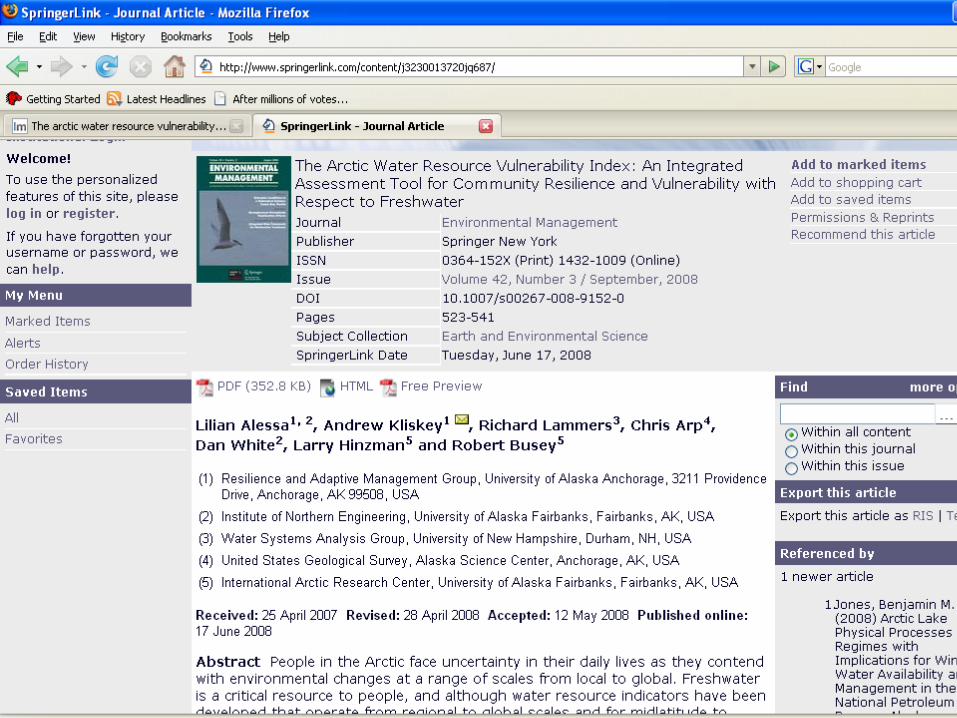
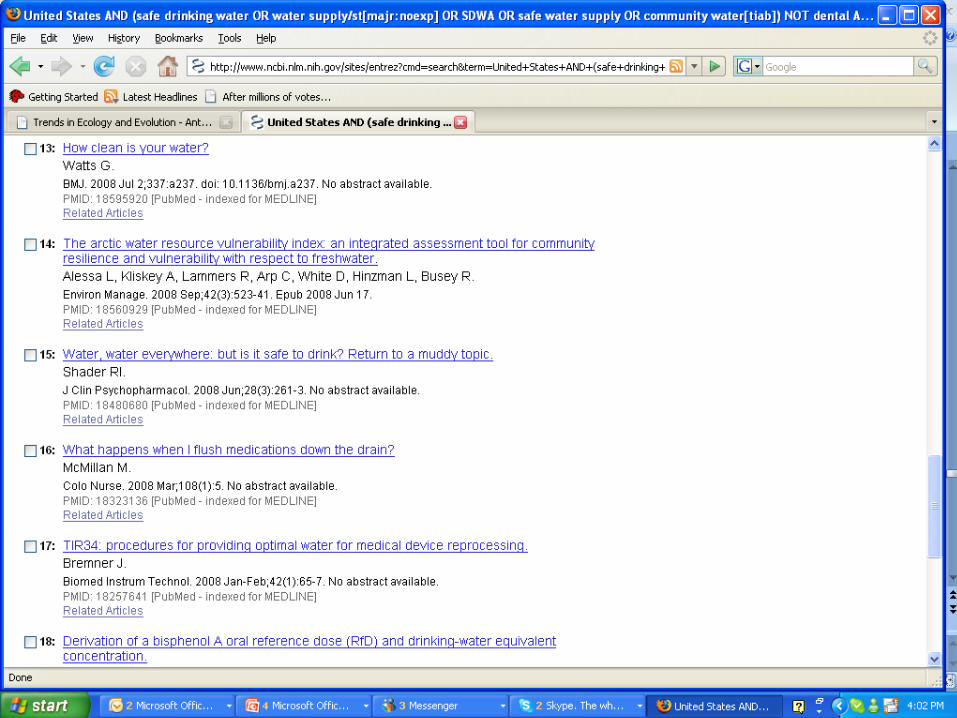
Screen shot of paper
Screen shot of paper
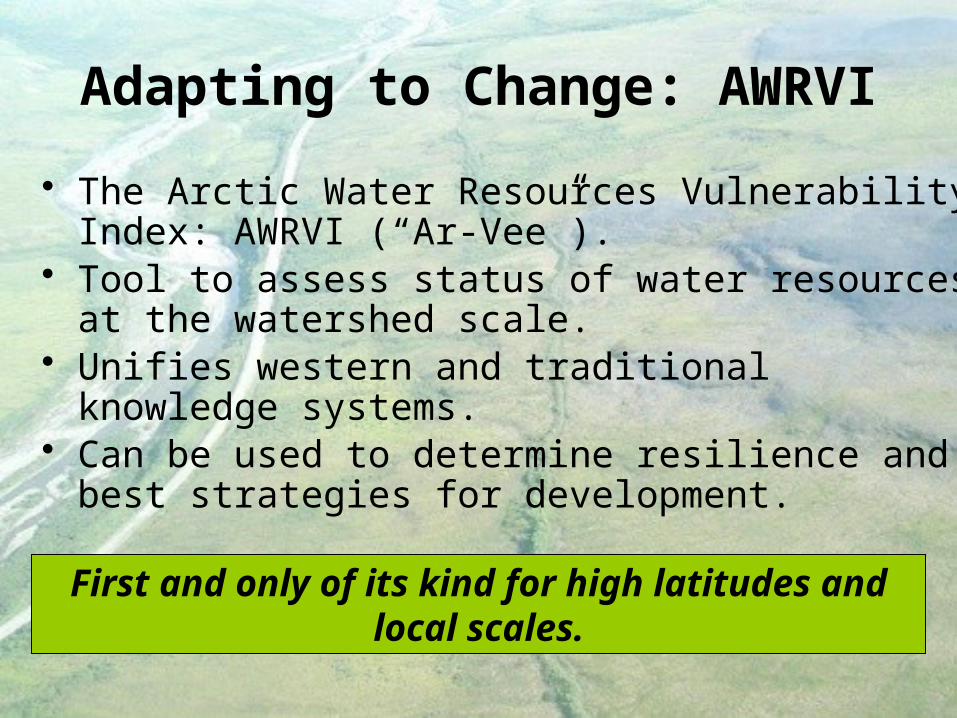
Adapting to Change: AWRVI
• The Arctic Water Resources Vulnerability Index: AWRVI (“Ar-Vee”).
• Tool to assess status of water resources at the watershed scale.
• Unifies western and traditional knowledge systems.• Can be used to determine resilience and best
strategies for development.
First and only of its kind for high latitudes and local scales.
Environmental Vulnerability Indices
• EVI: United Nations Environment Programme (2001).
• UN Commission on Sustainable Development (1995).
• Global Commission on Fresh Water Resources (2004).
• Water recognized as single-most important variable in rapid change.
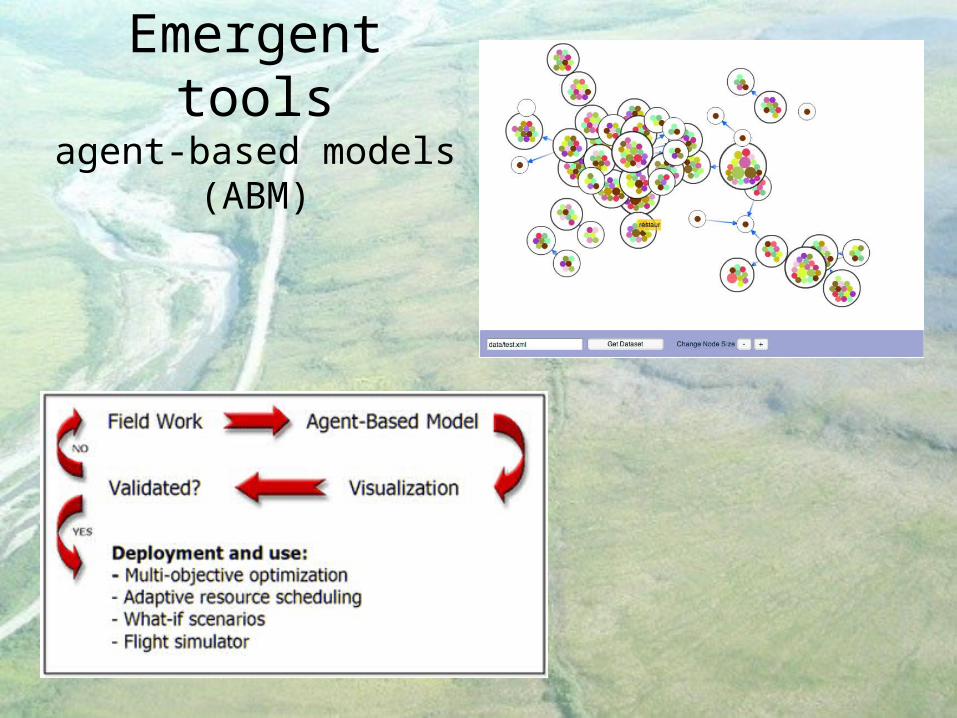
Emergent toolsagent-based models
(ABM)
Agent Based Models
• Specify the rules of behavior of individuals (agents) as well as rules of interaction
• Simulate many agents using a computer model
• Explore the consequences of the agent-level rules on the population as a whole
• “Simple” models to produce complex behaviors
“How could drops of water know themselves to be a river? Yet the river flows on”--Antoine du Sainte-Exupery
Agents and Systems
• agents have connections to each other, and form a system and operate in an environment with feedbacks
• agents behave autonomously thus they each have their own parameters (data) and behaviors
• systems change once the agents affect the threshold in a significant way
Agent Based Models
Are not• An attempt to perfectly reproduce reality (usually)
Are• Are a tool to gain intuition about the system of interest
without needing to know all of the details• A tool to run “experiments” which cannot be performed
in real life• A tool to generate and test hypotheses about what is
occurring• A tool to refine data collection foci
Big Questions
• What drives the human hydrological system?
• How do societies ‘overshoot’ their resources (both social and physical)?
• How can we learn to avoid this fate? (Should we? If so, why?)
• Move beyond rhetoric.
Source: Alessa , Kliskey, and Altaweel. 2009, In Press, Sustainability

Desire,Means
Technology
Perceptions,Values
Exposure
NetworksLearning
Vulnerable Resilient
Resources
Disasters/Conflicts
Policies
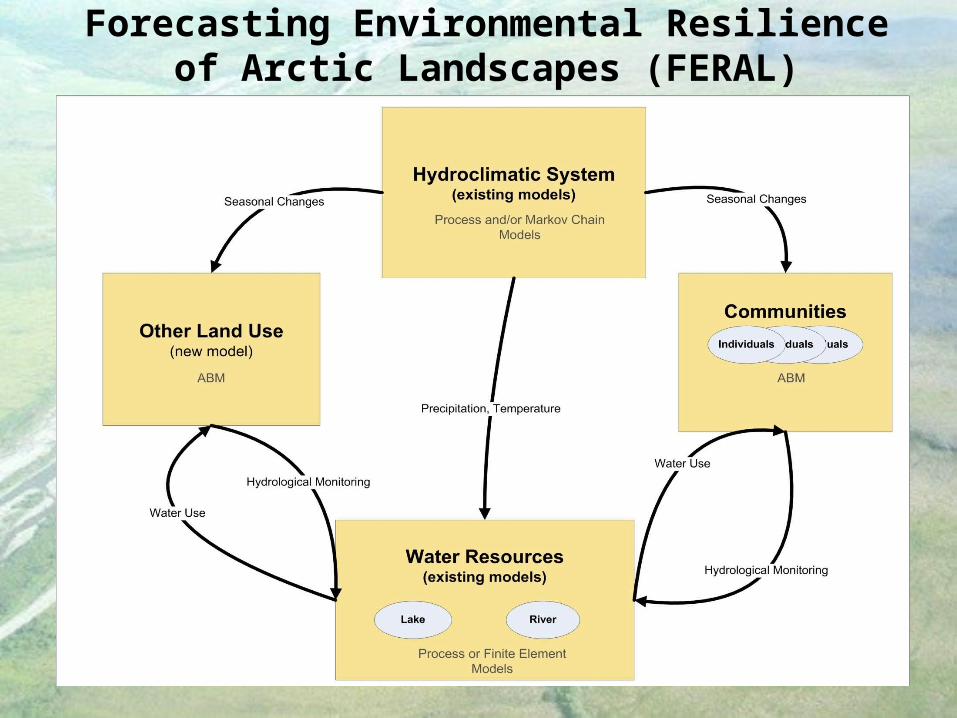
Forecasting Environmental Resilience of Arctic Landscapes (FERAL)
Developing “Real” Rules
• Too often, ABMs rely on ‘artificial’ rules (e.g., games).
• Or ….”what ifs”.• It is critical that rules be derived from the
messy, real world.• Humans are not logical but they are
predictable.
"Man is a complex being; he makes the deserts bloom and lakes die."— Gil Stern
Developing Real Rules
• There are three rules of thumb to successfully developing rule sets for ABM.1. Observe your system to the point of intimacy.
2. Establish colleagues in it who will assist you with field work and data collection.
3. Include modelers at the outset, not once you think it would be “nice” to model.
Screen shot of JASSS 2 paper
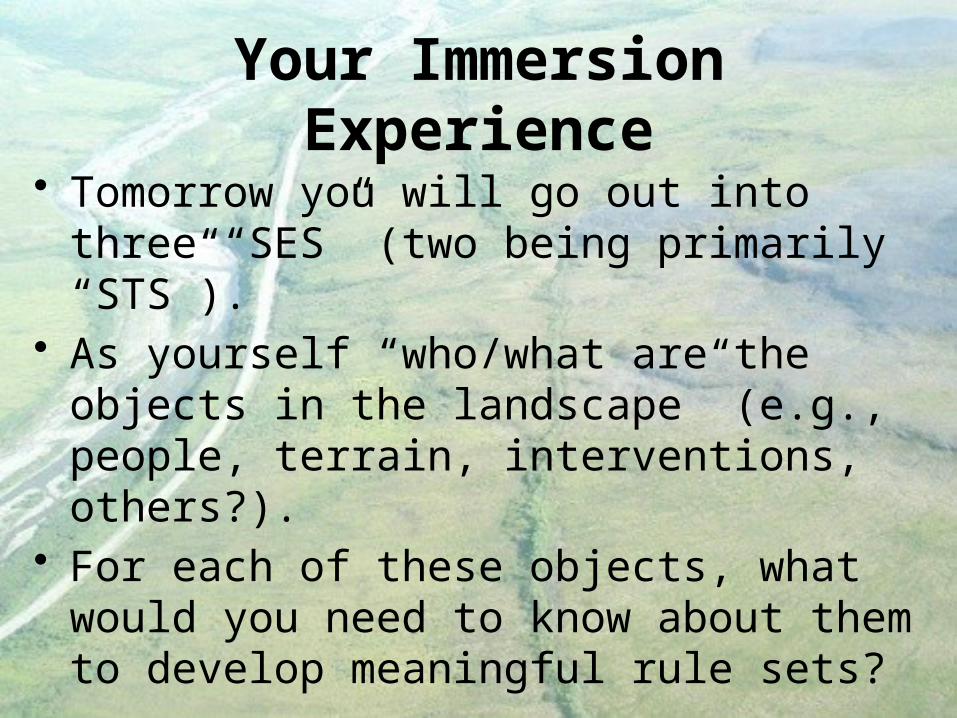
Your Immersion Experience
• Tomorrow you will go out into three “SES” (two being primarily “STS”).
• As yourself “who/what are the objects in the landscape” (e.g., people, terrain, interventions, others?).
• For each of these objects, what would you need to know about them to develop meaningful rule sets?
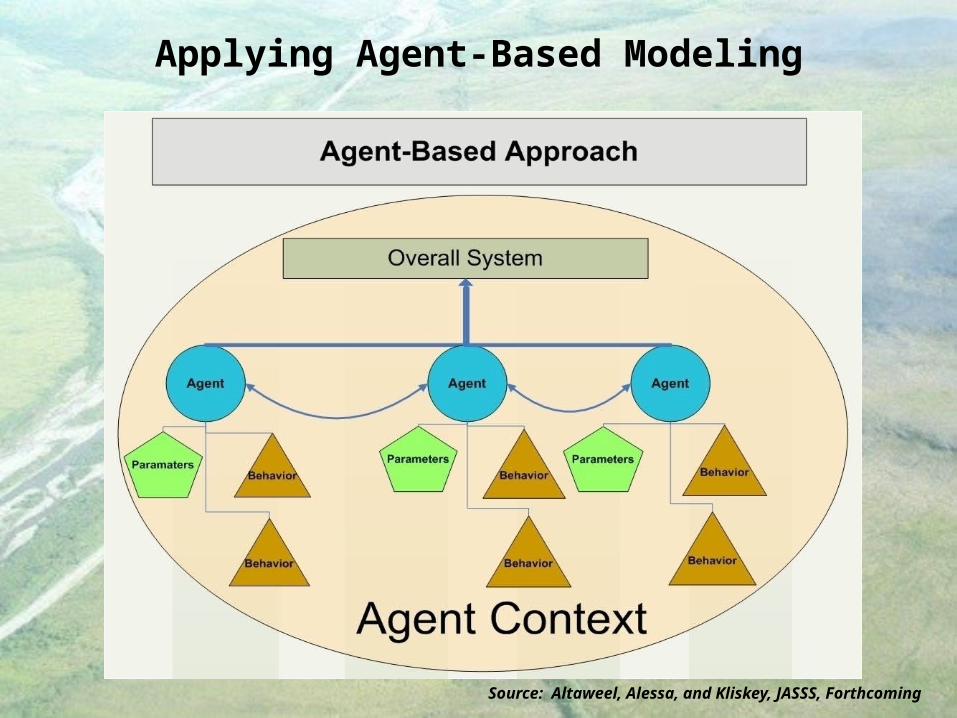
Applying Agent-Based Modeling
Source: Altaweel, Alessa, and Kliskey, JASSS, Forthcoming
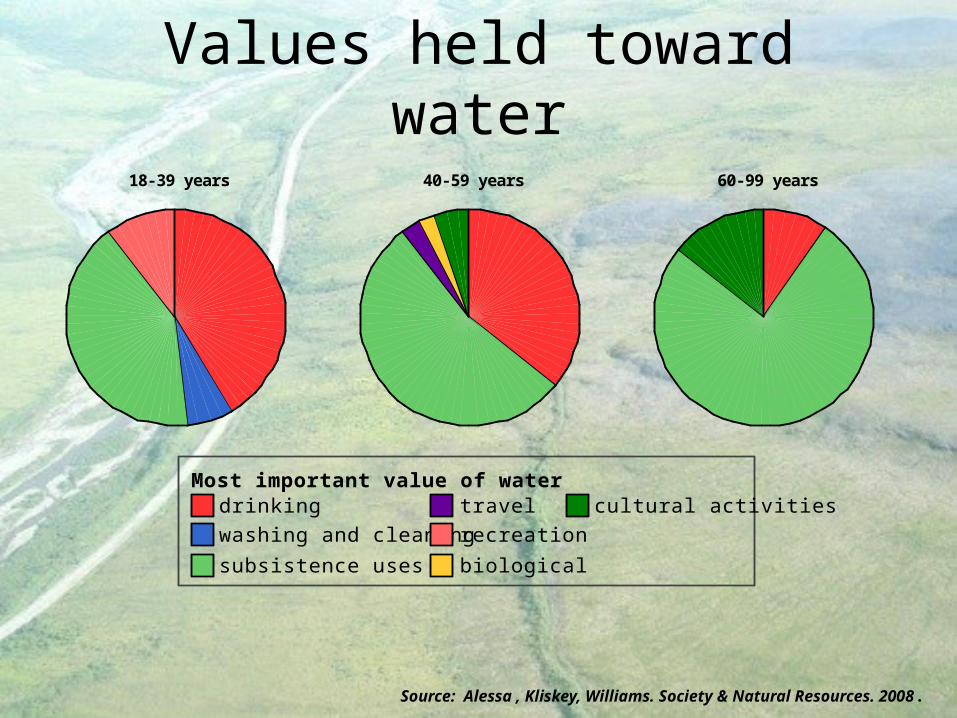
Values held toward water
drinking
washing and cleaning
subsistence uses
travel
recreation
biological
cultural activitiesMost important value of water
18-39 years 40-59 years 60-99 years
Source: Alessa , Kliskey, Williams. Society & Natural Resources. 2008.
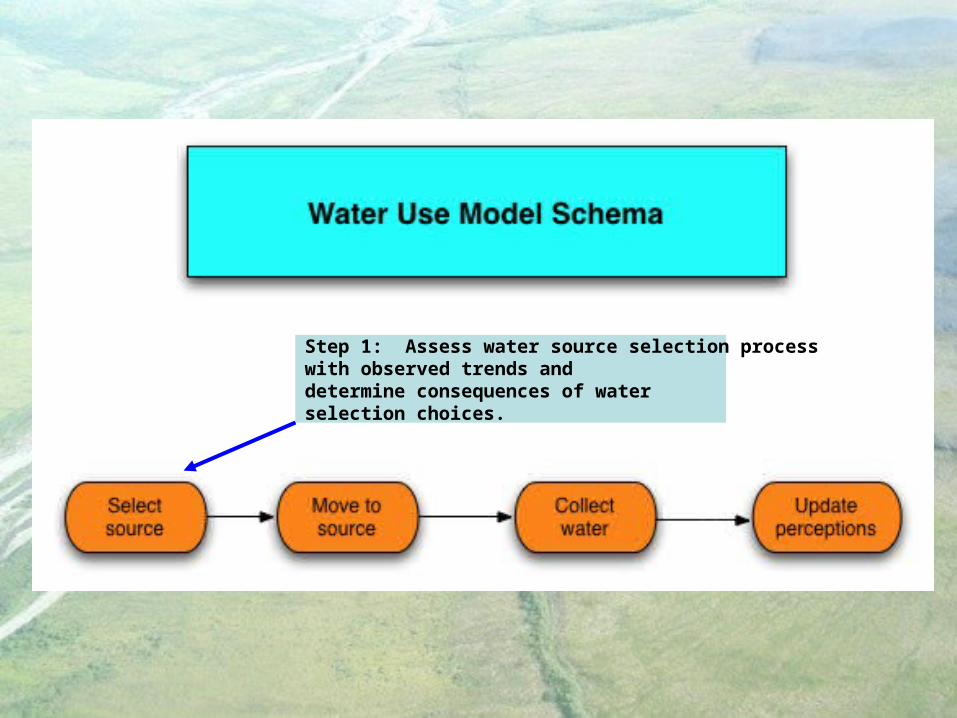
Current Social ABM in
FERAL
Step 1: Assess water source selection process with observed trends and determine consequences of water selection choices.
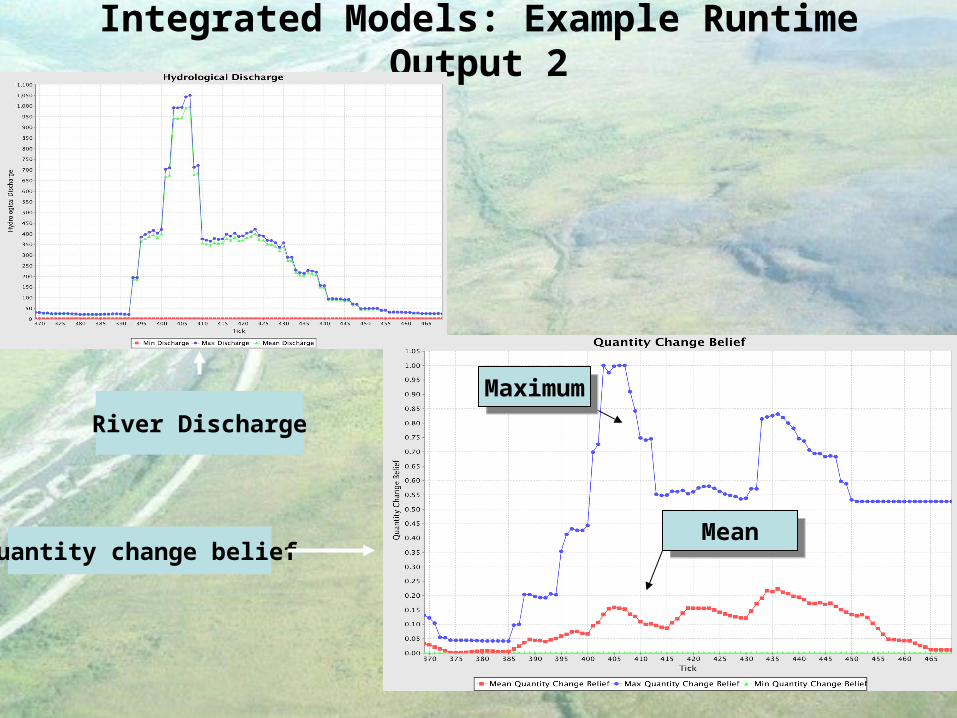
Integrated Models: Example Runtime Output 2
River Discharge
Quantity change belief
MaximumMaximum
MeanMean
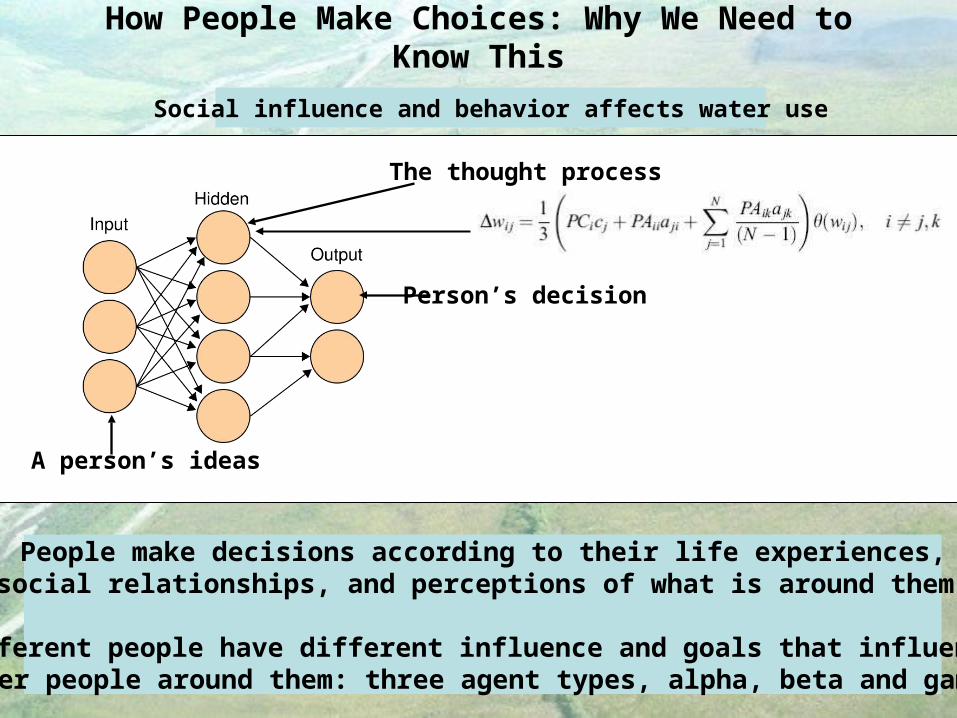
How People Make Choices: Why We Need to Know This
People make decisions according to their life experiences,social relationships, and perceptions of what is around them.
Different people have different influence and goals that influencesother people around them: three agent types, alpha, beta and gamma.
A person’s ideas
Person’s decision
The thought process
Social influence and behavior affects water use
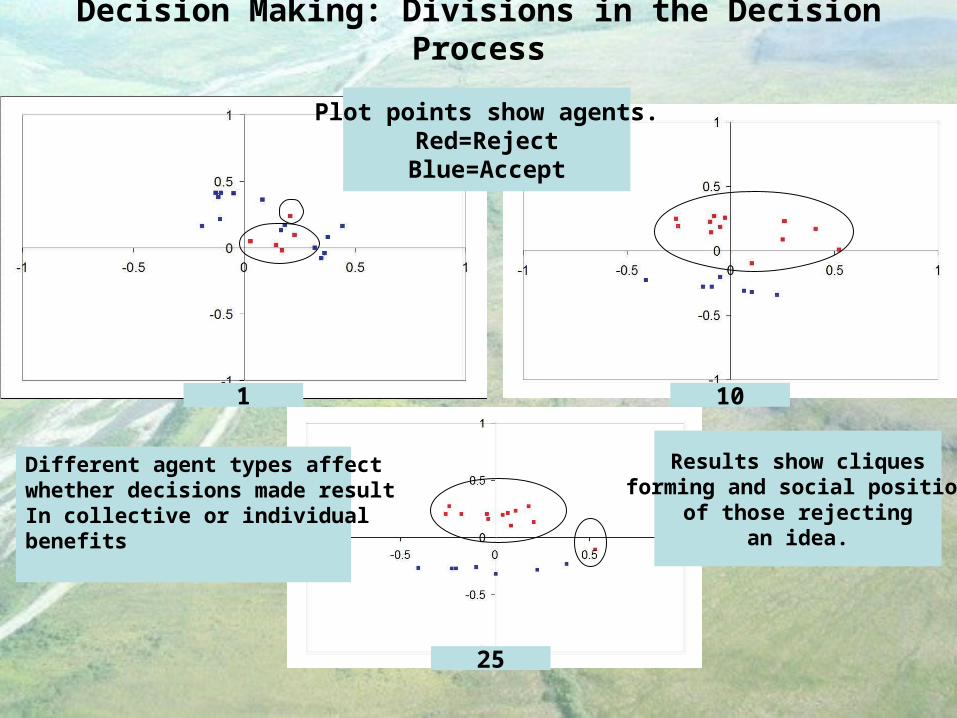
Decision Making: Divisions in the Decision Process
1
25
10
Plot points show agents.Red=Reject
Blue=Accept
Different agent types affectwhether decisions made resultIn collective or individualbenefits
Results show cliquesforming and social position
of those rejectingan idea.
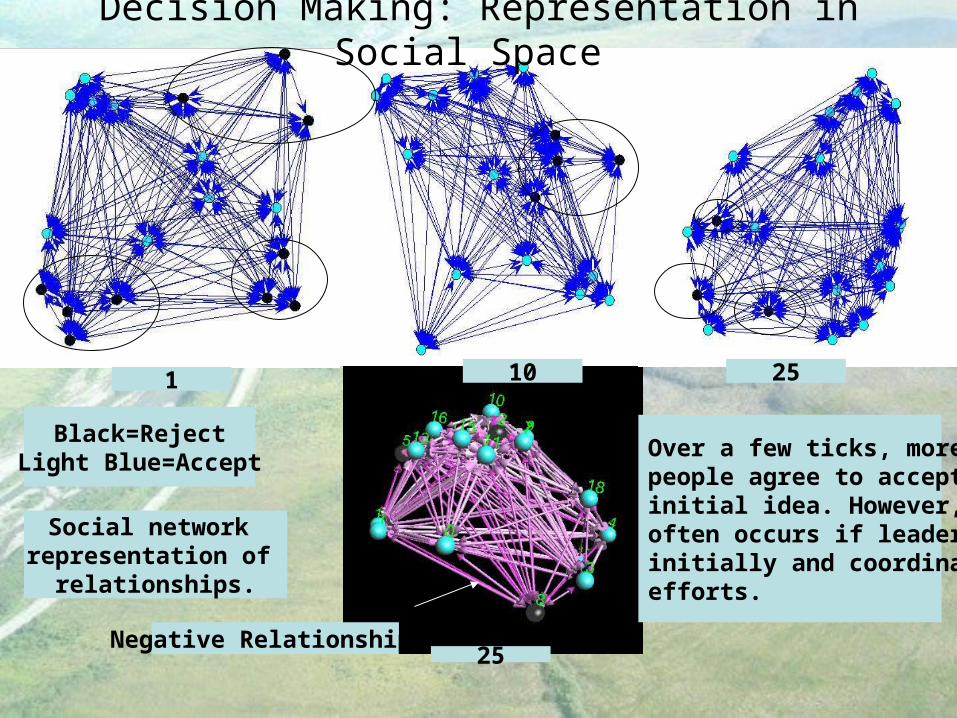
Decision Making: Representation in Social Space
251 10
Social network representation of
relationships.
Over a few ticks, more people agree to accept the initial idea. However, this often occurs if leaders agree initially and coordinate theirefforts.
Black=RejectLight Blue=Accept
25Negative Relationships
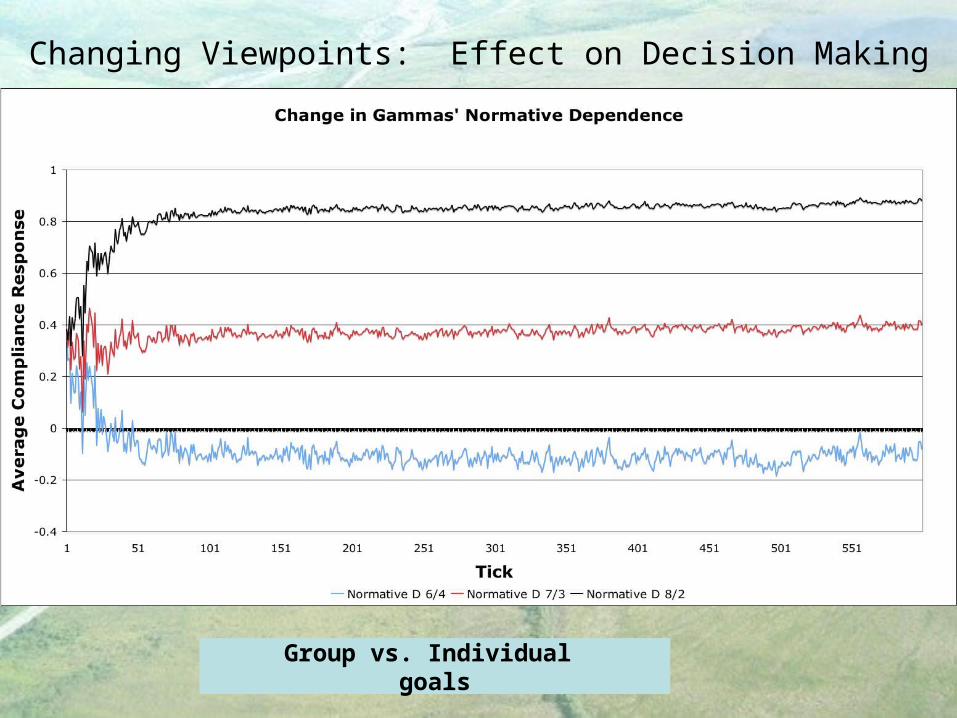
Changing Viewpoints: Effect on Decision Making
Group vs. Individual goals
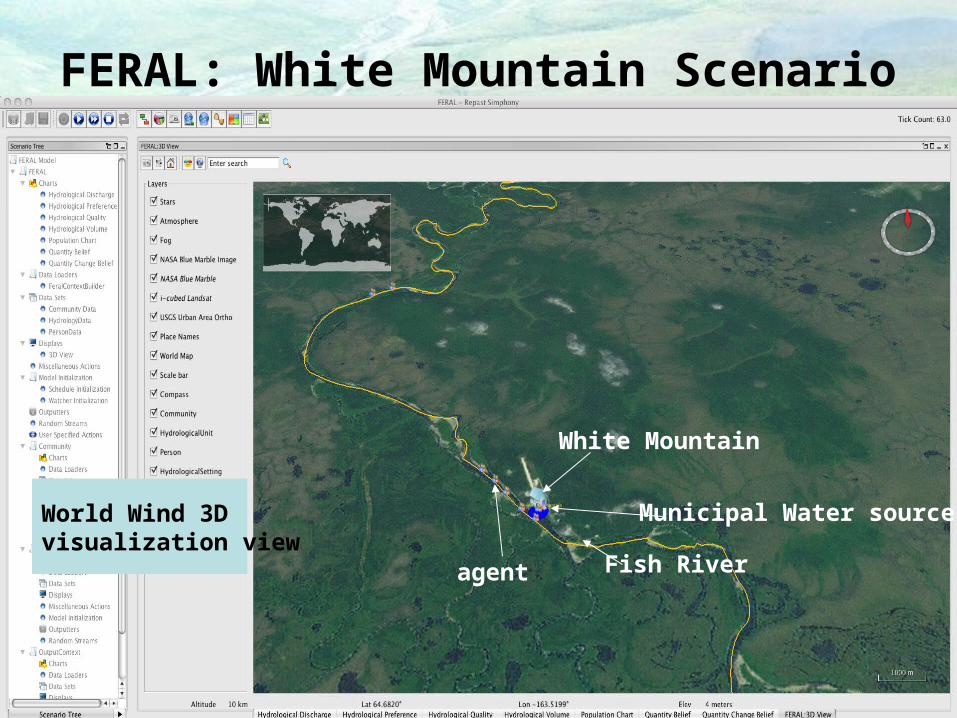
FERAL: White Mountain Scenario
agent
White Mountain
Fish River
Municipal Water sourceWorld Wind 3D visualization view
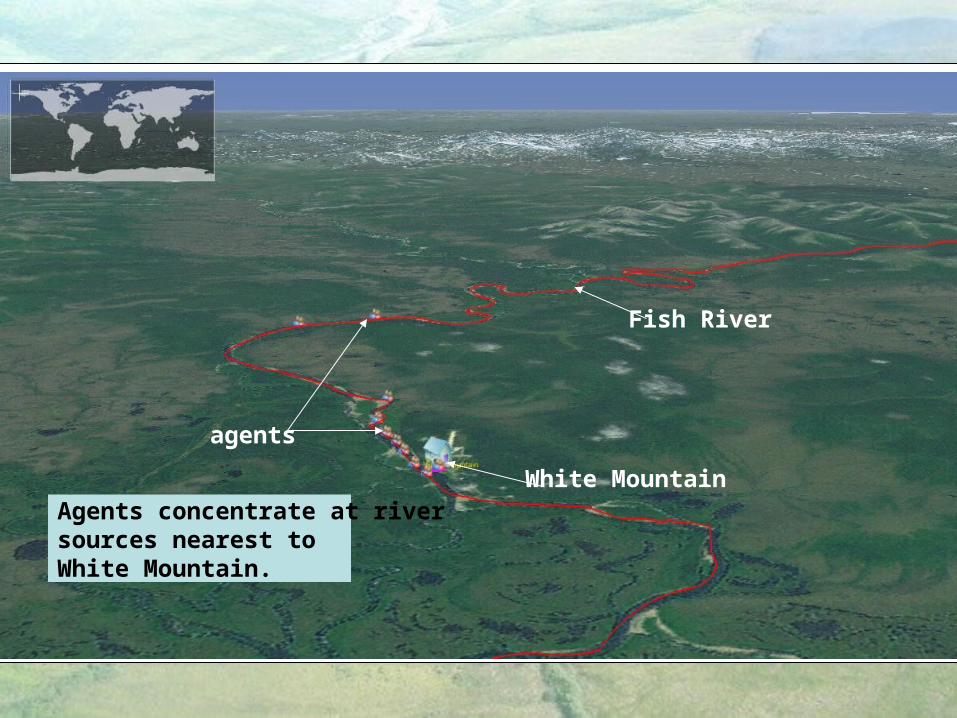
10-Year Scenario: Travel To River
agents
White Mountain
Fish River
Agents concentrate at river sources nearest to White Mountain.
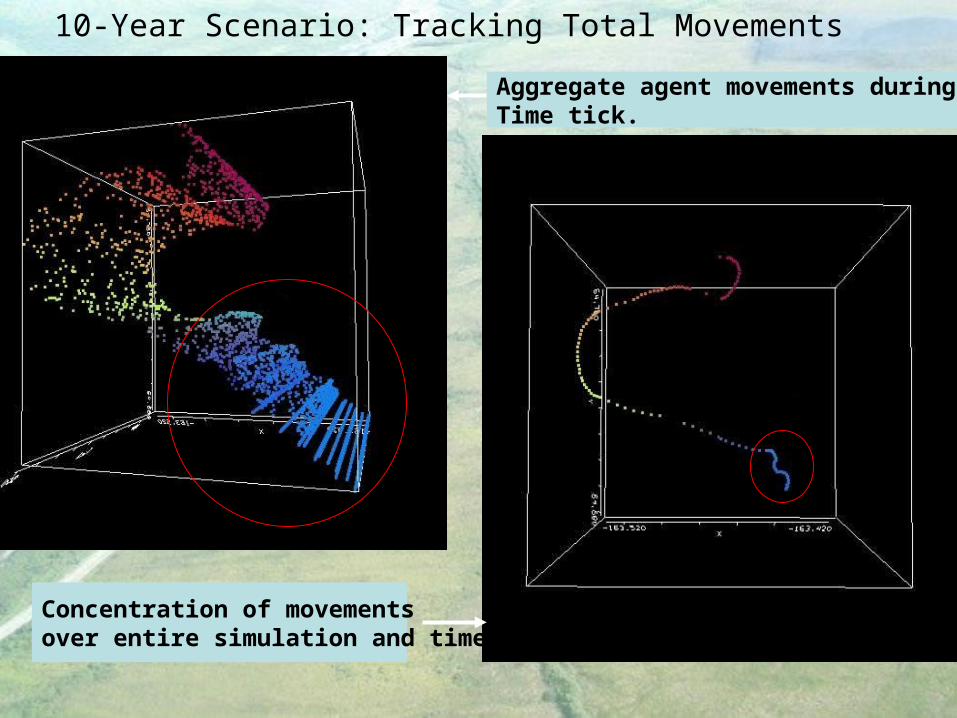
10-Year Scenario: Tracking Total Movements
Aggregate agent movements during each Time tick.
Concentration of movements over entire simulation and time.
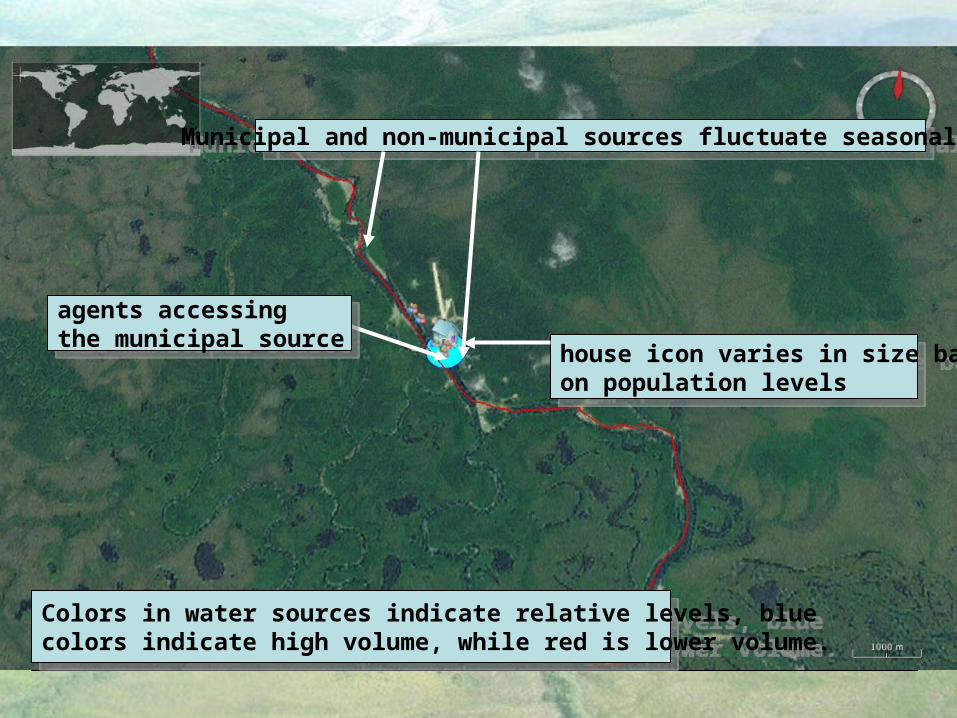
Municipal and non-municipal sources fluctuate seasonally.Municipal and non-municipal sources fluctuate seasonally.
Colors in water sources indicate relative levels, bluecolors indicate high volume, while red is lower volume.
Colors in water sources indicate relative levels, bluecolors indicate high volume, while red is lower volume.
agents accessing the municipal source
agents accessing the municipal source
house icon varies in size basedon population levels
house icon varies in size basedon population levels
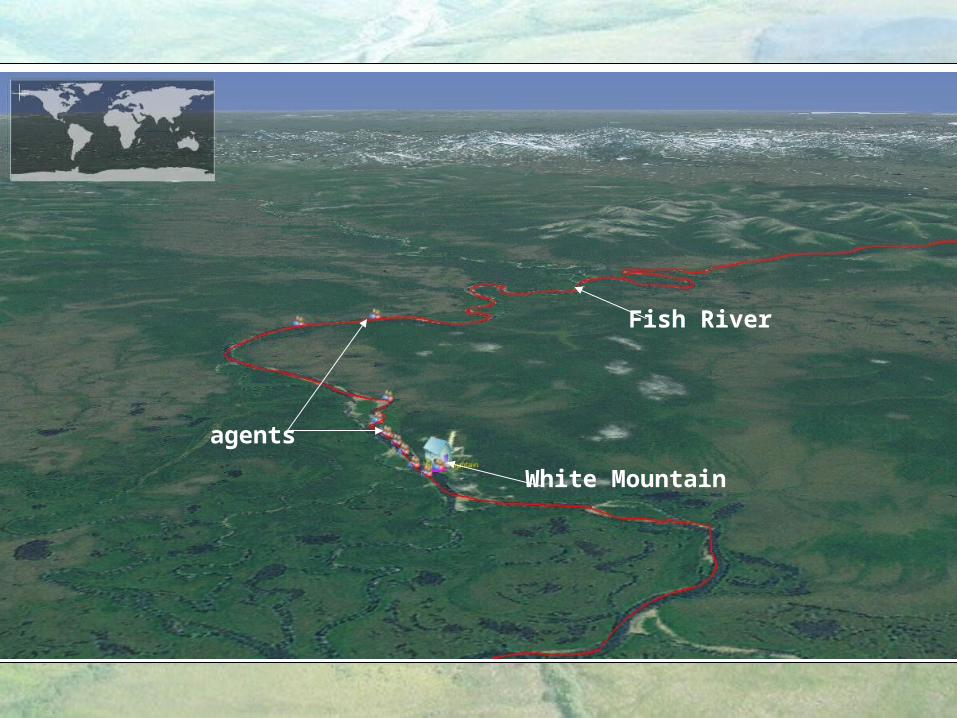
10-Year Scenario: Travel To River
agents
White Mountain
Fish River
0
2000
4000
6000
8000
10000
12000
14000
16000
18000
20000
1900 1910 1920 1930 1940 1950 1960 1970 1980 1990 2000
Pop
ula
tion
0
20
40
60
80
100
120
140
160
180
200
Wat
er U
se (
litre
s p
er c
apit
a p
er d
ay)
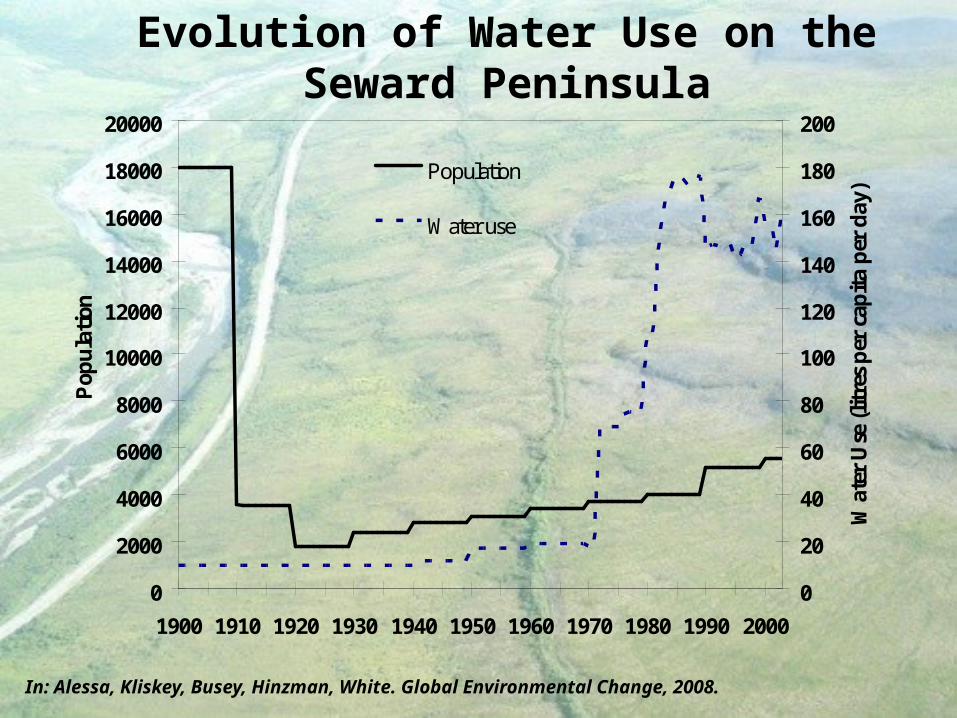
Population
Water use
In: Alessa, Kliskey, Busey, Hinzman, White. Global Environmental Change, 2008.
Evolution of Water Use on the Seward Peninsula
Take Home Messages
• Many of the challenges in sustainability are not ‘fixable’ using technologies or good will.
• Agents drive the system from the bottom up and some dynamics simply aren’t pretty.
• A powerful approach to understanding consequences is to use agent based models.
• ABMs allow the unpredictable outcomes of simple choices and changes in patterns of use to be visualized in virtual worlds.
Acknowledgements
• The RAM Group at UAA• My colleagues at the International Arctic Research Center,
and the Institute for Northern Engineering, UAF • My colleagues at the Center for Social Dynamics and
Complexity, Arizona State University• Fabrice Renaud, Head, Environmental Assessment and
Resource Vulnerability Section, United Nations University• Volker Grimm, Director, Center for Environmental Research,
Leipzig-Halle, Germany. • The National Science Foundation.