Forecasting MKA/13 1 Meaning Elements Steps Types of forecasting.
30
Forecasting MKA/13 1 Meaning Elements Steps Types of forecasting
-
Upload
linette-fletcher -
Category
Documents
-
view
237 -
download
0
Transcript of Forecasting MKA/13 1 Meaning Elements Steps Types of forecasting.

Forecasting
MKA/13 1
Meaning
Elements
Steps
Types of forecasting
Forecasting
MKA/132
FORECAST:A statement about the future
Used to help managersPlan the systemPlan the use of the system
Common Features
MKA/133
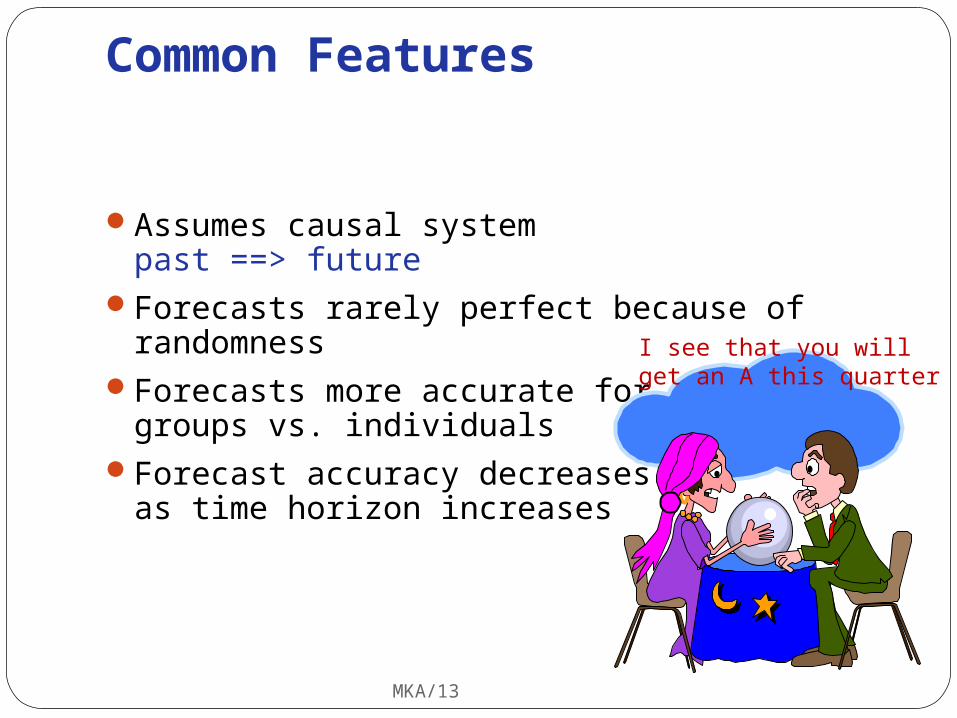
Assumes causal systempast ==> future
Forecasts rarely perfect because of randomnessForecasts more accurate for
groups vs. individuals Forecast accuracy decreases
as time horizon increases
I see that you willget an A this quarter

Elements of a Good Forecast
MKA/134
Timely
AccurateReliable
Mea
ningfu
l
Written
Easy
to u
se

Steps in the Forecasting Process
MKA/135
Step 1 Determine purpose of forecast
Step 2 Establish a time horizon
Step 3 Select a forecasting technique
Step 4 Gather and analyze data
Step 5 Prepare the forecast
Step 6 Monitor the forecast
“The forecast”

Types of forecast
MKA/136
i. Qualitative
ii. Time series analysis
iii. Causal relationship
iv. Simulation
Qualitative
MKA/137
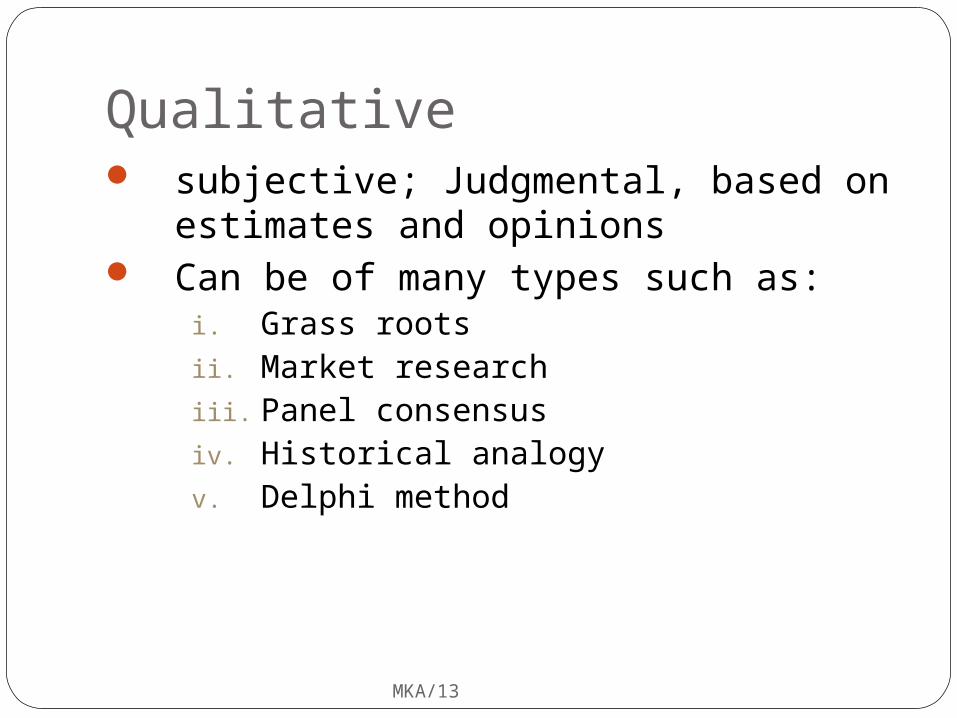
subjective; Judgmental, based on estimates and opinions
Can be of many types such as:i. Grass rootsii. Market researchiii. Panel consensusiv. Historical analogyv. Delphi method

Grass roots
MKA/138
Forecast by adding successively from the bottom
Derives a forecast by compiling input from those at the end of hierarchy who deal with what is being forecast.
As for example: An overall sales forecast may be derived by combining inputs from each sales person who is closest to his territory.

Market research
MKA/139
Firms often hire outside companies that specialize in market research to conduct this type of forecast.
Typically used to forecast long range and new product sales.

Panel consensus
MKA/1310
Free open exchange at meeting.
Idea is that two heads are better than one
Group discussion will produce better forecast than any one individual
Participants may be executive, salespeople and customers
Historical analogy
MKA/1311
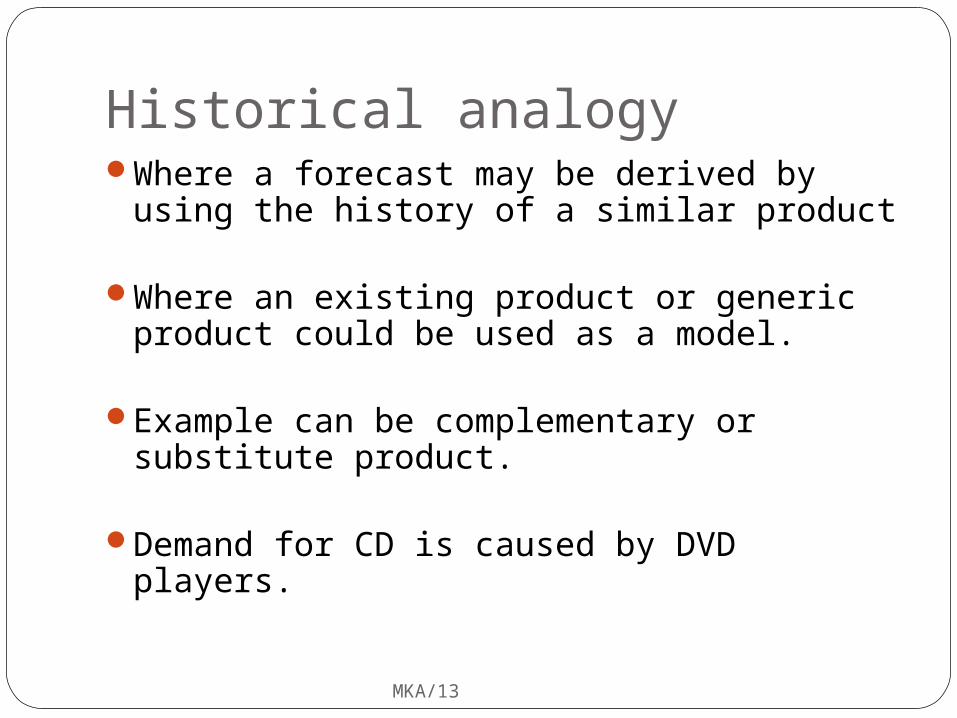
Where a forecast may be derived by using the history of a similar product
Where an existing product or generic product could be used as a model.
Example can be complementary or substitute product.
Demand for CD is caused by DVD players.

Delphi method
MKA/1312
Group of experts responds to questionnaires
A moderator compiles results and formulates a new questionnaire and submitted again to the respondents
As a results initiate learning process and no influence of group pressure.
Time series analysis
MKA/1313
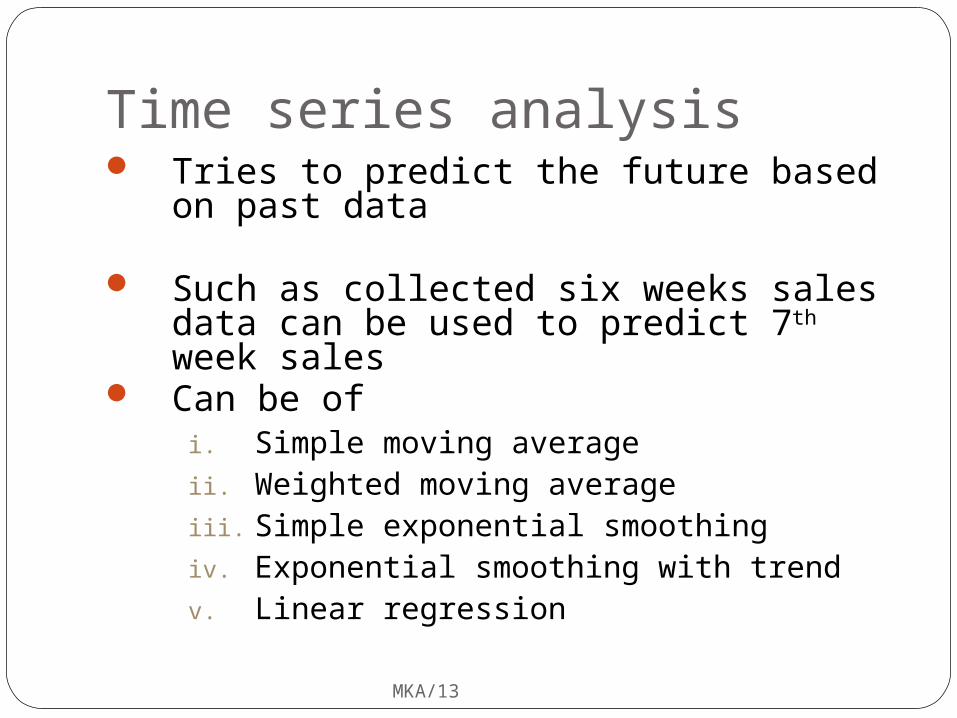
Tries to predict the future based on past data
Such as collected six weeks sales data can be used to predict 7th week sales
Can be of i. Simple moving averageii. Weighted moving averageiii. Simple exponential smoothingiv. Exponential smoothing with trendv. Linear regression
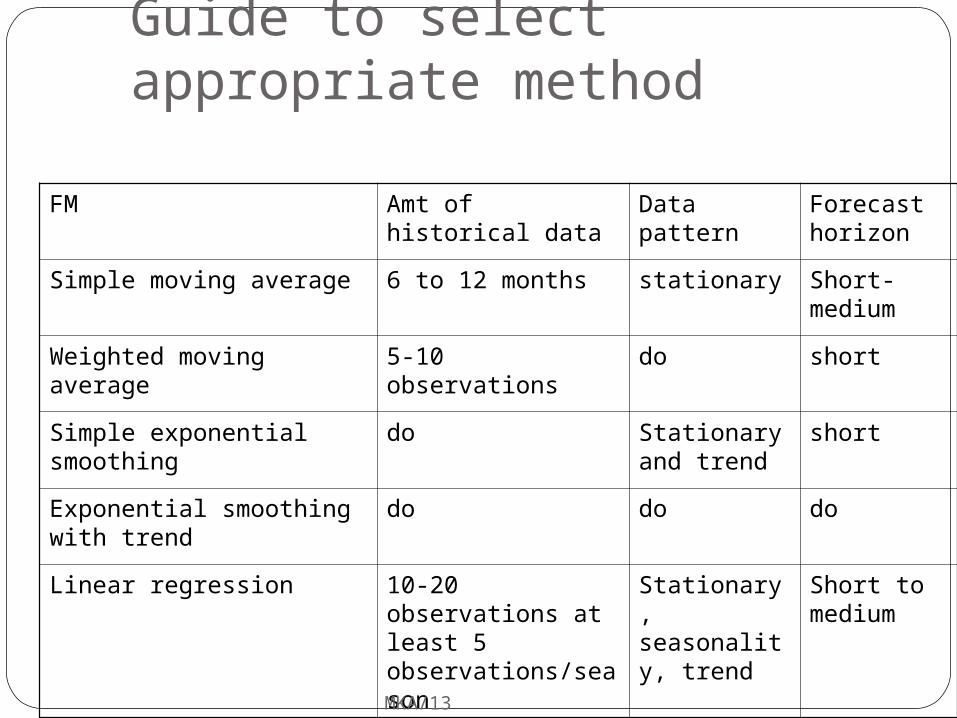
Guide to select appropriate method
FM Amt of historical data
Data pattern
Forecast horizon
Simple moving average 6 to 12 months stationary Short-medium
Weighted moving average 5-10 observations do short
Simple exponential smoothing
do Stationary and trend
short
Exponential smoothing with trend
do do do
Linear regression 10-20 observations at least 5 observations/season
Stationary, seasonality, trend
Short to medium
MKA/1314

Which model you choose?
MKA/1315
Depends on
Time horizon to forecast
Data availability
Accuracy required
Size of forecasting budget
Availability of qualified personnel

Simple moving average
MKA/1316
A time period containing a number of data points is averaged by dividing the sum of the points values by the number of points
When demand fro product is neither growing nor declining and if it does not have seasonal characteristics, this model can be used.
Ft =At-1 +At-2+At-3……+At-n /nFt = forecast for the coming periodAt-1 = Actual occurrence for the past periodAt-2 =Actual occurrence two periods ago
n= no of periods to be averaged

Weighted moving average
MKA/1317
Moving average allows any weight to be placed on each element
The sum of all weights equal 1Ft =w1At-1 + w2 At-2+ w3 At-3……+ w n At-n
F5=.40*95+.3*105+.20*90+.1*100=97.5
M1 m2 m3 m4
100 90 105 95 ?

Exponential smoothing
MKA/1319
Only three pieces of data are used such as The most recent forecast The actual demand that occurred for that forecast period Smoothing constant α
F t =Ft-1 + α (At-1 –Ft-1)
F t = the exponential smooth forecast for period t Ft-1=Exponentially smoothed forecast made for the prior
period. At-1 = The actual demand in the prior period
α = the desired response rate or smoothing constant

Why exponential smoothing
MKA/1320
Because of four reasons
Are surprisingly accurateFormulating the model is relatively easyLittle computation is requiredThe user can understand how the model
works.
Linear regression analysis
MKA/1324
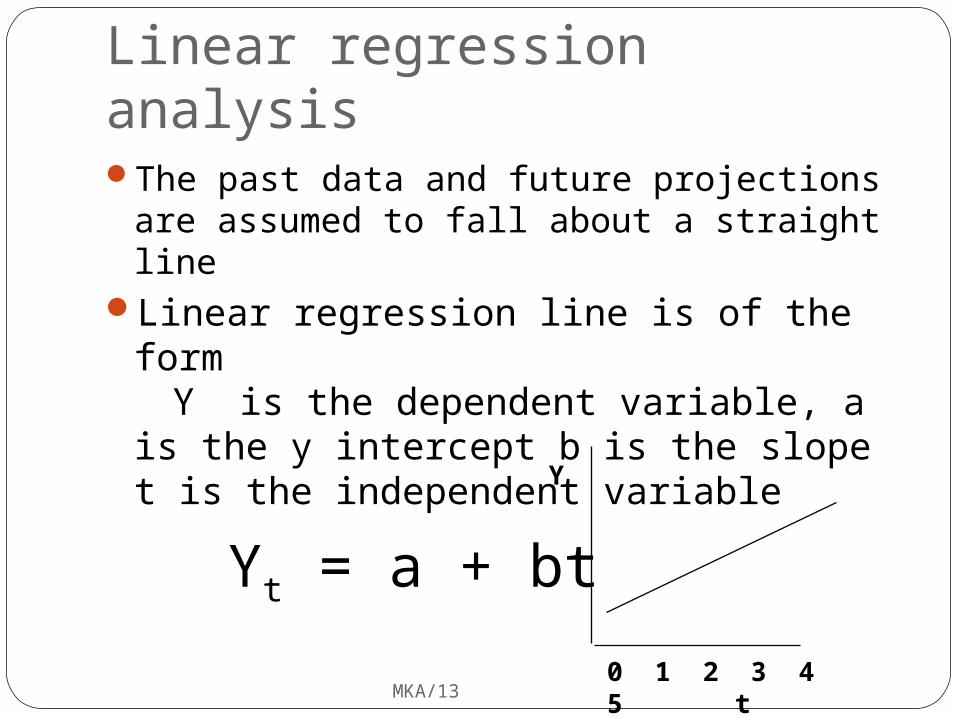
The past data and future projections are assumed to fall about a straight line
Linear regression line is of the form Y is the dependent variable, a is the y
intercept b is the slope t is the independent variable
Yt = a + bt
0 1 2 3 4 5 t
Y

Calculating a and b
MKA/1325
B(Slope) = n (ty) - t y
n t2 - ( t)2
A Intercept = y - b t
n

Linear Trend Equation Example
MKA/1326
t yW e e k t 2 S a l e s t y
1 1 1 5 0 1 5 02 4 1 5 7 3 1 43 9 1 6 2 4 8 64 1 6 1 6 6 6 6 45 2 5 1 7 7 8 8 5
t = 1 5 t 2 = 5 5 y = 8 1 2 t y = 2 4 9 9( t ) 2 = 2 2 5

Linear Trend Calculation
MKA/1327
y = 143.5 + 6.3t
a = 812 - 6.3(15)
5 =
b = 5 (2499) - 15(812)
5(55) - 225 =
12495-12180
275-225 = 6.3
143.5
Example
MKA/1328
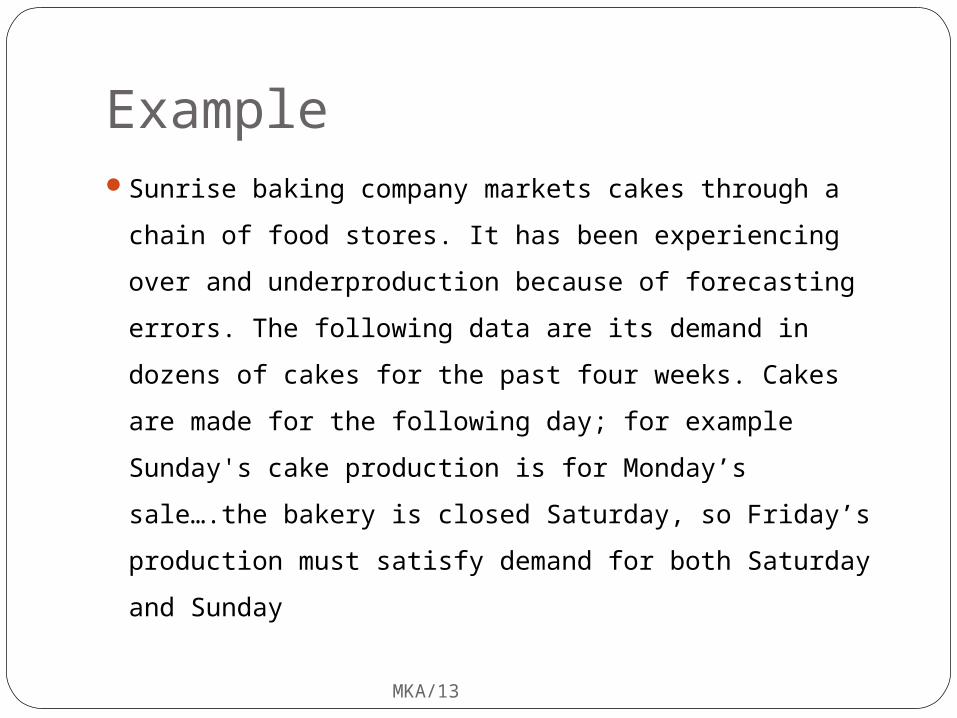
Sunrise baking company markets cakes through a
chain of food stores. It has been experiencing over
and underproduction because of forecasting errors.
The following data are its demand in dozens of
cakes for the past four weeks. Cakes are made for
the following day; for example Sunday's cake
production is for Monday’s sale….the bakery is
closed Saturday, so Friday’s production must satisfy
demand for both Saturday and Sunday

Example
Day 4weeks ago
3weeks ago
2 weeks ago
Last week
Monday 2200 2400 2300 2400
Tuesday 2200 2100 2200 2200
Wednesday
2300 2400 2300 2500
Thursday 1800 1900 1800 2000
Friday 1900 1800 2100 2000
Saturday
Sunday 2800 2700 3000 2900MKA/13 29

Example
MKA/1330
Make a forecast for this week on the following basis
i. Daily using a simple four week moving average
ii. Daily using a weighted average of .4,.3,.2,.1 for the past
four weeks
iii. Sun rise is also planning its purchases of ingredients for
bread production. If bread demand had been forecast for
last week at 22000 loaves and only 21000 loaves were
actually demanded, what would sunrise’s forecast be for
this week using exponential smoothing with a=.10
iv. suppose with the forecast made in c this week’s demand
actually turns out to be 22500.what would be the new
forecast be for the next week

Causal relationship forecasting
One occurrence causes another
The rain causes the sale of rain gear
If housing starts are known then sale of carpet forecasting is possible
MKA/13

Forecasting using a causal relationship
Year Housing Permits x
Sales sqr mtry
1998 18 13000
1999 15 12000
2000 12 11000
2001 10 14000
2002 28 16000
2003 35 19000
2004 30 17000MKA/13
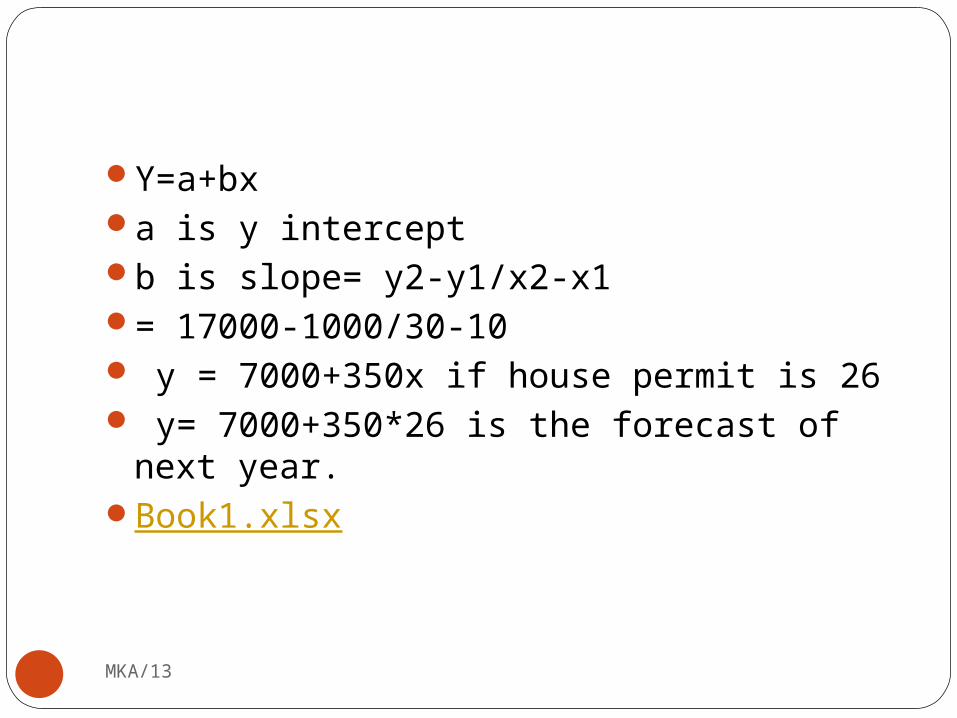
Y=a+bxa is y interceptb is slope= y2-y1/x2-x1= 17000-1000/30-10 y = 7000+350x if house permit is 26 y= 7000+350*26 is the forecast of next
year.Book1.xlsx
MKA/13

Simulation
Dynamic model usually computer basedAllow the forecaster to make
assumptions about the internal variables and external environment in the model
Depending on the variable in the model forecaster may ask such question as what would happen to my forecast if price increased by 10%
MKA/13