Forecast Summaries by Secondary Plan Area
50
Appendix A Planning Information Forecast Summaries by Secondary Plan Area Schedule F, City of Brampton Official Plan (Infrastructure, Utilities, and Resources)
Transcript of Forecast Summaries by Secondary Plan Area

Appendix A
Planning Information
Forecast Summaries by Secondary Plan Area
Schedule F, City of Brampton Official Plan (Infrastructure, Utilities, and Resources)

Forecast Summaries by Secondary Plan Area

November 14, 2008
FILE
Population Forecasts by Secondary Plan Area
SPA 2006 2011 2021 2031 Growth 2006 2011 2021 2031 Growth
*Mount Pleasant 222 1,323 32,287 49,188 48,967 198 1,478 32,477 41,184 40,986
40 - Bram West 6,264 14,374 36,424 50,045 43,781 5,877 15,702 36,067 45,398 39,521
*Northwest Brampton 233 233 4,041 36,362 36,129 181 177 4,459 35,260 35,079
45 - Credit Valley 1,090 17,937 33,889 34,525 33,434 822 19,079 34,384 33,824 33,003
47 - Highway 427 Industrial 345 72 10,701 32,401 32,055 287 280 9,746 23,494 23,207
28 - Sandringham-Wellington 55,920 80,702 85,352 84,037 28,118 50,254 68,082 72,656 71,474 21,220
41 - Bram East 17,649 34,044 45,342 45,148 27,500 14,917 31,995 41,430 40,757 25,839
48 - Sandringham - Wellington North 140 571 16,862 19,316 19,175 122 1,240 22,355 23,195 23,074
7 - Downtown Brampton 8,457 8,960 11,293 14,776 6,320 9,587 11,634 16,506 19,850 10,263
50 - Vales of Humber 251 637 5,597 6,529 6,277 535 618 9,252 9,102 8,567
36 - Queen Street Corridor 17,679 18,299 19,491 21,705 4,027 18,660 18,215 22,439 24,609 5,949
44 - Fletcher's Meadow 44,019 50,249 48,883 47,761 3,742 39,846 40,776 38,938 38,304 -1,541
6 - Brampton West 13,506 14,111 15,233 17,219 3,713 14,571 14,845 18,839 18,532 3,961
42 - Vales of Castlemore 10,597 14,770 14,502 14,176 3,578 8,840 11,856 11,321 10,550 1,710
2 - Northwest Sandalwood 6,583 10,288 9,974 9,743 3,160 5,978 8,369 8,225 8,091 2,113
4 - Heart Lake East 9,694 9,464 10,705 12,706 3,012 10,663 13,113 14,770 14,530 3,868
26 - Toronto Gore Rural Estate 1,597 2,651 2,646 2,588 992 1,801 1,848 1,764 1,736 -65
49 - Wales of Castlemore North 4,236 5,252 5,222 5,107 872 3,761 4,347 4,261 4,192 431
14 - Gore Industrial North 1,741 2,656 2,552 2,494 753 1,546 1,993 2,114 2,080 534
24 - Fletcher's Creek South 31,414 29,828 30,347 32,002 588 30,405 33,172 31,983 31,463 1,058
39 - Goreway Drive Corridor 584 596 1,042 1,071 487 616 601 2,101 2,066 1,451
1 - Snelgrove 11,289 z 11,176 11,468 179 11,171 12,045 11,502 11,315 144
23 - Gore Industrial South 0 144 138 135 135 0 0 0 0 0
18 - Brampton East Industrial 0 0 0 0 0 0 0 0 0 0
22 - Bramalea South Industrial 0 0 0 0 0 0 0 0 0 0
25 - Steeles Industrial 0 0 0 0 0 0 0 0 0 0
38 - Bramalea Road South Gateway 0 0 0 0 0 0 0 0 0 0
54 - Kennedy Road South 0 0 0 0 0 0 0 0 0 0
Heart Lake 0 0 0 0 0 0 0 0 0 0
Claireville 0 0 0 0 0 0 0 0 0 0
Parkway Belt West 0 0 0 0 0 0 0 0 0 0
32 - Parkway Belt Industrial Area 50 32 31 30 -19 50 49 47 46 -4
19 - Bramalea West Industrial 910 934 897 876 -34 1,239 1,209 1,155 1,136 -103
37 - Airport Road / Hwy 7 Business Centre 53 6 6 6 -47 0 0 0 0 0
43 - Fletcher's Creek Village 8,834 9,282 8,954 8,745 -89 7,786 8,401 8,328 8,193 407
13 - Bramalea North Industrial 1,760 1,768 1,698 1,658 -102 1,979 2,067 1,974 1,941 -38
29 - Huttonville 385 298 286 280 -105 385 376 359 353 -32
10 - Westgate 12,412 12,342 12,014 11,953 -459 13,817 13,875 13,250 13,034 -783
20 - Avondale 7,940 7,670 7,465 7,426 -514 8,358 8,559 8,626 8,486 128
15 - Fletcher's West Secondary Plan 16,741 15,808 15,680 16,004 -737 16,921 16,530 16,256 15,992 -929
5 - Northwood Park 9,743 9,495 9,119 8,905 -838 10,293 10,047 9,594 9,438 -855
21 - Southgate 13,381 13,362 12,834 12,532 -849 13,907 13,575 12,963 12,753 -1,155
17 - Brampton East 12,330 12,104 11,626 11,352 -978 12,848 12,541 11,976 11,781 -1,067
12 - Northgate 15,482 15,316 14,711 14,365 -1,117 17,232 16,821 16,063 15,802 -1,431
3 - Heart Lake West 16,738 16,128 15,491 15,126 -1,612 17,605 17,185 16,410 16,143 -1,462
9 - Madoc 20,444 19,748 18,968 18,522 -1,922 22,896 22,350 21,342 20,995 -1,901
16 - Brampton South 15,459 13,949 13,563 13,475 -1,984 15,391 15,072 14,420 14,185 -1,206
11 - Central Park 16,457 15,359 14,752 14,405 -2,052 17,196 16,786 16,029 15,769 -1,428
8 - Brampton North 16,820 15,666 15,047 14,693 -2,126 17,745 17,322 16,541 16,272 -1,473
Grand Total 429,446 496,428 626,841 720,855 291,408 426,285 504,232 632,923 693,326 267,041
2008 Preliminary Forecast 2006 Development Outlook Forecast

November 14, 2008
FILE
Employment Forecasts by Secondary Plan Area
Secondary Plan Area (SPA) 2006 2011 2021 2031 Growth 2006 2011 2021 2031 Growth
40 - Bram West 5,500 15,422 31,793 41,268 35,768 6,484 20,625 37,216 42,985 36,501
*Northwest Brampton 79 82 3,385 17,650 17,571 92 92 1,704 15,756 15,664
47 - Highway 427 Industrial 272 3,271 11,586 17,000 16,728 318 3,793 12,522 17,393 17,075
36 - Queen Street Corridor 21,882 26,084 32,913 35,508 13,626 25,811 29,861 35,809 37,326 11,515
41 - Bram East 3,818 5,747 10,445 12,412 8,594 4,188 5,929 10,515 12,234 8,046
7 - Downtown Brampton 7,077 9,918 12,496 14,341 7,264 8,288 11,311 13,511 14,945 6,657
2 - Northwest Sandalwood 5,801 9,254 10,802 11,450 5,649 6,802 10,512 11,675 11,977 5,175
32 - Parkway Belt Industrial Area 6,433 9,798 11,252 12,059 5,626 7,700 11,365 12,386 12,836 5,136
28 - Sandringham-Wellington 4,830 7,829 9,129 10,362 5,532 4,570 7,333 8,200 9,209 4,639
48 - Sandringham - Wellington North 97 288 4,022 4,832 4,735 113 322 4,062 4,725 4,612
37 - Airport Road / Hwy 7 Business Centre 2,934 5,163 6,393 7,410 4,476 3,511 5,989 7,037 7,887 4,376
23 - Gore Industrial South 7,368 9,753 10,669 11,269 3,901 8,820 11,310 11,742 11,992 3,172
25 - Steeles Industrial 9,930 11,167 12,762 13,635 3,705 11,887 12,954 14,049 14,514 2,627
24 - Fletcher's Creek South 6,787 8,013 9,353 9,760 2,973 7,444 8,649 9,638 9,696 2,252
19 - Bramalea West Industrial 8,606 9,345 10,592 11,573 2,967 10,282 10,820 11,640 12,300 2,018
45 - Credit Valley 447 982 3,084 3,296 2,849 511 750 2,660 2,760 2,249
*Mount Pleasant 11 32 2,089 2,735 2,725 8 8 1,600 1,846 1,838
20 - Avondale 3,395 4,206 5,317 5,997 2,602 3,892 4,713 5,691 6,222 2,330
18 - Brampton East Industrial 5,955 7,134 7,858 8,220 2,265 7,129 8,275 8,650 8,750 1,621
22 - Bramalea South Industrial 9,275 10,021 11,118 11,456 2,180 11,103 11,624 12,239 12,194 1,091
14 - Gore Industrial North 4,644 5,550 6,362 6,513 1,870 5,521 6,380 6,948 6,879 1,358
44 - Fletcher's Meadow 2,384 3,352 4,051 4,166 1,783 1,900 2,800 3,400 3,400 1,500
49 - Wales of Castlemore North 269 362 869 1,930 1,661 230 306 844 1,944 1,714
13 - Bramalea North Industrial 8,010 9,042 9,890 9,440 1,430 9,550 10,450 10,850 10,012 462
21 - Southgate 3,747 4,150 4,387 4,723 977 4,195 4,524 4,551 4,756 561
39 - Goreway Drive Corridor 341 685 927 1,055 714 395 782 998 1,100 705
16 - Brampton South 2,343 2,555 2,949 3,048 704 2,470 2,662 2,952 2,952 482
15 - Fletcher's West Secondary Plan 1,510 1,541 2,219 2,151 641 1,445 1,445 2,103 1,943 498
3 - Heart Lake West 2,014 2,183 2,499 2,573 559 2,048 2,183 2,415 2,411 363
6 - Brampton West 1,758 1,926 2,176 2,270 512 1,812 1,928 2,065 2,043 231
4 - Heart Lake East 969 996 1,564 1,480 511 950 950 1,490 1,300 350
42 - Vales of Castlemore 690 982 1,226 1,174 484 596 819 1,035 943 347
38 - Bramalea Road South Gateway 1,039 1,396 1,448 1,490 451 1,244 1,619 1,594 1,586 342
5 - Northwood Park 1,519 1,649 1,928 1,886 368 1,607 1,707 1,925 1,815 208
43 - Fletcher's Creek Village 582 712 835 887 306 505 625 725 755 250
50 - Vales of Humber 5 81 399 291 286 0 80 318 168 168
9 - Madoc 1,523 1,559 1,650 1,730 207 1,380 1,380 1,405 1,440 60
10 - Westgate 1,135 1,213 1,263 1,310 174 1,090 1,140 1,130 1,135 45
17 - Brampton East 1,962 2,020 2,103 2,071 109 2,081 2,081 2,063 1,958 -123
26 - Toronto Gore Rural Estate 219 337 435 314 95 228 334 421 278 50
Parkway Belt West 466 481 507 524 58 558 558 558 558 0
Claireville 200 207 218 225 25 240 240 240 240 0
1 - Snelgrove 1,137 1,244 1,363 1,152 15 1,117 1,200 1,258 978 -139
54 - Kennedy Road South 0 0 0 0 0 0 0 0 0 0
Heart Lake 0 0 0 0 0 0 0 0 0 0
29 - Huttonville 7 6 6 6 -1 0 0 0 0 0
8 - Brampton North 2,633 2,695 2,803 2,605 -27 2,787 2,787 2,760 2,455 -332
11 - Central Park 1,568 1,286 1,316 1,354 -215 1,521 1,159 1,129 1,129 -392
12 - Northgate 1,681 1,344 1,359 1,398 -283 1,677 1,227 1,177 1,177 -500
Grand Total 154,852 203,061 273,808 320,000 165,148 176,101 227,600 288,901 322,904 146,803
2006 Development Outlook Forecast2008 Preliminary Forecast

Schedule F, City of Brampton Official Plan (Infrastructure, Utilities, and Resources)

HWY. 407
STEELESH
WY.
410
HU
RO
NTA
RIO
ST
KEN
NED
Y R
D S
McL
AUG
HLI
N R
D S
MAVIS RD
MAI
N S
TREE
T S
WESTAVENUE
HWY. 407
MAI
N S
TREE
T N
WEST
BOVAIRD DRIVE EAST
STREET
STEELES
QUEEN
WIN
STO
N C
HU
RC
HIL
L B
V
BOVAIRD DRIVE WEST
RDM
cLAU
GH
LIN
R
OAD
CH
ING
UAC
OU
SY
R
D
EMBLETON
CR
EDIT
VIEW
RO
AD
MIS
SISS
AUG
A R
OAD
WANLESS DRIVE
HER
ITAG
E R
OAD
MAYFIELD ROAD
HWY. 4
27
EAST
HWY. 407
ROAD
AVENUE
REG
IONA
L RO
AD N
O. 5
0
EBENEZER
CLA
RKW
AY D
RIV
E
CO
LER
AIN
E D
R.
HU
MBE
RW
EST
PY
THE
GO
RE
RO
AD
EAST
McV
EAN
D
RIV
E
STREET
GO
REW
AY
DR
IVE
CASTLEMORE ROAD
QUEEN
AIR
POR
T
R
OAD
MAYFIELD ROAD
TOR
BRAM
R
OAD
BRAM
ALEA
R
OAD
DIX
IE
R
OAD
HEA
RT
LAK
E
RO
AD
COUNTRYSIDE DR
KEN
NED
Y
RO
AD
HU
RO
NTA
RIO
ST
CITY OF TORONTO
CITY OFVAUGHAN
TOWN OF CALEDON
TOWNOF
HALTONHILLS
CITY OF MISSISSAUGA
Schedule FLast Amended Date
Printed DateInfrastructure, Utilities
and ResourcesOctober 5, 2006
NOTES:This map forms part of the Official Plan of the City of Brampton and must be read inconjunction with the text, other schedules and secondary plans. The boundaries andalignments of designations on this schedule are approximate and are not intended to bescaled.Information regarding existing or former waste disposal sites has been compiled basedon information from the Ministry of Environment or the Region of Peel. Please contactthe Ministry of Environment or the Region of Peel directly for further information and/orclarification regarding the status of these sites.
LEGEND
October 5, 2006
HeartLake
Professor's Lake
Loafer'sLake
1:70 0000 1 2 3 4 5
Kilometres
EXISTING WATERMAIN TRUNKS
PROPOSED WATERMAIN TRUNK
RESERVOIR
TREATMENT PLAN
EXISTING SANITARY TRUNK SEWER
PROPOSED SANITARY TRUNK SEWER
PUMPING STATION
TREATMENT PLANT
WASTE MANAGEMENT/RECYCLING FACILITY
TRANSFORMER STATION
HYDRO TRANSMISSION LINE
FUTURE UTILITY CORRIDOR
TRANSCANADA GAS PIPELINE
FORMER WASTE DISPOSAL SITE
NORTH WEST BRAMPTON POLICY AREA
230
kvTR
ANSM
ISSI
ON
LINE
PLEASANTTRANSFORMER
STATION
230
kvTR
ANSM
ISSI
ON
LINE
(Bur
ried)
500 kv
TRANSMISSION LINE
Right of Way
BRAMPTONGOREWAY
TRANSFORMERSTATION
TRANSCANADAGAS PIPELINE
BRAMALEATRANSFORMER
STATION
BOLTON TRUNKSEWER
ETO
BICO
KE C
REEK
EAST
BRA
NCH
ETO
BICO
KE C
REEK
CENT
RAL
BRAN
CH
FLET
CHER
CRE
EK
ETOBICOKE CREEKWEST BRANCH
WATERTOWER
ALGONQUIN POWERENERGY FROM WASTE
FACILITY
PEEL INTEGRATEDWASTE
MANAGEMENTFACILITY
BRAMPTONCOMMUNITY
RECYCLING CENTRE
SEE SECTION4.14.4

Appendix B
Utility Stakeholder Consultation
Contact List
List of Meetings
Contact Letters
Comments Received

Contact List

6/17/2009
City of Brampton Infrastructure Capacity ReviewAECOM Project Number: 4020-012-00
Utility Vendor Contacts
Primary Contacts:Bell Canada John La Chapelle, MCIP, RPP R.O.W Control Centre Contact provided by City
Floor 5 BLUE, 100 Borough Dr. 416-735-0009 [email protected] Met with JohnScarborough, ON Provided feedback M1P 4W2
Hydro One Networks Inc. Doug Magee 483 Bay Street Contact provided by CityTeam Leader, Environmental Services & Approvals North Tower, 12th Floor 416-345-6596 [email protected] Sent documentation May 11, 2009
Toronto, ONM5G 2P5
Hydro One Brampton Andy Kuchowicz, P.Eng. 175 Sandalwood Parkway West Contact provided by CityProject Engineer Brampton, ON 905-840-6300 [email protected] Met with Andy & staff
L7A 1E8 Provided feedback Rogers Cable Darryl Dimitroff 3573 Wolfdale Road Met with Darryl & Tony Ranieri
Team Manager, Outside Plant Engineering Mississauga, ON Bus: 905-897-3912 No major comments providedL5C 3T6 Cell: 416-509-8772 [email protected]
Enbridge Consumer Gas Shelley Van Sickle, P.Eng. PO Box 650 416-498-3842 [email protected] Shelley replacing Carmelo TanciocoManager, Special Projects - Distribution Planning Scarborough, ON No major comments provided
M1K 5E3Allstream Peter Rutkowski 50 Worcester Road Did not meet in person(Telecommunications) Corey Knight, GIS/CAD Specialist Etobicoke, ON 416-649-7531 [email protected] No comments rec'd via e-mail
M9W 5X2 416-649-7509 [email protected] Contacts:Bell Canada Frank Fucile, C. Tech. Municipal Operation Centre: Present at meeting with John L.
Floor 5 - Blue 416-296-6034 [email protected] Borough DriveScarborough, ONM1P 4W2
Hydro One Brampton Wolf Schaefer 175 Sandalwood Parkway WestBrampton, ON 905-840-6300 Ext. 5531 [email protected] 1E8
Enbridge Consumer Gas Kent Todd 500 Consumers Road 416-758-7953 [email protected] Communicated via e-mail.Manager, Long Range Planning North York, ON
M2J 1P8TransCanada Pipelines, Ken McBride 11200 Weston RoadToronto Regional Office P.O. Box 790 905-832-7390 [email protected](Natural Gas Pipelines) Maple, ON
L6A 1S7
Manager of the Development and Municipal Services Control Centre.
Utility AddressContact Name CommentsTelephone Number Email Address

List of Meetings

Project No.: 4020-012-00June 17, 2009
CITY OF BRAMPTONINFRASTRUCTURE CAPACITY REVIEW
LIST OF MEETINGS
Meeting Date Location Time Attendees
Kick-Off Meeting 17-Jun-08City of Brampton2 Wellington St. West,Brampton
10:00 – 11:00 a.m.
Sabeen Makki (COB)Janice Given (COB)Adrian Smith (COB)Chris Hamel (AECOM)Laura Borowiec (AECOM)
Stormwater ReviewMeeting 29-Jul-08
City of Brampton2 Wellington St. West,Brampton
9:00 – 10:30 a.m.
Sabeen Makki (COB)Janice Given (COB)David Kenth (COB)Michael Won (COB)Frank Azello (COB)Chris Hamel (AECOM)Steve Hollingworth (AECOM)Janelle Weppler (AECOM)Laura Borowiec (AECOM)
Hydro One Brampton 28-Aug-08Hydro One Brampton165 Sandalwood Pkwy,Brampton
1:00 – 3:00 p.m.
Andy Kuchowicz (HOB)Chris Hamel (AECOM)Sabeen Makki (COB)Laura Borowiec (AECOM)
Bell Canada 11-Sep-08AECOM220 Advance Blvd.,Brampton
9:30 – 10:30 a.m.
John LaChapelle (BC)Frank Fucile (BC)Chris Hamel (AECOM)Laura Borowiec (AECOM)
RogersCommunications 15-Sep-08
RogersCommunications3573 Wolfdale Rd.,Mississauga
10:00 – 11:00 a.m.
Darryl Dimitroff (RC)Tony Ranieri (RC)Chris Hamel (AECOM)Laura Borowiec (AECOM)
Downtown BramptonDevelopment & HydroOne
06-Oct-08Hydro One Brampton165 Sandalwood Pkwy,Brampton
1:30 – 3:30 p.m.
Andy Kuchowicz (HOB)Walter Rose (HOB)Robert E. (HOB)Allan Sharp (HOB)Bernie Steiger (COB)Anthony Wong (COB)Sabeen Makki (COB)Chris Hamel (AECOM)Laura Borowiec (AECOM)
Enbridge Gas 08-Oct-08AECOM220 Advance Blvd.,Brampton
9:45 – 10:30 a.m.Carmelo Tancioco (EG)Chris Hamel (AECOM)Laura Borowiec (AECOM)
Note: Acronyms are described below:COB – City of BramptonHOB – Hydro One BramptonBC – Bell CandaRC – Rogers CommunicationsEG – Enbridge Gas

Comments Received


FAX TRANSMITTAL
175 Sandalwood Parkway West, Brampton, Ontario
From: Andy Kuchowicz Telephone: 905-452-5534
Fax: 905-840-1305
Date: May 26, 2009
To: City of Brampton
Attention: Miss Daniella Grosvenor Page: 1 of 2
Re: Comments on draft version of Infrastructure Capacity study
Hi Daniella:
With regards to the draft version of the Infrastructure Capacity Review of Utilities and Serviceswithin the City of Brampton please find Hydro One Brampton comments as follows:
A) On page #15 – the paragraph starting with “Brampton GorewayTS…………”, It seems that the paragraph is related to the Goreway GeneratingStation. The Goreway Generating Station is located on the west side of GorewayDrive, half way between Queen Street East and HWY #407. The GeneratingStation is producing electricity which feeds the hydro transmission grid/system at230 kV level. This electrical energy flows though the transmission grid and can beutilized at any location in the province. In addition, the Goreway GeneratingStation in not under Hydro One Brampton’s jurisdiction.
The Transformer Station (TS) conveys the transmission voltage level to a distribution level which is utilized by the Local Distribution Utility (LDC) to feed hydro’s distribution system and Utility’s customers. The Goreway Transformer Station is located on the east side of Goreway Drive, half way between Castlemore Road and Queen Street East. The station is owned by Hydro One Networks Inc. and Hydro One Brampton connects the distribution feeders to the distribution breakers at the transformer station.
B) Figure #11 – Recommended Hydro System UpgradesFigure #11 has already been discussed with Miss Laura Borowiec of AECOM.Laura has been advised to contact Hydro One Network s Inc. with regards to theproposed transmission lines and new transformer station locations.

However, Hydro One Brampton Networks Inc. would be satisfied if the newtransformer stations (new DESNs) are located as follows:- First new TS - in the vicinity of Chinguacousy Road/ McLaughlin Road- and Wanless Drive/Mayfield Road- Second new TS - in the vicinity of Goreway Drive/Airport Road and
Countryside Drive/Mayfield Road.- Third new TS – in the vicinity of Hwy #407 and Kennedy Road
Should you require any additional information, clarification or to set up brief meeting pleasecontact me at 905-452-5534.
Regards
Andy Kuchowicz
Cc: Laura Borowiec - AECOM

Hydro One Brampton Inc. Infrastructure Capacity study
Contest:
1. Scope
2. Background of Hydro One Brampton Network Inc. (HOBNI)
3. Forecasting horizon and data
4. Transmission lines and Transformers stations (TS)
5. Forecasted hydro load growth
6. Primary feeders
7. Downtown core and Queen St corridor
1. Scope:
This report has been prepared by Hydro One Brampton Network Inc. for City of Brampton to examineand evaluate the hydro current and planned utility services for the City’s anticipated growth up to year2031. This study has been enforced by Provincial Government to implement the Provincial Growth Planpolicies and subsequently the City’s Official Plan in June 2009.
2. Background of Hydro One Brampton Network Inc.
The Hydro One Brampton Network Inc. is a subsidiary of Hydro One Network Inc. (HONI) and isresponsible for supplying and distributing hydro power within boundary of City of Brampton. The City ofBrampton is located within GTA in the Region of Peel, north-west from City of Toronto. The Hydro OneBrampton Network Inc. is responsible to supply power to 127,000 customers (residential, commercialand industrial). The existing hydro infrastructure contains as follows:
- 14,500 distribution line poles
- 15,000 distribution transformers
- 2200km of underground primary feeder and distribution cable
- 8000km of overhead primary bare conductor (feeder and distribution)

- The main operating voltages are 44 and 27.6kV , however there are legacy voltages of 13.8, 8.23and 4.16kV which have to be maintain for local loads
- There are four Transformer stations (TS) supplying power to HOBNI grid system
- There are 13 active Municipal Station (MS)
3. Forecasting horizon and data
For the purpose of hydro load forecast, Hydro One Brampton Network Inc. has selected two sources ofavailable data as follows:
- Historical data of hydro load growth and the extrapolation of the trend into the future. Thismethod has a limitation for a time line horizon and is limited to a 10 years forecast.
- Forecasted employment and population growth study conducted by AECOM consulting office.
Both sources of data has been accepted for this study
4. Transmission lines and Transformers stations (TS)
4.1.Existing data of Transmission Lines and Transformer Station (TS)
All existing transmission lines are rated as 230kV double line in radial configuration to each transformerstation. Three of them are overhead tower lines and one underground line to Goreway Transformer
Station. The data of Transmission Lines and Transformer Station has been included in Table 1 –Transformer Stations -2008 -2010.
4.2. Future expansion of Transmission Lines and Transformer Station
The Transmission Lines and Transformer Stations are under jurisdiction of Hydro One NetworkInc. (HONI) and need to be examined by HONI from following perspective :
- Existing and future capacity of transmission lines and each DESN in the City of Brampton
- Secure land for future expansion of transmission line and TS location with relation toRight Of Way, easements, encroachments.
The existing Transformer Stations and all available DESN (existing and already approved forexpansion) may cover power supply to City of Brampton up to year 2022 when it’s expectedthat the peak load may reach a level of 1000MW (See Table 2- 2010fLoad Forecast byPopulation Growth Vs HOBNI Projected Growth)).

Additional transformer station capacity will be required to meet the load requirements, identified byHOBNI, in 2022. Future sites for evaluation would depend on load growth patterns resulting frompopulation/employment growth within the City. Power supply requirements beyond 2022 could promptHOBNI to initiate TS studies in the following areas :
- The transmission utility corridor, Kennedy Road/ Highway 407 area.
- The transmission utility corridor, Airport Road/Highway 407 area.
- The transmission utility corridor, Heritage Road/ Highway 407 area.
- North West sector of the City, Mayfield Road/Chinguacousy Road area.
- North East sector of the City, Mayfield Road, Airport Road to Goreway Drive area.
- Expansion of the existing 44kV yard at Goreway TS.
- Expansion of the existing 44kV yard at Bramalea TS.
The location and number of future sites required would depend on the future load growth patternsfor the areas noted above.
5. Forecasted hydro load growth
The peak load, which is quiete good indicator for evaluation of existing and future
expansion of hydro infrastructure (transmission lines, DESN’s, number of breakers and feedersneeded) to be as follows:
- 2005 – peak load of 731.20MW
- 2006 – peak load of 784.90MW
- 2007 – peak load of 772.10MW
- 2008 – peak load of 729.20MW actual and 801.5MW forecasted
The peak load is the summer factor of loading and it’s closely related to weather condition andtemperature.
The load forecast up to 2031 has been shown in TABLE 2.
According to load growth study and Table 2, the new DESN will be required by 2022.

6. Primary feeders and breakers requirement.
Hydro One Brampton Network Inc. has been assigned to use and utilize 77 breakers in total atthe 27.6 and 44 kV voltage level.
The HOBNI feeder network has been designed to achieve the following criteria:
- For 27.6kV feeders the maximum loading is to be between 13 to 17 MW depending on theservicing distance from TS and the voltage drop. The 27.6kV feeders are designated to providesupply to residential, commercial and small industrial customers. The feeder load needs to bereduced if customer is located more the 6 km from the TS.
- For 44kV feeders the maximum loading is to be between 22 to 27 MW depending on theservicing distance from TS and voltage drop. The feeder load should be significantly reduced ifthe customer is located more the 10 km from TS. The 44kV feeders are designated to providesupply to large industrial customers and municipal stations.
In conclusion, it’s has been forecasted to develop one or two new 27.6kV feeders per year up toyear 2031 to accommodate the load growth.
7. Downtown core and Queen St corridor
The Downtown Brampton and Queen St corridor are located some distance from the existing TSwhich creates some challenges regarding future power supply to the Queen St. corridor. The existinginfrastructure at Queen St. corridor can support only existing load. Any new development willrequire new underground infrastructure including cable replacements and the installation of newconcrete encased duct bank.
As mentioned, the practical solution to supply power (primary feeder) at Queen St. corridor is theinstallation of a new TS at the vicinity of Kennedy Rd and Utility corridor or HWY 407.
Prepared by: Andy Kuchowicz - Project Engineer - Hydro One Brampton Network Inc.
October 27, 2008

May 7, 2009 Daniella Grosvenor, MCIP, RPP Growth Management Policy Planner III Planning, Design and Development Department 2 Wellington Street West Brampton, On, L6Y 4R2
Re: Infrastructure Capacity Review of Utilities and Services within the City of Brampton
Dear Ms. Grosvenor Further to our meeting held on September 11, 2008, Bell is pleased to have the opportunity to review and provide input into the City of Brampton’s Infrastructure Capacity Review. We would like to thank staff for their efforts to date to incorporate Bell’s interests into the City’s growth management strategy. As you are aware, Bell Canada is Ontario’s principal telecommunications infrastructure provider. The Bell Canada Act, a federal statute, requires that Bell manage and operate most of the trunk telecommunications system in Ontario. Bell is also responsible for the infrastructure that supports most 911 emergency services in the Province. The Provincial Policy Statement (PPS) and the Places to Grow document both strongly support the integrated planning of communities, including telecommunications infrastructure. The PPS specifically requires that “planning for infrastructure and public service facilities shall be integrated with planning for growth so that these are available to meet current and projected needs” (Section 1.6.1). Furthermore, the PPS states that infrastructure should be located to support the delivery of emergency management services (Section 1.6.3). We note that the definition of infrastructure in the PPS includes communications/ telecommunications. In light of Provincial policy, it is critical to understand the complexity of expanding and enhancing the telecommunications network to accommodate growth, both through outward expansion of an urban area and through intensification, infill and redevelopment. All types of growth and development place demands on the telecommunications network and its associated support infrastructure. Beyond simply extending fibre or copper cable, growth and development can precipitate the need for reinforcement and replacement of the support infrastructure. Reinforcement and replacement of the telecommunications network can represent an extensive and costly undertaking, which needs to be managed to avoid disruption of public services. This is particularly critical in relation to the provision of 911 emergency services and the operating services essential to the City of Brampton’s businesses operating in a global economy.
Bell Canada Development and Municipal Services Control Centre Floor 5 BLUE, 100 Borough Drive Toronto, Ontario M1P 4W2 Telephone 905-853-4044 Fax 905-895-3872 [email protected]

May 7, 2009 2
One of Bell’s main objectives is to become more involved early in the planning process. This allows us to coordinate with the City on the provision of appropriate telecommunications infrastructure for new growth and development in a timely fashion. It also allows for greater consideration of the size and locational needs of large telecommunications infrastructure and equipment that houses key electronics. We understand that central to the growth management program for the City is the development of a proactive strategy for providing utilities. The Infrastructure Capacity Review has clearly identified the constraints that telecommunication providers must address to meet customer demands. We would like to thank staff for recognizing that system upgrades/expansions rely on being well informed of planned growth within the City. We were also pleased to see the recommendation to establish a two-way information exchange process that would alleviate risks to the infrastructure system and provide support for growth. While specific suggestions for coordination requirements have been provided for the Downtown/Queen Street Corridor in Section 7.1.2, we would like to see a more formalized process for the entire City, particular for developments that represent infill and intensification relative to infrastructure projects. It is critical to Bell that the City ensures that telecommunication providers are kept informed of these type of initiatives, particularly any future road and related infrastructure improvements that will occur as a result of the City’s growth management program. As well as being provided with the opportunity to plan infrastructure development and utility placement in conjunction with the other utility providers and public works, to be consistent with the planned development/growth. Therefore, we would ask that the City ensure that the necessary provisions for the efficient and effective delivery of services to existing and future residents of the community be undertaken during the planning process and be identified prior to undertaking extensive works. Further, the continual advancement of telecommunications technology, coupled with the need of rapid information transfer, have a significant impact on the future growth, development and economic vitality of the City of Brampton. As communities move towards an emphasis on industry standards technological advancement to support the growth of existing businesses and ensure an areas ability to attract new employment opportunities, it is important to be cognisant that much of the “backbone” of these new advancements is Bell’s infrastructure. Telecommunications has had, and will continue to have, a significant impact on the sustainability and competitiveness of Brampton. Recognizing that the document provides policy directions, we would request that the City considers the following policies to be incorporated that support the infrastructure provisioning needs of telecommunications providers, as follows: • The City of Brampton will support the completion of a technology audit to
determine the existing capabilities of the existing telecommunications network;

May 7, 2009 3
• The City of Brampton will facilitate coordination between growth management and the maintenance and expansion of the telecommunication sector, both in terms of technological advancement and service provision;
• The City of Brampton will protect and enhance existing communications networks;
• The City of Brampton will undertake discussions with telecommunications providers regarding the feasibility of servicing existing and future employment areas with industry standard telecommunications services, including broadband technology, to attract knowledge-based industries and support the technological advancement and growth of existing businesses;
• In order to implement the recommendations of this review, the City of Brampton will cooperate with both private and public telecommunication providers responsible for the regulation, transmission and delivery of telecommunications services within the City of Brampton in planning the future development and staging of the networks.
Once again, on behalf of Bell, we thank you for the continued opportunity to participate in the process and the consideration of our comments. We kindly request that all documents and information related to this initiative be forwarded to our Development and Municipal Services Control Centre:
Mr. John La Chapelle, MCIP, RPP Manager – Municipal Relations Access Network Provisioning, Ontario Development and Municipal Services Control Centre Bell Canada Floor 5 BLUE, 100 Borough Drive Toronto, Ontario M1P 4W2
Should you have any questions, please direct them to the undersigned. Yours truly,
John La Chapelle, MCIP, RPP Manager – Municipal Relations, Access Network Provisioning, Ontario cc: Wayne Corrigan - Associate Director - Access Network – Bell Canada
Scott Moon - Regional Manager – Bell Canada Chris Hamel - AECOM
Chris Tyrrell - MMM Group Ltd

From: Rutkowski, Peter [[email protected]]Sent: 2009/05/21 3:41 PMTo: Grosvenor, DaniellaSubject: RE: Brampton's Draft Infrastructure Capacity Review ReportHi Daniella,
MTS Allstream is supportive of the content that is presented in the Brampton's Draft Infrastructure CapacityReview Report.
As a telecommunications service provider to large and medium size companies only, MTS Allstream is notproactive in the planning process of future infrastructure, but rather our planning and service is based on day today customer acquisition and/or customer needs.
Thank you,
Peter RutkowskiMTS-Allstream Inc.Network Engineering50 Worcester RoadToronto, ON M9W 5X2Tel: 416-649-7531Fax: [email protected]
Page 1 of 1Brampton's Draft Infrastructure Capacity Review Report
5/28/2009file://P:\4020\012-00\3 Other Party Communications\2 Utilities\MTS-Allstream Comment...

Contact Letters

May 11th, 2009 Project No.:4020-012-00
Doug MageeHydro One Networks Inc.Environmental Services and Approvals483 Bay StreetNorth Tower, 12th FloorToronto, ON M5G 2P5
Subject: City of Brampton Infrastructure Capacity Review
Dear Mr. Magee:
As you may be aware, AECOM (previously UMA Engineering Ltd.) has been retained to undertakethe Infrastructure Capacity Review for the City of Brampton as part of the City’s overall Growth Planconformity exercise. The purpose of this study is to broadly examine and evaluate the ability ofcurrent and planned municipal services and private vendor utilities to meet the City’s anticipatedgrowth needs to 2031. This study is one of several which are part of a current exercise beingundertaken by the City to implement the Provincial Growth Plan policies in the City of Brampton byJune 2009.
As part of this study, AECOM has contacted private vendors and utilities providing services for theCity of Brampton to determine future plans for extension of infrastructure or services, including hydro,gas, cable, and telecommunication, within the City of Brampton. In particular, we have contacted andengaged Andy Kuchowicz, P.Eng. at Hydro One Brampton. Based on the consultation carried out atthus far, we have recently completed a draft study report for stakeholder review.
Recognizing that Hydro One Networks Inc. is a key utility stakeholder and that the issues of proposedtransformer stations and transmission lines falls within its jurisdiction, we would like to ensure thatHydro One Networks Inc. is also engaged and has an opportunity to provide input into this study.Based on your involvement with the City of Brampton regarding the Class Environmental AssessmentStudies being undertaken for the Bram West Parkway / North-South Transportation Corridor, wewould like to engage you as our primary point of contact for this study to ensure that comments fromHydro One Networks Inc. are incorporated and accurately reflected in the final study report.
As such, we will be sending you a hardcopy of the draft study report for your review. We wouldappreciate it if you could take the time to review this report, focusing on the hydro related sections,and provide comments no later than May 22nd, 2009. In efforts to facilitate this process and toprovide you with the necessary background information and context for this study and its objectives,we would like to set up a conference call with you during the week of May 11th, 2009. Please let usknow what date and time works for you and we will make the necessary arrangements at our end.

Page 2 Project No.:4020-012-00Hydro One Networks Inc.May 8th, 2009
We appreciate in advance your cooperation in supporting this study. Should you require anyadditional information or have any questions, please do not hesitate to contact the undersigned byphone at 905-747-7562 or via e-mail at [email protected]. You can also contact DaniellaGrosvenor at the City of Brampton by phone at 905-874-2061 or via e-mail [email protected].
Sincerely,AECOM Canada Ltd.
Chris Hamel, P.Eng.Regional Manager, Infrastructure Planning
LB:lb
File Location: P:\4020\012-00\3 Other Party Communications\2 Utilities\L-4020-012-00-Hydro One Networks Letter-090511.doc


Appendix C
Region of Peel Water & Wastewater Master Plan
Recommended Water & Wastewater Servicing Strategy Maps


Appendix D
Region of Peel Development Charges
Water & Wastewater DC Maps

2
87
9
4
1
6
3
4
5
3
61
5
8
2
7
9
10
2
3
5
1
4
CLARKSON WASTEWATER
TREATMENT PLANT
LAKEVIEW
WASTEWATER TREATMENT PLANT
CREDIT WOODLANDS
SEWAGE PUMPING STATION
LIONS HEAD
SEWAGE PUMPING
STATION
CHINGUACOUSY LANDFILL
DEER VALLEY DRIVE
SEWAGE PUMPING STATION
RICHARDS MEMORIAL
SEWAGE PUMPING STATION
BOLTON NORTH HILL
SEWAGE PUMPING STATION
BRAMPTON HEIGHTS
SEWAGE PUMPING STATION
BRITANNIA LANDFILL
MEADOWVALE
SEWAGE PUMPING STATION
O'NEIL COURT
SEWAGE PUMPING STATION
FIRESHIRE
SEWAGE PUMPING STATION
CLARKSON
SEWAGE PUMPING STATION
STONEHAVEN
SEWAGE PUMPING STATION
SILVER BIRCH TRAIL
SEWAGE PUMPING STATION
BEXHILL
SEWAGE PUMPING STATION
WATERSEDGE
SEWAGE PUMPING STATION
SHARDAWN MEWS
SEWAGE PUMPING STATION
BEACH STREET
SEWAGE PUMPING STATION
BEN MACHREE
SEWAGE PUMPING STATION
HIAWATHA PARKWAY
SEWAGE PUMPING STATION
ELMWOOD
SEWAGE PUMPING STATION
FRONT STREET
SEWAGE PUMPING STATION
ROSEMERE
SEWAGE PUMPING STATION
INDIAN ROAD
SEWAGE PUMPING STATION
PINETREE
SEWAGE PUMPING STATION LARCHVIEW
SEWAGE PUMPING STATION
RILEY COURT
SEWAGE PUMPING STATION
DONNELLY
SEWAGE PUMPING STATION
MAYFIELD
SEWAGE PUMPING STATION
CALEDON EAST
SEWAGE PUMPING STATION
CASTLEMORE
SEWAGE PUMPING STATION
INTERMODAL
SEWAGE PUMPING STATION
THE GORE ROAD
SEWAGE PUMPING STATION
MCVEAN
SEWAGE PUMPING STATION
ALBION VAUGHAN
SEWAGE PUMPING STATION
HARVESTVIEW
SEWAGE PUMPING STATION
BOLTON
SEWAGE PUMPING STATION
HENDERSON
SEWAGE PUMPING STATION
COLERAINE
SEWAGE PUMPING STATION
BEXHILL R
OAD
GATEHOUSE DRIVE
RANGEVIEW ROAD
HYD
RO
RO
AD
LAKESHORE ROAD EAST
HAIG
BOU
LEVAR
D
COURT
HU
RO
NTA
RIO
STR
EE
T
NORTH SERVICE ROAD
SH
ERO
BEE
RO
AD
CATERPILLAR ROADTONOLLI ROAD
ROAD
BLUN
DEL L
MISSISSAUGA VALLEY BOULEVARD
TAH
OE
BO
ULE
VAR
D
LUKE R
OAD
RAN
GE R
OAD
BRITANNIA ROAD EAST
NETH
ERH
ART R
OAD
CR
ESCEN
T
BISCAYNE
FIRST G
ULF B
V
WILLIAMS PARKWAY EAST
GRASSINGTON
GATEWOOD DRIVE
CORPORATION DRIVE
TOR
BR
AM
RO
A D
JEF F
ERS O
N R
OAD
MAITLAND ST
BRAM
AL E
A R
OAD
NORTH PARK DRIVE
ELDOMAR AV
ELMGROVE AV
FAI R
GLE
N A
V
WIN
STO
N C
HU
RC
HIL
L B
LVD
BROMSGROVE ROADBROOKHURST ROAD
ORR ROAD
HAZ
ELH
UR
ST
RO
AD
ROYAL WINDSOR DRIVE
AVO
NH
E AD
R
OAD
MAYFIELD ROAD
MIS
SISS
AU
GA
RO
AD
BEEC
HW
OO
D
AVE
NU
E
MONTBECK
SOU
THD
OW
N
RO
A D
AUTU
MN
BOU
L EVA
RD
HE A
RT
L AK
E R
OAD
DIX
IE R
OA
D
BRAM
AL E
A R
OADMAYFIELD ROAD
TRUSCOTT DRIVE
MIS
SISS
AU
GA
RO
AD
KE N
NE
DY
RO
AD
N
CHURCH STREET E
CR
ED
ITV I
EW
RO
AD
BOSTON MILLS ROAD
MIS
SISS
AU
GA
RO
AD
WALKER ROAD WEST
PATTERSON SR
ST A
ND
REW
S R
OAD
HO
RSE
S HO
E H
ILL
RO
AD
OLDE BASE LINE ROAD
THE GRANGE SR
NORTH PARK DRIVE
GO
RE
WA
Y D
RIV
EHU
MB
ER W
EST
PAR
KWAY
GIBSON LAKE DRIVE
PINE AVENUE
FINNERTY SR
HUNSDEN SR
MO
UN
T H
OPE
RO
AD
HI G
HW
AY 5
0
HU
RO
NT A
RIO
STR
EET
BEECH GROVE SR
QUEEN STREET EAST
HIGHPOINT RD
MAI
N S
TREE
T
SOU
THD
OW
N R
OAD
P AR
KL A
ND
AV EN
UE
PAISLEY BOULEVARD EAST
ERIN
DAL
E S
TATI
ON
R
OA D
PARKWAY
CO
NFED
ERATIO
N
HU
RO
NT A
RIO
STR
EET
LOLITA GATE
FUTURE FINANCIAL DRIVE
HALLSTONE RD
WANLESS DRIVE
BOVAIRD DRIVE
MIS
SISS
AU
GA
RO
AD
TEN
TH L
INE
W
COUNTRYSIDE DRIVE
CASTLEMORE ROAD
DERRY RD E
GOREWAY DR
AI R
POR
T R
D
STEELES AVENUE
STEELES AVENUE
PEAR
SON
RO
AD
ALPHA MILLS RD
KEN
NED
Y R
OAD
WIN
STO
N C
HU
RC
HIL
L B
OU
LEV A
RD
MIS
SISS
AU
GA
RO
A D
COUNTRYSIDE DRIVE
COTTRELLE BOULEVARD
AIR
PO
RT
RO
A DA
I RPO
RT
RO
AD
DIX
IE
RO
AD
DIX
IE
RO
AD
DI X
IE
RO
AD
DIX
IE
RO
AD
ARGENTIA RO
AD
COPENHAGEN ROAD
CR
ED
ITV I
EW
R
OA
D
QU
EEN
ST
RE E
T S
OU
THQ
UEE
N
STR
E ET
NO
RTH
ERIN
M
ILLS
P
ARK W
AY
BRITANNIA ROAD
BRITANNIA ROAD
THE QUEENSWAY
THE QUEENSWAY
HIG
HW
AY 5
0
HIG
HW
AY 5
0
HIG
HW
AY 5
0
HIG
HWAY
50
MAYFIELD ROAD
MAYFIELD ROAD
MAYFIELD ROAD
EBENEZER ROAD
QUEEN STREET WEST
EMBLETON RD
STEELES AVENUE
MATHESON BV W
MATHESON BV E
BRISTOL RD W
GL E
N E
RIN
D
R
MILLCREEK DRIVE
ARGENTIA ROAD
COURTNEYPARK DR W COURTNEYPARK DRIVE EAST
ORENDA ROADBALMORAL DR
CLARK BVOULEVARD
CHAROLAIS BV
MC
LAU
GH
LIN
R
OA D
CH
ING
UA C
OU
S Y
RO
AD
HE R
ITAG
E
RD
CONSERVATION DR
SANDALWOOD PY W
WANLESS DRIVE
HIG
HW
A Y 5
0
HEALEY ROAD
KING STREET
DU
FFYS
LI
NE
HU
MB
ER S
TAT I
ON
RD
QUEEN STREET
CLA
RK W
AY
D
RIV
E
MC
VEA
N
DR
AIR P
ORT
ROA
D
GOR E
WAY
DR
407 H
Y W
NIN T
H L
INE
WIN
STON
CHU
R CHI
LL B
V
TEN T
H L
I NE
WE S
T
DUNDAS STREET WEST
DUNDAS STREET WEST
BURNHAMTHORPE ROAD EAST
BURNHAMTHORPE RD W
MCL A
UGHL
IN R
D N
401 HY W
407 HY W
BR
AMA L
EA
RO
AD
TOR
BR
AM
R
OA
D
HEALEY ROAD
OLD SCHOOL ROAD
MISSISSAUGA ROAD
BR
AMA L
EA
R
OA
D
TOR
BR
AM
R
D
THE
GO
RE
RD
AIR
POR
T R
OA
D
AIR
PO
RT
RO
A D
LAKESHORE ROAD E
LAKESHORE ROAD WEST
HU
RO
NT A
RIO
STR
EET
DIX
IE
RD
DIX
IE
RO
AD
HU
RO
NT A
RIO
ST
RE E
T
CR
ED
ITV I
EW
RD
CR
ED
ITV I
EW
RO
AD
CH
ING
UA C
OU
S Y R
D
HW
Y 4
10
HWY 403
HWY 403
CA
WTH
RA
RD
QEW HY E
QEW HY E
ERIN
M
ILLS
P
ARKW
AY
EGLINTON AVENUE EAST
EGLINTON AVENUE WEST
ERIN MILLS P
ARKWAY
HWY 401
HWY 401
HWY 407
HWY 407
525
525525
450
375
525
525
450
525
750
600
825
975
975
1200
750
1500525
2006
1800
2100250
1200 1200
1200
1500
750
1500
525
1050
975
1200
900
1350
1350
1350750
750750
600
600
600
750
1350
750
2100
1200
1200
1200
1200
900
1500
2100
750
825
1200
1200
1800
1350
1350
1200
1650
750675
750
1200
900
750
675
82 5825
7 50
375
2016 1516912-2900
20071657906-2930
2007 1657806-2940
20071582505-2220
20081112606-2935
20072247804-2983
20061703706-2415
2006 386906-2109
20101454309-2385
20081112706-2405
20072137805-2230
2007 2137805-2230
2007402807-2255
20072137805-2230
20292264112-2200
2029 2260012-2200
20092181007-2250
20072180203-2280
20072179204-2250
20072155205-2220
20292115512-2200
20292114212-2200
20292113812-2200
20292113112-2200
20292112612-2200
20292112012-2200
20292110912-2200
2029 2110612-2200
20292110312-2200
20292110012-2200
2029 2109812-2200
20292109712-2200
20292109412-2200
20082109007-2210
20241998112-2200
2024 1998012-2200
20071953605-2197
20291705012-2200
20291704412-2200
20291704012-2200
2024 1703912-2200
2029 1703812-2200
20161637212-2200
20161637212-2200
20201635512-2200
20071582705-2220
2020 1561512-2200
2012 1307512-2210
2031584012-2200
2014583812-2200
2009581407-2225
2010 578109-2220
2010453108-2205
2010 453108-2205
2014449712-2200
2014449412-2200
2019448712-2200
2009446108-2230
2007402707-2215
2008402605-2215
2007397107-2240
2009396607-2225
2009396307-2250
2011384210-2210
2011383510-2210
2011383010-2210
2011 382910-2205
2011 381310-2205
2011 381210-2205
2011 380810-2205
2010379608-2235
2010377808-2235
2011 3777102205
2020 2460712-2100
2020 2460712-2100
20102460210-2153
20102180810-2153
2010 2460508-2109
2019377212-2100
2014 377412-2100
20101306908-2109
2015385612-2100
2007 2180805-2152
20182156112-2100
2017 2155812-2100
2020 2155612-2100
2022 2155512-2100
20092152508-2185
20102119710-2198
20072117907-2185
201421171122100
20071999806-2165
20102107510-2115
20132106412-2100
2015 2106212-2100
20232104012-2100
20232105812-2100
20232105712-2100
20242105612-2100
20242105512-2100
2020 2105312-2100
2021 2105212-2100
2021 2105112-2100
2021 2105012-2100
2014 2104512-2100
2020 2104312-2100
20232104112-2100
2024 21039 12-2100
2025 2103612-2100
2026 2102812-2100
2027 2102712-2100
2024 2102412-2100
2025 2102112-2100 2011
2101711-2170
2011 2101611-2145
2012 2101512-2100
20112101411-2120
2013 2101212-2100
20102097710-2135
20091286608-2185
2012582112-21002009
581809-2198
2016 575712-2100
2010 401009-2155
2009398809-2185
2008 398008-2145
2008397008-2165
2010396410-2135
2009395809-2120
2010387110-2140 2012
387012-2100
2014 384912-2100
2030383112-2100
20072445207-2165
2007 2269804-2122
20102227310-2125
20072180503-2151
20082166508-2170
20082164908-2170
2016 2155912-2100
2018 2155712-2100
2024 2155312-2100
20092142109-2165
20082138408-2150
201621195122100
2007 2118707-2190
20072116007-2180
20082115908-2190
20112106611-2130
20112106511-2115
2015 2106312-2100
2015 2106112-2100
2018 2106012-2100
2022 2105912-2100
2018 2105412-2100
2014 2104712-2100
2020 2104412-2100
20202104212-2100
2024 2103812-2100
2025 2103012-2100
20232102512-2100
2025 2102312-2100
2030 2102212-2100
2013 2102012-2100
2014 2101912-2100
20112101811-2170
2012 2101312-2100
2011 2101011-2120
2007 1943001-2115
20171307012-2100
20081287408-2195
20131286308-2109
2008 584208-2135
2017582012-2100
2010401109-2155
2008397908-2145
2008 397208-2130
2008 396908-2165
2008396108-2160
2016 384512-2100
2030383212-2100
2011382711-2135
2020 377012-2100
2021376912-2100
2021376812-2100
525
600
375
525
450
525
525
675
675
450
450
525
450
450
450 600450
450
375
525
525
600
525
600
600
525
375
375
900
375
600
525
450
45 0
525
375
825
825
6 75
675
375
525
525
525
450
375
450
675
375
375
525
525
675
525
375
525
375
450
450
375
525
825
525
450
600
450
45 0
450
525
375
600
600
375
675
675
450
375
450
375
450
450
600
375
375
375
525
450450
375
375
675
675
375
675
600
600
375
450525
750
525
525
525 675
900
WASTEWATER SERVICING INFRASTRUCTURETREATMENT AND TRUNK SEWER SYSTEM2007 - 2031 DEVELOPMENT CHARGES
DATE ISSUED: JANUARY 2007
Approved Sanitary Trunk Component WWP Collection Gen (2007
Proposed Sanitary Trunk Components WWP Collection Gen (2008-2031)
Proposed Sewer Component WWL Development (2008-2031)
Approved Sewer Component WWL Development (2007)
Existing Sanitary Sub Trunk (375-675 mm)
South Peel, East-West Drainage Boundary
Major River
Major Roads
Wards
LEGENDExisting Waste Water Treatment Plants
Proposed Waste Water Treatment Plant Components (2008-2031)
Approved Waste Water Treatment Plant Components (2007)
Existing Wastewater Pumping Stations and Landfills
Proposed Wastewater Pumping Station Components (2008-2031)
Approved Wastewater Pumping Station Components (2007)
Proposed New Wastewater Pumping Station (2008-2031)
CLARKSON WASTEWATER TREATMENT PLANT
NEW OUTFALL (C) 6056 (2007) 06-2925
UN-IONIZED AMMONIA LIMITS (C) 13154 (2009) 09-2920WAS THICKENING (C) 11692 (2010) 08-2905PLANT EXPANSION 200ML-350ML (C) 16360 (2010) 08-2905BIOSOLIDS DEWATERING (C) 12825 (2010) 08-2905
LAKEVIEW WASTEWATER TREATMENT PLANT
EXPANSION TO 486ML/D (C) 16353 (2007) 07-2960
NEW SCREENS(HEADWORKS UPGRADE (D) 12909 (2018) 12-2900NEW SCREENS(HEADWORKS UPGRADE (C) 11680 (2018) 12-2900EXPANSION TO 518ML/D (D) 11710 (2020) 12-2900EXPANSION TO 518ML/D (C) 11687 (2022) 12-2900
Rail Track
Airport Outline
Major Lakes
0.00 0.75 1.50 2.25 3.00 3.75 km

2
87
5
6
119
10
2
1
4
1
8
1
3
5
3
6
7
9
4
4
10
2
3
5
2013437111-1205
2013437111-1205
20091955908-1210
20072155104-1222
2018 2069712-1200
20102069509-1205
20072047304-1205
20081940107-1210
20081939207-1210
20121283410-1205
2008444806-1205
2010440109-1210
2013437111-1205
2013360512-1200
400
2007 2350707-1121
2007 2350607-1121
2014 2270012-1100
2010 2269909-11452012
2269712-1100
2020 2191912-1100
2010 2191609-1120
2010 2191409-1155
2007 2190305-1183
2017 2179812-1100
2024 2114112-1100
2015 2114012-1100
2018 2113912-1100
2018 2113712-1100
2018 2113612-1100
2016 2113512-1100
2011 2111910-1140
2008 2108107-1124
2016 2092212-1100
2017 2092012-1100
2018 2091912-1100
2029 2091812-1100
2011 2091710-1141
2021 2091612-1100
2019 2091512-1100
2018 2091412-1100
2017 2091312-1100
2017 2091212-1100
2008 2077508-1107
2014 2077412-1100
2015 2077312-1100
2011 2077211-1110
2015 2077112-1100
2030 2077012-1100
2010 2076810-1105
2024 2076712-1100
2013 2076512-1100
2011 2076310-1155
2009 2076108-1175
2024 2075912-1100
2014 2075712-1100
2025 2075512-1100
2024 2075312-1100
2023 2075112-1100
2020 2074912-1100
2011 2074710-1125
2021 2074512-1100
2021 2074212-1100
2010 2073910-1145
2010 2073710-1145
2014 20735 12-1100
2014 2073312-1100
2010 2072910-1107
2009 2072709-1123
2008 2072608-1122
2008 2072508-1121
2007 2071605-1111
2007 2071506-1181
2008 2068207-1119
2010 2066009-1115
2013 1996412-1100
2013 1996312-1100
2013 1996212-1100
2009 1744308-1108
2011 1661610-1135
2008 1614707-1116
2008 1614607-1116
2008 1614507-1116
2008 1614407-1116
2007 660707-1117
2008 366207-1175
2011 364010-1136
2017 363412-1100
2009 363309-1110
2008 362707-1147
2010 362410-1121
2011 362311-1122
2009 361708-1106
2012 360911-1115
2009 360008-1150
2009 359708-1108
750
2012
359611-1130
2012 359511-1130
750
750
2012 359411-1130
2012 359311-1130
750
750
2011 359210-1115
2011 359110-1115
750
750
2011 359010-1115
750
2011 358910-1115
2011 3588 10-1115
750
750
2011 358710-1115
2015 358412-1100
2015 358212-1100
2015 3581121100
2008 356108-1156
2008 356008-1135
6
65B
6
6
1
2
4
3
5
4
98
7
5
6
4
2
1
3
2A
1200
400
400
400
400750
400
400
400
400
400
900
400
400
400
400
1200
400
40 0
4 00
400
600
400
400
400 400
600
600
400
400
400400
400
400
400
400400
400400
400
400
500500
400
400
600600
600
750
750
400
400400
400
400400
400
400
400
900
900
900
900
1050
400
400
400
400
600
400
400400
500
400
400
750
750
600
750
6 00
600
600
400400
1200400
300
12 0012 00
750
750
1200
1200
1200
1050
1050
2100
2100
600
12 00
750
MIS
SIS
SA
UG
A R
OA
D
MAYFIELD ROAD
WISEMAN COURTRICHEY COURT
BEEC
HW
OO
D
AVE
NU
E
MO
NTB
EC
K
CO
UR
T
SO
UTH
DO
WN
R
OA
D
AU
TUM
N
B
OU
LEV
AR
D
HE
AR
T LA
KE
RO
AD
DIX
IE R
OA
D
BR
AM
ALE
A R
OA
D
MAYFIELD ROAD
BROMSGROVE ROAD
TRUSCOTT DRIVE
SAN
DG
ATE
CR
MIS
SISS
AU
GA
RO
AD
QUEEN STREETKE
NN
ED
Y R
OA
D N
CHURCH STREET E
CR
ED
ITV
IEW
RO
AD
BOSTON MILLS ROAD
MIS
SIS
SA
UG
A R
OA
D
WALKER ROAD WEST
PATTERSON SR
ST
AN
DR
EW
S R
OA
D
HO
RS
ES
HO
E H
ILL
RO
AD
OLDE BASE LINE ROAD
THE GRANGE SR
NORTH PARK DRIVE
GO
RE
WA
Y D
RIV
E
WILLIAMS PARKWAY EAST
HU
MB
ER
WE
ST
PA
RK
WA
Y
GIBSON LAKE DRIVE
PINE AVENUE
FINNERTY SR
HUNSDEN SR
MO
UN
T H
OP
E R
OA
D
HIG
HW
AY
50
HU
RO
NTA
RIO
STR
EE
T
BEECH GROVE SR
QUEEN STREET EAST
HIGHPOINT RDMA
IN S
TRE
ET
SO
UTH
DO
WN
RO
AD
PA R
KLA
ND
AVE N
UE
PAISLEY BOULEVARD EAST
ER
IND
ALE
STA
TIO
N
RO
AD
BOULEVARD
PARKWAY
CO
NFED
ERATIO
N
HU
RO
NTA
RIO
STR
EE
T
VALLEY
MISSISSAUGA LOLITA GATE
FUTURE FINANCIAL DRIVE
HALLSTONE RD
WANLESS DRIVE
BOVAIRD DRIVE
MIS
SISS
AU
GA
RO
AD
TEN
TH L
INE
W
COUNTRYSIDE DRIVE
CASTLEMORE ROAD
DERRY RD E GOREWAY DR
AIR
PO
RT
RD
STEELES AVENUE
STEELES AVENUE
PE
AR
SO
N R
OA
D
ALPHA MILLS RD
KE
NN
ED
Y
RO
AD
WIN
STO
N C
HU
RC
HIL
L B
OU
LEV
AR
D
MIS
SIS
SA
UG
A
RO
AD
COUNTRYSIDE DRIVE
COTTRELLE BOULEVARD
AIR
PO
RT
RO
AD
AIR
PO
RT
RO
AD
DIX
IE
RO
AD
DIX
IE
RO
AD
DIX
IE
RO
AD
DIX
IE
RO
AD
ARGENTIA RO
AD
COPENHAGEN ROAD
CR
ED
ITV
IEW
R
OA
D
QU
EE
N
STR
EE
T S
OU
THQ
UEE
N
STR
EET
NO
RTH
ER
IN
MIL
LS
PA
RK
WA
Y
BRITANNIA ROAD
BRITANNIA ROAD
WIN
STO
N C
HU
RC
HIL
L B
OU
LEV
AR
D
THE QUEENSWAY
THE QUEENSWAY
HIG
HW
AY 5
0
HIG
HW
AY 5
0
HIG
HW
AY 5
0
HIG
HW
AY 5
0
MAYFIELD ROAD
MAYFIELD ROAD
MAYFIELD ROAD
EBENEZER ROAD
QUEEN STREET WEST
EMBLETON RD
STEELES AVENUE
MATHESON BV W
MATHESON BV E
BRISTOL RD W
GLE
N E
RIN
D
R
MILLCREEK DRIVE
ARGENTIA ROAD
COURTNEYPARK DR W
COURTNEYPARK DR E
RU
THE
RFO
RD
RO
AD
ORENDA ROADBALMORAL DR
CLARK BVOULEVARD
CHAROLAIS BV
CE
NTR
E S
T S
MC
LAU
GH
LIN
R
OA
D
CH
ING
UA
CO
US
Y
RO
AD
HE
RIT
AG
E
RD
CONSERVATION DR
SANDALWOOD PY W
WANLESS DRIVE
HEALEY ROAD
KING STREET DU
FFYS
LI
NE
HU
MB
ER
STA
TIO
N R
D
QUEEN STREET
CLA
RK
WA
Y
DR
IVE
MC
VE
AN
D
R
AIRP
ORT
ROA
D
GORE
WAY
DR
407 H
Y W
NINT
H L
INE
WIN
STON
CHU
RCHI
LL B
V
TENT
H L
INE
WES
T
DUNDAS ST E
DUNDAS STREET WEST
BURNHAMTHORPE RD E
BURNHAMTHORPE RD W
WILLIAMS PARKWAY EAST
MCLA
UGHL
IN R
D N
401 HY W
407 HY W
BR
AM
ALE
A R
OA
D
TOR
BR
AM
R
OA
D
HEALEY ROAD
OLD SCHOOL ROAD
MISSISSAUGA ROAD
BR
AM
ALE
A
RD
TOR
BR
AM
R
D
THE
GO
RE
RD
AIR
POR
T R
OA
D
AIR
PO
RT
RO
AD
LAKESHORE ROAD E
LAKESHORE ROAD WEST
HU
RO
NTA
RIO
STR
EE
T
DIX
IE
RD
DIX
IE
RO
AD
HU
RO
NTA
RIO
S
TRE
ET
CR
ED
ITV
IEW
RD
CR
ED
ITV
IEW
RO
AD
CH
ING
UA
CO
US
Y R
D
HW
Y 4
10
HWY 403
HWY 403
CA
WTH
RA
RD
QEW HY E
QEW HY E
ER
IN
MIL
LS
PA
RK
WA
Y
EGLINTON AV E
EGLINTON AV W
ERIN MILLS P
ARKWAY
HWY 401
HWY 401
HWY 407
HWY 407
DATE ISSUED: JANUARY 2007
HERRIDGE RESERVOIR AND PUMPING STATION
PUMPING STATION EXPANSION (P) 16389 (2014) 12 - 1900 (P) 11807 (2016) 12 - 1900
PUMPING STATION (D) 23484 (2007) 04-1935 (C) 4224 (2008) 04-1935
TULLAMORE PUMPING STATION AND RESERVOIR
RESERVOIR (D) 23483 (2007) 04-1935 (C) 4233 (2008) 04-1935
PROPERTY 24526 (2007) 04-1935STANDBY POWER AND 5683 (2008) 04-1935PUMP PURCHASE
NORTH BOLTON ELEVATED TANK
NEW ELEVATED TANK (D) 4296 (2009) 09 - 1970 (C) 4297 (2010) 09 - 1970
STREETSVILLE RESERVOIR AND PUMPING STATION
RESERVOIR EXPANSION (C) 19460 (2008) 06 - 1922
SURGE AND OTHER EQUIPMENT (P) 15544 (2007) 06 - 1921
NEW PUMPS AND OTHER (C) 4148 (2007) 06 - 1922EQUIPMENT
PUMPING STATION (C) 24601 (2008) 06 - 1922EXPANSION
MEADOWVALE NORTH RESERVOIR AND PUMPING STATION
ADDITIONAL LOW AND HIGH LIFT PUMPS (P) 4151 (2010) 09 - 1980ADDITIONAL LOW LIFT PUMP (P) 5476 (2010) 09 - 1980ADDITIONAL LIFT PUMPS (P) 16347 (2010) 09 - 1980
LORNE PARK WATER TREATMENT PLANT NO 1 LORNE PARK WATER TREATMENT PLANT NO 2
PLANT AND PUMPING (C) 12125 (2007) 06 - 1906STATION EXPANSION
AIRPORT ROAD PUMPING STATION AND RESERVOIR
RESERVOIR (C) 16901 (2009) 07-1960
PUMPING STATION (C) 12840 (2009) 07-1960
ALLOA RESERVOIR AND PUMPING STATION
PUMPING STATION BLDG (D) 4172 (2010) 10 - 1960 (C) 4173 (2012) 10 - 1960
RESERVOIR (NEW) (D) 4269 (2010) 10 - 1960RESERVOIR (NEW 25 ML) (C) 4268 (2012) 10 - 1960
ALTON VILLAGE NEW WELL
NEW WELL (C) 21741 (2020) 12 - 1800
ALTON VILLAGE NEW WELL
NEW WELL (C) 21735 (2013) 12 - 1800 CALEDON VILLAGE NEW WELL
NEW WELL (C) 21739 (2013) 12 - 1800
PALGRAVE NEW WELL
NEW WELL (C) 21738 (2018) 12 - 1800
PALGRAVE WELL 2 REPLACEMENT
WELL 2 REPLACEMENT (C) 23857 (2007) 07 - 1825
ZONE 7 RESERVOIR
NEW RESERVOIR (D) 20692 (2017) 12 - 1900 (C) 20685 (2018) 12 - 1900
CALEDON EAST
WELL4 UPGRADE (C) 15546 (2010) 08 - 1825NEW WELL (C) 21736 (2013) 12 - 1800NEW RESERVOIR (C) 21716 (2015) 12 - 1800PUMPING STATION (C) 23866 (2015) 12 - 1800
CALEDON VILLAGE RESERVOIR
ALTON VILLAGE STANDPIPEMONO MILLS STANDPIPE
CALEDON EAST RESERVOIR
BOLTON ELEVATED TANK
BOLTON STAND PIPE NO 2
BOLTON STAND PIPE NO 1
SNELGROVE ELEVATED TANK
NORTH BRAMPTON RESERVOIR
EAST BRAMPTON RESERVOIR
BECKETT SPROULE RESERVOIR
HANLAN RESERVOIR
NORTH STREETSVILLE ELEVATED TANK
MEADOWVALE NORTH RESERVOIR
STREETSVILLE RESERVOIR
HERRIDGE RESERVOIR
SILVERTHORN RESERVOIR
WATER SERVICING INFRASTRUCTUREPRODUCTION AND PRIMARY SYSTEMSLOCAL DISTRIBUTION SYSTEMS2007 - 2031 DEVELOPMENT CHARGES
LORNE PARK WATER TREATMENT PLANT
LAKEVIEW WATER TREATMENT PLANT
CHELTENHAM RESERVOIR
NEW RESERVOIR (C) 23617 (2011) 10 - 1850
NEW WELL (C) 21729 (2013) 12 - 1800
MAYFIELD WEST ELEVATED TANK
NEW ELEVATED TANK (C) 23292 (2007) 02 - 1910
ZONE 6 NEW RESERVOIR
NEWRESERVOIR (D) 20691 (2009) 09 - 1960 (C) 20688 (2010) 09 - 1960
RESERVOIR (D) 23581 (2019) 12 - 1900RESERVOIR (NEW 25 ML) (C) 22563 (2020) 12 - 1900
HANLAN RESERVOIR AND PUMPING STATION
LOW LIFT TRANSFER STATION (C) 11844 (2007) 04 - 1999
PUMPING STATION (C) 23585 (2019) 12 - 1900EXPANSION
LAKEVIEW WATER TREATMENT PLANT AND RESERVOIR
HIGH LIFT PUMPING STATION (C) 22947 (2007) 03 - 1985STATION EXPANSION
PLANT AND PUMPING STATION (C) 12836 (2011) 07 - 1936EXPANSION (C) 21385 (2009) 07 - 1936
PALGRAVE RESERVOIR
INGLEWOOD RESERVOIR
CHELTENHAM RESERVOIR
AIRPORT ROAD RESERVOIR
INGLEWOOD - RESERVOIR
NEW RESERVOIR (C) 16286 (2007) 06 - 1810
WELL 3 UPGRADE (C) 23862 (2013) 12 - 1800
BECKETT SPROULE RESERVOIR
NEW TRANSFER STATION (C) 11852 (2007) 04 - 1998
NEW TRANSFER PUMPS (P) 23587 (2019) 12 - 1900
Approved Water Treatment Plants Components (2007)
Proposed Water Treatment Plants Components (2008-2031)
Existing Reservoirs
Existing Tanks
New Proposed Reservoirs (2008-2031)
Approved Feeder Main (WTS) Components (2007)
Proposed Feeder Main (WTS) Components (2008-2031)
Approved WDS Components (2007)
Proposed WDS Components (2008-2031)
Existing Feeder Main
Pressure Zone
Major River
Major Roads
Wards
LEGEND
Proposed Upgrades to Existing Wells (2008-2031)
Proposed New Wells (2008-2031)
Existing Water Treatment Plants
Approved Water Reservoir Components (2007)
Proposed Water Reservoir Components (2008-2031)
New Proposed Elevated Tanks (2008-2031)
Approved Upgrades to Existing Wells (2007)
Major Lakes
Rail Tracks
Airport Outline
WEST BRAMPTON RESERVOIR AND PUMPING STATION
NEW PUMPING (C) 20711 (2007) 03 - 1975STATION ANDRESERVOIR
NEW PUMPS (P) 16350 (2011) 11 - 1980
Proposed Pumping Station Upgrades (2008-2031)
0.0 1.5 3.0 4.5 6.0 7.5 km

Appendix E
Stormwater System Test Area Calculations

November 14, 2008
FILE
CITY OF BRAMPTON INFRASTRUCTURE CAPACITY REVIEWRESIDENTIAL STORM SEWER SYSTEM TEST AREA - Main Street North
City of Brampton Works and Transportation Department, Drawing No. 343:
R=ATB
(mm/hr)
2-year 5-year 10-year 25-year 50-year 100-year
A = 22.1 29.9 35.1 41.6 46.5 51.3
B = -0.714 -0.701 -0.695 -0.691 -0.688 -0.686
City of Brampton Works and Transportation Department, Drawing No. 342:
Inlet time = 10 minutes
Runoff Coefficients = 0.25 (Parks)
0.50 (Single & Semi-Detached)
0.75 (Multiples, Institutional, Industrial)
0.90 (Commercial)
Manning's Roughness Coefficient = 0.013 (concrete pipe)
Storm 1 = 10 -year
Storm 2 = 100 -year
A (Storm 1) = 35.1
B (Storm 1) = -0.695
A (Storm 2) = 51.3
B (Storm 2) = -0.686
upstream invert el. = 200 m (arbitrary)
PRE-INTENSIFICATION
STREET AREA UPSTREAM DOWNSTREAM TOTAL i i Q Q LENGTH SIZE GRADE CAPACITY VEL. TIME
NO. MH INV MH INV IN AREA CONTRI. TOTAL 0.25 0.50 0.75 0.90 A x C IN AREA TOTAL STORM 1 STORM 2 STORM 1 STORM 2 STORM 1 STORM 2
(m) (m) (ha) (ha) (ha) (ha) (ha) (ha) (ha) (min) (min) 10 100 10 100 (m) (mm) (m3/s) (m/s) (min) 10 100
GREENLEAF CRESCENT 4 1 200.0 4 199.5 0.676 100% 0.676 0.676 0.34 10.0 10.0 122 175 0.115 0.165 89.5 375 0.545% 0.130 1.173 1.272 88% 127%
GREENLEAF CRESCENT 5 4 199.5 5 199.5 0.296 100% 0.296 0.296 0.49 11.3 112 162 0.152 0.218 13.4 450 0.344% 0.167 1.052 0.212 91% 130%
GREENLEAF CRESCENT 6 5 199.5 6 199.0 0.502 100% 0.502 0.502 0.74 11.5 111 159 0.227 0.327 89.5 525 0.476% 0.297 1.372 1.087 76% 110%
GREENLEAF CRESCENT 7 6 199.0 7 198.9 0.294 100% 0.294 0.294 0.88 12.6 104 150 0.256 0.368 47.7 525 0.348% 0.254 1.173 0.678 101% 145%
GREENLEAF CRESCENT 8 3 200.0 7 198.9 0.803 100% 0.803 0.803 0.40 10.0 10.0 122 175 0.136 0.196 107.9 450 1.055% 0.293 1.843 0.975 46% 67%
OUTLET 7 198.9 8 198.3 1.29 13.2 100 145 0.358 0.517 18.4 525 2.924% 0.736 3.401 0.090 49% 70%
POST-INTENSIFICATION
STREET AREA UPSTREAM DOWNSTREAM TOTAL i i Q Q LENGTH SIZE GRADE CAPACITY VEL. TIME
NO. MH INV MH INV IN AREA CONTRI. TOTAL 0.25 0.50 0.75 0.90 A x C IN AREA TOTAL STORM 1 STORM 2 STORM 1 STORM 2 STORM 1 STORM 2
(m) (m) (ha) (ha) (ha) (ha) (ha) (ha) (ha) (min) (min) 10 100 10 100 (m) (mm) (m3/s) (m/s) (min) 10 100
GREENLEAF CRESCENT 4 1 200.0 4 199.5 0.676 100% 0.676 0.676 0.34 10.0 10.0 122 175 0.115 0.165 89.5 375 0.545% 0.130 1.173 1.272 88% 127%
GREENLEAF CRESCENT 5 4 199.5 5 199.5 0.296 100% 0.296 0.296 0.60 11.3 112 162 0.189 0.271 13.4 450 0.344% 0.167 1.052 0.212 113% 162%
GREENLEAF CRESCENT 6 5 199.5 6 199.0 0.623 100% 0.623 0.193 0.43 1.09 11.5 111 159 0.335 0.482 89.5 525 0.476% 0.297 1.372 1.087 113% 162%
GREENLEAF CRESCENT 7 6 199.0 7 198.9 0.394 100% 0.394 0.06 0.334 1.42 12.6 104 150 0.410 0.591 47.7 525 0.348% 0.254 1.173 0.678 162% 233%
GREENLEAF CRESCENT 8 3 200.0 7 198.9 0.803 100% 0.803 0.803 0.40 10.0 10.0 122 175 0.136 0.196 107.9 450 1.055% 0.293 1.843 0.975 46% 67%
OUTLET 7 198.9 8 198.3 1.82 13.2 100 145 0.507 0.732 18.4 525 2.924% 0.736 3.401 0.090 69% 99%
POST-INTENSIFICATION WITH UPSIZED PIPES (10-YEAR POST BACK TO 10-YEAR PRE)
STREET AREA UPSTREAM DOWNSTREAM TOTAL i i Q Q LENGTH SIZE GRADE CAPACITY VEL. TIME
NO. MH INV MH INV IN AREA CONTRI. TOTAL 0.00 0.00 0.00 AREA A x C IN AREA TOTAL STORM 1 STORM 2 STORM 1 STORM 2 STORM 1 STORM 2
(m) (m) (ha) (ha) (ha) (ha) (ha) (ha) (ha) (min) (min) 10 100 10 100 (m) (mm) (m3/s) (m/s) (min) 10 100
GREENLEAF CRESCENT 4 1 200.0 4 199.5 0.676 100% 0.676 0.676 0.34 10.0 10.0 122 175 0.115 0.165 89.5 375 0.545% 0.130 1.173 1.272 88% 127%
GREENLEAF CRESCENT 5 4 199.5 5 199.5 0.296 100% 0.296 0.296 0.60 11.3 112 162 0.189 0.271 13.4 525 0.344% 0.252 1.166 0.191 75% 107%
GREENLEAF CRESCENT 6 5 199.5 6 199.0 0.623 100% 0.623 0.193 0.43 1.09 11.5 111 160 0.335 0.483 89.5 600 0.476% 0.424 1.500 0.995 79% 114%
GREENLEAF CRESCENT 7 6 199.0 7 198.9 0.394 100% 0.394 0.06 0.334 1.42 12.5 105 151 0.413 0.595 47.7 750 0.348% 0.657 1.488 0.534 63% 90%
GREENLEAF CRESCENT 8 3 200.0 7 198.9 0.803 100% 0.803 0.803 0.40 10.0 10.0 122 175 0.136 0.196 107.9 450 1.055% 0.293 1.843 0.975 46% 67%
OUTLET 7 198.9 8 198.3 1.82 13.0 102 147 0.514 0.741 18.4 600 2.924% 1.051 3.717 0.082 49% 71%
POST-INTENSIFICATION WITH UPSIZED PIPES (100-YEAR POST BACK TO 10-YEAR PRE)
STREET AREA UPSTREAM DOWNSTREAM TOTAL i i Q Q LENGTH SIZE GRADE CAPACITY VEL. TIME
NO. MH INV MH INV IN AREA CONTRI. TOTAL 0.00 0.00 0.00 AREA A x C IN AREA TOTAL STORM 1 STORM 2 STORM 1 STORM 2 STORM 1 STORM 2
(m) (m) (ha) (ha) (ha) (ha) (ha) (ha) (ha) (min) (min) 10 100 10 100 (m) (mm) (m3/s) (m/s) (min) 10 100
GREENLEAF CRESCENT 4 1 200.0 4 199.5 0.676 100% 0.676 0.676 0.34 10.0 10.0 122 175 0.115 0.165 89.5 450 0.545% 0.211 1.325 1.126 54% 78%
GREENLEAF CRESCENT 5 4 199.5 5 199.5 0.296 100% 0.296 0.296 0.60 11.1 113 163 0.190 0.274 13.4 600 0.344% 0.360 1.275 0.175 53% 76%
GREENLEAF CRESCENT 6 5 199.5 6 199.0 0.623 100% 0.623 0.193 0.43 1.09 11.3 112 161 0.339 0.488 89.5 750 0.476% 0.769 1.740 0.857 44% 63%
GREENLEAF CRESCENT 7 6 199.0 7 198.9 0.394 100% 0.394 0.06 0.334 1.42 12.2 106 153 0.420 0.605 47.7 750 0.348% 0.657 1.488 0.534 64% 92%
GREENLEAF CRESCENT 8 3 200.0 7 198.9 0.803 100% 0.803 0.803 0.40 10.0 10.0 122 175 0.136 0.196 107.9 525 1.055% 0.442 2.043 0.880 31% 44%
OUTLET 7 198.9 8 198.3 1.82 12.7 103 149 0.523 0.753 18.4 750 2.924% 1.906 4.313 0.071 27% 40%
NO. OF HECTARES AREA x STORM CO-EFF. TIME
FLOW 2.78ACi/1000 m3/s PIPE
% FULL
FLOW 2.78ACi/1000 m3/s PIPE
NO. OF HECTARES AREA x STORM CO-EFF. TIME % FULL
FLOW 2.78ACi/1000 m3/s PIPE
NO. OF HECTARES AREA x STORM CO-EFF. TIME % FULL
FLOW 2.78ACi/1000 m3/s PIPE
NO. OF HECTARES AREA x STORM CO-EFF. TIME % FULL

November 14, 2008
FILE
CITY OF BRAMPTON INFRASTRUCTURE CAPACITY REVIEWRESIDENTIAL STORM SEWER SYSTEM TEST AREA - Main Street North
SCENARIO 1 SCENARIO 2
Control 10-year post to 10-year existing Control 100-year post to 10-year existing
Pre-Intensification: Pre-Intensification:
Storm = 10 -year Storm = 10 -year
Allowable Flow (Pre-Intens.) = 0.358 m3/s Allowable Flow (Pre-Intens.) = 0.358 m
3/s
Post-Intensification: Post-Intensification:
Storm = 10 -year Storm = 100 -year
A = 35.1 A = 51.3
B = -0.695 B = -0.686
AC (Calculated) = 1.82 AC (Calculated) = 1.82
Required Storage = 196 m3
Required Storage = 329 m3
Total Area = 2.792 ha Total Area = 2.792 ha
Average Depth = 7 mm Average Depth = 12 mm
Flow Required Flow Required
Time Intensity Proposed Storage Time Intensity Proposed Storage
(min) (mm/hr) (m3/s) (m
3) (min) (mm/hr) (m
3/s) (m
3)
1 604 3.079 163 1 851 4.337 239
2 373 1.902 185 2 529 2.696 280
3 282 1.435 194 3 401 2.041 303
4 231 1.175 196 4 329 1.676 316
5 197 1.006 194 5 282 1.438 324
6 174 0.886 190 6 249 1.269 328
7 156 0.796 184 7 224 1.141 329
8 142 0.726 176 8 204 1.041 328
9 131 0.669 168 9 189 0.961 325
10 122 0.621 158 10 175 0.894 321
11 114 0.582 147 11 164 0.837 316
12 107 0.547 136 12 155 0.789 310
13 102 0.518 124 13 146 0.746 303
14 97 0.492 112 14 139 0.709 295
15 92 0.469 99 15 133 0.677 286
16 88 0.448 86 16 127 0.647 277
17 84 0.430 73 17 122 0.621 268
18 81 0.413 59 18 117 0.597 258
19 78 0.398 45 19 113 0.575 247
20 75 0.384 31 20 109 0.555 237

Appendix F
Stormwater Drawings

November 14, 2008
FILE

November 14, 2008
FILE
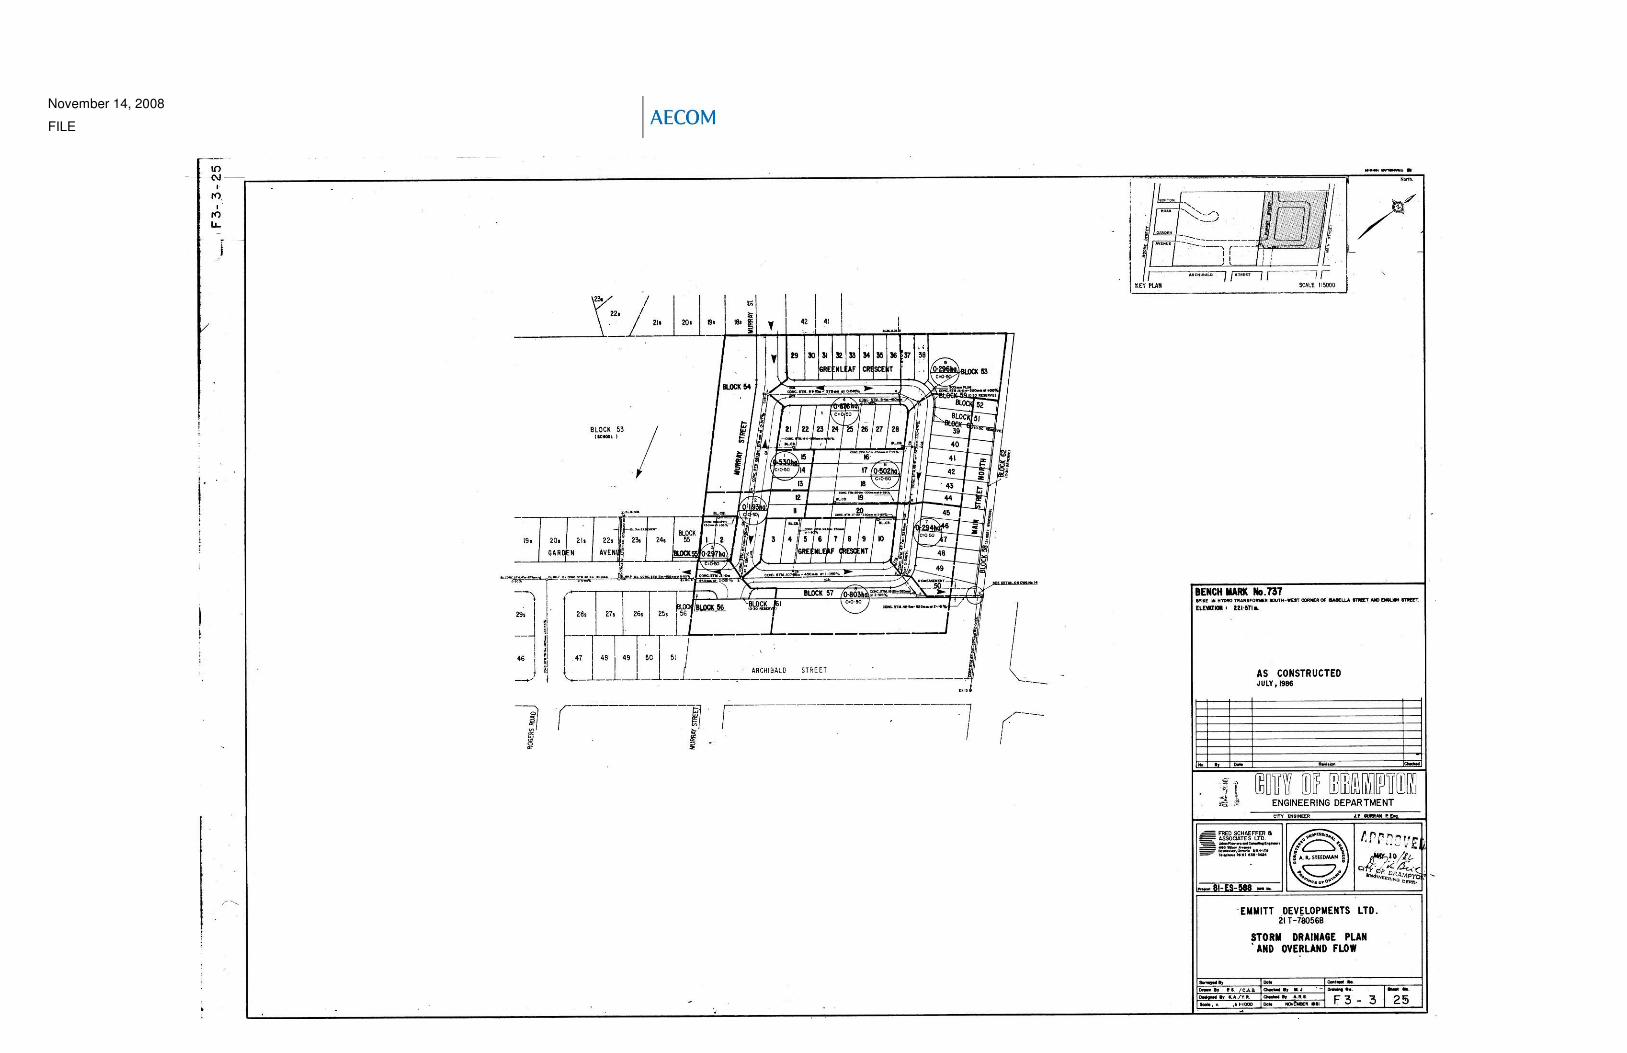
November 14, 2008
FILE