
Forced convection in the wakes of sliding bubblesInfluence of forced convection on solidification...
9
This content has been downloaded from IOPscience. Please scroll down to see the full text. Download details: IP Address: 134.226.8.83 This content was downloaded on 13/12/2016 at 15:34 Please note that terms and conditions apply. Forced convection in the wakes of sliding bubbles View the table of contents for this issue, or go to the journal homepage for more 2016 J. Phys.: Conf. Ser. 745 032117 (http://iopscience.iop.org/1742-6596/745/3/032117) Home Search Collections Journals About Contact us My IOPscience You may also be interested in: Influence of forced convection on solidification and remelting in the developing mushy zone M Wu, A Vakhrushev, A Ludwig et al. Numerical investigation of forced convection of nano fluid flow in horizontal U-longitudinal finned tube heat exchanger S M Qasim, A F A Sahar and A A Firas Analytic study of the temperature profile in a copper bromide laser I P Iliev, S G Gocheva-Ilieva and N V Sabotinov Kinetics modeling of the drying of sunflower stem (Helianthus annuus L.) in a forced convection tunnel R López, M Vaca, H Terres et al. Between inertia and viscous effects: Sliding bubbles beneath an inclined plane C. Dubois, A. Duchesne and H. Caps Sliding bubble dynamics and the effects on surface heat transfer B Donnelly, A J Robinson, Y M C Delauré et al. Experiment on nucleate pool boiling in microgravity by using transparent heating surface – Analysis of surface heat transfer coefficients C Kubota, O Kawanami, Y Asada et al. Frequency dependence of the temperature profile of a copper vapor laser S Behrouzinia and K Khorasani
Transcript of Forced convection in the wakes of sliding bubblesInfluence of forced convection on solidification...
This content has been downloaded from IOPscience. Please scroll down to see the full text.
Download details:
IP Address: 134.226.8.83
This content was downloaded on 13/12/2016 at 15:34
Please note that terms and conditions apply.
Forced convection in the wakes of sliding bubbles
View the table of contents for this issue, or go to the journal homepage for more
2016 J. Phys.: Conf. Ser. 745 032117
(http://iopscience.iop.org/1742-6596/745/3/032117)
Home Search Collections Journals About Contact us My IOPscience
You may also be interested in:
Influence of forced convection on solidification and remelting in the developing mushy zone
M Wu, A Vakhrushev, A Ludwig et al.
Numerical investigation of forced convection of nano fluid flow in horizontal U-longitudinal finned
tube heat exchanger
S M Qasim, A F A Sahar and A A Firas
Analytic study of the temperature profile in a copper bromide laser
I P Iliev, S G Gocheva-Ilieva and N V Sabotinov
Kinetics modeling of the drying of sunflower stem (Helianthus annuus L.) in a forced convection
tunnel
R López, M Vaca, H Terres et al.
Between inertia and viscous effects: Sliding bubbles beneath an inclined plane
C. Dubois, A. Duchesne and H. Caps
Sliding bubble dynamics and the effects on surface heat transfer
B Donnelly, A J Robinson, Y M C Delauré et al.
Experiment on nucleate pool boiling in microgravity by using transparent heating surface – Analysis
of surface heat transfer coefficients
C Kubota, O Kawanami, Y Asada et al.
Frequency dependence of the temperature profile of a copper vapor laser
S Behrouzinia and K Khorasani
Forced convection in the wakes of sliding bubbles
R O’Reilly Meehan1,2, B Donnelly2, T Persoons1, K Nolan2, D BMurray1
1Dept. Mechanical & Manufacturing Engineering, Trinity College Dublin, Ireland2Thermal Management Research Group, Efficient Energy Transfer (ηET ) Department, BellLabs Research, Nokia, Blanchardstown Business & Technology Park, Snugborough Rd, Dublin15, Ireland.
E-mail: [email protected]
Abstract.Both vapour and gas bubbles are known to significantly increase heat transfer rates between
a heated surface and the surrounding fluid, even with no phase change. However, the complexwake structures means that the surface cooling is not fully understood. The current study useshigh speed infra-red thermography to measure the surface temperature and convective heat fluxenhancement associated with an air bubble sliding under an inclined surface, with a particularfocus on the wake. Enhancement levels of 6 times natural convection levels are observed, alongwith cooling patterns consistent with a possible hairpin vortex structure interacting with thethermal boundary layer. Local regions of suppressed convective heat transfer highlight thecomplexity of the bubble wake in two-phase applications.
1. IntroductionTwo phase flows are extremely desirable from a cooling perspective, since they offerextremely high heat transfer coefficients, temperature homogenisation and passive or low powerconsumptions [1]. However, despite extensive recent research, the widespread implementation oftwo phase technologies has yet to occur. This is in part due to the complex nature of the flows,which leads to significant uncertainty regarding the reliability of new two phase technologies[1]. This complexity arises from the coupling between the motion of the gas and liquid phases.Current research on two phase bubbly flow has focused on the effect of bubbles moving againsthorizontal, vertical or inclined surfaces [2, 3, 4, 5, 6, 7]. A key flow configuration for applicationssuch as two-phase shell and tube heat exchangers is the motion of a bubble underneath aheated, inclined surface. Enhanced heat transfer in this configuration has been attributed to theinteraction between the bubble and the thermal boundary layer at the surface [7]. Even withoutphase change, high heat transfer coefficients can be obtained using gas bubbles [3, 5]. However,the surface cooling associated with air bubbles is not fully understood [3].
Freely rising air bubbles can take on different shapes and rise paths depending on theproperties of the bubble and the surrounding fluid, namely the Reynolds, Eotvos, and Mortonnumbers. Typically, oscillations in shape and path triggered by an instability in the bubble wake,which is defined as the region of non-zero vorticity downstream of the bubble [8]. Brucker [9]performed 2-D PIV on ellipsoidal rising bubbles in two 2-D planes, deducing that the structuresin three dimensions formed a chain of interconnected vortex loops of alternate circulation
7th European Thermal-Sciences Conference (Eurotherm2016) IOP PublishingJournal of Physics: Conference Series 745 (2016) 032117 doi:10.1088/1742-6596/745/3/032117
Content from this work may be used under the terms of the Creative Commons Attribution 3.0 licence. Any further distributionof this work must maintain attribution to the author(s) and the title of the work, journal citation and DOI.
Published under licence by IOP Publishing Ltd 1

and orientation. These are also known as hairpin vortices and have also been identified asa mechanism in near-wall turbulence [10] and in the flow field surrounding bluff bodies [11], [12].
Bubbles sliding under an inclined surface differ from rising bubbles in that they onlyexperience the component of the buoyancy force parallel to the surface. This is true untilthe surface inclination angle is increased above a critical angle, at which point they begin tobounce. It is the sliding regime without bouncing that is under consideration here. Maxworthy[13] studied a bubble rising under a flat inclined plate, finding that the terminal sliding velocitydid not scale linearly with Reynolds number or surface inclination angle. A later investigation byPerron et al. [14] showed that this terminal velocity instead had distinct regimes correspondingto different bubble shapes. Cornwell [7] identified the main contributions due to heat transferfrom a vapour bubble as bubble nucleation, liquid disturbance and micro-layer evaporation.Houston and Cornwell [5] showed that the liquid disturbance induced by a sliding gas bubblewith no phase change could account for significant heat transfer at low wall superheats. Qiu &Dhir [15] studied the heat transfer associated with a single vapour bubble as it grew and slidunder a downward facing heated surface. The study found that a vortex located immediatelybehind the bubble enhanced heat transfer from the wall by introducing cooler liquid from thebulk to the surface. This was supported by the 3-D simulations of Li et al. [16]. Donoghue etal. [17] showed that the impact of an air bubble on a horizontal heated surface generated localheat transfer enhancement of up to 18 times natural convection levels.
The current study builds on the recent work of Donnelly et al. [3] and O’Reilly Meehan etal. [2]. Donnelly et al. [3] performed measurements of motion and time-resolved heat transfercoefficient distribution due to a sliding air bubble between 5-9 mm diameter on an inclinedheated surface. Bubbles of this size were found to undergo an undulating motion linked tovortex generation and shedding in the bubble wake. Local heat transfer enhancement severaltimes that of natural convection occurred in small regions downstream of the bubble. O’ReillyMeehan et al. [2] performed time-resolved PIV on the wake of a sliding air bubble of 5-7 mmdiameter in three measurement planes, revealing a near wake that travelled in close associationwith the bubble and a far wake that extended downstream in the form of successive hairpinvortex loops. Fluid was found to separate from the near wake at the local extrema of theundulating bubble path, resulting an a large affected region of fluid that overshot the bubblepath. The current study seeks to extend this understanding by measuring the convective heatflux of an air bubble sliding under a heated inclined surface, performing an in-depth analysis ofthe interactions occurring between the bubble, its associated wake and the surface.
2. ExperimentFigure 1 shows the experimental apparatus and a schematic of the flow under investigation.The experimental apparatus in figure 1 (a) consists of a tilting water tank, a heated thin foiland support structure, a bubble injector, and the infrared camera. The water tank is an opentop glass cube of dimension 400 × 400 × 300 mm3, filled with distilled water. The heatedsurface consists of a 25 µm thick, 130 × 250 mm2 AISI 316 stainless steel foil, manufactured byGoodfellow. The foil is bonded to a pair of copper busbars using thermally conductive epoxy toensure good electrical contact and uniform heat generation. A Lambda GENESYS GEN6-200DC power supply provides 64 amps of constant current to the foil. One of the copper bars isadjustable to tension the foil. On the reverse side of the foil is a window made from sapphireglass, which sits on a ledge 3 mm behind the foil, trapping a small quantity of air. This actsas an infrared transparent insulator, ensuring the majority of the heat generated by the foil istransferred into the water. When heated, the surface provides an approximately constant fluxboundary condition, with the difference between surface and bulk temperatures being Te = 10K.
Bubbles are introduced to the surface by an injector system comprising of an acetal copolymerbox, gastight syringe (model Hamilton 1000 series GASTIGHT, 5 ml), silicone rubber tubing,
7th European Thermal-Sciences Conference (Eurotherm2016) IOP PublishingJournal of Physics: Conference Series 745 (2016) 032117 doi:10.1088/1742-6596/745/3/032117
2

δf.(y=) Ub
T.=.Ts(y)
δT(y)
T.=.T∞
Pump.1
α
Pump.2
PCDAQ
Thermocouples
IR.glass
air.gap
heatedfoil
IR.camera
Injector
Spacer
thermal.b.l.
8000 9000 10000 11000 12000 13000 14000Counts
20
30
40
50
RT
D T
empe
ratu
re [°
C] Trendline
95% CL
Data
liquid.film
(a) (b)
(c)
Figure 1. (a) Experimental set-up, (b) in-situ calibration curve and (c) zooming in on thebubble.
a syringe needle, a syringe pump (NE-1000 from New Era Pump Systems, Inc.) and a rotatingplate. Inside the box, a series of small bubbles are introduced via the syringe pump and the 5mm diameter tubing into a cylindrical bubble chamber, coalescing to form a bubble of knownsize. By rotating a circular plate above this chamber, the bubble is released from the chamber,impacts the surface and slides up into the measurement region. Upon reaching the measurementregion, the bubbles are at terminal velocity and are no longer bouncing.
A FLIR SC6000 infrared camera is used to measure the transient changes in surfacetemperature on the rear of the foil. The camera, which is mounted directly onto the tank,records a 320 × 256 pixel window of a focal plane array (FPA) sensor at 400 fps. The foil iscoated in a 25 µm layer of black paint on the air side in order to provide a known, high emissivity.The calibration of the thermal camera is performed in-situ in order to take the effects of paintemissivity and the sapphire window into account. To ensure accurate temperature control duringcalibration, an open flow loop is formed between the tilting test tank, an external reservoir anda chiller (Grant RC 1400G), which is used to increase the temperature in increments of 1◦Cfrom 15◦C to 50◦C. A certified RTD master probe is used as a temperature reference. Thiscalibration curve is shown in figure 1 (b). Finally, a description of this problem is shown in figure1 (c) by zooming in on the bubble. A liquid film exists between the bubble and surface, whichheavily influences the bubble’s shape and dynamics. As the bubble slides under the surface, thethermal boundary layer on the underside of the surface is disrupted, changing the heat transfermechanism to forced convection.
3. Data reduction & uncertainty analysisTo convert from surface temperature into convective heat flux, an energy balance is performedon the raw temperature data from the IR camera in MATLAB. A Biot number analysis on thefoil and paint layers shows that a lumped capacitance analysis is appropriate in the currentstudy. An energy balance is subsequently performed on a volume of foil of dimensions (i.e.dx× dx× δ), where δ is the foil and paint thickness and dx is width of a pixel on the FPA. Thisis performed on every pixel of the surface temperature plot, yielding:
7th European Thermal-Sciences Conference (Eurotherm2016) IOP PublishingJournal of Physics: Conference Series 745 (2016) 032117 doi:10.1088/1742-6596/745/3/032117
3

q′′conv = q′′gen − q′′cond − q′′rad − (ρfcp,fδf + ρpcp,pδp)∂T
∂t+ (kfδf + kpδp)
(∂2T
∂x2+∂2T
∂y2
)(1)
where kf , kp, ρf , ρp, cp,f and cp,p are the stainless steel and paint thermal conductivity, densityand specific heat capacity, respectively. This equation accounts for the generated heat flux(q′′gen), the one-dimensional conduction through the 3 mm air gap to the IR glass (q′′cond) and theradiation from the surface on the air side (q′′rad). Lateral conduction and heat storage within thefoil and paint layer are also accounted for in equation 1. These terms are solved by applying asecond order central-difference approximation to the spatial derivatives and a central-differenceapproximation to the temporal derivatives. To prevent excess noise, the spatial derivatives areweighted using a Gaussian filter generated from Pascal’s triangle (n = 5) before differentiation.
To find the propagation of errors in the convective heat flux measurement, the Taylor seriesmethod, as described by Coleman & Steele [18], is applied to each term in the foil energy balance.This method takes into account the uncertainties of the curves fitted to the calibration of theIR camera and the thermocouples, the precision of the current measurements and the foil andpaint properties. An additional, covariance term is added to the lateral conduction and theheat storage terms, since these terms involve operations between adjacent pixels on the FPA inspace and time, respectively. The degree of correlation is found by applying an autocorrelationanalysis on the temporal derivatives in the heat storage term and a cross-correlation analysis onthe spatial derivatives in the lateral conduction term. The resultant uncertainties are shown intable 1. These values are consistent with those of Donnelly et al. [3] and Donoghue et al. [17].
Table 1. Absolute and relative uncertainty for the measured thermal data.
Measurement Symbol Absolute Uncertainty Relative Uncertainty [%]
Surface temperature Ts 0.14◦ C –Water temperature T∞ 0.12◦ C –Air temperature Ta 0.15◦ C –Convective heat flux: near wake q′′conv 800 - 1400 W/m2 9 – 11Convective heat flux: far wake q′′conv 340 - 800 W/m2 11 – 20
4. ResultsIn this section, the surface temperature and convective heat flux are presented for bubblesof diameter de = 5.7 and 7.2 mm sliding under a heated surface inclined at α = 30◦ to thehorizontal, at a mean wall superheat of Te ≈ 10K. The temperature plots are expressed interms of the non-dimensional surface temperature ∆T ∗. This is given by ∆T ∗ = Ts−T∞
T0−T∞, where
Ts is the current surface temperature, T0 is the surface temperature with no bubble present andT∞ is the bulk fluid temperature. The convective heat flux is similarly non-dimensionalised and
can be considered as an enhancement ratio of forced to natural convection, q∗ = q′′convq′′nat
. Note that
although the bubble position is not tracked, it can be found based on the motion observed bythe authors in previous work [2, 3]. Reference to the bubble and fluid velocities are also basedon the findings of these earlier studies.
Figure 2 shows the dimensionless surface temperature and enhancement ratio at two instancesin time 0.2 s apart for de = 5.8 mm and 7.2 mm. The bubble forms a “snake”-like cooled region
7th European Thermal-Sciences Conference (Eurotherm2016) IOP PublishingJournal of Physics: Conference Series 745 (2016) 032117 doi:10.1088/1742-6596/745/3/032117
4
sx[mm]
s y[mm]
−20 0 200
20
40
60
80
100
sx[mm]
s y[mm]
−20 0 200
20
40
60
80
100
sx[mm]
s y[mm]
−20 0 200
20
40
60
80
100
∆ T*0.6 0.65 0.7 0.75 0.8 0.85 0.9 0.95 1 1.05
cooling"plume"
bubblelocation
ellipticalregions
sx[mm]
s y[mm]
−20 0 200
20
40
60
80
100
sx[mm]
s y[mm]
−20 0 200
20
40
60
80
100
[]
∆ T*0.6 0.65 0.7 0.75 0.8 0.85 0
sx[mm]
s y[mm]
−20 0 200
20
40
60
80
100
sx[mm]
s y[mm]
−20 0 200
20
40
60
80
100
q*0 1 2 3
sx[mm]
s y[mm]
−20 0 200
20
40
60
80
100
sx[mm]
s y[mm]
−20 0 200
20
40
60
80
100
sx[mm]
s y[mm]
−20 0 200
20
40
60
80
100
q*0 1 2 3 4 5 6
(a)
(e)
(b) (c)
(f) (g) (h)
0 0.1 0.2 0.3 0.4 0.5 0.6 0.7 0.8 0.9 10
0.2
0.4
0.6
0.8
1
∆ T*0.6 0.65 0.7 0.75 0.8 0.85 0.9 0.95 1 1.05
0 0.1 0.2 0.3 0.4 0.5 0.6 0.7 0.8 0.9 10
0.2
0.4
0.6
0.8
1
q*0 1 2 3 4 5 6
(d)
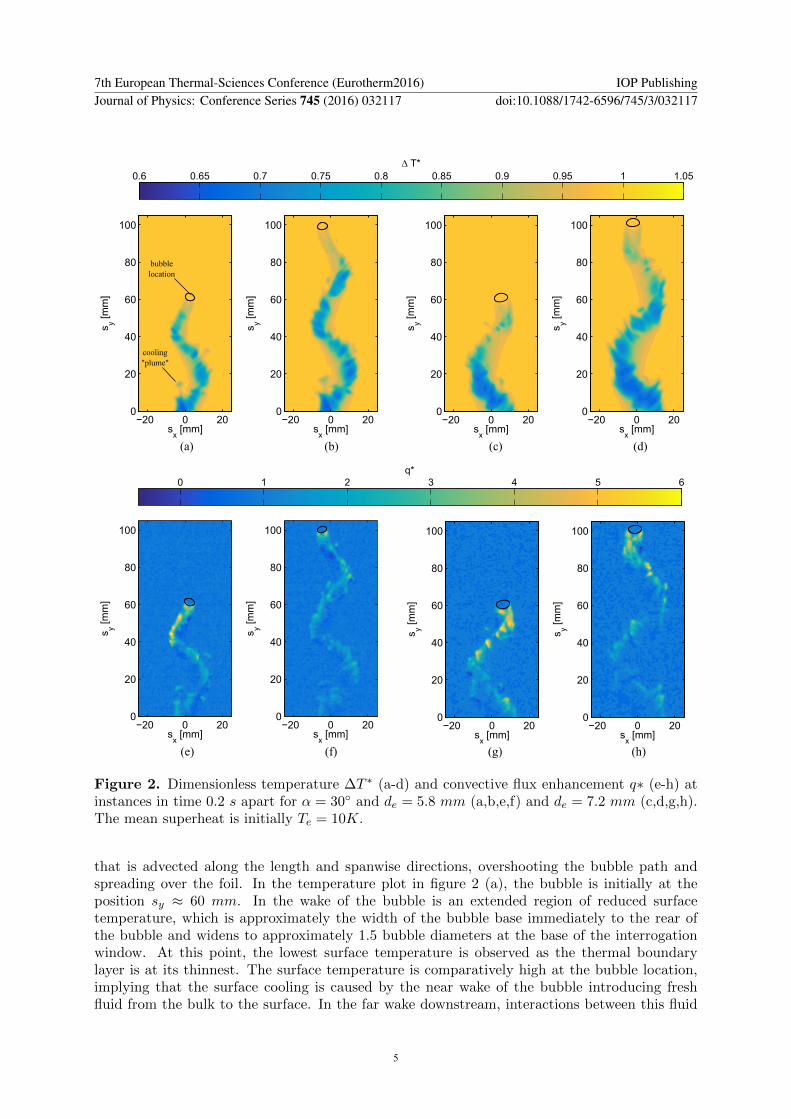
Figure 2. Dimensionless temperature ∆T ∗ (a-d) and convective flux enhancement q∗ (e-h) atinstances in time 0.2 s apart for α = 30◦ and de = 5.8 mm (a,b,e,f) and de = 7.2 mm (c,d,g,h).The mean superheat is initially Te = 10K.
that is advected along the length and spanwise directions, overshooting the bubble path andspreading over the foil. In the temperature plot in figure 2 (a), the bubble is initially at theposition sy ≈ 60 mm. In the wake of the bubble is an extended region of reduced surfacetemperature, which is approximately the width of the bubble base immediately to the rear ofthe bubble and widens to approximately 1.5 bubble diameters at the base of the interrogationwindow. At this point, the lowest surface temperature is observed as the thermal boundarylayer is at its thinnest. The surface temperature is comparatively high at the bubble location,implying that the surface cooling is caused by the near wake of the bubble introducing freshfluid from the bulk to the surface. In the far wake downstream, interactions between this fluid
7th European Thermal-Sciences Conference (Eurotherm2016) IOP PublishingJournal of Physics: Conference Series 745 (2016) 032117 doi:10.1088/1742-6596/745/3/032117
5

and the thermal boundary layer cause secondary cooling structures, such as the “plume” shapedregion of surface cooling highlighted on figure 2 (a).
The convective heat flux enhancement shown in figure 2 (c) reveals regions of local convectiveheat flux enhancement in the near wake that start directly to the rear of the bubble andcan extend over 4-5 bubble diameters downstream. Typically, large convective heat transfercorresponds to regions with a high fluid velocity in the wake, although heat flux enhancementis also observed in the slow-moving far wake. At the bubble, the convective heat transfer formsa triangular-shaped region that starts at the bubble major axes. Downstream of the bubble,local heat flux enhancements of up to 6 times natural convection levels are visible on the outsideof the wake structure. The regions of maximum convective cooling take the form of small,approximately elliptical locations within the wake structure. Further downstream in the farwake, the heat flux has reduced to ≈ 2.5 times that of natural convection levels at the base ofthe interrogation window. Interestingly, to the rear of the bubble on the inside of its path is aregion of suppressed heat flux, where the local temperature is recovering.
At 0.2 s later (figure 2 (b) and (f)), the surface temperature in the far wake has reducedfurther, although the convective heat transfer has now dropped to under twice that of naturalconvection levels. Note that the convective flux enhancement behind the bubble appears lowerthan that at the first instant in tine. This is due to the increased thickness of the thermalboundary layer at the top of the foil, which reduces the relative enhancement effect. As thecooled region temporally evolves, it is advected up the foil at a significant rate, which is due tothe fluid motion within the thermal boundary later at the surface. In the far wake, the smallerregions of low surface temperature eventually begin to join together into larger elliptical regions,with cooling effects lasting up to 20 seconds after the bubble passage. The specific heat capacityof the water and low wall superheat means that it takes some time for the surface to recoverfrom this thermal depression. Thus, the mode of convective heat flux in the low-velocity farwake reverts to natural convection but remains larger than the base levels due to the bubblehaving introduced cooler fluid to the surface.
The effect of increasing the bubble diameter to 7.23 mm on ∆T ∗ (figure 2 (b) and (c))and q∗ (figure 2 (g) and (h)) is to provide greater fluid advection and a larger affected area ofenhancement, although the level of surface cooling and heat flux enhancement is largely similarto the 5.8 mm test. The greater bulk motion of the fluid leads to higher values of convective fluxin the far wake, while secondary flow features are again visible at the extrema of the bubble path.Note again that the maximum convective heat transfer occurs in small, elliptical packets thatare visible along the outside of the bubble path up to 5 diameters downstream of the bubble.Thus, at a nominal wall superheat of 10◦C, the influence of increasing the bubble volume onsurface temperature is to provide surface cooling over a larger area, rather than decreasing thelocal temperature further.
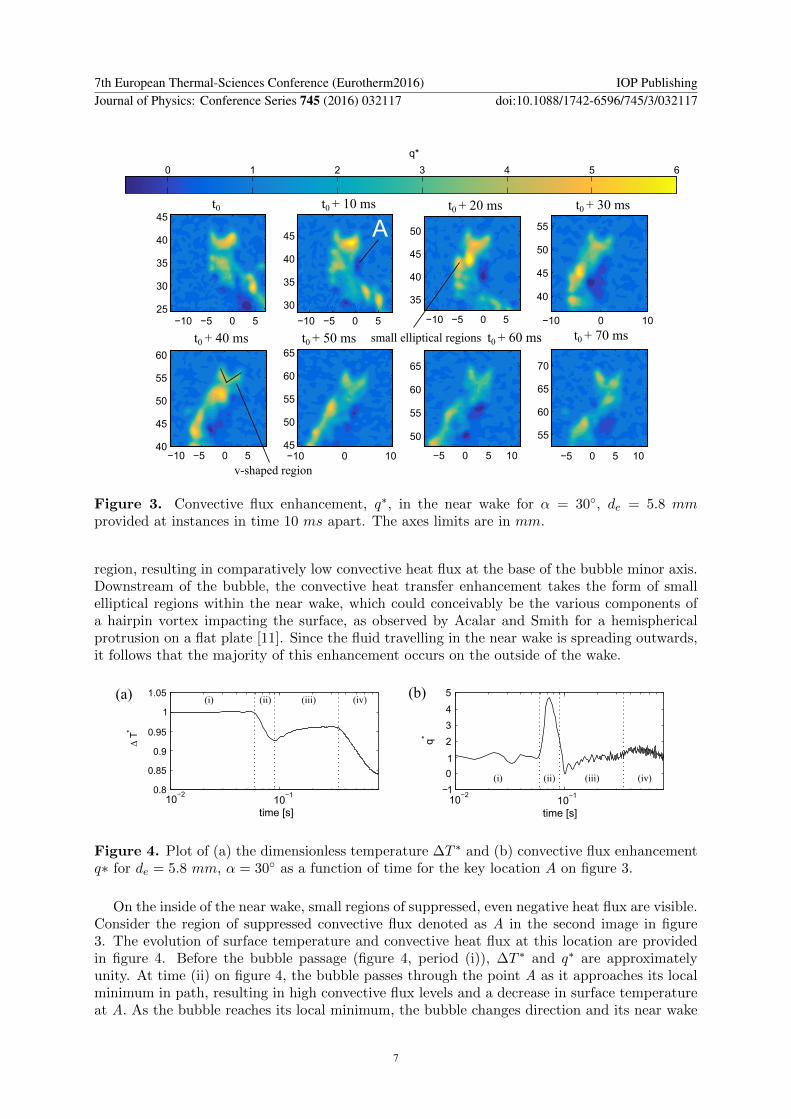
Figure 2 revealed complex, transient regions of both convective heat transfer enhancementand suppression in the near wake of the bubble. Figure 3 focuses on these regions in greaterdetail by plotting the instantaneous convective heat flux in the near wake of the 5.8 mm bubbleat 10 ms intervals. Some trends in the convective heat flux are apparent. In general, withincreasing distance along the surface, the local heat transfer decreases due to the increasingthermal boundary layer thickness. As the bubble traverses the surface, distinct variations occurin the local convective heat flux, which are linked to the path-wise location of the bubble.Directly after an extremum in bubble path, high convective heat flux is observed just downstreamof the bubble in the near wake. As the bubble returns from this extremum to its mean position,there is comparatively little enhancement in the near wake. This behaviour is consistent witha wake structure that sheds from the bubble at the extrema in path, which was shown byBrucker [9] to occur for freely rising bubbles. As was discussed in relation to figure 2, convectiveheat transfer enhancement starts at the bubble major axes and extends back in a v-shaped
7th European Thermal-Sciences Conference (Eurotherm2016) IOP PublishingJournal of Physics: Conference Series 745 (2016) 032117 doi:10.1088/1742-6596/745/3/032117
6
sx[mm]
s y[mm]
−20 0 200
20
40
60
80
100
sx[mm]
s y[mm]
−20 0 200
20
40
60
80
100
q*0 1 2 3
sx[mm]
s y[mm]
−20 0 200
20
40
60
80
100
sx[mm]
s y[mm]
−20 0 200
20
40
60
80
100
sx[mm]
s y[mm]
−20 0 200
20
40
60
80
100
q*0 1 2 3 4 5 6
(c) (d)
−10 −5 0 525
30
35
40
45
q*0 1 2 3 4 5 6
−10 −5 0 5
30
35
40
45
−10 −5 0 5
35
40
45
50
−10 0 10
40
45
50
55
−10 −5 0 540
45
50
55
60
−10 0 1045
50
55
60
65
−5 0 5 10
50
55
60
65
−5 0 5 10
55
60
65
70
A
small elliptical regions
v-shaped region
0 0.1 0.2 0.3 0.4 0.5 0.6 0.7 0.8 0.9 10
0.2
0.4
0.6
0.8
1
q*0 1 2 3 4 5 6
q*
t0 t0 + 10 ms t0 + 20 ms t0 + 30 ms
t0 + 40 ms t0 + 50 ms t0 + 60 ms t0 + 70 ms
Figure 3. Convective flux enhancement, q∗, in the near wake for α = 30◦, de = 5.8 mmprovided at instances in time 10 ms apart. The axes limits are in mm.
region, resulting in comparatively low convective heat flux at the base of the bubble minor axis.Downstream of the bubble, the convective heat transfer enhancement takes the form of smallelliptical regions within the near wake, which could conceivably be the various components ofa hairpin vortex impacting the surface, as observed by Acalar and Smith for a hemisphericalprotrusion on a flat plate [11]. Since the fluid travelling in the near wake is spreading outwards,it follows that the majority of this enhancement occurs on the outside of the wake.
10−1
0
1
2
3
4
5
q*
∆T*
(i)
time [s]
(ii) (iii) (iv)
(i) (ii) (iii) (iv)
(a)
10−20.8
0.85
0.9
0.95
1
1.05
10−1
time [s]10
−2 −1
(b)
Figure 4. Plot of (a) the dimensionless temperature ∆T ∗ and (b) convective flux enhancementq∗ for de = 5.8 mm, α = 30◦ as a function of time for the key location A on figure 3.
On the inside of the near wake, small regions of suppressed, even negative heat flux are visible.Consider the region of suppressed convective flux denoted as A in the second image in figure3. The evolution of surface temperature and convective heat flux at this location are providedin figure 4. Before the bubble passage (figure 4, period (i)), ∆T ∗ and q∗ are approximatelyunity. At time (ii) on figure 4, the bubble passes through the point A as it approaches its localminimum in path, resulting in high convective flux levels and a decrease in surface temperatureat A. As the bubble reaches its local minimum, the bubble changes direction and its near wake
7th European Thermal-Sciences Conference (Eurotherm2016) IOP PublishingJournal of Physics: Conference Series 745 (2016) 032117 doi:10.1088/1742-6596/745/3/032117
7
separates, continuing to move in the negative spanwise direction. Thus, although the bubblepasses through A, its near wake does not. Since there is no cool fluid at the location A, its surfacetemperature recovers, resulting in suppressed (or in some cases, negative) convective heat flux.This behaviour is visible on figure 4 (iii). Finally, a further reduction in surface temperature isobserved where the wake downstream is advected into the region A. This repeats as the bubbletraverses the surface; namely the development of regions of low heat flux at regions where thebubble passed through but its wake does not. Note that this suppressed convective heat transferonly occurs following a period of initial convective heat transfer enhancement. Thus, the overalleffect of the sliding bubble is to increase convective heat transfer and decrease the mean surfacetemperature.
5. ConclusionThis work has presented a study of the convective heat transfer enhancement offered by a slidingbubble by means of high-speed infra-red thermography at a nominal wall superheat of Te = 10◦C.Heat transfer enhancement occurs via bluff body advection and due to the near wake introducingfluid from the bulk to the surface. In the near wake, enhancement levels were observed of up to 6times that of natural convection, with a cooling pattern consistent with that of a hairpin vorteximpacting the surface. Local heat flux measurements also reveal small regions of suppressedheat transfer at locations through which the bubble, but not its wake, passes. Thus, althoughsliding air bubbles increase convective heat transfer rates (in this study, local enhancementsfrom 2kW/mK to 12 kW/mK were observed for both diameters), the interaction between thebubble wake and the thermal boundary layer is complex and warrants further investigation.
AcknowledgementsThis research is supported by the Irish Research Council under its Enterprise Partnershipscheme, grant number EPSPG/2012/323, in association with Bell Labs Ireland. Bell LabsIreland would like to thank the Industrial Development Agency (IDA) Ireland for their financialsupport.
References[1] Robinson A J 2009 Components and Packaging Technologies, IEEE Transactions on 32 347–357[2] O’Reilly Meehan R, Donnelly B, Persoons T and Murray D B 2016 Int. J. of Multiphase Flow 84 145–154[3] Donnelly B, O’Reilly Meehan R, Nolan K and Murray D B 2015 Int. J. of Heat and Mass Transfer 91
532–542[4] Donoghue D, Donnelly B and Murray D B 2012 J. of Enhanced Heat Transfer 19[5] Houston S and Cornwell K 1996 Int. J. of Heat and Mass Transfer 39 211–214[6] Yan Y, Kenning D, Grant I and Cornwell K 1995 Inst. of Mech. Engineers Conf. Pub. vol 2 pp 295–295[7] Cornwell K 1990 Int. J. of Heat and Mass Transfer 33 2579–2584[8] Fan L and Tsuchiya K 1990 Bubble wake dynamics in liquids and liquid-solid suspensions (Butterworth-
Heinemann Stoneham)[9] Brucker C 1999 Phys. of Fluids 11 1781
[10] Adrian R and Liu Z 2002 J. of Visualization 5 9–19[11] Acarlar M and Smith C 1987 J. of Fluid Mech. 175 1–83[12] Stewart B, Thompson M, Leweke T and Hourigan K 2010 J. of Fluid Mech. 643 137–162[13] Maxworthy T 1991 J. of Fluid Mech. 229 659–674[14] Perron A, Kiss L and Poncsak S 2006 Int. J. of Multiphase Flow 32 606–622[15] Qiu D and Dhir V 2002 Exp. Thermal and Fluid Science 26 605–616[16] Li D, Manickam S and Dhir V 2005 ASME Summer Heat Transfer Conf., San Francisco[17] Donoghue D, Albadawi A, Delaure Y, Robinson A and Murray D B 2014 Int. J. of Heat and Mass Transfer
71 439 – 450[18] Coleman H W and Steele W G 2009 Experimentation, validation, and uncertainty analysis for engineers
(John Wiley & Sons)
7th European Thermal-Sciences Conference (Eurotherm2016) IOP PublishingJournal of Physics: Conference Series 745 (2016) 032117 doi:10.1088/1742-6596/745/3/032117
8


