Force Measurement - Best load cell calibration practices
48
Best Practices For Force Measurement Common Measurement Errors, and Challenges on CMC uncertainty for Force Measurements Copyright Morehouse 2016 1
-
Upload
henry-zumbrun -
Category
Science
-
view
147 -
download
4
Transcript of Force Measurement - Best load cell calibration practices
Copyright Morehouse 2016 1
Best Practices For Force Measurement
Common Measurement Errors, and Challenges on CMC uncertainty for Force Measurements
Copyright Morehouse 2016 2
Best Practices For Force Measurement
Best measurement practice is talking to the customer and replicating via
calibration, how the equipment is being used
Best Practices For Force Measurement
Henry Zumbrun II, President Morehouse Instrument Company1742 Sixth AveYork, PA 17403PH: 717-843-0081 web: www.mhforce.cominfo: [email protected]
3
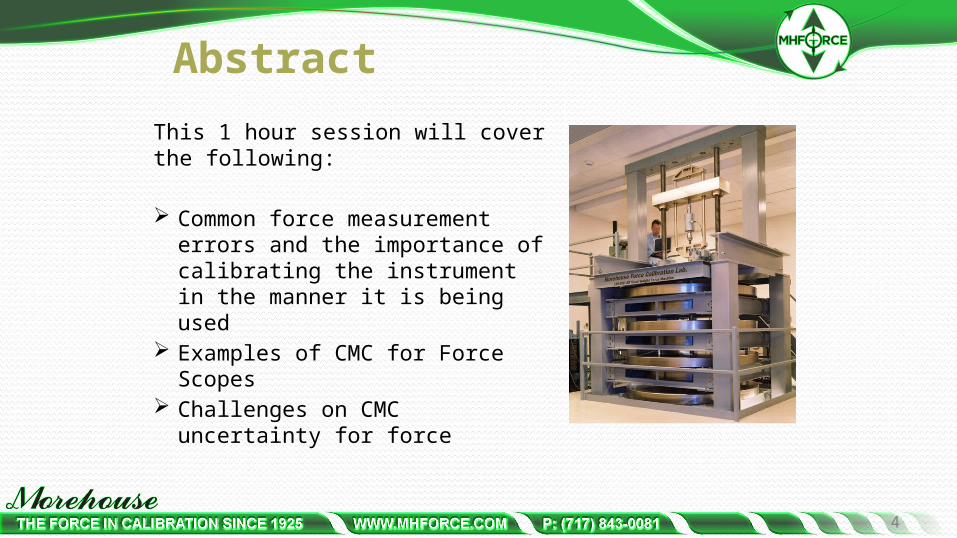
AbstractThis 1 hour session will cover the following:
Common force measurement errors and the importance of calibrating the instrument in the manner it is being used
Examples of CMC for Force Scopes Challenges on CMC uncertainty
for force
4
5
Documentation→ISO/IEC 17025 , 5.4.1 – The laboratory shall use the appropriate methods and procedures for all tests and/or calibrations within its scope.
Importance:• The calibration must be performed using an acceptable and agreed upon
calibration method or procedure (Contract Review). The results must be provided in a report with necessary information.
What could go wrong?:• The reference laboratory may only check the calibration procedure and not
mention the adapters used to perform the calibration.• Even the ASTM E74 standard is an incomplete calibration procedure and does
not address measurement errors associated with the use of different calibration fixtures. This is significant source of error and variability between labs that adhere to ASTM E74-13a or other standards

6
ISO 376: 2011
ISO 376 recognizes the importance of adapters in reproducibility conditions of the measurement. Proper adaptor use in accordance with ISO 376 Annex A, helps ensure the reliability of reported measurements. Note: Annex A is not a requirement for labs to adhere to.
A.4 Loading fittingsA.4.1 General• Loading fittings should be designed in such a way that the line of force application is not
distorted. As a rule, tensile force transducers should be fitted with two ball nuts, two ball cups and, if necessary, with two intermediate rings, while compressive force transducers should be fitted with one or two compression pads.
7
Competence and Measurement ErrorExamples of Competency include:
Using proper adaptors when calibrating force instruments. Improper adaptors can produce errors 10-20 times that of manufacturer’s stated accuracy.
Proper alignment of UUT (Unit Under Test), adaptors, and proper methods for loading threads. Misalignment, different hardness of adaptors, and thread loading versus shoulder loading, contribute to a decrease in the repeatability of measurement results, resulting in additional measurement error.
Repeatability and Reproducibility Tests, as well as, Proficiency Tests are good methods for detecting measurement errors.
8
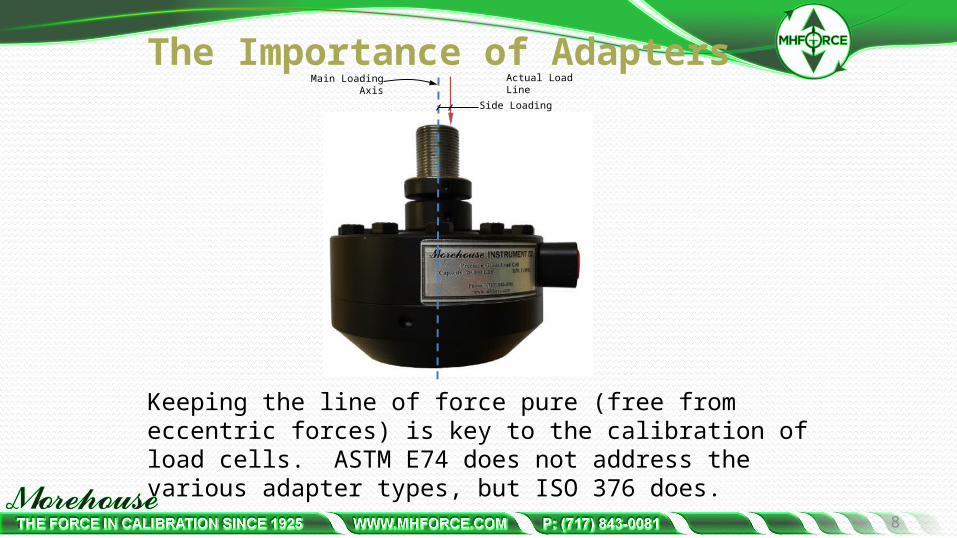
Keeping the line of force pure (free from eccentric forces) is key to the calibration of load cells. ASTM E74 does not address the various adapter types, but ISO 376 does.
Main Loading Axis
Actual Load Line
Side Loading
The Importance of Adapters
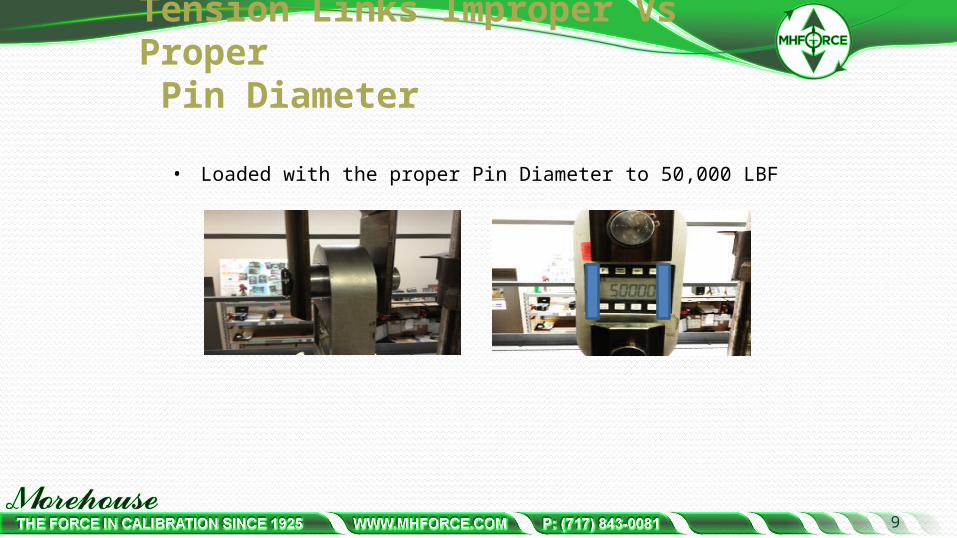
• Loaded with the proper Pin Diameter to 50,000 LBF
9
Tension Links Improper Vs Proper Pin Diameter
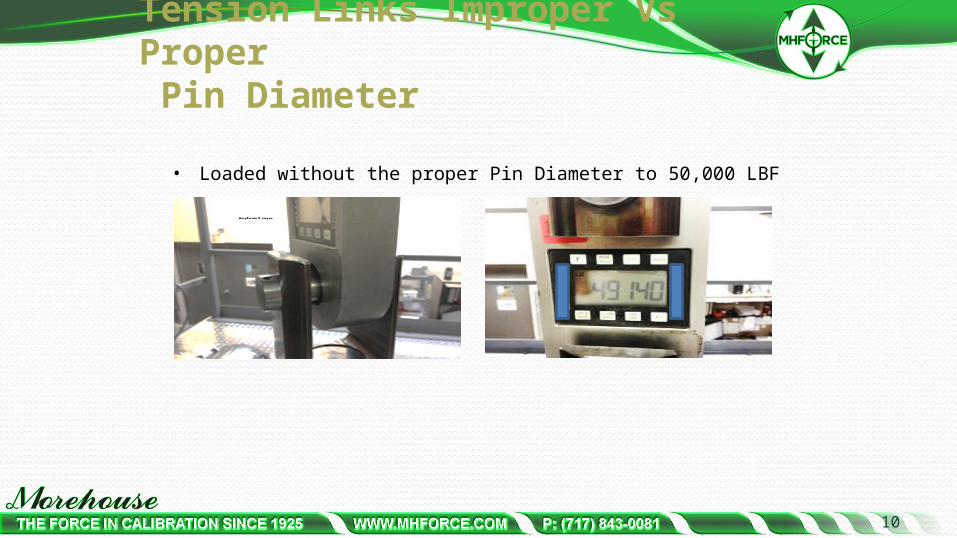
• Loaded without the proper Pin Diameter to 50,000 LBF
10
Tension Links Improper Vs Proper Pin Diameter
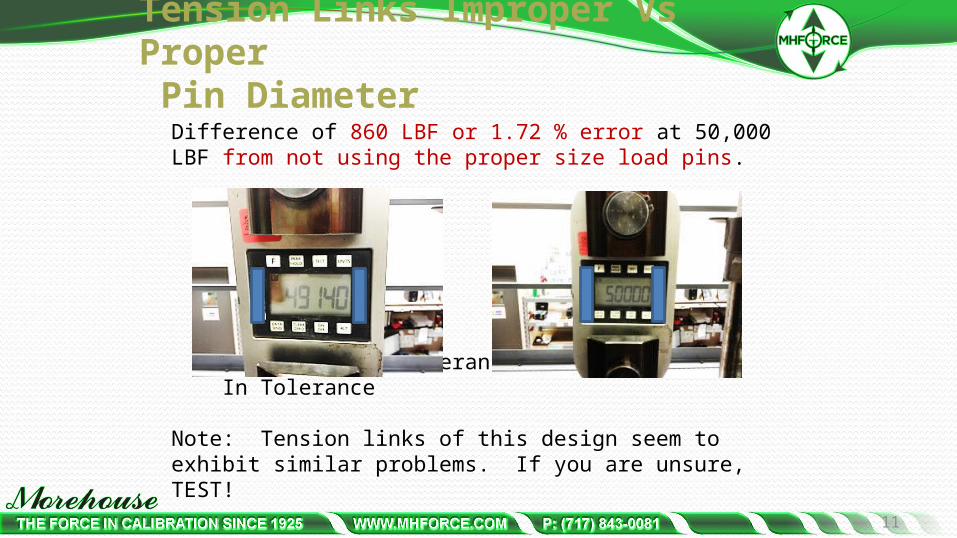
Tension Links Improper Vs Proper Pin Diameter
Difference of 860 LBF or 1.72 % error at 50,000 LBF from not using the proper size load pins.
Out of Tolerance Versus In Tolerance
Note: Tension links of this design seem to exhibit similar problems. If you are unsure, TEST!
11

Misalignment Demonstrating 0.752 % error
12
Misalignment on S-beam
Output in mV/V Aligned in machine
-1.96732 mV/V
Output in mV/V Slightly misaligned in machine
-1.98211 mV/V

Misalignment Demonstrating 0.752 % Error
13
Misalignment on 10,000 LBF S-beam
Output in mV/V Aligned in machine
-1.96732 mV/VExpanded Uncertainty 9.95 LBF
Output in mV/V Slightly misaligned in machine
-1.98211 mV/VExpanded Uncertainty 85.0 LBF

14
Misalignment S-Beam versus Shear web cell
S-BEAM WITH 0.75 % MISALIGNMNET ERROR VS MOREHOUSE WITH 0.0022 % ERROR MOREOUSE 10000 LBF SERIAL NO EXAMPLE
% Force Applied COMBINED UNCERTAINTY FOR K=22.00% 200 0.20836% 0.417 LBF
10.00% 1000 0.04179% 0.418 LBF20.00% 2000 0.02108% 0.422 LBF30.00% 3000 0.01426% 0.428 LBF40.00% 4000 0.01091% 0.436 LBF50.00% 5000 0.00894% 0.447 LBF60.00% 6000 0.00766% 0.460 LBF70.00% 7000 0.00677% 0.474 LBF80.00% 8000 0.00613% 0.490 LBF90.00% 9000 0.00565% 0.508 LBF100.00% 10000 0.00527% 0.527 LBF
S-BEAM 10000 LBF SERIAL NO EXAMPLE
% Force Applied COMBINED UNCERTAINTY FOR K=22.00% 200 0.89076% 1.782 LBF
10.00% 1000 0.86705% 8.671 LBF20.00% 2000 0.86630% 17.326 LBF30.00% 3000 0.86616% 25.985 LBF40.00% 4000 0.86612% 34.645 LBF50.00% 5000 0.86609% 43.305 LBF60.00% 6000 0.86608% 51.965 LBF70.00% 7000 0.86607% 60.625 LBF80.00% 8000 0.86607% 69.286 LBF90.00% 9000 0.86607% 77.946 LBF100.00% 10000 0.86606% 86.606 LBF

15
Different Hardness of Top Adaptors
Example: A customer brought in a 1,000,000 LBF load cell for calibration. Morehouse performed a calibration. The output of the load cell was recorded as 1,500 LBF higher than the previous calibration for a force applied 1,000,000 LBF.
Is this a stability issue, or an adaptor issue? After calling the customer, we were informed a new top loading block was supplied
with this load cell for the current calibration. When we told them what was happening, they sent the original top loading block. When tested, the original block resulted in an output of 1,000,180 LBF when loaded to 1,000,000 LBF.
When using the new adaptor and figuring the measurement error between the different top blocks (adaptors), Expanded Uncertainty would have increased from 269 LBF with original top adaptor to 1,490 LBF using the newly fabricated adaptor.
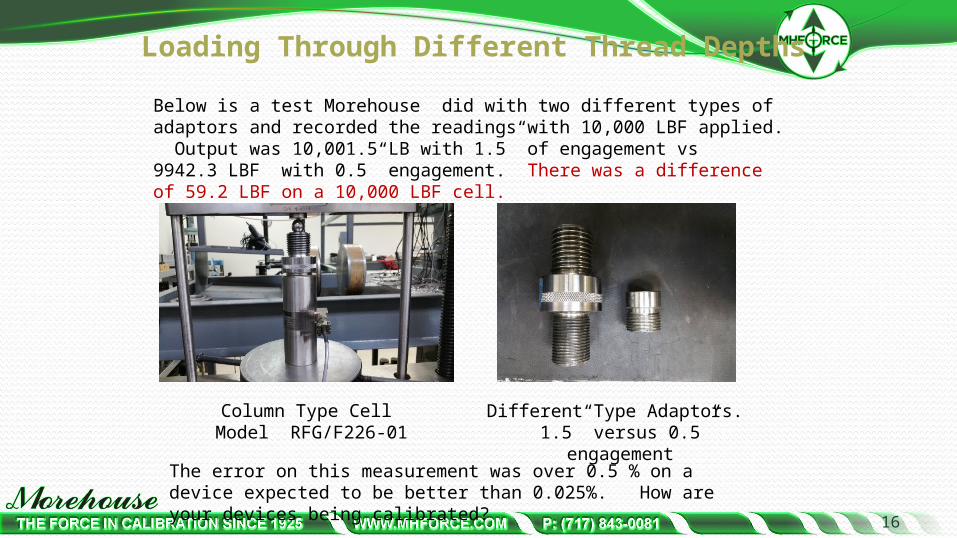
Loading Through Different Thread Depths
16
Below is a test Morehouse did with two different types of adaptors and recorded the readings with 10,000 LBF applied. Output was 10,001.5 LB with 1.5” of engagement vs 9942.3 LBF with 0.5” engagement. There was a difference of 59.2 LBF on a 10,000 LBF cell.
Column Type Cell Model RFG/F226-01
Different Type Adaptors. 1.5” versus 0.5” engagement
The error on this measurement was over 0.5 % on a device expected to be better than 0.025%. How are your devices being calibrated?
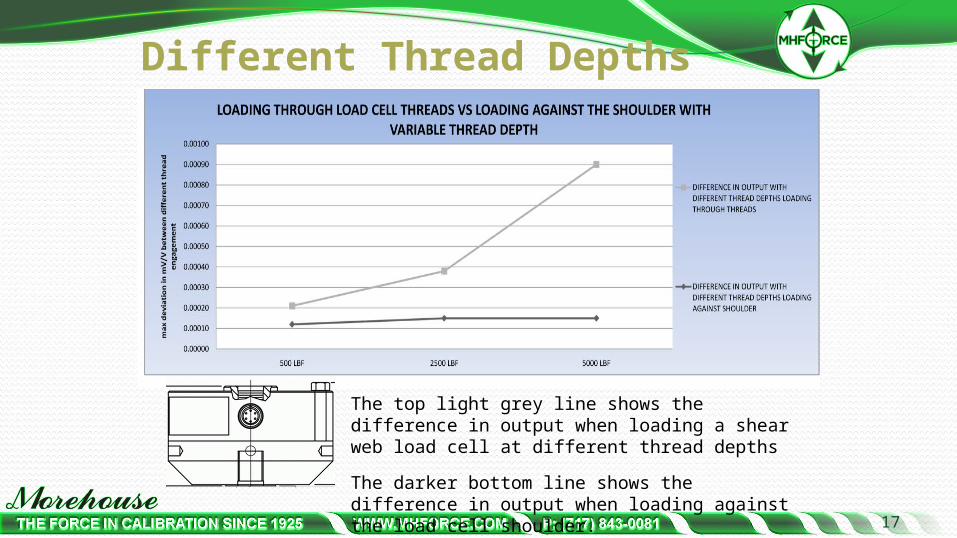
Different Thread Depths
17
The top light grey line shows the difference in output when loading a shear web load cell at different thread depths
The darker bottom line shows the difference in output when loading against the load cell shoulder.
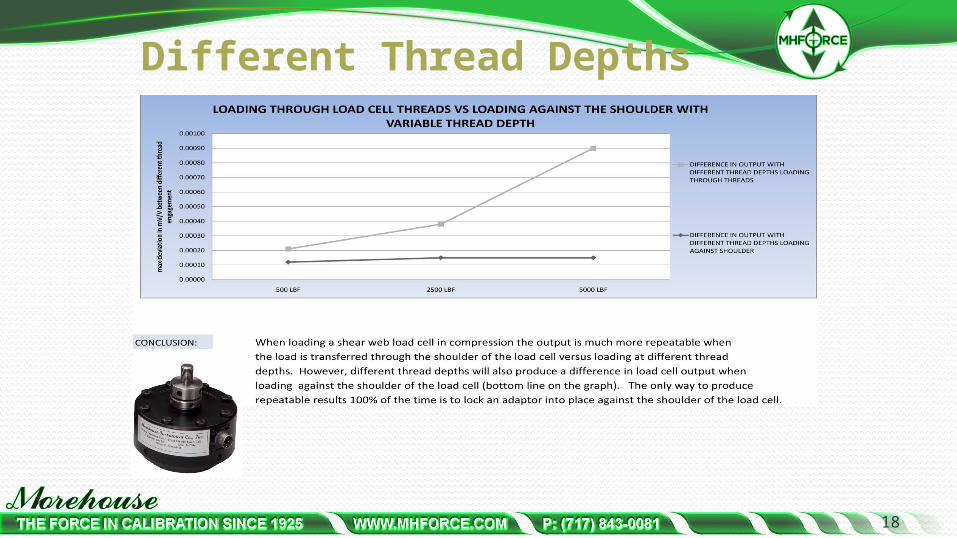
Different Thread Depths
18

19
ALUMINUM LOAD CELL OUTPUT USING DIFFERENT COMPRESSION ADAPTERS LOADED TIGHT AGAINST THE SHOULDER
Force Applied Adapter 1 Adapter 2 Adapter 3 Max Error MaxReadings Readings Readings Between Adapters % Error
600 595.4 598.8 605.6 10.2 1.70%1200 1191.2 1196.4 1205.1 13.9 1.16%1800 1787.4 1793.4 1802.7 15.3 0.85%2400 2383.2 2390.3 2399.7 16.5 0.69%3000 2979.4 2987.1 2996.7 17.3 0.58%
Note: This test was done on Aluminum type Shear Web Cell. Steel cells behave much differently. Aluminum cells are usually from 100 LBF - 3,000 LBF
Aluminum Load Cell Top Fixture Test
600 1200 1800 2400 3000Adapter 1 0.77% 0.74% 0.70% 0.70% 0.69%Adapter 2 0.20% 0.30% 0.37% 0.41% 0.43%Adapter 3 0.92% 0.42% 0.15% 0.01% 0.11%
0.00%
0.10%
0.20%
0.30%
0.40%
0.50%
0.60%
0.70%
0.80%
0.90%
1.00%
Erro
r Per
cent
age
from
nom
inal
Different Top Adapter Test on a 3K Aluminum Load Cell

Multi - Column Load Cell
• Error associated with installing a non flat base on a multi-column cell. This is an actual test result we observed on a Revere multi-column cell.
20
Non Flat Base Flat Base
Maximum Error Maximum Error
Force Applied In Rotation In Rotation
LBF LBF
30000 12 4
150000 136 24
300000 342 68
% error % error
30000 0.040% 0.013%
150000 0.091% 0.016%
300000 0.114% 0.023%
21
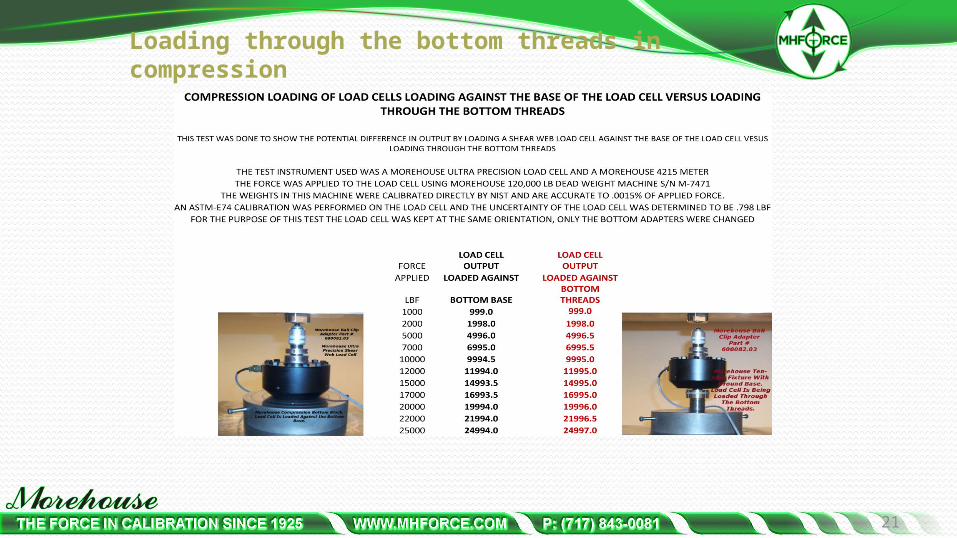
Loading through the bottom threads in compression
22
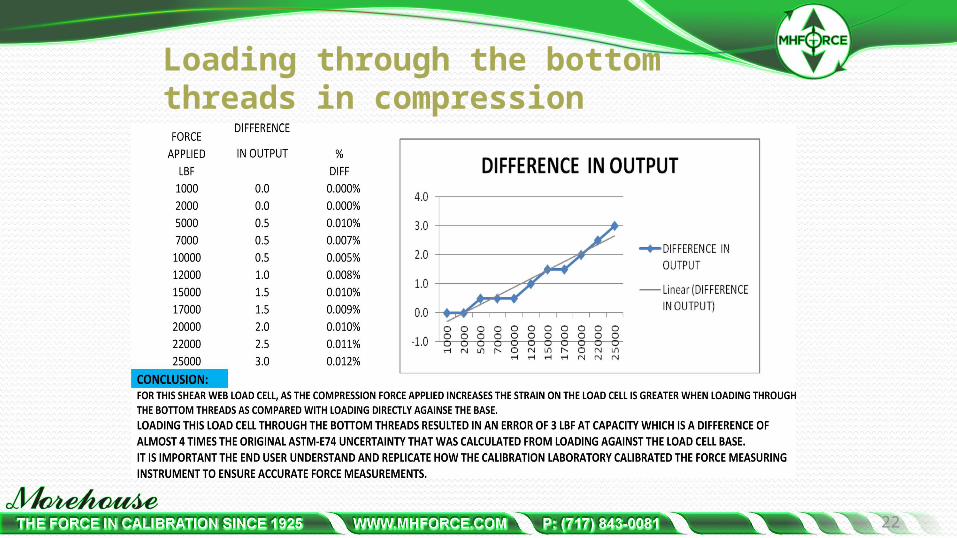
Loading through the bottom threads in compression
23
Loading through the bottom threads in compression
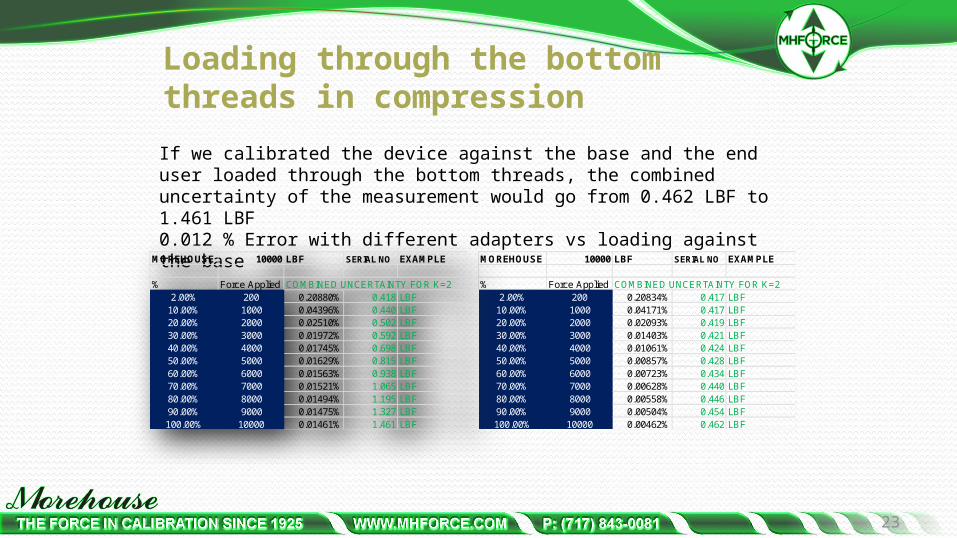
MOREHOUSE 10000 LBF SERIAL NO EXAMPLE
% Force Applied COMBINED UNCERTAINTY FOR K=22.00% 200 0.20834% 0.417 LBF
10.00% 1000 0.04171% 0.417 LBF20.00% 2000 0.02093% 0.419 LBF30.00% 3000 0.01403% 0.421 LBF40.00% 4000 0.01061% 0.424 LBF50.00% 5000 0.00857% 0.428 LBF60.00% 6000 0.00723% 0.434 LBF70.00% 7000 0.00628% 0.440 LBF80.00% 8000 0.00558% 0.446 LBF90.00% 9000 0.00504% 0.454 LBF100.00% 10000 0.00462% 0.462 LBF
If we calibrated the device against the base and the end user loaded through the bottom threads, the combined uncertainty of the measurement would go from 0.462 LBF to 1.461 LBF0.012 % Error with different adapters vs loading against the base
MOREHOUSE 10000 LBF SERIAL NO EXAMPLE
% Force Applied COMBINED UNCERTAINTY FOR K=22.00% 200 0.20880% 0.418 LBF
10.00% 1000 0.04396% 0.440 LBF20.00% 2000 0.02510% 0.502 LBF30.00% 3000 0.01972% 0.592 LBF40.00% 4000 0.01745% 0.698 LBF50.00% 5000 0.01629% 0.815 LBF60.00% 6000 0.01563% 0.938 LBF70.00% 7000 0.01521% 1.065 LBF80.00% 8000 0.01494% 1.195 LBF90.00% 9000 0.01475% 1.327 LBF100.00% 10000 0.01461% 1.461 LBF
24
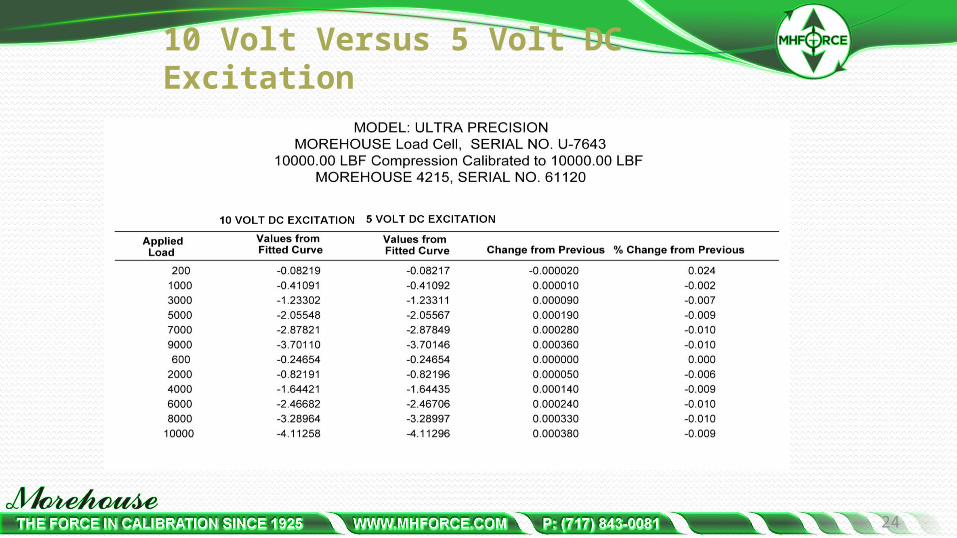
10 Volt Versus 5 Volt DC Excitation
25
Proper Fixtures ConclusionCommunication with the customer is key to address these issues. Unfortunately, this does not always happen. Examples of this scenario are as follows:• 3rd party suppliers• Purchasing Departments• Management who does not care• Large Companies where it is difficult to reach the technician
using the device.
To minimize these errors, the Ideal solution would be to calibrate the device with the customer’s adaptors or have the customer send the appropriate adaptors to the reference lab for calibration.
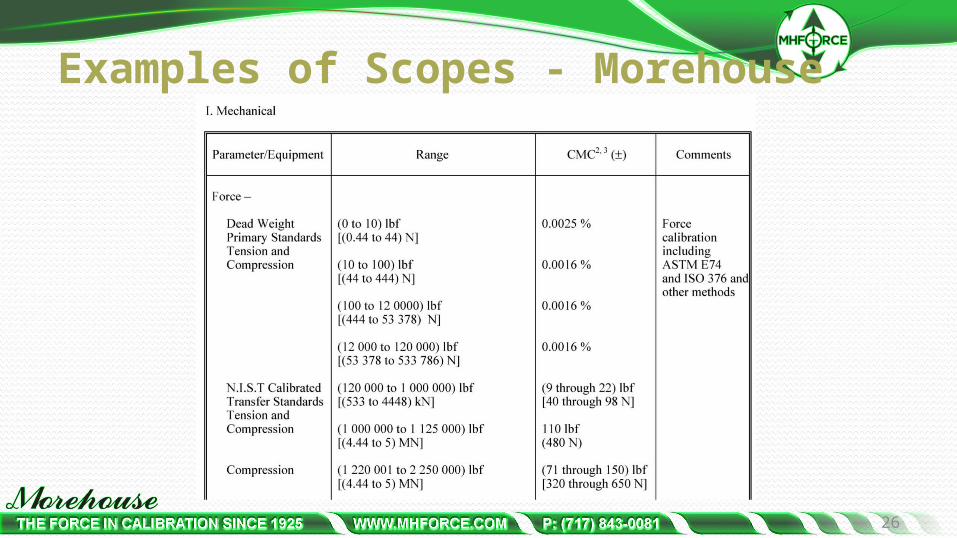
Examples of Scopes - Morehouse
26

Examples of Scopes – Secondary Standards lab
27
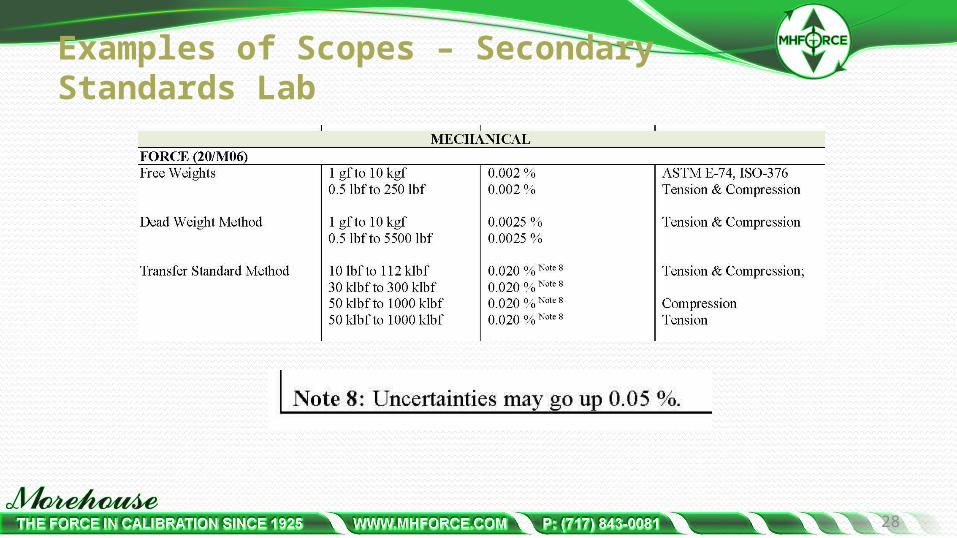
Examples of Scopes – Secondary Standards Lab
28

Examples of Scopes
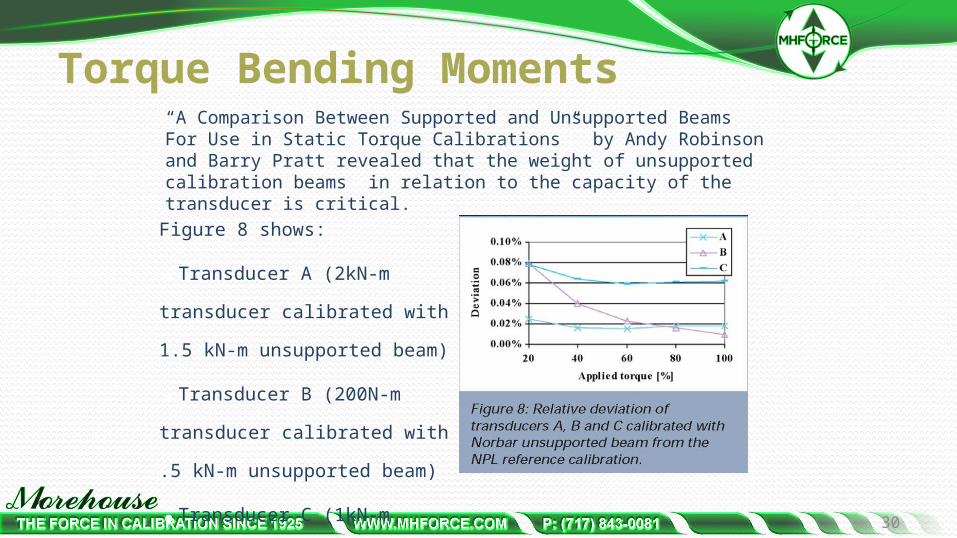
Torque numbers are questionable. Bending moments, unsupported arms, etc.., We have a paper from NPL showing most unsupported arms are no better than 0.02 % at best. The next slide shows some of this information.
29
Torque Bending Moments
Figure 8 shows:
•Transducer A (2kN-m transducer calibrated with 1.5 kN-m unsupported beam)
•Transducer B (200N-m transducer calibrated with .5 kN-m unsupported beam)
•Transducer C (1kN-m transducer calibrated with 1 kN-m unsupported beam)
“A Comparison Between Supported and Unsupported Beams For Use in Static Torque Calibrations” by Andy Robinson and Barry Pratt revealed that the weight of unsupported calibration beams in relation to the capacity of the transducer is critical.
30
Examples of Scopes – Working Standards
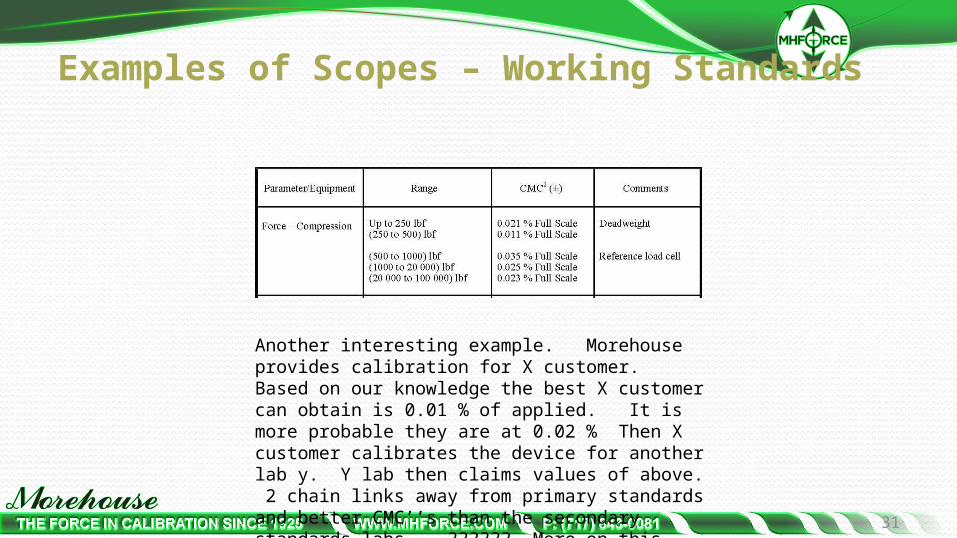
Another interesting example. Morehouse provides calibration for X customer. Based on our knowledge the best X customer can obtain is 0.01 % of applied. It is more probable they are at 0.02 % Then X customer calibrates the device for another lab y. Y lab then claims values of above. 2 chain links away from primary standards and better CMC’’s than the secondary standards labs. ?????? More on this later
31

ASTM E74 Calibration• The Class A or Class AA loading range
cannot be less than the first applied non zero force point (400 x 0.132 = 52.8)
• Per Section 8.6 of ASTM E74-13a “The loading range shall not include forces outside the range of forces applied during the calibration”
• Per Section 7.2.1 of ASTM E74-13a states “In no case should the smallest force applied be below the lower limit of the instrument as defined by the values: 400 x resolution for Class A loading range & 2000 x resolution for Class AA loading range”
32Copyright Morehouse 2016

ASTM E74 Calibration• It is recommended that the lower
force limit be not less than2%( 1⁄50) of the capacity of the instrument.
• Per Section 7.2.1 If the lower limit of the loading range of the device (see 8.6.1) is anticipated to be less than one tenth of the maximum force applied during calibration, then forces should be applied at or below this lower limit
33Copyright Morehouse 2016
ASTM E74 Calibration (Do Not)
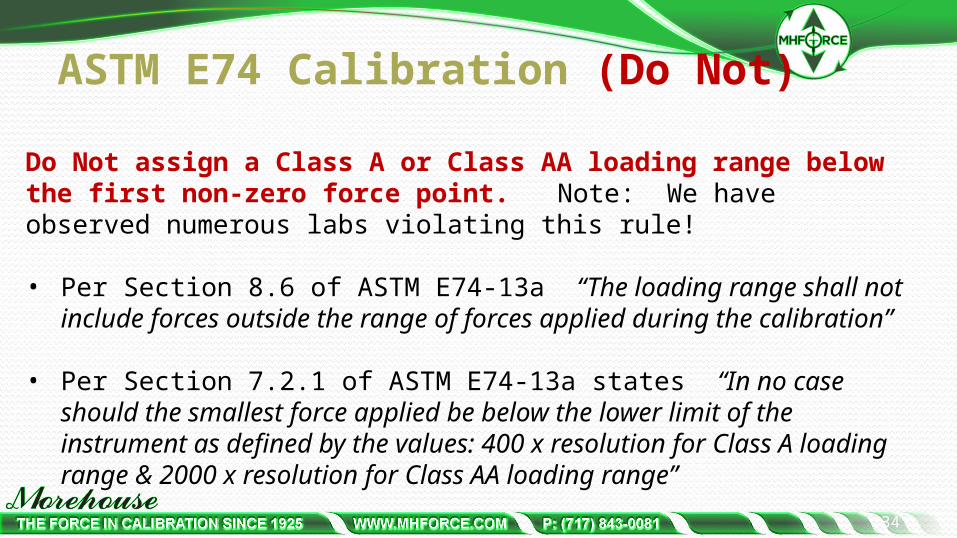
Do Not assign a Class A or Class AA loading range below the first non-zero force point. Note: We have observed numerous labs violating this rule!
• Per Section 8.6 of ASTM E74-13a “The loading range shall not include forces outside the range of forces applied during the calibration”
• Per Section 7.2.1 of ASTM E74-13a states “In no case should the smallest force applied be below the lower limit of the instrument as defined by the values: 400 x resolution for Class A loading range & 2000 x resolution for Class AA loading range”
34
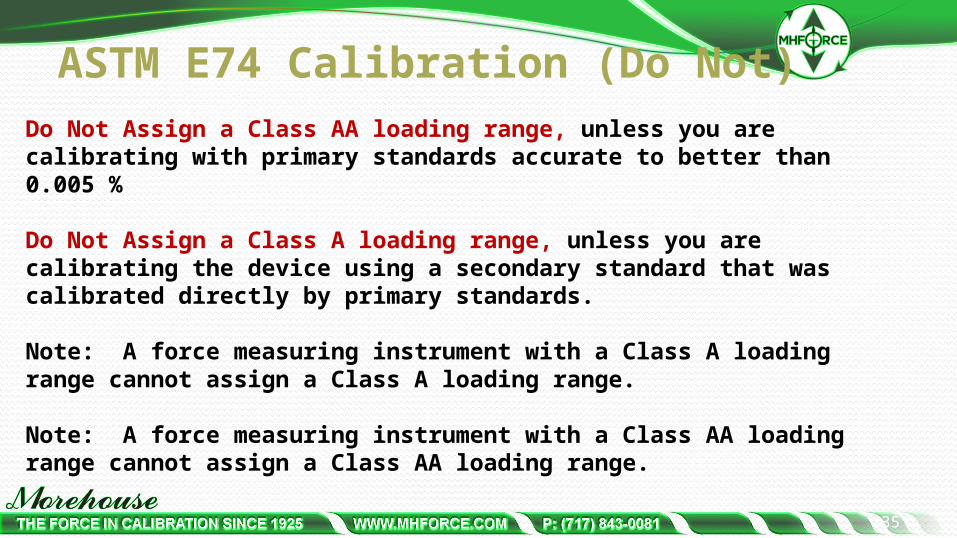
ASTM E74 Calibration (Do Not) Do Not Assign a Class AA loading range, unless you are calibrating with primary standards accurate to better than 0.005 %
Do Not Assign a Class A loading range, unless you are calibrating the device using a secondary standard that was calibrated directly by primary standards.
Note: A force measuring instrument with a Class A loading range cannot assign a Class A loading range.
Note: A force measuring instrument with a Class AA loading range cannot assign a Class AA loading range.
35
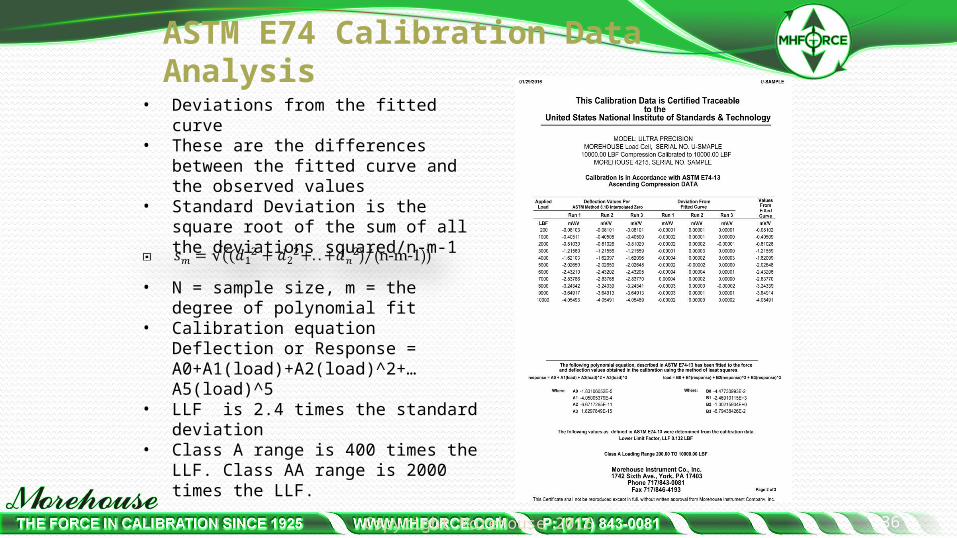
ASTM E74 Calibration Data Analysis
• Deviations from the fitted curve• These are the differences between
the fitted curve and the observed values
• Standard Deviation is the square root of the sum of all the deviations squared/n-m-1
• N = sample size, m = the degree of polynomial fit
• Calibration equation Deflection or Response = A0+A1(load)+A2(load)^2+…A5(load)^5
• LLF is 2.4 times the standard deviation
• Class A range is 400 times the LLF. Class AA range is 2000 times the LLF.
36Copyright Morehouse 2016
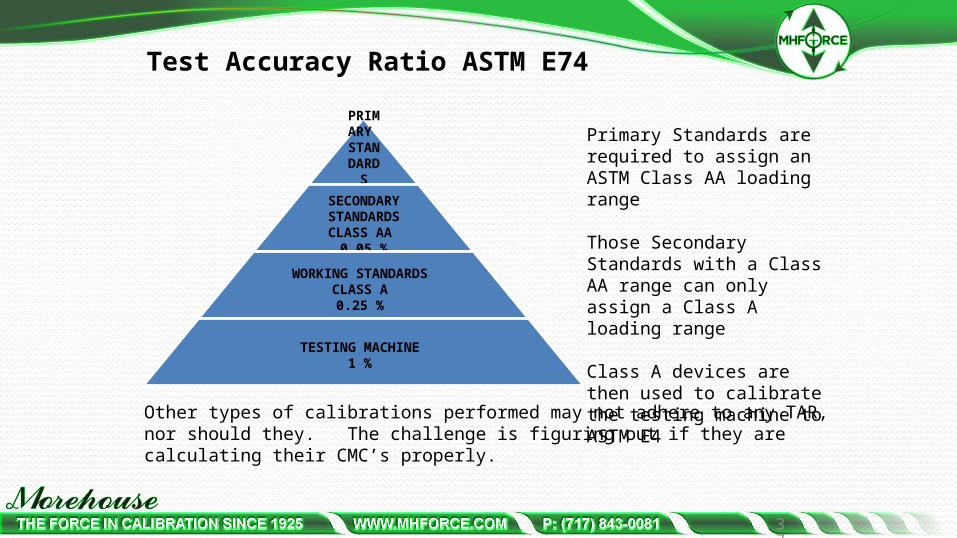
Test Accuracy Ratio ASTM E74 PRIMARY STANDARDS0.005
%SECONDARY STANDARDSCLASS AA
0.05 %
WORKING STANDARDS CLASS A
0.25 %
TESTING MACHINE 1 %
37
Other types of calibrations performed may not adhere to any TAR, nor should they. The challenge is figuring out if they are calculating their CMC’s properly.
Primary Standards are required to assign an ASTM Class AA loading range
Those Secondary Standards with a Class AA range can only assign a Class A loading range
Class A devices are then used to calibrate the testing machine to ASTM E4

38
ASTM E74 STANDARD• Remember Customer X Scope Example

Calibration In Accordance with ASTM E74
Secondary Force Standard – an instrument or mechanism, the calibration of which has been established by comparison with primary force standards.
Criteria for Lower Load Limit
• LLF = 2.4 * STD DEV – This corresponds to a 98.2 % Coverage Factor• Based on LLF or Resolution whichever is higher • Class A 400 times the LLF or resolution• Class AA 2000 times the LLF or resolution
39
CLASS AA? THIS IS NOT CORRECT. CALIBRATION LAB IS USING A LOAD CELL TO ASSIGN A CLASS AA LOADING RANGE
40
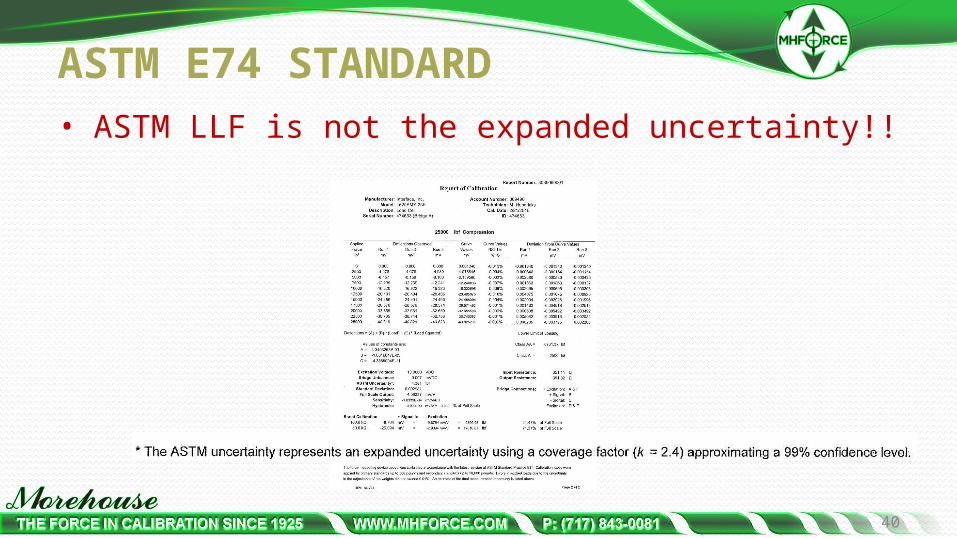
ASTM E74 STANDARD• ASTM LLF is not the expanded uncertainty!!

41
ASTM E74 STANDARD• The “Expanded Uncertainty” is less than the Reference
Standard Uncertainty. How is this possible?

42
Scope Issues→Example:
• An AB acquires a new lab to audit. This lab is performing force calibration and is referencing the ASTM E74 standard using a set of load cells, 100K,50K,10K and 1K. This lab had their standards calibrated by another accredited lab using secondary standards. This lab becomes accredited and continues to perform Class A calibrations.
→What does go wrong!• The reference lab would have to be using primary standards to assign a
Class AA loading range.• The Class AA loading range allows this lab to calibrate devices and assign a
Class A loading range. • In the example above, this lab would only be able to use their load cells for
ASTM E4 (Field Testing) and not ASTM E74 calibrations.
43
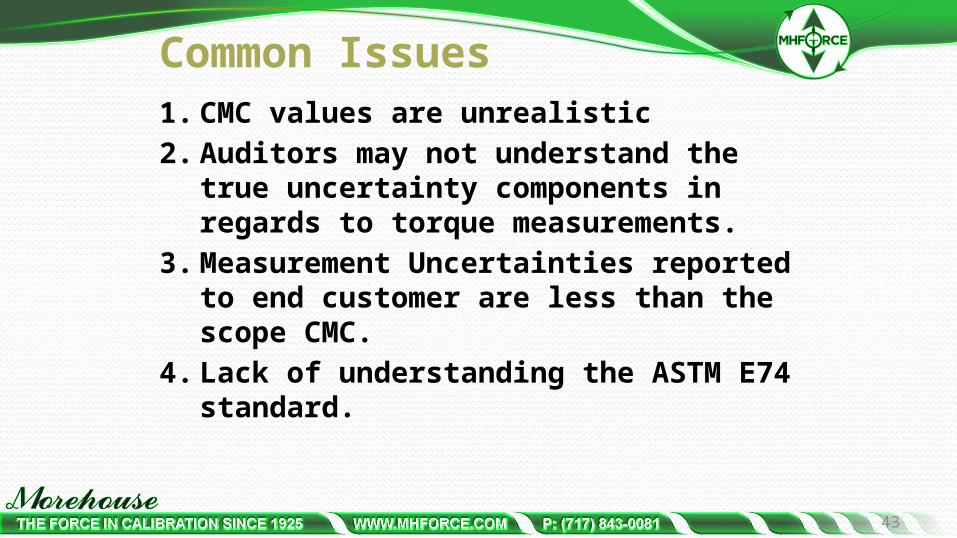
Common Issues1. CMC values are unrealistic 2. Auditors may not understand the true
uncertainty components in regards to torque measurements.
3. Measurement Uncertainties reported to end customer are less than the scope CMC.
4. Lack of understanding the ASTM E74 standard.
44
Calculating Force CMC’sGuidance Documents • NCSLI RP-12 • Lack of proper guidance document for non ASTM E74• ASTM E74 Appendix combined with A2LA R205

45
Force CMC for ASTM E 74 Calibrations
We will need the following:1. Calibration Report for the Device.2. The uncertainty of the
instrument(s) that were used to perform the calibration
3. Calibration History (if available) 4. Manufacturer’s Specification
Sheet5. Error Sources, if known
The end user will then have to conduct the following tests:
1. Repeatability study2. R & R between technicians 3. Complete Proficiency Testing
Requirements
46
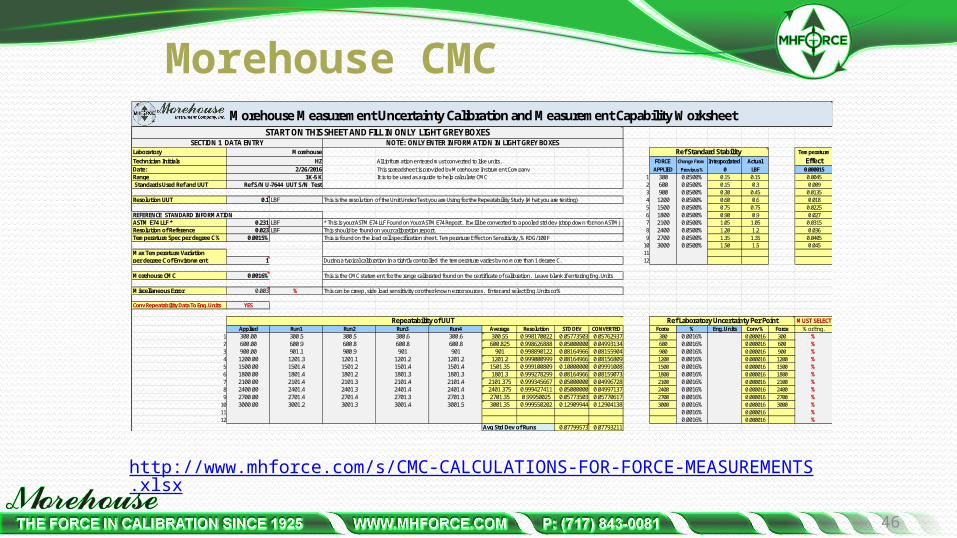
Morehouse CMC
http://www.mhforce.com/s/CMC-CALCULATIONS-FOR-FORCE-MEASUREMENTS.xlsx
Laboratory Temperature Technician Initials All information entered must converted to like units. FORCE Change From Interporlated Actual EffectDate: This spreadsheet is provided by Morehouse Instrument Company APPLIED Previous % 0 LBF 0.000015Range It is to be used as a guide to help calculate CMC 1 300 0.0500% 0.15 0.15 0.0045 Standards Used Ref and UUT 2 600 0.0500% 0.15 0.3 0.009
3 900 0.0500% 0.30 0.45 0.0135Resolution UUT 0.1 LBF This is the resolution of the Unit Under Test you are Using for the Repeatability Study (What you are testing) 4 1200 0.0500% 0.60 0.6 0.018
5 1500 0.0500% 0.75 0.75 0.0225REFERENCE STANDARD INFORMATION 6 1800 0.0500% 0.90 0.9 0.027ASTM E74 LLF * 0.231 LBF 7 2100 0.0500% 1.05 1.05 0.0315Resolution of Reference 0.023 LBF This should be found on your calibration report. 8 2400 0.0500% 1.20 1.2 0.036Temperature Spec per degree C % 0.0015% This is found on the load cell specification sheet. Temperature Effect on Sensitivity, % RDG/100 F 9 2700 0.0500% 1.35 1.35 0.0405
10 3000 0.0500% 1.50 1.5 0.045Max Temperature Variation 11per degree C of Environment 1 During a typical calibration in a tightly controlled the temperature varies by no more than 1 degree C. 12
Morehouse CMC 0.0016% This is the CMC statement for the range calibrated found on the certificate of calibration. Leave blank if entering Eng. Units
Miscellaneous Error 0.003 %
Conv Repeatability Data To Eng. Units YES
MUST SELECTApplied Run1 Run2 Run3 Run4 Average Resolution STD DEV CONVERTED Force % Eng. Units Conv % Force % or Eng.
1 300.00 300.5 300.5 300.6 300.6 300.55 0.998170022 0.05773503 0.05762937 300 0.0016% 0.000016 300 % 2 600.00 600.9 600.8 600.8 600.8 600.825 0.998626888 0.05000000 0.04993134 600 0.0016% 0.000016 600 % 3 900.00 901.1 900.9 901 901 901 0.998890122 0.08164966 0.08155904 900 0.0016% 0.000016 900 % 4 1200.00 1201.3 1201.1 1201.2 1201.2 1201.2 0.999000999 0.08164966 0.08156809 1200 0.0016% 0.000016 1200 % 5 1500.00 1501.4 1501.2 1501.4 1501.4 1501.35 0.999100809 0.10000000 0.09991008 1500 0.0016% 0.000016 1500 % 6 1800.00 1801.4 1801.2 1801.3 1801.3 1801.3 0.999278299 0.08164966 0.08159073 1800 0.0016% 0.000016 1800 % 7 2100.00 2101.4 2101.3 2101.4 2101.4 2101.375 0.999345667 0.05000000 0.04996728 2100 0.0016% 0.000016 2100 % 8 2400.00 2401.4 2401.3 2401.4 2401.4 2401.375 0.999427411 0.05000000 0.04997137 2400 0.0016% 0.000016 2400 % 9 2700.00 2701.4 2701.4 2701.3 2701.3 2701.35 0.99950025 0.05773503 0.05770617 2700 0.0016% 0.000016 2700 %
10 3000.00 3001.2 3001.3 3001.4 3001.5 3001.35 0.999550202 0.12909944 0.12904138 3000 0.0016% 0.000016 3000 % 11 0.0016% 0.000016 % 12 0.0016% 0.000016 %
Avg Std Dev of Runs 0.07799573 0.07793211
Ref S/N U-7644 UUT S/N Test
NOTE: ONLY ENTER INFORMATION IN LIGHT GREY BOXES SECTION 1 DATA ENTRY
This can be creep, side load sensitivity or other known error sources. Enter and select Eng. Units or %
Repeatability of UUT Ref Laboratory Uncertainty Per Point
MorehouseHZ
2/26/20161K-5 K
* This is your ASTM E74 LLF Found on Your ASTM E74 Report. It will be converted to a pooled std dev (drop down for non ASTM)
Ref Standard Stability
Morehouse Measurement Uncertainty Calibration and Measurement Capability WorksheetSTART ON THIS SHEET AND FILL IN ONLY LIGHT GREY BOXES
47
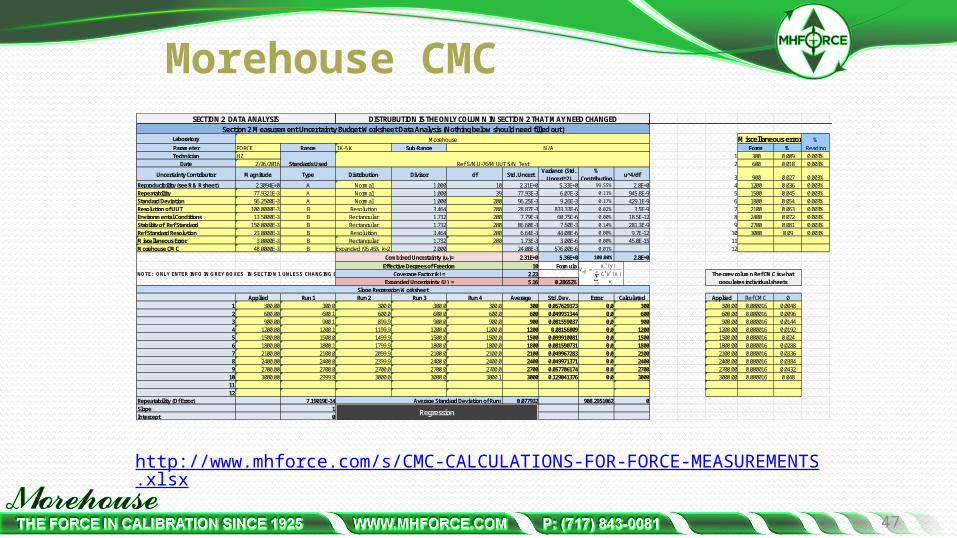
Morehouse CMC
http://www.mhforce.com/s/CMC-CALCULATIONS-FOR-FORCE-MEASUREMENTS.xlsx
Laboratory %Parameter FORCE Range 1K-5 K Sub-Range Force % ReadingTechnician HZ 1 300 0.009 0.003%
Date 2/26/2016 2 600 0.018 0.003%
Uncertainty Contributor Magnitude Type Distribution Divisor df Std. UncertVariance (Std.
Uncert^2)%
Contributionu^4/df 3 900 0.027 0.003%
Reproducibility (see R & R sheet) 2.3094E+0 A Normal 1.000 10 2.31E+0 5.33E+0 99.55% 2.8E+0 4 1200 0.036 0.003%Repeatability 77.9321E-3 A Normal 1.000 39 77.93E-3 6.07E-3 0.11% 945.8E-9 5 1500 0.045 0.003%Standard Deviation 96.2500E-3 A Normal 1.000 200 96.25E-3 9.26E-3 0.17% 429.1E-9 6 1800 0.054 0.003%Resolution of UUT 100.0000E-3 B Resolution 3.464 200 28.87E-3 833.33E-6 0.02% 3.5E-9 7 2100 0.063 0.003%Environmental Conditions 13.5000E-3 B Rectangular 1.732 200 7.79E-3 60.75E-6 0.00% 18.5E-12 8 2400 0.072 0.003%Stability of Ref Standard 150.0000E-3 B Rectangular 1.732 200 86.60E-3 7.50E-3 0.14% 281.3E-9 9 2700 0.081 0.003%Ref Standard Resolution 23.0000E-3 B Resolution 3.464 200 6.64E-3 44.08E-6 0.00% 9.7E-12 10 3000 0.09 0.003%Miscellaneous Error 3.0000E-3 B Rectangular 1.732 200 1.73E-3 3.00E-6 0.00% 45.0E-15 11Morehouse CMC 48.0000E-3 B Expanded (95.45% k=2) 2.000 24.00E-3 576.00E-6 0.01% 12
2.31E+0 5.36E+0 100.00% 2.8E+010 Formula
NOTE: ONLY ENTER INFO IN GREY BOXES IN SECTION 1 UNLESS CHANGING DIST 2.235.16 0.28652%
Applied Run 1 Run 2 Run 3 Run 4 Average Std. Dev. Error Calculated Applied Ref CMC 01 300.00 300.0 300.0 300.0 300.0 300 0.057629373 0.0 300 300.00 0.000016 0.00482 600.00 600.1 600.0 600.0 600.0 600 0.049931344 0.0 600 600.00 0.000016 0.00963 900.00 900.1 899.9 900.0 900.0 900 0.081559037 0.0 900 900.00 0.000016 0.01444 1200.00 1200.1 1199.9 1200.0 1200.0 1200 0.08156809 0.0 1200 1200.00 0.000016 0.01925 1500.00 1500.0 1499.9 1500.0 1500.0 1500 0.099910081 0.0 1500 1500.00 0.000016 0.0246 1800.00 1800.1 1799.9 1800.0 1800.0 1800 0.081590731 0.0 1800 1800.00 0.000016 0.02887 2100.00 2100.0 2099.9 2100.0 2100.0 2100 0.049967283 0.0 2100 2100.00 0.000016 0.03368 2400.00 2400.0 2399.9 2400.0 2400.0 2400 0.049971371 0.0 2400 2400.00 0.000016 0.03849 2700.00 2700.0 2700.0 2700.0 2700.0 2700 0.057706174 0.0 2700 2700.00 0.000016 0.0432
10 3000.00 2999.9 3000.0 3000.0 3000.1 3000 0.129041376 0.0 3000 3000.00 0.000016 0.04811 12
Repeatability (Of Error) 7.19019E-14 0.077932 908.2951062 0Slope 1Intercept 0
SECTION 2 DATA ANALYSIS DISTRUBUTION IS THE ONLY COLUMN IN SECTION 2 THAT MAY NEED CHANGED
Slope Regression Worksheet
Average Standard Deviation of Runs
Combined Uncertainty (uc)=
Section 2 Measurement Uncertainty Budget Worksheet Data Analysis (Nothing below should need filled out)Morehouse
N/A
Standards Used Ref S/N U-7644 UUT S/N Test
populates individual sheets The grey column Ref CMC is what
Effective Degrees of FreedomCoverage Factor (k) =
Expanded Uncertainty (U) =
Miscellaneous error
3500
Regression
Vu yc u x
v
effc
i i
ii
N
4
4 4
1
( )( )

48
ConclusionIsn’t it our job to audit a lab and ask how they calculated their CMC? If so, assessor(s) must:• Assess if they considered the impact on uncertainty
of fixturing and site deficiencies if not being used;• The assessor should carefully review the contract
review process for completeness based on items covered today;
• AB Staff & Assessors, are PTs with appropriate artifacts being completed for force & torque?