
FORAGE PRODUCTION, WEED SEEDBANK AND …
140
FORAGE PRODUCTION, WEED SEEDBANK AND ALLELOPATHIC POTENTIAL OF SELECTED GRASS AND LEGUME SPECIES NATIVE TO THE GREAT PLAINS REGION OF CANADA A Thesis Submitted to the College of Graduate and Postdoctoral Studies In Partial Fulfillment of the Requirements For the Degree of Doctor of Philosophy In the Department of Plant Science University of Saskatchewan Saskatoon By MOSTAFA SERAJCHI © Copyright Mostafa Serajchi, August 2017. All rights reserved.
Transcript of FORAGE PRODUCTION, WEED SEEDBANK AND …

FORAGE PRODUCTION, WEED SEEDBANK AND ALLELOPATHIC POTENTIAL OF
SELECTED GRASS AND LEGUME SPECIES NATIVE TO THE GREAT PLAINS REGION
OF CANADA
A Thesis Submitted to the College of
Graduate and Postdoctoral Studies
In Partial Fulfillment of the Requirements
For the Degree of Doctor of Philosophy
In the Department of Plant Science
University of Saskatchewan
Saskatoon
By
MOSTAFA SERAJCHI
© Copyright Mostafa Serajchi, August 2017. All rights reserved.
i
Permission to use
In presenting this thesis/dissertation in partial fulfillment of the requirements for a Postgraduate
degree from the University of Saskatchewan, I agree that the Libraries of this University may make
it freely available for inspection. I further agree that permission for copying of this
thesis/dissertation in any manner, in whole or in part, for scholarly purposes may be granted by
the professor or professors who supervised my thesis/dissertation work or, in their absence, by the
Head of the Department or the Dean of the College in which my thesis work was done. It is
understood that any copying or publication or use of this thesis/dissertation or parts thereof for
financial gain shall not be allowed without my written permission. It is also understood that due
recognition shall be given to me and to the University of Saskatchewan in any scholarly use which
may be made of any material in my thesis/dissertation.
Head of the Department of Plant Sciences
University of Saskatchewan
51 Campus Drive
Saskatoon, Saskatchewan, S7N 5A8
Canada
ii
Acknowledgments
I would like to express my sincere gratitude to my advisors Dr. Eric Lamb and Dr. Michael
Schellenberg for their continuous support, forethought and constructive criticism through the
completion of my Ph.D as well as providing me with numerous learning opportunities and skill
sets. I also would like to thank the members of my committee, Dr. Jill Johnstone, Dr. Bruce
Coulman, Dr. Bill Biligetu for their insightful comments and encouragement in the writing
process of this thesis, and a special thank you to my external examiner Dr. Cameron Carlyle.
My sincere thanks go to the forage research group, located at the Agriculture and Agri-
food Canada (AAFC), Swift Current Research and Development Centre (SCRDC) for their
amazing support throughout my research, including but not limited to: Isabelle Pichè, Melissa
Kehler, Lorna Fast, Shawn Bender, SeaRa Lim, Perry Coward and Russ Muri. Thank you to
Dr. Jillian Bainard and Krystal Isbister for their critiques and comments throughout my writing. I
would also like to thank the numerous summer students who helped me complete my field work
during my Ph.D.
Finally, I must express my very profound gratitude to my wife and my parents for
providing me with unfailing support and continuous encouragement throughout the years of my
study and through the process of researching and writing this thesis. This accomplishment would
not have been possible without them.
This project was funded by a Beef Cattle Research Council grant to M. P. S. and E. G. L. and
CFI Leaders Opportunity Fund and NSERC Discovery grants to E. G. L.
iii
Abstract
The forage yield and quality, weed seedbank abundance and allelopathic potential of
seven native grass and legume species were evaluated in field and greenhouse experiments
conducted at the Agriculture and Agri-Food Canada (AAFC), Swift Current Research and
Development Centre (SCRDC), Saskatchewan, Canada. Native perennial forage species were
selected from three functional groups (C3, C4 grasses and legumes) and seeded in 2010 and 2014
in monocultures and mixtures, including: western wheatgrass (WWG) (Pascopyrum smithii
(Rydb.) Barkworth & D.R. Dewey), bluebunch wheatgrass (BBW) (Pseudoroegneria spicata
(Pursh) Á. Löve), nodding brome (NOB) (Bromus porteri (J.M. Coult.) Nash), little blue stem
(LBS) (Schizachyrium scoparium (Michx.) Nash), side-oats grama (SOG) (Bouteloua
curtipendula (Michx.) Torr.), purple prairie clover (PPC) (Dalea purpurea Vent.) and white
prairie clover (WPC) (Dalea candida Willd.). Objectives of this thesis were to: 1) evaluate the
long-term forage yield and quality of these forage species in monocultures and mixtures; 2)
determine the weed seedbank density and aboveground weed populations in stands of these
species; and 3) evaluate the allelopathic effect of these species on three problematic weeds:
dandelion (Taraxacum officinale F.H. Wigg.), scentless chamomile (Matricaria perforata Mérat)
and foxtail barley (Hordeum jubatum L.). Forage mixtures produced greater dry matter than
monocultures at all harvesting times. Mixtures of which WWG was a component produced
higher forage yield, and a mixture of WWG, BBW, LBS and legumes can provide sustainable
forage yield and quality and can be suitable options for seeded pastures. In this study, the forage
stands experienced one of the driest and wettest years in the history of the region. We observed
no significant differences in forage production of each species from dry to wet year supporting
the idea of high stability and productivity of native species during varying climate conditions.
Mixtures of forage species also promoted lower weed densities in the seedbank and in the swards
aboveground compared to monocultures. Among mixtures, those containing WWG had a
significant lower abundance of weeds in the seedbank and aboveground weed populations
compared to other forage species. The weed seedbank varied seasonally with the minimum
number of weed seeds in early spring and maximum in late summer. The most abundant weeds
in the seedbank were the least abundant weeds in aboveground population and vice versa. WWG
showed promising results as a native forage species by demonstrating the potential to suppress
iv
weeds and reduce weed seed size when seeded in monocultures and mixtures. In the greenhouse,
root leachate from WWG, LBS and SOG reduced the aboveground and belowground growth of
weeds up to 90%. These findings suggest that the use of allelopathic species may provide weed
control and management benefits in seeded pastures and native prairie restorations. In
conclusion, forage mixtures produced greater dry matter and promoted lower weed densities in
the seedbank and aboveground populations compared to monocultures. This demonstrates that
increasing forage mixture diversity can increase forage yield and be an effective ecological and
non-chemical weed control tactic in seeded pastures.

v
Table of Contents
Page
Permission to use ...................................................................................................................... i
Acknowledgments ................................................................................................................... ii
Abstract ................................................................................................................................... iii
Table of Contents ..................................................................................................................... v
List of Tables ........................................................................................................................... x
List of Figures ....................................................................................................................... xiii
Chapter 1 ......................................................................................................................................... 1
INTRODUCTION ................................................................................................................... 1
1.1 Native species in Canadian Prairie .................................................................................... 1
1.2 Thesis objectives ................................................................................................................ 1
Chapter 2 ......................................................................................................................................... 4
LITERATURE REVIEW ........................................................................................................ 4
2.1 Native species and their role in forage productivity .......................................................... 4
2.1.1 Complementarity and competition in the mixtures ................................................. 4
2.1.2 Species diversity and productivity ........................................................................... 5
2.1.3 Native species’ mixtures .......................................................................................... 6
2.1.4 Selected native species ............................................................................................ 7
2.2 Soil seedbank ..................................................................................................................... 8
2.2.1 Seed dormancy ......................................................................................................... 9
2.2.2 Seedbank dynamics ............................................................................................... 10
2.2.3 Seedbank management strategies .......................................................................... 10
2.2.4 Relationships between the weed seedbank and aboveground communities .......... 11
2.3 Allelopathy....................................................................................................................... 11

vi
2.3.1 Effects of allelochemicals on ecosystem ............................................................... 12
2.3.2 Mode of action ....................................................................................................... 12
2.3.3 Allelopathic weed control ...................................................................................... 13
Chapter 3 ....................................................................................................................................... 14
MIXTURES OF NATIVE PERENNIAL FORAGE SPECIES PRODUCE HIGHER YIELD
THAN PURE STANDS IN A LONG-TERM STUDY IN SEMI-ARID ECOREGION OF
SASKATCHEWAN, CANADA .................................................................................................. 14
3.1 Introduction ...................................................................................................................... 14
3.2 Materials and Methods..................................................................................................... 16
3.2.1 Forage Species ....................................................................................................... 16
3.2.2 Experimental Design ............................................................................................. 16
3.2.3 Forage Yield .......................................................................................................... 17
3.2.4 Forage Quality ....................................................................................................... 19
3.2.5 Statistical analysis .................................................................................................. 19
3.3 Results .............................................................................................................................. 20
3.3.1 Forage Production .................................................................................................. 20
3.3.2 Species Composition ............................................................................................. 22
3.3.3 Forage production of functional groups, monocultures vs. mixtures .................... 22
3.3.4 Forage Quality ....................................................................................................... 25
3.4 Discussion ........................................................................................................................ 29
3.4.1 Productivity of forage species in monoculture ...................................................... 29
3.4.2 Mixtures produced greater forage yield than monocultures .................................. 29
3.4.3 WWG contains the highest crude protein and lowest ADF and NDF among
grasses ................................................................................................................................... 36
3.5 Conclusion ....................................................................................................................... 37
Chapter 4 ....................................................................................................................................... 39
vii
EVALUATION OF BINARY AND COMPLEX MIXTURES OF NATIVE FORAGE
SPECIES FOR THE DRY-MIXED AND TALL-GRASS ECOREGION OF CANADIAN
PRAIRIE ....................................................................................................................................... 39
4.1 Introduction ...................................................................................................................... 39
4.2 Materials and Methods..................................................................................................... 41
4.2.1 Forage Species ....................................................................................................... 41
4.2.2 Experimental Design ............................................................................................. 42
4.2.3 Forage Yield .......................................................................................................... 43
4.2.4 Forage Quality ....................................................................................................... 43
4.2.5 Statistical analysis .................................................................................................. 44
4.3 Results .............................................................................................................................. 44
4.3.1 Forage Production .................................................................................................. 44
4.3.2 Species Composition ............................................................................................. 46
4.3.3 Forage quality ........................................................................................................ 46
4.4 Discussion ........................................................................................................................ 49
4.4.1 Forage yield ........................................................................................................... 49
4.4.2 Species composition .............................................................................................. 52
4.4.3 Forage quality ........................................................................................................ 53
4.5 Conclusion ....................................................................................................................... 53
Chapter 5 ....................................................................................................................................... 55
MULTI-SPECIES FORAGE MIXTURES REDUCE WEED SEEDBANK AND
ABOVEGROUND POPULATION.............................................................................................. 55
5.1 Introduction ...................................................................................................................... 55
5.2 Material and Methods ...................................................................................................... 57
5.2.1 Study Site ............................................................................................................... 57
5.2.2 Experimental Design ............................................................................................. 58
viii
5.2.3 Aboveground Weed Population ............................................................................. 58
5.2.4 Weed Seedbank Sampling ..................................................................................... 59
5.2.5 Statistical Analysis ................................................................................................. 59
5.3 Results .............................................................................................................................. 60
5.3.1 Aboveground Weed Population and Soil Seedbank .............................................. 60
5.3.2 Distribution of Seeds in the Soil Layers ................................................................ 66
5.3.3 Annual, Biennial and Perennial Weeds in the Seedbank ....................................... 66
5.3.4 Weed Seedbank in Monocultures and Mixtures .................................................... 69
5.4 Discussion ........................................................................................................................ 71
5.4.1 Effect of Forage Mixtures on Weed Seedbank and Aboveground Population ...... 71
5.4.2 Aboveground Weed Population vs. Weed Seedbank ............................................ 72
5.4.3 Temporal Variability of Weed Seedbank and Aboveground Population .............. 73
5.5 Conclusion ....................................................................................................................... 73
Chapter 6 ....................................................................................................................................... 75
THE POTENTIAL OF SEVEN NATIVE NORTH AMERICAN FORAGE SPECIES TO
SUPPRESS WEEDS THROUGH ALLELOPATHY .................................................................. 75
6.1 Introduction ...................................................................................................................... 75
6.2 Materials and methods ..................................................................................................... 77
6.2.1 Allelopathic Properties of Perennial Forages in the third month of growth
(Experiment 1) ...................................................................................................................... 78
6.2.2 Allelopathic Properties of Forage Species in the fifth month of growth and after
cutting (Experiment 2) .......................................................................................................... 79
6.2.3 Root Leachate Mixtures (Experiment 3) ............................................................... 80
6.2.4 Statistical analysis .................................................................................................. 81
6.3 Results .............................................................................................................................. 81

ix
6.3.1 Allelopathic Potential of Perennial Forages in the third month of growth
(Experiment 1) ...................................................................................................................... 81
6.3.2 Allelopathic Properties of Forage Species in the fifth month of growth and after
cutting (Experiment 2) .......................................................................................................... 83
6.3.3 Root Leachate Mixtures (Experiment 3) ............................................................... 83
6.4 Discussion ........................................................................................................................ 87
6.5 Conclusion ....................................................................................................................... 88
Chapter 7 ....................................................................................................................................... 90
GENERAL CONCLUSION .................................................................................................. 90
Chapter 8 ....................................................................................................................................... 94
LITERATURE CITED .......................................................................................................... 94
Chapter 9 ..................................................................................................................................... 115
Appendix .............................................................................................................................. 115
x
List of Tables
Table Page
Table 3.1 Common name, Latin name, abbreviation and functional group of selected species. .. 19
Table 3.2 F statistics and P values indicating statistical significance for the treatment, year,
month and their interactions on production, crude protein, ADF, NDF, P, Ca, Cu and CV
of seven forage species in monoculture and mixtures. ..................................................... 21
Table 3.3 Forage species composition in the mixture plots in July and August of 2014-2016.
Proportion of each species in the mixture at the time of seeding was 50%. Abbreviation:
WWG: Western wheatgrass; BBW: Bluebunch wheatgrass; SOG: Side oats grama; LBS:
Little blue stem; NOB: Nodding brome; PPC: Purple prairie clover; and WPC: White
prairie clover. .................................................................................................................... 24
Table 3.4 F statistics and P values indicating statistical significance for forage production in
monoculture vs. mixture treatments. Forage production of all monoculture plots were
categorized in one group versus forage production of all mixture plots in another group.
........................................................................................................................................... 27
Table 3.5 P, Cu and Ca concentrations (ppm) of seven forage species in July and August of
2011-2014. Abbreviation: WWG: Western wheatgrass; BBW: Bluebunch wheatgrass;
SOG: Side oats grama; LBS: Little blue stem; NOB: Nodding brome; PPC: Purple prairie
clover; and WPC: White prairie clover. One standard error around the mean is shown
after ±; n = 4. Columns containing the same letter for each element are not significantly
different (P ≤ 0.05) according to protected Fisher’s LSD test. Columns containing more
than three significant letters are shown by the first and last letters, separated by dash. ... 28
Table 3.6 Coefficient of variation (CV) for each treatment in the month of July and August for
the period of 2011-2016 (mean ±SE). Lower values represent higher temporal stability.
Columns containing the same letter are not significantly different (P ≤ 0.05) according to
protected Fisher’s LSD test. .............................................................................................. 32
Table 4.1 Common name, Latin name, abbreviation and the functional group of selected species.
........................................................................................................................................... 42
Table 4.2 The contribution of each species (%) at the seeding rate in complex mixtures, planted
in Swift Current SK and Brandon MB. ............................................................................. 43
xi
Table 4.3 F statistics and P values indicating statistical significance for the treatment, year,
month and their interactions on production, crude protein, Acid detergent fiber (ADF),
Neutral detergent fiber (NDF) and Phosphorus of seven forage species in Swift Current,
SK. .................................................................................................................................... 46
Table 4.4 Species composition in the mixture plots in July and August of 2015 and 2016 in Swift
Current SK. Species composition was measured two and three years after seeding (2015
and 2016). Abbreviation: WWG: Western wheatgrass; BBW: Bluebunch wheatgrass;
SOG: Side oats grama; LBS: Little blue stem; NOB: Nodding brome; PPC: Purple prairie
clover; and WPC: White prairie clover. ............................................................................ 48
Table 4.5 ADF and NDF concentrations in a monoculture of WWG and mixture plots in July and
August of 2015-2016 in Swift Current SK. The species composition of Mixtures A-E is
provided in Table 1. Abbreviation: WWG: Western wheatgrass; BBW: Bluebunch
wheatgrass; SOG: Side oats grama; LBS: Little blue stem; NOB: Nodding brome; PPC:
Purple prairie clover; and WPC: White prairie clover. One standard error around the
mean is shown after ±; n = 4. ............................................................................................ 51
Table 4.6 P concentrations (%) in a monoculture of WWG and mixture plots in July and August
of 2015-2016 in Swift Current SK. The species composition of Mixtures A-E is provided
in Table 1. Abbreviation: WWG: Western wheatgrass; BBW: Bluebunch wheatgrass;
SOG: Side oats grama; LBS: Little blue stem; NOB: Nodding brome; PPC: Purple prairie
clover; and WPC: White prairie clover. One standard error around the mean is shown
after ±; n = 4. ..................................................................................................................... 52
Table 5.1 Common name, Latin name, abbreviation and functional group of selected native
forage species seeded in 2010 in Swift Current SK. ......................................................... 58
Table 5.2 F statistics and P values indicating statistical significance for the weed seedbank of all
treatments, monocultures and monocultures vs. mixtures in both weed seedbank and
aboveground population in Swift Current SK. ................................................................. 62
Table 5.3 Latin name, common name and plant family of germinated seeds in soil seedbank and
aboveground weed population. ......................................................................................... 63
Table 5.4 Percentage of the most abundant weeds in the soil seedbank and aboveground
population. ........................................................................................................................ 66
Table 6.1 Common name, Latin name, abbreviation and functional group of selected species. .. 78

xii
Table 6.2 F statistics and P values indicating statistical significance for the weeds, forage species
leachate and their interactions on the root and shoot dry weight of dandelion, foxtail
barley and scentless chamomile. ....................................................................................... 82
xiii
List of Figures
Figure Page
Figure 3.1 Accumulative precipitation (mm) and mean air temperature (°C) in 2011-2016 and
average of 120 years at Swift Current SK Canada. Data were provided from AAFC in
Swift Current SK. Precipitation in 2016 was higher than normal, whereas, 2015 was
among the driest years in the region. ................................................................................ 18
Figure 3.2 Forage production (kg/ha) in monoculture plots in July and August of 2011-2016.
Abbreviation: WWG: Western wheatgrass; BBW: Bluebunch wheatgrass; SOG: Side
oats grama; LBS: Little blue stem; NOB: Nodding brome; PPC: Purple prairie clover;
and WPC: White prairie clover. Error bars represent one standard error around the mean;
n = 4. Bars containing more than three significant letters are shown by the first and last
letters, separated by dash. Bars containing the same letter in each graph are not
significantly different (P ≤ 0.05) according to protected Fisher’s LSD test. .................... 23
Figure 3.3 Forage production in mixture plots containing different forage species averaged
across all years. Abbreviation: WWG: Western wheatgrass; BBW: Bluebunch
wheatgrass; SOG: Side oats grama; LBS: Little blue stem; NOB: Nodding brome; PPC:
Purple prairie clover; and WPC: White prairie clover. Error bars represent one standard
error around the mean; n = 144. ........................................................................................ 25
Figure 3.4 Forage production in mixtures vs. monoculture plots in July and August of 2011-
2016. Abbreviation: WWG: Western wheatgrass; BBW: Bluebunch wheatgrass; SOG:
Side oats grama; LBS: Little blue stem; NOB: Nodding brome; PPC: Purple prairie
clover; and WPC: White prairie clover. Error bars represent one standard error around the
mean; n = 84 (mixtures) and 28 (monocultures). Bars containing more than three
significant letters are shown by the first and last letters, separated by dash. Bars
containing the same letter in each graph are not significantly different (P ≤ 0.05)
according to protected Fisher’s LSD test. ......................................................................... 27
Figure 3.5 Forage production of different functional groups including C3, C4, legume and their
mixtures in July and August of 2011-2016. Abbreviation: WWG: Western wheatgrass;
BBW: Bluebunch wheatgrass; SOG: Side oats grama; LBS: Little blue stem; NOB:
Nodding brome; PPC: Purple prairie clover; and WPC: White prairie clover. Error bars
xiv
represent one standard error around the mean; n = 24 (C3+C4 and C3+legume), 16
(C4+Legume), 12 (C3+C3 and C3), 8 (C4 and Legume), 4 (C4+C4 and
Legume+Legume). ............................................................................................................ 31
Figure 3.6 Crude protein (N×6.25) of forage species in July and August of 2011-2015.
Abbreviation: WWG: Western wheatgrass; BBW: Bluebunch wheatgrass; SOG: Side
oats grama; LBS: Little blue stem; NOB: Nodding brome; PPC: Purple prairie clover;
and WPC: White prairie clover. Error bars represent one standard error around the mean;
n = 4. Bars containing more than three significant letters are shown by the first and last
letters, separated by dash. Bars containing the same letter in each graph are not
significantly different (P ≤ 0.05) according to protected Fisher’s LSD test. .................... 34
Figure 3.7 Acid detergent fiber (ADF) and neural detergent fiber (NDF) of seven forage species
in July and August of 2011-2016. Abbreviation: WWG: Western wheatgrass; BBW:
Bluebunch wheatgrass; SOG: Side oats grama; LBS: Little blue stem; NOB: Nodding
brome; PPC: Purple prairie clover; and WPC: White prairie clover. Error bars represent
one standard error around the mean; n = 4. Bars containing more than three significant
letters are shown by the first and last letters, separated by dash. Bars containing the same
letter in each graph are not significantly different (P ≤ 0.05) according to protected
Fisher’s LSD test............................................................................................................... 35
Figure 4.1 Forage production (kg/ha) in a monoculture of WWG and mixture plots (above graph)
and forage production of mixtures with different number of species diversity (below
graph) in July and August of 2015-2016 in Swift Current SK. The species composition of
Mixtures A-E are provided in Table 4.2. Abbreviation: WWG: Western wheatgrass;
BBW: Bluebunch wheatgrass; SOG: Side oats grama; LBS: Little blue stem; NOB:
Nodding brome; PPC: Purple prairie clover; and WPC: White prairie clover. Error bars
represent one standard error around the mean; n = 4. Bars containing more than three
significant letters are shown by the first and last letters, separated by a dash. Bars
containing the same letter are not significantly different (P ≤ 0.05) according to protected
Fisher’s LSD test............................................................................................................... 45
Figure 4.3 Crude protein (N×6.25) in a monoculture of WWG and mixture plots in July and
August of 2015-2016 in Swift Current SK. The species composition of Mixtures A-E is
provided in Table 1. Abbreviation: WWG: Western wheatgrass; BBW: Bluebunch
xv
wheatgrass; SOG: Side oats grama; LBS: Little blue stem; NOB: Nodding brome; PPC:
Purple prairie clover; and WPC: White prairie clover. Error bars represent one standard
error around the mean; n = 4. Bars containing more than three significant letters are
shown by the first and last letters, separated by a dash. Bars containing the same letter are
not significantly different (P ≤ 0.05) according to protected Fisher’s LSD test. .............. 47
Figure 5.1 Aboveground weed density in monoculture plots in 2014 and 2015. Abbreviation:
WWG: Western wheatgrass; BBW: Bluebunch wheatgrass; SOG: Side oats grama; LBS:
Little blue stem; NOB: Nodding brome; PPC: Purple prairie clover; and WPC: White
prairie clover. Error bars represent one standard error around the mean; n = 4. Bars with
the same letter are not significantly different (P ≤ 0.05) according to protected Fisher’s
LSD test. ........................................................................................................................... 67
Figure 5.2 Aboveground weed density in monoculture and mixture plots in 2014 and 2015. The
density of weeds between monoculture and mixture plots were statistically different in
2014 and 2015. Error bars represent one standard error around the mean; n = 28 and 84
for monoculture and mixture, respectively. Bars with the same letter are not significantly
different (P ≤ 0.05) according to protected Fisher’s LSD test. ......................................... 67
Figure 5.3 (A) Number of seeds m-2 from all weed species in depth 0-5, 5-10 and 10-15 cm and
in total (0-15 cm) at four sampling dates; (B) Density of biennial, annual and perennial
weeds in all treatments at four sampling dates; (C) Density of the most abundance
species: biennial wormwood, stinkweed, purslane and flixweed in all treatments at four
sampling dates. Error bars represent one standard error around the mean; n=120. .......... 68
Figure 5.4 Average of weed seed bank density in monoculture plots from four sampling dates.
Abbreviation: WWG: Western wheatgrass; BBW: Bluebunch wheatgrass; SOG: Side
oats grama; LBS: Little blue stem; NOB: Nodding brome; PPC: Purple prairie clover;
and WPC: White prairie clover. Error bars represent one standard error around the mean;
n = 16. Bars with the same letter are not significantly different (P ≤ 0.05) according to
protected Fisher’s LSD test. .............................................................................................. 69
Figure 5.5 Weed seed bank density in monoculture and mixture plots in three depths: 0-5, 5-10
and 10-15 cm. The density of weed seed bank between monoculture and mixture plots
were statistically different in depth 0-5 cm but not statistically different in depth 5-10 and
10-15 cm. Error bars represent one standard error around the mean; n = 28 and 84 for
xvi
monoculture and mixture, respectively. Bars with the same letter are not significantly
different (P ≤ 0.05) according to protected Fisher’s LSD test. ......................................... 70
Figure 5.6 Weed seedbank and aboveground weed population in mixture plots containing
different forage species. The data related to these graphs was not statistically analyzed
since each data was used more than once to make the bars. Abbreviation: WWG: Western
wheatgrass; BBW: Bluebunch wheatgrass; SOG: Side oats grama; LBS: Little blue stem;
NOB: Nodding brome; PPC: Purple prairie clover; and WPC: White prairie clover. Error
bars represent one standard error around the mean; n = 96 for weed seedbank and n=48
for aboveground weed population. ................................................................................... 71
Figure 6.1 Shoot dry weight (left graphs) and root:shoot ratio (right graphs) of dandelion (upper
graphs), foxtail barley (middle graphs) and scentless chamomile (lower graphs) in the
first experiment, watered with leachate from five forage species including: western
wheatgrass (WWG), side-oats grama (SOG), bluebunch wheatgrass (BBW), little blue
stem (LBS) and nodding brome (NOB). Error bars represent + or - one standard error
around the mean; n=4. Bars with the same letter in each graph are not significantly
different (P ≤ 0.05) according to protected Fisher’s LSD test. ......................................... 84
Figure 6.2 Shoot dry weight (left graphs) and root:shoot ratio (right graphs) of dandelion (upper
graphs), foxtail barley (middle graphs) and scentless chamomile (lower graphs) in the
second experiment (after first cut of forage species) watered by leachate from six forage
species including: western wheatgrass (WWG), side-oats grama (SOG), little blue stem
(LBS), nodding brome (NOB), purple prairie clover (PPC) and white prairie clover
(WPC). Error bars represent one standard error + or - around the mean; n=4. Bars with
the same letter in each graph are not significantly different (P ≤ 0.05) according to
protected Fisher’s LSD test. .............................................................................................. 85
Figure 6.3 Shoot dry weight and root:shoot ratio of dandelion and scentless chamomile watered
by leachate from six forage species including: western wheatgrass (WWG), side-oats
grama (SOG), little blue stem (LBS), nodding brome (NOB), purple prairie clover (PPC)
and white prairie clover (WPC). Leachate were applied alone and in a 1:1 mixture. Error
bars represent one standard error + or - around the mean; n=4. Bars with the same letter
in each graph are not significantly different (P≤0.05) according to protected Fisher’s LSD
test. .................................................................................................................................... 86
1
CHAPTER 1
INTRODUCTION
1.1 Native species in Canadian Prairie
About 5.7 million hectares of the Canadian Prairie is covered by seeded pastures
(Statistics Canada, 2010), primarily with introduced species like crested wheatgrass (Agropyron
cristatum L. Gaertn.), smooth brome (Bromus inermis Leyss) and Russian wildrye (Elymus
junceus Fisch.) (Otfinowski et al. 2007; Smoliak and Dormaar 1985). However, the use of native
perennial forage species is increasing for seeded pastures and land reclamation projects in the
Northern Great Plains. In this region, forage grasses are commonly seeded in monoculture or a
binary mixture with legumes. The majority of seeded forage species are cool-season grasses of
Eurasian origin and, while highly productive, the invasive behavior of some of the introduced
species is a serious threat to native grasslands (Biligetu et al. 2014; DeKeyser et al. 2015;
Otfinowski et al. 2007). Many native prairie grasses are adapted to a broad range of soil and
climatic conditions and have great commercial potential for forage production, soil reclamation,
and long-term sustainability under grazing (Schellenberg et al. 2012; Tilman et al. 2001; Willms
et al. 2005). Locally adapted species or ecotypes can better cope with the changes in the local
climates, have better tolerance to diseases, and have a long-term association with soil
microorganisms and other species in the community (Dorner 2002).
1.2 Thesis objectives
This thesis is focused on the agronomy, quality, allelopathic potential and seedbank
composition of Western wheatgrass, Bluebunch wheatgrass, Nodding brome, Little blue stem,
Side-oats grama, Purple prairie clover and White prairie clover in mixtures. The intent of this
thesis is to test the following general hypotheses: 1) That mixtures of forage species are more
productive than monocultures; 2) Certain native forage species can better suppress weeds; and
also mixtures of forage species may be more effective at decreasing weed population and
seedbank abundance compared to monocultures; and 3) Lower weed density in some forage
species especially western wheatgrass can be linked to allelopathic potential.
2
I have three major objectives in my thesis: 1) To evaluate the long-term forage yield and
quality of these seven forage species in monoculture, binary mixtures, and a series of complex
multispecies mixtures predicted to be high-yielding (Chapters 3 and 4); 2) To determine the
weed seedbank density and aboveground weed populations of forage species in monocultures
and mixtures (Chapter 5); and 3) To evaluate the allelopathic potential of selected forage species
(Chapter 6).
The first major objective (forage production and quality) includes two separate sub-
studies. In the first sub-study, I evaluate the long-term forage yield and quality of the
aforementioned species in monoculture and mixture over a 6-year period in the semi-arid
ecoregion of Saskatchewan, Canada (Chapter 3). This experiment was started in 2010 with 2011
data collected by Jenalee Mischkolz for her MSc thesis (Mischkolz 2013), 2012 and 2013 data
by technicians under the supervision of Dr. Michael P. Schellenberg, and 2014-2016 data
collected by me. The specific objectives of this sub-study were to: 1) Evaluate forage yield and
quality of each species under a range of climate conditions; 2) Assess persistence of less
competitive species in the mixtures; 3) Study the effects of functional group diversity on forage
productivity and quality; and 4) Determine the effect of binary mixtures of forage species on
productivity. In the second sub-study, I evaluated forage yield and quality of these seven species,
in monoculture, binary mixtures and complex mixtures in two different ecoregions of Canadian
Prairie, Mixed Grass Prairie Ecoregion (Swift Current, SK) and Tall Grass Prairie Ecoregion
(Brandon, MB) (Chapter 4). The specific objectives of this sub-study were to: 1) Evaluate forage
yield and quality of monoculture and simple mixtures vs. complex mixtures; 2) Evaluate whether
the complex mixtures predicted to be more productive are actually more productive; and 3)
Assess the changes in mixture composition with time.
The second major objective was to evaluate the weed seedbank density and aboveground
weed populations of forage species (Chapter 5). There is a growing interest in the use of native
perennial forage species for sustainable beef production systems. However, little research has
been conducted on weed seedbank composition and aboveground populations in seeded pastures.
The specific objectives of weed seedbank study were to evaluate: 1) The effects of different
native forage species in monocultures on weed seedbank composition and aboveground weed
populations; 2) The effect of forage mixtures on the weed seedbank and aboveground weed
3
populations; and 3) The similarity between the weed seedbank and emerged weed populations in
mixtures of native perennial forage species.
The third major objective (allelopathy) was to evaluate the allelopathic potential of these
forage species (Chapter 6). There are many studies of the potential of allelopathic crops for weed
control, but much less is known about the allelopathic potential of forage species in pastures.
There are many benefits to using diverse mixtures of forage species in seeded pastures and
moreover, identifying those species with high allelopathic properties in the mixtures could
reduce plant-weed competition, increase forage productivity and decrease the cost of weed
control in pastures. The specific objectives of allelopathy study were to evaluate: 1) The
allelopathic potential of seven native forage species early and later in the first season of growth;
and 2) The effect of multispecies leachate mixtures on weeds.
4
CHAPTER 2
LITERATURE REVIEW
In this section, the relationships between forage species in mixture will first be reviewed
including complementarity, competition, and the effects of species mixtures on productivity.
Secondly, the use of native forage species in Canadian Prairies and their role in forage
productivity will be examined. In the next section, the literature on soil seedbanks, seed
dormancy and the relationships between soil seedbank and aboveground population will be
reviewd. Finally, allelopathy and the implications of allelopathy for weed control in perennial
forages will be discussed.
2.1 Native species and their role in forage productivity
2.1.1 Complementarity and competition in the mixtures
In a plant community, each species may either compete with others or complement each
other to capture resources. The type and intensity of these interactions determine the community
productivity (Hooper et al. 2005a; Lamb et al. 2011; Miller 1997; Mischkolz et al. 2016;
Sheehan et al. 2006; Trenbath 1974a). When mixtures produce greater yield than monocultures,
the mixture is over-yielding (Trenbath 1974a) which is a sign of positive interactions between
species. Positive or complementary interactions between species are because of combinations of
characteristics or functional roles that are beneficial for mixtures to increase productivity
(Brooker et al. 2008; Hooper et al. 2005a). Over-yielding is achieved when species in the
community complement each other in their use of resources by occupying different niches or
through facilitation (Brooker et al. 2008; Callaway 1995; Tracy and Sanderson 2004).
Facilitation is another example of complementarity where at least one species is benefited in the
interaction and harm is caused to neither. Facilitation is one of the most important plant-plant
interactions with strong impacts on population and community ecology (Lortie 2007).
Facilitation can influence communities through strong effects on plant growth rates, population
distribution, species diversity and composition, and even landscape community dynamics (Bruno
et al. 2003). Facilitation enables plants to exploit a greater portion of available resources like
nutrients and light, and therefore can increase the utilization of the fundamental niche space
(Bruno et al. 2003). The relationship between grasses and legumes can be an example of
5
facilitation (Bertness and Callaway 1994; Bruno et al. 2003; Muir et al. 2011; Tilman et al.
1997). Legumes by fixing atmospheric nitrogen can provide sustainable source of nitrogen for
grasses and other species in the mixture (Duchene et al. 2017). The ability of legumes to fix
atmospheric nitrogen is linked to their symbiosis relationship with a Rhizobium bacteria, located
in the root structures called nodules (Duchene et al. 2017). Facilitation can also play an
important role in determining community structure, and maintaining the productivity in harsh
conditions (Callaway and Howard 2007; Lortie et al. 2016).
Under-yielding, on the other hand, happens when negative interactions such as
competition between species in the mixture occur (Trenbath 1974b). The competitive ability of a
plant has two components, the “competitive effect” which is the ability of one species to
suppress neighbours, and “competitive response” which is the ability of one species to tolerate
suppression by neighbours (Goldberg 1996). The competitive ability of a species depends on its
size and growth rate, whereas competitive response depends on persistence and avoidance of the
species from the neighbours’ damage (Keddy et al. 1998; Keddy et al. 1994; Wang et al. 2010).
In plant communities when complementarity is maximum and competition is minimum,
optimum forage yield is obtained (Brooker et al. 2008).
2.1.2 Species diversity and productivity
Increasing community diversity results in increased resource capturing, nutrient cycling,
stability, and decreased community susceptibility to weed invasion or other pests (Knops et al.
1999; Loreau and de Mazancourt 2013; Sanderson et al. 2005). Many studies have shown a
positive association between diversity and productivity, particularly in planted or artificial
communities (Balvanera et al. 2006; Díaz and Cabido 2001; Hooper et al. 2005a; Kirwan et al.
2007; Lehman and Tilman 2000; Reich et al. 2004; Sheehan et al. 2006; Tilman 1996; Tilman et
al. 2001; Walker 1995; Walker et al. 1999; Weigelt et al. 2009; Wight and White 1974).
Communities that have higher species richness can be beneficial as more species traits join the
community (e.g. different rooting depths), resources can be used more effectively as compared to
monocultures, thus ecosystem productivity and stability can be improved (Picasso et al. 2008;
Weigelt et al. 2009). Moreover, with increasing species richness there is a higher chance of
including a highly productive species in the mixture. Combinations of different species or
different functional groups may also show additivity or complementarity in resource use which
can increase productivity and plant community stability (Brooker et al. 2008; Hooper et al.
6
2005a; Mischkolz et al. 2016; Picasso et al. 2008; Spehn et al. 2005; Tilman et al. 2001; Weigelt
et al. 2009).
This is a controversial topic however, as the productivity-diversity relationship in natural
communities can be affected by various factors including plant litter accumulation, plant
morphology, disturbance, species composition and soil microbial community (Grace 1999).
Similarly, Huston et al. (2000) emphasized that in ecological experiments there are many
interactions between biotic and abiotic factors that complicate the design and interpretation of
the results. He emphasized that ,in many cases, species diversity has no statistically or
biologically significant effect on produvtivity. In his perspective, there are three type of “hidden
treatments” that potentially affect biodiversity experiments: 1) biotic and abiotic fators like
resource levels and predators, 2) non-random selection of species, and 3) the increased statistical
probability of including a species with a dominant negative or positive effect on biomass and
productivity. In these cases the results may be wrongly attributed to variation in plant diversity
(Huston et al. 2000).
2.1.3 Native species’ mixtures
This thesis deals with native species in mixtures. Native forage species have developed
and existed naturally for many years within a given region or ecosystem with no human
intervention, as opposed to tame forages which are introduced or non-native grass and legume
species cultivated for feeding livestock (Barnes et al. 1995). Forage indicates plant material,
often herbaceous in nature, utilized by grazing livestock (Fageria 1997). Forage mixtures
composed of native species have the potential to be as productive as tame monocultures in a
greater range of environmental conditions and may provide a more reliable source of forage yield
even in years with different environmental conditions (Lehman and Tilman 2000; Schellenberg
et al. 2012). Forage species diversity can provide stable yield and improve the nutritional quality
and palatability of forages by providing a mixed diet throughout the growing season (Holechek
et al. 2004; Wang and Schellenberg 2012). Diversity in native forage mixtures can also enhance
ecosystem services like carbon sequestration and wildlife habitat quality, decrease in pathogen
infection and reduce nutrient loss from soil (Hector et al. 1999; Hooper and Vitousek 1998;
Knops et al. 1999; McNaughton 1977; Mischkolz et al. 2016; Symstad et al. 2003; Tilman and
Downing 1994; Tilman et al. 1996; Vibart et al. 2016; Weigelt et al. 2009). In a diverse forage
mixture, warm-season and cool-season species with different maturation times have the potential

7
to provide high forage quality for livestock over a longer period of the growing season than a
monoculture or simple cool-season mixtures (Jones and Wilson 1987; Tilman et al. 2001). In a
seven-year study on 16 grassland species, Tilman et al. (2001) concluded that mixtures produced
2.7 times the biomass than monocultures. Positive effects of species diversity on productivity can
be explained by different factors including: interspecific complementarity, increase in the use of
available resources, nutrients cycling and potential reduction of herbivory and disease outbreaks
(Tilman et al. 2014). Not all native species produce high forage yield, but forage mixtures
including less productive species may bring beneficial characteristics like drought or grazing
tolerance to the plant community. The diverse species mixtures guarantee the forage yield under
good climate condition and more importantly, ensure the acceptable forage productivity under
unpredictable harsh conditions. In the mixtures, low productivity of one species can be
compensated by other species (Doak et al. 1998; Lehman and Tilman 2000; Lhomme and
Winkel 2002; Mischkolz et al. 2013; Tilman 1999).
2.1.4 Selected native species
In native dry-mixed grasslands of the Canadian prairies, C3 grasses are the dominant
species and produce the bulk of the forage yield and provide most of the digestible energy (Muir
et al. 2011; Schellenberg and Banerjee 2002). C3 grasses start growing early in the season,
whereas C4 grasses initiate growth later in the season (Lehman and Tilman 2000; McGraw et al.
2004; Schellenberg et al. 2012; Tilman et al. 2001). Legumes are best known for their nitrogen
fixation ability. Grasses can use legumes’ nitrogen through the process of nitrogen fixation; thus,
less fertilizer is needed in rangeland and pastures (Brooker et al. 2008; Callaway 1995; Muir et
al. 2011; Oelmann et al. 2007; Temperton et al. 2007; Whitbread et al. 2009). Legumes also
contain high protein concentrations which can increase the total crude protein concentration of
the forage mixtures (McGraw et al. 2004; Muir et al. 2011).
In this study seven native perennial forage species from three functional groups (C3, C4
and legumes) were selected; Western wheatgrass (Pascopyrum smithii (Rydb.) Barkworth &
D.R. Dewey), Bluebunch wheatgrass (Pseudoroegneria spicata (Pursh) Á. Löve), Nodding
brome (Bromus porteri (J.M. Coult.) Nash), Little blue stem (Schizachyrium scoparium (Michx.)
Nash), Side-oats grama (Bouteloua curtipendula (Michx.) Torr.), Purple prairie clover (Dalea
purpurea Vent.) and White prairie clover (Dalea candida Willd.). Since these species are native
to the Canadian Prairie, they are expected more effectively to cope with environmental stresses
8
in this region. These species have the potential to be agronomic crops in seeded pastures and
native prairie restorations as they are available in the market, have sufficient nutritional quality,
have the ability to work well with conventional machinery and are distributed broadly in the
Prairie provinces.
These species were evaluated in the greenhouse studies (Mischkolz et al. 2016) and have
continued to be evaluated in the field studies in Saskatoon and Swift Current, SK, (Biligetu et al.
2014; Mischkolz et al. 2013; Schellenberg et al. 2012), and ongoing field studies in Swift
Current and Brandon, MB Canada. More details on the characteristics of these seven species are
provided in Mischkolz (2013).
2.2 Soil seedbank
Seedbank can be defined as all dormant and non-dormant seeds in the soil and is a source
of floristic diversity that contribute to plant population stability (Baskin and Baskin 1978; Harper
1977). The soil seedbank is also a legacy of past weed populations in a region and a source of
plants that have the potential emerge following disturbance (Murphy et al. 2006; Sanderson et al.
2007; Sosnoskie et al. 2006). Although soil seedbank of pastures contains useful species, it is
also a reservoir of undesirable weedy species (Rice 1989). There are many ways to define weed.
Although each weed scientist has a clear understanding of the term weed, but there is no
universal definition that is accepted by all scientists. In 1967 the Weed Science Society of
America defined a weed as “a plant growing where it is not desired”. In 1989, it was changed to
“any plant that is objectionable or interferes with the activities or welfare of man”. The European
Weed Research Society defined a weed as “any plant or vegetation, excluding fungi, interfering
with the objectives or requirements of people” (Zimdahl 2007). Since in this thesis the focus was
on the quality and yield of seeded native species, we considered any non-seeded species as a
weed. Knowledge of soil weed seedbank composition can be useful for pasture manager, as it
may indicate which species most likely will emerge after a disturbance that opens a gap in the
sward and successional processes in the pasture (Sanderson et al. 2014).
Soil microsites contain different humidity, temperature and oxygen that affect seed fate in
the seedbank (Fenner 2000; Young et al. 2001). Other factors like solar radiation, CO2,
topography, longitude, latitude, slope, biotic factors like bacteria, predators and fungus can also
have an impact on seeds in the seedbank (Dekker 2011). Different seeds have different longevity
9
in the soil seedbank (Burnside et al. 1996; Telewski and Zeevaart 2002). Seeds at soil surface are
more likely to deplete faster due to predation and other rapid changes in the environmental
conditions (Roberts and Feast 1972). The composition of seedbank changes by seed rain and
losses (Dekker 2011). The seed rain provides additions to the active and dormant seed bank
(Harper 1977). Seed losses, on the other hand, occur due to mortality including predation,
pathogenic decay, unsuccessful germination and physiological seed death (Cavers 1983; Zorner
et al. 1984).
2.2.1 Seed dormancy
Seed dormancy is the phenomenon that seeds are unable to germinate in specific
situations as compared with non-dormant seeds that are indeed able to germinate (Baskin and
Baskin 2004). Dormancy is an important mechanism that prevents seed germination during
unsuitable conditions when there is a low chance of seedling survival (Black et al. 2006); thus
seed dormancy improves plants’ ability to survive in natural situations (Grime 1981).
The soil seedbank can be classified as active and dormant. Active seeds are ready to
germinate under favorable situations, whereas dormant seeds do not germinate even in favorable
situations. The active seeds can be transformed to dormant seeds and vice versa (Dekker 2011).
Seed dormancy can be classified as primary and secondary. Primary dormancy is an
innate dormancy present in the seeds at the first stages of seed formations, whereas secondary
dormancy is a dormant state that is induced in non-dormant seeds when the conditions for
germination are unfavorable (Benech-Arnold et al. 2000; Karssen 1982). Seed dormancy cycling
from primary to secondary dormancy happens to many weed species (Baskin and Baskin 1998).
Dormancy cycles in temperate environments, where there is an abundance of water, are most
often influenced by soil temperature (Batlla and Benech-Arnold 2003). For example, in a
summer annual species, dormancy is reduced by the low temperatures during winter, whereas
high temperatures during summer increase the level of seed dormancy. In winter annual species,
on the other hand, the high temperature of summer reduces the dormancy and low temperature of
winter can induce secondary dormancy (Batlla and Benech-Arnold 2007). Many studies support
the primary role of soil temperature on seed dormancy, but there are some studies that show seed
dormancy might be regulated by soil moisture (Batlla and Benech-Arnold 2004; Benech-Arnold
et al. 2000).

10
Seed dormancy is not an all-or-nothing trait (Batlla and Benech-Arnold 2007). Seed
dormancy status can vary between some point of maximum and some point of minimum (Batlla
and Benech-Arnold 2004). Seeds with a low level of dormancy can germinate in a wide range of
environmental conditions until they reach a maximum level of germination. While seeds with a
high level of dormancy show a narrow range of environmental conditions allow for germination,
until germination is no longer possible at any temperature or water potential (Batlla and Benech-
Arnold 2004; Benech-Arnold et al. 2000).
2.2.2 Seedbank dynamics
Weed seedbank composition changes over time (Warr et al. 1993). Many weed seeds are
dormant in the seed rain, but over time some will lose their dormancy (Dekker 2011). Other
seeds may remain non-dormant waiting for suitable conditions to germinate or enter secondary
dormancy (Forcella et al. 1997; Karssen 1980; Taylorson 1982). Annual change in seed
germinability in the soil seedbank has been reported for many weeds (Baskin and Baskin 1985).
In dormant seeds, both endogenous and exogenous factors may affect cyclic physiological
changes. This strategy is an important adaptation for weeds to survive in natural situations, and
germinate in an appropriate time to avoid fatal germination (Dekker 2011).
2.2.3 Seedbank management strategies
Weeds can significantly reduce forage yield and quality, affecting livestock production
qualities and increase rangeland management costs (DiTomaso 2000). Within the range of
available weed control practices, mechanical and chemical are the most commonly used methods
(Altieri and Liebman 1988). Understanding the processes affecting seedbank dynamics can help
managers to select better weed control strategies (Buhler et al. 1997; Dekker 1997; Dekker
2011).
The weed seedbank can be easier to manage in soils containing more diverse
communities of weed seeds compared to those that are dominated by a few problematic weeds
(Dekker 2011). Occupying the soil seedbank by a few dominant weeds is an indication that the
cropping systems are leaving some free niches to exploit (Dekker 2011). Diverse weed seedbank,
on the other hand, is an indication that fewer opportunities are available for weeds, and resources
are used by many species. Thus, communities that have few small unused resources are more
11
likely to have the smaller, more diverse and more easily managed weed seed bank flora (Dekker
2011).
2.2.4 Relationships between the weed seedbank and aboveground communities
While some studies have found strong relationships between the weed seedbank and
aboveground communities (Dessaint et al. 1997; Rahman et al. 2006; Rahman et al. 2001; Zhang
et al. 1998), others have found low correlations (Cardina and Sparrow 1996; Tracy and
Sanderson 2000; Webster et al. 2003). Generally, low similarity between aboveground plant
community and seedbank has been reported for perennial species (Bakker et al. 1996; Milberg
1995; Rabinowitz 1981; Schenkeveld and Verkaar 1984; Thompson and Grime 1979), and
greater similarity in annual communities (Chang et al. 2001; Moore 1980; Unger and Woodell
1993; Unger and Woodell 1996). Sanderson et al. (2014) also showed that permanent pasture can
have a more stable soil seedbank than that of recently cultivated lands. They also found that
annual weeds are more common in the seedbank of hayfields and recently seeded pastures,
whereas the weed seedbank in older pastures tended to be dominated by perennial grasses.
2.3 Allelopathy
Allelopathy is the direct or indirect, negative or positive effect of species on other species
by production and release of chemical materials (Inderjit and Callaway 2003; Rice 1984). The
word ‘Allelopathy’ was first coined in 1937 by Hans Molisch, an Austrian scientist, and is
derived from two Greek words: ‘Allelo’ (mutually) and ‘Pathy’ (suffering) (Fujii et al. 2004).
Plants produce more than 100,000 primary and secondary chemical compounds, many of which
can act as allelochemicals (Callaway and Howard 2007). Among them, phenolics and terpenoids
have been studied more widely, but the role of many secondary compounds is still unclear
(Reigosa et al. 1999). Phenolics are common in cool and humid climates, whereas terpenoids are
frequent in dry climates (Reigosa et al. 1999).
Most allelochemicals are water soluble and can enter the environment and affect the
adjacent plants in four ways: aboveground leaching, litter decomposition, shoot volatilization
and root exudates (Bonanomi et al. 2006; Gawronska and Golisz 2006; Nishida et al. 2005;
Reigosa et al. 1999). Litter decomposition has been recognized as the most important source of
allelochemical materials in many ecosystems (González et al. 1997; Souto et al. 1995).
Decomposition conditions of litter affect allelochemical production, where waterlogging and

12
anoxia can increase the production of allelochemicals (Patrick 1971). There are few studies on
root exudation, but it might be a very important process since it can directly affect soil
microorganisms and other plant roots (Robinson 1972). Allelochemical production in the roots of
plants can be affected by many factors like plant habitat, the age of root, temperature, water
stress, etc. (Inderjit and Callaway 2003; Reigosa et al. 1999).
2.3.1 Effects of allelochemicals on ecosystem
Allelopathy plays an important role in natural ecosystems (Rice 1984). Allelopathy can
affect plant species’ diversity, distribution, abundance, dominance, succession, climax,
community and agroecosystem productivity, weed invasion and the ecosystem structure and
function dramatically (Bias et al. 2003; Callaway and Aschehoug 2000; Chou 1999; Grant et al.
2003; Hierro and Callaway 2003; Inderjit et al. 2008; Rice 1972; Rice 1979).
Allelochemicals can only be effective if they are released into the environment with
adequate concentrations (Reigosa et al. 1999). Plants tend to produce more allelochemicals under
stresses (Einhellig 1996; Tang et al. 1995). The production of allelochemicals can be influenced
by many biotic and abiotic factors like light quality and quantity, nutritional deficits, water
stress, extreme temperatures, use of herbicides and pesticides, plant diseases, plant age and
genotype (Ahmed and Wardle 1994; Chung and Miller 1995; Einhellig 1996; Einhellig et al.
1970; Gerson and Kelsey 1998; Koeppe et al. 1976; Miller 1996; Mwaja et al. 1995).
2.3.2 Mode of action
Allelochemicals have different mode of actions (Seigler 1996). The most important
modes of actions include: effect on cell division, cell elongation, cell structure, cell wall,
ultrastructure of the cell, growth regulators (mostly inhibitors), membrane permeability, nutrient
uptake, stomatal aperture, photosynthesis and respiration (Reigosa et al. 1999). The effect of
allelochemicals on target plants is different from pesticides. Chemical pesticides are very target
specific and have stronger effects than that of allelochemicals (Reigosa et al. 1999). However,
Macías (1995) suggested that some allelochemicals can be as effective as commercial pesticides.
In natural conditions, allelochemicals are not produced and released in high enough
concentrations to suppress other species, and they are also not very stable in the environment and
are biodegraded easily like phenolic compounds (Blum 1998; Turner and Rice 1975). Juglone as
an exception can keep its allelopathic potential in humid soils for more than 90 days (Fisher
13
1978). Unlike herbicides that have one or few mode of actions (like ALS inhibitors),
allelochemicals can have different mode of actions simultaneously (Reigosa et al. 1999).
2.3.3 Allelopathic weed control
Allelopathy has long been recognized to influence plant–plant interactions and is a well-
known mechanism of weed suppression in some crops (Kumar et al. 2009; Milchunas et al.
2011). Allelopathic compounds released by donor crop plants can reduce both emergence and
growth of weeds (Zeng et al. 2008). A number of methods are available for weed control in
pastures including grazing, mechanical, cultural, chemical, biological and allelopathic weed
control (Bailey et al. 2010; Jabran et al. 2015). In some agricultural systems, especially organic
systems, allelopathic weed control can be one of the most important tactics available for
suppressing weeds (Jabran et al. 2015). There are many studies of the potential of allelopathic
crops for weed control (Milchunas et al. 2011; Singh et al. 2003), but much less is known about
the allelopathic potential of forage species in pastures. Allelopathic weed control through the
selection of forage species with high allelopathic properties for seeded pastures can be a practical
and sustainable way to suppress weeds. There are many benefits to using diverse mixtures of
forage species in seeded pastures (Mischkolz et al. 2013; Mischkolz et al. 2016) and moreover,
identifying those species with high allelopathic properties in the mixtures could reduce plant-
weed competition, increase forage productivity and decrease the cost of weed control in pastures.

14
CHAPTER 3
MIXTURES OF NATIVE PERENNIAL FORAGE SPECIES PRODUCE HIGHER
YIELD THAN PURE STANDS IN A LONG-TERM STUDY IN SEMI-ARID
ECOREGION OF SASKATCHEWAN, CANADA
Abstract
To evaluate the forage yield and quality of seven perennial native species in monoculture
and mixtures under a range of climate conditions, a 6-year field experiment was conducted at the
Agriculture and Agri-Food Canada (AAFC), Swift Current Research and Development Centre
(SCRDC), Saskatchewan, Canada. Seven native perennial forage species from three functional
groups (C3, C4 grasses and legumes) were seeded in 2010, in monocultures and mixtures. Forage
yield and quality (crude protein, acid detergent fiber (ADF), neutral detergent fiber (NDF),
phosphorus (P), calcium (Ca) and copper (Cu)) were measured during the first week of July and
last week of August in 2011-2016. Mixtures that included western wheatgrass (Pascopyrum
smithii) (WWG) produced greater yield, where 90% of the composition within these mixtures
was WWG. Adding bluebunch wheatgrass (Pseudoroegneria spicata) (BBW), little blue stem
(Schizachyrium scoparium) (LBS) and prairie clovers (Dalea spp.) to the mixtures can increase
the positive aspects of species diversity on stability and productivity in seeded pastures. Among
the grasses, WWG contained higher crude protein and lower ADF and NDF concentration.
Mixtures of forage species produced higher forage yield compared to monocultures. Native
forage species can produce stable forage yield across very different climate situations. In
mixtures, WWG showed promising results in forage productivity and quality and can be a
suitable option for seeded pastures.
3.1 Introduction
There is growing interest in the use of native perennial forage species for seeded pastures
and land reclamation projects in the Northern Great Plains. In this region, forage grasses are
commonly seeded in monoculture or in a mixture with legumes like alfalfa. The majority of
seeded forage species are cool-season grasses of Eurasian origin and, while highly productive,
the invasive characteristics of some of these introduced species is a serious threat to native
grasslands (Biligetu et al. 2014; DeKeyser et al. 2015; Otfinowski et al. 2007). Many native

15
prairie grasses are adapted to a broad range of soil and climatic conditions and have commercial
potential for forage production, soil reclamation, and long-term sustainability under grazing
(Schellenberg et al. 2012; Tilman et al. 2001; Willms et al. 2005).
Forage mixtures composed of native species have the potential to be as productive as
tame monocultures in a greater range of environmental conditions and may provide a more
reliable source of forage yield even in years with very different environmental conditions
(Lehman and Tilman 2000; Schellenberg et al. 2012). An ideal mixture would provide nutritious
and adequate forage throughout the growing season. Combinations of different species or
different functional groups may show additivity or complementarity in resource use which can
increase productivity (Brooker et al. 2008; Hooper et al. 2005a; Mischkolz et al. 2016; Picasso et
al. 2008; Weigelt et al. 2009) and plant community stability (Spehn et al. 2005; Tilman et al.
2001). Moreover, species diversity provides a mixed diet which can improve the nutritional
quality and palatability of forages (Holechek et al. 2004; Wang and Schellenberg 2012). In a
diverse forage mixture, warm-season and cool-season species with differing maturities have the
potential to provide higher forage quality for livestock over a longer period of the growing
season than a monoculture or simple cool-season mixtures (Jones and Wilson 1987; Tilman et al.
2001).
A number of recent studies have documented the advantage of forage mixtures for
western Canada. Schellenberg et al. (2012), for example, studied the forage production of 7-
species and 14-species mixtures of native cool and warm-season grasses in a semi-arid ecoregion
of Canada. Forage mixtures of cool-season grasses were more productive than a combination of
warm and cool-season grasses, however, mixtures that included warm-season grasses had
increased protein content in the late growing season which improve nutritive value of those
mixtures. Similarly, Biligetu et al. (2014) evaluated mixtures of grass-legume or monocultures of
grasses over a 7-year period where mixtures of alfalfa with cool-season grasses produced more
forage yield compared to warm-season grasses. The mixture of alfalfa and WWG ranked the
highest among other mixtures for forage quality and yield. Finally, Mischkolz et al. (2013)
showed that, though western wheatgrass dominated productivity in two-species native mixtures,
there were no negative effects of including other native species in the mixtures. Inclusion of less
productive species with traits such as drought tolerance may provide insurance against
productivity declines under sub-optimal conditions.
16
In this study, I evaluated the forage yield and quality of seven native perennial forage
species, including C3 and C4 grasses and legumes, in monoculture and mixtures over a 6-year
period in a semi-arid ecoregion of Saskatchewan, Canada. The objectives of this study were to:
(1) evaluate forage yield and quality of species in monocultures over time; (2) assess persistence
of less competitive species in the mixtures; (3) study the effects of functional group diversity on
forage productivity and quality; and (4) determine the long-term relationship between forage
mixtures and productivity.
3.2 Materials and Methods
This experiment was conducted at the Agriculture and Agri-Food Canada (AAFC), Swift
Current Research and Development Centre (SCRDC) near Swift Current (latitude 50°25′N,
longitude 107°44′W, 824 m elevation), Saskatchewan, Canada. This area is located in the Dry
Mixed Grass Prairie ecoregion, which is the driest part of the province. This ecoregion has an
Orthic Brown Chernozemic soil (Swinton loam) with a pH of 7.4 (Ayers et al. 1985; Bailey et al.
2010). The average annual temperature, annual precipitation and May-July precipitation is 4.1
°C, 327 mm and 153 mm, respectively (Bailey et al. 2010). Weather data were collected for
2011-2016 and compared to the 120-year average from the AAFC, SCRDC (Figure 3.1). In
general, 2016 was the 4th wettest year on record (May-July precipitation was 347 mm), whereas
2015 was one of the driest years in the last 120 years in Swift Current (May-July precipitation
was 125 mm).
3.2.1 Forage Species
Seven North American native perennial forage species from three functional groups were
selected, including three C3 grasses, two C4 grasses and two legumes (Table 3.1). These species
were evaluated in greenhouse studies (Mischkolz et al. 2016) and field studies in Saskatoon and
Swift Current, SK, (Biligetu et al. 2014; Mischkolz et al. 2013; Schellenberg et al. 2012) and
also they are under evaluation in ongoing field studies in Swift Current and Brandon, MB.
3.2.2 Experimental Design
Forage species were seeded in a split-plot block design with four replicates of 30
treatments in June 2010. Treatments in each block included seven ‘monoculture’ plots, 21 ‘two-
species mixture’ plots, one ‘seven-species mixture’ plot and one ‘blank’ or non-seeded plot.
17
Plots were summer fallowed for one year before starting the experiment. Weed control practices
began in the spring of 2010 before planting the forage species with Roundup WeatherMAX®
(Monsanto Canada Inc., Winnipeg, Canada) at a rate of 0.82 L ha-1) and eleven days later with 2-
4DB Cobutox® 625 (Interprovincial Cooperative Limited, Winnipeg, Canada) in the rate of 2.47
L ha-1. Neither herbicide nor fertilizer was applied after seeding the forage species. Forage
species were seeded with a press drill at the depth of 1.3 cm, in 4×8 m plots with 12 rows spaced
22.5 cm apart. Grass and legume species were planted at a rate of 100 and 200 pure live
seeds m-1, respectively. In two-species mixtures and seven-species mixtures, the seeding rate was
reduced to half and one seventh of the monoculture plots, respectively. In the mixture plots, all
species were seeded in the same row. Full details on the experimental design are provided in
Mischkolz et al. (2013).
3.2.3 Forage Yield
Forage production was measured in the first week of July (mid-season) and last week of
August (late-season) in 2011-2016 by clipping aboveground biomass at ground level from two
separate square-meter quadrats from different spots in each plot. In 2014-2016, forage species in
the mixture plots (two-species and seven-species mixture plots) were separated by hand to
evaluate the proportion of each species in the stand. Clipped biomass of seeded forage species
was dried in a forced-air oven at 60 °C to constant mass and weighed.
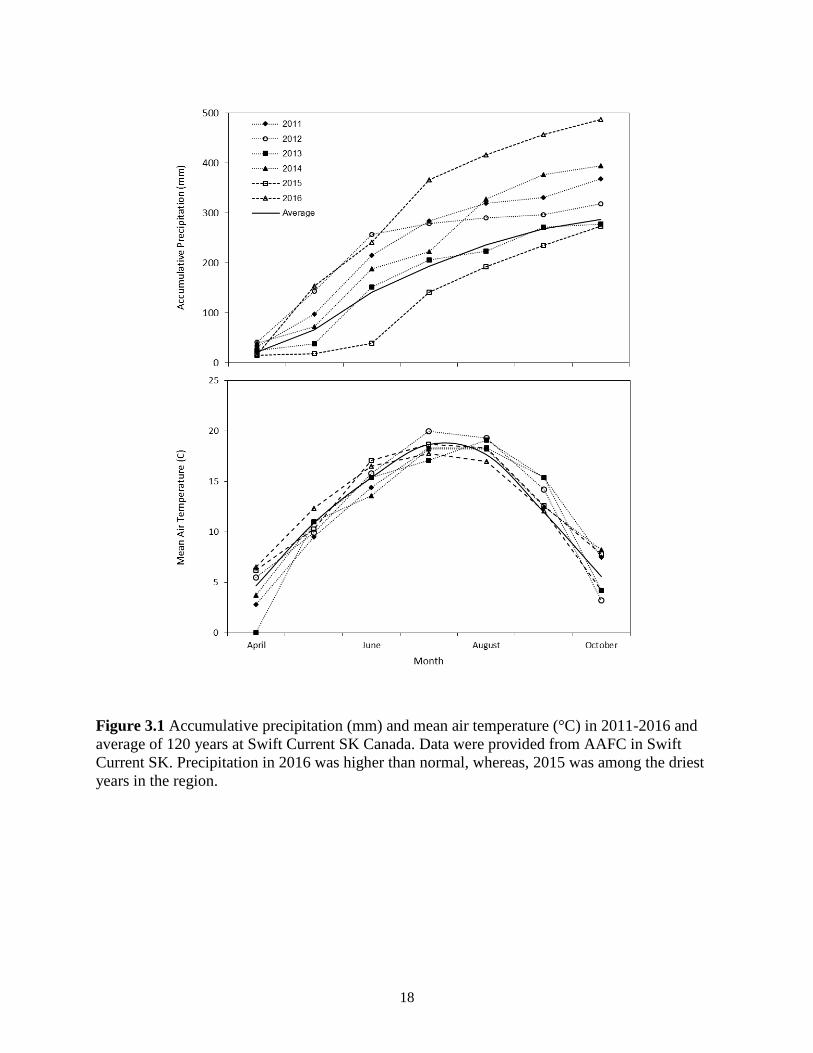
18
Figure 3.1 Accumulative precipitation (mm) and mean air temperature (°C) in 2011-2016 and
average of 120 years at Swift Current SK Canada. Data were provided from AAFC in Swift
Current SK. Precipitation in 2016 was higher than normal, whereas, 2015 was among the driest
years in the region.
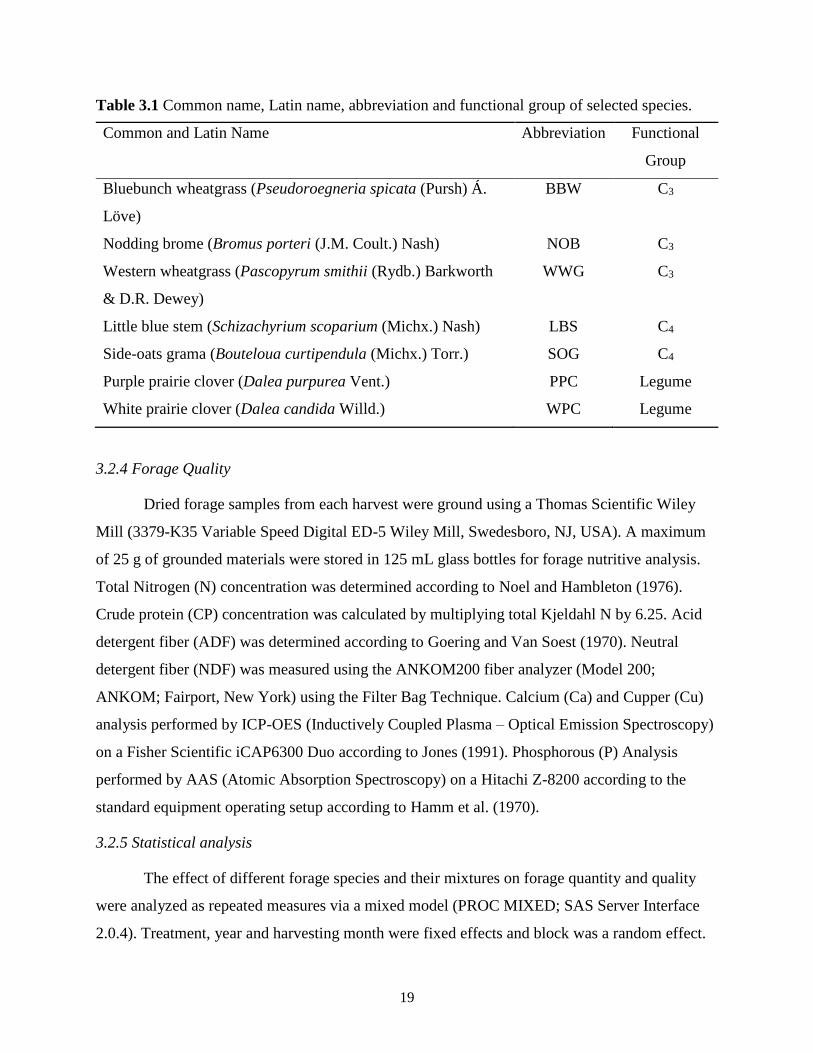
19
Table 3.1 Common name, Latin name, abbreviation and functional group of selected species.
Common and Latin Name Abbreviation Functional
Group
Bluebunch wheatgrass (Pseudoroegneria spicata (Pursh) Á.
Löve)
BBW C3
Nodding brome (Bromus porteri (J.M. Coult.) Nash) NOB C3
Western wheatgrass (Pascopyrum smithii (Rydb.) Barkworth
& D.R. Dewey)
WWG C3
Little blue stem (Schizachyrium scoparium (Michx.) Nash) LBS C4
Side-oats grama (Bouteloua curtipendula (Michx.) Torr.) SOG C4
Purple prairie clover (Dalea purpurea Vent.) PPC Legume
White prairie clover (Dalea candida Willd.) WPC Legume
3.2.4 Forage Quality
Dried forage samples from each harvest were ground using a Thomas Scientific Wiley
Mill (3379-K35 Variable Speed Digital ED-5 Wiley Mill, Swedesboro, NJ, USA). A maximum
of 25 g of grounded materials were stored in 125 mL glass bottles for forage nutritive analysis.
Total Nitrogen (N) concentration was determined according to Noel and Hambleton (1976).
Crude protein (CP) concentration was calculated by multiplying total Kjeldahl N by 6.25. Acid
detergent fiber (ADF) was determined according to Goering and Van Soest (1970). Neutral
detergent fiber (NDF) was measured using the ANKOM200 fiber analyzer (Model 200;
ANKOM; Fairport, New York) using the Filter Bag Technique. Calcium (Ca) and Cupper (Cu)
analysis performed by ICP-OES (Inductively Coupled Plasma – Optical Emission Spectroscopy)
on a Fisher Scientific iCAP6300 Duo according to Jones (1991). Phosphorous (P) Analysis
performed by AAS (Atomic Absorption Spectroscopy) on a Hitachi Z-8200 according to the
standard equipment operating setup according to Hamm et al. (1970).
3.2.5 Statistical analysis
The effect of different forage species and their mixtures on forage quantity and quality
were analyzed as repeated measures via a mixed model (PROC MIXED; SAS Server Interface
2.0.4). Treatment, year and harvesting month were fixed effects and block was a random effect.
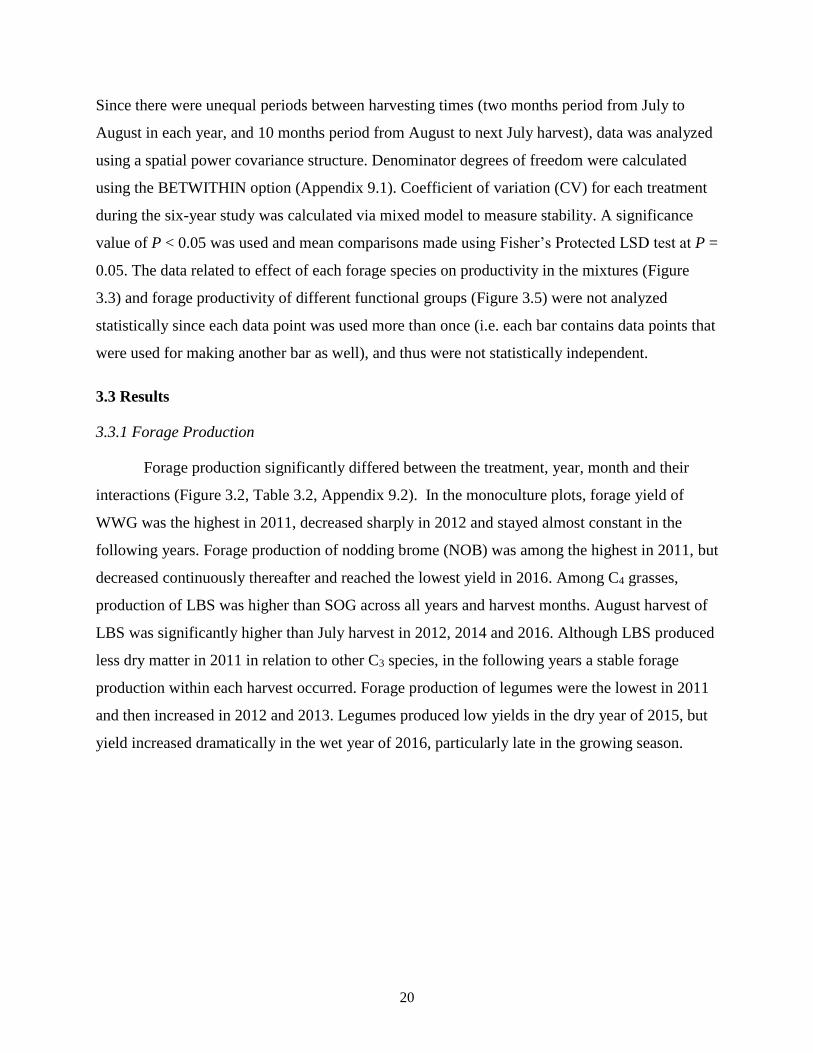
20
Since there were unequal periods between harvesting times (two months period from July to
August in each year, and 10 months period from August to next July harvest), data was analyzed
using a spatial power covariance structure. Denominator degrees of freedom were calculated
using the BETWITHIN option (Appendix 9.1). Coefficient of variation (CV) for each treatment
during the six-year study was calculated via mixed model to measure stability. A significance
value of P < 0.05 was used and mean comparisons made using Fisher’s Protected LSD test at P =
0.05. The data related to effect of each forage species on productivity in the mixtures (Figure
3.3) and forage productivity of different functional groups (Figure 3.5) were not analyzed
statistically since each data point was used more than once (i.e. each bar contains data points that
were used for making another bar as well), and thus were not statistically independent.
3.3 Results
3.3.1 Forage Production
Forage production significantly differed between the treatment, year, month and their
interactions (Figure 3.2, Table 3.2, Appendix 9.2). In the monoculture plots, forage yield of
WWG was the highest in 2011, decreased sharply in 2012 and stayed almost constant in the
following years. Forage production of nodding brome (NOB) was among the highest in 2011, but
decreased continuously thereafter and reached the lowest yield in 2016. Among C4 grasses,
production of LBS was higher than SOG across all years and harvest months. August harvest of
LBS was significantly higher than July harvest in 2012, 2014 and 2016. Although LBS produced
less dry matter in 2011 in relation to other C3 species, in the following years a stable forage
production within each harvest occurred. Forage production of legumes were the lowest in 2011
and then increased in 2012 and 2013. Legumes produced low yields in the dry year of 2015, but
yield increased dramatically in the wet year of 2016, particularly late in the growing season.
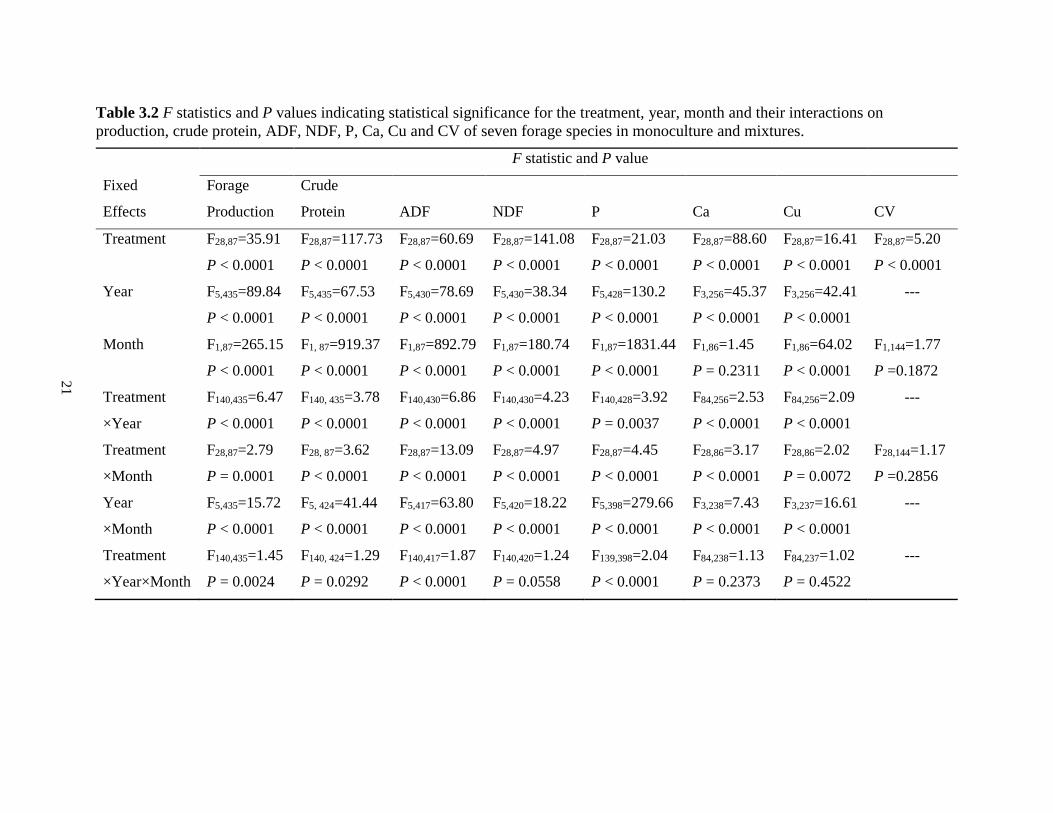
21
Table 3.2 F statistics and P values indicating statistical significance for the treatment, year, month and their interactions on
production, crude protein, ADF, NDF, P, Ca, Cu and CV of seven forage species in monoculture and mixtures.
F statistic and P value
Fixed
Effects
Forage
Production
Crude
Protein
ADF
NDF
P
Ca
Cu
CV
Treatment F28,87=35.91
P < 0.0001
F28,87=117.73
P < 0.0001
F28,87=60.69
P < 0.0001
F28,87=141.08
P < 0.0001
F28,87=21.03
P < 0.0001
F28,87=88.60
P < 0.0001
F28,87=16.41
P < 0.0001
F28,87=5.20
P < 0.0001
Year F5,435=89.84
P < 0.0001
F5,435=67.53
P < 0.0001
F5,430=78.69
P < 0.0001
F5,430=38.34
P < 0.0001
F5,428=130.2
P < 0.0001
F3,256=45.37
P < 0.0001
F3,256=42.41
P < 0.0001
---
Month F1,87=265.15
P < 0.0001
F1, 87=919.37
P < 0.0001
F1,87=892.79
P < 0.0001
F1,87=180.74
P < 0.0001
F1,87=1831.44
P < 0.0001
F1,86=1.45
P = 0.2311
F1,86=64.02
P < 0.0001
F1,144=1.77
P =0.1872
Treatment
×Year
F140,435=6.47
P < 0.0001
F140, 435=3.78
P < 0.0001
F140,430=6.86
P < 0.0001
F140,430=4.23
P < 0.0001
F140,428=3.92
P = 0.0037
F84,256=2.53
P < 0.0001
F84,256=2.09
P < 0.0001
---
Treatment
×Month
F28,87=2.79
P = 0.0001
F28, 87=3.62
P < 0.0001
F28,87=13.09
P < 0.0001
F28,87=4.97
P < 0.0001
F28,87=4.45
P < 0.0001
F28,86=3.17
P < 0.0001
F28,86=2.02
P = 0.0072
F28,144=1.17
P =0.2856
Year
×Month
F5,435=15.72
P < 0.0001
F5, 424=41.44
P < 0.0001
F5,417=63.80
P < 0.0001
F5,420=18.22
P < 0.0001
F5,398=279.66
P < 0.0001
F3,238=7.43
P < 0.0001
F3,237=16.61
P < 0.0001
---
Treatment
×Year×Month
F140,435=1.45
P = 0.0024
F140, 424=1.29
P = 0.0292
F140,417=1.87
P < 0.0001
F140,420=1.24
P = 0.0558
F139,398=2.04
P < 0.0001
F84,238=1.13
P = 0.2373
F84,237=1.02
P = 0.4522
---
21

22
3.3.2 Species Composition
The biomass ratio changed dramatically over time (Table 3.3). In Table 3.3 only
proportion of seeded species are provided; weeds and non-seeded forage species in each plot
were not included in the species composition. In mixtures of legumes and grasses (except
WWG), more than 15% of the forage yield was from legumes, but in the mixture of
WWG+legumes, only 1-11% of the yield was from legumes. In the mixtures of C4+C3 grasses
(except WWG), the proportion of forage species in the mixture was dependent on forage species
and harvesting time. Generally, the proportion of C3 grasses was higher than C4 grasses in July,
and reversed in August. Whereas, the majority of forage yield in WWG+C4 mixtures was from
WWG at all sampling dates and years. In the mixtures of WWG and the other two C3 grasses,
WWG composed more than 97% of the stand. In the mixture of two C4 grasses, the proportion of
LBS was higher than SOG at all sampling dates.
3.3.3 Forage production of functional groups, monocultures vs. mixtures
Mixtures, in which WWG was a component, produced the highest forage yield at both
harvesting times (Figure 3.3). In all years and harvesting times, forage production from mixture
plots was higher than monoculture plots (Figure 3.4, Table 3.4). Mixtures of C3+C3 grasses
produced the highest forage yield in 2011 (Figure 3.5). In general, mixtures containing C3s
followed by C4s and legumes contributed the most in forage productivity.
There was significant effect of forage species on the temporal stability of forage
production (Table 3.2; Table 3.6). Among monocultures, WWG had the lowest CV followed by
LBS which indicated that temporal stability of these two forage species were greater than other
studied species. Legumes, on the other hand, contained the highest CV among species. Mixtures
containing WWG had the lowest CV, but mixtures containing legumes and NOB, on the other
hand, had the highest CV compared to other mixtures.
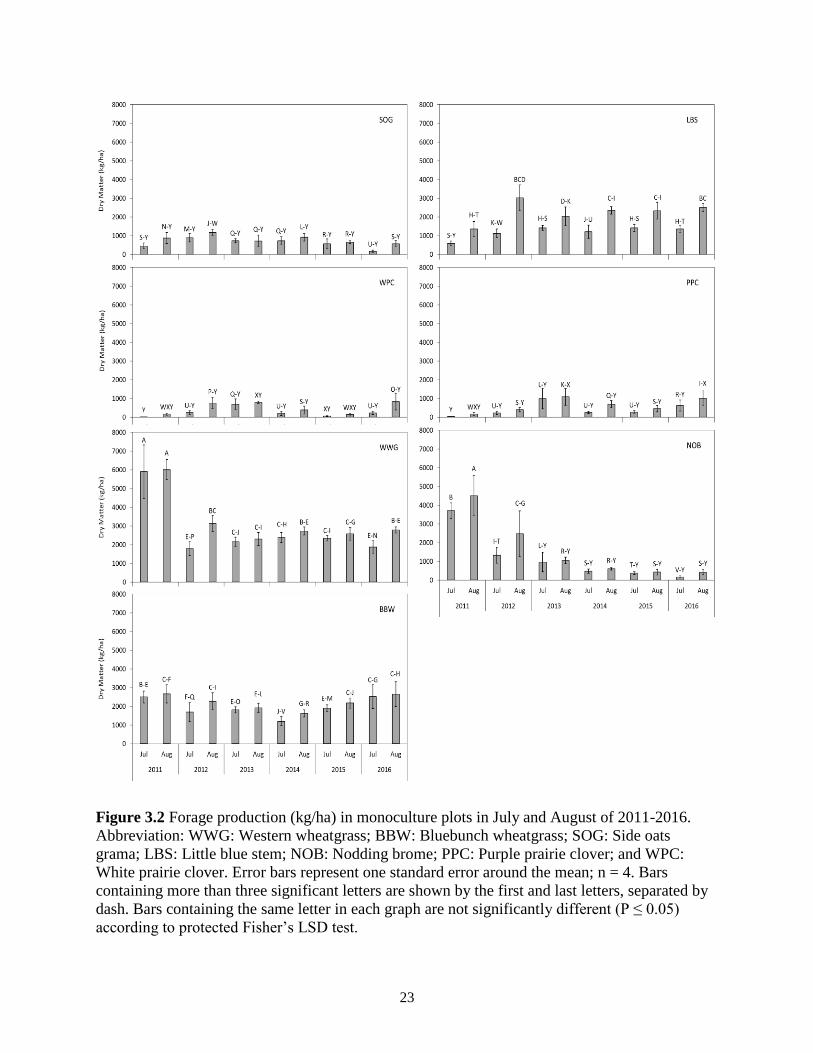
23
Figure 3.2 Forage production (kg/ha) in monoculture plots in July and August of 2011-2016.
Abbreviation: WWG: Western wheatgrass; BBW: Bluebunch wheatgrass; SOG: Side oats
grama; LBS: Little blue stem; NOB: Nodding brome; PPC: Purple prairie clover; and WPC:
White prairie clover. Error bars represent one standard error around the mean; n = 4. Bars
containing more than three significant letters are shown by the first and last letters, separated by
dash. Bars containing the same letter in each graph are not significantly different (P ≤ 0.05)
according to protected Fisher’s LSD test.
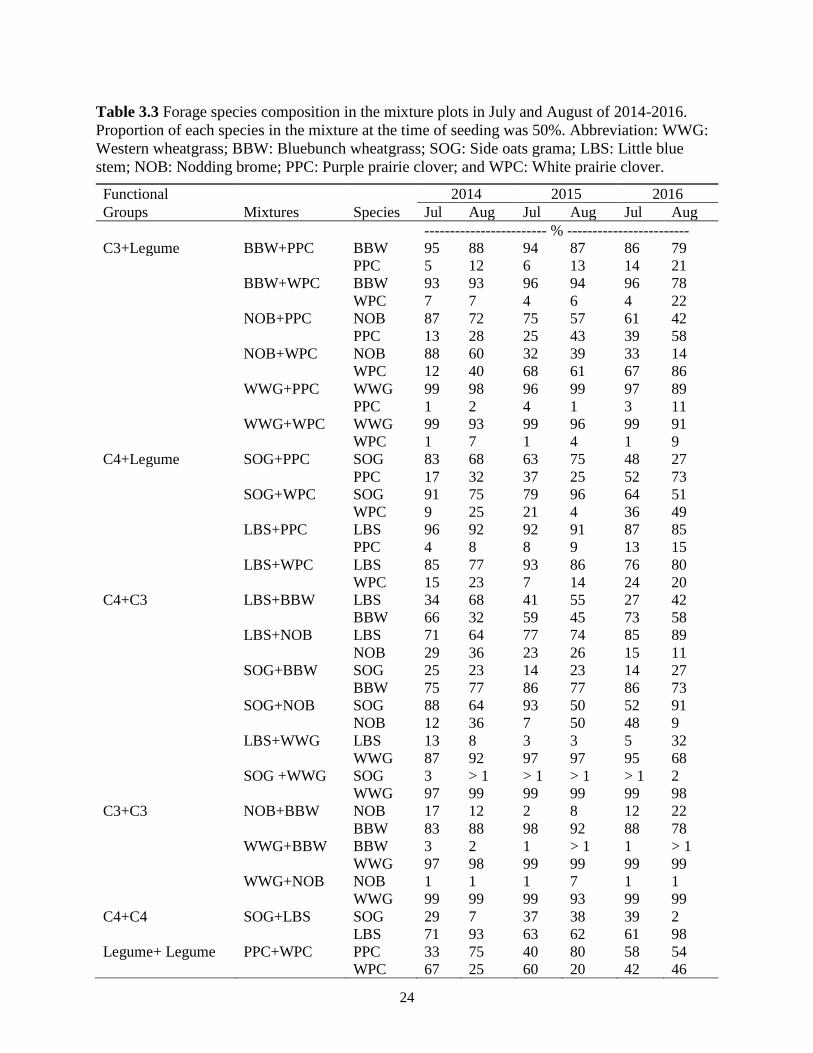
24
Table 3.3 Forage species composition in the mixture plots in July and August of 2014-2016.
Proportion of each species in the mixture at the time of seeding was 50%. Abbreviation: WWG:
Western wheatgrass; BBW: Bluebunch wheatgrass; SOG: Side oats grama; LBS: Little blue
stem; NOB: Nodding brome; PPC: Purple prairie clover; and WPC: White prairie clover.
Functional 2014 2015 2016
Groups Mixtures Species Jul Aug Jul Aug Jul Aug
------------------------ % ------------------------
C3+Legume BBW+PPC BBW 95 88 94 87 86 79
PPC 5 12 6 13 14 21
BBW+WPC BBW 93 93 96 94 96 78
WPC 7 7 4 6 4 22
NOB+PPC NOB 87 72 75 57 61 42
PPC 13 28 25 43 39 58
NOB+WPC NOB 88 60 32 39 33 14
WPC 12 40 68 61 67 86
WWG+PPC WWG 99 98 96 99 97 89
PPC 1 2 4 1 3 11
WWG+WPC WWG 99 93 99 96 99 91
WPC 1 7 1 4 1 9
C4+Legume SOG+PPC SOG 83 68 63 75 48 27
PPC 17 32 37 25 52 73
SOG+WPC SOG 91 75 79 96 64 51
WPC 9 25 21 4 36 49
LBS+PPC LBS 96 92 92 91 87 85
PPC 4 8 8 9 13 15
LBS+WPC LBS 85 77 93 86 76 80
WPC 15 23 7 14 24 20
C4+C3 LBS+BBW LBS 34 68 41 55 27 42
BBW 66 32 59 45 73 58
LBS+NOB LBS 71 64 77 74 85 89
NOB 29 36 23 26 15 11
SOG+BBW SOG 25 23 14 23 14 27
BBW 75 77 86 77 86 73
SOG+NOB SOG 88 64 93 50 52 91
NOB 12 36 7 50 48 9
LBS+WWG LBS 13 8 3 3 5 32
WWG 87 92 97 97 95 68
SOG +WWG SOG 3 > 1 > 1 > 1 > 1 2
WWG 97 99 99 99 99 98
C3+C3 NOB+BBW NOB 17 12 2 8 12 22
BBW 83 88 98 92 88 78
WWG+BBW BBW 3 2 1 > 1 1 > 1
WWG 97 98 99 99 99 99
WWG+NOB NOB 1 1 1 7 1 1
WWG 99 99 99 93 99 99
C4+C4 SOG+LBS SOG 29 7 37 38 39 2
LBS 71 93 63 62 61 98
Legume+ Legume PPC+WPC PPC 33 75 40 80 58 54
WPC 67 25 60 20 42 46
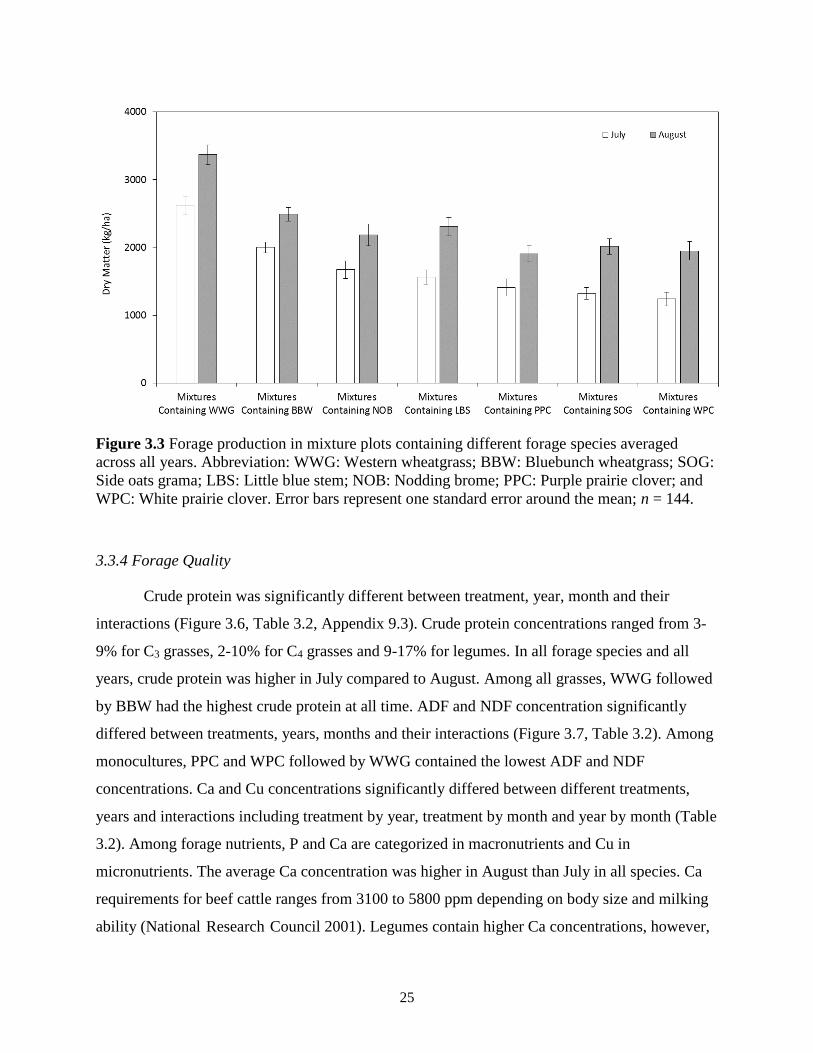
25
Figure 3.3 Forage production in mixture plots containing different forage species averaged
across all years. Abbreviation: WWG: Western wheatgrass; BBW: Bluebunch wheatgrass; SOG:
Side oats grama; LBS: Little blue stem; NOB: Nodding brome; PPC: Purple prairie clover; and
WPC: White prairie clover. Error bars represent one standard error around the mean; n = 144.
3.3.4 Forage Quality
Crude protein was significantly different between treatment, year, month and their
interactions (Figure 3.6, Table 3.2, Appendix 9.3). Crude protein concentrations ranged from 3-
9% for C3 grasses, 2-10% for C4 grasses and 9-17% for legumes. In all forage species and all
years, crude protein was higher in July compared to August. Among all grasses, WWG followed
by BBW had the highest crude protein at all time. ADF and NDF concentration significantly
differed between treatments, years, months and their interactions (Figure 3.7, Table 3.2). Among
monocultures, PPC and WPC followed by WWG contained the lowest ADF and NDF
concentrations. Ca and Cu concentrations significantly differed between different treatments,
years and interactions including treatment by year, treatment by month and year by month (Table
3.2). Among forage nutrients, P and Ca are categorized in macronutrients and Cu in
micronutrients. The average Ca concentration was higher in August than July in all species. Ca
requirements for beef cattle ranges from 3100 to 5800 ppm depending on body size and milking
ability (National-Research-Council 2001). Legumes contain higher Ca concentrations, however,

26
plant species, maturity and tissue age can affect the concentrations of minerals in forages (Grings
et al. 1996). In this study, the range of Ca varied between 1200-5000 ppm for grasses and 12000-
21000 ppm for legumes. BBW contained the lowest range of Ca concentrations and legumes
contained 2.4-17.5 times more Ca concentrations than grasses. The recommended level of Cu is
8 ppm for beef cattle (National-Research-Council 2001) which Karn and Hofmann (1990) found
that Cu concentrations in forage species were below recommended levels in many North
American pastures. In this study, legumes contained 1.5-6 times more Cu than grasses, and the
average of Cu concentrations in legumes were higher in July. Cu concentrations in C3 and C4
grasses ranged between 1-4 ppm and in legumes ranged between 4-6 ppm. Cu concentrations in
WWG increased from 1 ppm in 2011 to 4 ppm in 2014. Beef cattle require 0.21-0.26% P in their
diets (National-Research-Council 2001). Concentration of P differed significantly between the
different treatments, years, months and their interactions (Table 3.2). Generally, concentrations
of P and Cu decreased whereas concentrations of Ca increased from July to August (Table 3.5).
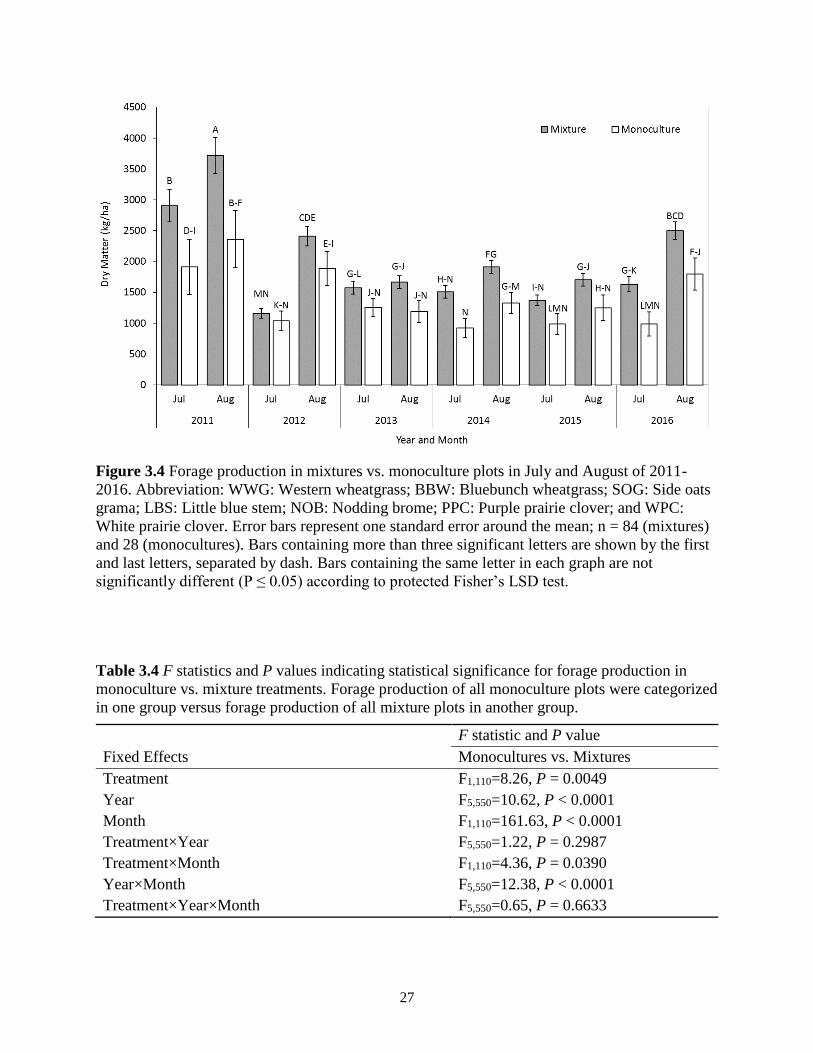
27
Figure 3.4 Forage production in mixtures vs. monoculture plots in July and August of 2011-
2016. Abbreviation: WWG: Western wheatgrass; BBW: Bluebunch wheatgrass; SOG: Side oats
grama; LBS: Little blue stem; NOB: Nodding brome; PPC: Purple prairie clover; and WPC:
White prairie clover. Error bars represent one standard error around the mean; n = 84 (mixtures)
and 28 (monocultures). Bars containing more than three significant letters are shown by the first
and last letters, separated by dash. Bars containing the same letter in each graph are not
significantly different (P ≤ 0.05) according to protected Fisher’s LSD test.
Table 3.4 F statistics and P values indicating statistical significance for forage production in
monoculture vs. mixture treatments. Forage production of all monoculture plots were categorized
in one group versus forage production of all mixture plots in another group.
F statistic and P value
Fixed Effects Monocultures vs. Mixtures
Treatment F1,110=8.26, P = 0.0049
Year F5,550=10.62, P < 0.0001
Month F1,110=161.63, P < 0.0001
Treatment×Year F5,550=1.22, P = 0.2987
Treatment×Month F1,110=4.36, P = 0.0390
Year×Month F5,550=12.38, P < 0.0001
Treatment×Year×Month F5,550=0.65, P = 0.6633
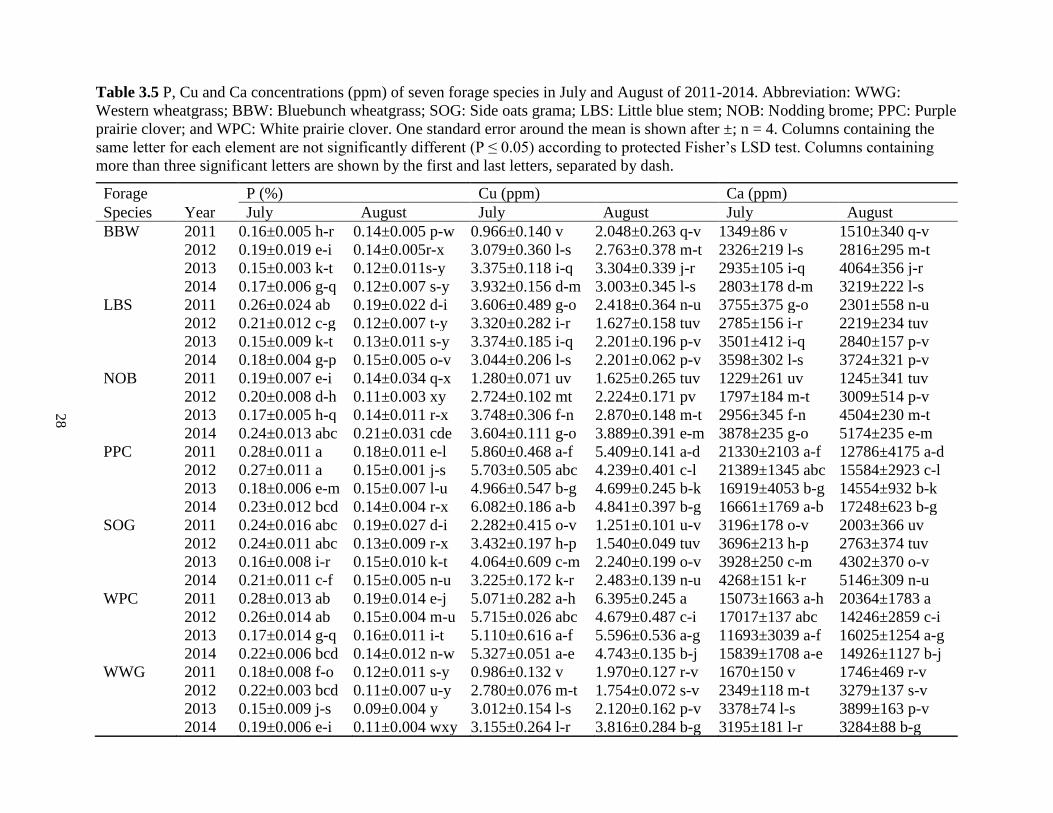
28
Table 3.5 P, Cu and Ca concentrations (ppm) of seven forage species in July and August of 2011-2014. Abbreviation: WWG:
Western wheatgrass; BBW: Bluebunch wheatgrass; SOG: Side oats grama; LBS: Little blue stem; NOB: Nodding brome; PPC: Purple
prairie clover; and WPC: White prairie clover. One standard error around the mean is shown after ±; n = 4. Columns containing the
same letter for each element are not significantly different (P ≤ 0.05) according to protected Fisher’s LSD test. Columns containing
more than three significant letters are shown by the first and last letters, separated by dash.
Forage P (%) Cu (ppm) Ca (ppm)
Species Year July August July August July August
BBW 2011 0.16±0.005 h-r 0.14±0.005 p-w 0.966±0.140 v 2.048±0.263 q-v 1349±86 v 1510±340 q-v
2012 0.19±0.019 e-i 0.14±0.005r-x 3.079±0.360 l-s 2.763±0.378 m-t 2326±219 l-s 2816±295 m-t
2013 0.15±0.003 k-t 0.12±0.011s-y 3.375±0.118 i-q 3.304±0.339 j-r 2935±105 i-q 4064±356 j-r
2014 0.17±0.006 g-q 0.12±0.007 s-y 3.932±0.156 d-m 3.003±0.345 l-s 2803±178 d-m 3219±222 l-s
LBS 2011 0.26±0.024 ab 0.19±0.022 d-i 3.606±0.489 g-o 2.418±0.364 n-u 3755±375 g-o 2301±558 n-u
2012 0.21±0.012 c-g 0.12±0.007 t-y 3.320±0.282 i-r 1.627±0.158 tuv 2785±156 i-r 2219±234 tuv
2013 0.15±0.009 k-t 0.13±0.011 s-y 3.374±0.185 i-q 2.201±0.196 p-v 3501±412 i-q 2840±157 p-v
2014 0.18±0.004 g-p 0.15±0.005 o-v 3.044±0.206 l-s 2.201±0.062 p-v 3598±302 l-s 3724±321 p-v
NOB 2011 0.19±0.007 e-i 0.14±0.034 q-x 1.280±0.071 uv 1.625±0.265 tuv 1229±261 uv 1245±341 tuv
2012 0.20±0.008 d-h 0.11±0.003 xy 2.724±0.102 mt 2.224±0.171 pv 1797±184 m-t 3009±514 p-v
2013 0.17±0.005 h-q 0.14±0.011 r-x 3.748±0.306 f-n 2.870±0.148 m-t 2956±345 f-n 4504±230 m-t
2014 0.24±0.013 abc 0.21±0.031 cde 3.604±0.111 g-o 3.889±0.391 e-m 3878±235 g-o 5174±235 e-m
PPC 2011 0.28±0.011 a 0.18±0.011 e-l 5.860±0.468 a-f 5.409±0.141 a-d 21330±2103 a-f 12786±4175 a-d
2012 0.27±0.011 a 0.15±0.001 j-s 5.703±0.505 abc 4.239±0.401 c-l 21389±1345 abc 15584±2923 c-l
2013 0.18±0.006 e-m 0.15±0.007 l-u 4.966±0.547 b-g 4.699±0.245 b-k 16919±4053 b-g 14554±932 b-k
2014 0.23±0.012 bcd 0.14±0.004 r-x 6.082±0.186 a-b 4.841±0.397 b-g 16661±1769 a-b 17248±623 b-g
SOG 2011 0.24±0.016 abc 0.19±0.027 d-i 2.282±0.415 o-v 1.251±0.101 u-v 3196±178 o-v 2003±366 uv
2012 0.24±0.011 abc 0.13±0.009 r-x 3.432±0.197 h-p 1.540±0.049 tuv 3696±213 h-p 2763±374 tuv
2013 0.16±0.008 i-r 0.15±0.010 k-t 4.064±0.609 c-m 2.240±0.199 o-v 3928±250 c-m 4302±370 o-v
2014 0.21±0.011 c-f 0.15±0.005 n-u 3.225±0.172 k-r 2.483±0.139 n-u 4268±151 k-r 5146±309 n-u
WPC 2011 0.28±0.013 ab 0.19±0.014 e-j 5.071±0.282 a-h 6.395±0.245 a 15073±1663 a-h 20364±1783 a
2012 0.26±0.014 ab 0.15±0.004 m-u 5.715±0.026 abc 4.679±0.487 c-i 17017±137 abc 14246±2859 c-i
2013 0.17±0.014 g-q 0.16±0.011 i-t 5.110±0.616 a-f 5.596±0.536 a-g 11693±3039 a-f 16025±1254 a-g
2014 0.22±0.006 bcd 0.14±0.012 n-w 5.327±0.051 a-e 4.743±0.135 b-j 15839±1708 a-e 14926±1127 b-j
WWG 2011 0.18±0.008 f-o 0.12±0.011 s-y 0.986±0.132 v 1.970±0.127 r-v 1670±150 v 1746±469 r-v
2012 0.22±0.003 bcd 0.11±0.007 u-y 2.780±0.076 m-t 1.754±0.072 s-v 2349±118 m-t 3279±137 s-v
2013 0.15±0.009 j-s 0.09±0.004 y 3.012±0.154 l-s 2.120±0.162 p-v 3378±74 l-s 3899±163 p-v
2014 0.19±0.006 e-i 0.11±0.004 wxy 3.155±0.264 l-r 3.816±0.284 b-g 3195±181 l-r 3284±88 b-g
28
29
3.4 Discussion
3.4.1 Productivity of forage species in monoculture
Among monoculture plots, WWG produced greater forage yield at all harvesting times.
The high productivity of WWG compared to other grasses can be related to its rhizomatous
growth behavior. Biligetu et al. (2014) found that rhizomatous C3 grasses, regardless of the
species’ origin, produce greater dry matter than caespitose grasses. Forage production of WWG
was the highest in 2011 and decreased in the following year. Increases in intraspecific
competition and reduction in soil N levels might be explanations for this forage reduction. NOB
performed well in 2011, but the forage yield decreased continuously thereafter and was among
the lowest producers in 2016. Therefore, NOB doesn’t seem to be a suitable option for stable and
long-term forage productivity in the dry-mix ecoregion. BBW, on the other hand, produced more
stable forage yield during the course of study and might be a good option for long-term stable
forage productivity in seeded pastures. Forage production of LBS was the highest in August of
2012 and its yield stayed stable in August of the following years.
3.4.2 Mixtures produced greater forage yield than monocultures
In this study mixtures of forage species were consistently more productive than
monocultures and demonstrated long-term benefits over monocultures. The mixture advantage
was greatest in 2011 (first year after seeding forage species) followed by the wet year of 2016.
Higher soil nutrients availability and lower intraspecific competition might explain the mixture
advantage in the first year after seeding. Among mixture plots, those containing WWG followed
by BBW, NOB and LBS had higher forage production. In the wet years, mixtures containing
WWG even outperformed the monoculture of WWG. During the course of the study, 2015 was
one of the driest years, whereas 2016 was one of the wettest years in the last 120 years in Swift
Current. We observed no significant differences in forage production of WWG in monoculture
and mixtures from dry to wet years. This yield stability across very different climate conditions
is highly desirable. Native species may not be as productive as introduced species in some areas,
but they can reduce the likelihood of yield failure in this semi-arid environment (Schellenberg et
al. 2012). Among monocultures WWG and LBS had the highest temporal stability (lower CV)
during the course of this study and NOB, PPC and WPC had the lowest temporal stability
30
(higher CV). Drought tolerance of WWG and LBS (USDA 2016) and also rhizomatous growth
behavior of WWG can be linked to higher stability of these species. However, regarding the high
forage production of NOB in the second year after seeding and the sharp decrease thereafter, the
low stability of NOB can be linked to sensitivity of this species to soil nutrients deficit or
increasing in the intraspecific competition. Species composition in mixture plots was highly
dependent on the growth behavior of each species in the mixture. WWG occupied more than
90% of the binary mixtures in 2014 and thereafter. WWG is a stronger competitor than the other
species tested here in both seedling and maturity stages (Zhang and Lamb 2011). These results
show the strong ability of WWG to occupy space, and limit the growth and survival of other
species. WWG is a perennial grass that grows densely with sod-forming rhizomes that can
occupy all the spaces between seeded rows (National-Research-Council 2001), and based on
WWG’s competitive ability, it may limit the presence of other species in the mixture. This
competitive ability of WWG can be also implemented for weed control and management in
seeded pastures, as many weeds may not find an empty niche to survive in a WWG sward
(Chapter 5).
Among different functional groups, mixtures containing C3 grasses consistently produced
greater forage yield. C3 grasses begin growth earlier than C4 grasses, reduce light quality and
quantity reaching C4 grasses; therefore, they can be more competitive and productive than C4
grasses in the Canadian Prairies (Jones 1992; Schellenberg et al. 2012). Among C4 grasses,
inclusion of LBS in the mixtures resulted in higher forage yields compared to SOG. LBS is a
drought tolerant grass with broad adaptation to different ecoregions, whereas SOG is moderately
drought tolerant (USDA 2016). In mixtures of C3+C4 grasses (except WWG), the proportion of
each functional group in the mixture varied was based on the growth behavior of each species.
We expected to see a higher proportion of C3s in the early to mid-growing season and C4s in the
late growing season. This expected pattern was observed in the BBW+LBS mixture, however
other possible patterns were also recorded from other C3+C4 mixtures.
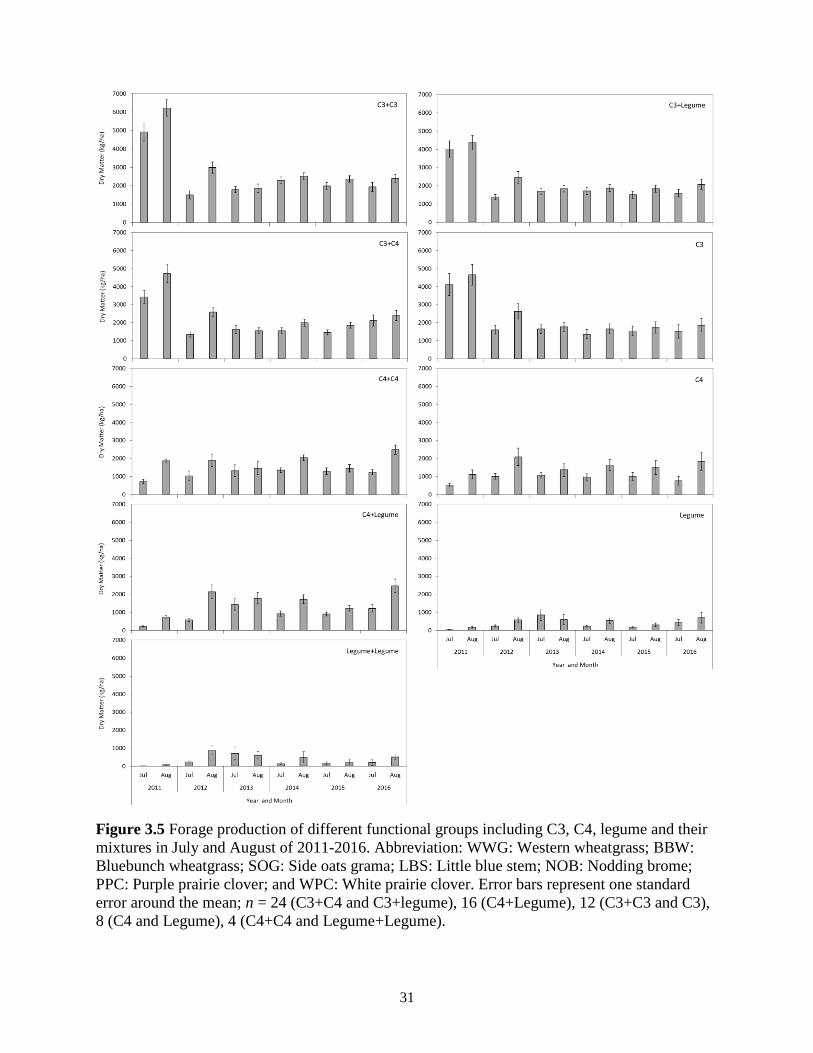
31
Figure 3.5 Forage production of different functional groups including C3, C4, legume and their
mixtures in July and August of 2011-2016. Abbreviation: WWG: Western wheatgrass; BBW:
Bluebunch wheatgrass; SOG: Side oats grama; LBS: Little blue stem; NOB: Nodding brome;
PPC: Purple prairie clover; and WPC: White prairie clover. Error bars represent one standard
error around the mean; n = 24 (C3+C4 and C3+legume), 16 (C4+Legume), 12 (C3+C3 and C3),
8 (C4 and Legume), 4 (C4+C4 and Legume+Legume).
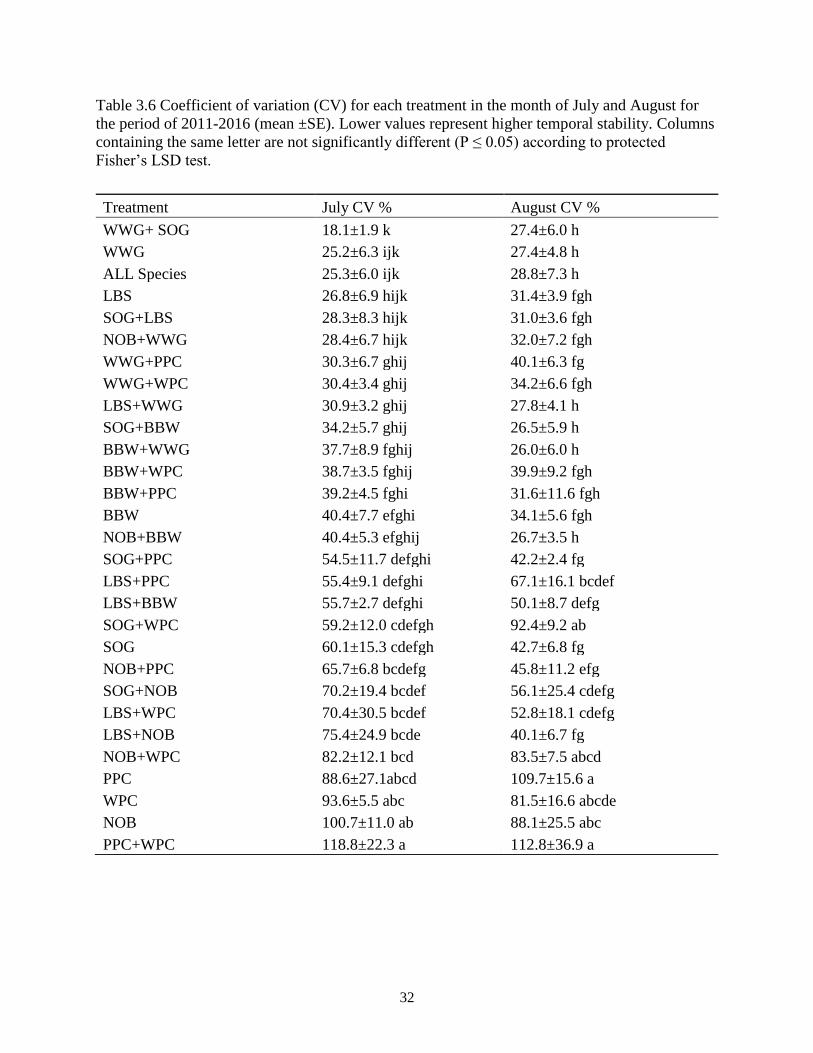
32
Table 3.6 Coefficient of variation (CV) for each treatment in the month of July and August for
the period of 2011-2016 (mean ±SE). Lower values represent higher temporal stability. Columns
containing the same letter are not significantly different (P ≤ 0.05) according to protected
Fisher’s LSD test.
Treatment July CV % August CV %
WWG+ SOG 18.1±1.9 k 27.4±6.0 h
WWG 25.2±6.3 ijk 27.4±4.8 h
ALL Species 25.3±6.0 ijk 28.8±7.3 h
LBS 26.8±6.9 hijk 31.4±3.9 fgh
SOG+LBS 28.3±8.3 hijk 31.0±3.6 fgh
NOB+WWG 28.4±6.7 hijk 32.0±7.2 fgh
WWG+PPC 30.3±6.7 ghij 40.1±6.3 fg
WWG+WPC 30.4±3.4 ghij 34.2±6.6 fgh
LBS+WWG 30.9±3.2 ghij 27.8±4.1 h
SOG+BBW 34.2±5.7 ghij 26.5±5.9 h
BBW+WWG 37.7±8.9 fghij 26.0±6.0 h
BBW+WPC 38.7±3.5 fghij 39.9±9.2 fgh
BBW+PPC 39.2±4.5 fghi 31.6±11.6 fgh
BBW 40.4±7.7 efghi 34.1±5.6 fgh
NOB+BBW 40.4±5.3 efghij 26.7±3.5 h
SOG+PPC 54.5±11.7 defghi 42.2±2.4 fg
LBS+PPC 55.4±9.1 defghi 67.1±16.1 bcdef
LBS+BBW 55.7±2.7 defghi 50.1±8.7 defg
SOG+WPC 59.2±12.0 cdefgh 92.4±9.2 ab
SOG 60.1±15.3 cdefgh 42.7±6.8 fg
NOB+PPC 65.7±6.8 bcdefg 45.8±11.2 efg
SOG+NOB 70.2±19.4 bcdef 56.1±25.4 cdefg
LBS+WPC 70.4±30.5 bcdef 52.8±18.1 cdefg
LBS+NOB 75.4±24.9 bcde 40.1±6.7 fg
NOB+WPC 82.2±12.1 bcd 83.5±7.5 abcd
PPC 88.6±27.1abcd 109.7±15.6 a
WPC 93.6±5.5 abc 81.5±16.6 abcde
NOB 100.7±11.0 ab 88.1±25.5 abc
PPC+WPC 118.8±22.3 a 112.8±36.9 a
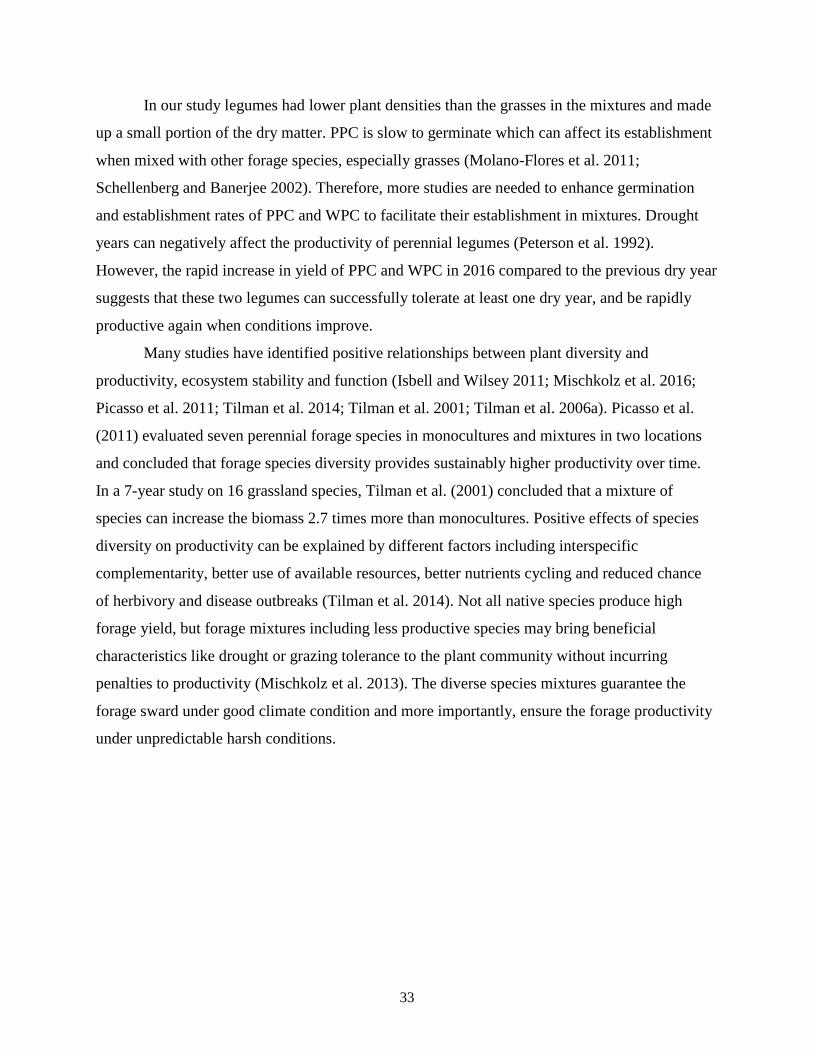
33
In our study legumes had lower plant densities than the grasses in the mixtures and made
up a small portion of the dry matter. PPC is slow to germinate which can affect its establishment
when mixed with other forage species, especially grasses (Molano-Flores et al. 2011;
Schellenberg and Banerjee 2002). Therefore, more studies are needed to enhance germination
and establishment rates of PPC and WPC to facilitate their establishment in mixtures. Drought
years can negatively affect the productivity of perennial legumes (Peterson et al. 1992).
However, the rapid increase in yield of PPC and WPC in 2016 compared to the previous dry year
suggests that these two legumes can successfully tolerate at least one dry year, and be rapidly
productive again when conditions improve.
Many studies have identified positive relationships between plant diversity and
productivity, ecosystem stability and function (Isbell and Wilsey 2011; Mischkolz et al. 2016;
Picasso et al. 2011; Tilman et al. 2014; Tilman et al. 2001; Tilman et al. 2006a). Picasso et al.
(2011) evaluated seven perennial forage species in monocultures and mixtures in two locations
and concluded that forage species diversity provides sustainably higher productivity over time.
In a 7-year study on 16 grassland species, Tilman et al. (2001) concluded that a mixture of
species can increase the biomass 2.7 times more than monocultures. Positive effects of species
diversity on productivity can be explained by different factors including interspecific
complementarity, better use of available resources, better nutrients cycling and reduced chance
of herbivory and disease outbreaks (Tilman et al. 2014). Not all native species produce high
forage yield, but forage mixtures including less productive species may bring beneficial
characteristics like drought or grazing tolerance to the plant community without incurring
penalties to productivity (Mischkolz et al. 2013). The diverse species mixtures guarantee the
forage sward under good climate condition and more importantly, ensure the forage productivity
under unpredictable harsh conditions.
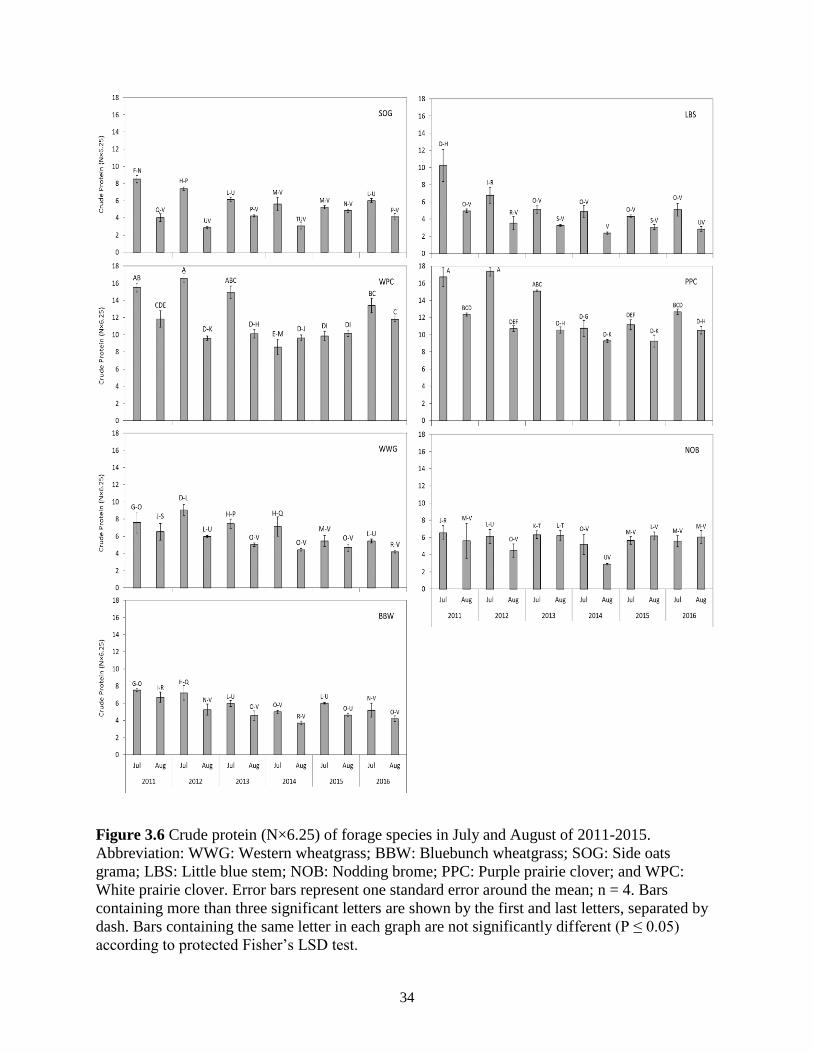
34
Figure 3.6 Crude protein (N×6.25) of forage species in July and August of 2011-2015.
Abbreviation: WWG: Western wheatgrass; BBW: Bluebunch wheatgrass; SOG: Side oats
grama; LBS: Little blue stem; NOB: Nodding brome; PPC: Purple prairie clover; and WPC:
White prairie clover. Error bars represent one standard error around the mean; n = 4. Bars
containing more than three significant letters are shown by the first and last letters, separated by
dash. Bars containing the same letter in each graph are not significantly different (P ≤ 0.05)
according to protected Fisher’s LSD test.
35
Figure 3.7 Acid detergent fiber (ADF) and neural detergent fiber (NDF) of seven forage species
in July and August of 2011-2016. Abbreviation: WWG: Western wheatgrass; BBW: Bluebunch
wheatgrass; SOG: Side oats grama; LBS: Little blue stem; NOB: Nodding brome; PPC: Purple
prairie clover; and WPC: White prairie clover. Error bars represent one standard error around the
mean; n = 4. Bars containing more than three significant letters are shown by the first and last
letters, separated by dash. Bars containing the same letter in each graph are not significantly
different (P ≤ 0.05) according to protected Fisher’s LSD test.
36
Side-oats grama was not as productive as LBS, and potentially indicating a lower
tolerance for drought. Although SOG did not perform well in the dry-mixed ecoregion high
forage productivity of SOG was recorded in an ongoing field experiment in Brandon, MB
(Chapter 4). Brandon is located in the tall grass prairie ecoregion and has higher precipitation
than Swift Current (Bailey et al. 2010). Therefore, SOG may be a more suitable as a forage
candidate in the Tall-Grass Prairie ecoregion than in the dry-mixed ecoregion.
3.4.3 WWG contains the highest crude protein and lowest ADF and NDF among grasses
Among grasses, WWG contained the highest crude protein concentration which was in
agreement with the data reported by Biligetu et al. (2014). Crude protein concentrations were
higher in July compared to August in all species in both monoculture and mixtures. The result
demonstrates that there is a negative relationship between plant maturity and the concentrations
of crude protein. The decreases in leaf:stem ratio can be another reason for lower crude protein
concentrations in late-season. PPC and WPC contained the higher crude protein concentration
compared to grasses and adding legumes to the grasses increased the crude protein concentration
of the mixtures.
Among all seven species, legumes contained the lowest ADF and NDF concentrations
followed by WWG. These results are in agreement with Biligetu et al. (2014) and Jefferson et al.
(2004). Jefferson et al. (2004) indicated that western wheatgrass contains the best potential
forage digestibility for fall grazing. In this study, average ADF concentrations in C4 grasses were
similar to C3 grasses but average NDF concentrations in C4 grasses were higher than C3 grasses.
Warm-season or C4 grasses tend to have more vascular tissue and thicker cell walls and more
fiber concentrations than C3 grasses (Van Soest 1994). However, short summer and average low
temperature can limit the fiber concentrations in C4 grasses of the Canadian Prairies (Jefferson et
al. 2004). Since plants contain more structural compounds in late growing season (Bélanger et al.
2001), in our study ADF and NDF concentrations in all species were higher in August compared
to July. Grasses in the late growing season tended to have a higher proportion of stem (structural
tissue) and lower proportion of cell contents (metabolic compounds) (Bélanger et al. 2001).
The concentrations of P were greater in July, and legumes contained the highest P
concentrations. Average P concentrations in WWG and BBW were the lowest among species.
LBS and SOG provided higher P concentrations than WWG which is in agreement with
Jefferson et al. (2004). Beef cattle require 0.21-0.26% P in their diets (National-Research-
37
Council 2001). In most years, P concentrations provided by grasses were lower than the
minimum requirement, suggesting a need to provide P supplements under this production
system. Biligetu et al. (2014) also indicated that P concentrations were lower than the
requirement in forage mixtures.
Legumes can increase the Ca concentrations in the forage mixtures. Plant species,
maturity and tissue age can affect the concentrations of minerals in forages (Grings et al. 1996).
Ca requirements for beef cattle ranges from 3100 to 5800 ppm depending on body size and
milking ability (National-Research-Council 2001). In our study, Ca concentrations in C3 grasses
did not meet this requirement in 2012 and 2013, but did in August of the following years. Grings
et al. (1996) also found that Ca concentrations in C3 grasses were lower than the minimum
requirement. The results showed that perennial C3 grasses may provide Ca requirement for beef
cattle after 4 years of establishment.
Grings et al. (1996) reported an average of 2 ppm Cu concentrations in WWG. The
recommended level of Cu is 8 ppm for beef cattle (National-Research-Council 2001), therefore,
it seems that grasses and legumes and their mixtures cannot provide Cu requirements for beef
cattle. Karn and Hofmann (1990) in North Dakota also found that Cu concentrations in forage
species were below recommended levels. In this study, Cu concentration average of C3 and C4
grasses was the same, however, Grings et al. (1996) reported 7 ppm for C3 grasses and 4 ppm for
C4 grasses.
3.5 Conclusion
This study was conducted over a six-year period to evaluate the forage yield and quality
of seven native North American species in monoculture and mixtures. Forage mixtures produced
greater dry matter than monocultures at all harvesting times. Mixtures of which WWG was a
component produced higher forage yield, therefore, WWG may be a key species to increase the
mixture productivity. In this study, a mixture of C3+C3 grasses produced higher forage yield,
however, adding LBS to the mixture can guarantee the productivity in late-season. Among
monoculture plots, WWG ranked the highest in forage productivity, but NOB doesn’t seem to be
a suitable option for stable and long-term forage productivity. Among grasses, WWG contained
the highest crude protein concentrations and the lowest ADF and NDF concentrations, indicating
WWG can be a nutritious forage species for seeded pastures. In this study, the forage species

38
experienced one of the driest and wettest years in the history of the region. We observed no
significant differences in forage production of all native species from dry to wet year. The results
support the idea of highly stability and productivity of native species during varying climate
conditions. In conclusion, a mixture of WWG, BBW, LBS and legumes can provide sustainable
forage yield and quality in varied climate conditions and can be suitable options for seeded
pastures.
39
CHAPTER 4
EVALUATION OF BINARY AND COMPLEX MIXTURES OF NATIVE FORAGE
SPECIES FOR THE DRY-MIXED AND TALL-GRASS ECOREGION OF CANADIAN
PRAIRIE
Abstract
This study was carried out to evaluate the forage yield and quality of binary and complex
mixtures of seven native North American species in two different ecoregions of Canadian
Prairie. The relative abundance of each species in the complex mixtures was calculated based on
a greenhouse study. Forage species were seeded in 2014 and 2016 in Swift Current and Brandon,
Canada, respectively. Forage yield was measured in early July and late-August in 2015-2016 in
Swift Current and mid-August in 2016 in Brandon. Species composition changed dramatically
from 2015 to 2016 in Swift Current. Monocultures of western wheatgrass (Pascopyrum smithii)
(WWG) and complex mixtures E (71% WWG, 5% noding brome (NOB), 5% little blue stem
(LBS), 9% side oats-grama (SOG), 5% white prairie clover (WPC) and 5% purple prairie clover
(PPC)), and mixture C (57% WWG, 5% bluebunch wheatgrass (BBW), 19% SOG and 19%
PPC) produced the highest dry matter; whereas, in Brandon, monoculture of side-oats grama
(Bouteloua curtipendula) and binary of SOG+purple prairie clover (Dalea purpurea) produced
the greatest yield. In conclusion, WWG and SOG strongly affect the productivity of mixtures in
dry-mixed and Tall-Grass Ecoregions, respectively. Western wheatgrass occupied more than 87
% of the forage mixture in 2016 regardless of the initial seeding rate. The results suggest that in
the Dry-Mixed Ecoregion WWG is a key species for forage productivity, however, mixtures
containing more than 57% WWG had no positive effect on productivity.
4.1 Introduction
There is a growing interest in using diverse plant communities in seeded pastures,
agriculture and agroforestry, however, identifying optimal species combinations and species
relative abundances is challenging (Kelty 2006; Malézieux et al. 2009; Mischkolz et al. 2016).
There is a great deal of evidence that forage productivity can improve with diverse community
composition, species richness, functional group richness and species evenness (Balvanera et al.
2006; Hooper et al. 2005b; Kirwan et al. 2007; Loreau et al. 2001; Mischkolz et al. 2016; Reiss

40
et al. 2009). Further, forage mixtures containing different functional groups can improve
nutritional quality and palatability (Holechek et al. 2004; Mischkolz et al. 2013; Wang and
Schellenberg 2012) increase primary production (Loreau et al. 2001) and enhance ecosystem
services like wildlife habitat quality and carbon sequestration (Symstad et al. 2003; Weigelt et al.
2009). It is also shown that increasing biodiversity can decrease the variability of ecosystem
function, therefore, insure the ecosystem against environmental fluctuations because of the
differential ability of each species to response to a changing environment (Loreau et al. 2001;
Tilman et al. 2006b; Yachi and Loreau 1999).
Mixtures of warm and cool-season species with differing maturities have the potential to
provide higher forage quality for livestock over a longer period of the growing season than a
monoculture or mixtures of only cool-season species (Jones and Wilson 1987; Tilman et al.
2001). Combinations of different species or different functional groups may show additivity or
complementarity in resource use which can increase productivity and plant community stability
(Brooker et al. 2008; Hooper et al. 2005a; Mischkolz et al. 2016; Picasso et al. 2008; Spehn et al.
2005; Tilman et al. 2001; Weigelt et al. 2009).
A number of studies have evaluated the productivity of simple and complex forage
mixtures. Schellenberg et al. (2012) studied the forage production of seven-species and 14-
species mixtures in semiarid Swift Current, SK. They found that seven-species mixtures had
greater dry matter and lower crude protein than the 14-species mixtures. They also concluded
that cool season grasses are more competitive than other species. Foster et al. (2014) also
evaluated forage yield of eleven treatments including monocultures of alfalfa and four grasses,
binary mixtures of grasses+alfalfa, five-species mixture and ten-species mixtures in more mesic
Melfort, SK. Alfalfa was included in all five-species and ten-species mixtures. They found that
five-species and ten-species mixtures produced greater dry matter than the monoculture of
grasses but lesser than binary mixtures or monoculture of alfalfa. Finally, Deak et al. (2007)
conducted a three-year study of forage productivity of simple (binary or three-species mixtures)
and complex (six-species mixtures) and very complex mixtures (nine-species mixtures) with
different relative abundance for each species. They found that six-species mixtures produced the
highest forage yield among other mixtures. However, at the end of the experiment only three
species of orchardgrass (Dactylis glomerata L.), tall fescue (Festuca arundinacea Schreb.), and
41
white clover (Trifolium repens L.) predominate the forage mixtures, regardless of the initial
seeding rate.
In this study, I evaluated forage yield and quality of seven native perennial forage
species, including C3, C4 and legumes, in monoculture, binary and complex mixtures in two
different ecoregions of the Canadian Prairie, Dry-Mixed Grass (Swift Current, SK) and Tall-
Grass Prairie (Brandon, MB). Mischkolz et al. (2016) developed a screening approach to identify
optimal mixtures, and this field study was conducted to test the greenhouse results. The
objectives of this study were to: (1) evaluate forage yield and quality of monocultures and simple
mixtures vs. complex mixtures; (2) determine the effect of each species in mixtures productivity;
and (3) assess the changes in mixture composition by time.
4.2 Materials and Methods
This experiment was conducted at the Agriculture and Agri-Food Canada (AAFC), Swift
Current Research and Development Centre (SCRDC) near Swift Current SK. A second trial was
conducted at the Brandon Research and Development Centre, Brandon MB, Canada. Only first
year data are available for the Brandon site, however, so all result from that site are reported in
the appendix. Swift Current is located in Dry-Mixed Grass Prairie ecoregion which is the driest
part of the province. The annual temperature, annual precipitation and May-July precipitation are
3.7 °C, 322 mm and 159 mm, respectively (Bailey et al. 2010). This ecoregion has an Orthic
Brown Chernozem soil (Swinton loam) and pH of 7.4 (Ayers et al. 1985; Bailey et al. 2010). In
general, 2016 was the 4th wettest in 120 years; whereas 2015 was one the driest years in the last
120 years in Swift Current.
4.2.1 Forage Species
Seven native perennial forage species from three functional groups were selected,
including three C3 grasses, two C4 grasses and two legumes (Table 4.1). These species were
evaluated in greenhouse studies by Mischkolz et al. (2016) and their results were evaluated in the
field situation in the present study. These species have also continued to be evaluated in field
studies in Saskatoon and Swift Current, SK (Biligetu et al. 2014; Mischkolz et al. 2013;
Schellenberg et al. 2012).
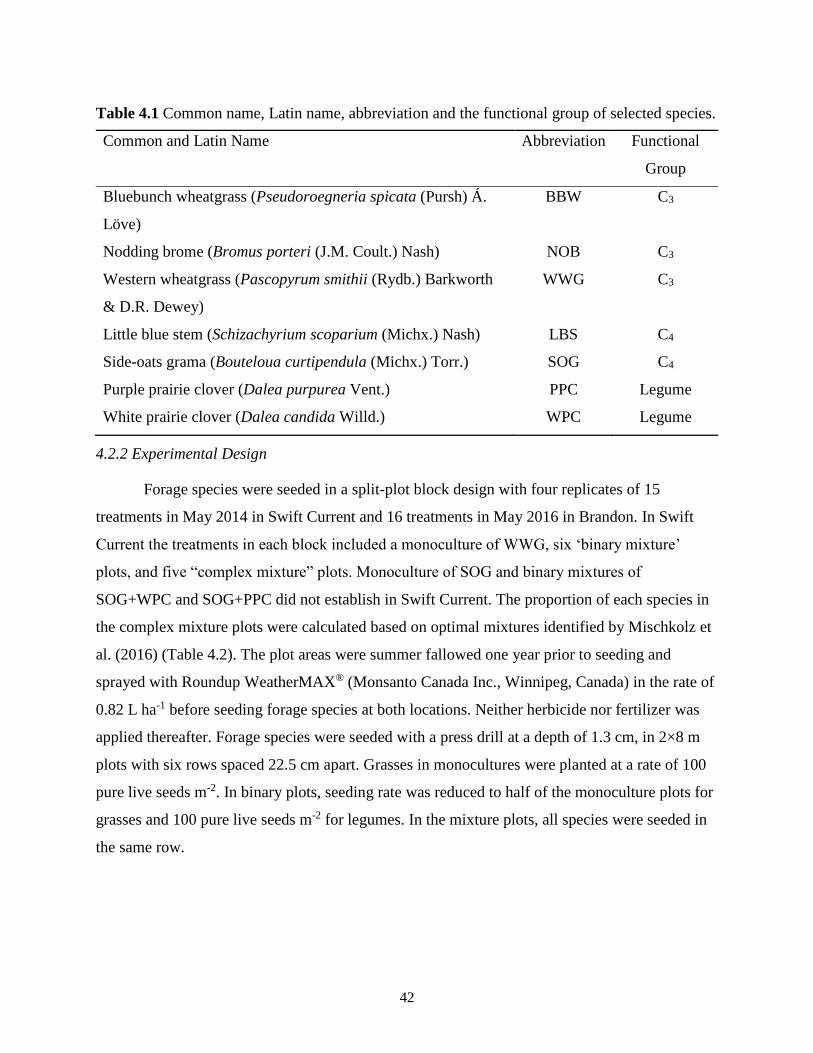
42
Table 4.1 Common name, Latin name, abbreviation and the functional group of selected species.
Common and Latin Name Abbreviation Functional
Group
Bluebunch wheatgrass (Pseudoroegneria spicata (Pursh) Á.
Löve)
BBW C3
Nodding brome (Bromus porteri (J.M. Coult.) Nash) NOB C3
Western wheatgrass (Pascopyrum smithii (Rydb.) Barkworth
& D.R. Dewey)
WWG C3
Little blue stem (Schizachyrium scoparium (Michx.) Nash) LBS C4
Side-oats grama (Bouteloua curtipendula (Michx.) Torr.) SOG C4
Purple prairie clover (Dalea purpurea Vent.) PPC Legume
White prairie clover (Dalea candida Willd.) WPC Legume
4.2.2 Experimental Design
Forage species were seeded in a split-plot block design with four replicates of 15
treatments in May 2014 in Swift Current and 16 treatments in May 2016 in Brandon. In Swift
Current the treatments in each block included a monoculture of WWG, six ‘binary mixture’
plots, and five “complex mixture” plots. Monoculture of SOG and binary mixtures of
SOG+WPC and SOG+PPC did not establish in Swift Current. The proportion of each species in
the complex mixture plots were calculated based on optimal mixtures identified by Mischkolz et
al. (2016) (Table 4.2). The plot areas were summer fallowed one year prior to seeding and
sprayed with Roundup WeatherMAX® (Monsanto Canada Inc., Winnipeg, Canada) in the rate of
0.82 L ha-1 before seeding forage species at both locations. Neither herbicide nor fertilizer was
applied thereafter. Forage species were seeded with a press drill at a depth of 1.3 cm, in 2×8 m
plots with six rows spaced 22.5 cm apart. Grasses in monocultures were planted at a rate of 100
pure live seeds m-2. In binary plots, seeding rate was reduced to half of the monoculture plots for
grasses and 100 pure live seeds m-2 for legumes. In the mixture plots, all species were seeded in
the same row.

43
Table 4.2 The contribution of each species (%) at the seeding rate in complex mixtures, planted
in Swift Current SK and Brandon MB.
Forage Species
WWG BBW NOB LBS SOG PPC WPC
Mixtures ---------------------------------------- % ----------------------------------------
Mixture A 14 14 48 9 5 0 10
Mixture B 14 62 0 5 14 5 0
Mixture C 57 5 0 0 19 19 0
Mixture D 38 19 24 0 0 0 19
Mixture E 71 0 5 5 9 5 5
4.2.3 Forage Yield
Forage yield was measured in the first week of July (mid-season) and last week of
August (late-season) in 2015-2016 in Swift Current, and August 2016 (seeding year) in Brandon
by clipping aboveground of species at ground level with two square-meter quadrats from
different spots within each plot. Unlike in Swift Current, some forage species performed very
well in the seeding year in Brandon, therefore, forage yield in Brandon was measured in 2016.
Species in the mixture plots (binary and complex mixture plots) were separated by hand to
evaluate the proportion of each species in forage production. Clipped biomass was dried in a
forced-air oven at 60 °C to constant mass and weighed. In the October of each year the plots
were mowed to mimic haying; plant materials were removed from the plots.
4.2.4 Forage Quality
Dried forage samples from each harvest were ground using a Thomas Scientific Wiley
Mill (3379-K35 Variable Speed Digital ED-5 Wiley Mill, Swedesboro, NJ, USA). Total
Nitrogen (N) concentration was determined according to Noel and Hambleton (1976). Crude
protein (CP) concentration was calculated by multiplying total Kjeldahl N by 6.25. Acid
detergent fiber (ADF) was determined according to (Goering and Van Soest 1970). Neutral
detergent fiber (NDF) was measured using the ANKOM200 fiber analyzer (Model 200;
ANKOM; Fairport, New York) using the Filter Bag Technique. Phosphorous (P), and analysis
was performed by AAS (Atomic Absorption Spectroscopy) on a Hitachi Z-8200 (Hamm et al.
1970).
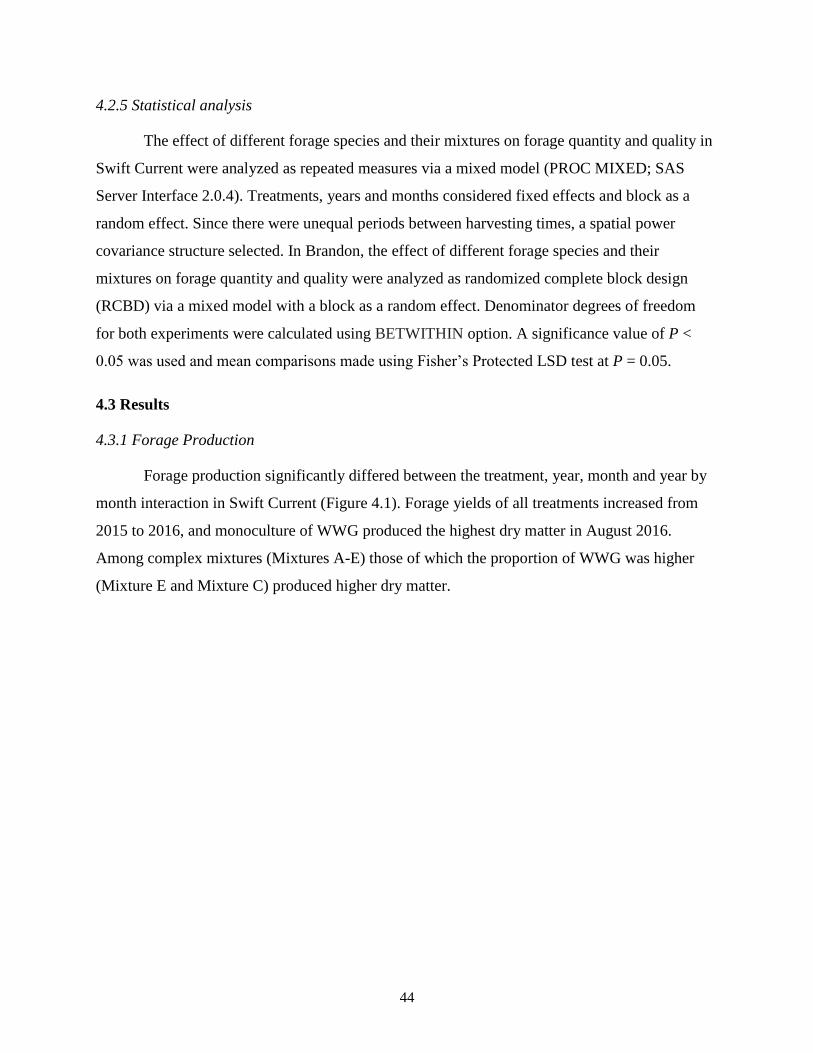
44
4.2.5 Statistical analysis
The effect of different forage species and their mixtures on forage quantity and quality in
Swift Current were analyzed as repeated measures via a mixed model (PROC MIXED; SAS
Server Interface 2.0.4). Treatments, years and months considered fixed effects and block as a
random effect. Since there were unequal periods between harvesting times, a spatial power
covariance structure selected. In Brandon, the effect of different forage species and their
mixtures on forage quantity and quality were analyzed as randomized complete block design
(RCBD) via a mixed model with a block as a random effect. Denominator degrees of freedom
for both experiments were calculated using BETWITHIN option. A significance value of P <
0.05 was used and mean comparisons made using Fisher’s Protected LSD test at P = 0.05.
4.3 Results
4.3.1 Forage Production
Forage production significantly differed between the treatment, year, month and year by
month interaction in Swift Current (Figure 4.1). Forage yields of all treatments increased from
2015 to 2016, and monoculture of WWG produced the highest dry matter in August 2016.
Among complex mixtures (Mixtures A-E) those of which the proportion of WWG was higher
(Mixture E and Mixture C) produced higher dry matter.
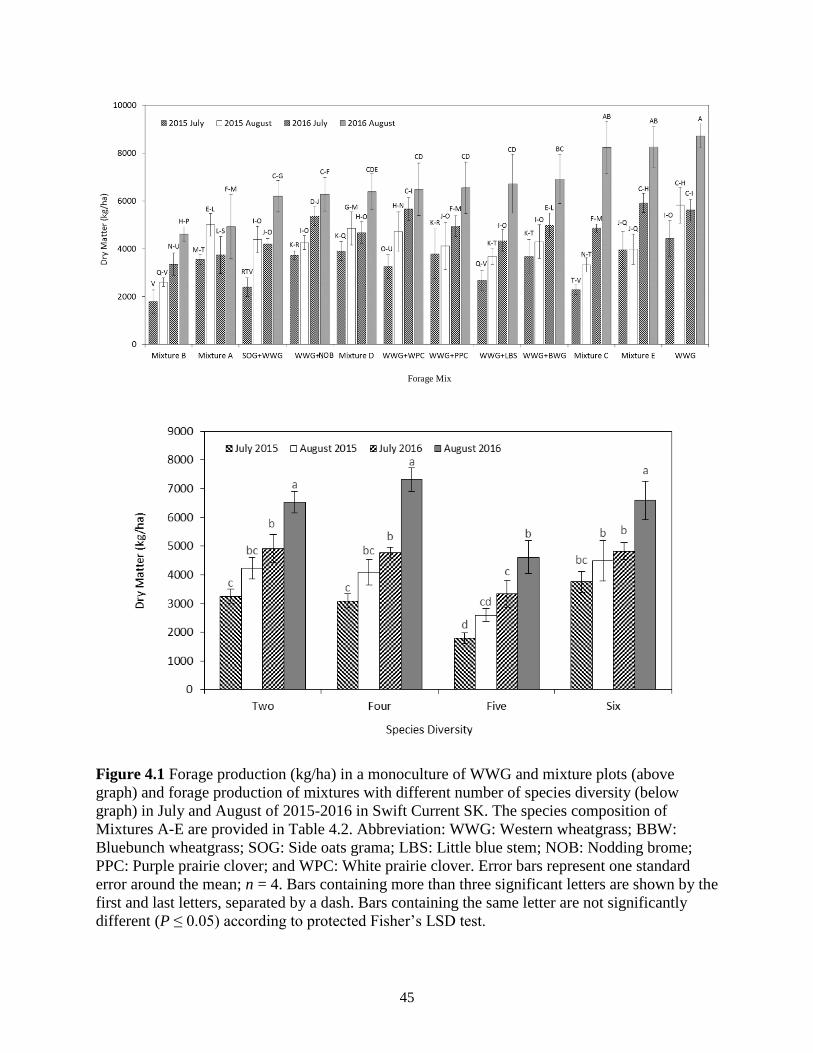
45
Figure 4.1 Forage production (kg/ha) in a monoculture of WWG and mixture plots (above
graph) and forage production of mixtures with different number of species diversity (below
graph) in July and August of 2015-2016 in Swift Current SK. The species composition of
Mixtures A-E are provided in Table 4.2. Abbreviation: WWG: Western wheatgrass; BBW:
Bluebunch wheatgrass; SOG: Side oats grama; LBS: Little blue stem; NOB: Nodding brome;
PPC: Purple prairie clover; and WPC: White prairie clover. Error bars represent one standard
error around the mean; n = 4. Bars containing more than three significant letters are shown by the
first and last letters, separated by a dash. Bars containing the same letter are not significantly
different (P ≤ 0.05) according to protected Fisher’s LSD test.
Forage Mix
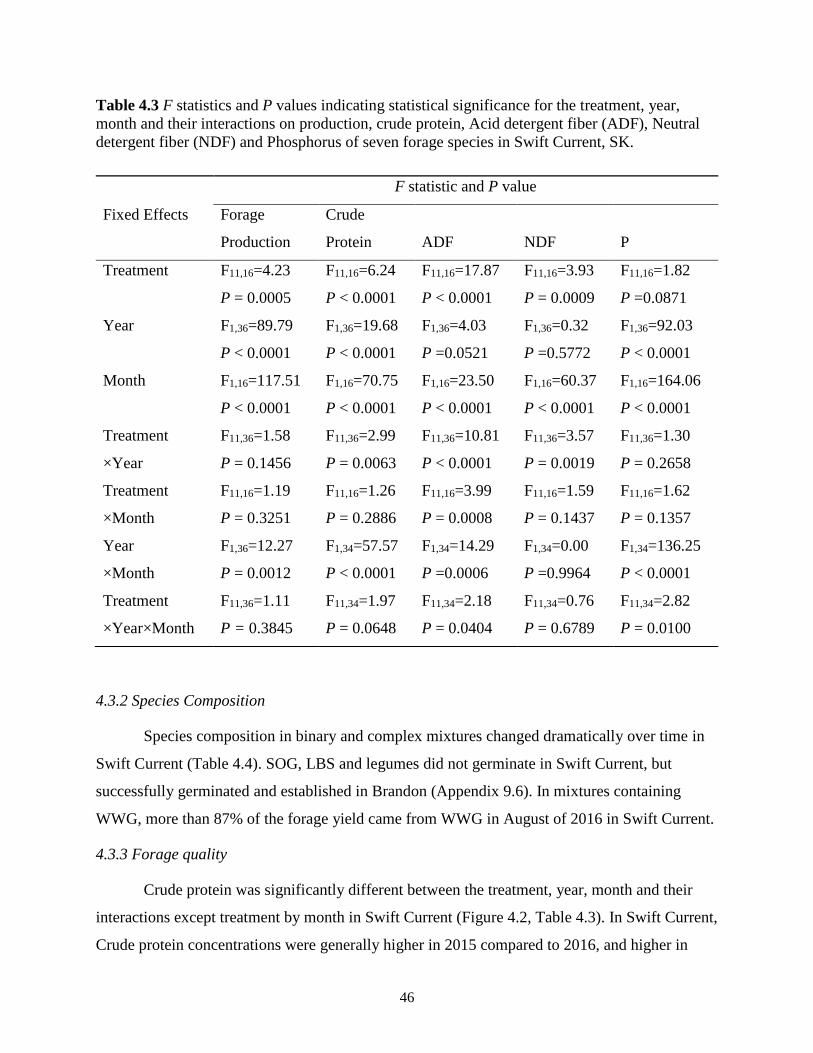
46
Table 4.3 F statistics and P values indicating statistical significance for the treatment, year,
month and their interactions on production, crude protein, Acid detergent fiber (ADF), Neutral
detergent fiber (NDF) and Phosphorus of seven forage species in Swift Current, SK.
4.3.2 Species Composition
Species composition in binary and complex mixtures changed dramatically over time in
Swift Current (Table 4.4). SOG, LBS and legumes did not germinate in Swift Current, but
successfully germinated and established in Brandon (Appendix 9.6). In mixtures containing
WWG, more than 87% of the forage yield came from WWG in August of 2016 in Swift Current.
4.3.3 Forage quality
Crude protein was significantly different between the treatment, year, month and their
interactions except treatment by month in Swift Current (Figure 4.2, Table 4.3). In Swift Current,
Crude protein concentrations were generally higher in 2015 compared to 2016, and higher in
F statistic and P value
Fixed Effects Forage
Production
Crude
Protein
ADF
NDF
P
Treatment F11,16=4.23
P = 0.0005
F11,16=6.24
P < 0.0001
F11,16=17.87
P < 0.0001
F11,16=3.93
P = 0.0009
F11,16=1.82
P =0.0871
Year F1,36=89.79
P < 0.0001
F1,36=19.68
P < 0.0001
F1,36=4.03
P =0.0521
F1,36=0.32
P =0.5772
F1,36=92.03
P < 0.0001
Month F1,16=117.51
P < 0.0001
F1,16=70.75
P < 0.0001
F1,16=23.50
P < 0.0001
F1,16=60.37
P < 0.0001
F1,16=164.06
P < 0.0001
Treatment
×Year
F11,36=1.58
P = 0.1456
F11,36=2.99
P = 0.0063
F11,36=10.81
P < 0.0001
F11,36=3.57
P = 0.0019
F11,36=1.30
P = 0.2658
Treatment
×Month
F11,16=1.19
P = 0.3251
F11,16=1.26
P = 0.2886
F11,16=3.99
P = 0.0008
F11,16=1.59
P = 0.1437
F11,16=1.62
P = 0.1357
Year
×Month
F1,36=12.27
P = 0.0012
F1,34=57.57
P < 0.0001
F1,34=14.29
P =0.0006
F1,34=0.00
P =0.9964
F1,34=136.25
P < 0.0001
Treatment
×Year×Month
F11,36=1.11
P = 0.3845
F11,34=1.97
P = 0.0648
F11,34=2.18
P = 0.0404
F11,34=0.76
P = 0.6789
F11,34=2.82
P = 0.0100
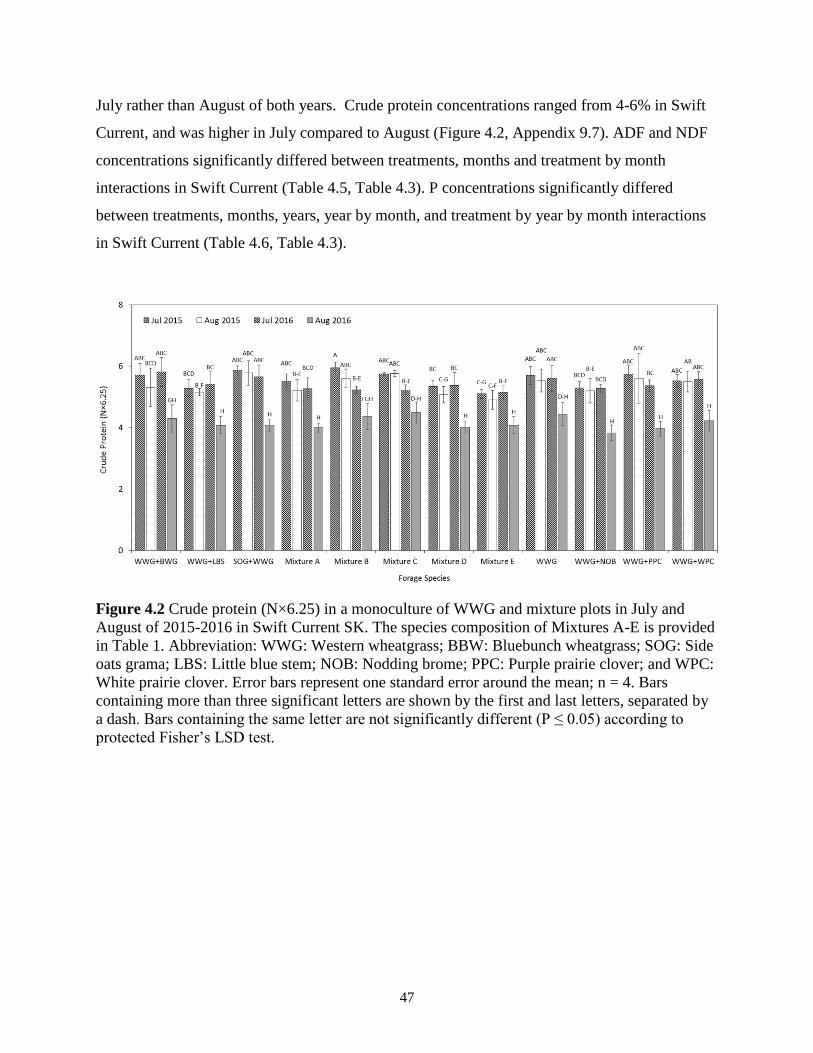
47
July rather than August of both years. Crude protein concentrations ranged from 4-6% in Swift
Current, and was higher in July compared to August (Figure 4.2, Appendix 9.7). ADF and NDF
concentrations significantly differed between treatments, months and treatment by month
interactions in Swift Current (Table 4.5, Table 4.3). P concentrations significantly differed
between treatments, months, years, year by month, and treatment by year by month interactions
in Swift Current (Table 4.6, Table 4.3).
Figure 4.2 Crude protein (N×6.25) in a monoculture of WWG and mixture plots in July and
August of 2015-2016 in Swift Current SK. The species composition of Mixtures A-E is provided
in Table 1. Abbreviation: WWG: Western wheatgrass; BBW: Bluebunch wheatgrass; SOG: Side
oats grama; LBS: Little blue stem; NOB: Nodding brome; PPC: Purple prairie clover; and WPC:
White prairie clover. Error bars represent one standard error around the mean; n = 4. Bars
containing more than three significant letters are shown by the first and last letters, separated by
a dash. Bars containing the same letter are not significantly different (P ≤ 0.05) according to
protected Fisher’s LSD test.
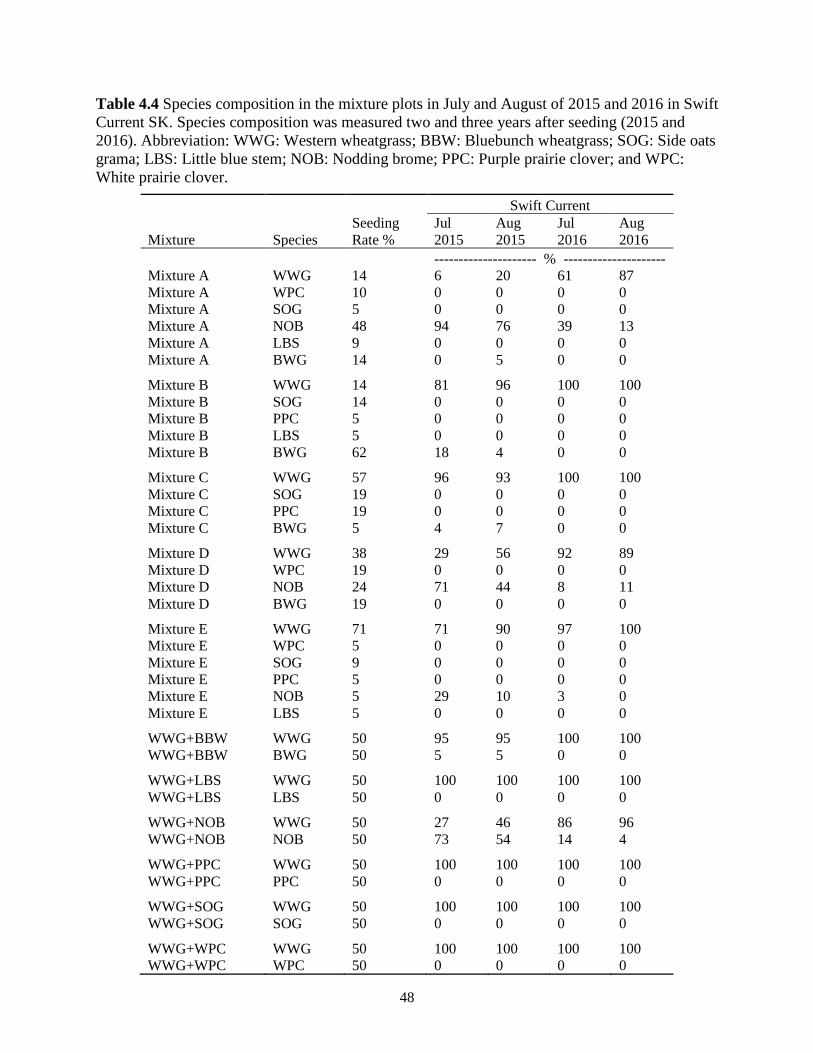
48
Table 4.4 Species composition in the mixture plots in July and August of 2015 and 2016 in Swift
Current SK. Species composition was measured two and three years after seeding (2015 and
2016). Abbreviation: WWG: Western wheatgrass; BBW: Bluebunch wheatgrass; SOG: Side oats
grama; LBS: Little blue stem; NOB: Nodding brome; PPC: Purple prairie clover; and WPC:
White prairie clover.
Swift Current
Mixture Species Seeding Rate %
Jul 2015
Aug 2015
Jul 2016
Aug 2016
--------------------- % --------------------- Mixture A WWG 14 6 20 61 87 Mixture A WPC 10 0 0 0 0 Mixture A SOG 5 0 0 0 0 Mixture A NOB 48 94 76 39 13 Mixture A LBS 9 0 0 0 0 Mixture A BWG 14 0 5 0 0
Mixture B WWG 14 81 96 100 100 Mixture B SOG 14 0 0 0 0 Mixture B PPC 5 0 0 0 0 Mixture B LBS 5 0 0 0 0 Mixture B BWG 62 18 4 0 0
Mixture C WWG 57 96 93 100 100 Mixture C SOG 19 0 0 0 0 Mixture C PPC 19 0 0 0 0 Mixture C BWG 5 4 7 0 0
Mixture D WWG 38 29 56 92 89 Mixture D WPC 19 0 0 0 0 Mixture D NOB 24 71 44 8 11 Mixture D BWG 19 0 0 0 0
Mixture E WWG 71 71 90 97 100 Mixture E WPC 5 0 0 0 0 Mixture E SOG 9 0 0 0 0 Mixture E PPC 5 0 0 0 0 Mixture E NOB 5 29 10 3 0 Mixture E LBS 5 0 0 0 0
WWG+BBW WWG 50 95 95 100 100 WWG+BBW BWG 50 5 5 0 0
WWG+LBS WWG 50 100 100 100 100 WWG+LBS LBS 50 0 0 0 0
WWG+NOB WWG 50 27 46 86 96 WWG+NOB NOB 50 73 54 14 4
WWG+PPC WWG 50 100 100 100 100 WWG+PPC PPC 50 0 0 0 0
WWG+SOG WWG 50 100 100 100 100 WWG+SOG SOG 50 0 0 0 0
WWG+WPC WWG 50 100 100 100 100 WWG+WPC WPC 50 0 0 0 0
49
4.4 Discussion
4.4.1 Forage yield
Our results showed that mixtures containing a higher proportion of WWG (e.g. mixture E
and mixture C) produced a higher yield in 2016 in Swift Current. Mixture E and C contained
29% and 43% less WWG compared to monoculture, but forage yield did not differ significantly
in 2016 from the monoculture of WWG. In other words, mixtures containing 57% or greater
percentage WWG all produced the same amount of dry matter. Therefore, increasing the
proportion of WWG higher than 57% in seed mixes does not seem to have any positive effects
on forage productivity. Mixtures A and B (both of which contained 14% WWG) produced the
lowest dry matter in 2016 that showed that 14% WWG was not high enough to achieve
maximum productivity. Mischkolz et al. (2013) also found that even when WWG is seeded at
half of the seeding rate, the final forage yield was still the same as WWG in monoculture. Forage
yield increased in 2016 in almost all mixtures; filling of the spaces between seeded rows by
WWG rhizomes and high precipitation in 2016 can explain this trend. Our study showed that the
rhizomatous growth behavior of WWG might strongly affect the forage productivity of mixtures.
Biligetu et al. (2014) found that rhizomatous C3 grasses, regardless of the species’ origin,
produce greater dry matter than non-rhizomatous grasses. Mixture A which contained 48% NOB
performed well in August of 2015, but was not as productive as mixtures E and C in the
following year. In chapter 3, I also found that the forage yield of NOB decreased continuously
from year to year, therefore, NOB does not seem to be a suitable option for stable and long-term
forage productivity in the dry-mix ecoregion. In this study, legumes did not germinate
successfully in Swift Current. PPC is slow to germinate which can affect establishment when
mixed with other forage species, especially grasses (Molano-Flores et al. 2011; Schellenberg and
Banerjee 2002). Therefore, given the benefits of legumes in the mixtures more studies are needed
to identify ways to enhance germination and establishment rates of PPC and WPC to facilitate
their establishment in mixtures with other species, especially in dry ecoregions.
50
In Brandon, SOG strongly affected the productivity of mixtures. Monoculture of SOG
and binary mixtures containing SOG produced the highest forage yield in the seeding year of
2016. Among complex mixtures, mixture C followed by mixture E produced the highest forage
yield. Monoculture of SOG produced about three-times more dry matter than that of WWG,
however a longer study is needed to evaluate the forage yield of SOG over time in the more
mesic Tall-Grass Prairie Ecoregion.
Many studies have identified positive relationships between plant diversity and
productivity, ecosystem stability and function (Isbell and Wilsey 2011; Mischkolz et al. 2016;
Picasso et al. 2011; Tilman et al. 2014; Tilman et al. 2001; Tilman et al. 2006a). Positive effects
of species diversity on productivity such as those shown in Chapter three can be explained by
different factors including interspecific complementarity, better use of available resources, better
nutrients cycling and reduced chance of herbivory and disease outbreaks (Tilman et al. 2014).
Not all native species produce high forage yield, but forage mixtures including less productive
species may bring beneficial characteristics like drought or grazing tolerance to the plant
community. The diverse species mixtures guarantee forage yield under good climate conditions
and more importantly ensure stable forage productivity under unpredictable harsh conditions
(Mischkolz et al. 2013).
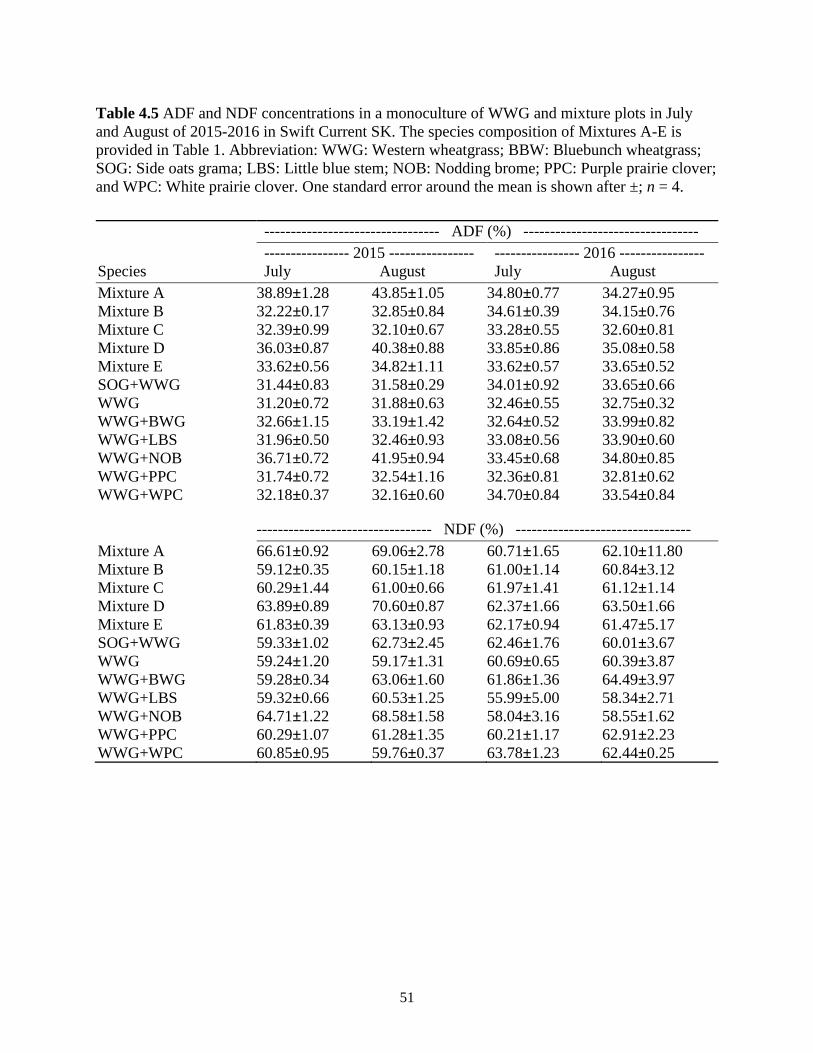
51
Table 4.5 ADF and NDF concentrations in a monoculture of WWG and mixture plots in July
and August of 2015-2016 in Swift Current SK. The species composition of Mixtures A-E is
provided in Table 1. Abbreviation: WWG: Western wheatgrass; BBW: Bluebunch wheatgrass;
SOG: Side oats grama; LBS: Little blue stem; NOB: Nodding brome; PPC: Purple prairie clover;
and WPC: White prairie clover. One standard error around the mean is shown after ±; n = 4.
--------------------------------- ADF (%) ---------------------------------
---------------- 2015 ---------------- ---------------- 2016 ----------------
Species July August July August
Mixture A 38.89±1.28 43.85±1.05 34.80±0.77 34.27±0.95
Mixture B 32.22±0.17 32.85±0.84 34.61±0.39 34.15±0.76
Mixture C 32.39±0.99 32.10±0.67 33.28±0.55 32.60±0.81
Mixture D 36.03±0.87 40.38±0.88 33.85±0.86 35.08±0.58
Mixture E 33.62±0.56 34.82±1.11 33.62±0.57 33.65±0.52
SOG+WWG 31.44±0.83 31.58±0.29 34.01±0.92 33.65±0.66
WWG 31.20±0.72 31.88±0.63 32.46±0.55 32.75±0.32
WWG+BWG 32.66±1.15 33.19±1.42 32.64±0.52 33.99±0.82
WWG+LBS 31.96±0.50 32.46±0.93 33.08±0.56 33.90±0.60
WWG+NOB 36.71±0.72 41.95±0.94 33.45±0.68 34.80±0.85
WWG+PPC 31.74±0.72 32.54±1.16 32.36±0.81 32.81±0.62
WWG+WPC 32.18±0.37 32.16±0.60 34.70±0.84 33.54±0.84
--------------------------------- NDF (%) ---------------------------------
Mixture A 66.61±0.92 69.06±2.78 60.71±1.65 62.10±11.80
Mixture B 59.12±0.35 60.15±1.18 61.00±1.14 60.84±3.12
Mixture C 60.29±1.44 61.00±0.66 61.97±1.41 61.12±1.14
Mixture D 63.89±0.89 70.60±0.87 62.37±1.66 63.50±1.66
Mixture E 61.83±0.39 63.13±0.93 62.17±0.94 61.47±5.17
SOG+WWG 59.33±1.02 62.73±2.45 62.46±1.76 60.01±3.67
WWG 59.24±1.20 59.17±1.31 60.69±0.65 60.39±3.87
WWG+BWG 59.28±0.34 63.06±1.60 61.86±1.36 64.49±3.97
WWG+LBS 59.32±0.66 60.53±1.25 55.99±5.00 58.34±2.71
WWG+NOB 64.71±1.22 68.58±1.58 58.04±3.16 58.55±1.62
WWG+PPC 60.29±1.07 61.28±1.35 60.21±1.17 62.91±2.23
WWG+WPC 60.85±0.95 59.76±0.37 63.78±1.23 62.44±0.25

52
Table 4.6 P concentrations (%) in a monoculture of WWG and mixture plots in July and August
of 2015-2016 in Swift Current SK. The species composition of Mixtures A-E is provided in
Table 1. Abbreviation: WWG: Western wheatgrass; BBW: Bluebunch wheatgrass; SOG: Side
oats grama; LBS: Little blue stem; NOB: Nodding brome; PPC: Purple prairie clover; and WPC:
White prairie clover. One standard error around the mean is shown after ±; n = 4.
2015 2016
Species July August July August
---------------------------- Swift Current ----------------------------
Mixture A 0.119±0.006 0.084±0.004 0.160±0.007 0.118±0.012
Mixture B 0.130±0.008 0.134±0.012 0.168±0.003 0.113±0.003
Mixture C 0.116±0.006 0.127±0.001 0.160±0.004 0.113±0.007
Mixture D 0.103±0.003 0.084±0.003 0.155±0.016 0.125±0.010
Mixture E 0.106±0.015 0.109±0.014 0.145±0.005 0.113±0.003
SOG+WWG 0.105±0.009 0.110±0.006 0.155±0.006 0.120±0.004
WWG 0.108±0.011 0.103±0.011 0.165±0.006 0.113±0.003
WWG+BWG 0.099±0.007 0.109±0.009 0.150±0.004 0.120±0.004
WWG+LBS 0.124±0.006 0.125±0.005 0.163±0.006 0.113±0.005
WWG+NOB 0.110±0.006 0.095±0.007 0.150±0.006 0.115±0.006
WWG+PPC 0.118±0.019 0.125±0.015 0.178±0.005 0.110±0.006
WWG+WPC 0.105±0.005 0.116±0.010 0.163±0.003 0.113±0.005
4.4.2 Species composition
Binary mixtures were seeded at the same rate (50-50%) at both locations, however, in
August 2016, WWG occupied more than 96% of the mixtures in Swift Current. In complex
mixtures (mixtures A-E), WWG occupied more than 87% of the mixtures, regardless of initial
seeding rate. The results showed that WWG can aggressively occupy the majority of forage
mixture in the third year after seeding. WWG is a stronger competitor than the other species in
these mixtures at both the seedling and mature stages (Zhang and Lamb 2011). These results
show the strong ability of WWG to occupy the spaces, and limit the growth and survival of other
species. WWG is a perennial grass that grows densely with sod-forming rhizomes that can fill all
the spaces between seeded rows (National-Research-Council 2001), and based on WWG’s
competitive ability, it may limit the presence of other species in the mixture. This competitive
ability of WWG can also be implemented for weed control and management in seeded pastures,
as many weeds may not find an empty niche to thrive beside WWG.
53
4.4.3 Forage quality
The result of this study demonstrates that there is a negative relationship between plant
maturity and the concentrations of crude protein. In Brandon Mixture D (contained 19% WPC)
followed by WWG+legumes contained the highest crude protein concentrations. Among grasses,
WWG contained the highest crude protein concentration which agrees with the data reported by
Biligetu et al. (2014).
In Swift Current, the mixtures of WWG+NOB and mixture A (containing 48% NOB) had
the highest amount of ADF and NDF concentration, whereas monoculture of WWG contained
the lowest amount of ADF and NDF concentrations in 2015. Carbohydrates are the main source
of energy and should include 60-70% of the total diet (National-Research-Council 2001). In
Chapter 3 I also found that the ADF and NDF concentrations of NOB were higher than WWG.
In 2016, since most of the plots were occupied by WWG, the fiber concentration of all
treatments ranged only between 32 and 34%. Jefferson et al. (2004) indicated that among grasses
western wheatgrass showed the best potential forage digestibility for fall grazing of stockpiled,
reseeded native grasses.
The concentrations of P were generally greater in July and mixtures containing legumes
had higher P concentrations. Beef cattle require 0.21-0.26% P in their diets (National-Research-
Council 2001). In both years at Swift Current, P concentrations provided by grasses were lower
than the minimum requirement. Biligetu et al. (2014) also indicated that P concentrations were
lower than the requirement in forage mixtures. However, in Brandon in the seeding year, P
concentrations provided by forage mixtures met the minimum requirement.
4.5 Conclusion
In summary, the results showed that WWG is a suitable option for forage productivity in
the Dry-Mixed ecoregion of Saskatchewan, and mixtures containing the higher proportion of
WWG, up to 57%, can produce greater dry matter. The other 43% can be filled with legumes,
NOB, BBW, LBS and SOG; and the proportion of SOG can be higher than other species in the
Tall-Grass Ecoregion. Mixtures that contained NOB performed well in 2015 however, its yield
decreased in the following year. NOB may be a good option when short-term forage productivity
is targeted, but does not appear to be suitable for long-term use in pastures. In Brandon, on the
other hand, SOG performed well in the seeding year and produced three times more dry matter

54
than WWG, suggesting that that species may be preferred more mesic ecoregions. WWG is an
aggressive perennial grass that has occupied more than 87% of the forage mixture in 2016 in
Swift Current regardless of the initial seeding rate.
55
CHAPTER 5
MULTI-SPECIES FORAGE MIXTURES REDUCE WEED SEEDBANK AND
ABOVEGROUND POPULATION
Abstract
To evaluate the effect of forage species in monoculture and mixtures on weed
seedbank and aboveground density, seven native perennial forage species were seeded in the
Dry-Mixed Grass Prairie Ecoregion of Saskatchewan, Canada. Four and five years later,
weed seedbank and aboveground weed populations were measured. Weed seedbank and
aboveground populations were significantly affected by the different seeding mixtures. The
most abundant weeds in the soil seedbank were the least abundant weeds in the aboveground
population and vice versa. About 57%, 37% and 6% of germinated seeds had biennial, annual
and perennial life cycles, respectively. Biennial wormwood (Artemisia biennis), stinkweed
(Thlaspi arvense), purslane (Portulaca oleracea) and flixweed (Descurainia sophia)
comprised 86% of the total germinated seeds. We show that forage mixtures can reduce the
abundance of weeds in the seedbank and aboveground weed population compared to
monocultures. Among mixtures, those containing western wheatgrass had the lowest
abundance of weeds in the seedbank and aboveground population. In conclusion, mixtures of
forage species can reduce the number of weed seeds in the seedbank and size of the
aboveground weed population. Inclusion of strong competitors like western wheatgrass in the
mixtures can also increase the suppressive potential on weeds.
5.1 Introduction
The soil seedbank is a legacy of past weed populations and a source of potential
emergents following disturbance (Murphy et al. 2006; Sanderson et al. 2007; Sosnoskie et al.
2006). Although the soil seedbank may contain useful pasture species, it also is a reservoir of
undesirable weedy species (Rice 1989). Knowledge of soil weed seedbank composition can
be useful for pasture manager, as it can indicate both which species may emerge after a
disturbance that opens a gap in the sward and successional processes operating in the pasture
(Sanderson et al. 2014).
Weeds can significantly reduce forage yield and quality, affecting livestock
production qualities and increase rangeland management costs (DiTomaso 2000). More
diverse aboveground plant communities tend to be more resistant to weeds compared to less
56
complex plant communities (Elton 1958; Picasso et al. 2008). This phenomenon can be
explained in two ways. The first perspective, ‘resource use complementarity’, suggests that
plants in a diverse community use resources more efficiently leaving few unoccupied niches
for the weeds (Knops et al. 1999; Naeem et al. 2000). The second perspective, ‘sampling
effect’, theorizes that in more complex mixtures, there is at least one strong and productive
species that can outcompete weeds and reduces weed presence in the mixtures (Huston 1997).
Other benefits of forage mixtures include an increase in forage productivity, yield stability in
different climate conditions, nutrient loss prevention from soil, a decrease in pathogen
infection and provision of diverse nutrients for grazing animals (Hector et al. 1999; Hooper
and Vitousek 1998; Knops et al. 1999; McNaughton 1977; Mischkolz et al. 2016; Tilman and
Downing 1994; Tilman et al. 1996; Vibart et al. 2016).
A number of studies have examined the benefits of forage mixtures for weed
suppression. For example, Picasso et al. (2008) evaluated 49 combinations of seven species
including all monocultures and selected two to six species mixtures and found that as forage
species richness increased, weed biomass decreased. Sanderson et al. (2007) similarly found
a smaller proportion of aboveground weeds in six- and nine-species mixtures compared to
two- and three-species mixtures, but no effect of different mixtures on the weed seedbank.
Most of the weed seedbank was composed of annual forbs and there was only a minor
relationship between weed seedbank composition and aboveground weed populations.
Sanderson et al. (2014) also showed that a permanent pasture can have a more stable soil
seedbank than that of recently cultivated land. They also found that annual weeds are more
common in the seedbank of hayfields and recently seeded pastures, whereas the weed
seedbank in older pastures tended to be dominated by perennial grasses.
About 5.7 million hectares of the Canadian Prairie is covered by seeded pastures
(Statistics Canada, 2010), primarily introduced species like crested wheatgrass (Agropyron
cristatum [L.] Gaertn.), smooth brome (Bromus inermis Leyss) and Russian wildrye (Elymus
junceus Fisch.) (Otfinowski et al. 2007; Smoliak and Dormaar 1985). Although there is a
growing interest in the use of native perennial species for sustainable beef production from
seeded pastures, little research has been conducted on weed seedbank composition and
aboveground populations in pastures seeded to native forages. In this study, we hypothesized
that certain native forage species may better suppress weeds and reduce the weed seedbank,
and mixtures of forage species may be more effective at excluding weeds and decreasing
weed seedbank compared to monocultures. The objectives of this study were to (1) evaluate
the effects of different native forage species on weed seedbank composition and size and

57
aboveground weed populations; (2) investigate the effect of forage mixtures on weed
seedbank and aboveground weed populations and; (3) evaluate the similarity between the
weed seedbank and emerged weed density in mixtures of native perennial forage species.
5.2 Material and Methods
5.2.1 Study Site
This experiment was conducted at the Agriculture and Agri-Food Canada (AAFC),
Swift Current Research and Development Centre (SCRDC) near Swift Current (latitude
50°25′N, longitude 107°44′W, 824 m elevation) Saskatchewan, Canada. This area is located
in the dry mixed-grass Prairie ecoregion which is the driest part of the province (Bailey et al.
2010). The annual temperature, annual precipitation and May-July precipitation are 4.1 °C,
327 mm and 153 mm, respectively (Bailey et al. 2010). This ecoregion has an Orthic Brown
Chernozemic soils (Swinton loam) with a pH of 7.4 (Ayers et al. 1985; Bailey et al. 2010).
Weather data was collected from AAFC Swift Current for 2014, 2015 and the average of 120
years (Figure 3.1). In general, precipitation in 2014 was close to average; whereas, 2015 was
one of the driest years in the history of Swift Current.
Seven native perennial forage species from three functional groups were selected in
this experiment: three C3 grasses, two C4 grasses and two legumes (Table 5.1). These species
were evaluated in greenhouse studies (Mischkolz et al. 2016) and have continued to be
evaluated in breeding studies in Saskatoon and Swift Current, SK, (Biligetu et al. 2014;
Mischkolz et al. 2013; Schellenberg et al. 2012) and ongoing field studies in Swift Current
and Brandon, MB Canada. These native forage species have significant agronomic potential
as they are broadly distributed, seeds are readily available, have acceptable nutritional quality
profiles and do not require specialized machinery for seeding.
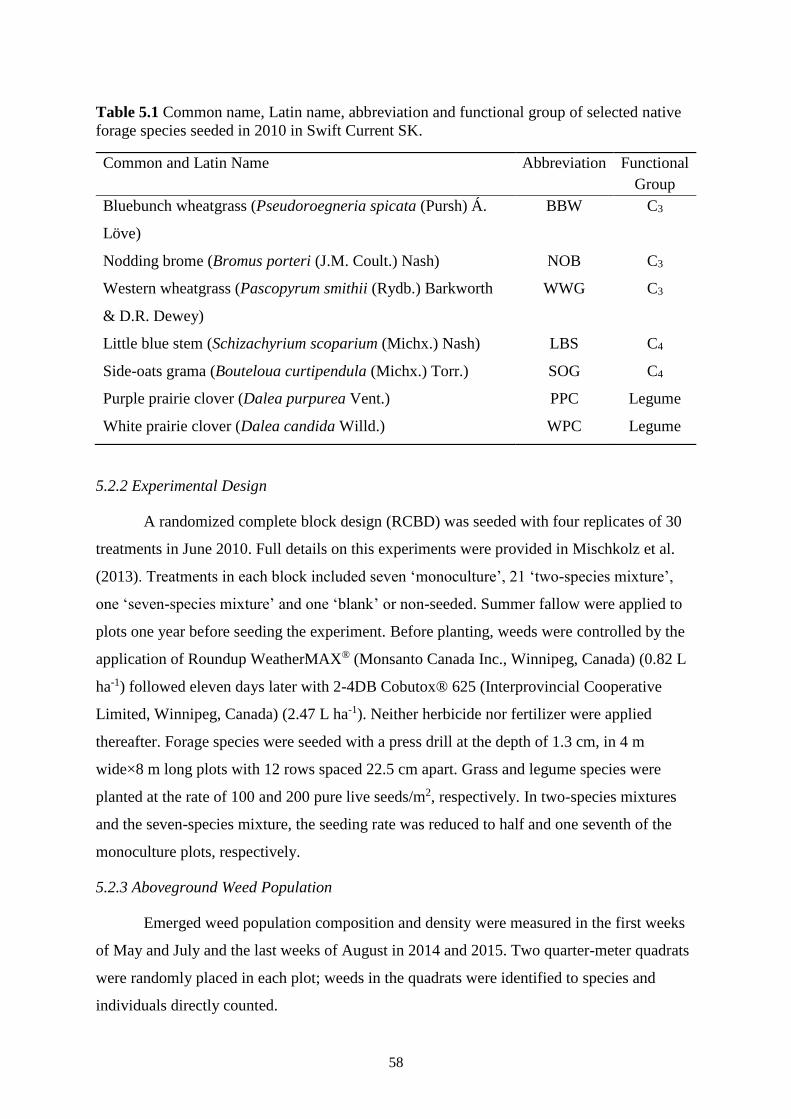
58
Table 5.1 Common name, Latin name, abbreviation and functional group of selected native
forage species seeded in 2010 in Swift Current SK.
5.2.2 Experimental Design
A randomized complete block design (RCBD) was seeded with four replicates of 30
treatments in June 2010. Full details on this experiments were provided in Mischkolz et al.
(2013). Treatments in each block included seven ‘monoculture’, 21 ‘two-species mixture’,
one ‘seven-species mixture’ and one ‘blank’ or non-seeded. Summer fallow were applied to
plots one year before seeding the experiment. Before planting, weeds were controlled by the
application of Roundup WeatherMAX® (Monsanto Canada Inc., Winnipeg, Canada) (0.82 L
ha-1) followed eleven days later with 2-4DB Cobutox® 625 (Interprovincial Cooperative
Limited, Winnipeg, Canada) (2.47 L ha-1). Neither herbicide nor fertilizer were applied
thereafter. Forage species were seeded with a press drill at the depth of 1.3 cm, in 4 m
wide×8 m long plots with 12 rows spaced 22.5 cm apart. Grass and legume species were
planted at the rate of 100 and 200 pure live seeds/m2, respectively. In two-species mixtures
and the seven-species mixture, the seeding rate was reduced to half and one seventh of the
monoculture plots, respectively.
5.2.3 Aboveground Weed Population
Emerged weed population composition and density were measured in the first weeks
of May and July and the last weeks of August in 2014 and 2015. Two quarter-meter quadrats
were randomly placed in each plot; weeds in the quadrats were identified to species and
individuals directly counted.
Common and Latin Name Abbreviation Functional
Group
Bluebunch wheatgrass (Pseudoroegneria spicata (Pursh) Á.
Löve)
BBW C3
Nodding brome (Bromus porteri (J.M. Coult.) Nash) NOB C3
Western wheatgrass (Pascopyrum smithii (Rydb.) Barkworth
& D.R. Dewey)
WWG C3
Little blue stem (Schizachyrium scoparium (Michx.) Nash) LBS C4
Side-oats grama (Bouteloua curtipendula (Michx.) Torr.) SOG C4
Purple prairie clover (Dalea purpurea Vent.) PPC Legume
White prairie clover (Dalea candida Willd.) WPC Legume
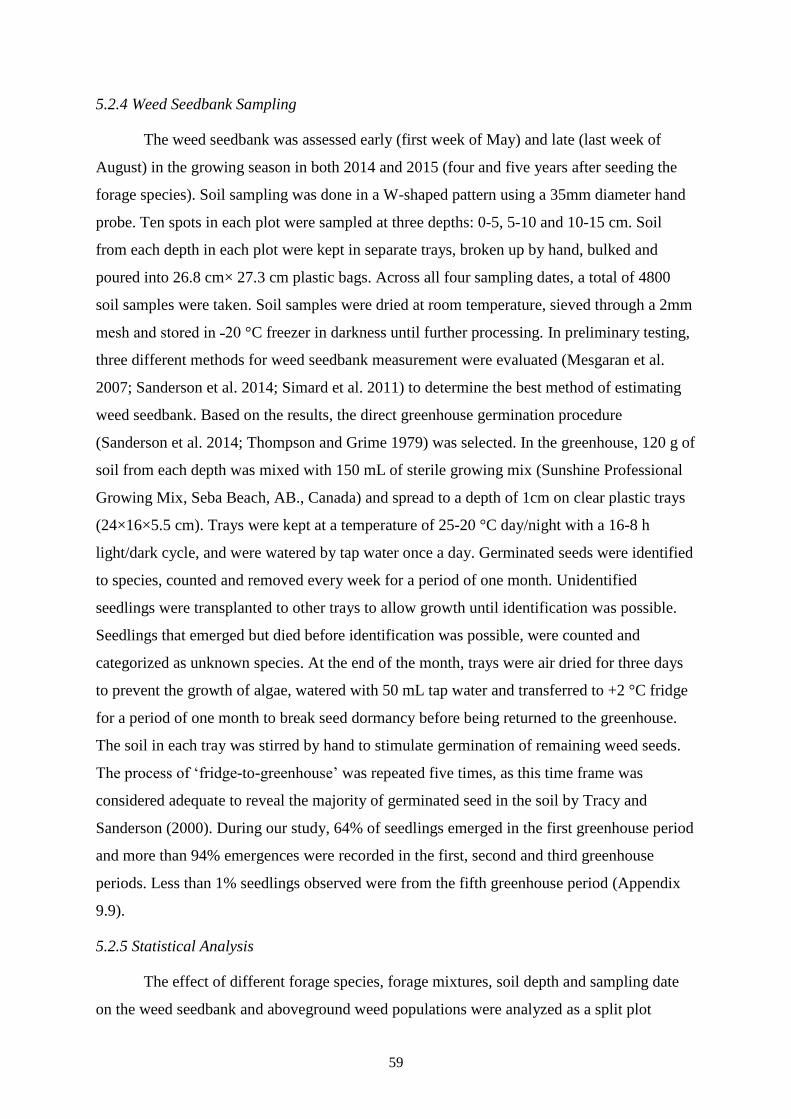
59
5.2.4 Weed Seedbank Sampling
The weed seedbank was assessed early (first week of May) and late (last week of
August) in the growing season in both 2014 and 2015 (four and five years after seeding the
forage species). Soil sampling was done in a W-shaped pattern using a 35mm diameter hand
probe. Ten spots in each plot were sampled at three depths: 0-5, 5-10 and 10-15 cm. Soil
from each depth in each plot were kept in separate trays, broken up by hand, bulked and
poured into 26.8 cm× 27.3 cm plastic bags. Across all four sampling dates, a total of 4800
soil samples were taken. Soil samples were dried at room temperature, sieved through a 2mm
mesh and stored in ˗20 °C freezer in darkness until further processing. In preliminary testing,
three different methods for weed seedbank measurement were evaluated (Mesgaran et al.
2007; Sanderson et al. 2014; Simard et al. 2011) to determine the best method of estimating
weed seedbank. Based on the results, the direct greenhouse germination procedure
(Sanderson et al. 2014; Thompson and Grime 1979) was selected. In the greenhouse, 120 g of
soil from each depth was mixed with 150 mL of sterile growing mix (Sunshine Professional
Growing Mix, Seba Beach, AB., Canada) and spread to a depth of 1cm on clear plastic trays
(24×16×5.5 cm). Trays were kept at a temperature of 25-20 °C day/night with a 16-8 h
light/dark cycle, and were watered by tap water once a day. Germinated seeds were identified
to species, counted and removed every week for a period of one month. Unidentified
seedlings were transplanted to other trays to allow growth until identification was possible.
Seedlings that emerged but died before identification was possible, were counted and
categorized as unknown species. At the end of the month, trays were air dried for three days
to prevent the growth of algae, watered with 50 mL tap water and transferred to +2 °C fridge
for a period of one month to break seed dormancy before being returned to the greenhouse.
The soil in each tray was stirred by hand to stimulate germination of remaining weed seeds.
The process of ‘fridge-to-greenhouse’ was repeated five times, as this time frame was
considered adequate to reveal the majority of germinated seed in the soil by Tracy and
Sanderson (2000). During our study, 64% of seedlings emerged in the first greenhouse period
and more than 94% emergences were recorded in the first, second and third greenhouse
periods. Less than 1% seedlings observed were from the fifth greenhouse period (Appendix
9.9).
5.2.5 Statistical Analysis
The effect of different forage species, forage mixtures, soil depth and sampling date
on the weed seedbank and aboveground weed populations were analyzed as a split plot
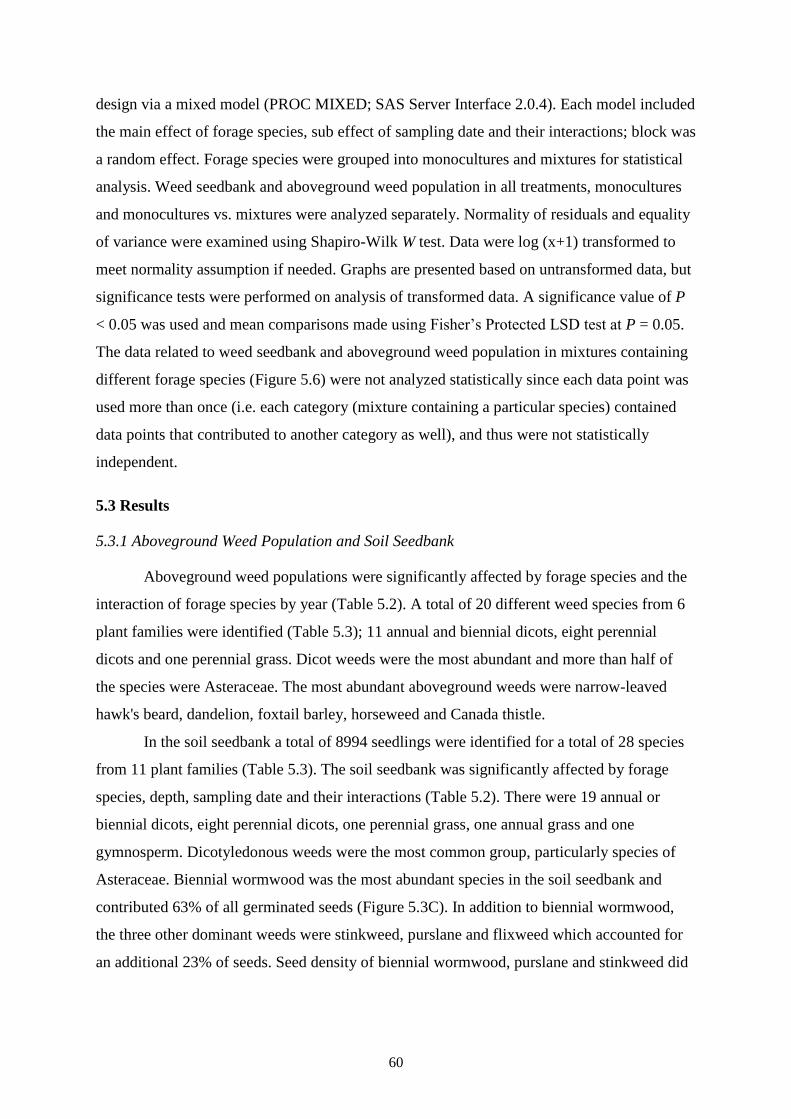
60
design via a mixed model (PROC MIXED; SAS Server Interface 2.0.4). Each model included
the main effect of forage species, sub effect of sampling date and their interactions; block was
a random effect. Forage species were grouped into monocultures and mixtures for statistical
analysis. Weed seedbank and aboveground weed population in all treatments, monocultures
and monocultures vs. mixtures were analyzed separately. Normality of residuals and equality
of variance were examined using Shapiro-Wilk W test. Data were log (x+1) transformed to
meet normality assumption if needed. Graphs are presented based on untransformed data, but
significance tests were performed on analysis of transformed data. A significance value of P
< 0.05 was used and mean comparisons made using Fisher’s Protected LSD test at P = 0.05.
The data related to weed seedbank and aboveground weed population in mixtures containing
different forage species (Figure 5.6) were not analyzed statistically since each data point was
used more than once (i.e. each category (mixture containing a particular species) contained
data points that contributed to another category as well), and thus were not statistically
independent.
5.3 Results
5.3.1 Aboveground Weed Population and Soil Seedbank
Aboveground weed populations were significantly affected by forage species and the
interaction of forage species by year (Table 5.2). A total of 20 different weed species from 6
plant families were identified (Table 5.3); 11 annual and biennial dicots, eight perennial
dicots and one perennial grass. Dicot weeds were the most abundant and more than half of
the species were Asteraceae. The most abundant aboveground weeds were narrow-leaved
hawk's beard, dandelion, foxtail barley, horseweed and Canada thistle.
In the soil seedbank a total of 8994 seedlings were identified for a total of 28 species
from 11 plant families (Table 5.3). The soil seedbank was significantly affected by forage
species, depth, sampling date and their interactions (Table 5.2). There were 19 annual or
biennial dicots, eight perennial dicots, one perennial grass, one annual grass and one
gymnosperm. Dicotyledonous weeds were the most common group, particularly species of
Asteraceae. Biennial wormwood was the most abundant species in the soil seedbank and
contributed 63% of all germinated seeds (Figure 5.3C). In addition to biennial wormwood,
the three other dominant weeds were stinkweed, purslane and flixweed which accounted for
an additional 23% of seeds. Seed density of biennial wormwood, purslane and stinkweed did

61
not significantly vary with sampling date, whereas the density of flixweed was significantly
higher in September of both years.
Thirteen weed species were present in both the weed seedbank and aboveground weed
population, and seven species were exclusively recorded from the aboveground population
including six species of Asteraceace (Table 5.3). Although flixweed seeds were present in
many soil samples, flixweed was only present aboveground in the blank or non-seeded plots.
Canada thistle, on the other hand, was recorded in aboveground measurements, but no seeds
were recorded in the seedbank. The most abundant weeds in the soil seedbank were the least
abundant weeds in the aboveground population and vice versa (Table 5.4).
In monoculture plots, forage species significantly influenced the composition and
abundance of aboveground weed populations. Monocultures of WWG had the lowest weed
density, legumes the highest, and among C4 species LBS had a lower density of aboveground
weeds than SOG (Figure 5.1). The number of aboveground weeds was lower in the dry year
of 2015 compared to the wet year of 2014 (Figure 5.1); in both years weed populations were
significantly lower in mixtures compared to monocultures (Table 5.2, Figure 5.2).
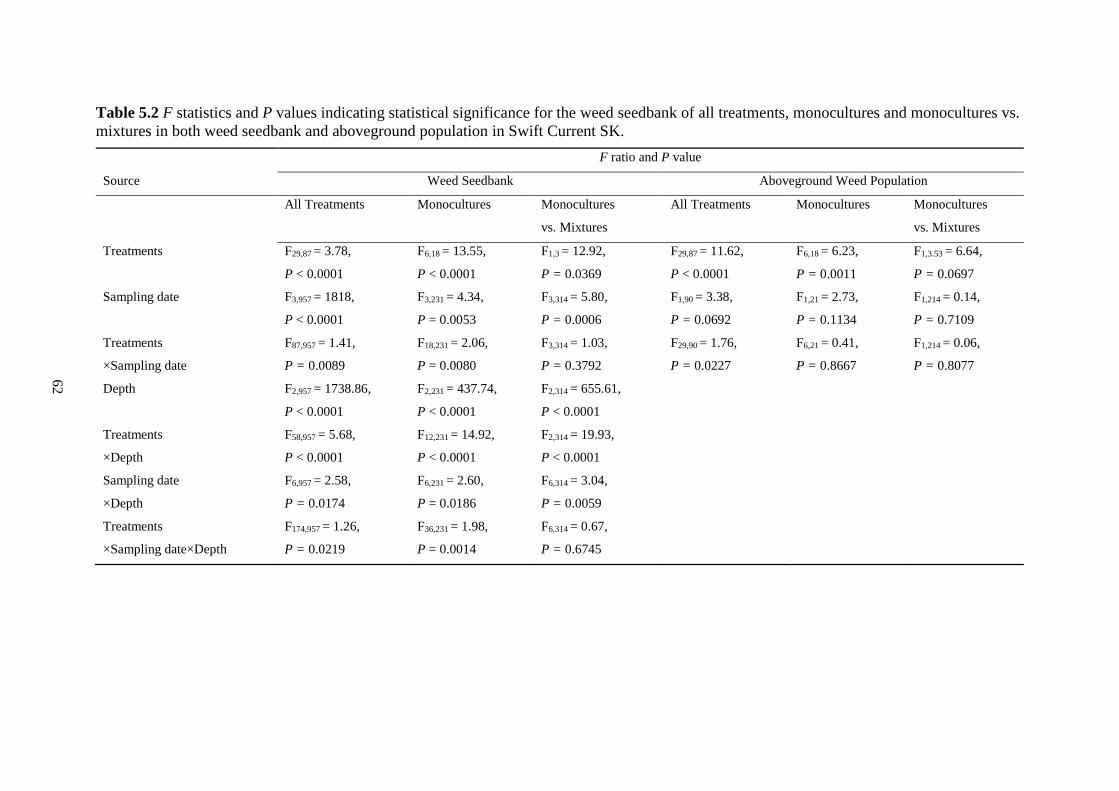
62
Table 5.2 F statistics and P values indicating statistical significance for the weed seedbank of all treatments, monocultures and monocultures vs.
mixtures in both weed seedbank and aboveground population in Swift Current SK.
F ratio and P value
Source Weed Seedbank Aboveground Weed Population
All Treatments Monocultures Monocultures
vs. Mixtures
All Treatments Monocultures Monocultures
vs. Mixtures
Treatments F29,87 = 3.78,
P < 0.0001
F6,18 = 13.55,
P < 0.0001
F1,3 = 12.92,
P = 0.0369
F29,87 = 11.62,
P < 0.0001
F6,18 = 6.23,
P = 0.0011
F1,3.53 = 6.64,
P = 0.0697
Sampling date F3,957 = 1818,
P < 0.0001
F3,231 = 4.34,
P = 0.0053
F3,314 = 5.80,
P = 0.0006
F1,90 = 3.38,
P = 0.0692
F1,21 = 2.73,
P = 0.1134
F1,214 = 0.14,
P = 0.7109
Treatments
×Sampling date
F87,957 = 1.41,
P = 0.0089
F18,231 = 2.06,
P = 0.0080
F3,314 = 1.03,
P = 0.3792
F29,90 = 1.76,
P = 0.0227
F6,21 = 0.41,
P = 0.8667
F1,214 = 0.06,
P = 0.8077
Depth F2,957 = 1738.86,
P < 0.0001
F2,231 = 437.74,
P < 0.0001
F2,314 = 655.61,
P < 0.0001
Treatments
×Depth
F58,957 = 5.68,
P < 0.0001
F12,231 = 14.92,
P < 0.0001
F2,314 = 19.93,
P < 0.0001
Sampling date
×Depth
F6,957 = 2.58,
P = 0.0174
F6,231 = 2.60,
P = 0.0186
F6,314 = 3.04,
P = 0.0059
Treatments
×Sampling date×Depth
F174,957 = 1.26,
P = 0.0219
F36,231 = 1.98,
P = 0.0014
F6,314 = 0.67,
P = 0.6745
62

63
Table 5.3 Latin name, common name and plant family of germinated seeds in soil seedbank and aboveground weed population.
Latin Name Common Name Family Life Cycle Morphotype
Only in weed seedbank
Amaranthus retroflexus L. Redroot pigweed Amaranthaceae A* D**
Artemisia biennis Willd. Biennial wormwood Asteraceae A, B D
Brassica kaber (DC.) L.C. Wheeler Wild mustard Brassicaceae A D
Capsella bursa-pastoris (L.) Medik. shepherd's-purse Brassicaceae A D
Chenopodium album L. Lamb's quarters Chenopodiaceae A D
Echinochloa crusgalli (L.) Beauv Barnyard grass Poaceae A M
Kochia scoparia (L.) Schrad. Kochia Amaranthaceae A D
Lepidium densiflorum Schrad. Common pepper-grass Brassicaceae A, B D
Monolepis nuttalliana (Schult.) Greene Goosefoot Chenopodiaceae A D
Pinus sylvestris L. Scots pine Pinaceae P G
Portulaca oleracea L. Purslane Portulacaceae A D
Rumex pseudonatronatus (Borbás) Borbás ex Murb. Field dock Polygonaceae P D
Salsola pestifer A. Nels. Russian thistle Amaranthaceae A D
Solanum triflorum Nutt. Wild tomato Solanaceae A D
Thlaspi arvense L. Stinkweed Brassicaceae A D
63
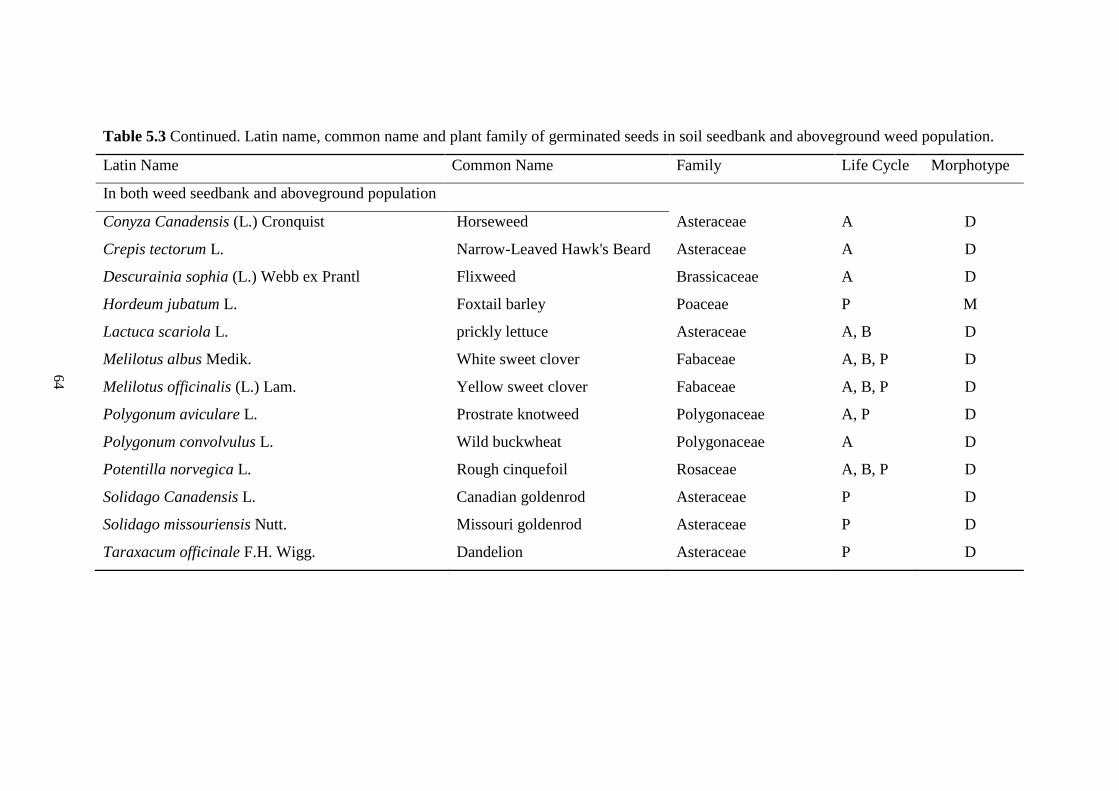
64
Table 5.3 Continued. Latin name, common name and plant family of germinated seeds in soil seedbank and aboveground weed population.
Latin Name Common Name Family Life Cycle Morphotype
In both weed seedbank and aboveground population
Conyza Canadensis (L.) Cronquist Horseweed Asteraceae A D
Crepis tectorum L. Narrow-Leaved Hawk's Beard Asteraceae A D
Descurainia sophia (L.) Webb ex Prantl Flixweed Brassicaceae A D
Hordeum jubatum L. Foxtail barley Poaceae P M
Lactuca scariola L. prickly lettuce Asteraceae A, B D
Melilotus albus Medik. White sweet clover Fabaceae A, B, P D
Melilotus officinalis (L.) Lam. Yellow sweet clover Fabaceae A, B, P D
Polygonum aviculare L. Prostrate knotweed Polygonaceae A, P D
Polygonum convolvulus L. Wild buckwheat Polygonaceae A D
Potentilla norvegica L. Rough cinquefoil Rosaceae A, B, P D
Solidago Canadensis L. Canadian goldenrod Asteraceae P D
Solidago missouriensis Nutt. Missouri goldenrod Asteraceae P D
Taraxacum officinale F.H. Wigg. Dandelion Asteraceae P D
64

65
Table 5.3 Continued. Latin name, common name and plant family of germinated seeds in soil seedbank and aboveground weed population.
Latin Name Common Name Family Life Cycle Morphotype
Only in aboveground population
Achillea millefolium L. Yarrow Asteraceae P D
Artemisia frigida Willd. Pasture sage Asteraceae P D
Cirsium arvense (L.) Scop. Canada thistle Asteraceae P D
Lactuca pulchella (L.) C.A. Mey. Blue lettuce Asteraceae B, P D
Medicago lupulina L. Black medic Fabaceae A, P D
Sonchus asper (L.) Hill Spiny annual sow-thistle Asteraceae A D
Tragopogon dubius Scop. Goat’s-beard Asteraceae A D
* A: Annual; B: Biennial; P: Perennial
** D: Dicotyledonous; M: Monocotyledon; G: Gymnosperm
65
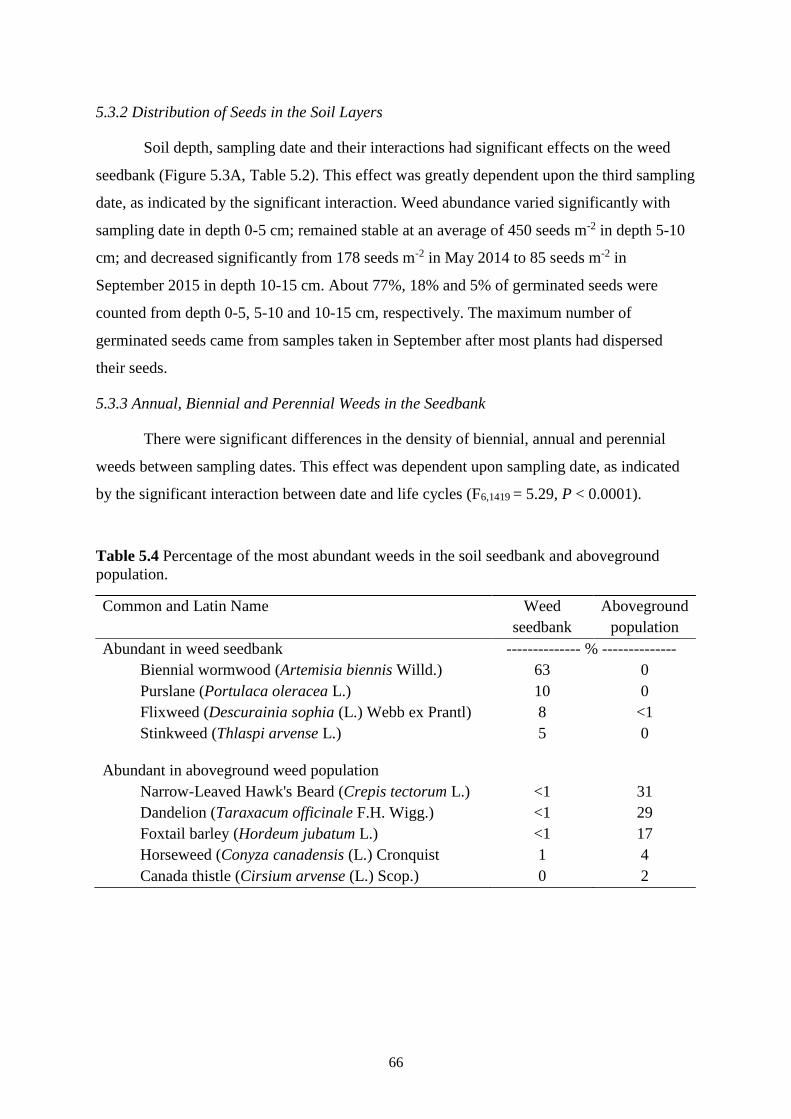
66
5.3.2 Distribution of Seeds in the Soil Layers
Soil depth, sampling date and their interactions had significant effects on the weed
seedbank (Figure 5.3A, Table 5.2). This effect was greatly dependent upon the third sampling
date, as indicated by the significant interaction. Weed abundance varied significantly with
sampling date in depth 0-5 cm; remained stable at an average of 450 seeds m-2 in depth 5-10
cm; and decreased significantly from 178 seeds m-2 in May 2014 to 85 seeds m-2 in
September 2015 in depth 10-15 cm. About 77%, 18% and 5% of germinated seeds were
counted from depth 0-5, 5-10 and 10-15 cm, respectively. The maximum number of
germinated seeds came from samples taken in September after most plants had dispersed
their seeds.
5.3.3 Annual, Biennial and Perennial Weeds in the Seedbank
There were significant differences in the density of biennial, annual and perennial
weeds between sampling dates. This effect was dependent upon sampling date, as indicated
by the significant interaction between date and life cycles (F6,1419 = 5.29, P < 0.0001).
Table 5.4 Percentage of the most abundant weeds in the soil seedbank and aboveground
population.
Common and Latin Name Weed
seedbank
Aboveground
population
Abundant in weed seedbank -------------- % --------------
Biennial wormwood (Artemisia biennis Willd.) 63 0
Purslane (Portulaca oleracea L.) 10 0
Flixweed (Descurainia sophia (L.) Webb ex Prantl) 8 <1
Stinkweed (Thlaspi arvense L.) 5 0
Abundant in aboveground weed population
Narrow-Leaved Hawk's Beard (Crepis tectorum L.) <1 31
Dandelion (Taraxacum officinale F.H. Wigg.) <1 29
Foxtail barley (Hordeum jubatum L.) <1 17
Horseweed (Conyza canadensis (L.) Cronquist 1 4
Canada thistle (Cirsium arvense (L.) Scop.) 0 2

67
Figure 5.1 Aboveground weed density in monoculture plots in 2014 and 2015. Abbreviation:
WWG: Western wheatgrass; BBW: Bluebunch wheatgrass; SOG: Side oats grama; LBS:
Little blue stem; NOB: Nodding brome; PPC: Purple prairie clover; and WPC: White prairie
clover. Error bars represent one standard error around the mean; n = 4. Bars with the same
letter are not significantly different (P ≤ 0.05) according to protected Fisher’s LSD test.
Figure 5.2 Aboveground weed density in monoculture and mixture plots in 2014 and 2015.
The density of weeds between monoculture and mixture plots were statistically different in
2014 and 2015. Error bars represent one standard error around the mean; n = 28 and 84 for
monoculture and mixture, respectively. Bars with the same letter are not significantly
different (P ≤ 0.05) according to protected Fisher’s LSD test.
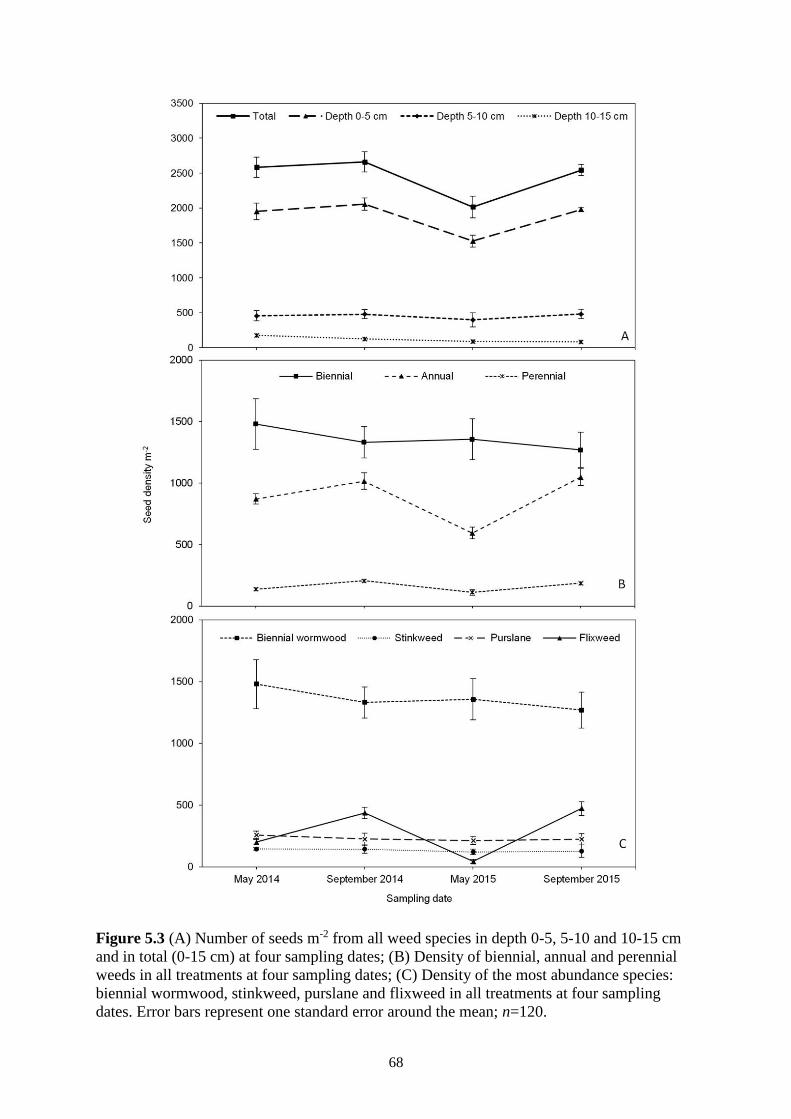
68
Figure 5.3 (A) Number of seeds m-2 from all weed species in depth 0-5, 5-10 and 10-15 cm
and in total (0-15 cm) at four sampling dates; (B) Density of biennial, annual and perennial
weeds in all treatments at four sampling dates; (C) Density of the most abundance species:
biennial wormwood, stinkweed, purslane and flixweed in all treatments at four sampling
dates. Error bars represent one standard error around the mean; n=120.

69
This interaction reflects the number of germinated seeds, particularly annuals. About
57% of recorded species had a biennial life cycle, 37% were annuals and 6% perennials
(Figure 5.3B). Biennial wormwood, flixweed and dandelion were the dominant biennial,
annual and perennial weeds, respectively. Seeds of these species were present in all
treatments. The total density of biennials, annuals and perennials varied with sampling date.
5.3.4 Weed Seedbank in Monocultures and Mixtures
There were significant differences between monoculture plots (Figure 5.4, Table 5.2).
Sampling date and sampling date by treatment interaction were not significant. Monocultures
of WWG contained the lowest number of weeds in the seedbank (1100 seeds m-2), but were
not significantly different from two other C3 grasses, whereas PPC and WPC contained the
highest number of weed seeds (3200 and 3400 seeds m-2, respectively). Between the two C4
species, LBS contained significantly lower numbers of seeds compared to SOG.
Figure 5.4 Average of weed seed bank density in monoculture plots from four sampling
dates. Abbreviation: WWG: Western wheatgrass; BBW: Bluebunch wheatgrass; SOG: Side
oats grama; LBS: Little blue stem; NOB: Nodding brome; PPC: Purple prairie clover; and
WPC: White prairie clover. Error bars represent one standard error around the mean; n = 16.
Bars with the same letter are not significantly different (P ≤ 0.05) according to protected
Fisher’s LSD test.
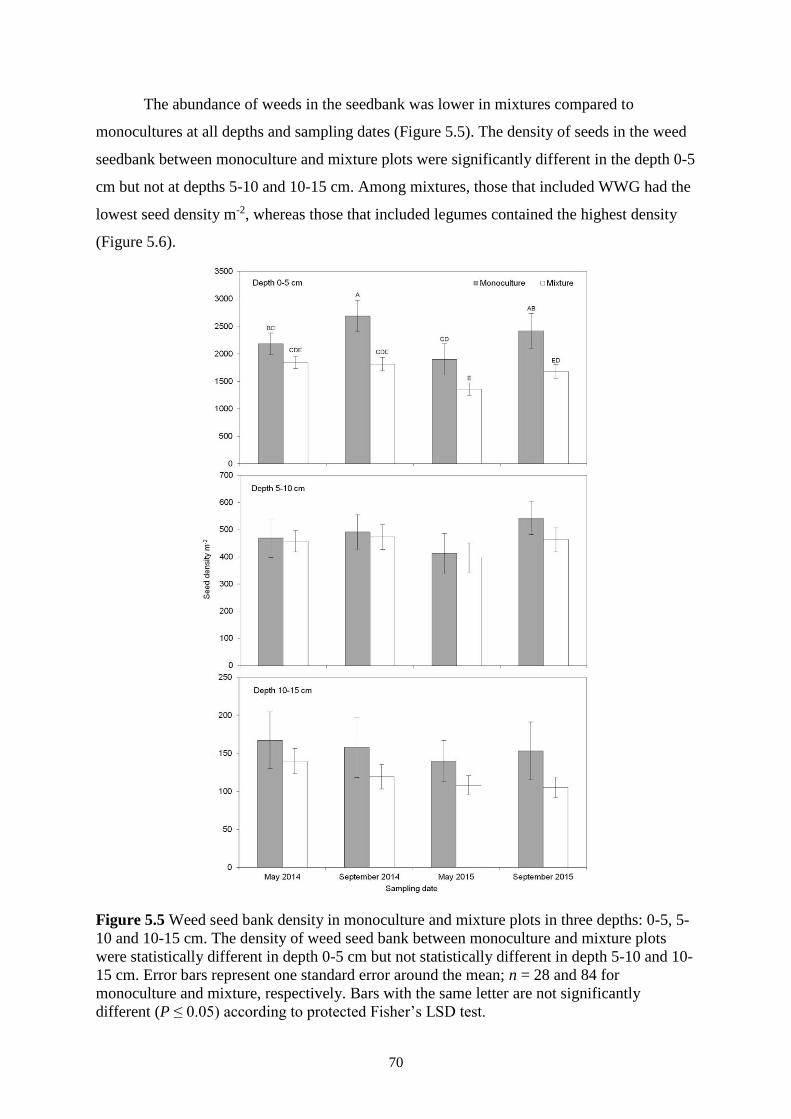
70
The abundance of weeds in the seedbank was lower in mixtures compared to
monocultures at all depths and sampling dates (Figure 5.5). The density of seeds in the weed
seedbank between monoculture and mixture plots were significantly different in the depth 0-5
cm but not at depths 5-10 and 10-15 cm. Among mixtures, those that included WWG had the
lowest seed density m-2, whereas those that included legumes contained the highest density
(Figure 5.6).
Figure 5.5 Weed seed bank density in monoculture and mixture plots in three depths: 0-5, 5-
10 and 10-15 cm. The density of weed seed bank between monoculture and mixture plots
were statistically different in depth 0-5 cm but not statistically different in depth 5-10 and 10-
15 cm. Error bars represent one standard error around the mean; n = 28 and 84 for
monoculture and mixture, respectively. Bars with the same letter are not significantly
different (P ≤ 0.05) according to protected Fisher’s LSD test.

71
Figure 5.6 Weed seedbank and aboveground weed population in mixture plots containing
different forage species. The data related to these graphs was not statistically analyzed since
each data was used more than once to make the bars. Abbreviation: WWG: Western
wheatgrass; BBW: Bluebunch wheatgrass; SOG: Side oats grama; LBS: Little blue stem;
NOB: Nodding brome; PPC: Purple prairie clover; and WPC: White prairie clover. Error bars
represent one standard error around the mean; n = 96 for weed seedbank and n=48 for
aboveground weed population.
5.4 Discussion
5.4.1 Effect of Forage Mixtures on Weed Seedbank and Aboveground Population
Mixtures of forage species contained lower number of weeds in the seedbank and
aboveground weed populations compared to monocultures. This demonstrates that increasing
forage mixture diversity can be an effective ecological and non-chemical weed control tactic
in seeded pastures. Among mixtures, those of which WWG was a component contained
72
lower abundance of weeds in the seedbank and aboveground population. In the present study,
the results of forage yield also showed higher forage productivity of mixtures containing
WWG compared to other mixtures (Chapter 3). Thus, inclusion of highly productive and
strong competitor forage species like WWG in the mixtures, seems to have both positive
effect on forage productivity and strong negative effect on weed seedbank and aboveground
populations.
Lower weed populations in more diverse plant communities have been reported in
many studies (Crawley et al. 1999; Hector et al. 2001; Knops et al. 1999; Lyons and
Schwartz 2001; Naeem et al. 2000; Pfisterer et al. 2004; Picasso et al. 2008). This
phenomenon can be explained in two ways (Wardle 2001): (1) multiple species exhibit
complementarity in resource use limits the ability of other species to enter the community and
(2) a sampling effect that makes it more likely that a diverse mixture will contain a highly
productive or competitive species that monopolizes resources. In this study, it seems that the
‘sampling effect’ is a more likely explanation in the reduction of weed densities in the
seedbank and aboveground population in the mixtures containing WWG. WWG is a sod-
forming rhizomatous grass and was the strongest competitor among the species in this study
(Zhang and Lamb 2011). WWG dominated (more than 87% of the biomass) forage mixtures
in the second year after seeding and thereafter (Chapter 3). Crawley et al. (1999) similarly
found that the sampling effect from including Alopecurus pratensis in the mixture reduced
invasive species’ biomass much more effectively than other species in the mixture. A.
pratensis is an aggressive rhizomatous perennial grass with rapid growth in spring and dense
canopy that can grow to a maximum of 1.2 m (Crawley et al. 1999). However, other studies
have identified complementarity as a primary driver of mixture effects on weed populations.
For example, Naeem et al. (2000) concluded that resource use complementarity best
explained the lower narrow-leaved hawk's beard (Crepis tectorom) density in diverse forage
communities, where higher species diversity decreased available light and nutrients to C.
tectorom and decreased its success to invade a new area.
5.4.2 Aboveground Weed Population vs. Weed Seedbank
Among the 35 identified weed species aboveground and in the seedbank, only 13
weeds were common in both populations. The most abundant weed in the seedbank was
biennial wormwood followed by purslane, both of which were absent in aboveground weed
populations. Conversly, narrow-leaved hawk's beard followed by dandelion were the most
abundant weeds aboveground, but least abundant in the seedbank. While some studies have
73
found strong relationships between the weed seedbank and aboveground communities
(Dessaint et al. 1997; Rahman et al. 2006; Rahman et al. 2001; Zhang et al. 1998), others
have found low correlations (Cardina and Sparrow 1996; Tracy and Sanderson 2000; Webster
et al. 2003). Generally, low similarity between aboveground plant community and seedbank
has been reported for perennial-dominated plant communities (Bakker et al. 1996; Milberg
1995; Rabinowitz 1981; Schenkeveld and Verkaar 1984; Thompson and Grime 1979), and
greater similarity in annual communities (Chang et al. 2001; Moore 1980; Unger and
Woodell 1993; Unger and Woodell 1996).
5.4.3 Temporal Variability of Weed Seedbank and Aboveground Population
Weed seedbank varied seasonally, reached a minimum in early spring and maximum
in late summer. Seed mortality during the fall and winter can explain the reduced weed
seedbank in April, while the seed rain from existing weeds during the growing season will
increase the seedbank reservoir in late season. Changes in weed seedbank size from 2014 to
2015 were also observed. Aboveground weed populations were generally low in 2015
compared to 2014. Since 2015 was one the driest years on record for the region, a decrease in
weed growth and weed seed production is not surprising. In a related study, we found that the
productivity of these native forage species was not significantly affected by the dry
conditions in 2015 (Chapter 3), suggesting that germination conditions may be a stronger
driver of aboveground weed community dynamics than the perennial plant community in this
system.
5.5 Conclusion
Our results demonstrated that mixtures of forage species promote lower weed
densities in the seedbank and aboveground compared to monocultures. Among mixtures,
those containing WWG had lower abundance of weeds in the seedbank and aboveground
weed populations. Species composition of mixtures had an effect on weed seedbank and
aboveground weed populations. WWG, a strong perennial rhizomatous grass, limited the
presence of weedy species in the mixtures stronger than other grasses. The weed seedbank
varied seasonally with the minimum weed seeds in early spring and maximum in late
summer. The most abundant weeds in the seedbank were the least abundant weeds in
aboveground population and vice versa. Among monocultures, WWG contained the lowest
weed densities in the seedbank and aboveground. WWG showed promising results as a native

74
forage species by demonstrating the potential to suppress weeds and reduce weed seed size
when seeded in monocultures and mixtures.
75
CHAPTER 6
THE POTENTIAL OF SEVEN NATIVE NORTH AMERICAN FORAGE SPECIES
TO SUPPRESS WEEDS THROUGH ALLELOPATHY
Abstract
We conducted a series of three greenhouse studies to study the allelopathic effects of
seven native perennial North American forage species alone and in mixture on three
problematic weeds including dandelion (Taraxacum officinale), scentless chamomile
(Matricaria perforata) and foxtail barley (Hordeum jubatum). Shoot dry weight and
root:shoot ratio of weeds were affected by leachate from forage species in all three
experiments. In the first experiment, leachate from little blue stem (Schizachyrium
scoparium) reduced the shoot dry weight of weeds up to 58%. In the second experiment,
leachate of little blue stem, western wheatgrass (Pascopyrum smithii) and side-oats grama
(Bouteloua curtipendula) reduced shoot dry weight of weeds up to 72% and this number
increased up to 90% in the third experiment. In the last experiment, no synergistic effects of
mixed leachate from different forage species on shoot dry weight of weeds were observed. In
this study dandelion and foxtail barley allocated less to roots and shoots, respectively. In
conclusion, the results showed that root leachate from western wheatgrass, little blue stem
and side-oats grama can reduce the aboveground and belowground growth of weeds. These
findings suggest that the use of allelopathic species may provide weed control and
management benefits in seeded pastures and native prairie restorations.
6.1 Introduction
Pasture weeds can significantly reduce forage yield and quality, affecting livestock
production qualities and increase pasture management costs (DiTomaso 2000). The economic
cost of weeds in pastures can be more than that of insects and pathogens combined (Quimby
et al. 1991). In addition to mechanical, cultural, chemical and biological weed control,
selection of highly allelopathic species can be an effective strategy in pastures (Bailey et al.
2010; Jabran et al. 2015). Allelopathic weed control through the selection of forage species
with high allelopathic properties for seeded pastures can be a practical and sustainable way to
suppress weeds. In some agricultural systems, especially organic systems, allelopathic weed
control can be one of the most important tactics available for suppressing weeds (Jabran et al.
2015). The allelopathic relationship between crops and weeds is a reciprocal relationship. Not
76
only agricultural crops produce allelochemicals, but allelopathic potential of invasive weedy
species in the process of invasion, may play an important role in displacing the native species
(Inderjit et al. 2008; Mitchell et al. 2006). Allelopathy is the direct or indirect effect of the
species on others by producing and releasing chemical compounds (Inderjit et al. 2005).
Plants produce more than 100,000 primary and secondary chemical compounds, many of
which can act as allelochemicals (Callaway and Howard 2007). Allelochemicals can affect
the soil microbial community and chemical and physiological properties of the soil (Pedrol et
al. 2006). Most allelochemicals are water soluble and can enter the environment through
aboveground leaching, litter decomposition, shoot volatilization and root leachate (Reigosa et
al. 1999). Allelochemical production in the roots of perennial plants can be affected by many
factors like plant habitat, age of root, temperature, water stress, etc. (Inderjit and Callaway
2003; Reigosa et al. 1999).
There are many studies of the potential of allelopathic agricultural crops for weed
control (Milchunas et al. 2011; Singh et al. 2003), but much less is known about the
allelopathic potential of forage species in pastures. There are many benefits to using diverse
mixtures of forage species in seeded pastures (Mischkolz et al. 2013; Mischkolz et al. 2016)
and moreover, identifying those species with high allelopathic properties in the mixtures
could reduce plant-weed competition, increase forage productivity and decrease the cost of
weed control in pastures. A number of studies have investigated the allelopathic potential of
forage species. For example, Ghebrehiwot et al. (2013) examined the allelopathic potential of
root and leaf extracts of five native grassland species in South Africa on lettuce seeds,
concluding that the dominance of a small number of grass species in South African
grasslands can be linked to the allelopathic properties of those species. San Emeterio et al.
(2004) found that the Mediterranean forage grass Lolium rigidum exerts allelopathic effects
on some pasture plants including Lolium multiflorum Lam., Dactylis glomerata L., and
Medicago sativa L. In another study done by Bokhari (1978) allelopathic potential of western
wheatgrass (Pascopyrum smithii) on seed germination of blue grama (Bouteloua gracilis) and
buffalo grass (Bouteloua dactyloides) was reported. Bokhari (1978) found that western
wheatgrass extract inhibited seed germination of blue grama and buffalo grass up to 40%, and
also extracts collected at an early growth stage of western wheatgrass was more allelopathic
than a later growth stage. Western wheatgrass, one of the study species in this paper, is a
perennial cool season grasses, native to North America and has a shallow root system
(Monsen et al. 2004). In an ongoing field experiment, started by Mischkolz et al. (2013)
anecdotal observations of lower weed populations in western wheatgrass plots and mixture of
77
forage species were recorded. Therefore, we hypothesized that lower weed density in western
wheatgrass plots might be linked to allelopathic activity of western wheatgrass. Root age can
affect allelochemical production (Reigosa et al. 1999), thus in the second experiment, we
hypothesized that our perennial forage species may produce more allelochemicals when they
get older and are cut. In the third experiment, we hypothesized that leachate mixtures might
show synergistic allelopathic effects on weeds. The objectives of this study were to evaluate
(i) the allelopathic potential of seven native forage species in the third month of growth, (ii)
the allelopathic potential of seven native forage species in the fifth month of growth and after
cutting, and (iii) the effect of multispecies leachate mixtures on weeds.
6.2 Materials and methods
A series of three greenhouse experiments was conducted at the Agriculture and Agri-
food Canada (AAFC), Swift Current Research and Development Centre (SCRDC) near Swift
Current, Saskatchewan, Canada. We investigated the allelopathic effects of seven perennial
native North American forage species with high agronomic potential as donor plants (Table
6.1). These species have been evaluated in greenhouse studies (Mischkolz et al. 2016) and
have continued to be evaluated in field studies in Saskatoon and Swift Current, SK (Biligetu
et al. 2014; Mischkolz et al. 2013; Schellenberg et al. 2012). Forage seeds were from the
same seedlots as used in the aforementioned studies. Three problematic weeds with a wide
geographic distribution were collected from Swift Current area and selected as target plants:
dandelion (Taraxacum officinale F.H. Wigg.), scentless chamomile (Matricaria perforata
Mérat) and foxtail barley (Hordeum jubatum L.). Seeds of dandelion and foxtail barley were
collected from SCRDC farm, and scentless chamomile seeds were collected from open areas
in Swift Current, SK in the spring and fall of 2014, respectively.
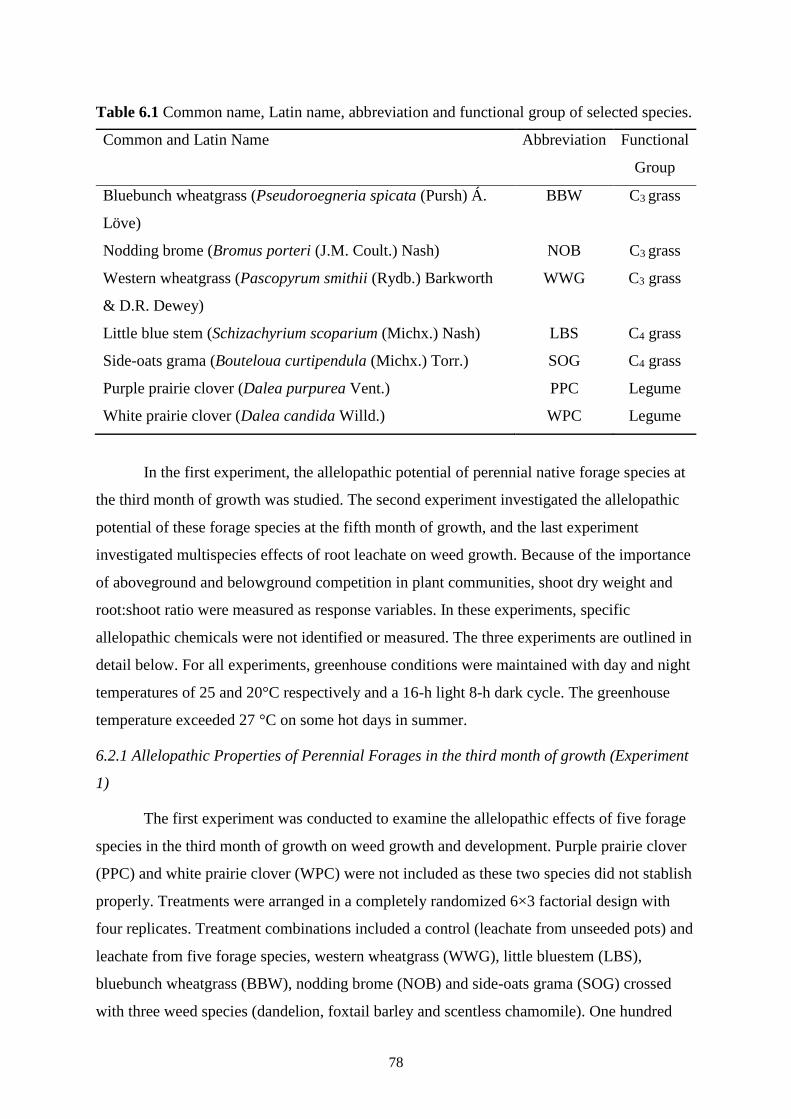
78
Table 6.1 Common name, Latin name, abbreviation and functional group of selected species.
Common and Latin Name Abbreviation Functional
Group
Bluebunch wheatgrass (Pseudoroegneria spicata (Pursh) Á.
Löve)
BBW C3 grass
Nodding brome (Bromus porteri (J.M. Coult.) Nash) NOB C3 grass
Western wheatgrass (Pascopyrum smithii (Rydb.) Barkworth
& D.R. Dewey)
WWG C3 grass
Little blue stem (Schizachyrium scoparium (Michx.) Nash) LBS C4 grass
Side-oats grama (Bouteloua curtipendula (Michx.) Torr.) SOG C4 grass
Purple prairie clover (Dalea purpurea Vent.) PPC Legume
White prairie clover (Dalea candida Willd.) WPC Legume
In the first experiment, the allelopathic potential of perennial native forage species at
the third month of growth was studied. The second experiment investigated the allelopathic
potential of these forage species at the fifth month of growth, and the last experiment
investigated multispecies effects of root leachate on weed growth. Because of the importance
of aboveground and belowground competition in plant communities, shoot dry weight and
root:shoot ratio were measured as response variables. In these experiments, specific
allelopathic chemicals were not identified or measured. The three experiments are outlined in
detail below. For all experiments, greenhouse conditions were maintained with day and night
temperatures of 25 and 20°C respectively and a 16-h light 8-h dark cycle. The greenhouse
temperature exceeded 27 °C on some hot days in summer.
6.2.1 Allelopathic Properties of Perennial Forages in the third month of growth (Experiment
1)
The first experiment was conducted to examine the allelopathic effects of five forage
species in the third month of growth on weed growth and development. Purple prairie clover
(PPC) and white prairie clover (WPC) were not included as these two species did not stablish
properly. Treatments were arranged in a completely randomized 6×3 factorial design with
four replicates. Treatment combinations included a control (leachate from unseeded pots) and
leachate from five forage species, western wheatgrass (WWG), little bluestem (LBS),
bluebunch wheatgrass (BBW), nodding brome (NOB) and side-oats grama (SOG) crossed
with three weed species (dandelion, foxtail barley and scentless chamomile). One hundred
79
seeds of each forage species were seeded in trays filled with a mixture of silica sand and
sterile growing mix (2:1 v/v) (Sunshine Professional Growing Mix, Seba Beach, AB
Canada). After two months, 20 uniform plants of each forage species (Donor Plants) were
transplanted into conical shaped pots (6.5 cm diameter×25 cm depth) (one plant per pot)
filled with silica sand (20-40 grit, Target® Filter Sand, Morinville, AB Canada). A control
treatment of twenty conical pots with no plants was filled with silica sand and watered with
tap water the same way as other conical pots. Forage species were watered daily with 25 mL,
40 mL and 60 mL tap water in the first month, second month and thereafter, respectively. As
root biomass increased over time, plant water uptake increased, therefore the amount of tap
water applied was also increased in order to capture the same amount of leachate every day.
Since we grew plants in silica sand, control and forage species pots were fertilized once a
week with 1g/L of 20-20-20 NPK fertilizer solution (Winter “Plus” Formula, with chelated
trace elements; The Professional Gardener Co. LTD. Calgary, AB Canada). Conical pots
were arranged so that leachate from all 20 pots of each forage species was collected every
day after each watering, in a single tray underneath, and weeds were watered by the collected
leachate on the same day.
Three months after seeding the forage species, 100 seeds of each weed species were
germinated in trays filled with the mixture of silica sand and growing mix (2:1 v/v). Three
weeks after planting, uniform weed seedlings were transplanted into square pots (6.5×6.5×8.5
cm) filled with silica sand (one plant per pot) and then watered with leachate collected from
forage species. Each weed species was watered with 20 ml of forage species leachate every
day for a period of 30 days. The control weeds were watered with water that had passed
through conical pots absent of forage species. At the end of the first experiment, weeds were
harvested and roots were washed, and dried in 60 °C oven for 72 hours and then shoot and
root dry weights were measured.
6.2.2 Allelopathic Properties of Forage Species in the fifth month of growth and after cutting
(Experiment 2)
In the second experiment the increasing effect of allelopathic material in the root of
forage species in the fifth month of growth and after cutting was studied. The cutting was
included to simulate normal defoliation expected in the pastures and hayfields. Treatments
were arranged in a 7×3 factorial structure using a completely randomized design with four
replications. Treatment combinations included the control and leachate from six forage
species (WWG, LBS, NOB, SOG, PPC, WPC) and a control crossed with three weeds
80
(dandelion, foxtail barley and scentless chamomile). In this experiment and the next one,
BBW was removed as that species was infested with disease after the first experiment; PPC
and WPC were added to the experiments as donor plants. The legumes were seeded at the
same time as the other species but since they were slow in growth and development, they
were not included in the first experiment. The process for preparing pots containing PPC and
WPC were the same as other species described for the first experiment. Forage species grown
for the first experiment were cut before flowering stage at the end of the first experiment to a
height of 2.5 cm and cut biomass was removed from the pots. Forage species were cut to
simulate harvesting where forage species are cut either by animal or machinery. Pots
containing weeds were prepared as in the first experiment. One month after cutting the forage
species, weeds began to be watered with 20 ml of forage species leachate every day for a
period of 30 days. At the end of the second experiment, weeds were harvested and roots were
washed, dried in 60 °C oven for 72 hours and then shoot and root dry weights measured.
6.2.3 Root Leachate Mixtures (Experiment 3)
In the third experiment dandelion and scentless chamomile were watered with a
mixture of forage species leachate. Foxtail barley was not included in the third experiment as
there was not enough leachate available to water three weed species. In an ongoing field
experiment started by Mischkolz et al. (2013), anecdotal observations of lower weed density
in mixture plots prompted us to hypothesize that multispecies mixtures of leachate may have
synergistic effects on weed suppression. This experiment was a completely randomized 22×2
factorial design with four replications. Treatment combinations included control and leachate
from six forage species (WWG, LBS, NOB, SOG, PPC, WPC and control) and crossed with
two weeds (dandelion and scentless chamomile). Forage species established for the first
experiment were cut for a second time at the end of the second experiment before flowering
stage to a height of 2.5 cm and cut biomass was removed from the pots. Pots containing
dandelion and scentless chamomile were prepared the same as the first experiment. One
month after cutting forage species, weeds were watered every day using leachate of forage
species for a period of one month. Treatments included leachate from each forage species
alone and all possible two-species combinations. As in previous experiments, leachate of
forage species were collected and two-species mixtures were made using a 1:1 ratio of
leachate from each, and then weeds were watered with 20 ml of either mixed or single
species leachate. As with previous experiments, control weeds were watered using water
passed through conical pots without plants. At the end of the third experiment, weeds were
81
harvested and roots were washed, and dried in 60 °C oven for 72 hours and then shoot and
root dry weights were measured.
6.2.4 Statistical analysis
The data were analyzed with analysis of variance (ANOVA) via a general linear
model (PROC GLM; SAS Server Interface 2.0.4) to examine the effects of leachate
treatments and weed species on weed shoot and root dry weight. Each model included the
main effects of leachate source, weed species, and their interaction. Normality of residuals
were examined using Shapiro-Wilk W test and homogeneity of variance were evaluated using
Levene’s test; based on the results no data transformations were needed. A significance value
of P < 0.05 was used and mean comparisons made using Fisher’s Protected LSD test at P =
0.05.
6.3 Results
6.3.1 Allelopathic Potential of Perennial Forages in the third month of growth (Experiment
1)
In the first experiment, leachate from LBS reduced significantly the shoot dry weight
of dandelion, foxtail barley and scentless chamomile by 52, 46 and 58%, respectively
compared to the control (Figure 6.1, left graphs, Table 6.2). Leachate released by WWG,
SOG and NOB decreased the shoot dry weight of weeds by 33-53% compared to the control.
Leachate from NOB and BBW reduced the root:shoot ratio of dandelion and foxtail barley
significantly; but, the root:shoot ratio in scentless chamomile increased compared to the
control after applying leachate (Figure 6.1). The average percentage shoot reductions of
dandelion, foxtail barley and scentless chamomile from all leachates were 41, 34 and 51%,
respectively.
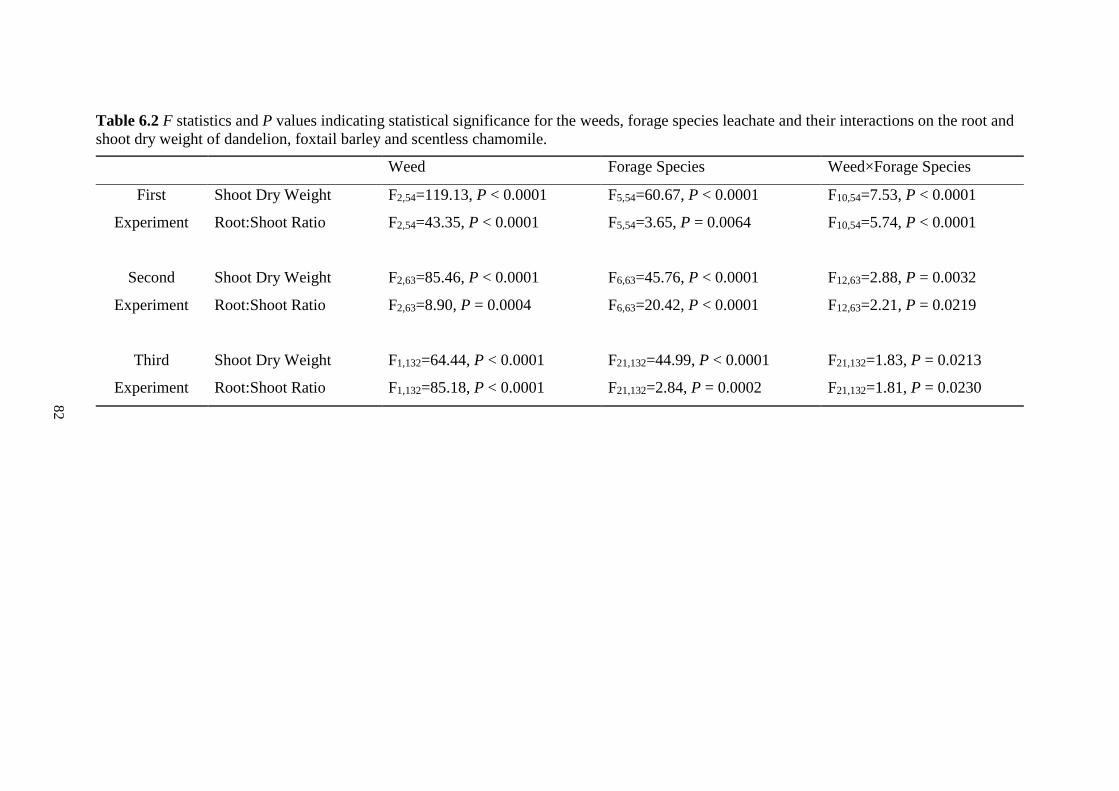
82
Table 6.2 F statistics and P values indicating statistical significance for the weeds, forage species leachate and their interactions on the root and
shoot dry weight of dandelion, foxtail barley and scentless chamomile.
Weed Forage Species Weed×Forage Species
First
Experiment
Shoot Dry Weight F2,54=119.13, P < 0.0001 F5,54=60.67, P < 0.0001 F10,54=7.53, P < 0.0001
Root:Shoot Ratio F2,54=43.35, P < 0.0001 F5,54=3.65, P = 0.0064 F10,54=5.74, P < 0.0001
Second
Experiment
Shoot Dry Weight F2,63=85.46, P < 0.0001 F6,63=45.76, P < 0.0001 F12,63=2.88, P = 0.0032
Root:Shoot Ratio F2,63=8.90, P = 0.0004 F6,63=20.42, P < 0.0001 F12,63=2.21, P = 0.0219
Third
Experiment
Shoot Dry Weight F1,132=64.44, P < 0.0001 F21,132=44.99, P < 0.0001 F21,132=1.83, P = 0.0213
Root:Shoot Ratio F1,132=85.18, P < 0.0001 F21,132=2.84, P = 0.0002 F21,132=1.81, P = 0.0230
82

83
6.3.2 Allelopathic Properties of Forage Species in the fifth month of growth and after cutting
(Experiment 2)
In the second experiment, suppression effects of WWG, SOG and LBS leachate on
target weeds were up to 72% compared to the control (Figure 6.2, Table 6.2). The largest
suppressive effect was from WWG leachate on scentless chamomile. Leachate from WPC
and PPC had lesser effects and did not perform as well as other forage leachate on target
weeds in the second experiment. Root:shoot ratios in dandelion were reduced by WWG, SOG
and LBS leachate compared to the control, but increased in foxtail barley and scentless
chamomile (Figure 6.2).
6.3.3 Root Leachate Mixtures (Experiment 3)
In the third experiment, suppressive effects of leachate from LBS, SOG and WWG on
shoot dry weight of target weeds were up to 88% compared to the control (Figure 6.3, Table
6.2). Similar to the second experiment, leachate of PPC and WPC were not as suppressive as
other leachate. Leachates from each forage species alone reduced the shoot dry weight of
dandelion and scentless chamomile more than two-species mixtures; no synergistic effects of
mixed leachate on shoot dry weight of dandelion and scentless chamomile were thus
observed (Figure 6.3). Leachate of LBS significantly reduced the root:shoot ratio of scentless
chamomile compared to leachate from SOG and WWG, but in dandelion the root:shoot ratio
was similar among different non-mixed leachate. The results in the third experiment showed
that dandelion was more susceptible to leachate from all treatments than that of scentless
chamomile. Average shoot weight of dandelion and scentless chamomile from all treatments
reduced up to 67 and 49%, respectively.
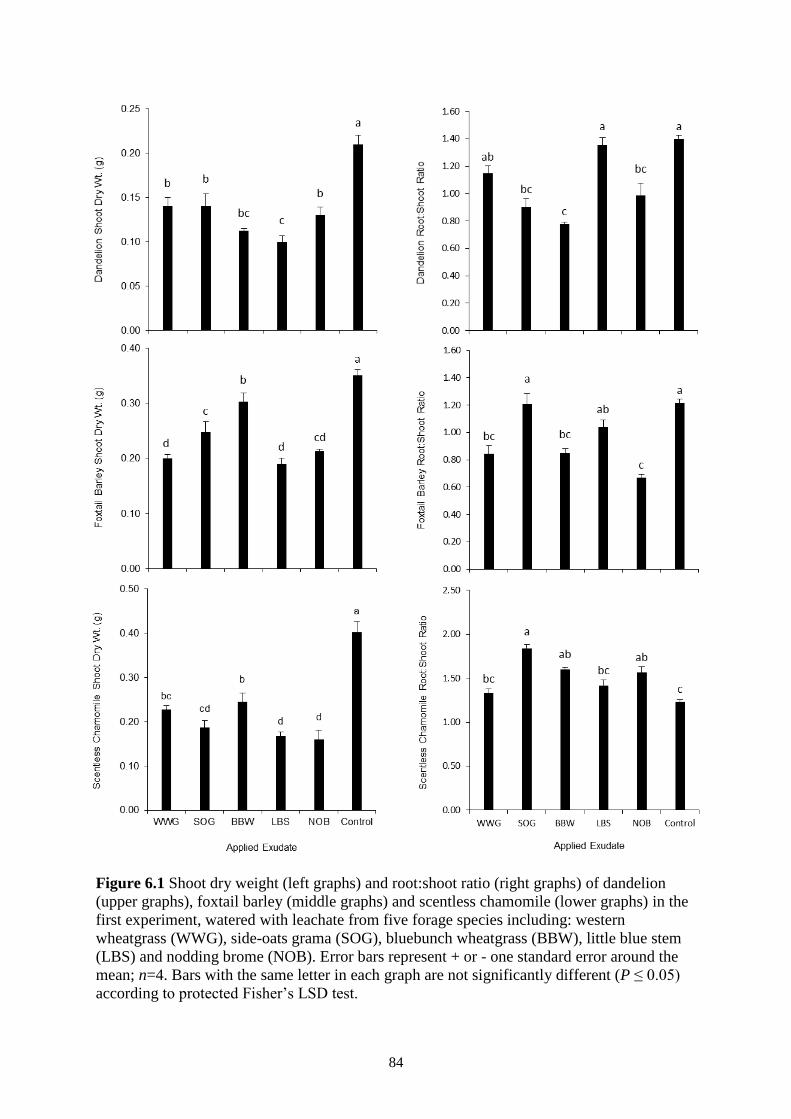
84
Figure 6.1 Shoot dry weight (left graphs) and root:shoot ratio (right graphs) of dandelion
(upper graphs), foxtail barley (middle graphs) and scentless chamomile (lower graphs) in the
first experiment, watered with leachate from five forage species including: western
wheatgrass (WWG), side-oats grama (SOG), bluebunch wheatgrass (BBW), little blue stem
(LBS) and nodding brome (NOB). Error bars represent + or - one standard error around the
mean; n=4. Bars with the same letter in each graph are not significantly different (P ≤ 0.05)
according to protected Fisher’s LSD test.
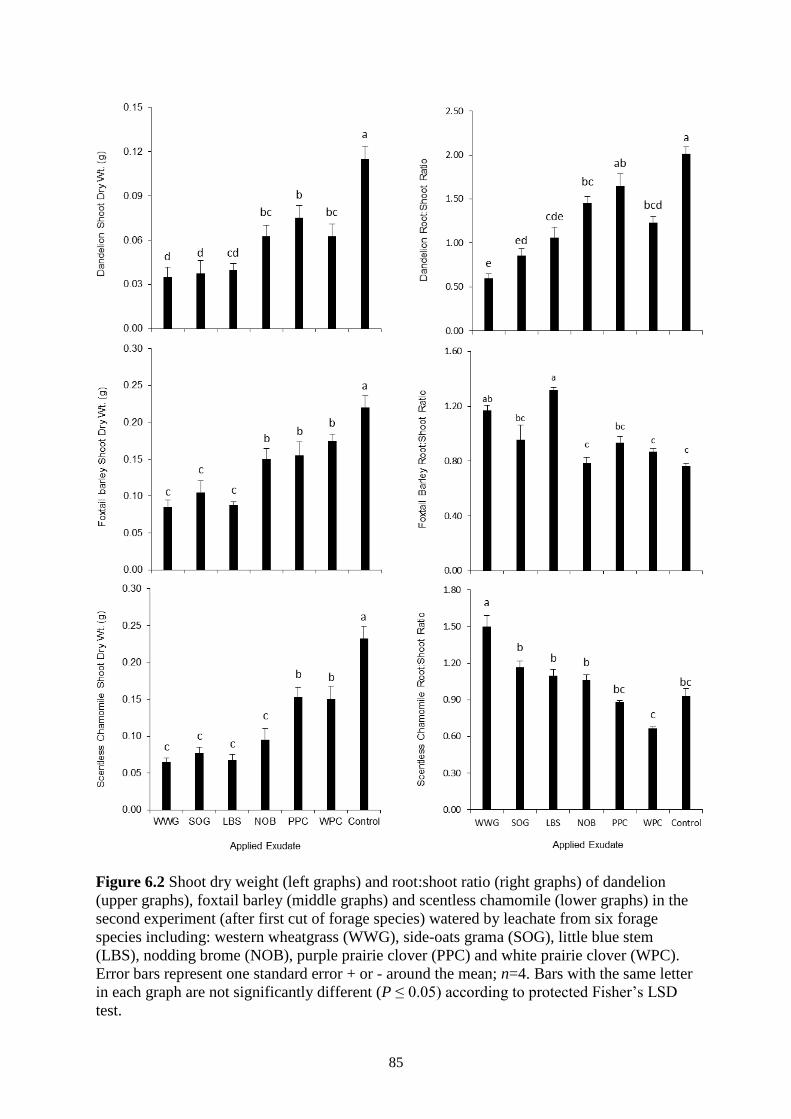
85
Figure 6.2 Shoot dry weight (left graphs) and root:shoot ratio (right graphs) of dandelion
(upper graphs), foxtail barley (middle graphs) and scentless chamomile (lower graphs) in the
second experiment (after first cut of forage species) watered by leachate from six forage
species including: western wheatgrass (WWG), side-oats grama (SOG), little blue stem
(LBS), nodding brome (NOB), purple prairie clover (PPC) and white prairie clover (WPC).
Error bars represent one standard error + or - around the mean; n=4. Bars with the same letter
in each graph are not significantly different (P ≤ 0.05) according to protected Fisher’s LSD
test.

86
Figure 6.3 Shoot dry weight and root:shoot ratio of dandelion and scentless chamomile
watered by leachate from six forage species including: western wheatgrass (WWG), side-oats
grama (SOG), little blue stem (LBS), nodding brome (NOB), purple prairie clover (PPC) and
white prairie clover (WPC). Leachate were applied alone and in a 1:1 mixture. Error bars
represent one standard error + or - around the mean; n=4. Bars with the same letter in each
graph are not significantly different (P≤0.05) according to protected Fisher’s LSD test.
87
6.4 Discussion
This study showed that root leachate from all seven native forage species likely
contain allelochemicals that can reduce shoot dry weight of dandelion, foxtail barley and
scentless chamomile, but leachate from LBS, WWG and SOG had the strongest allelopathic
effects on selected weeds. These results are consistent with our anecdotal observations of
lower density and populations of weeds in WWG plots than seen for other forage species in
an ongoing field experiment. LBS is a warm season grass and might be an ideal option for the
southern part of the Great Plains, whereas WWG is a cool season grass and performs well in
the Canadian Great Plains where there are shorter summers (Mischkolz et al. 2013). This
result may be general as in another study WWG growth was not affected by knapweed in
either the greenhouse or field (Grant et al. 2003). WWG is a strong competitor (Zhang and
Lamb 2011), and its dense root system can occupy large soil volumes, potentially exposing
neighboring plants to more allelochemicals. More studies are needed on WWG to definitively
separate resource competition effects from allelopathy. The results also showed an interaction
between allelochemicals from forage species and weeds. Differential sensitivity to
allelochemicals between target weeds was observed in this study. Plants can present different
degrees of sensitivity to allelochemicals (Jensen and Ehlers 2010; Viard-Crétat et al. 2012);
this may explain why our studied weeds showed different reactions to allelochemicals.
Different degrees of co-occurrence and interactions between donor and target plants during
the process of evolution might be an explanation for differential sensitivity of target plants to
allelochemicals (Viard-Crétat et al. 2012). In this study, dandelion allocated less biomass to
roots compared to foxtail barley and scentless chamomile which might reduce the overwinter
survival rates of dandelion in natural situation. Dandelion roots are viable during the winter
and act as a nutrient reservoir for spring regrowth (Cyr and Bewley 1990). Foxtail barley, on
the other hand, allocated less to shoots which can make it a weak competitor in aboveground
competition in pastures. Dandelion is a perennial weed present in many Canadian farms and
pastures (Wilson and Michiels 2003), and is among the top six most abundant weeds in areas
with no tillage (Stewart-Wade et al. 2002). Foxtail barley is a native perennial grass common
in pastures and rangelands of the Canadian Prairies that is problematic because it is not
palatable once the head is formed (Best et al. 1978). Scentless chamomile is a noxious
invasive weed in that grows in both native prairie and tame pasture (Woo et al. 1991).
Alternative control measures for scentless chamomile are important as many herbicides do
not provide efficient control (Graham et al. 2006).
88
Allelochemicals can be either water soluble or water insoluble and based on the
design of our experiment, all the suppression effects from root leachate can be linked to water
soluble compounds. Allelochemicals have multiple modes of action including effects on cell
division, elongation, structure, wall, cell ultrastructure, growth regulators, membrane
permeability, nutrient uptake, stomatal aperture, photosynthesis and respiration (Reigosa et
al. 1999; Seigler 1996). Unlike herbicides that have one or a few modes of action,
allelochemicals can have multiple modes of action simultaneously (Reigosa et al. 1999). The
suppression effect of root leachate varied in different experiments. Although the effects of
allelochemicals are not highly predictable (Reigosa et al. 1999), in our experiment the
allelopathic potential of forage species generally appeared to increase with age. The increase
in root mass and increase in aboveground material as a source of allelochemicals might be an
explanation for increasing effect of allelopathic potential with age in perennial forage species.
Many factors like soil microorganisms, temperature, light intensity, etc. can affect
allelochemical fate and transform them to less or more harmful compounds (Kobayashi
2004). The results of this experiment open a promising perspective for more field studies on
WWG, LBS and SOG to investigate the effects of environmental factors in natural conditions
on allelochemicals production and fate. Growing weeds in soil collected from pastures
occupied by WWG, LBS and SOG can be another possible experiment to determine the
presence of allelochemicals in the soils of these species. Future field research will provide
wider view on allelopathic potential of these forage species for weed control and
management in seeded pastures.
6.5 Conclusion
In conclusion, the results showed that root leachate from WWG, LBS and SOG can
affect the aboveground and belowground growth of three problematic weeds in the region.
Compared to LBS and SOG which are warm season (C4) grasses, WWG is a cool season (C3)
grass with a dense rhizomatous growth behavior and one of the strongest forage competitors,
which makes it one of the best options for seeded pastures, both for high forage production
and weed suppression in the Canadian Prairie (Mischkolz et al. 2016; Zhang and Lamb
2011). Leachate from these three forage species showed promising results regarding the
suppression of scentless chamomile, one of the most important invasive weeds in the region
(Woo et al. 1991). Allelopathic potential of some forage species on other pasture species have
been reported (Miller 1996; San Emeterio et al. 2004), but our selected native forage species
have been grown successfully in mixture in a long-term study started by Mischkolz et al.

89
(2013). Planting native forage species with high allelopathic potential in seeded pastures can
reduce the cost of weed controls, prevent or eliminate the spread of invasive weeds and
provide a sustainable and environmentally friendly approach for weed control and
management practices.
90
CHAPTER 7
GENERAL CONCLUSION
In this thesis seven native perennial forage species were evaluated from three
perspectives: 1) forage yield and quality, 2) weed seedbank and aboveground weed
population and 3) allelopathic potential to suppress weeds. In Chapters three and four, forage
yield and quality of forage species in monoculture, binary mixtures and complex mixtures
were evaluated in two ecoregions. Several general conclusions arise from this work, the most
important being the consistently higher productivity of mixtures over monocultures.
Mixtures of forage species were consistently more productive and supported a lower
weed seedbank density and aboveground weed population than that of monocultures,
demonstrating the long-term benefits of perennial forage mixtures over monocultures
(Chapter 3, 4 and 5). Mixture composition effects were region and year specific. In the Tall-
Grass Ecoregion, SOG strongly affected the productivity of the binary and complex mixtures
in the seeding year (Chapter 4). In the Dry-Mixed Ecoregion, however, mixtures containing
WWG had higher forage production and lower weed seedbank density and aboveground
weed population (Chapter 3 and 5). Complex mixtures that contain 57% or more WWG,
produced the same amount of dry matter, therefore increasing the proportion of WWG higher
than 57% doesn’t seem to have any positive effects on forage productivity (Chapter 4).
Mischkolz et al. (2013) similarly found that even when WWG is seeded at half of the full
seeding rate, the final forage yield was still as same as WWG in monoculture. Therefore, I
recommend that seed companies consider mixtures containing a maximum of 57% WWG
with the remainder depending on the ecoregion. For example, more LBS should be included
in the mixture for the Dry-Mixed Ecoregion and more SOG for in the Tall-Grass Ecoregion.
Seed mixtures containing WWG, BBW and LBS or SOG (depends on the region) have a
potential to provide higher forage yield, suppress weeds based on their allelopathic potential,
and reduce the weed seedbank abundance.
Long-term trends in species composition in mixture plots were highly dependent on
the growth behavior of each species in the mixture. Binary mixtures were initially seeded at
the same rate (50-50%), however WWG occupied more than 90% of the mixtures in the latest
years of the experiment (Chapter 3). WWG is a stronger competitor than the other species
tested here as both a seedling and at maturity (Zhang and Lamb 2011). These results show the
strong ability of WWG to occupy space, and limit the growth and survival of other species.
91
This competitive ability of WWG can also be implemented for weed control and management
in seeded pastures, as many weeds may not find an empty niche to survive beside WWG
(Chapter 5).
The strong agronomic benefits of mixtures identified in this study are consistent with
many studies that have identified positive relationships between plant diversity and
productivity, ecosystem stability and function (Isbell and Wilsey 2011; Mischkolz et al. 2016;
Picasso et al. 2011; Tilman et al. 2014; Tilman et al. 2001; Tilman et al. 2006a). More diverse
plant communities tend to be more productive than less complex plant communities (Elton
1958; Picasso et al. 2008). This phenomenon can be explained in two ways: 1) resource use
complementarity, and 2) sampling effect (Knops et al. 1999; Naeem et al. 2000; Huston
1997). In the ‘sampling effect’ perspective, more complex mixtures contain at least one
strong and productive species that highly influences the productivity (Huston 1997). In this
study, regarding rhizomatous growth behavior of WWG and also its strong competitive
ability, it seems that the ‘sampling effect’ is a more likely explanation for increased forage
productivity of the mixtures compared to monocultures.
Positive effects of species diversity on productivity can be explained by many factors
including interspecific complementarity, better use of available resources and reduced chance
of herbivory and disease outbreaks (Tilman et al. 2014). Not all native species produce high
forage yield, but forage mixtures including less productive species may bring beneficial
characteristics like drought or grazing tolerance to the plant community. The diverse species
mixtures not only provide good forage yields under favorable climate conditions, but ensure
the maintenance of forage productivity under unpredictable harsh conditions (Mischkolz et al.
2013).
Among monoculture plots, WWG produced greater forage yield at all harvesting
times and contained the lowest weed seedbank and aboveground weed populations (Chapter
3, 4 and 5). Lower weed population in WWG can also be linked to its allelopathic potential
(Chapter 6). Although WWG is a strong competitor (Zhang and Lamb 2011), its dense root
system can also occupy more soil volume and potentially exposes neighboring plants to more
allelochemicals. Therefore, more studies are needed on WWG to separate competition from
allelopathy. A suggested experiment following the design of Duke (2015) would be to
examine the growth of WWG and target plants under conditions whereby both competition
and allelopathy can be manipulated. This experiment should contain six treatments: 1) WWG
and target species grown under conditions whereby both competition and allelopathy occur,
2) using semipermeable sheets to separate roots, and still allowing allelochemicals to move
92
easily, 3) using non-permeable sheets to separate roots from competition and allelopathy, 4)
using non-permeable sheets to separate shoots from competition, 5) using non-permeable
sheets to separate shoots from competition, and using semipermeable sheets for roots, 6)
using non-permeable sheets for both roots and shoots. Using activated charcoal in these
experiments can provide further support for an allelopathy hypothesis. Results of these six
experiments can separate the effect of allelopathy from competition.
During the course of the study, 2015 was one of the driest years, whereas 2016 was
one of the wettest years in the last 120 years in Swift Current. We observed no significant
differences in forage production of WWG between dry and wet years (Chapter 3). This yield
stability across very different climate conditions is highly desirable in a forage species. The
high productivity of WWG compared to other grasses can be related to its rhizomatous
growth behavior. Biligetu et al. (2014) found that rhizomatous C3 grasses, regardless of the
species’ origin, produce greater dry matter than caespitose grasses. NOB performed well in
2011, but the forage yield decreased continuously thereafter and was among the lowest
producers in 2016. Therefore, NOB doesn’t seem to be a suitable option for stable and long-
term forage productivity in the dry-mix ecoregion (Chapter 3). BBW, on the other hand,
produced more stable forage yield during the course of study and might be a good option for
long-term stable forage productivity in seeded pastures. Forage production of LBS was
among the highest in August of all years in Swift Current (Chapter 3). Although SOG did not
perform well in the Dry-Mixed Ecoregion, the species did perform well in the Tall-Grass
Prairie Ecoregion (Chapter 4). In the Tall-Grass Prairie Ecoregion, SOG in monoculture
produced about three-times more dry matter than that of WWG in the seeding year, however
a longer study is needed to evaluate the long-term forage yields of this species in this
ecoregion.
In the study on weed seedbank and aboveground weed population, among the 35
identified weed species aboveground and in the seedbank, only 13 weeds were common in
both aboveground and belowground populations. The most abundant weeds in the seedbank
were the least abundant weeds in aboveground population and vice versa (Chapter 5).
Generally, low similarity between aboveground plant community and seedbank has been
reported for perennial species, thus seedbank measurements in perennial crops seem
necessary to avoid dominance of non-desirable species after disturbance (Bakker et al. 1996;
Milberg 1995; Rabinowitz 1981; Schenkeveld and Verkaar 1984; Thompson and Grime
1979).
93
The results of the allelopathy study (Chapter 6) showed that root leachate from
WWG, LBS and SOG can reduce the aboveground and belowground growth of three
problematic weeds in the region. Leachate from these three forage species showed promising
results regarding the suppression of scentless chamomile, one of the most important invasive
weeds in the region. Different sensitivity to allelochemicals between target weeds was also
observed (Chapter 6). Different degrees of co-occurrence and interactions between donor and
target plants during the process of evolution might be a possible explanation for the different
sensitivity of target plants to allelochemicals from some donor plants (Viard-Crétat et al.
2012). In this study, dandelion allocated less biomass to roots compared to foxtail barley and
scentless chamomile which may reduce the overwinter survival rates of dandelion in a natural
situation. Foxtail barley, on the other hand, allocated less to shoots which can make it a weak
competitor in aboveground competition in pastures. Although the effects of allelochemicals
are not highly predictable (Reigosa et al. 1999), in our experiment the allelopathic potential
of forage species generally appeared to increase with age (Chapter 6). The increase in root
mass and an increase in aboveground material as a source of allelochemical production might
be an explanation for increasing effect of allelopathy with age in perennial forage species.
The results of this experiment initiated the promising perspective for more studies on WWG,
LBS and SOG under field conditions. Planting forage species with high allelopathic potential
in seeded pastures can reduce the cost of weed controls, prevent or eliminate the spread of
invasive weeds and provide a sustainable and environmentally friendly approach for weed
control and management practices.
In summary, the overall goal of this thesis was to provide a wider view on forage
productivity, weed seedbank and allelopathic potential of some native species. Among the
studied species, WWG showed promising results as a native forage species by demonstrating
the potential to produce high forage yield and quality, produce allelopathic compounds,
suppress weeds and reduce weed seedbank density. The inclusion of BBW, LBS and legumes
to the mixtures with WWG can provide sustainable forage yield and quality in varied climate
conditions and can be suitable options for seeded pastures. In this study we observed no
significant differences in forage production of all native species from dry to wet year. The
results showed high stability and productivity of native forage species during very diverse
climate conditions. Forage mixtures produced greater dry matter and promoted lower weed
densities in the seedbank and aboveground populations compared to monocultures. This
demonstrates that an increase in forage mixture diversity can increase forage yield and can
provide ecological and non-chemical weed control techniques in seeded pastures.
94
CHAPTER 8
LITERATURE CITED
Ahmed, M. and Wardle, D. A. 1994. Allelopathic potential of vegetative and flowering
ragwort (Senecio jacobaea L.) plants against associated pasture species. Plant and
Soil 164(4):61-68.
Altieri, M. A. and Liebman, M. Z. 1988. Weed Management in Agroecosystems:
Ecological Approaches. CRC Press, Boca Rato´n.
Ayers, K. W., Acton, D. F. and Ellis, J. G. 1985. The soils of the Swift Current map area
72J Saskatchewan. Saskatchewan Institute of Pedology, Saskatoon
Bailey, A. W., McCartney, D. and Schellenberg, M. P. 2010. Management of Canadian
prairie rangeland. Agriculture and Agri-Food Canada, Ottawa. v, 58 p. pp.
Bakker, E. S., Rosén, E., Verweij, G. L., Bekker, R. M. and Bakker, J. P. 1996. Soil seed
bank composition along a gradient from dry alvar grassland to Juniperus shrubland.
Journal of Vegetation Science 7(2):165 - 176.
Balvanera, P., Pfisterer, A. B., Buchmann, N., He, J. S., Nakashizuka, T., Raffaelli, D.
and Schmid, B. 2006. Quantifying the evidence for biodiversity effects on ecosystem
functioning and services. Ecol Lett 9(10):1146-56.
Baskin, C. C. and Baskin, J. M. 1998. Seed Dormancy and Germination: Ecology,
Biogeography and Evolution. Academic Press, San Diego.
Baskin, J. M. and Baskin, C. C. 1978. The seed bank in a population of an endemic plant
species and its ecological significance. Biological Conservation 14(2):125-130.
Baskin, J. M. and Baskin, C. C. 1985. The annual dormancy cycle in buried weed seeds:a
continuum. Bioscience 35(18):492-498.
Baskin, J. M. and Baskin, C. C. 2004. A classification system of seed dormancy. Seed
Science Research 14(1):1-16.
95
Batlla, D. and Benech-Arnold, R. L. 2003. A quantitative analysis of dormancy loss
dynamics in Polygonum aviculare L. seeds. Development of a thermal time model
based on changes in seed population thermal parameters. Seed Science Research
13(1):55-68.
Batlla, D. and Benech-Arnold, R. L. 2004. Seed dormancy loss assessed by changes in
population hydrotime parameters. Seed Science Research 14(3):277-286.
Batlla, D. and Benech-Arnold, R. L. 2007. Predicting changes in dormancy level in weed
seed soil banks: Implications for weed management. Crop Protection 26(3):189-197.
Bélanger, G., Michaud, R., Jefferson, P. G., Tremblay, G. F. and Brégard, A. 2001.
Improving the nutritive value of timothy through management and breeding.
Canadian Journal of Plant Science 81(4):577-585.
Benech-Arnold, R. L., Sa´ nchez, R. A., Forcella, F., Kruk, B. C. and Ghersa, C. M.
2000. Environmental control of dormancy in weed seed banks in soil. Field Crops
Research 67(2):105-122.
Bertness, M. D. and Callaway, R. M. 1994. Positive interactions in communities. Trends in
Ecology & Evolution 9(5):191-193.
Best, K. F., Banting, J. D. and Bowes, G. G. 1978. The biology of Canadian weeds. 31.
Hordeum jubatum L. Canadian Journal of Plant Science 58:699-708.
Bias, H. P., Vepachedu, R., Gilroy, S., Callaway, R. M. and Vivanco, J. M. 2003.
Allelopathy and Exotic Plant Invasion: From Molecules and Genes to Species
Interactions. Science 301(5638):1377-1380.
Biligetu, B., Jefferson, P. G., Muri, R. and Schellenberg, M. P. 2014. Late summer forage
yield, nutritive value, compatibility of warm- and cool-season grasses seeded with
legumes in western Canada. Canadian Journal of Plant Science 94(7):1139-1148.
Black, M., Bewley, J. D. and Halmer, P. 2006. The encyclopaedia of seeds: science,
technology and uses. CABI International, Wallingford, UK.

96
Blum, U. 1998. Effects of microbial utilization of phenolic acids and their phenolic acid
breakdown products on allelopathic interactions. Journal of Chemical Ecology
24(4):685-708.
Bokhari, U. G. 1978. Allelopathy among prairie grasses and its possible ecological
significance. Annals of Botany 42(1):127-136.
Bonanomi, G., Sicurezza, M. G., Caporaso, S., Esposito, A. and Mazzoleni, S. 2006.
Phytotoxicity dynamics of decaying plant materials. New Phytologist 169(3):571-578.
Brooker, R. W., Maestre, F. T., Callaway, R. M., Lortie, C. L., Cavieres, L. A.,
Kunstler, G., Liancourt, P., Tielborger, K., Travis, J. M. J., Anthelme, F. and
others. 2008. Facilitation in plant communities: the past, the present, and the future.
Journal of Ecology 96(1):18-34.
Bruno, J. F., Stachowicz, J. J. and Bertness, M. D. 2003. Inclusion of facilitation into
ecological theory. Trends in Ecology & Evolution 18(119-125).
Buhler, D. D., Hartzler, R. G. and Forcella, F. 1997. Implications of weed seed and
seedbank dynamics to weed management. Weed Science 45(3):329-336.
Burnside, O. C., Wilson, R. G., Weisberg, S. and Hubbard, K. G. 1996. Seed Longevity
of 41 Weed Species Buried 17 Years in Eastern and Western Nebraska. Weed Science
44(1):74-86.
Callaway, R. M. 1995. Positive interactions among plants. The Botanical Review 61(4):306-
349.
Callaway, R. M. and Aschehoug, E. T. 2000. Invasive plants versus their new and old
neighbors: a mechanism for exotic invasion. Science 290(5491):521-523.
Callaway, R. M. and Howard, T. G. 2007. Competitive networks, indirect interactions, and
allelopathy a microbial viewpoint on plant communities. in K. E. Bochum, U. L.
Darmstadt, W. B. Bielefeld, J. M. Tokyo, eds. Progress in Botany. Springer-Verlag
Berlin Heidelberg New York.
Cardina, J. and Sparrow, D. H. 1996. A comparison of methods to predict weed seedling
populations from the soil seedbank. Weed Science 44(1):46-51.

97
Cavers, P. B. 1983. Seed demography. Canadian Journal of Botany 61:3578-3590.
Chang, E. R., Jefferies, R. L. and Carleton, T. J. 2001. Relationships between vegetation
and soil seed banks in arctic coastal marsh. Journal of Ecology 89:367-384.
Chou, C. H. 1999. Roles of allelopathy in plant biodiversity and sustainable agriculture.
Critical Reviews in Plant Sciences 18(5):609-636.
Chung, I. M. and Miller, D. A. 1995. Differences in autotoxicity among seven alfalfa
cultivars. Agronomy Journal 87(3):596-600.
Crawley, M. J., Brown, S. L., Heard, M. S. and Edwards, G. R. 1999. Invasion-resistance
in experimental grassland communities: species richness or species identity? Ecology
Letters 2(3):140-148.
Cyr, D. R. and Bewley, J. D. 1990. Proteins in the roots of the perennial weeds chicory
(Cichorium intybus L.) and dandelion (Taraxacum officinale Weber) are associated
with overwintering. Planta 182(3):370-374.
Deak, A., Hall, M. H., Sanderson, M. A. and Archibald, D. D. 2007. Production and
Nutritive Value of Grazed Simple and Complex Forage Mixtures. Agronomy Journal
99(3):814.
DeKeyser, E. S., Dennhardt, L. A. and Hendrickson, J. R. 2015. Kentucky Bluegrass (Poa
pratensis) invasion in the northern Great Plains: A story of rapid dominance in an
endangered ecosystem. Invasive Plant Science and Management 8(3):255-261.
Dekker, J. 1997. Weed diversity and weed management. Weed Science 45:357-363.
Dekker, J. 2011. Soil Weed Seed Banks and Weed Management. Journal of Crop Production
2(2):139-166.
Dessaint, F., Chadoeuf, R. and Barralis, G. 1997. Nine years' soil seed bank and weed
vegetation relationships in an arable field without weed control. Journal of Applied
Ecology 34(1):123-130.
Díaz, S. and Cabido, M. 2001. Vive la différence: plant functional diversity matters to
ecosystem processes. Trends in Ecology & Evolution 16(11):646–655.
98
DiTomaso, J. M. 2000. Invasive weeds in rangelands: Species, impacts, and management.
Weed Science 48(2):255-265.
Doak, D. F., Bigger, D., Harding, E. K., Marvier, M. A., O'Malley, R. E. and Thomson,
D. 1998. The statistical inevitability of stability diversity relationships in community
ecology. The American Naturalist 151(3):264-276.
Dorner, J. 2002. An introduction to using native plants in restoration projects. in B. o. L. M.
Plant Conservation Alliance, US Department of Interior, ed., Center for Urban
Horticulture, University of Washington.
Duchene, O., Vian, J. F. and Celette, F. 2017. Intercropping with legume for agroecological
cropping systems: Complementarity and facilitation processes and the importance of
soil microorganisms. A review. Agriculture, Ecosystems and Environment 240:148-
161.
Duke, S. O. 2015. Proving Allelopathy in Crop–Weed Interactions. Weed Science 63(
Special Issue):121-132.
Einhellig, F. A. 1996. Interactions involving allelopathy in cropping systems. Agronomy
Journal 88(6):886-893.
Einhellig, F. A., Rice, E. L., Risser, P. G. and Wender, S. H. 1970. Effects of scopoletin on
growth, CO2 exchange rates, and concentration of scopoletin, scopolin, and
chlorogenic acids in tobacco, sunflower, and pigweed. Bulletin of the Torrey
Botanical Club 97(1):22-23.
Elton, C. S. 1958. The Ecology of Invasions by Animals and Plants. Methuen, London.
Fenner, M. 2000. Seeds: the ecology of regeneration in plant communities. CAB
International, Wallingford, UK. 410 pp.
Fisher, R. F. 1978. Juglone inhibits pine growth under certain moisture regimes. Soil Science
Society of America journal 42:801-803.
Forcella, F., Wilson, R. G., Dekker, J., Kremer, R. J., Cardina, J., Anderson, R. L., Alm,
D., Renner, K. A., Harvey, R. G., Clay, S. and others. 1997. Weed seed bank
emergence across the corn belt. Weed Science 45(1):67-76.

99
Foster, A., Vera, C. L., Malhi, S. S. and Clarke, F. R. 2014. Forage yield of simple and
complex grass-legume mixtures under two management strategies. Canadian Journal
of Plant Science 94(1):41-50.
Fujii, Y., Shibuya, T., Nakatani, K., Itani, T., Hiradate, S. and Parvez, M. 2004.
Assessment method for allelopathic effect from leaf litter leachates. Weed Biology
and Management 4(1):19-23.
Gawronska, H. and Golisz, A. 2006. Allelopathy and biotic stresses. Pages 211-227 in M. J.
Reigosa, N. Pedrol, L. Gonzalez, eds. Allelopathy: A Physiological Process with
Ecological Implications. Springer, Netherlands.
Gerson, E. A. and Kelsey, R. G. 1998. Variation of piperidine alkaloids in ponderosa (Pinus
ponderosa) and lodgepole pine (P. contorta) foliage from central Oregon. Journal of
Chemical Ecology 24(5):815-827.
Ghebrehiwot, H. M., Aremu, A. O. and Van Staden, J. 2013. Evaluation of the
allelopathic potential of five South African mesic grassland species. Plant Growth
Regulation 72(2):155-162.
Goering, H. K. and Van Soest, P. J. 1970. Forage fiber analyses (apparatus, reagents,
procedures, and some applications). U.S. Agricultural Research Service; for sale by
the Supt. of Docs., U.S. Govt. Print. Off., Washington. iv, 20 p. pp.
Goldberg, D. E. 1996. Competitive ability: Definitions, contingency and correlated traits.
Philosophical Transactions: Biological Sciences 351(1345):1377-1385.
González, L., Souto, X. C. and Reigosa, M. J. 1997. Weed control by Capsicum annuum.
Allelopathy Journal 4:101-109.
Grace, J. B. 1999. The factors controlling species density in herbaceous plant communities:
an assessment. Perspectives in Plant Ecology, Evolution and Systematics 2:1-28.
Graham, G. L., Peng, G., Bailey, K. L. and Holm, F. A. 2006. Interactions of
Colletotrichum truncatum with Herbicides for Control of Scentless Chamomile
(Matricaria perforata). Weed Technology 20(4):877-884.

100
Grant, D. W., Peters, D. P. C., Beck, G. K. and Fraleigh, H. D. 2003. Influence of an
exotic species, Acroptilon repens (L.) DC. on seedling emergence and growth of
native grasses. Plant Ecology 166(2):157-166.
Grime, J. P. 1981. The role of seed dormancy in vegetation dynamics. Annals of Applied
Biology 98:555-558.
Grings, E. E., Haferkamp, M. R., Heitschmidt, R. K. and Karl, M. G. 1996. Mineral
dynamics in forages of the Northern Great Plains. Journal of Range Management
49(3):234-240.
Hamm, J. W., Radford, F. G. and Halstead, E. H. 1970. The simultaneous determination
of nitrogen, phosphorus and potassium in sodium bicarbonate extracts of soils. Pages
346 Advances in automated analysis Technicon International Congress 1969 Volume
2 Industrial analysis. Medied Inc., 188 E. Post Rd., White Plains, N.Y.10601.
Harper, J. L. 1977. Population Biology of Plants. Academic Press, London. 892 pp.
Hector, A., Dobson, K., Minns, A., Bazeley-White, E. and Lawton, J. H. 2001.
Community diversity and invasion resistance: An experimental test in a grassland
ecosystem and a review of comparable studies. Ecological Research 16(5):819-831.
Hector, A., Schmid, B., Beierkuhnlein, C., Caldeira, M. C., Diemer, M.,
Dimitrakopoulos, P. G., Finn, J. A., Freitas, H., Giller, P. S., Good, J. and others.
1999. Plant diversity and productivity experiments in european grasslands. Science
286(5442):1123-7.
Hierro, J. e. L. and Callaway, R. M. 2003. Allelopathy and exotic plant invasion. Plant and
Soil 256(1):29-39.
Holechek, J. L., Pieper, R. D. and Herbel, C. H. 2004. Range animal nutrition. Pages 265-
316 Range management: Principles and practices. Prentice-Hall, Inc., Englewood
Cliffs, NJ.
Hooper, D. U., Chapin, F. S., Ewel, J. J., Hector, A., Inchausti, P., Lavorel, S., Lawton,
J. H., Lodge, D. M., Loreau, M., Naeem, S. and others. 2005a. Effects of
101
biodiversity on ecosystem functioning: A consensus of current knowledge. Ecological
Monographs 75(1):3-35.
Hooper, D. U., Chapin, F. S., Ewel, J. J., Hector, A., Inchausti, P., Lavorel, S., Lawton,
J. H., Lodge, D. M., Loreau, M., Naeem, S. and others. 2005b. Effects of
biodiversity on ecosystem functioning: a consensus of current knowledge. Ecological
Monographs 75(1):3-35.
Hooper, D. U. and Vitousek, P. M. 1998. Effects of plant composition and diversity on
nutrient cycling. Ecological Monographs 68(1):121-149.
Huston, M. A. 1997. Hidden treatments in ecological experiments: re-evaluating the
ecosystem function of biodiversity. Oecologia 110(4):449-460.
Huston, M. A., Aarssen, L. W., Austin, M. P., Cade, B. S., Fridley, J. D., Garnier, E.,
Grime, J. P., Hodgson, J., Lauenroth, W. K., Thompson, K. and others. 2000. No
consistent effect of plant diversity on productivity. Science 289(5483):1255.
Inderjit and Callaway, R. M. 2003. Experimental designs for the study of allelopathy. Plant
and Soil 256(1):1–11.
Inderjit, Seastedt, T. R., Callaway, R. M., Pollock, J. L. and Kaur, J. 2008. Allelopathy
and plant invasions: traditional, congeneric, and bio-geographical approaches.
Biological Invasions 10(6):875-890.
Inderjit, Weston, L. A. and Duke, S. O. 2005. Challenges, achievements and opportunities
in allelopathy research. Journal of Plant Interactions 1(2):69-81.
Isbell, F. I. and Wilsey, B. J. 2011. Increasing native, but not exotic, biodiversity increases
aboveground productivity in ungrazed and intensely grazed grasslands. Oecologia
165(3):771-81.
Jabran, K., Mahajan, G., Sardana, V. and Chauhan, B. S. 2015. Allelopathy for weed
control in agricultural systems. Crop Protection 72:57-65.
Jefferson, P. G., McCaughey, W. P., May, K., Woosaree, J. and McFarlane, L. 2004.
Forage quality of seeded native grasses in the fall season on the Canadian Prairie
Provinces. Canadian Journal of Plant Science 84(2):503-509.

102
Jensen, C. G. and Ehlers, B. K. 2010. Genetic variation for sensitivity to a thyme
monoterpene in associated plant species. Oecologia 162(4):1017-25.
Jones, D. I. H. and Wilson, A. 1987. Nutritive quality of forages. Pages 65-90 in J. B.
Hacker, J. H. Ternouth, eds. The nutrition of herbivores. Academic Press, Sydney,
Australia.
Jones, H. G. 1992. Plants and microclimate: A quantitative approach to environmental plant
physiology. 2nd ed. Cambridge University Press, Cambridge, UK.
Jones, J. B. 1991. Plant Tissue Analysis in Micronutrients. in J. J. Mortvedt, F. R. Cox, L. M.
Shuman, R. M. Welch, eds. Micronutrients in Agriculture Second Edition. Soil
Science Society of America, Inc., Madison, Wisconsin, USA.
Karn, J. F. and Hofmann, L. 1990. Comparison of the Copper and Molybdenum Status of
Yearling Steers Grazing Reclaimed Mined-Land and Native Range. Journal of Range
Management 43(1):69-72.
Karssen, C. M. 1980. Environmental conditions and endogenous mechanisms involved in
secondary dormancy of seeds. Israel Journal of Botany 29(1-4):291-300.
Karssen, C. M. 1982. Seasonal patterns of dormancy in weed seeds. Pages 243-270 in A. A.
Khan, ed. The Physiology and Biochemistry of Seed Development, Dormancy and
Germination. Elsevier, Amsterdam.
Keddy, P., Fraser, L. H. and Wisheu, I. C. 1998. A comparative approach to examine
competitive response of 48 wetland plant species. Journal of Vegetation Science
9(6):777-786.
Keddy, P. A., Twolanstrutt, L. and Wisheu, I. C. 1994. Competitive effect and response
rankings in 20 wetland plants - Are they consistent across 3 environments. Journal of
Ecology 82(3):635-643.
Kelty, M. J. 2006. The role of species mixtures in plantation forestry. Forest Ecology
andManagement 233(2-3):195-204.
Kirwan, L., Luescher, A., Sebastia, M. T., Finn, J. A., Collins, R. P., Porqueddu, C.,
Helgadottir, A., Baadshaug, O. H., Brophy, C., Coran, C. and others. 2007.
103
Evenness drives consistent diversity effects in intensive grassland systems across 28
European sites. Journal of Ecology 95(3):530-539.
Knops, J. M. H., Tilman, D., Haddad, N. M., Naeem, S., Mitchell, C. E., Haarstad, J.,
Ritchie, M. E., Howe, K. M., Reich, P. B., Siemann, E. and others. 1999. Effects
of plant species richness on invasion dynamics, disease outbreaks, insect abundance
and diversity. Ecology Letters 2(5):286-293.
Kobayashi, K. 2004. Factors affecting phytotoxic activity of allelochemicals in soil. Weed
Biology and Management 4(1):1-7.
Koeppe, D. E., Southwick, L. M. and Bittell, J. E. 1976. The relationship of tissue
chlorogenic acid concentrations and leaching of phenolics from sunflowers grown
under varying phosphate nutrient conditions. Canadian Journal of Botany 54(7):593-
599.
Kumar, V., Brainard, D. C. and Bellinder, R. R. 2009. Suppression of Powell Amaranth
(Amaranthus powellii) by Buckwheat Residues: Role of Allelopathy. Weed Science
57(1):66-73.
Lamb, E., Kennedy, N. and Siciliano, S. 2011. Effects of plant species richness and
evenness on soil microbial community diversity and function. Plant and Soil
338(1):483-495.
Lehman, C. L. and Tilman, D. 2000. Biodiversity, Stability, and Productivity in
Competitive Communities. The American Naturalist 156(5):534-552.
Lhomme, J. P. and Winkel, T. 2002. Diversity stability relationships in community
ecology: Re-examination of the portfolio effect. Theoretical Population Biology
62(3):271-279.
Loreau, M. and de Mazancourt, C. 2013. Biodiversity and ecosystem stability: a synthesis
of underlying mechanisms. Ecology Letters 16(1):106-115.
Loreau, M., Naeem, S., Inchausti, P., Bengtsson, J., Grime, J. P., Hector, A., Hooper, D.
U., Huston, M. A., Raffaelli, D., Schmid, B. and others. 2001. Biodiversity and
104
ecosystem functioning: current knowledge and future challenges. Science
294(5543):804-8.
Lortie, C. J. 2007. An ecological tardis: the implications of facilitation through evolutionary
time. Trends in Ecology & Evolution 22(12):627-630.
Lortie, C. J., Filazzola, A., Welham, C. and Turkington, R. 2016. A cost–benefit model
for plant–plant interactions: a densityseries tool to detect facilitation. Plant Ecol
217:1315-1329.
Lyons, K. G. and Schwartz, M. W. 2001. Rare species loss alters ecosystem function –
invasion resistance. Ecology Letters 4(4):358-365.
Macías, F. A. 1995. Allelopathy in the Search for Natural Herbicide Models. ACS
Symposium Series 582:310-329.
Malézieux, E., Crozat, Y., Dupraz, C., Laurans, M., Makowski, D., Ozier-Lafontaine,
H., Rapidel, B., de Tourdonnet, S. and Valantin-Morison, M. 2009. Mixing plant
species in cropping systems: concepts, tools and models. A review. Agronomy for
Sustainable Development 29(1):43-62.
McGraw, R. L., Shockley, F. W., Thompson, J. F. and Roberts, C. A. 2004. Evaluation of
Native Legume Species for Forage Yield, Quality, and Seed Production. Native Plants
Journal 5(2):152-159.
McNaughton, S. J. 1977. Diversity and stability of ecological communities: a comment on
the role of empiricism in ecology. The American Naturalist 111(979):515-525.
Mesgaran, M. B., Mashhadi, H. R., Zand, E. and Alizadeh, H. M. 2007. Comparison of
three methodologies for efficient seed extraction in studies of soil weed seedbanks.
Weed Research 47(6):472-478.
Milberg, P. 1995. Soil seed bank after eighteen years of succession from grassland to forest.
Oikos 72(1):3-13.
Milchunas, D. G., Vandever, M. W., Ball, L. O. and Hyberg, S. 2011. Allelopathic Cover
Crop Prior to Seeding Is More Important Than Subsequent Grazing/Mowing in
Grassland Establishment. Rangeland Ecology & Management 64(3):291-300.

105
Miller, D. A. 1996. Allelopathy in forage crop systems. Agronomy Journal 88(6):854-859.
Miller, T. E. 1997. Direct and indirect species interactions in an early old-field plant
community. The American Society of Naturalists 143:1007-1025.
Mischkolz, J. M. 2013. Selecting and evaluating complex native forage mixtures for the
mixed grass prairie. University of Saskatchewan, Saskatoon, SK, CA. 112 pp.
Mischkolz, J. M., Schellenberg, M. P. and Lamb, E. G. 2013. Early productivity and crude
protein content of establishing forage swards composed of combinations of native
grass and legume species in mixed-grassland ecoregions. Canadian Journal of Plant
Science 93(3):445-454.
Mischkolz, J. M., Schellenberg, M. P. and Lamb, E. G. 2016. Assembling productive
communities of native grass and legume species finding the right mix. Applied
Vegetation Science 19:111-121.
Mitchell, C. E., Agrawal, A. A., Bever, J. D., Gilbert, G. S., Hufbauer, R. A.,
Klironomos, J. N., Maron, J. L., Morris, W. F., Parker, I. M., Power, A. G. and
others. 2006. Biotic interactions and plant invasions. Ecol Lett 9(6):726-40.
Molano-Flores, B., Coons, J. M. and Cunningham, J. B. 2011. Germination of Two Seed
Types from Three Dalea Species. Castanea 76(3):266-271.
Monsen, S. B., Stevens, R., Shaw, N. L. and Rocky Mountain Research Station (Fort
Collins Colo.). 2004. Restoring western ranges and wildlands. United States Dept. of
Agriculture, Forest Service, Rocky Mountain Research Station, Fort Collins, CO.
Moore, P. D. 1980. Soil seed banks. Nature 284:123-124.
Muir, J. P., Pitman, W. D. and Foster, J. L. 2011. Sustainable, low-input, warm-season,
grass-legume grassland mixtures: mission (nearly) impossible? Grass and Forage
Science 66(3):301-315.
Murphy, S. D., Clements, D. R., Belaoussoff, S., Kevan, P. G. and Swanton, C. J. 2006.
Promotion of weed species diversity and reduction of weed seedbanks with
conservation tillage and crop rotation. Weed Science 54(3):606-606.
106
Mwaja, V. N., Masiunas, J. B. and Weston, L. A. 1995. Effects of fertility on biomass,
phytotoxicity and allelochemical content of cereal rye. Journal of Chemical Ecology
21(1):81-96.
Naeem, S., Knops, J. M. H., Tilman, D., Howe, K. M., Kennedy, T. and Gale, S. 2000.
Plant diversity increases resistance to invasion in the absence of covarying extrinsic
factors. Oikos 91(1):97-108.
National-Research-Council. 2001. Nutrient requirements of beef cattle. 7th rev. ed. 1996
(updated 2001). Subcommittee on Beef Cattle Nutrition, Committee on Animal
Nutrition, Board on Agriculture, National Research Council. National Academic
Press, Washington, DC.
Nishida, N., Tamotsu, S., Nagata, N., Saito, C. and Sakai, A. 2005. Allelopathic effects of
volatile monoterpenoids produced by Salvia leucophylla: Inhibition of cell
proliferation and DNA synthesis in the root apical meristem of Brassica campestris
seedlings. Journal of Chemical Ecology 31(5):1187-1203.
Noel, R. J. and Hambleton, L. G. 1976. Collaborative study of a semiautomated method for
the determination of crude protein in animal feeds. J Assoc Off Anal Chem 59(1):134-
40.
Oelmann, Y., Wilcke, W., Temperton, V. M., Buchmann, N., Roscher, C., Schumacher,
J., Schulze, E. D. and Weisser, W. W. 2007. Soil and plant nitrogen pools as related
to plant diversity in an experimental grassland. Soil Science Society of America
Journal 71(3):720-729.
Otfinowski, R., Kenkel, N. C. and Catling, P. M. 2007. The biology of Canadian weeds.
134. Bromus inermis Leyss. Canadian Journal of Plant Science 87(1):183-198.
Patrick, Z. A. 1971. Phytotoxic substances associated with the decomposition in soil of plant
residues. Soil Science 111(1):13-18.
Pedrol, N., González, L. and Reigosa, M. J. 2006. Allelopathy and abiotic stress. Pages
171-206 in M. J. Reigosa, N. Pedrol, L. González, eds. Allelopathy: A Physiological
Process with Ecological Implications. Springer, Netherlands.
107
Peterson, P. R., Sheaffer, C. C. and Hall, M. H. 1992. Drought effects on perennial forage
legume yield and quality. 84(5):774-779.
Pfisterer, A. B., Joshi, J., Schmid, B. and Fischer, M. 2004. Rapid decay of diversity-
productivity relationships after invasion of experimental plant communities. Basic and
Applied Ecology 5(1):5-14.
Picasso, V. D., Brummer, E. C., Liebman, M., Dixon, P. M. and Wilsey, B. J. 2008. Crop
Species Diversity Affects Productivity and Weed Suppression in Perennial
Polycultures under Two Management Strategies. Crop Science 48(1):331-342.
Picasso, V. D., Brummer, E. C., Liebman, M., Dixon, P. M. and Wilsey, B. J. 2011.
Diverse perennial crop mixtures sustain higher productivity over time based on
ecological complementarity. Renewable Agriculture and Food Systems 26(04):317-
327.
Quimby, P. C., JR., Bruckart, W. L., Deloach, C. J., Knutson., L. and Ralphs, M. H.
1991. Biological control of rangeland weeds. Pages 83-102 in L. F. James, J. Evans,
M. H. Ralphs, R. D. Child, eds. Noxious Range Weeds. Westview Press, San
Francisco.
Rabinowitz, D. 1981. Buried viable seed in a North American tall-grass prairie: The
resemblance of their abundance and composition to dispersing seeds. Oikos
36(2):191-195.
Rahman, A., James, T. K. and Grbavac, N. 2006. Correlation between the soil seed bank
and weed populations in maize fields. Weed Biology and Management 6(4):228-234.
Rahman, A., James, T. K., Mellsop, J. M. and Grbavac, N. 2001. Weed seedbank
dynamics in maize under different herbicide regimes. New Zealand Plant Protection,
Vol 54 54:168-173.
Reich, P. B., Tilman, D., Naeem, S., Ellsworth, D. S., Knops, J., Craine, J., Wedin, D.
and Trost, J. 2004. Species and functional group diversity independently influence
biomass accumulation and its response to CO2 and N. Proceeding of the National
Academy of Sciences of the United States of America 101(27):10101-10106.
108
Reigosa, M. J., Sánchez-Moreiras, A. and González, L. 1999. Ecophysiological Approach
in Allelopathy. Critical Reviews in Plant Sciences 18(5):577-608.
Reiss, J., Bridle, J. R., Montoya, J. M. and Woodward, G. 2009. Emerging horizons in
biodiversity and ecosystem functioning research. Trends in Ecology & Evolution
24(9):505–514.
Rice, E. L. 1972. Allelopathic effects of Andropogon virginicus and its persistence in old
fields. American Journal of Botany 59(7):752-755.
Rice, E. L. 1979. Allelopathy—An update. The Botanical Review 45(1):15-109.
Rice, E. L. 1984. Allelopathy. 2nd ed. Academic Press, Orlando. xi, 422 p. pp.
Rice, K. J. 1989. Impacts of seed banks on grassland community structure and population
dynamics. Pages 211-230 in M. A. e. a. Leck, ed. Ecology of soil seed banks.
Academic Press, New York.
Roberts, H. A. and Feast, P. M. 1972. Fate of seeds of some annual weeds in different
depths of cultivated and undisturbed soil. Weed Research 12(4):316-324.
Robinson, R. K. 1972. The production by roots of Calluna vulgaris of a factor inhibitory to
growth of some mycorrhizal fungi. Journal of Ecology 60(1):219-224.
San Emeterio, L., Arroyo, A. and Canals, R. M. 2004. Allelopathic potential of Lolium
rigidum Gaud. on the early growth of three associated pasture species. Grass and
Forage Science 59(2):107-112.
Sanderson, M. A., Goslee, S. C., Klement, K. D. and Soder, K. J. 2007. Soil seed bank
composition in pastures of diverse mixtures of temperate forages. Agronomy Journal
99(6):1514-1520.
Sanderson, M. A., Soder, K. J., Muller, L. D., Klement, K. D., Skinner, R. H. and
Goslee, S. C. 2005. Forage mixture productivity and botanical composition in
pastures grazed by dairy cattle. Agronomy Journal 97:1465-1471.
109
Sanderson, M. A., Stout, R., Goslee, S., Gonet, J. and Smith, R. G. 2014. Soil seed bank
community structure of pastures and hayfields on an organic farm. Canadian Journal
of Plant Science 94(4):621-631.
Schellenberg, M. P. and Banerjee, M. R. 2002. The potential of legume-shrub mixtures for
optimum forage production in southwestern Saskatchewan: A greenhouse study.
Canadian Journal of Plant Science 82(2):357-363.
Schellenberg, M. P., Biligetu, B. and Iwaasa, A. D. 2012. Species dynamic, forage yield,
and nutritive value of seeded native plant mixtures following grazing. Canadian
Journal of Plant Science 92(4):699-706.
Schenkeveld, A. J. and Verkaar, H. J. 1984. The ecology of short- lived forbs in chalk
grasslands: distribution of germinative seeds and its significance for seedling
emergence. Journal of Biogeography 11(3):251-260.
Seigler, D. S. 1996. Chemistry and mechanisms of allelopathic interactions. Agronomy
Journal 88(6):876-885.
Sheehan, C., Kirwan, L., Connolly, J. and Bolger, T. 2006. The effects of earthworm
functional group diversity on nitrogen dynamics in soils. Soil Biology and
Biochemistry 38:2629-2636.
Simard, M. J., Rouane, S. and Leroux, G. D. 2011. Herbicide Rate,
Glyphosate/Glufosinate Sequence and Corn/Soybean Rotation Effects on Weed Seed
Banks. Weed Science 59(3):398-403.
Singh, H. P., Batish, D. R. and Kohli, R. K. 2003. Allelopathic Interactions and
Allelochemicals: New Possibilities for Sustainable Weed Management. Critical
Reviews in Plant Sciences 22(3-4):239-311.
Smoliak, S. and Dormaar, J. F. 1985. Productivity of Russian Wildrye and Crested
Wheatgrass and Their Effect on Prairie Soils. Journal of Range Management 38
(5):403-405.
110
Sosnoskie, L. M., Herms, N. P. and Cardina, J. 2006. Weed seedbank community
composition in a 35-yr-old tillage and rotation experiment. Weed Science 54(2):263-
273.
Souto, X. C., González, L. and Reigosa, M. J. 1995. Allelopathy in forest environment in
Galicia, NW Spain. Allelopathy Journal 2:67-78.
Spehn, E. M., Hector, A., Joshi, J., Scherer-Lorenzen, M., Schmid, M., Bazeley-White,
E., Beierkuhnlein, C., Caldeira, M. C., Diemer, M., Dimitrakopoulos, P. G. and
others. 2005. Ecosystem Effects of Biodiversity Manipulations in European
Grasslands. Ecological Monographs 75(1):37-63.
Stewart-Wade, S. M., Neumann, S., Collins, L. L. and Boland, G. L. 2002. The biology of
Canadian weeds. 117. Taraxacum officinale G. H. Weber ex Wiggers. Canadian
Journal of Plant Science 82(4):825-853.
Symstad, A. J., Chapin, F. S., Wall, D. H., Gross, K. L., Huenneke, L. F., Mittelbach, G.
G., Peters, D. P. C. and Tilman, D. 2003. Long-term and large-scale perspectives on
the relationship between biodiversity and ecosystem functioning. BioScience
53(1):89-98.
Tang, C.-S., Cai, W.-F., Kohl, K. and Nishimoto, R. K. 1995. Plant Stress and Allelopathy.
ACS Symposium Series 582:142–157.
Taylorson, R. B. 1982. Anesthetic effects on secondary dormancy and phytochrome
responses in Setaria faberi seeds. Plant Physiology 70(3):882-886.
Telewski, F. W. and Zeevaart, J. A. D. 2002. The 120-yr period for Dr. Beal's seed viability
experiment. American Journal of Botany 89(8):1285-1288.
Temperton, V. M., Mwangi, P. N., Scherer-Lorenzen, M., Schmid, B. and Buchmann, N.
2007. Positive interactions between nitrogen-fixing legumes and four different
neighbouring species in a biodiversity experiment. Oecologia 151(2):190-205.
Thompson, K. and Grime, J. P. 1979. Seasonal-Variation in the Seed Banks of Herbaceous
Species in 10 Contrasting Habitats. Journal of Ecology 67(3):893-921.
111
Tilman, D. 1996. Biodiversity: Population versus ecosystem stability. Ecology 77(2):350-
363.
Tilman, D. 1999. The ecological consequences of changes in biodiversity: A search for
general principles. Ecology 80(5):1455-1474.
Tilman, D. and Downing, J. A. 1994. Biodiversity and stability in grasslands. Nature
367:363-365.
Tilman, D., Isbell, F. and Cowles, J. M. 2014. Biodiversity and Ecosystem Functioning.
Annual Review of Ecology, Evolution, and Systematics 45:471-493.
Tilman, D., Lehman, C. L. and Thomson, K. T. 1997. Plant diversity and ecosystem
productivity: theoretical considerations. Proc Natl Acad Sci U S A 94(5):1857-61.
Tilman, D., Reich, P. B., Knops, J., Wedin, D., Mielke, T. and Lehman, C. 2001.
Diversity and productivity in a long-term grassland experiment. Science
294(5543):843-5.
Tilman, D., Reich, P. B. and Knops, J. M. 2006a. Biodiversity and ecosystem stability in a
decade-long grassland experiment. Nature 441(7093):629-32.
Tilman, D., Reich, P. B. and Knops, J. M. 2006b. Biodiversity and ecosystem stability in a
decadelong grassland experiment. Nature 441(7093):629-632.
Tilman, D., Wedin, D. and Knops, J. 1996. Productivity and sustainability influenced by
biodiversity in grassland ecosystem. Nature 379:718-720.
Tracy, B. F. and Sanderson, M. A. 2000. Seedbank diversity in grazing lands of the
Northeast United States. Journal of Range Management 53(1):114-118.
Tracy, B. F. and Sanderson, M. A. 2004. Forage productivity, species evenness and weed
invasion in pasture communities. Agriculture, Ecosystems and Environment
102(2):175-183.
Trenbath, B. R. 1974a. Biomass productivity of mixtures. Advances in Agronomy 26:177-
210.
112
Trenbath, B. R. 1974b. Neighbour Effects in the Genus Avena. II. Comparison of Weed
Species. Journal of Applied Ecology 11(1):111-125.
Turner, J. A. and Rice, E. L. 1975. Microbial decomposition of ferulic acid in soil. Journal
of Chemical Ecology 1(1):41-58.
Unger, I. A. and Woodell, S. R. J. 1993. The relationship between the seed bank and species
composition of plant communities in two British salt marshe. Journal of Vegetation
Science 4(4):531-536.
Unger, I. A. and Woodell, S. R. J. 1996. Similarity of seed bank to above ground vegetation
in grazed and ungrazed salt marsh communities on the Gower Peninsula, South
Wales. International Journal of Plant Sciences 157(6):746-749.
USDA. 2016. Natural Resources Conservation Service Plant Materials Program
https://www.nrcs.usda.gov/wps/portal/nrcs/main/plantmaterials/pmc/. [Online].
Van Soest, P. J. 1994. Nutritional ecology of the ruminant. Cornell University Press.
Viard-Crétat, F., Baptist, F., Secher-Fromell, H. and Gallet, C. 2012. The allelopathic
effects of Festuca paniculata depend on competition in subalpine grasslands. Plant
Ecology 213(12):1963-1973.
Vibart, R. E., Vogeler, I., Dodd, M. and Koolaard, J. 2016. Simple versus Diverse
Temperate Pastures: Aspects of Soil–Plant–Animal Interrelationships Central to
Nitrogen Leaching Losses. Agronomy journal 108(6):2174-2188.
Walker, B. 1995. Conserving Biological Diversity through Ecosystem Resilience.
Conservation Biology 9(4):747-752.
Walker, B., Kinzig, A. and Langridge, J. 1999. Plant attribute diversity, resilience, and
ecosystem function: The nature and significance of dominant and minor species.
Ecosystems 2(2):95-113.
Wang, P., Stieglitz, T., Zhou, D. W. and Cahill Jr, J. F. 2010. Are competitive effect and
response two sides of the same coin, or fundamentally different? Functional Ecology
24(1):196-207.
113
Wang, Z. and Schellenberg, M. P. 2012. Drought and N addition in a greenhouse
experiment: blue grama and western wheatgrass. Journal of Agricultural Science and
Technology B(2):29-37.
Wardle, D. A. 2001. Experimental demonstration that plant diversity reduces invasibility –
evidence of a biological mechanism or a consequence of sampling effect? Oikos
95(1):161-170.
Warr, S. J., Thompson, K. and Kent, M. 1993. Seed banks as a neglected area of
biogeographic research: a review of literature and sampling techniques. Progress in
Physical Geography 17(3):329-347.
Webster, T. M., Cardina, J. and White, A. D. 2003. Weed seed rain, soil seedbanks, and
seedling recruitment in no-tillage crop rotations. Weed Science 51(4):569-575.
Weigelt, A., Weisser, W. W., Buchmann, N. and Scherer-Lorenzen, M. 2009.
Biodiversity for multifunctional grasslands: equal productivity in high-diversity low-
input and low-diversity high-input systems. Biogeosciences 6:1695-1706.
Whitbread, A. M., Hall, C. A. and Pengelly, B. C. 2009. A novel approach to planting
grass-legume pastures in the mixed farming zone of southern inland Queensland,
Australia. Crop & Pasture Science 60(12):1147-1155.
Wight, J. R. and White, L. M. 1974. Interseeding and pitting on a sandy range site in
eastern Montana. Journal of Range Management 27(3):206-210.
Willms, W. D., Ellert, B. H., Janzen, H. H. and Douwes, H. 2005. Evaluation of Native
and Introduced Grasses for Reclamation and Production. Rangeland Ecology &
Management 58(2):177-183.
Wilson, R. G. and Michiels, A. 2003. Fall herbicide treatments affect carbohydrate content
in roots of Canada thistle (Cirsium arvense) and dandelion (Taraxacum officinale).
Weed Science 51(3):299-304.
Woo, S. L., Harms, V. L., Thomas, A. G., Peschken, D. P., Bowes, G. G., Douglas, D. W.
and McClay, A. S. 1991. The biology of Canadian weeds. 99. Matricaria perforate
Merat (Asteraceae). Canadian Journal of Plant Science 71(4):1101-1119.
114
Yachi, S. and Loreau, M. 1999. Biodiversity and ecosystem productivity in a fluctuating
environment: the insurance hypothesis. Proceedings of the National Academy of
Sciences of the USA 96:1463-1468.
Young, T. P., Chase, J. M. and Huddleston, R. T. 2001. Community succession and
assembly: comparing: contrasting and combining paradigms in the context of
ecological restoration. Ecological Restoration 19(1):5-18.
Zeng, R. S., Mallik, A. U. and Luo, S. M. 2008. Allelopathy in Sustainable Agriculture and
Forestry. Springer.
Zhang, J., Hamill, A. S., Gardiner, I. O. and Weaver, S. E. 1998. Dependence of weed
flora on the active soil seedbank. Weed Research 38(2):143-152.
Zhang, S. and Lamb, E. G. 2011. Plant competitive ability and the transitivity of
competitive hierarchies change with plant age. Plant Ecology 213(1):15-23.
Zorner, P. S., Zimdahl, R. L. and Schweizer, E. E. 1984. Sources of viable seed loss in
buried dormant and non-dormant populations of wild oat (Avena fatua L.) seed in
Colorado. Weed Research 24(2):143-150.

115
CHAPTER 9
Appendix
Appendix 9.1 Example SAS code used for analyzing data in chapter 2. The effect of different
forage species and their mixtures on forage quantity and quality were analyzed as repeated
measures via a mixed model. Treatment, year and harvesting month were fixed effects and
block was a random effect. Since there were unequal periods between harvesting times (two
months period from July to August in each year, and 10 months period from August to next
July harvest), data was analyzed using a spatial power covariance structure. Denominator
degrees of freedom were calculated using BETWITHIN option.
proc mixed;
class plot rep trt year month;
model dry=trt year month trt*year trt*month year*month trt*year*month/DDFM=
BETWITHIN;
random rep;
repeated / subject=plot type=SP(LINL)(space) r rcorr;
run;

116
Appendix 9.2 Forage production (kg/ha) in mixture plots in July and August of 2011-2016. Abbreviation: WWG: Western wheatgrass; BBW:
Bluebunch wheatgrass; SOG: Side oats grama; LBS: Little blue stem; NOB: Nodding brome; PPC: Purple prairie clover; and WPC: White prairie
clover. One standard error around the mean is presented after ± (n = 4).
2011 2012 2013 2014 2015 2016
Mixtures July August July August July August July August July August July August
All Species 3184±912 5621±1559 1623±360 3163±603 1897±304 1919±482 2010±170 2198±321 1893±137 2008±321 2129±361 2939±343
BBW+PPC 2639±589 2338±460 1977±333 2924±236 1592±426 2302±373 2386±453 1949±416 1864±173 2164±184 1927±478 1576±366 BBW+WPC 2514±315 2956±569 1297±115 1786±175 2067±209 1982±431 1489±303 2421±345 1874±198 2365±213 2440±643 1606±774
LBS+BBW 1630±662 1983±441 853±221 3454±527 2473±695 1734±524 1504±272 2934±482 1437±170 2434±296 2940±244 3633±121
LBS+NOB 3385±518 6065±1403 847±175 1329±243 794±332 917±153 1130±557 1222±270 1007±211 1106±48 2798±163 1871±339 LBS+PPC 128±36 582±57 695±190 1785±372 1554±268 1559±465 1417±293 1866±449 1281±236 1423±237 1662±555 3311±113
LBS+WPC 192±23 740±311 654±176 2105±485 2353±111 2556±710 1011±288 2222±601 1082±168 1385±479 1288±444 3716±724
NOB+BBW 3459±394 5696±738 1616±394 2122±304 1678±470 1497±183 1854±218 1719±136 1372±268 1827±254 1137±127 1832±380 NOB+PPC 4477±975 4455±816 1196±214 1577±152 674±205 980±316 689±236 1182±225 387±136 874±258 507±205 1925±126
NOB+WPC 2765±729 4446±899 525±105 959±42 1196±431 1216±518 779±156 446±87 212±93 444±155 875±330 2185±564
PPC+WPC 11±5 80±45 233±102 886±265 713±352 609±204 131±51 490±318 165±79 223±154 204±154 1316±442 SOG+BBW 1705±430 2598±281 1920±193 2189±515 2621±461 2079±264 1579±474 2001±218 1650±275 1745±215 2300±560 2344±387
SOG+LBS 711±123 1869±84 1033±271 1897±340 1315±327 1458±360 1345±137 2042±161 1289±189 1458±208 1231±150 2484±254
SOG+NOB 3583±379 5197±1250 813±109 1453±455 620±308 520±139 928±313 884±236 484±130 857±303 626±210 945±116 SOG+PPC 285±48 890±235 529±255 1662±278 907±76 1339±498 837±258 2059±438 648±100 1274±264 1246±302 2584±592
SOG+WPC 245±79 708±29 432±100 2995±146 914±407 1659±869 414±115 756±162 586±43 803±234 651±178 2652±617
WWG+BBW 4453±463 5594±579 1023±339 3324±399 1714±167 2156±472 2294±207 2831±161 2352±119 2861±222 2442±497 2643±375 WWG+LBS 5649±539 7138±950 1842±497 3323±598 1254±236 1932±219 2208±301 2434±377 2113±180 2512±360 2130±114 2617±307
WWG+NOB 6851±492 7374±789 1849±324 3506±604 1941±188 1928±470 2719±380 2985±226 2248±280 2397±148 2211±289 2677±359
WWG+PPC 7099±1207 5845±837 1739±371 3994±121 2582±256 2067±342 2397±337 2338±269 2081±69 2290±198 1834±550 3889±805 WWG+SOG 4577±762 5378±887 1732±200 3793±485 1973±68 2074±217 1914±342 2470±430 2035±220 2445±66 1880±217 2978±625
WWG+WPC 4588±918 6137±971 1555±403 3493±993 2097±127 2496±298 2565±544 2860±133 2593±153 2871±477 1942±299 3655±592
116

117
Appendix 9.3 Crude protein (N×6.25) in mixture plots in July and August of 2011-2015. Abbreviation: WWG: Western wheatgrass; BBW:
Bluebunch wheatgrass; SOG: Side oats grama; LBS: Little blue stem; NOB: Nodding brome; PPC: Purple prairie clover; and WPC: White prairie
clover. One standard error around the mean is presented after ± (n = 4).
2011 2012 2013 2014 2015 2016
Mixtures July August July August July August July August July August July August
All Species 8.19±0.58 5.40±0.51 9.40±0.52 5.98±0.35 7.06±0.48 5.15±0.21 6.70±0.56 4.16±0.31 5.66±0.14 4.80±0.14 6.94±1.45 6.38±1.02
BBW+PPC 6.99±0.24 6.88±0.72 7.32±0.32 6.55±0.51 6.36±0.73 5.26±0.39 6.66±0.32 4.12±0.30 6.40±0.22 6.55±0.83 6.64±1.01 5.22±0.49
BBW+WPC 8.45±0.45 6.87±0.83 7.49±0.29 6.52±0.61 7.28±0.54 4.88±0.61 6.41±0.17 4.65±0.22 6.13±0.28 4.91±0.12 6.66±1.70 6.54±0.98 BBW+WWG 8.02±1.14 6.29±1.35 9.21±0.36 6.27±0.78 6.71±0.53 5.55±0.48 6.11±0.19 4.47±0.14 5.47±0.45 4.69±0.55 6.23±0.58 4.19±0.25
LBS+BBW 8.16±1.05 6.13±0.33 7.52±0.61 3.31±0.36 5.95±0.24 3.33±0.25 5.45±0.49 2.43±0.21 5.70±0.43 4.03±0.30 4.58±0.50 3.19±0.09
LBS+NOB 7.70±0.39 4.20±0.22 7.29±0.33 3.89±0.39 6.20±0.33 4.86±0.41 5.80±0.85 2.88±0.26 4.91±0.31 5.19±0.77 5.23±0.09 3.39±0.22 LBS+PPC 10.98±1.07 5.91±0.73 8.53±0.19 4.70±0.84 6.42±0.06 4.48±0.24 5.95±0.41 3.98±0.35 5.54±0.41 5.84±1.30 6.42±0.02 4.90±0.75
LBS+WPC 9.70±0.25 6.66±0.86 8.38±0.38 3.46±0.31 7.44±0.93 5.98±0.80 4.92±0.17 3.31±0.89 6.25±1.20 6.06±1.76 8.03±1.88 4.11±1.34
LBS+WWG 8.93±0.82 5.41±1.23 9.37±0.75 5.57±0.22 6.16±0.33 4.89±0.17 6.45±0.43 4.05±0.25 5.38±0.22 4.52±0.04 5.61±0.26 3.83±0.18 NOB+BBW 6.85±0.34 4.28±0.38 7.25±0.53 4.71±0.31 5.40±0.30 4.48±0.29 6.14±0.49 4.08±0.29 6.33±0.19 5.32±0.36 4.45±0.23 3.77±0.16
NOB+PPC 6.94±0.33 4.12±0.82 7.04±0.17 4.26±0.69 8.73±1.91 7.02±0.71 7.84±1.33 6.31±0.41 7.10±0.67 7.65±0.50 10.23±2.06 9.06±1.14
NOB+WPC 7.91±0.20 4.69±0.60 8.21±0.43 5.60±0.94 7.70±0.91 8.63±0.76 8.40±0.55 8.67±1.03 8.45±1.05 7.71±0.81 9.56±1.55 11.45±1.74 NOB+WWG 8.48±0.52 5.02±1.06 10.57±0.95 5.64±0.31 7.34±0.62 5.59±0.23 7.40±0.21 5.44±0.69 5.66±0.31 5.82±0.74 5.39±0.04 4.17±0.19
PPC+WPC 14.75±0.75 11.71±0.38 15.50±0.86 9.27±1.25 13.78±1.80 10.93±0.30 11.34±0.56 9.79±0.16 11.04±0.52 9.10±0.35 14.13±1.43 11.33±0.67
SOG+BBW 8.53±0.51 7.06±0.66 8.20±0.96 4.73±0.48 6.08±0.62 4.09±0.14 6.41±0.50 3.43±0.15 6.31±0.34 4.66±0.14 4.52±0.40 3.91±0.25 SOG+LBS 9.09±0.63 3.98±0.16 6.84±0.30 3.08±0.17 5.48±0.46 3.31±0.15 4.29±0.13 2.56±0.06 4.55±0.14 3.58±0.37 5.38±0.18 3.19±0.22
SOG+NOB 6.95±0.18 4.70±0.50 6.47±0.41 3.80±0.56 6.15±0.17 4.91±0.14 5.94±0.67 3.04±0.10 5.62±0.12 5.60±0.63 6.31±0.59 5.05±0.51
SOG+PPC 9.67±0.58 4.39±0.27 11.37±0.36 4.35±0.69 8.35±0.68 6.19±0.88 7.07±0.77 6.35±1.18 7.99±0.81 6.10±0.25 9.86±1.22 8.42±0.20 SOG+WPC 8.74±0.15 6.15±0.33 9.81±0.66 5.21±0.44 8.41±1.19 5.97±0.58 7.23±0.66 5.02±1.05 6.76±0.73 5.38±0.21 8.52±1.35 6.44±0.97
SOG+WWG 8.06±0.81 5.20±0.50 9.63±0.12 6.03±0.66 6.82±0.30 5.16±0.35 6.92±0.43 4.56±0.63 5.62±0.23 4.76±0.27 5.59±0.27 4.22±0.13
WWG+PPC 9.32±0.86 5.56±0.79 11.95±1.42 6.36±0.09 8.13±0.59 5.49±0.38 8.49±1.01 4.78±0.69 6.07±0.50 5.51±0.36 6.86±0.39 6.13±0.68 WWG+WPC 8.89±0.69 5.66±0.77 10.20±0.38 6.05±0.25 6.89±0.47 6.13±0.88 6.94±0.46 5.19±1.01 5.52±0.20 5.20±0.39 5.73±0.24 5.31±0.66
117

118
Appendix 9.4 F statistics and P values indicating statistical significance for the treatment,
year, month and their interactions on production, crude protein, Acid detergent fiber (ADF),
Neutral detergent fiber (NDF) and Phosphorus of seven forage species in Brandon MB.
Plots in Swift Current and Brandon were first seeded at the same time (May 2014) but
the Brandon plots were heavily infested by perennial weeds and thus were reseeded in 2016.
In Brandon, monocultures of LBS were added based on the results of the allelopathy
experiments (Chapter 6) and forage yield was measured in the August 2016 (seeding year).
Forage production significantly differed between treatments (Appendix 9.5).
Monoculture of SOG performed better than other monocultures and mixtures in the seeding
year. Binary mixtures containing SOG produced higher forage yield, and among complex
mixtures, mixture E and C provided greater dry matter in the establishment year of 2016.
Crude protein was significantly different between treatments and its concentrations
ranged from 11-18% (Appendix 9.7). Binary mixtures of WWG+legumes and mixture D
(contained 19% WPC) contained the lowest ADF and NDF concentrations (Appendix 9.8).
Thus, adding legumes to mixtures may reduce the fiber concentration of the forage mixtures.
F statistic and P value
Fixed Effects
Forage
Production
Crude
Protein
ADF
NDF
P
Treatment F15,45=16.39
P < 0.0001
F15,45=9.68
P < 0.0001
F15,45=4.45
P < 0.0001
F15,45=18.09
P < 0.0001
F15,45=2.31
P = 0.0153

119
Appendix 9.5 Forage production (kg/ha) in monoculture and mixture plots in August 2016 in
Brandon MB. The species composition of Mixture A-E is provided in Table 4.2. Abbreviation:
WWG: Western wheatgrass; BBW: Bluebunch wheatgrass; SOG: Side oats grama; LBS: Little
blue stem; NOB: Nodding brome; PPC: Purple prairie clover; and WPC: White prairie clover.
Error bars represent one standard error around the mean; n = 4. Bars with the same letter are
not significantly different (P ≤ 0.05) according to protected Fisher’s LSD test.
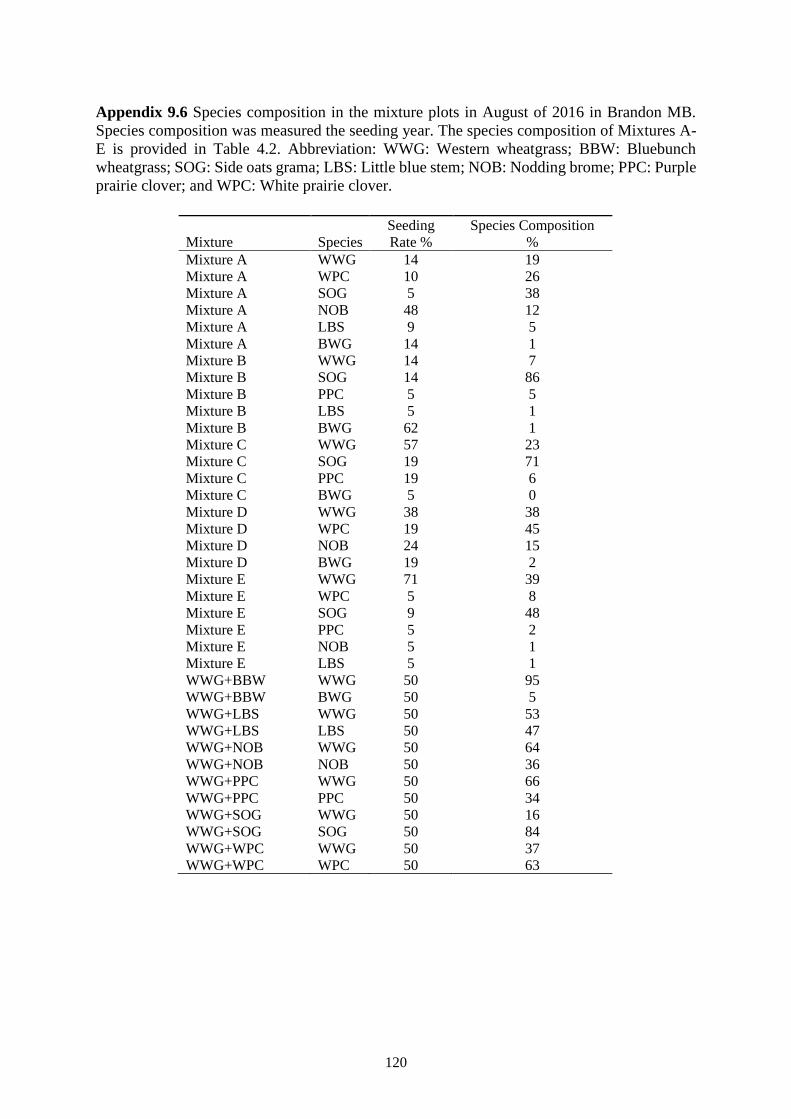
120
Appendix 9.6 Species composition in the mixture plots in August of 2016 in Brandon MB.
Species composition was measured the seeding year. The species composition of Mixtures A-
E is provided in Table 4.2. Abbreviation: WWG: Western wheatgrass; BBW: Bluebunch
wheatgrass; SOG: Side oats grama; LBS: Little blue stem; NOB: Nodding brome; PPC: Purple
prairie clover; and WPC: White prairie clover.
Mixture Species Seeding Rate %
Species Composition
% Mixture A WWG 14 19 Mixture A WPC 10 26 Mixture A SOG 5 38 Mixture A NOB 48 12 Mixture A LBS 9 5 Mixture A BWG 14 1 Mixture B WWG 14 7 Mixture B SOG 14 86 Mixture B PPC 5 5 Mixture B LBS 5 1 Mixture B BWG 62 1 Mixture C WWG 57 23 Mixture C SOG 19 71 Mixture C PPC 19 6 Mixture C BWG 5 0 Mixture D WWG 38 38 Mixture D WPC 19 45 Mixture D NOB 24 15 Mixture D BWG 19 2 Mixture E WWG 71 39 Mixture E WPC 5 8 Mixture E SOG 9 48 Mixture E PPC 5 2 Mixture E NOB 5 1 Mixture E LBS 5 1 WWG+BBW WWG 50 95 WWG+BBW BWG 50 5 WWG+LBS WWG 50 53 WWG+LBS LBS 50 47 WWG+NOB WWG 50 64 WWG+NOB NOB 50 36 WWG+PPC WWG 50 66 WWG+PPC PPC 50 34 WWG+SOG WWG 50 16 WWG+SOG SOG 50 84 WWG+WPC WWG 50 37 WWG+WPC WPC 50 63
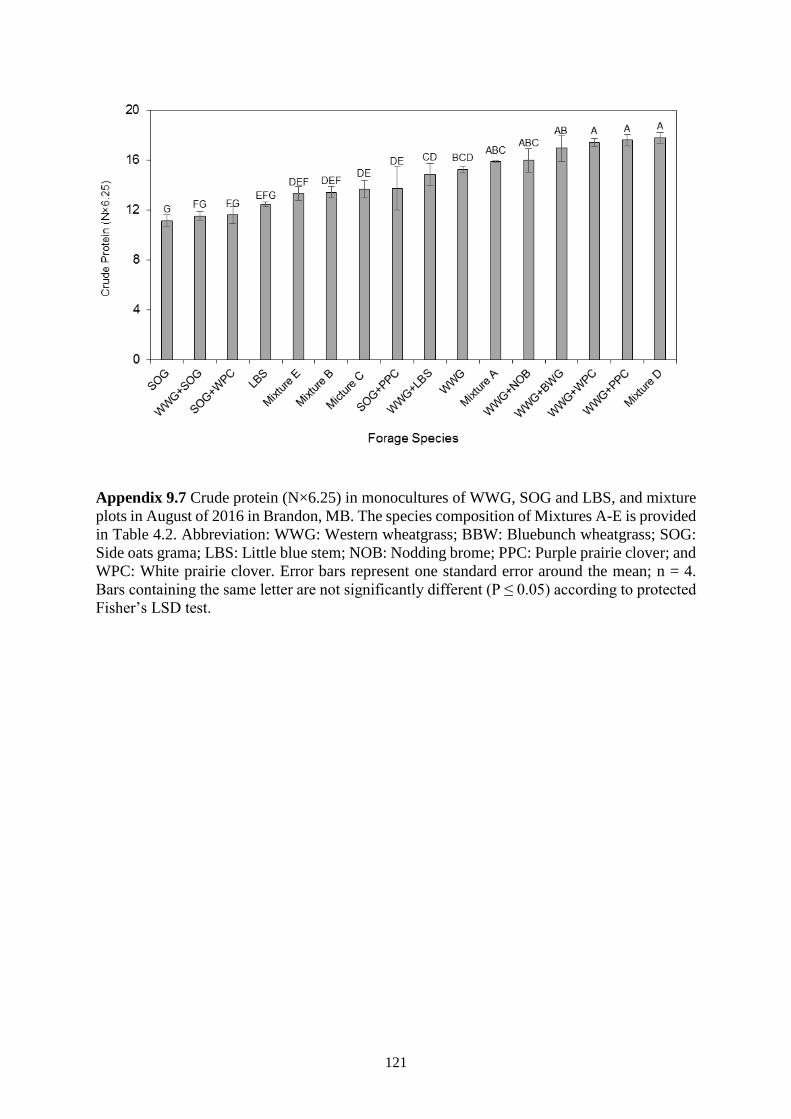
121
Appendix 9.7 Crude protein (N×6.25) in monocultures of WWG, SOG and LBS, and mixture
plots in August of 2016 in Brandon, MB. The species composition of Mixtures A-E is provided
in Table 4.2. Abbreviation: WWG: Western wheatgrass; BBW: Bluebunch wheatgrass; SOG:
Side oats grama; LBS: Little blue stem; NOB: Nodding brome; PPC: Purple prairie clover; and
WPC: White prairie clover. Error bars represent one standard error around the mean; n = 4.
Bars containing the same letter are not significantly different (P ≤ 0.05) according to protected
Fisher’s LSD test.
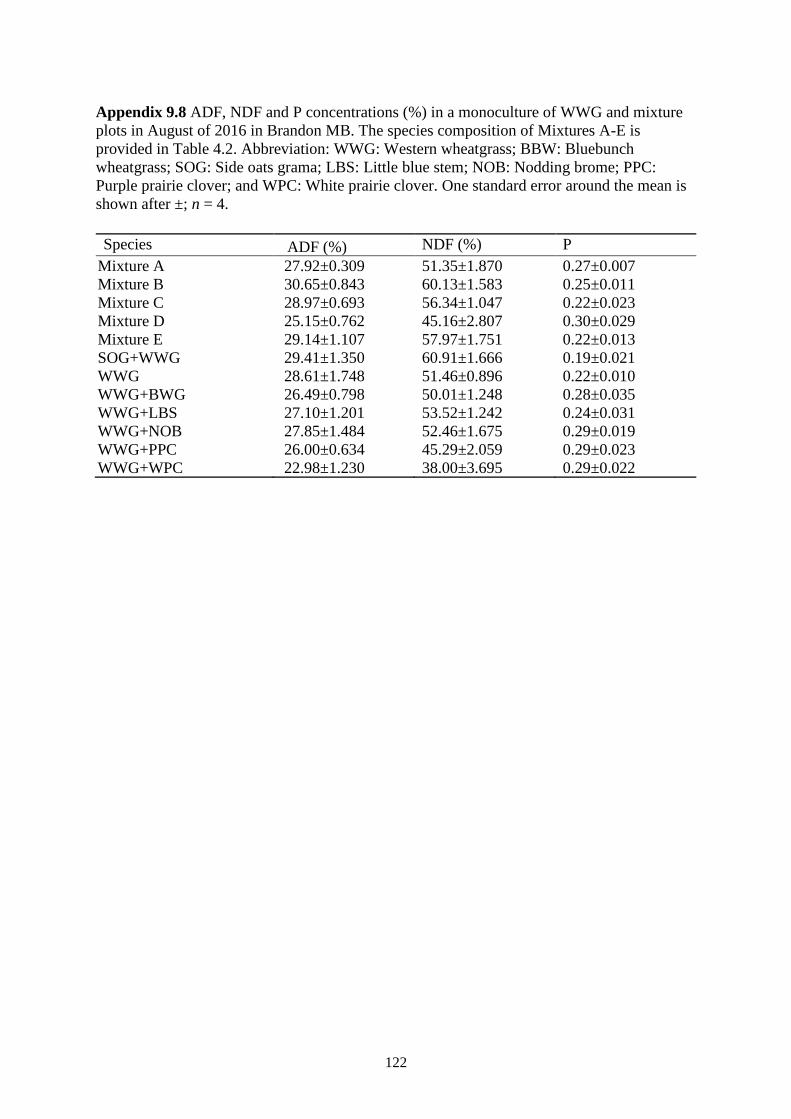
122
Appendix 9.8 ADF, NDF and P concentrations (%) in a monoculture of WWG and mixture
plots in August of 2016 in Brandon MB. The species composition of Mixtures A-E is
provided in Table 4.2. Abbreviation: WWG: Western wheatgrass; BBW: Bluebunch
wheatgrass; SOG: Side oats grama; LBS: Little blue stem; NOB: Nodding brome; PPC:
Purple prairie clover; and WPC: White prairie clover. One standard error around the mean is
shown after ±; n = 4.
Species ADF (%) NDF (%) P
Mixture A 27.92±0.309 51.35±1.870 0.27±0.007
Mixture B 30.65±0.843 60.13±1.583 0.25±0.011
Mixture C 28.97±0.693 56.34±1.047 0.22±0.023
Mixture D 25.15±0.762 45.16±2.807 0.30±0.029
Mixture E 29.14±1.107 57.97±1.751 0.22±0.013
SOG+WWG 29.41±1.350 60.91±1.666 0.19±0.021
WWG 28.61±1.748 51.46±0.896 0.22±0.010
WWG+BWG 26.49±0.798 50.01±1.248 0.28±0.035
WWG+LBS 27.10±1.201 53.52±1.242 0.24±0.031
WWG+NOB 27.85±1.484 52.46±1.675 0.29±0.019
WWG+PPC 26.00±0.634 45.29±2.059 0.29±0.023
WWG+WPC 22.98±1.230 38.00±3.695 0.29±0.022
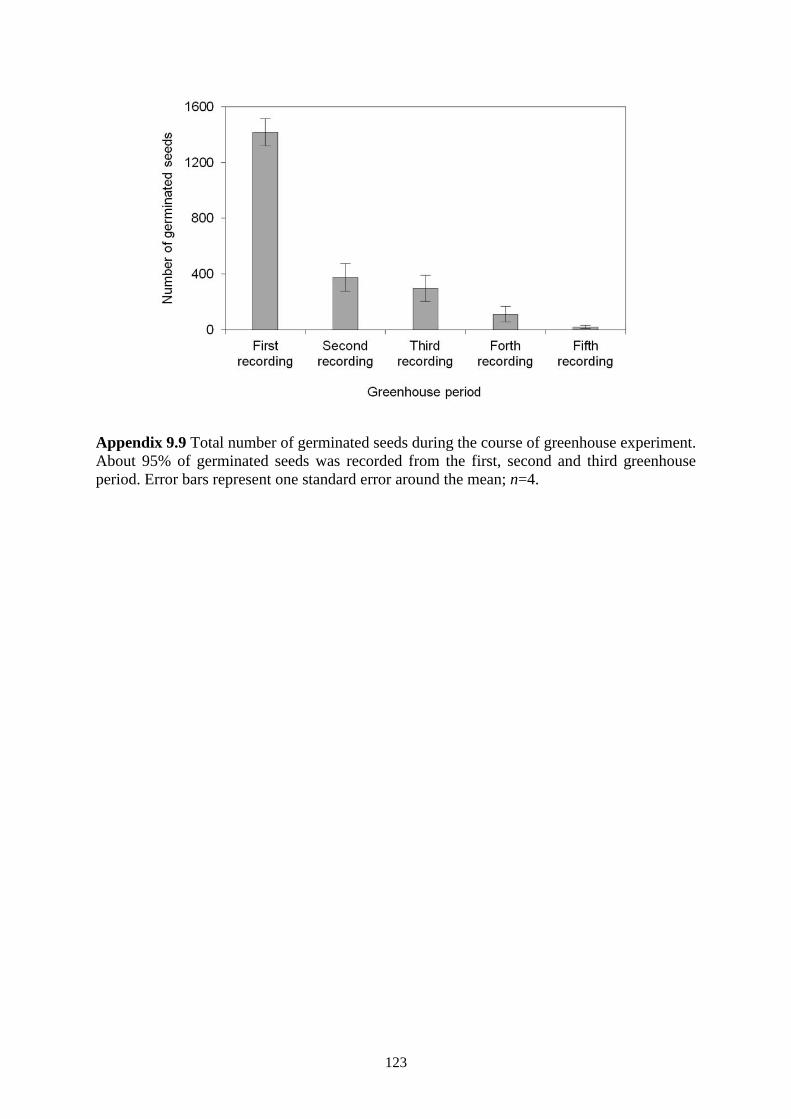
123
Appendix 9.9 Total number of germinated seeds during the course of greenhouse experiment.
About 95% of germinated seeds was recorded from the first, second and third greenhouse
period. Error bars represent one standard error around the mean; n=4.


