For Venture Academy Family of Schools - SJCOE Academy- SARC-1516.pdfintend to meet annual...
36
Page 1 of 36 For Venture Academy Family of Schools Address: 2829 Transworld Dr., Stockton, CA 95206-3950 Phone: 209-468-5940 Principal: Kathleen Focacci, Director Grade Span: K-12 By February 1 of each year, every school in California is required by state law to publish a School Accountability Report Card (SARC). The SARC contains information about the condition and performance of each California public school. Under the Local Control Funding Formula (LCFF) all local educational agencies (LEAs) are required to prepare a Local Control and Accountability Plan (LCAP), which describes how they intend to meet annual school-specific goals for all pupils, with specific activities to address state and local priorities. Additionally, data reported in an LCAP is to be consistent with data reported in the SARC. ➢ For more information about SARC requirements, see the California Department of Education (CDE) SARC Web page at http://www.cde.ca.gov/ta/ac/sa/. ➢ For more information about the LCFF or LCAP, see the CDE LCFF Web page at http://www.cde.ca.gov/fg/aa/lc/. ➢ For additional information about the school, parents/guardians and community members should contact the school principal or the district office. DataQuest DataQuest is an online data tool located on the CDE DataQuest Web page at http://dq.cde.ca.gov/dataquest/ that contains additional information about this school and comparisons of the school to the district and the county. Specifically, DataQuest is a dynamic system that provides reports for accountability (e.g., test data, enrollment, high school graduates, dropouts, course enrollments, staffing, and data regarding English learners). Internet Access Internet access is available at public libraries and other locations that are publicly accessible (e.g., the California State Library). Access to the Internet at libraries and public locations is generally provided on a first- come, first-served basis. Other use restrictions may include the hours of operation, the length of time that a workstation may be used (depending on availability), the types of software programs available on a workstation, and the ability to print documents. California Department of Education School Accountability Report Card Reported Using Data from the 2015–16 School Year Published During 2016-17
Transcript of For Venture Academy Family of Schools - SJCOE Academy- SARC-1516.pdfintend to meet annual...
Page 1 of 36
For Venture Academy Family of Schools Address: 2829 Transworld Dr., Stockton, CA 95206-3950 Phone: 209-468-5940 Principal: Kathleen Focacci, Director Grade Span: K-12 By February 1 of each year, every school in California is required by state law to publish a School Accountability Report Card (SARC). The SARC contains information about the condition and performance of each California public school. Under the Local Control Funding Formula (LCFF) all local educational agencies (LEAs) are required to prepare a Local Control and Accountability Plan (LCAP), which describes how they intend to meet annual school-specific goals for all pupils, with specific activities to address state and local priorities. Additionally, data reported in an LCAP is to be consistent with data reported in the SARC. ➢ For more information about SARC requirements, see the California Department of Education (CDE)
SARC Web page at http://www.cde.ca.gov/ta/ac/sa/. ➢ For more information about the LCFF or LCAP, see the CDE LCFF Web page at
http://www.cde.ca.gov/fg/aa/lc/. ➢ For additional information about the school, parents/guardians and community members should contact
the school principal or the district office. DataQuest DataQuest is an online data tool located on the CDE DataQuest Web page at http://dq.cde.ca.gov/dataquest/ that contains additional information about this school and comparisons of the school to the district and the county. Specifically, DataQuest is a dynamic system that provides reports for accountability (e.g., test data, enrollment, high school graduates, dropouts, course enrollments, staffing, and data regarding English learners). Internet Access Internet access is available at public libraries and other locations that are publicly accessible (e.g., the California State Library). Access to the Internet at libraries and public locations is generally provided on a first-come, first-served basis. Other use restrictions may include the hours of operation, the length of time that a workstation may be used (depending on availability), the types of software programs available on a workstation, and the ability to print documents.
California Department of Education
School Accountability Report Card Reported Using Data from the 2015–16 School Year
Published During 2016-17

Page 2 of 36
Kathleen Focacci, Director Principal, Venture Academy
About Our School
“Millions saw the apple fall, but Newton asked why?” -Bernard Baruch-
As you begin your review of the information and data presented in this report, please keep this quote in mind. It speaks to how Venture Academy Family of Schools' (VAFS) staff believes students learn best. We believe that curiosity and thinking without boundaries, as demonstrated by Newton, have been the catalyst for major scientific discoveries throughout history and also the basis for powerful educational experiences for students from all walks of life. Learning occurs when curiosity prompts us to ask questions and seek answers.
While preparing our students to take their places as the scientists, performers, engineers, builders, artists, etc. who will shape the future of our world it is our mission to keep alive and nurture the natural curiosity they carry with them. Students who choose to enroll in VAFS find themselves being challenged to imagine possibilities for the future, to solve real world problems, to be curious and ask questions about the world, to learn to play while they play to learn. The school’s nontraditional, individualized approach to teaching and learning includes 12 academies, each with a specific focus. Students choose the learning environment that fits their interests and keeps them motivated. Once you witness our students’ growth as they gain confidence, understanding and knowledge you get a strong sense that education is really happening here. Venture Academy Family of Schools' staff is creative, passionate and committed to providing our students in grades TK though twelve a robust, rigorous educational experience that will empower them to take their places in the world and let their voices be heard. It is through education like this that young minds begin the process of developing important ideas that will shape and define their world and ours. I hope you enjoy this report and understand that it is just one part of our story.
Kathleen Focacci Division Director Venture Academy Family of Schools
Keep up to date on events and information about Venture Academy Family of School by visiting our website at www.ventureacademyca.org.
Contact Venture Academy 2829 Transworld Dr. Stockton, CA 95206-3950 Phone: (209)468-5940 Email: [email protected]
Page 3 of 36
About This School District Contact Information (School Year 2016–17) District Name San Joaquin County Office of Education Phone Number (209) 468-4800 Superintendent James Mousalimas E-mail Address [email protected] Web Site http://www.sjcoe.org School Contact Information (School Year 2016–17) School Name Venture Academy Street 2829 Transworld Drive City, State, Zip Stockton, CA 95206-3950 Phone Number (209) 468-5940 Principal Kathleen Focacci, Director E-mail Address [email protected] Web Site www.ventureacademyca.org/ County-District-School (CDS) Code 39 10397 3930476 School Description and Mission Statement (School Year 2016–17)
Chartered by the San Joaquin County Board of Education, Venture Academy Family of Schools is one of the largest charter schools in the area. Serving TK-12 students, we offer WASC accredited programs featuring flexible schedule and sites that develop students' academic progress and further their imagination.
• Small Class Sizes - K-12 • Innovative non-traditional approach to education • A public school of choice • Tuition free • Western Association of Schools and Colleges (WASC) Accredited
Our modified daily attendance academies are staffed by credentialed teachers with a targeted 25 to 1 (or less) student to teacher ratio. Students attend classes Monday-Thursday. Fridays allow for opportunities for home school assignments, special projects or required onsite activities and instruction. Enrollment is offered to students within San Joaquin County and any contiguous counties including: Stanislaus, Sacramento, Contra Costa, Calaveras, and Alameda counties.
MISSION
The mission of Venture Academy Family of Schools is to awaken the imagination, passion, dreams and curiosity of K-12 students by providing rich, standards-based educational opportunities for those who seek innovative, non-traditional approaches to learning. Our students will become literate. lifelong learners empowered to embrace challenge, think critically, play passionately, live responsibly and imagine possibilities.
SCHOOLWIDE LEARNING OUTCOMES
Schoolwide Learning Outcomes (SLO’s) define what each student should know, understand, and be able to do upon leaving Venture Academy. They are the framework around which the academic program is built and reflect the mission, vision and beliefs of the school. The six SLO’s, developed by Venture Academy staff are listed below. Throughout their education at Venture Academy students are challenged to demonstrate the following:

Page 4 of 36
Venture Academy students will embrace challenge. Students may demonstrate this by (but are not limited to):
• Identifying and reflecting on challenges • Identifying tools and talents • Developing and implementing a plan of action
Venture Academy students will think critically. Students may demonstrate this by (but are not limited to):
• Evaluating and applying knowledge/skills in a variety of situations and contexts • Acquiring knowledge necessary to form an educated opinion
Venture Academy students will live responsibly. Students may demonstrate this by (but are not limited to):
• Exhibiting and making healthy lifestyle choices • Identifying community needs • Serving the community
Venture Academy students will play passionately. Students may demonstrate this by (but are not limited to):
• Playing to learn • Learning to play • Balancing lives (work and play) • Exploring the connection between passion and work
Venture Academy students will learn infinitely. Students may demonstrate this by (but are not limited to):
• Realizing the world is a classroom • Demonstrating continuous progress toward mastery of a core body of knowledge Initiating and
facilitating their own learning
Venture Academy students will imagine possibilities.
BELIEF STATEMENT
We believe that...
• Each individual can learn
• Education empowers individuals
• Each individual has unique strengths and intelligences
• Each individual is important and can make a difference in the world
• Individuals joining together for a common purpose produce powerful results Individuals learn best in a
nurturing non-threatening environment
• Imagination, passion, dreams, and curiosity are gateways to learning
• Play is an essential part of learning
• Learning involves embracing challenge and being willing to risk
Page 5 of 36
• Students’ needs direct their educational paths
• Education is a team effort involving students, families, teachers and community
• Real world connections enhance learning
• Learning is lifelong
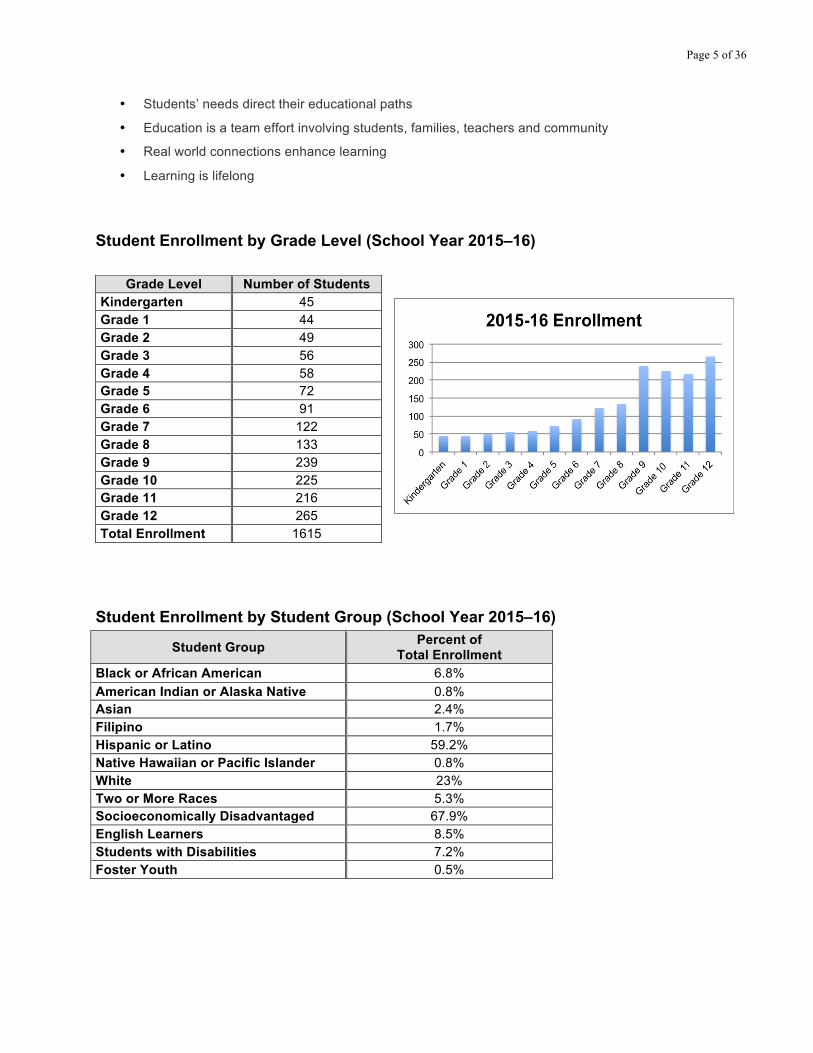
Student Enrollment by Grade Level (School Year 2015–16)
Student Enrollment by Student Group (School Year 2015–16)
Student Group Percent of Total Enrollment
Black or African American 6.8% American Indian or Alaska Native 0.8% Asian 2.4% Filipino 1.7% Hispanic or Latino 59.2% Native Hawaiian or Pacific Islander 0.8% White 23% Two or More Races 5.3% Socioeconomically Disadvantaged 67.9% English Learners 8.5% Students with Disabilities 7.2% Foster Youth 0.5%
Grade Level Number of Students Kindergarten 45 Grade 1 44 Grade 2 49 Grade 3 56 Grade 4 58 Grade 5 72 Grade 6 91 Grade 7 122 Grade 8 133 Grade 9 239 Grade 10 225 Grade 11 216 Grade 12 265 Total Enrollment 1615
Page 6 of 36
A. Conditions of Learning State Priority: Basic The SARC provides the following information relevant to the State priority: Basic (Priority 1):
• Degree to which teachers are appropriately assigned and fully credentialed in the subject area and for the pupils they are teaching;
• Pupils have access to standards-aligned instructional materials; and
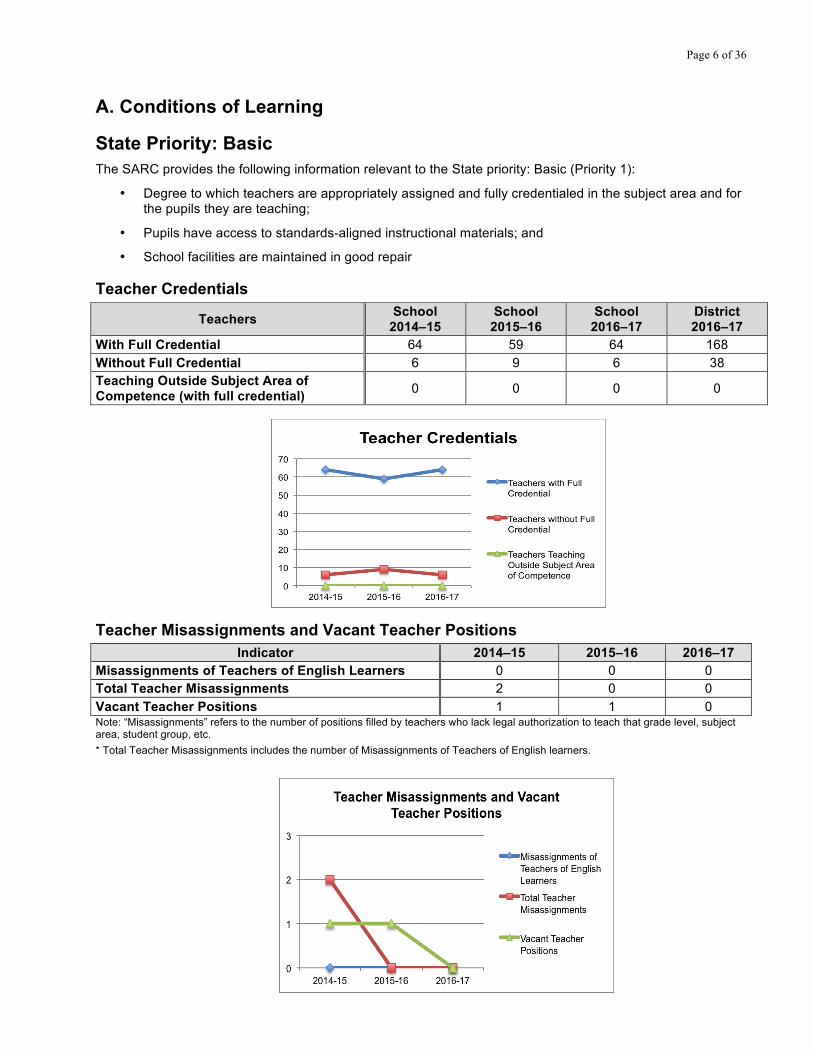
• School facilities are maintained in good repair Teacher Credentials
Teachers School 2014–15
School 2015–16
School 2016–17
District 2016–17
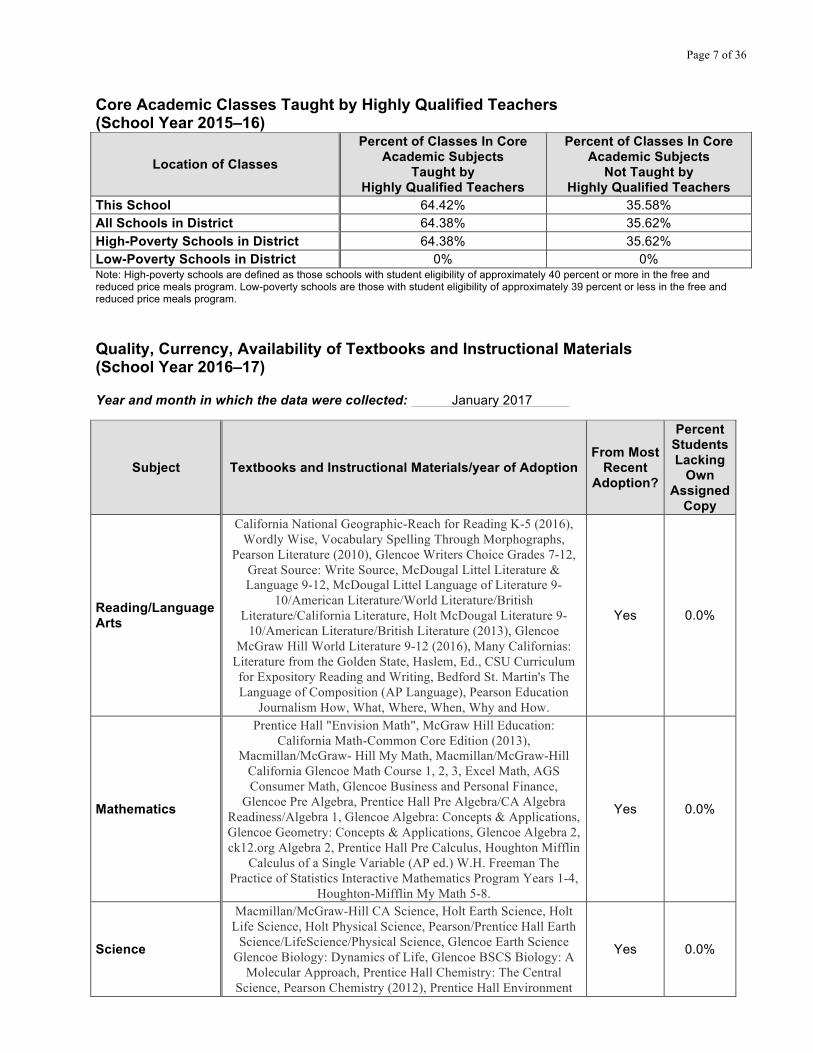
With Full Credential 64 59 64 168 Without Full Credential 6 9 6 38 Teaching Outside Subject Area of Competence (with full credential) 0 0 0 0 Teacher Misassignments and Vacant Teacher Positions
Indicator 2014–15 2015–16 2016–17 Misassignments of Teachers of English Learners 0 0 0 Total Teacher Misassignments 2 0 0 Vacant Teacher Positions 1 1 0 Note: “Misassignments” refers to the number of positions filled by teachers who lack legal authorization to teach that grade level, subject area, student group, etc. * Total Teacher Misassignments includes the number of Misassignments of Teachers of English learners.
Page 7 of 36
Core Academic Classes Taught by Highly Qualified Teachers (School Year 2015–16)
Location of Classes
Percent of Classes In Core Academic Subjects
Taught by Highly Qualified Teachers
Percent of Classes In Core Academic Subjects
Not Taught by Highly Qualified Teachers
This School 64.42% 35.58% All Schools in District 64.38% 35.62% High-Poverty Schools in District 64.38% 35.62% Low-Poverty Schools in District 0% 0% Note: High-poverty schools are defined as those schools with student eligibility of approximately 40 percent or more in the free and reduced price meals program. Low-poverty schools are those with student eligibility of approximately 39 percent or less in the free and reduced price meals program.
Quality, Currency, Availability of Textbooks and Instructional Materials (School Year 2016–17) Year and month in which the data were collected: January 2017 .
Subject Textbooks and Instructional Materials/year of Adoption From Most
Recent Adoption?
Percent Students Lacking
Own Assigned
Copy
Reading/Language Arts
California National Geographic-Reach for Reading K-5 (2016), Wordly Wise, Vocabulary Spelling Through Morphographs,
Pearson Literature (2010), Glencoe Writers Choice Grades 7-12, Great Source: Write Source, McDougal Littel Literature & Language 9-12, McDougal Littel Language of Literature 9-
10/American Literature/World Literature/British Literature/California Literature, Holt McDougal Literature 9-
10/American Literature/British Literature (2013), Glencoe McGraw Hill World Literature 9-12 (2016), Many Californias:
Literature from the Golden State, Haslem, Ed., CSU Curriculum for Expository Reading and Writing, Bedford St. Martin's The Language of Composition (AP Language), Pearson Education
Journalism How, What, Where, When, Why and How.
Yes 0.0%
Mathematics
Prentice Hall "Envision Math", McGraw Hill Education: California Math-Common Core Edition (2013),
Macmillan/McGraw- Hill My Math, Macmillan/McGraw-Hill California Glencoe Math Course 1, 2, 3, Excel Math, AGS Consumer Math, Glencoe Business and Personal Finance,
Glencoe Pre Algebra, Prentice Hall Pre Algebra/CA Algebra Readiness/Algebra 1, Glencoe Algebra: Concepts & Applications, Glencoe Geometry: Concepts & Applications, Glencoe Algebra 2, ck12.org Algebra 2, Prentice Hall Pre Calculus, Houghton Mifflin
Calculus of a Single Variable (AP ed.) W.H. Freeman The Practice of Statistics Interactive Mathematics Program Years 1-4,
Houghton-Mifflin My Math 5-8.
Yes 0.0%
Science
Macmillan/McGraw-Hill CA Science, Holt Earth Science, Holt Life Science, Holt Physical Science, Pearson/Prentice Hall Earth
Science/LifeScience/Physical Science, Glencoe Earth Science Glencoe Biology: Dynamics of Life, Glencoe BSCS Biology: A
Molecular Approach, Prentice Hall Chemistry: The Central Science, Pearson Chemistry (2012), Prentice Hall Environment
Yes 0.0%
Page 8 of 36
Science, Mader Human Biology, ck12.org Biology, Sports Medicine Essentials Current Publishing "Life On An Ocean Planet", Addison Wesley Conceptual Physics, REA Human
Geography, McDougal Holt Understanding Human Anatomy and Physiology, Saunder Language of Medicine, McGraw Hill
Ecology Concepts and Applications
History-Social Science
Holt: United States History-Independence to 1914, Holt: Medieval to Early Modern Times, Teachers Curriculum Institute: History
Alive! California Middle Schools Program (2009), Macmillan/McGraw-Hill California Vistas, Glencoe World
History: The Human Experience, Glencoe World History: Modern Times, Cengage Learning Societies, Networks and Transitions Volume 1 &2/AP World History, Houghton Mifflin American
Pageant /AP US History, Glencoe American Vision/US History (2007), Glencoe US Government: Democracy in Action, Center
for Civic Education for Government- We the People: The Citizen and the Constitution, Glencoe Economics: Principles & Practices,
Glencoe World Geography (2013), Glencoe Understanding Psychology (2013), Myers Psychology for AP, Glencoe Sociology and You (2013), Davies Sports in American Life (2010), Glencoe
The Developing Child (2014), Glencoe Street Law, Scribner Environmental Law
Yes 0.0%
Foreign Language Glencoe Asi Se Dice Spanish 1/Spanish 2/Spanish 3 Yes 0.0% Health Glencoe Health Yes 0.0% Visual and Performing Arts Glencoe Art in Focus, Glencoe ArtTalk Yes 0.0%
Science Laboratory Equipment (grades 9-12)
Economy Air Track w/ air source, Go Motion Sensor, Air Powered Projectile, Classroom Set Digital Strobe, Complete Push Pull Spring Scale Set, Constant Velocity Cars, Vertical Acceleration Demonstrator, Velocity Radar Gun, Rotational Inertia Demonstrator, Deluxe Bicycle Wheel Gyroscope, Dynamics Cart Liquid Accelerometer, G Ball, Advanced Gas Laws demo with Temp Fire Syringe, Elasticity of Gasses Demo, Bell Jar & Ringer, Electric Vacuum Pump, Reversible Thermoelectric Demonstrator, Energy Discovery Pack, Ice Melting Blocks, UV Meter, Ball and Ring Colliding Steel Spheres, Van de Graaff Generator, Discharge Electrode, Wimhurst Machine Friction Rod Kit, Fun Fly Stick Electroscope, Flask Form, Static Charge Indicator, Dissectible Leyden Jar, Genecon Experiment Pack, Visual Electricity Demonstrator, Digital Multimeter, Electricity & Magnetism Bulb Demo, Magnetic Field Observation Window Kit, Magnetic Field Observation Box, Solenoid Air Core Magnetic Field Model, Giant Neodymium Magnet, Cow Magnet, Steel Horseshoe Magnet with Keeper, Alnico Bar Magnets Pair, Ripple Tanks, Standing Wave Kit, Sympathetic Tuning Fork Set, Helical Spring, Giant Slinky, Sound Pipes, Sound and Waves Interference Kit, Laser Ray, Box and Lenses Laser, Viewing Tank, Green Laser, Laser Tripod, Spectrum Analysis Set, Quantitative Spectroscopes, Handheld Color Mixing Demo, Violet Laser, Mega Mirrors, Reflect-View Holographic Diffraction Grating, Lens Set, RSpec-Explorer, Density Blocks, Digital Timer, TI Solar Calculator, USB Digital Microscope, Periodic Chart of the Elements, Solar Spectrum Chart, Pocket Oscilloscope, 1 lb Food Scale, 130x Illuminated Microscope, 1x8x3/16" Vinyl Tubing, 2" Magnifiers, 3 fish tanks large, 3 fish tanks medium, AccuLabs digital scales, AccuLab Digital Scale, Air Pollution Demonstration Kit, Air Quality Lab,
Yes 0.0%
Page 9 of 36
Ammonia Water Quality Test Kit, Animal & Plant Slides, Animal Cell Division Meiosis Display, Animal Miosis Mold, Autoclave Gloves, Battery Science Kit, Better Black Box kit, Binoculars, Bunsen burner, Burette clamp, Cabbages and Chemistry kit, Cell Model, Cell respiration kit, Cell spreaders, Chem plates, Chemical and Mechanical Weathering Lab Kit, Chemical Probe, China Markers, Coli Test Kit, Colony Transformation kit, Colorimeter, Conductivity Electrode, Cork Test Tube Stoppers, Cover Slips, Curved Black Strobe Light, Diffusion and osmosis kit, Digital Scale, Discovery Scope Kit, Disection Sets, Disolve Oxygen Electrode, Dissolve Oxygen kit, Dissolved oxygen , DNA Extraction Kit, DNA Fingerprinting Kits, DNA Puzzle, Drop Counter, Dual Scale Thermometer, Earth Science Rock and Mineral Collection, Earthquake plate tectonic kit, Electro Storm Ball, Environmental Forensic Kit, Eukaryote prepares slides 20, Evaporation Trays, Eye Droppers, Eye Wash Bath, Fish Blastodisc prepared slide 8, Forensic Entymology kit, Forensic Lab, Forest Foundation Tree ID Kit, Friction lighter, Frog Hatchery Kit, Fun with chromosomes kit, Genotype cards, Glass Beakers, Glass Flasks, Glass Graduated Cylinders, Glass Microscope Slides, Glucose Test Kit, Go Link Probe Censor, Go Temp Censor, GPS Position Probe, Grow Lamp, Growing Dishes, Heart Rate Censor, Heart Sensor, Hot Hands, Hovercraft, Human Body Skeleton Kit, Human head and Torso model, Hydrogen Rocket Launcher, Incubator, Intro to Biochemistry kit, Introduction to toxicology kit, K'nex DNA Replication and Transcription, Lens Papers, Light Probes, Light Sensor, Long Thermometers, M50 USB Microscope Lens Unit, Magnet Sets, Making and Interpreting Topographic Map Set, Making ethynol kit, Master the Forces Kit, Measuring Spoon Sets, Mechanical Hand Kit, Microbe Scavenger Hunt Set, Microscopes, Milk bottle demonstration, Mini Conductivity Probe, Mitosis and meosis kit, Morter and Pestal , Motion Sensor, Multi Color 1oz Cups, Mystery with interesting parts kit, Nalgene, Need Chemical Energy Kit, NEED Solar Energy Kit, Nutrition kit, Onion root tip prepared slides 8, Packages of Balsa Wood, Pasco charging station, PASCO Scientific Container w/ Airlink Cord, Magnetic Field Censor, Turbidimeter, Probe, Voltage Current Censor, PH Censor, CO2 Censor, PAS Conductivity Censor, Airlink SI, Airlink 2, PASCO Scientific Container w/ CO2, Chemistry, Water Qual, Oxygen Mask, Probe, Electrode Storage Unit, 250ml bottle and DVD, Petri Dishes, Ph Censor, Photosynthesis tank, Photovoltataics Need Kit, Pinpressions Art Kit, Pipettes, Plastic beakers, Plastic Funnel, Plastic Graduated Cylinders, Plastic Hand Lens, Plastic Magnifiers, Plastic Microscope Slides, Plastic mini petrie dishes , Plastic Mircoscope Slides with Depression, Plastic Thermometer, Prisms, Propane Balloon Launcher, Quartz Timers, Rat Disection Aprons, Reel Wheels Toy Cars, Ring stand sets, Rock Collection, Rocket Launcher, Safety Goggles, Science and our food supply Kit, Science Inventors Need Kit, skeleton model, Sliding Rulers, Slinky, Small Plastic Specimen Jars, Smithsonian Environmental Test Kit, Soil PH Test Kit, Soil Survey Kit, Soil Texture Study Kit, Spark Balls Set, Spirit Foam 3pack of multi color, Teaching physics with toys packs, Temperature Probes, Temperature Thermometer, Topigraphic Map Kit, Triple Beam Balances, Understanding Genome Lab, Vital Stain Set of 7, Water Quality Probe, Water quality sensor scope, Weather Probe, Weighing dishes.
Note: Cells with N/A values do not require data.
Page 10 of 36
School Facility Conditions and Planned Improvements
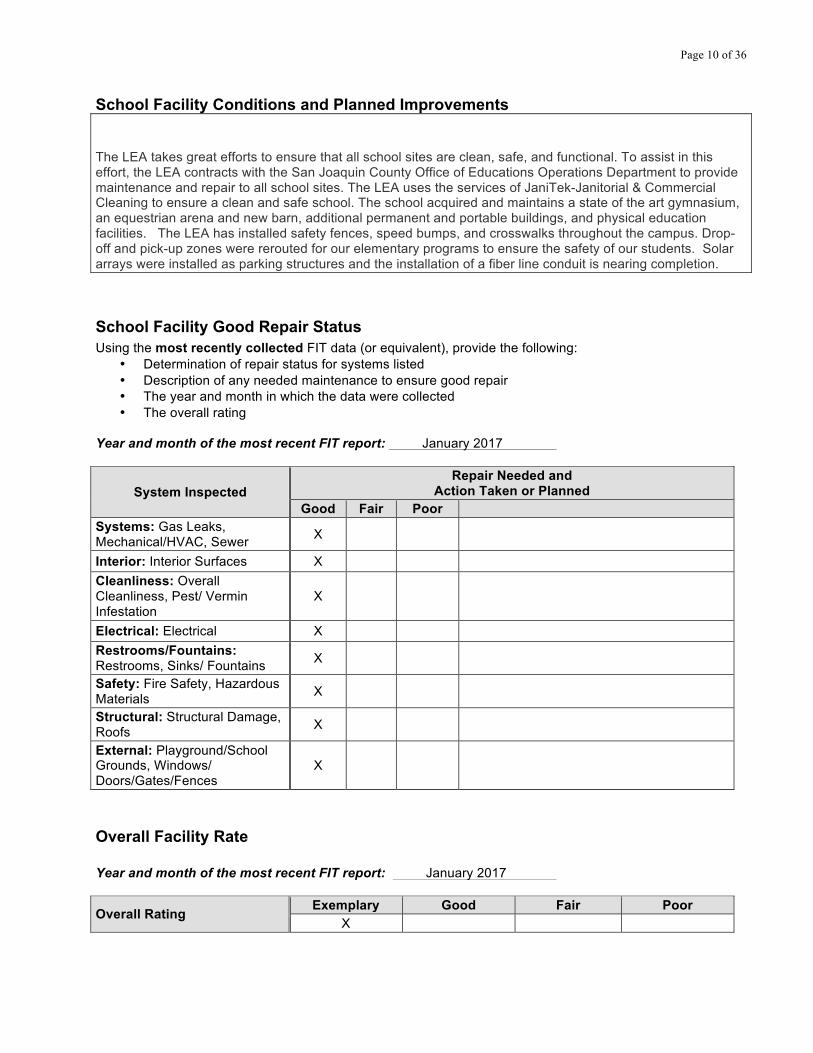
The LEA takes great efforts to ensure that all school sites are clean, safe, and functional. To assist in this effort, the LEA contracts with the San Joaquin County Office of Educations Operations Department to provide maintenance and repair to all school sites. The LEA uses the services of JaniTek-Janitorial & Commercial Cleaning to ensure a clean and safe school. The school acquired and maintains a state of the art gymnasium, an equestrian arena and new barn, additional permanent and portable buildings, and physical education facilities. The LEA has installed safety fences, speed bumps, and crosswalks throughout the campus. Drop-off and pick-up zones were rerouted for our elementary programs to ensure the safety of our students. Solar arrays were installed as parking structures and the installation of a fiber line conduit is nearing completion. School Facility Good Repair Status Using the most recently collected FIT data (or equivalent), provide the following:
• Determination of repair status for systems listed • Description of any needed maintenance to ensure good repair • The year and month in which the data were collected • The overall rating
Year and month of the most recent FIT report: January 2017
System Inspected Repair Needed and
Action Taken or Planned Good Fair Poor
Systems: Gas Leaks, Mechanical/HVAC, Sewer X
Interior: Interior Surfaces X Cleanliness: Overall Cleanliness, Pest/ Vermin Infestation
X
Electrical: Electrical X Restrooms/Fountains: Restrooms, Sinks/ Fountains X
Safety: Fire Safety, Hazardous Materials X
Structural: Structural Damage, Roofs X
External: Playground/School Grounds, Windows/ Doors/Gates/Fences
X
Overall Facility Rate Year and month of the most recent FIT report: January 2017
Overall Rating Exemplary Good Fair Poor
X
Page 11 of 36
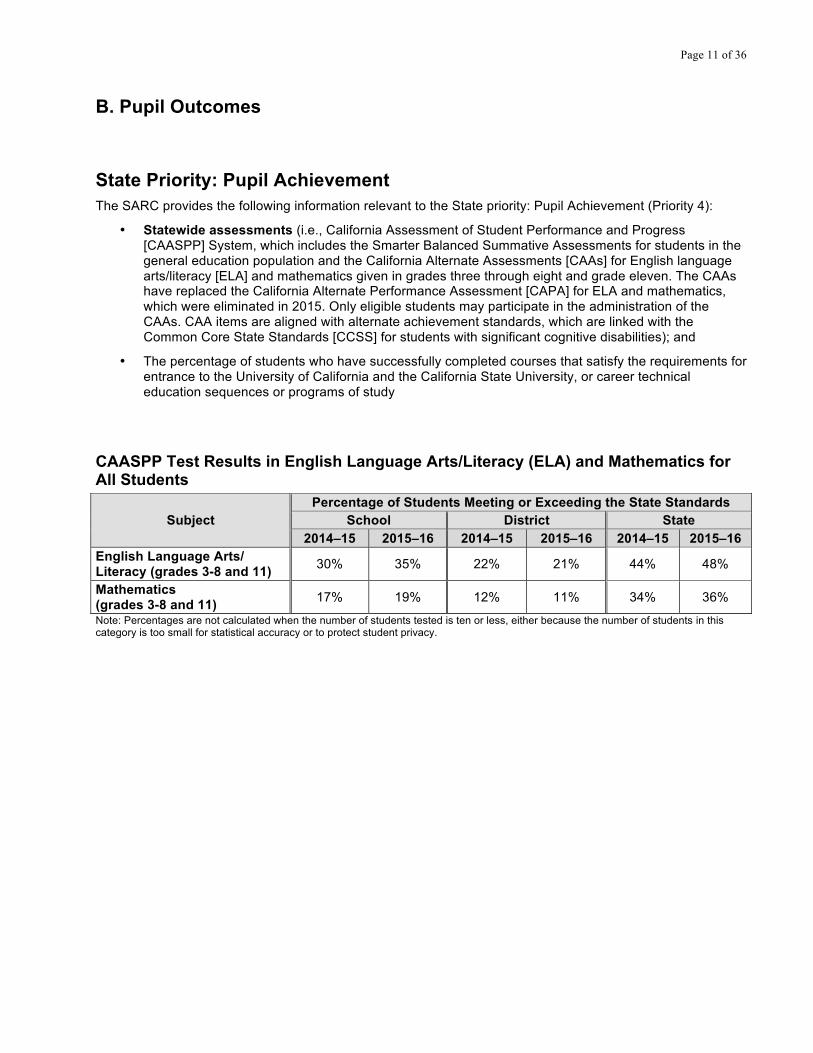
B. Pupil Outcomes State Priority: Pupil Achievement The SARC provides the following information relevant to the State priority: Pupil Achievement (Priority 4):
• Statewide assessments (i.e., California Assessment of Student Performance and Progress [CAASPP] System, which includes the Smarter Balanced Summative Assessments for students in the general education population and the California Alternate Assessments [CAAs] for English language arts/literacy [ELA] and mathematics given in grades three through eight and grade eleven. The CAAs have replaced the California Alternate Performance Assessment [CAPA] for ELA and mathematics, which were eliminated in 2015. Only eligible students may participate in the administration of the CAAs. CAA items are aligned with alternate achievement standards, which are linked with the Common Core State Standards [CCSS] for students with significant cognitive disabilities); and
• The percentage of students who have successfully completed courses that satisfy the requirements for entrance to the University of California and the California State University, or career technical education sequences or programs of study
CAASPP Test Results in English Language Arts/Literacy (ELA) and Mathematics for All Students
Subject Percentage of Students Meeting or Exceeding the State Standards
School District State 2014–15 2015–16 2014–15 2015–16 2014–15 2015–16
English Language Arts/ Literacy (grades 3-8 and 11) 30% 35% 22% 21% 44% 48%
Mathematics (grades 3-8 and 11) 17% 19% 12% 11% 34% 36%
Note: Percentages are not calculated when the number of students tested is ten or less, either because the number of students in this category is too small for statistical accuracy or to protect student privacy.
Page 12 of 36
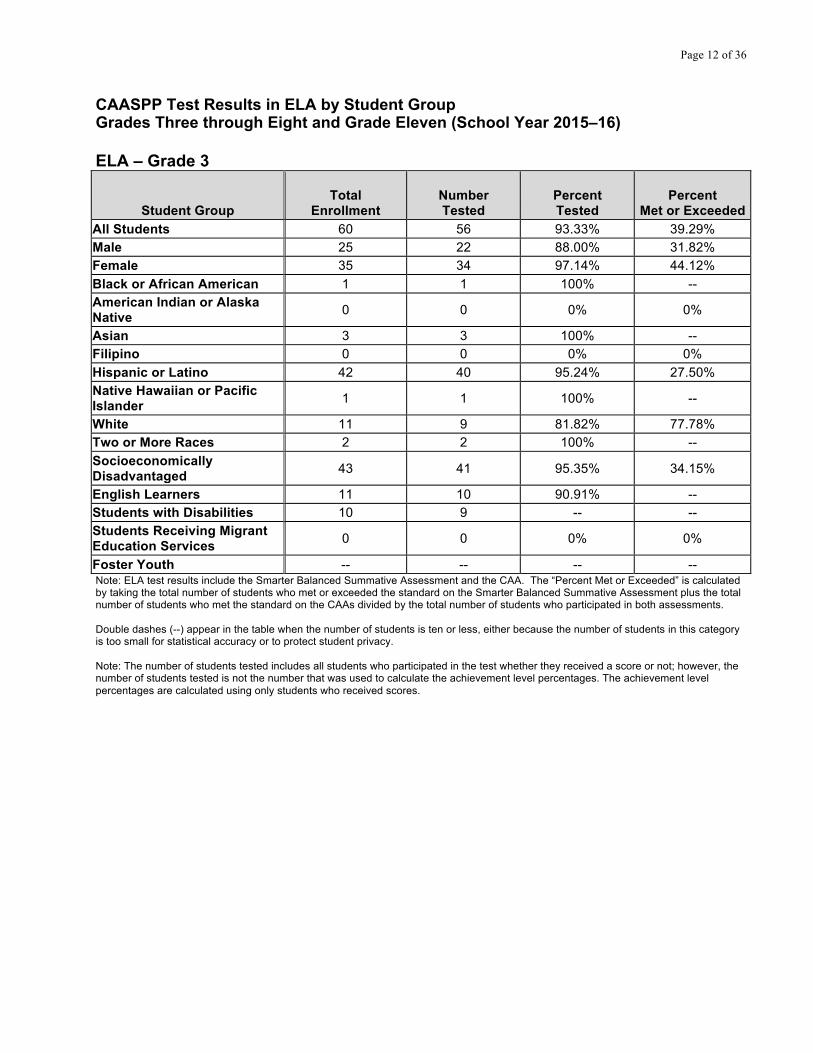
CAASPP Test Results in ELA by Student Group Grades Three through Eight and Grade Eleven (School Year 2015–16) ELA – Grade 3
Student Group
Total
Enrollment Number Tested
Percent Tested
Percent Met or Exceeded
All Students 60 56 93.33% 39.29% Male 25 22 88.00% 31.82% Female 35 34 97.14% 44.12% Black or African American 1 1 100% -- American Indian or Alaska Native 0 0 0% 0%
Asian 3 3 100% -- Filipino 0 0 0% 0% Hispanic or Latino 42 40 95.24% 27.50% Native Hawaiian or Pacific Islander 1 1 100% --
White 11 9 81.82% 77.78% Two or More Races 2 2 100% -- Socioeconomically Disadvantaged 43 41 95.35% 34.15%
English Learners 11 10 90.91% -- Students with Disabilities 10 9 -- -- Students Receiving Migrant Education Services 0 0 0% 0%
Foster Youth -- -- -- -- Note: ELA test results include the Smarter Balanced Summative Assessment and the CAA. The “Percent Met or Exceeded” is calculated by taking the total number of students who met or exceeded the standard on the Smarter Balanced Summative Assessment plus the total number of students who met the standard on the CAAs divided by the total number of students who participated in both assessments. Double dashes (--) appear in the table when the number of students is ten or less, either because the number of students in this category is too small for statistical accuracy or to protect student privacy. Note: The number of students tested includes all students who participated in the test whether they received a score or not; however, the number of students tested is not the number that was used to calculate the achievement level percentages. The achievement level percentages are calculated using only students who received scores.
Page 13 of 36
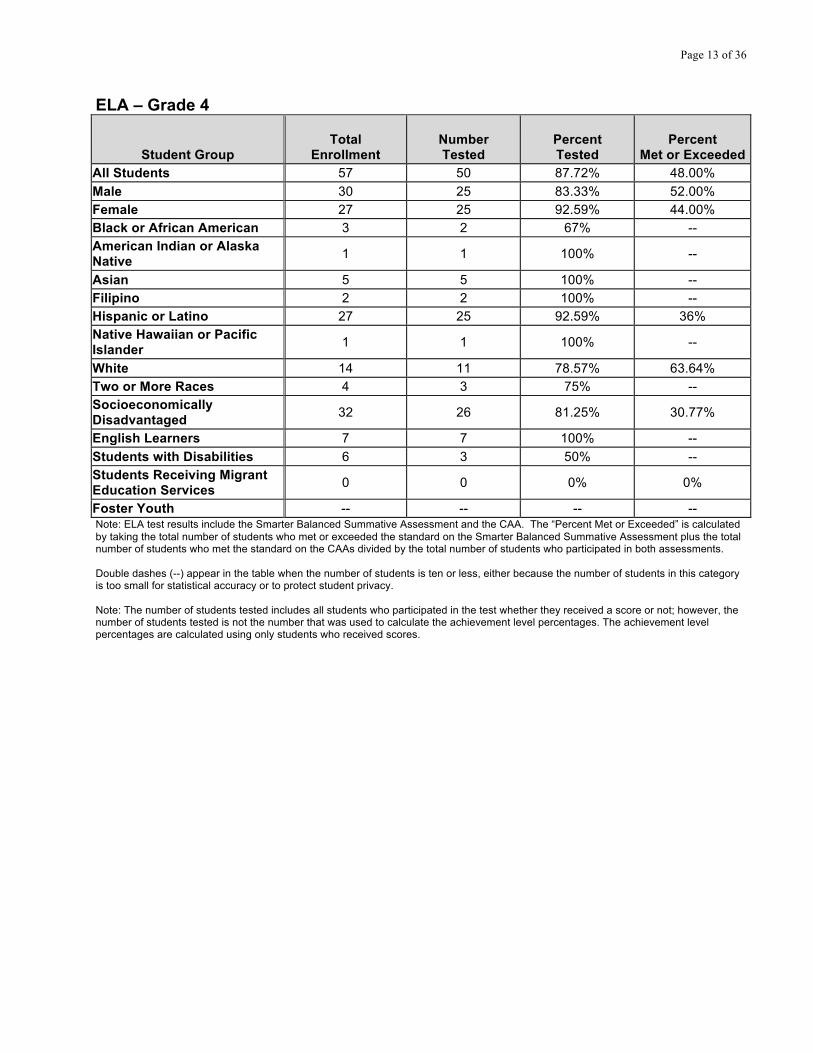
ELA – Grade 4
Student Group
Total
Enrollment Number Tested
Percent Tested
Percent Met or Exceeded
All Students 57 50 87.72% 48.00% Male 30 25 83.33% 52.00% Female 27 25 92.59% 44.00% Black or African American 3 2 67% -- American Indian or Alaska Native 1 1 100% --
Asian 5 5 100% -- Filipino 2 2 100% -- Hispanic or Latino 27 25 92.59% 36% Native Hawaiian or Pacific Islander 1 1 100% --
White 14 11 78.57% 63.64% Two or More Races 4 3 75% -- Socioeconomically Disadvantaged 32 26 81.25% 30.77%
English Learners 7 7 100% -- Students with Disabilities 6 3 50% -- Students Receiving Migrant Education Services 0 0 0% 0%
Foster Youth -- -- -- -- Note: ELA test results include the Smarter Balanced Summative Assessment and the CAA. The “Percent Met or Exceeded” is calculated by taking the total number of students who met or exceeded the standard on the Smarter Balanced Summative Assessment plus the total number of students who met the standard on the CAAs divided by the total number of students who participated in both assessments. Double dashes (--) appear in the table when the number of students is ten or less, either because the number of students in this category is too small for statistical accuracy or to protect student privacy. Note: The number of students tested includes all students who participated in the test whether they received a score or not; however, the number of students tested is not the number that was used to calculate the achievement level percentages. The achievement level percentages are calculated using only students who received scores.
Page 14 of 36
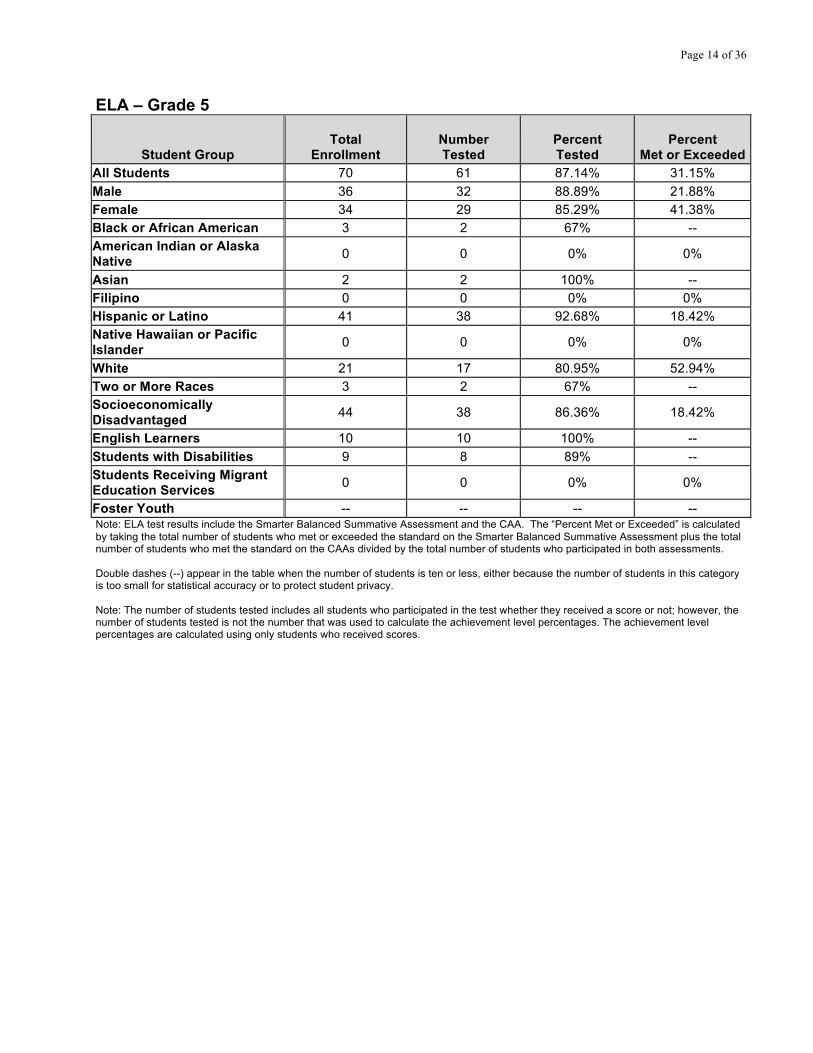
ELA – Grade 5
Student Group
Total
Enrollment Number Tested
Percent Tested
Percent Met or Exceeded
All Students 70 61 87.14% 31.15% Male 36 32 88.89% 21.88% Female 34 29 85.29% 41.38% Black or African American 3 2 67% -- American Indian or Alaska Native 0 0 0% 0%
Asian 2 2 100% -- Filipino 0 0 0% 0% Hispanic or Latino 41 38 92.68% 18.42% Native Hawaiian or Pacific Islander 0 0 0% 0%
White 21 17 80.95% 52.94% Two or More Races 3 2 67% -- Socioeconomically Disadvantaged 44 38 86.36% 18.42%
English Learners 10 10 100% -- Students with Disabilities 9 8 89% -- Students Receiving Migrant Education Services 0 0 0% 0%
Foster Youth -- -- -- -- Note: ELA test results include the Smarter Balanced Summative Assessment and the CAA. The “Percent Met or Exceeded” is calculated by taking the total number of students who met or exceeded the standard on the Smarter Balanced Summative Assessment plus the total number of students who met the standard on the CAAs divided by the total number of students who participated in both assessments. Double dashes (--) appear in the table when the number of students is ten or less, either because the number of students in this category is too small for statistical accuracy or to protect student privacy. Note: The number of students tested includes all students who participated in the test whether they received a score or not; however, the number of students tested is not the number that was used to calculate the achievement level percentages. The achievement level percentages are calculated using only students who received scores.

Page 15 of 36
ELA – Grade 6
Student Group
Total
Enrollment Number Tested
Percent Tested
Percent Met or Exceeded
All Students 99 93 93.94% 23.91% Male 45 44 97.78% 22.73% Female 54 49 90.74% 25% Black or African American 9 6 67% -- American Indian or Alaska Native 3 3 100% --
Asian 3 3 100% -- Filipino 2 2 100% -- Hispanic or Latino 55 55 100% 14.55% Native Hawaiian or Pacific Islander 0 0 0% 0%
White 23 20 86.96% 50.00% Two or More Races 4 4 100% -- Socioeconomically Disadvantaged 64 62 96.88% 17.74%
English Learners 13 13 100% 0% Students with Disabilities 7 7 100% -- Students Receiving Migrant Education Services 0 0 0% 0%
Foster Youth -- -- -- -- Note: ELA test results include the Smarter Balanced Summative Assessment and the CAA. The “Percent Met or Exceeded” is calculated by taking the total number of students who met or exceeded the standard on the Smarter Balanced Summative Assessment plus the total number of students who met the standard on the CAAs divided by the total number of students who participated in both assessments. Double dashes (--) appear in the table when the number of students is ten or less, either because the number of students in this category is too small for statistical accuracy or to protect student privacy. Note: The number of students tested includes all students who participated in the test whether they received a score or not; however, the number of students tested is not the number that was used to calculate the achievement level percentages. The achievement level percentages are calculated using only students who received scores.

Page 16 of 36
ELA – Grade 7
Student Group
Total
Enrollment Number Tested
Percent Tested
Percent Met or Exceeded
All Students 130 122 93.85% 31.97% Male 58 54 93.10% 27.78% Female 72 68 94.44% 35.29% Black or African American 8 7 88% -- American Indian or Alaska Native 2 1 50% --
Asian 4 4 100% -- Filipino 0 0 0% 0% Hispanic or Latino 69 65 94.20% 23.08% Native Hawaiian or Pacific Islander 2 2 100% --
White 36 35 97.22% 48.57% Two or More Races 9 8 89% -- Socioeconomically Disadvantaged 81 75 92.59% 26.67%
English Learners 13 13 100% 7.69% Students with Disabilities 11 10 90.91% 10.00% Students Receiving Migrant Education Services 0 0 0% 0%
Foster Youth -- -- -- -- Note: ELA test results include the Smarter Balanced Summative Assessment and the CAA. The “Percent Met or Exceeded” is calculated by taking the total number of students who met or exceeded the standard on the Smarter Balanced Summative Assessment plus the total number of students who met the standard on the CAAs divided by the total number of students who participated in both assessments. Double dashes (--) appear in the table when the number of students is ten or less, either because the number of students in this category is too small for statistical accuracy or to protect student privacy. Note: The number of students tested includes all students who participated in the test whether they received a score or not; however, the number of students tested is not the number that was used to calculate the achievement level percentages. The achievement level percentages are calculated using only students who received scores.

Page 17 of 36
ELA – Grade 8
Student Group
Total
Enrollment Number Tested
Percent Tested
Percent Met or Exceeded
All Students 139 132 94.96% 38.64% Male 66 62 93.94% 27.42% Female 73 70 95.89% 48.57% Black or African American 18 17 94.44% 29.41% American Indian or Alaska Native 1 1 100% --
Asian 3 3 100% -- Filipino 3 3 100% -- Hispanic or Latino 75 71 94.67% 35.21% Native Hawaiian or Pacific Islander 0 0 0% 0%
White 32 30 93.75% 46.67% Two or More Races 6 6 100% -- Socioeconomically Disadvantaged 88 82 93.18% 31.71%
English Learners 13 13 100% 15.38% Students with Disabilities 12 11 91.67% 9.09% Students Receiving Migrant Education Services 0 0 0% 0%
Foster Youth -- -- -- -- Note: ELA test results include the Smarter Balanced Summative Assessment and the CAA. The “Percent Met or Exceeded” is calculated by taking the total number of students who met or exceeded the standard on the Smarter Balanced Summative Assessment plus the total number of students who met the standard on the CAAs divided by the total number of students who participated in both assessments. Double dashes (--) appear in the table when the number of students is ten or less, either because the number of students in this category is too small for statistical accuracy or to protect student privacy. Note: The number of students tested includes all students who participated in the test whether they received a score or not; however, the number of students tested is not the number that was used to calculate the achievement level percentages. The achievement level percentages are calculated using only students who received scores.

Page 18 of 36
ELA – Grade 11
Student Group
Total
Enrollment Number Tested
Percent Tested
Percent Met or Exceeded
All Students 238 212 89.08% 36.02% Male 99 92 92.92% 33.70% Female 139 120 86.33% 37.8% Black or African American 14 11 78.57% 30.00% American Indian or Alaska Native 0 0 0% 0%
Asian 4 4 100% -- Filipino 4 4 100% -- Hispanic or Latino 144 131 90.97% 29.77% Native Hawaiian or Pacific Islander 3 3 100% --
White 59 50 84.75% 50.00% Two or More Races 10 9 90% -- Socioeconomically Disadvantaged 165 145 87.88% 29.86%
English Learners 12 12 100% 8.33% Students with Disabilities 9 9 100% -- Students Receiving Migrant Education Services 2 1 50% --
Foster Youth -- -- -- -- Note: ELA test results include the Smarter Balanced Summative Assessment and the CAA. The “Percent Met or Exceeded” is calculated by taking the total number of students who met or exceeded the standard on the Smarter Balanced Summative Assessment plus the total number of students who met the standard on the CAAs divided by the total number of students who participated in both assessments. Double dashes (--) appear in the table when the number of students is ten or less, either because the number of students in this category is too small for statistical accuracy or to protect student privacy. Note: The number of students tested includes all students who participated in the test whether they received a score or not; however, the number of students tested is not the number that was used to calculate the achievement level percentages. The achievement level percentages are calculated using only students who received scores.
Page 19 of 36
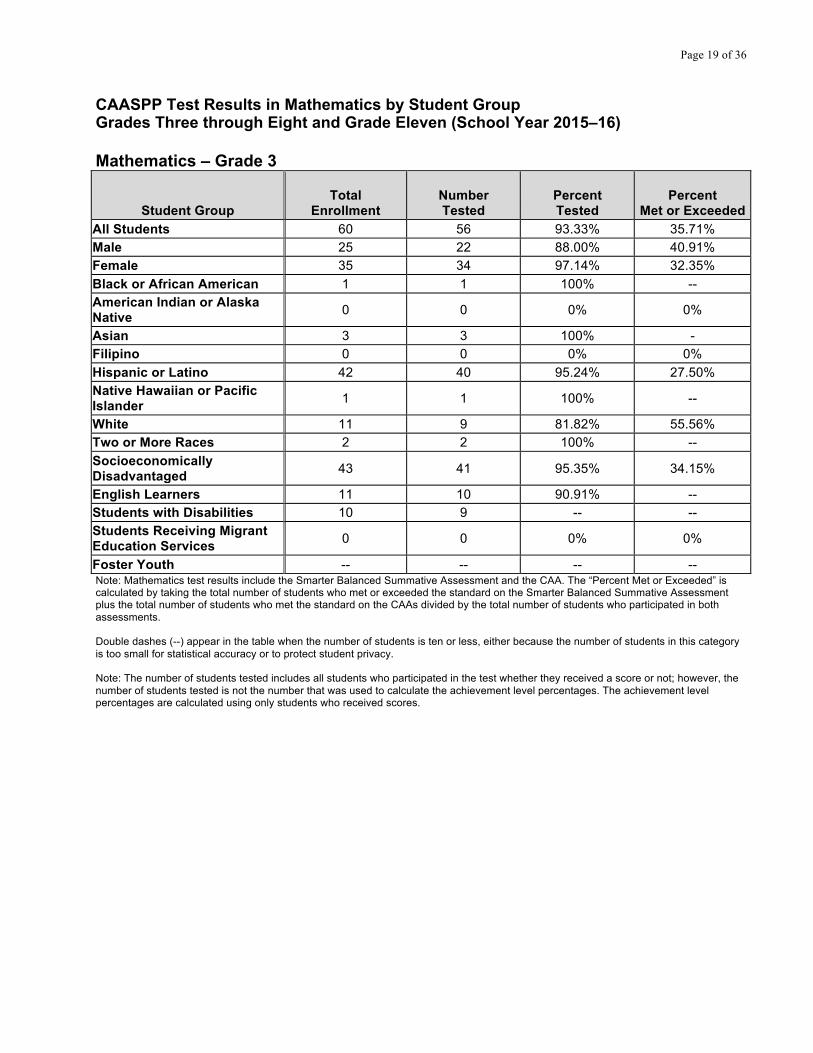
CAASPP Test Results in Mathematics by Student Group Grades Three through Eight and Grade Eleven (School Year 2015–16) Mathematics – Grade 3
Student Group
Total
Enrollment Number Tested
Percent Tested
Percent Met or Exceeded
All Students 60 56 93.33% 35.71% Male 25 22 88.00% 40.91% Female 35 34 97.14% 32.35% Black or African American 1 1 100% -- American Indian or Alaska Native 0 0 0% 0%
Asian 3 3 100% - Filipino 0 0 0% 0% Hispanic or Latino 42 40 95.24% 27.50% Native Hawaiian or Pacific Islander 1 1 100% --
White 11 9 81.82% 55.56% Two or More Races 2 2 100% -- Socioeconomically Disadvantaged 43 41 95.35% 34.15%
English Learners 11 10 90.91% -- Students with Disabilities 10 9 -- -- Students Receiving Migrant Education Services 0 0 0% 0%
Foster Youth -- -- -- -- Note: Mathematics test results include the Smarter Balanced Summative Assessment and the CAA. The “Percent Met or Exceeded” is calculated by taking the total number of students who met or exceeded the standard on the Smarter Balanced Summative Assessment plus the total number of students who met the standard on the CAAs divided by the total number of students who participated in both assessments. Double dashes (--) appear in the table when the number of students is ten or less, either because the number of students in this category is too small for statistical accuracy or to protect student privacy. Note: The number of students tested includes all students who participated in the test whether they received a score or not; however, the number of students tested is not the number that was used to calculate the achievement level percentages. The achievement level percentages are calculated using only students who received scores.

Page 20 of 36
Mathematics – Grade 4
Student Group
Total
Enrollment Number Tested
Percent Tested
Percent Met or Exceeded
All Students 57 50 87.72% 30.00% Male 30 25 83.33% 44.00% Female 27 25 92.59% 16.00% Black or African American 3 2 67% -- American Indian or Alaska Native 1 1 100% --
Asian 5 5 100% -- Filipino 2 2 100% -- Hispanic or Latino 27 25 92.59% 16.00% Native Hawaiian or Pacific Islander 1 1 100% --
White 14 11 78.57% 54.55% Two or More Races 4 3 75% -- Socioeconomically Disadvantaged 32 26 81.25% 7.69%
English Learners 7 7 100% -- Students with Disabilities 6 3 50% -- Students Receiving Migrant Education Services 0 0 0% 0%
Foster Youth -- -- -- -- Note: Mathematics test results include the Smarter Balanced Summative Assessment and the CAA. The “Percent Met or Exceeded” is calculated by taking the total number of students who met or exceeded the standard on the Smarter Balanced Summative Assessment plus the total number of students who met the standard on the CAAs divided by the total number of students who participated in both assessments. Double dashes (--) appear in the table when the number of students is ten or less, either because the number of students in this category is too small for statistical accuracy or to protect student privacy. Note: The number of students tested includes all students who participated in the test whether they received a score or not; however, the number of students tested is not the number that was used to calculate the achievement level percentages. The achievement level percentages are calculated using only students who received scores.
Page 21 of 36
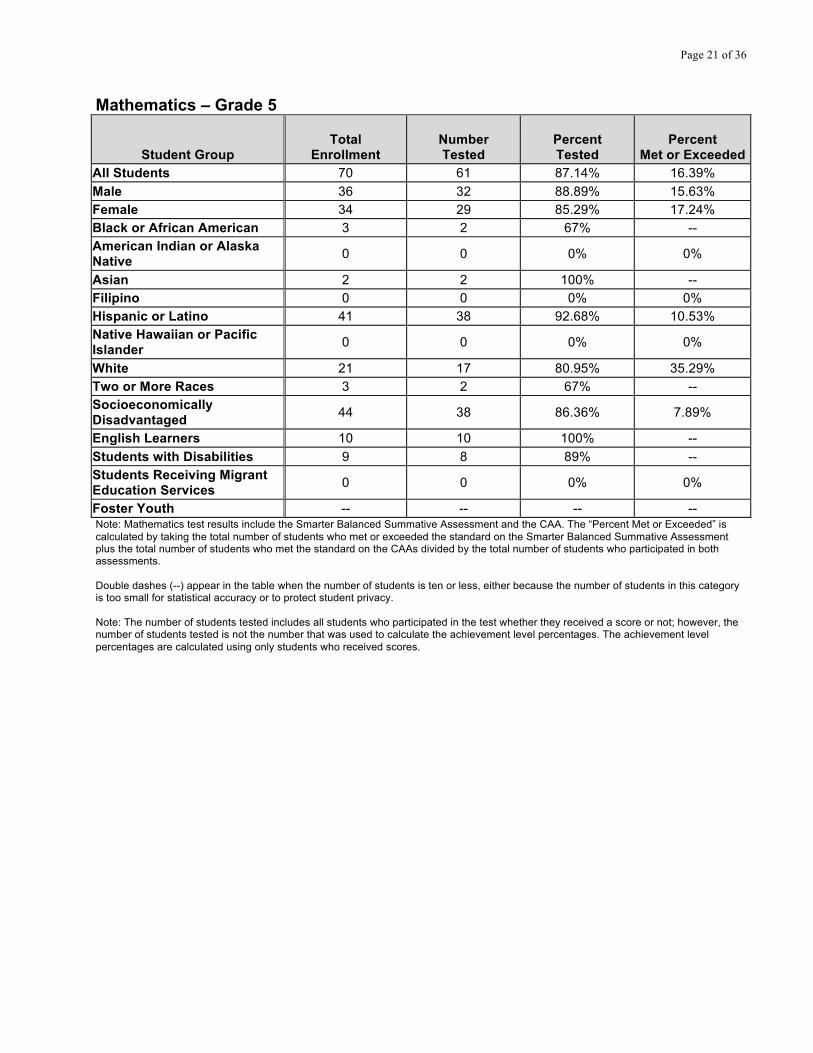
Mathematics – Grade 5
Student Group
Total
Enrollment Number Tested
Percent Tested
Percent Met or Exceeded
All Students 70 61 87.14% 16.39% Male 36 32 88.89% 15.63% Female 34 29 85.29% 17.24% Black or African American 3 2 67% -- American Indian or Alaska Native 0 0 0% 0%
Asian 2 2 100% -- Filipino 0 0 0% 0% Hispanic or Latino 41 38 92.68% 10.53% Native Hawaiian or Pacific Islander 0 0 0% 0%
White 21 17 80.95% 35.29% Two or More Races 3 2 67% -- Socioeconomically Disadvantaged 44 38 86.36% 7.89%
English Learners 10 10 100% -- Students with Disabilities 9 8 89% -- Students Receiving Migrant Education Services 0 0 0% 0%
Foster Youth -- -- -- -- Note: Mathematics test results include the Smarter Balanced Summative Assessment and the CAA. The “Percent Met or Exceeded” is calculated by taking the total number of students who met or exceeded the standard on the Smarter Balanced Summative Assessment plus the total number of students who met the standard on the CAAs divided by the total number of students who participated in both assessments. Double dashes (--) appear in the table when the number of students is ten or less, either because the number of students in this category is too small for statistical accuracy or to protect student privacy. Note: The number of students tested includes all students who participated in the test whether they received a score or not; however, the number of students tested is not the number that was used to calculate the achievement level percentages. The achievement level percentages are calculated using only students who received scores.

Page 22 of 36
Mathematics – Grade 6
Student Group
Total
Enrollment Number Tested
Percent Tested
Percent Met or Exceeded
All Students 99 93 93.94% 13.98% Male 45 44 97.78% 13.64% Female 54 49 90.74% 14.29% Black or African American 9 6 67% -- American Indian or Alaska Native 3 3 100% --
Asian 3 3 100% -- Filipino 2 2 100% -- Hispanic or Latino 55 55 100% 7.27% Native Hawaiian or Pacific Islander 0 0 0% 0%
White 23 20 86.96% 35.00% Two or More Races 4 4 100% -- Socioeconomically Disadvantaged 64 62 96.88% 9.68%
English Learners 13 13 100% 0% Students with Disabilities 7 7 100% -- Students Receiving Migrant Education Services 0 0 0% 0%
Foster Youth -- -- -- -- Note: Mathematics test results include the Smarter Balanced Summative Assessment and the CAA. The “Percent Met or Exceeded” is calculated by taking the total number of students who met or exceeded the standard on the Smarter Balanced Summative Assessment plus the total number of students who met the standard on the CAAs divided by the total number of students who participated in both assessments. Double dashes (--) appear in the table when the number of students is ten or less, either because the number of students in this category is too small for statistical accuracy or to protect student privacy. Note: The number of students tested includes all students who participated in the test whether they received a score or not; however, the number of students tested is not the number that was used to calculate the achievement level percentages. The achievement level percentages are calculated using only students who received scores.
Page 23 of 36
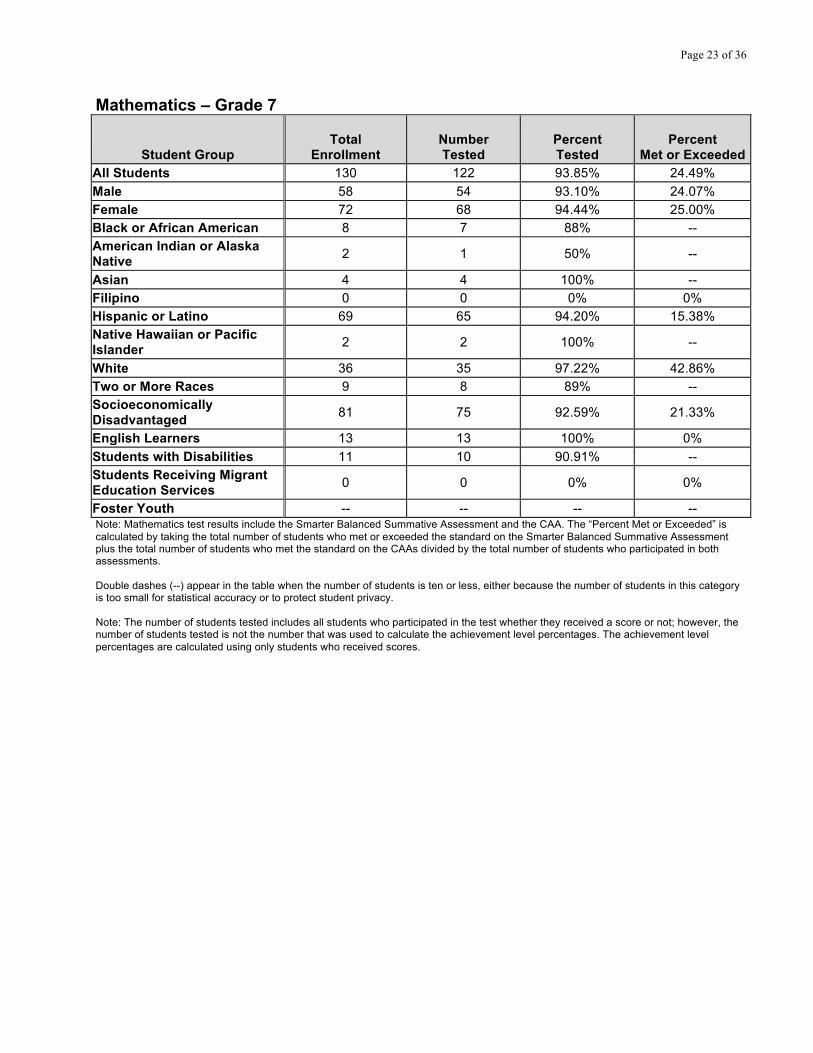
Mathematics – Grade 7
Student Group
Total
Enrollment Number Tested
Percent Tested
Percent Met or Exceeded
All Students 130 122 93.85% 24.49% Male 58 54 93.10% 24.07% Female 72 68 94.44% 25.00% Black or African American 8 7 88% -- American Indian or Alaska Native 2 1 50% --
Asian 4 4 100% -- Filipino 0 0 0% 0% Hispanic or Latino 69 65 94.20% 15.38% Native Hawaiian or Pacific Islander 2 2 100% --
White 36 35 97.22% 42.86% Two or More Races 9 8 89% -- Socioeconomically Disadvantaged 81 75 92.59% 21.33%
English Learners 13 13 100% 0% Students with Disabilities 11 10 90.91% -- Students Receiving Migrant Education Services 0 0 0% 0%
Foster Youth -- -- -- -- Note: Mathematics test results include the Smarter Balanced Summative Assessment and the CAA. The “Percent Met or Exceeded” is calculated by taking the total number of students who met or exceeded the standard on the Smarter Balanced Summative Assessment plus the total number of students who met the standard on the CAAs divided by the total number of students who participated in both assessments. Double dashes (--) appear in the table when the number of students is ten or less, either because the number of students in this category is too small for statistical accuracy or to protect student privacy. Note: The number of students tested includes all students who participated in the test whether they received a score or not; however, the number of students tested is not the number that was used to calculate the achievement level percentages. The achievement level percentages are calculated using only students who received scores.

Page 24 of 36
Mathematics – Grade 8
Student Group
Total
Enrollment Number Tested
Percent Tested
Percent Met or Exceeded
All Students 139 132 94.96% 23.48% Male 66 62 93.94% 20.97% Female 73 70 95.89% 25.71% Black or African American 18 17 94.44% 11.76% American Indian or Alaska Native 1 1 100% --
Asian 3 3 100% -- Filipino 3 3 100% -- Hispanic or Latino 75 71 94.67% 21.13% Native Hawaiian or Pacific Islander 0 0 0% 0%
White 32 30 93.75% 33.33% Two or More Races 6 6 100% -- Socioeconomically Disadvantaged 88 82 93.18% 19.51%
English Learners 13 13 100% 7.69% Students with Disabilities 12 11 91.67% 0% Students Receiving Migrant Education Services 0 0 0% 0%
Foster Youth -- -- -- -- Note: Mathematics test results include the Smarter Balanced Summative Assessment and the CAA. The “Percent Met or Exceeded” is calculated by taking the total number of students who met or exceeded the standard on the Smarter Balanced Summative Assessment plus the total number of students who met the standard on the CAAs divided by the total number of students who participated in both assessments. Double dashes (--) appear in the table when the number of students is ten or less, either because the number of students in this category is too small for statistical accuracy or to protect student privacy. Note: The number of students tested includes all students who participated in the test whether they received a score or not; however, the number of students tested is not the number that was used to calculate the achievement level percentages. The achievement level percentages are calculated using only students who received scores.

Page 25 of 36
Mathematics – Grade 11
Student Group
Total
Enrollment Number Tested
Percent Tested
Percent Met or Exceeded
All Students 238 212 89.08% 8.06% Male 99 92 92.93% 10.87% Female 139 120 86.33% 5.88% Black or African American 14 11 78.57% 0% American Indian or Alaska Native 0 0 0% 0%
Asian 4 4 100% -- Filipino 4 4 100% -- Hispanic or Latino 144 131 90.97% 4.58% Native Hawaiian or Pacific Islander 3 3 100% --
White 59 50 84.75% 16.00% Two or More Races 10 9 90% -- Socioeconomically Disadvantaged 165 145 87.88% 4.86%
English Learners 12 12 100% 0% Students with Disabilities 9 9 100% -- Students Receiving Migrant Education Services 2 1 50% --
Foster Youth -- -- -- -- Note: Mathematics test results include the Smarter Balanced Summative Assessment and the CAA. The “Percent Met or Exceeded” is calculated by taking the total number of students who met or exceeded the standard on the Smarter Balanced Summative Assessment plus the total number of students who met the standard on the CAAs divided by the total number of students who participated in both assessments. Double dashes (--) appear in the table when the number of students is ten or less, either because the number of students in this category is too small for statistical accuracy or to protect student privacy. Note: The number of students tested includes all students who participated in the test whether they received a score or not; however, the number of students tested is not the number that was used to calculate the achievement level percentages. The achievement level percentages are calculated using only students who received scores.
Page 26 of 36
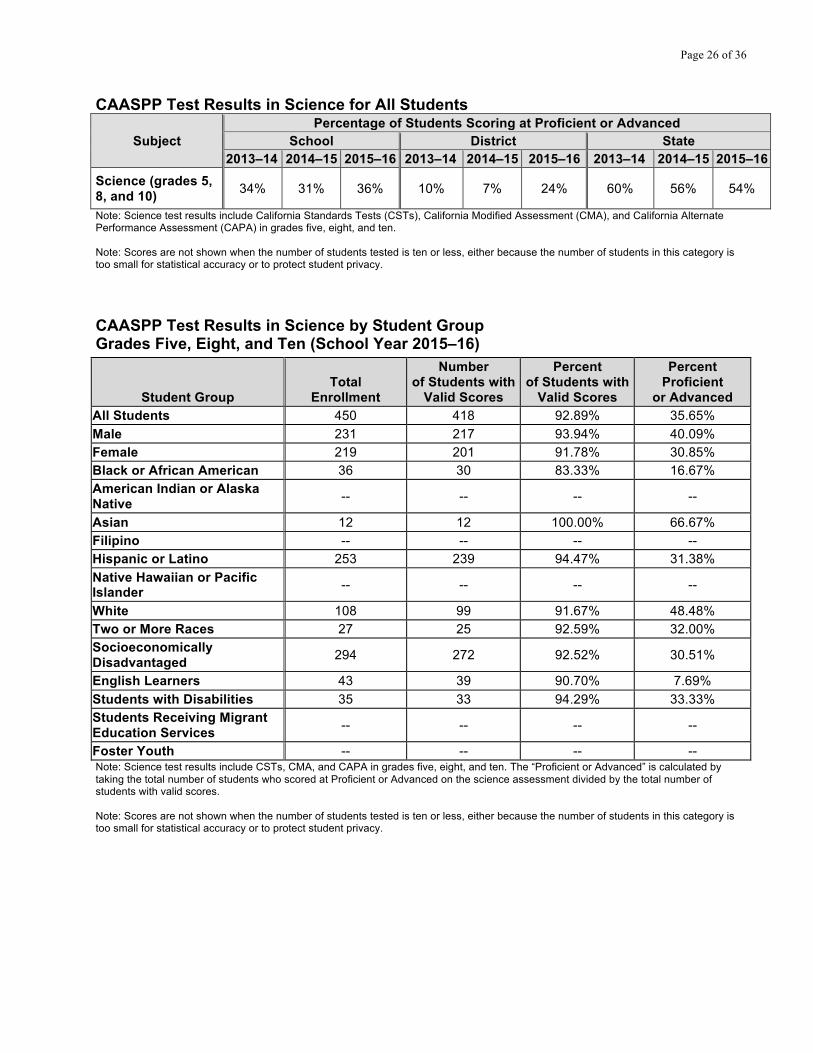
CAASPP Test Results in Science for All Students
Subject Percentage of Students Scoring at Proficient or Advanced
School District State 2013–14 2014–15 2015–16 2013–14 2014–15 2015–16 2013–14 2014–15 2015–16
Science (grades 5, 8, and 10) 34% 31% 36% 10% 7% 24% 60% 56% 54%
Note: Science test results include California Standards Tests (CSTs), California Modified Assessment (CMA), and California Alternate Performance Assessment (CAPA) in grades five, eight, and ten. Note: Scores are not shown when the number of students tested is ten or less, either because the number of students in this category is too small for statistical accuracy or to protect student privacy. CAASPP Test Results in Science by Student Group Grades Five, Eight, and Ten (School Year 2015–16)
Student Group
Total
Enrollment
Number of Students with
Valid Scores
Percent of Students with
Valid Scores
Percent Proficient
or Advanced All Students 450 418 92.89% 35.65% Male 231 217 93.94% 40.09% Female 219 201 91.78% 30.85% Black or African American 36 30 83.33% 16.67% American Indian or Alaska Native -- -- -- --
Asian 12 12 100.00% 66.67% Filipino -- -- -- -- Hispanic or Latino 253 239 94.47% 31.38% Native Hawaiian or Pacific Islander -- -- -- --
White 108 99 91.67% 48.48% Two or More Races 27 25 92.59% 32.00% Socioeconomically Disadvantaged 294 272 92.52% 30.51%
English Learners 43 39 90.70% 7.69% Students with Disabilities 35 33 94.29% 33.33% Students Receiving Migrant Education Services -- -- -- --
Foster Youth -- -- -- -- Note: Science test results include CSTs, CMA, and CAPA in grades five, eight, and ten. The “Proficient or Advanced” is calculated by taking the total number of students who scored at Proficient or Advanced on the science assessment divided by the total number of students with valid scores. Note: Scores are not shown when the number of students tested is ten or less, either because the number of students in this category is too small for statistical accuracy or to protect student privacy.

Page 27 of 36
Career Technical Education Programs (School Year 2015–16) Career Technical Education - SJCOE
The San Joaquin County Office of Education desires to provide a comprehensive career technical education (CTE) program in both secondary and post-secondary programs that integrate core academic instruction with technical and occupational instruction in order to increase student achievement, graduation rates, and readiness for postsecondary education and employment. The CTE program shall be designed to help students develop the academic, career, and technical skills needed to succeed in a knowledge- and skills-based economy. The program shall include a rigorous academic component and provide students with a strong experience and understanding of all aspects of an industry.
The San Joaquin County Office of Education’s CTE program shall focus on preparing students to enter current or emerging high-skill, high-wage, and/or high-demand occupations. CTE opportunities may be offered through linked learning programs, partnership academies, apprenticeship programs or orientation to apprenticeships, regional occupational centers or programs, tech prep programs, charter schools, small learning communities, or other programs that expose students to career options while preparing them for future careers in a given industry or interest area.
State model curriculum standards for CTE for grades 7-12 integrate the state's academic content standards with industry-specific knowledge and skills in 58 career pathways organized into 15 industry sectors: agriculture and natural resources; arts, media, and entertainment; building trades and construction; education, child development, and family services; energy and utilities; engineering and design; fashion and interior design; finance and business; health science and medical technology; hospitality, tourism, and recreation; information technology; manufacturing and product development; marketing, sales, and service; public services; and transportation. The state's curriculum framework for CTE provides guidance in implementing the state content standards and provides guidance for implementing assessment standards. Career Technical Education Participation (School Year 2015–16)
Measure CTE Program Participation Number of Pupils Participating in CTE 362 Percent of Pupils Completing a CTE Program and Earning a High School Diploma 21.8% Percent of CTE Courses Sequenced or Articulated Between the School and Institutions of Postsecondary Education 20.5% Courses for University of California (UC) and/or California State University (CSU) Admission
UC/CSU Course Measure Percent 2015–16 Pupils Enrolled in Courses Required for UC/CSU Admission 69.74% 2014–15 Graduates Who Completed All Courses Required for UC/CSU Admission 11.65%
Page 28 of 36
State Priority: Other Pupil Outcomes The SARC provides the following information relevant to the State priority: Other Pupil Outcomes (Priority 8):
• Pupil outcomes in the subject area of physical education
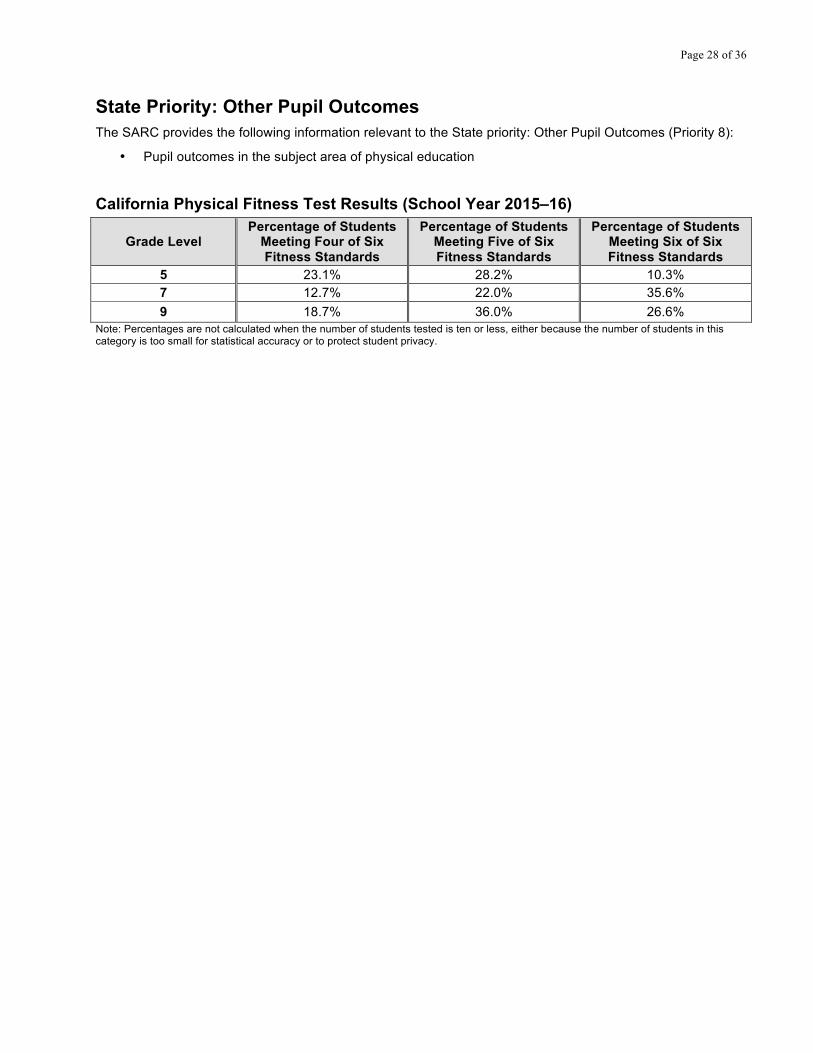
California Physical Fitness Test Results (School Year 2015–16)
Grade Level Percentage of Students
Meeting Four of Six Fitness Standards
Percentage of Students Meeting Five of Six Fitness Standards
Percentage of Students Meeting Six of Six Fitness Standards
5 23.1% 28.2% 10.3% 7 12.7% 22.0% 35.6% 9 18.7% 36.0% 26.6%
Note: Percentages are not calculated when the number of students tested is ten or less, either because the number of students in this category is too small for statistical accuracy or to protect student privacy.

Page 29 of 36
C. Engagement State Priority: Parental Involvement The SARC provides the following information relevant to the State priority: Parental Involvement (Priority 3):
• Efforts the school district makes to seek parent input in making decisions for the school district and each schoolsite
Opportunities for Parental Involvement (School Year 2016–17) The Advisory School Council (ASC) is responsible for holding VAFS accountable for the performance of enrolled students. This council conducts the lottery if enrollment exceeds capacity, addresses school safety issues, reviews parental concerns, and sets policies that are unique to the school. The ASC coordinates several annual fundraising events and approves grant proposals and distribution of funds raised through these events. The Council consists of the VAFS Director (non-voting member), two teachers, four parents, two community members and two students (one voting and one non-voting). The council meets the first Tuesday of each month at 2:30 pm. Information about the council meetings is posted on the bulletin board at the Venture Academy main site and on the school website. The Division Director is responsible for communicating all ASC policy decisions to the VAFS School Board. ASC elections are held in the fall. ASC meetings are conducted in compliance with all requirements of the Brown Act.
All academies now use an online gradebook with messaging features. This gives parents 24/7 access to their student’s progress. Parents and students can see their assignments, grades, uploaded worksheets and instructions, as well as communicate with teachers. Teachers regularly communicate with students and parents through the online gradebook. In addition, elementary academies have implemented progress reports and Edperformance reporting tools in order to more effectively communicate assessment results with students and parents.
Parents have been included in all phases of WASC accreditation and Charter Renewal. This includes participation in surveys, committees for improvement efforts, review of documents and meeting with WASC visiting committee and presentation of the Charter renewal document to the SJCOE Board.
In Venture Academy’s Modified Daily Attendance Program (MDA), all students are evaluated monthly and parents are informed of credit/progress being made. In addition, all students in home study and independent study are evaluated at monthly meetings with parents present and engaged in dialogue surrounding student progress. These meetings take place a minimum of every four weeks. Parents and their student(s) are required to attend this monthly check-in meeting with their teacher of record. During this meeting, all work is reviewed, student progress is assessed, and a month long learning plan is developed collaboratively with input from teacher, parent, and student. In addition to student work, parents are encouraged and welcome to participate in student programs when parent volunteers are needed. The following gives a small glimpse into what parent involvement is at Venture Academy.
• Parents help organize and promote school-wide involvement in community events. • Parents attend workshops/course offerings to learn with their children. • Parents, as member of the Advisory School Council, have taken leadership roles in planning many school events: Prom, Grad Nite at Disneyland, 8th grade promotion, book fair, and numerous fundraising opportunities. • Parents volunteer in classrooms helping teachers with various tasks. • Parents donate class supplies and contribute to class projects • Parents volunteer time working at school events, such as: Fall Festival, Dr. Seuss Day, Valley Days and the Clothing Exchange. • Parents attend field trips and provide additional support for teachers and students.

Page 30 of 36
State Priority: Pupil Engagement The SARC provides the following information relevant to the State priority: Pupil Engagement (Priority 5):
• High school dropout rates; and
• High school graduation rates Dropout Rate and Graduation Rate (Four-Year Cohort Rate)
Indicator School District State 2012–13 2013–14 2014–15 2012–13 2013–14 2014–15 2012–13 2013–14 2014–15
Dropout Rate 12.2 21.5 7.8 12 13.2 10.6 11.4 11.5 10.7 Graduation Rate 65.61 64.91 75.19 80.3 80.27 82.31 80.44 80.95 82.27 Completion of High School Graduation Requirements – Graduating Class of 2015 (One-Year Rate)
Student Group School District State All Students 100% 52.59% 85.92% Black or African American 100% 51.47% 78.04% American Indian or Alaska Native 75% 36.6% 78.06% Asian 100% 24.19% 93.32% Filipino 100% 73.68% 93.22% Hispanic or Latino 93.55% 50.1% 83% Native Hawaiian or Pacific Islander 100% 100% 84.88% White 100% 69.18% 90.52% Two or More Races 0 48.15% 89.32% Socioeconomically Disadvantaged 97.71% 47.52% 77.59% English Learners 100% 32.62% 53.97% Students with Disabilities 100% 26.44% 66.1%
Page 31 of 36
State Priority: School Climate The SARC provides the following information relevant to the State priority: School Climate (Priority 6):
• Pupil suspension rates;
• Pupil expulsion rates; and
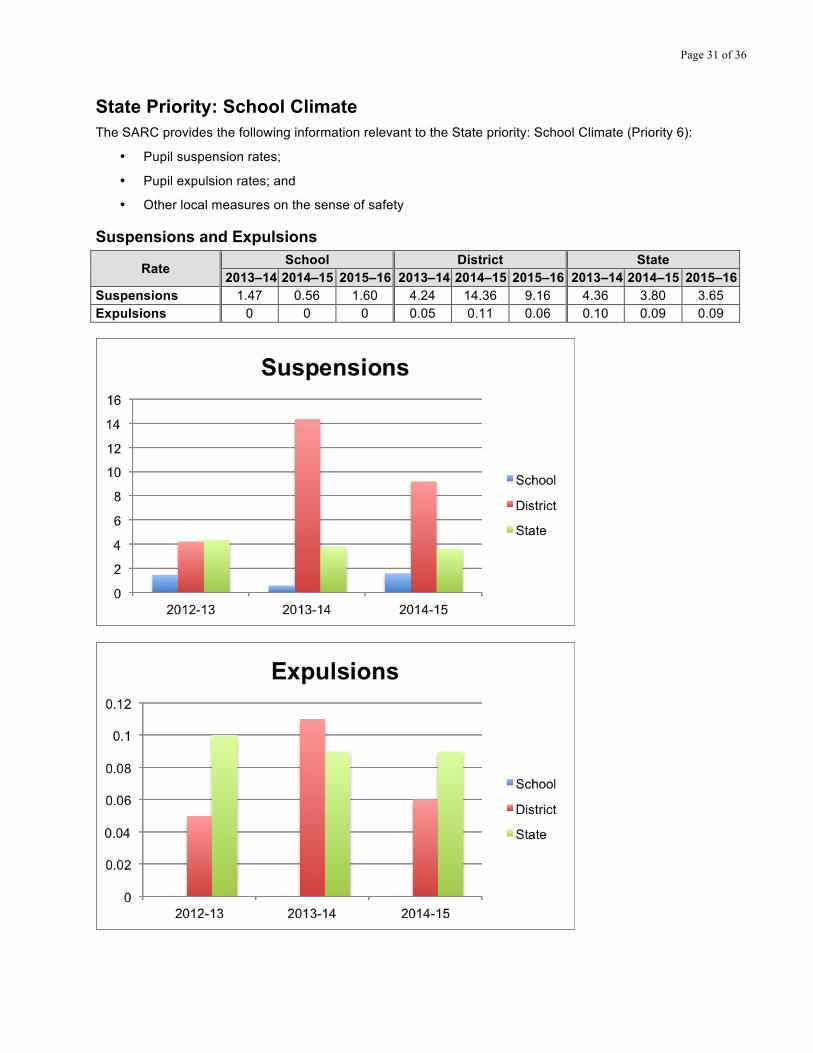
• Other local measures on the sense of safety Suspensions and Expulsions
Rate School District State 2013–14 2014–15 2015–16 2013–14 2014–15 2015–16 2013–14 2014–15 2015–16
Suspensions 1.47 0.56 1.60 4.24 14.36 9.16 4.36 3.80 3.65 Expulsions 0 0 0 0.05 0.11 0.06 0.10 0.09 0.09
Page 32 of 36
School Safety Plan (School Year 2016–17) All County Operated Schools and Programs (COSP) school sites have a comprehensive school safety plan in accordance with the Safe Schools policy, which includes a specific emergency operations plan. In compliance with SB 187, the plan is reviewed and revised annually for each school site. Site safety plans are aligned with the National Incident Management System (NIMS) and California Standardized Emergency Management Systems (SEMS) utilizing Incident Command System (ICS). Each document is prepared for the use of employees at a specific school site in the event of an emergency, disaster, or crisis situation.
At the beginning of each school year, COSP school site staff update their site specific Emergency Plan. The site specific Emergency plan includes the site safety plan, San Joaquin County Office of Education's Disaster Plan, updated site maps/evacuation routes, and Emergency Medical Services Authority, EMSA emergency first aid guidelines of California Schools. Schools are issued first aid kits and “grab and go” emergency packs in the event of an evacuation. The school nurse collaborates with parents/guardians of students with special needs in order to provide medical emergency kits in accordance with their Individualized School Health Plan, ISHP. A copy of the Emergency Plan binder is housed at the school site and the COSP Director's office and is available for parent/guardian review.
COSP also collaborates with community agencies that focus on violence prevention and who provide direct services to students/families; i.e. mental health clinicians, Child Abuse Prevention Council, Fathers, Families, Peacekeepers.
ALICE (Alert, Lockdown, Inform, Counter, Evacuate) training was provided for all Administrative, Support and Teaching staff at the beginning of the 2015-2016 school year. Annual professional development is offered in managing assaultive behavior, mental health first aid, and classroom management skill building.
The counseling staff creates a crisis file and provides on-line resources for every teacher in the program. Teachers are given the file at the beginning of the year, along with instructions on how they are to be utilized. The information is reviewed and updated as needed throughout the year. The following information is displayed at each site and is also included in the crisis file:
• Directions to follow in case of an emergency, crisis or injury • COSP Emergency Hotline phone number • A bomb threat checklist • Listing of emergency phone numbers • Tips for de-escalating a conflict • Suicide intervention information, suicide hotline and San Joaquin County Mental Health contact
information • Resource numbers (Runaway hotline, shelter and “safe house” contact numbers, Public Health
immunization and HIV/AIDS information) • Child abuse prevention information • CPS reporting form • State laws pertaining to unlawful conduct and sexual intercourse with a minor • Smoking cessation resource list • Community Resources
In order to promote safety and mitigate negative interactions, students participate in bullying prevention, life skills and positive relationship building activities throughout the school year.

Page 33 of 36
D. Other SARC Information The information in this section is required to be in the SARC but is not included in the state priorities for LCFF. Federal Intervention Program (School Year 2016–17)
Indicator School District Program Improvement Status In PI First Year of Program Improvement 2006-2007 Year in Program Improvement Year 5 Number of Schools Currently in Program Improvement N/A 1 Percent of Schools Currently in Program Improvement N/A 100% Note: Cells with NA values do not require data. Average Class Size and Class Size Distribution (Elementary)
Grade Level
Avg. Class Size
2013–14 Number of Classes*
Avg. Class Size
2014–15 Number of Classes*
Avg. Class Size
2015–16 Number of Classes*
1-20 21-32 33+ 1-20 21-32 33+ 1-20 21-32 33+ K 12.0 2 0 0 15.0 2 0 0 15.0 2 0 0 1 19.0 2 0 0 18.0 2 0 0 20.0 2 0 0 2 19.5 2 0 0 18.0 2 0 0 20.0 2 0 0 3 22.5 0 2 0 22.5 0 2 0 25.0 0 2 0 4 24.5 0 2 0 23.0 0 2 0 25.0 0 2 0 5 25.0 0 2 0 21.0 1 2 0 25.0 0 2 0 6 25.0 0 3 0 22.0 1 8 0 25.0 0 2 0
Other 23.0 0 9 0 23.0 0 9 0 24.0 0 12 0 * Number of classes indicates how many classes fall into each size category (a range of total students per class). Average Class Size and Class Size Distribution (Secondary)
Subject Avg. Class Size
2013–14 Number of Classes*
Avg. Class Size
2014–15 Number of Classes*
Avg. Class Size
2015–16 Number of Classes*
1-22 23-32 33+ 1-22 23-32 33+ 1-22 23-32 33+ English 21.0 8 14 1 21.0 22 13 1 22.0 18 17 1 Mathematics 19.0 18 9 8 20.0 18 14 2 22.0 10 15 2 Science 20.0 7 8 0 20.0 13 11 1 20.0 11 11 0 Social Science 20.0 17 12 11 21.0 23 13 1 23.0 15 17 0 * Number of classes indicates how many classrooms fall into each size category (a range of total students per classroom). At the
secondary school level, this information is reported by subject area rather than grade level.

Page 34 of 36
Academic Counselors and Other Support Staff (School Year 2015–16)
Title Number of FTE* Assigned to School
Average Number of Students per
Academic Counselor Academic Counselor 5.0 323 Counselor (Social/Behavioral or Career Development) 5.0 N/A
Library Media Teacher (Librarian 0.0 N/A Library Media Services Staff (paraprofessional) 0.0 N/A
Psychologist 0.8 N/A Social Worker 0.0 N/A Nurse 0.8 N/A Speech/Language/Hearing Specialist Contracted Service N/A Resource Specialist (non-teaching) Contracted Service N/A Language Development Leader 1 N/A Campus Safety Monitor/Technician 5 323 Note: Cells with N/A values do not require data. * One Full Time Equivalent (FTE) equals one staff member working full time; one FTE could also represent two staff members who each work 50 percent of full time. Expenditures Per Pupil and School Site Teacher Salaries (Fiscal Year 2014–15)
Level Total
Expenditures Per Pupil
Expenditures Per Pupil
(Supplemental/ Restricted)
Expenditures Per Pupil (Basic/
Unrestricted)
Average Teacher Salary
School Site $6,650.0 $6,650.0 $0.0 $64,112 District N/A N/A $0.0 $64,112 Percent Difference – School Site and District -- -- 0.0% 0.0%
State N/A N/A $5,677.0 $0.0 Percent Difference – School Site and State -- -- -- --
Note: Cells with N/A values do not require data. Types of Services Funded (Fiscal Year 2015–16)
The LEA provides programs and supplemental educational services based on students needs.
To be provided by LEA

Page 35 of 36
Teacher and Administrative Salaries (Fiscal Year 2014–15)
Category District Amount
State Average For Districts
In Same Category Beginning Teacher Salary $43,294 -- Mid-Range Teacher Salary $63,723 -- Highest Teacher Salary $84,151 -- Average Principal Salary (Elementary) -- -- Average Principal Salary (Middle) -- -- Average Principal Salary (High) -- -- Superintendent Salary $257,374.00 -- Percent of Budget for Teacher Salaries 12.70% -- Percent of Budget for Administrative Salaries 11.71% -- For detailed information on salaries, see the CDE Certificated Salaries & Benefits Web page at http://www.cde.ca.gov/ds/fd/cs/. Advanced Placement (AP) Courses (School Year 2015–16)
Subject Number of AP Courses Offered*
Percent of Students In AP Courses
Computer Science 0 N/A English 1 N/A Fine and Performing Arts 0 N/A Foreign Language 1 N/A Mathematics 1 N/A Science 3 N/A Social Science 3 N/A All Courses 9 11% Note: Cells with N/A values do not require data. * Where there are student course enrollments of at least one student.
Page 36 of 36
Professional Development – Most Recent Three Years Teachers, Administrators, clerical and other staff members are provided with opportunities to participate in staff development activities that improve and maintain their professional skills. An average of ten school days per year are dedicated to staff development for teachers. New teachers are provided one extra day for orientation, philosophy and school procedures. Recent staff development meetings included activities and discussions surrounding: Schoolwide Learner Outcomes, Testing & Accountability, Education Policy & Administrative Regulation, Technology, Common Core Standards, Innovative teaching tools, Confidentiality, Procedures for dispensing medication, and Medi-cal Administrative Activities (MAA), ALICE training, Odysseyware Online Learning Management System, Pathways Student Information System, Special Education Information System (SEIS). Grade level and academy site meetings are also scheduled monthly to provide staff development, articulation, planning, and collaboration for improving grade level curriculum, content area curriculum, and teaching strategies. Clerical staff meets monthly to ensure communication on upcoming events and for cross training on new and existing procedures. New teachers participate in BTSA.
Most staff members participate in off-site training and conferences. Recent conferences and training include: Writing Across Texts, Multiplication Strategies, Idea for America (The Colonial Williamsburg Official History), AVID Summer Institute (training in strands including AVID Elective, Critical Reading, Mathematics, Writing, and Social Studies), AVID Workshops, Rick Morris Eight Great Ideas, ELD Standards training, Spanish for Teachers, EL Strategies, NGSS Transition training, Lab Safety Certification, Partners to Renew and Improve Math Education (PRIME), Delta Studies Institute Flood Plain and Delta Ecology, STEM Tracts, Opening the World through Nature Journal Curriculum, Teaching Proportional Reasoning, Suicide Prevention, Rick Morris Classroom Management, SLEWS Academy, Odysseyware Training, BTSA Support Provider Training, Teacher Performance Assessment Scoring, Charter Schools Development Annual Conference, and Counselor Summit Conference.
Venture Academy of Family of Schools encourages teachers to earn additional credentials and pursue advanced degrees. Several staff members earned CTEL certification or a Certification of Eligibility for an Administrative Credential. As of 2016, fifteen staff members hold Master’s degrees and one has a doctoral degree. Currently, six staff members are enrolled in Master’s degree programs and three are pursuing doctoral degrees.