Biologically Active Peptides Section of Peptides International ...
Upload
hoangkhanhCategory
view
215download
0
Subscriber access provided by CZECH ACADEMY OF SCIENCES
The Journal of Physical Chemistry B is published by the American Chemical Society.1155 Sixteenth Street N.W., Washington, DC 20036Published by American Chemical Society. Copyright © American Chemical Society.However, no copyright claim is made to original U.S. Government works, or worksproduced by employees of any Commonwealth realm Crown government in the courseof their duties.
Article
Computed and Experimental Chemical Shift Parametersfor Rigid and Flexible YAF Peptides in the Solid State
Tomasz Pawlak, Katarzyna Trzeciak-Karlikowska, Jiri Czernek,Wlodzimierz Ciesielski, and Marek Jozef Potrzebowski
J. Phys. Chem. B, Just Accepted Manuscript • DOI: 10.1021/jp2111567 • Publication Date (Web): 12 Jan 2012
Downloaded from http://pubs.acs.org on January 17, 2012
Just Accepted
“Just Accepted” manuscripts have been peer-reviewed and accepted for publication. They are postedonline prior to technical editing, formatting for publication and author proofing. The American ChemicalSociety provides “Just Accepted” as a free service to the research community to expedite thedissemination of scientific material as soon as possible after acceptance. “Just Accepted” manuscriptsappear in full in PDF format accompanied by an HTML abstract. “Just Accepted” manuscripts have beenfully peer reviewed, but should not be considered the official version of record. They are accessible to allreaders and citable by the Digital Object Identifier (DOI®). “Just Accepted” is an optional service offeredto authors. Therefore, the “Just Accepted” Web site may not include all articles that will be publishedin the journal. After a manuscript is technically edited and formatted, it will be removed from the “JustAccepted” Web site and published as an ASAP article. Note that technical editing may introduce minorchanges to the manuscript text and/or graphics which could affect content, and all legal disclaimersand ethical guidelines that apply to the journal pertain. ACS cannot be held responsible for errorsor consequences arising from the use of information contained in these “Just Accepted” manuscripts.
Computed and Experimental Chemical Shift Parameters for
Rigid and Flexible YAF Peptides in the Solid State
Tomasz Pawlak1, Katarzyna Trzeciak-Karlikowska1, Jiri Czernek2, Wlodzimierz Ciesielski1 and Marek J. Potrzebowski1*.
AUTHOR ADDRESS
1) Polish Academy of Sciences, Centre of Molecular and Macromolecular Studies, Sienkiewicza 112, PL-90-363 Lodz, Po-land.
2) Academy of Science of the Czech Republic, Institute of Macromolecular Chemistry, Heyrovsky Square 2, CZ-16206 Praha 6, Czech Republic
KEYWORDS. Solid State NMR, DFT GIAO, DFT ONIOM, Dynamic disorder, pseudopotentials, peptides
ABSTRACT: DFT methods were employed to compute the 13C NMR chemical shift tensor (CST) parameters for crystals of YAF peptides (Tyr-Ala-Phe) with different stereochemistry for the Ala residue. Tyr-D-Ala-Phe 1 crystallizes in the C2 space group while Tyr- L-Ala-Phe crystallizes in either the P21212 space group (2a) or the P65 space group (2b). PISEMA MAS measurements for samples with a natural abundance of 1H and 13C nuclei and 2H QUADECHO experiments for samples with deuterium labeled aro-matic rings were used to analyze the geometry and time scale of the molecular motion. At ambient temperature, the tyrosine ring of sample 1 is rigid and the phenylalanine ring undergoes a π-jump, both rings in sample 2a are static, and both rings in sample 2b undergo a fast regime exchange. The theoretical values of the CST were obtained for isolated molecules (IM) and clusters employ-ing the ONIOM approach. The experimental 13C δii parameters for all of the samples were measured via a 2D PASS sequence. Sig-nificant scatter of the computed versus the experimental 13C CST parameters was observed for 1 and 2b, while the observed corre-lation was very good for 2a. In this report, we show that the quality of the 13C σii/
13C δii correlations, when properly interpreted, can be a source of important information about local molecular motions.
Introduction
The nuclear magnetic resonance (NMR) chemical shift (CS) is one of the most important structural parameters that can be obtained from the spectroscopic methods.1,2 The CS is very useful in structure analysis, because it provides insight into the underlying mechanism of nuclear shielding including the dependence on molecular conformational changes and intra-(inter)molecular interactions, such as hydrogen bonding and aromatic-aromatic interactions as well as the ionization state.3 The power of NMR spectroscopy is due to the ability to use this technique with all kinds of materials including gases, liquids, solids and semi-solids. For gas and solution-state NMR, the assignment of chemical shifts to molecular structures can be performed by employing one dimensional and/or two-dimensional experiments, examination of empiri-cal tables of chemical shifts or application of quantum me-chanics (QM) methods, which are currently used to calculate the CS for nuclei in a variety of molecules.4,5 At the begin-ning of development QM methods, the methods based on semi-empirical, ab inito or DFT (density functional theory) approaches have remained qualitative in their prediction of experimental data.6,7 With recent progress in quantum me-chanics calculations, the accuracy of computed nuclear shielding parameters for gases and liquids with respect to experimental data is excellent in many cases.8 For the solid matter, the assignment of CS parameters is more complex, because the number of so-called “solid state effects”, such as intermolecular contacts, molecular disorder, presence of
polymorphs, etc., play a significant role.9 Another factor that can greatly complicate calculation of the chemical shift pa-rameters is the molecular dynamics in the solid state. Re-cently, this problem was exhaustively discussed by several authors.10 Dumez and Pickard, who employed well-defined crystalline organic solids, have tested the influence of mo-lecular motion on the quality of theoretical data using den-sity functional theory calculations performed within the plane-wave pseudopotential framework.11 In the cited work, the influence of motional effects was assessed by averaging over the vibrational modes or over snapshots taken from ab
initio molecular dynamics simulations. A similar approach was recently applied by Vendruscolo and coworkers, who showed that molecular motion has a great influence on the accuracy of chemical shift calculations when using the gauge including projector augmented wave (GIPAW) method, which accounts for the periodic nature of the crystal struc-ture.12 This effect was discussed for N-formyl-L-methionyl-L-leucyl-L-phenylalanine-OMe (MLF), which is a relatively rigid peptide system that has been very well characterized experimentally by XRD and has been used to develop of number of solid-state NMR techniques. The role of small-amplitude motion, its influence on 13C chemical shielding tensors and quality of DFT calculations was recently re-ported by Geppi and coworkers.13
The challenge for modern QM methodology is the correla-tion of experimental and theoretical NMR chemical shift parameters for solid-state systems with large amplitude mo-
Page 1 of 12
ACS Paragon Plus Environment
The Journal of Physical Chemistry
123456789101112131415161718192021222324252627282930313233343536373839404142434445464748495051525354555657585960

2
lecular motions. For several reasons, peptides appear to be good candidates for such projects. It is well known that pep-tides are relatively small biological entities (compared to proteins or nucleic acids). In physiological environments, they are flexible molecules with molecular flexibility en-coded in their primary structure. Flexibility is required to perform their natural biological functions and to control processes, such as molecular recognition, ligand binding and catalysis.
In this work, we present a detailed analysis of the structure and molecular dynamics in the crystal lattice of YAF (Tyr-Ala-Phe) peptides with varying alanine residue stereochemis-try (L and D) and comparison of experimentally measured chemical shift parameters with computed NMR data. Such models can be further used for developing of more advanced QM methodologies implementing large amplitude motions.
NH2
NN
OH
OH
O
H O
H O
(C11)
(C15)
(C12)
(C13)
(C18)
(C17)
(C16)(C14)
(C22)
(C36)
(C37)
(C21)(C10)
(C35)
(C34)
(C31)
(C32)
(C33)
(C38)
(C30)
(C20)
Scheme 1. Molecular structure and numbering system of YAF.
Tyr-D-Ala-Phe (Scheme 1) is a message sequence of deltor-phin I (Tyr-D-Ala-Phe-Asp-Val-Val-Gly-NH2), deltorphin II (Tyr-D-Ala-Phe-Glu-Val-Val-Gly-NH2), and dermorphin (Tyr-D-Ala-Phe-Gly-Tyr-Pro-Ser-NH2), which are opioid peptides extracted from the skin of South American frogs.14 The presence of D-amino acid is crucial for biological activ-ity. It is interesting to note that heptapeptides consisting of L-alanine are not analgesics.15 Analysis of the influence of stereochemistry on molecular packing, dynamics and bio-logical functions of neuropeptides is still challenging not only for theoretical chemistry (e.g., QM calculations) but also for practical applications (e.g., design of new selective pain killers).
Experimental
NMR
The solid-state magic angle spinning (MAS) experiments were performed on a BRUKER Avance III 400 spectrometer at a frequency of 100.613 MHz for 13C equipped with a MAS probe head using 4 mm ZrO2 rotors. A sample of gly-cine was used to set the Hartmann-Hahn condition, and gly-cine was used as a secondary chemical shift reference δ=176.04 ppm from the external TMS.16 The conventional spectra were recorded with a proton 90° pulse length of 4 µs and a contact time of 2 ms. The repetition delay was 6 s, and the spectra width was 25 kHz. The FIDs were accumulated using a time domain size of 2 K data points. The RAMP shape pulse17 was used during the cross-polarization and TPPM decoupling18. The spectral data were processed using
the TOPSPIN program.19 The 61.42 MHz 2H NMR spectra were recorded employing a quadrupole echo pulse sequence without sample spinning and a 90° pulse length of 3 µs.
For the PISEMA MAS experiment20, the 1H effective field strength was 50 kHz in all of the experiments, and the 13C spin-lock field strengths was adjusted to the first-order side-band condition, ω13C= ω1Heff ± ωr. The spinning speed was 13 kHz and was regulated to ± 3 Hz by a pneumatic control unit. Recycle delays varied from 1.5 s to 4 s. The 2D PISEMA MAS experiments incremented the SEMA contact time at a step of 16.28 µs. At a spinning speed of 13 kHz, the dwell time for the evolution period was 19.23 µs. The maximum t1 evolution time was typically approximately 1 ms. Only cosine-modulated data were collected. Thus, a real Fourier transformation was performed on the t1 data yielding spectra with a symmetrized ω1 dimension and showing the dipolar splittings. Because the t1 time signal increases with increasing SEMA contact time, the ω1 dimension was proc-essed using the baseline correction mode “qfil” in the TOPSPIN software, which subtracts a constant intensity from the time signals prior to the Fourier transformation yielding spectra free of a dominant zero-frequency peak giv-ing the 1H-13C doublet.
A 5-π pulse 2D PASS scheme and 1000 Hz sample spinning speeds were used in the 2D experiments. The π-pulse length was 8 µs. Sixteen t1 increments using the timings described by Levitt and co-workers were used in the 2D PASS experi-ments.21 For each increment, 360 scans were accumulated. Because the pulse positions in the t1 set return to their origi-nal positions after a full cycle and the t1-FID forms a full echo, the 16-point experimental t1 data were replicated to 256 points. After the Fourier transformation in the direct dimension, the 2D spectrum was sheared to align all side bands with the center bands in the indirect dimension of the 2D spectrum. One-dimensional CSA spinning sideband pat-terns were obtained from t1 slices taken at the isotropic chemical shifts in the t2 dimension of the 2D spectrum. The magnitudes of the principal elements of the CSA tensor were obtained from the best-fit simulated spinning sideband pat-tern. Simulations of the spinning CSA sideband spectra were performed on a PC using the Topspin program.
QM Calculations
The quantum chemical calculations were performed using Gaussian09.22 For the calculations, the scf=tight keyword was employed (i.e., convergence to 10-8 for the energy and to 10-6 for the density matrix). An ultrafine grid with 75 radial shells and 302 angular points has been employed. The calcu-lations were performed without any symmetry restrictions.
DFT calculations for the Isolated Molecules (IMs) of 1, 2a
and 2b. The starting structures for the geometry optimiza-tions were the X-ray geometries (CCDC codes 222456, 720511 and 720512).23,24 The B3LYP25,26 method has been used with the Pople 6-311G** basis set27,28,29 for optimiza-tion of the proton positions only. All of the calculations were performed for a single in vacuo molecule. The optimized geometries were used to calculate the nuclear magnetic shielding by means of DFT using the gauge including atomic
Page 2 of 12
ACS Paragon Plus Environment
The Journal of Physical Chemistry
123456789101112131415161718192021222324252627282930313233343536373839404142434445464748495051525354555657585960

3
orbitals (GIAO) method.30 We used the hybrid functional PBE031,32 with the 6-311++G** basis set.
DFT calculations for clusters of 1, 2a and 2b employing the
ONIOM approach.33 To reduce the computational time, the ONIOM method as programmed in the Gaussian 2009 com-puter program was employed for calculation of the clusters. ONIOM divides the system into three segments, which can be treated at different levels of calculational complexity. Therefore, one can treat the critical part of the system at a high level, while the less critical parts of the system might be calculated at a medium or low level. For this study, we used two ONIOM levels (i.e., high and low). The part of the sys-tem treated with the high level included molecules from the independent part of the unit cell (one molecule of YAF for the 1 and 2a structures and two molecules of YAF for the 2b structure). The part of system treated with the low level in-cluded molecules of the YAF peptide that exhibit short co ntacts to atoms from the high-level part of the system (short contacts observed in the X-ray structures). The clusters em-ployed for the calculations are presented in the supplemen-tary materials. For optimization of the proton coordinates we used a two layer ONIOM with the DFT hybrid functional B3LYP and the 6-311 basis set for the high layer and a mo-lecular mechanics methods with an universal force field (UFF).34 For the GIAO NMR calculations of all of the cases, we used the B3LYP functional and the 6-311++G** basis sets as the high layer and UFF molecular modeling as the low layer.
NMR chemical shifts. The choice of the reference compound can partially eliminate systematic errors in the DFT calcula-tions of the chemical shifts35. In this study, one reference
compound could not be selected for all molecular structures. Therefore, we have calculated the chemical shifts using the equation δi = ∆SF − σi where ∆SF is the scaling factor deter-mined from correlation between the experimental δiso and the theoretical σiso parameter and minimization of the RMSD value. The same ∆SF value was used to recalculate σii onto δii parameters. Linearization was performed separately for each of the three molecules in this study.
Results and Discussion
i) Assignment of isotropic chemical shifts to molecular structure of 1, 2a and 2b by means of GIAO DFT calcula-tions.
The X-ray data for Tyr-D-Ala-Phe (1) and two forms of Tyr-L-Ala-Phe (2a and 2b) have been previously reported.23,24 Figure 1 shows the molecular structure of the peptides, the unit cells are displayed in Figure 2.
For sample 1, the crystal system is monoclinic with a space group of C2. The unit cell contains four molecules with lat-tice parameters of a=23.091(5) Å, b= 5.4940(10) Å and c =
17.510(4) Å.
Sample 2a crystallizes in the orthorhombic system with P21212 space group. The unit cell contains four molecules, and its lattice parameters are as follow; a = 8.653(2) Å, b = 5.5238 (1) Å and c = 39.737(8) Å. Sample 2b crystallizes in the hexagonal system with P65 space group. The unit cell contains twelve molecules, and its size is much larger com-pared to 2a; a = 11.946(2) Å, b = 11.946(2) Å and c = 54.991(11) Å.
Figure 1. Molecular structures of tripeptide A) sample 1, B) sample 2a and C) sample 2b with ellipsoids at 50% probability.
Figure 2. Unit cells containing A) four molecules of tripeptide 1, B) four molecules of tripeptide 2a and C) twelve molecules of tripeptide 2b.
Page 3 of 12
ACS Paragon Plus Environment
The Journal of Physical Chemistry
123456789101112131415161718192021222324252627282930313233343536373839404142434445464748495051525354555657585960

The 13C CP/MAS spectra of 1, 2a and 2b recorded with a spinning rate of 8 kHz at ambient temperature are shown in Figure 3. It is worthy to note that for sample 2b two crysta-lographically nonequivalent molecules in the asymmetric unit of the crystal structure are magnetically equivalent. Due to this effect and molecular dynamics for 2b we observed spectra as in case of samples with one molecule in the asymmetric unit. The assignment of the 13C isotropic signals was performed via theoretical calculations. Many methods are currently available for computing NMR parameters. In most of the commonly used approaches, GIAO (gauge-including atomic orbitals) with DFT (density functional the-ory) hybrid functionals are employed.36 In the absence of dynamical disorder, this strategy can be expected to predict the tensor components within ten ppm from their experimen-tal counterparts.37 Since ab-initio and DFT calculations for large complexes are still very time consuming, the proper choice of the method and the basis set is crucial to maintain-ing a balance between the quality of results and the cost.
Figure 3. 13C CP/MAS spectra of A) 1, B) 2a, and C) 2b struc-tures.
In the current project, in order to have a full set of data for the 1, 2a, and 2b samples we performed DFT GIAO compu-tations for isolated molecules (IMs) and appropriate clusters (ONIOM approach) employing our previously reported strat-egy.38 The calculated NMR shielding parameters are attached as supporting data.
Fig. 4 shows plots of the isotropic values of the 13C chemical shifts as a function of the computed shielding parameters.
From inspection of the data, a good correlation between the experimental and calculated data is observed. By comparing the slope and fitting quality (R2) of the correlation functions, it may be concluded that both methods yielded acceptable results. For sample 1 and 2b, the intercepts for the clusters (ONIOM approach) are comparable, while for 2a, the inter-cept was lower compared to the IM calculations. For ONIOM, their values are in the range of 184.8-187.4 ppm. For the IM approach, the intercepts are in the range of 185.6-204.1 ppm. In particular, this value is overestimated for sample 2a (Figure 4b).
ii) 13C 2D PASS analysis of the CST parameters for 1 and 2. Correlation of experimental and calculated data.
Chemical shift tensor (CST) parameters can be obtained from analysis of the static line shape of 13C nuclei. Static CST principal component measurements can be only used with simple molecules or simple labeling schemes because of spectral overlap and also suffer from sensitivity issues in natural abundance systems, while 1D CP/MAS methods also suffer from similar limitations. This drives the need for 2D NMR techniques in the more complex molecules. 2D NMR methods can be employed to assign the values of the princi-pal elements 13C δii (ii = 11, 22, 33) of the chemical shift tensor (CST) that define the line shape. There are several approaches that allow the separation of the isotropic and anisotropic portions of the spectra for heavy overlapped sys-tems.39,40,41,42 In this work, we employed the 2D PASS se-quence for analysis of 13C spectra.43 This technique offers good sensitivity compared to other methods and does not require hardware modifications or a special probe head.
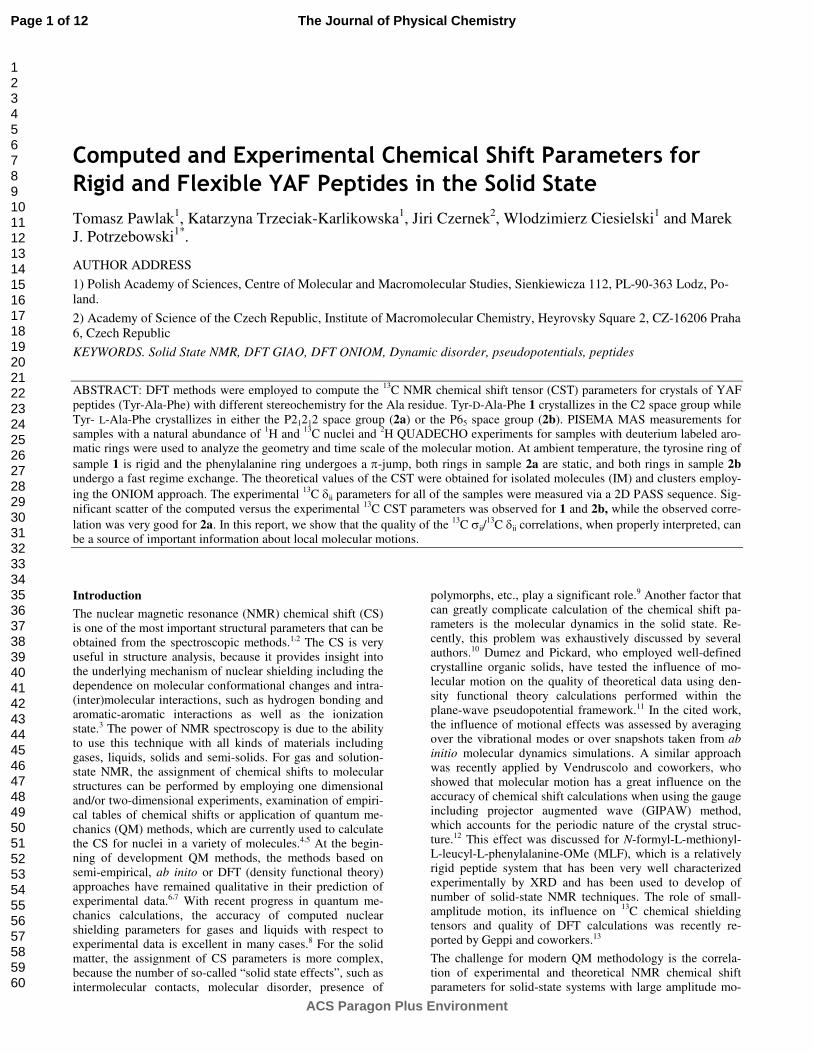
In our previous papers, we reported 13C δii parameters for the aromatic and carbonyl atoms of samples 1 and 2 analyzing 2D PASS spectra recorded at 2 kHz spinning rate.23,24 Be-cause the anisotropy of aliphatic carbons is much lower compared to the aromatic and carbonyl carbons, the spinning rate must be in the range of 1.0 – 1.5 kHz to obtain sufficient number of spinning sidebands for simulation. Figure 5 dis-plays the 2D PASS spectrum of 2a measured with a sample rotation 1 kHz. A similar procedure was employed to study 1
and 2b. The spectrum exhibits a complex pattern under slow sample spinning. Using proper data shearing (Figure 5B), it is possible to separate the spinning sidebands for each car-bon and to use a calculational procedure to establish the 13C δii parameters
Figure 4. Correlation of the experimental isotropic chemical shift values (δ) as a function of the calculated isotropic nuclear shielding (σ) using IM (blue) and ONIOM (green) data for A) sample 1, B) sample 2a and C) sample 2b.
Page 4 of 12
ACS Paragon Plus Environment
The Journal of Physical Chemistry
123456789101112131415161718192021222324252627282930313233343536373839404142434445464748495051525354555657585960
5
Figure 5. 2D PASS spectra for 2a recorded with a spinning rate of 1000 Hz (A) and the aliphatic part of spectrum after data shearing (B).
It is clear from such a presentation that the F2 projection corresponds to the infinite spinning speed spectrum,
whereas F1 represents CSA. For fitting of the spinning side-band pattern of the F1 spectra, we have employed a previ-ously published protocol.23,24 The values of the selected 13C δii parameters for 1 and 2 are presented in Table 1.
Figure 6 shows the correlation between the experimental and calculated shielding parameters obtained employing the DFT GIAO approach for the IMs and clusters (samples 1, 2a, 2b). In contrast to the plots shown in Figure 4, the correlation of the CST parameters was poor, especially for samples 1 and 2b. The scattering of the experimental points is apparent, and the values of the R2 parameters for both methods are lower compared to correlations of the isotropic values. For sample 2a (Figure 6C and Figure 6D), a comparable analysis of the plots indicates a slightly better correlation for the cluster calculation. For ONIOM, the R2 is equal to 0.9877 while, for IM, it is equal to 0.9867. It is interesting to note that, for this sample cluster molecule, correlates well in the region of the δ22 parameters, which are very sensitive to intermolecular contacts (e.g., hydrogen bonding with contribution of C=O peptide groups).44
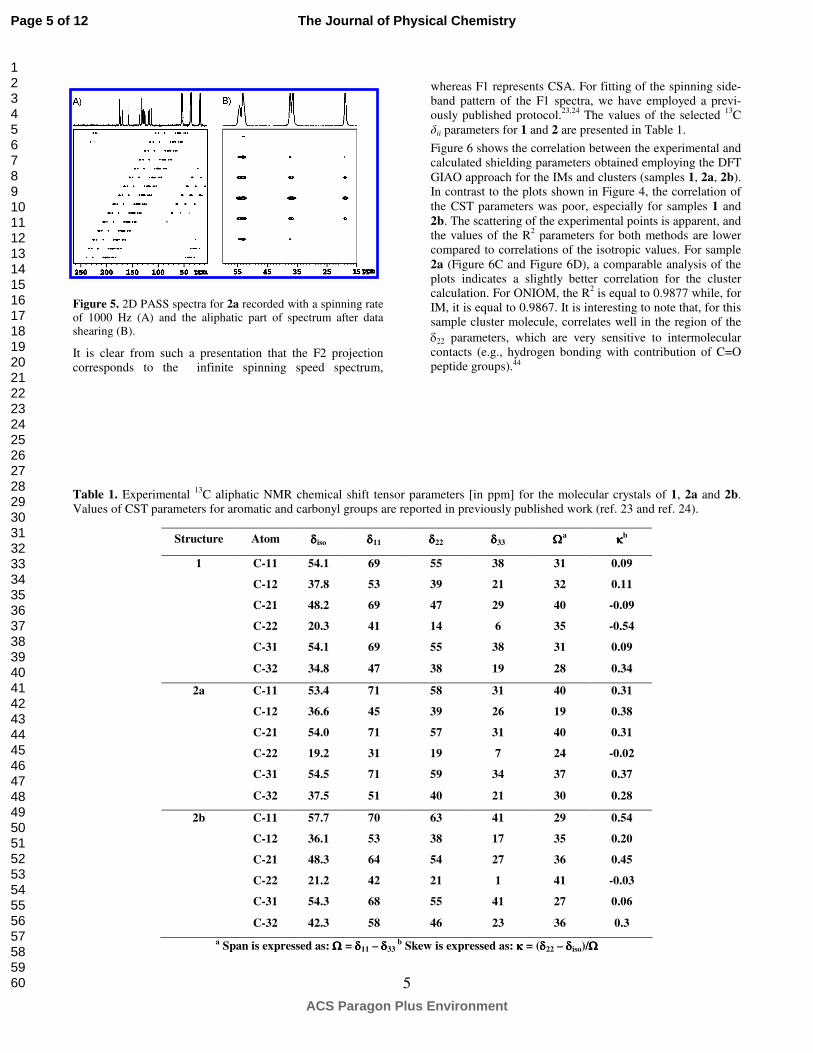
Table 1. Experimental 13C aliphatic NMR chemical shift tensor parameters [in ppm] for the molecular crystals of 1, 2a and 2b. Values of CST parameters for aromatic and carbonyl groups are reported in previously published work (ref. 23 and ref. 24).
Structure Atom δδδδiso δδδδ11 δδδδ22 δδδδ33 ΩΩΩΩa κκκκ
b
1 C-11 54.1 69 55 38 31 0.09
C-12 37.8 53 39 21 32 0.11
C-21 48.2 69 47 29 40 -0.09
C-22 20.3 41 14 6 35 -0.54
C-31 54.1 69 55 38 31 0.09
C-32 34.8 47 38 19 28 0.34
2a C-11 53.4 71 58 31 40 0.31
C-12 36.6 45 39 26 19 0.38
C-21 54.0 71 57 31 40 0.31
C-22 19.2 31 19 7 24 -0.02
C-31 54.5 71 59 34 37 0.37
C-32 37.5 51 40 21 30 0.28
2b C-11 57.7 70 63 41 29 0.54
C-12 36.1 53 38 17 35 0.20
C-21 48.3 64 54 27 36 0.45
C-22 21.2 42 21 1 41 -0.03
C-31 54.3 68 55 41 27 0.06
C-32 42.3 58 46 23 36 0.3
a Span is expressed as: ΩΩΩΩ = δδδδ11 – δδδδ33 b Skew is expressed as: κκκκ = (δδδδ22 – δδδδiso)/ΩΩΩΩ
Page 5 of 12
ACS Paragon Plus Environment
The Journal of Physical Chemistry
123456789101112131415161718192021222324252627282930313233343536373839404142434445464748495051525354555657585960

6
Figure 6. Correlation of experimental chemical shift tensor values (δii) and calculated nuclear shielding parameters (σii) of the YAF pep-tides using IM A) 1, C) 2a and E) 2b as well as ONIOM B) 1, D) 2a and F) 2b.
The plot of the experimental and calculated span values (Ω = δ11 − δ33) for all of the studied samples is displayed in Figure 7. For an ideal correlation, the slope is equal to 1 (represented by solid line in Figures). For sample 1 and 2b, both DFT GIAO calculations (IM, ONIOM) provide a simi-lar set of data. It is apparent that the experimental span val-ues for the phenyl ring of 1 represented by C34, C35 and C37, C38 as well C33, C36 carbons do not fit the calculated data (Figure 7A). The correlation for 2a (Figure 7B) is much better, and the scattering of the experimental data points is not considerable. In contrast, the distribution of the experi-mental points, for sample 2b shown in Figure 7C, is signifi-cant. The most spread out points represent aromatic rings of the phenylalanine and tyrosine. It has to be stressed that, for the other carbons in the side groups and main skeleton, the correlation of Ωexp and Ωcalc is relatively good.
To visualize the supra effect, we compared the static 13C line shapes sketched with the δii parameters obtained from the 2D PASS experiment with the line shapes drawn using the cal-
culated σii shielding parameters obtained from the ONIOM method (Figure 8).
The left, middle and right column of Figure 8 represent YAF 1, 2a and 2b, respectively. The solid black lines represent the experimental spectra, and the red broken lines display the calculated spectra. It is apparent from analysis of the static line shapes that, for sample 1, the correlation for the tyrosine ring is good, while that for the phenylalanine ring the, calcu-lated line shape is dramatically different compared to the experimental spectrum (Figure 8B). For the other aliphatic signals, the correlation between the experimental and calcu-lated spectra is acceptable even though the calculated σii values appear to be underestimated for the CH carbons. For sample 2a (middle column), there is good correlation be-tween the experimental and calculated line shapes, both in aromatic and aliphatic regions. In contrast, for sample 2b (right column), only the aliphatic carbons correlate well, while there is no correlation for the aromatic groups (i.e., tyrosine (Figure 8K) and phenylalanine (Figure 8L) rings).
Page 6 of 12
ACS Paragon Plus Environment
The Journal of Physical Chemistry
123456789101112131415161718192021222324252627282930313233343536373839404142434445464748495051525354555657585960

Figure 7. Correlation between the experimental span (Ωexp.) and calculated span values (Ωcalc.) using DFT GIAO IM and ONIOM method-ology for A) sample 1, B) sample 2a and C) sample 2b. Blue diamonds represents IM data and the green triangles represent the ONIOM data. Solid lines indicate ideal correlation with a slope equal to 1.
Figure 8. Correlation static experimental and computed CSA line shape for sample 1 (left column), 2a (middle column) and 2b (right col-umn). Black solid line - experimental, red dashed line - theory.
Our study clearly proves that the lack of correlation in some cases does not indicate weakness of the theoretical approach but is related to the nature of the systems under investiga-tion. The discrepancy between the experimental and calcu-lated 13C CST parameters for selected groups of carbon sig-nals suggests that there is a variation in the flexibility of the side chains and rigid backbone of the studied peptides. This problem is discussed in detail in the following sections.
iii) PISEMA MAS study of the molecular dynamics.
The preliminary results regarding the distinct dynamics of the YAF peptides were obtained using dipolar recoupling experiments, which are well suited for simultaneously meas-uring motional averaging at multiple sites in bio-molecules.45,46,47 In the two-dimensional (2D) experiments, the separated local field sequences can reintroduce dipolar anisotropic interactions and correlate them to the isotropic chemical shifts.48 The Lee–Goldburg cross-polarization
Page 7 of 12
ACS Paragon Plus Environment
The Journal of Physical Chemistry
123456789101112131415161718192021222324252627282930313233343536373839404142434445464748495051525354555657585960

- 8 -
(LGCP)49,50,51 and polarization inversion spin exchange at the magic angle (PISEMA)52 pulse sequences were recently used to correlate the motional average anisotropic dipolar interac-tions with high-resolution chemical shift dimensions during MAS in the 2D approach. For analysis of the effect of mo-lecular motion on the line shape of the dipolar spectra, we have employed a modified sequence of PISEMA MAS as reported by Dvinskikh et al.19
Figure 9 shows the 2D PISEMA MAS spectra for sample 1 and 2a recorded with a spinning rate of 13 kHz at ambient temperature. The 1H effective field strength, ω1Ηeff, was held constant, while the 13C spin-lock field strength was matched using ω1Ηeff ± ω13C = nωr (n= 1, -1). The SEMA contact time was incremented asynchronously with rotation to yield the heteronuclear dipolar dimension of the 2D experiment. The 13C spin isotropic chemical shift was detected in the second dimension of the experiment.
Figure 9. 2D PISEMA MAS overlapped spectra for sample 1 (red color) and 2a (blue color) in the aromatic (left) and ali-phatic regions (right). 1D projection represents sample 2a.
Figure 10 shows the F1 slices for the selected carbon atoms of 1 and 2 with labeled splitting between the singularities of the doublets. These doublets reflect the dipolar coupling between the proton and carbon. For 13C-1H, the rij distance was equal to 1.09 Å, δ the dipolar coupling constant for the rigid-limit is 22.7 kHz according to the following equation.
4 3
20
ij
ji
r
γγ
π
µδ
h−=
The experimental values of the splitting shown in Figure 10 are smaller lower compared to the calculated coupling, be-cause δ is reduced by a scaling factor (sf). As previously demonstrated , the dipolar sf in the PISEMA experiment is very sensitive to the amplitudes of the two RF spin-lock fields as well as the mismatch parameter ∆ = ωeff - ω1S. The discrepancy between the predicted and measured δ values was exhaustively discussed by Fu et al.53 For the PISEMA MAS, the exact Hartmann–Hahn matching condition yields a maximum scaling factor of 0.584 (cos 54.7°). In the case of a mismatch, the scaling factor can be much lower. For the rigid system, the expected value of δ is ca. 13.0 kHz (22.7 kHz ·0.584). Fast molecular motion can reduce the principal component of the dipolar tensor by a factor (S), which is known as the order parameter. The S ranges from 0.5 to 1. The latter value represents a rigid system.
Figure 10. Projection along F1 for selected carbon atoms of A) 1, B) 2a and C) 2b with labeled splitting between the singulari-ties of doublets.
The order parameters related to the dynamic models, includ-ing diffusion in a cone and the three-site hop for aliphatic groups as well two-site jumping or diffusion in a flattened cone that is typical for dynamics of phenyl rings, have been reported.39,54 Inspection of the splitting values shown in Fig-ure 10 clearly indicate distinct molecular motion of aromatic groups. For sample 1, the tyrosine ring is rigid, while the phenylalanine ring undergoes fast molecular motion (split-ting equal to 13.1 kHz and 4.1 kHz). For YAF 2a, both aro-matic rings are rigid, while for 2b, both rings are mobile (splitting equal to 4.1 kHz). In addition, the values for the aliphatic carbons are comparable, which shows that the main skeleton of peptides is rather rigid. The methyl groups for all three samples are undergoing fast molecular motion even though they exhibit slightly different splitting equal to 6.2 kHz (1), 6.2 kHz (2a) and 7.1 kHz (2b).
iv) 2H NMR study of the molecular motion of the phenyl rings for selectively labeled 1 and 2 YAF.
In this section, we report further study of the motion of the phenylalanine and tyrosine rings in the crystal lattice utiliz-ing solid-state 2H NMR spectroscopy. Selectively 2H labeled YAF models used in our study are shown in Scheme 2. Solid-state 2H NMR spectroscopy of the deuterium-labeled samples provided detailed information on the molecular mo-tion in the frequency range of 103 to 106 Hz as well as the characteristics of the motion, such as free rotation or a 180° flipping motion of the phenyl ring about a symmetry axis.55
The molecular motion of the phenyl rings of the Phe residues in the solids has been extensively studied by 2H NMR spec-troscopy for amino acids, polypeptides, and proteins.56,57,58,59. Hiraoki and coworkers exploring the phenyl ring dynamics of poly(L-phenylalanine) as a function of temperature and
Page 8 of 12
ACS Paragon Plus Environment
The Journal of Physical Chemistry
123456789101112131415161718192021222324252627282930313233343536373839404142434445464748495051525354555657585960

- 9 -
echo delay time have revealed that the π-flipping motion is characterized by a fairly broad distribution of correlation times and strongly dependent on the temperature.60 Kamihira et al. have reported detailed analysis of the molecular dy-namics of enkephalin, one of the best-characterized opioid peptides.61 These observations suggest that the degree of motion in the aromatic rings of the phenylalanine and tyro-sine residues strongly depends on the environment of the enkephalin molecules, such as the crystalline packing and the state of the bound solvents.
Figure 11 shows the static 2H NMR spectra for sample 1
(upper row, Figure 11 A), 2a (middle row, Figure 11 B) and
2b (bottom row, Figure 11 C) recorded using a quadrupolar echo pulse sequence with temperatures, as indicated in Fig-ure 11. The experimental spectra for the samples with the deuterium labeled phenylalanine ring are shown in column I, while the experimental spectra for the samples with the la-beled tyrosine ring are shown in column III. Column II and IV show the simulated spectra with the established values of the correlation times (τc) and geometry of the molecular mo-tion. For fitting experimental line shapes for peptides 2a and 2b, a combination of two subspectra with different correla-tion times (τc) was employed.
Scheme 2. Selectively 2H labeled YAF models used in our project A) Tyr-d4-Ala-Phe and B) Tyr-Ala-Phe-d5.
Figure 11. Experimental (column I and III) and simulated (column II and IV) 2H spectra for samples 1, 2a and 2b. The spectra were simu-lated using the EXPRESS 1.062 application performed in the MATLAB R2010b environment and the NMR-WEBLAB V4.3.2 software63. The line shape was apodized by Lorentzian function with line broadening equal to 2 kHz.
Page 9 of 12
ACS Paragon Plus Environment
The Journal of Physical Chemistry
123456789101112131415161718192021222324252627282930313233343536373839404142434445464748495051525354555657585960

We assumed that, in the unit cell containing a number of molecules, some of them could undergo dynamic processes on different time scales. Such phenomenon was experimen-tally illustrated by Torchia and coworkers,64 who analyzed the deuterium spectra of methionine to reveal different mo-lecular motions for the two molecules in the asymmetric unit of the crystal lattice.
It is important to note that 2H results are in excellent agree-ment with the PISEMA experiments performed at ambient temperature. Variable temperature 2H measurements prove that the tyrosine and phenylalanine rings in samples 2a and 2b became more mobile with increasing temperature. In con-trast, the aromatic rings of sample 1 preserve their dynamics regime (static tyrosine and π-jumping phenylalanine) in a large range of temperatures.
Conclusions
The X-ray coordinates are often used for structure assign-ment of the chemical shift parameters by employing theoreti-cal methods. With recent progress in QM methodology, the correlations between experimental data and theoretical calcu-lations are generally excellent, which is due to the fact that modern algorithms take into consideration a number of structural parameters (e.g., intra- and intermolecular interac-tions, π-π stacking, lattice periodicity, etc.), which has an influence on the quality of the computed results. Therefore, in the light of recent achievements, there is no surprise that the theoretical data, which did not perfectly fit the experi-mental results, might be a source of frustration for research-ers. In our work we show that in some cases scattering of data should be no matter of worries but rather considered as a source of important structural information.
In this project, we have tested DFT methodology for isolated molecules (IMs) and clusters employing rigid and flexible peptide models with large-scale amplitude motions in the crystal lattice. For rigid system, ONIOM is slightly better than IM in its ability to reproduce experimental chemical shift parameters, especially for those centers that contributed to intra- and/or intermolecular contacts. Both methods are not able to reproduce the shielding parameters for systems under a dynamic regime.
Finally, we wish to highlight the attractiveness of YAF pep-tides as testing samples for development of solid-state NMR methodologies and, in particular, for those sequences that are sensitive to large scale molecular dynamics in the solid state as well as challenging samples for theoretical calculation of NMR shielding.
ASSOCIATED CONTENT
Supporting Information.
This material is available free of charge via the Internet at
http://pubs.acs.org.
AUTHOR INFORMATION
Corresponding Author
Marek J. Potrzebowski, E-mail: [email protected]
ACKNOWLEDGMENT
The authors are grateful to the State Committee for Scientific Research (MIiN) for financial support, Grant No. N N204 131335. This work was partially supported by the Ministry of Education, Youths and Sports of the Czech Republic (MŠMT 2B08021). The computational resources were par-tially provided by the Polish Infrastructure for Supporting Computational Science in the European Research Space (PL-GRID) and under the program "Projects of Large Infrastruc-
ture for Research, Development, and Innovations"
LM2010005.
REFERENCES
(1) Abragam, A. The Principles of Nuclear Magnetism, Claderon Press 1994
(2) a) Levitt, M. H. Spin Dynamics: Basics of Nuclear Magnetic
Resonance, Wiley, 2007, b) Jacobsen, N. E. Simplified Theory, Applications and Examples for Organic Chemistry
and Structural Biology, Wiley, 2007
(3) Friebolin H. Basic One- and Two-Dimensional NMR
Spectroscopy, Wiley VCH Verlag GmbH, 2004
(4) Jackowski, K.; J. Mol Struct. 2006, 786, 215-219
(5) Casabianca, L. B.; Dios, D.; Angel, C. J. Chem. Phys. 2008, 128, 052201 and references cited therein
(6) Grant, D. M.; Facelli, J. C.; Alderman, D. W.; Sherwood, M. H.; Tossell, J. A. Nuclear Magnetic Shielding and
Molecular Structure, Kluwer Academic Publishers, Dordrecht, 1993, p. 367.
(7) Malkin, V. G.; Malkina, O. L.; Eriksson, L. A.; Salahub, D. R.; Seminaro, J. M.; Politzer, P. Modern density functional
theory: a tool for chemistry. Theoretical and Computational
Chemistry, Elsevier, Amsterdam, vol. 2, 1995
(8) a) Facelli, J. C. Prog. Nucl. Magn. Reson. Spectrosc. 2011, 58 , 176-201 b) Saito, H.; Ando, I.; Ramamoorthy, A. Prog.
Nucl. Magn. Reson. Spectrosc. 2010, 57, 181–228, and references cited therein
(9) Orendt A. M.; Facelli J. C. Annu. Rep. NMR Spectros. 2007, 62, 115-178
(10) Robinson, M.; Haynes, P. D. J. Chem. Phys. 2010, 133, 084109
(11) Dumez, J. N.; Pickard C. J.; J. Chem. Phys. 2009, 130, 104701.
(12) De Gortari, I.; Portella, G.; Salvatella, X.; Bajaj, V. S.; van der Wel, P. C.; A, Yates, J. R.; Segall, M. D.; Pickard, C. J.; Payne, M. C.; Vendruscolo, M.; J. Am. Chem. Soc. 2010, 132, 5993–6000,
(13) Carignani E., Borsacchi S., Marini A., Mennucci B., Geppi M. J. Phys. Chem. C 2011, 115, 25023–25029
(14) Erspamer, V;. Int. J. Dev. Neurosci. 1992, 10, 3–30.
(15) Jilek, A.; Kreil, G. Monatsh. Chem. 2008, 139, 1–5.
(16) Morcombe, C. R.; Zilm, K. W. J. Magn. Reson. 2003, 162, 479-486.
(17) Metz, G.; Wu, X.; Smith, S. O. J. Magn. Reson. Ser. A 1994, 110, 219-227.
Page 10 of 12
ACS Paragon Plus Environment
The Journal of Physical Chemistry
123456789101112131415161718192021222324252627282930313233343536373839404142434445464748495051525354555657585960

(18) Bennett, A. W.; Rienstra, C. M.; Auger, M.; Lakshmi, K. V.; Griffin, R. G. J. Chem. Phys. 1995, 103, 6951.
(19) Topspin, Version 2.1; Germany.
(20) Dvinskikh, S. V.; Sandstrom, D. J. Magn. Reson. 2005, 175, 163-169.
(21) Antzutkin, O. N.; Shekar, S. C.; Levitt, M. H. J. Magn.
Reson., Ser. A 1995, 115, 7-19.
(22) M. J. Frisch, G. W. Trucks, H. B. Schlegel, G. E. Scuseria, M. A. Robb, J. R. Cheeseman, G. Scalmani, V. Barone, B. Mennucci, G. A. Petersson, H. Nakatsuji, M. Caricato, X. Li, H. P. Hratchian, A. F. Izmaylov, J. Bloino, G. Zheng, J. L. Sonnenberg, M. Hada, M. Ehara, K. Toyota, R. Fukuda, J. Hasegawa, M. Ishida, T. Nakajima, Y. Honda, O. Kitao, H. Nakai, T. Vreven, J. A. Montgomery, Jr., J. E. Peralta, F. Ogliaro, M. Bearpark, J. J. Heyd, E. Brothers, K. N. Kudin, V. N. Staroverov, R. Kobayashi, J. Normand, K. Raghavachari, A. Rendell, J. C. Burant, S. S. Iyengar, J. Tomasi, M. Cossi, N. Rega, J. M. Millam, M. Klene, J. E. Knox, J. B. Cross, V. Bakken, C. Adamo, J. Jaramillo, R. Gomperts, R. E. Stratmann, O. Yazyev, A. J. Austin, R. Cammi, C. Pomelli, J. W. Ochterski, R. L. Martin, K. Morokuma, V. G. Zakrzewski, G. A. Voth, P. Salvador, J. J. Dannenberg, S. Dapprich, A. D. Daniels, O. Farkas, J. B. Foresman, J. V. Ortiz, J. Cioslowski, and D. J. Fox, Gaussian, Inc., Gaussian 09, Revision A.02 Wallingford CT, 2009.
(23) Słabicki, M. M.; Potrzebowski, M. J.; Bujacz, G.; Olejniczak, S.; Olczak J. J. Phys. Chem. B 2004, 108, 4535–4545
(24) Trzeciak-Karlikowska, K.; Bujacz, A.; Jeziorna, A.; Ciesielski, W. Bujacz, G. D.; Gajda, J.; Pentak D.; Potrzebowski, M. J. Cryst. Growth Des. 2009, 9, 4051–4059
(25) Becke, A. D. J. Chem. Phys. 1993, 98, 5648-5652.
(26) Stephen, P. J.; Devlin, F. J.; Chabalowski, C. F.; Frisch, M. J. J. Phys. Chem. 1994, 98, 11623.
(27) Hariharan, P. C.; Pople, J. A. Theoret. Chimica Acta 1973, 28, 213-222.
(28) Francl, M. M.; Petro, W. J.; Hehre, W. J.; Binkley, J. S.; Gordon, M. S.; DeFrees, D. J.; Pople, J. A. J. Chem. Phys. 1982, 77, 3654-3665.
(29) Krishnan, R.; Binkley, J. S.; Seeger, R.; Pople, J. A. J.
Chem. Phys. 1980, 72, 650-654.
(30) Helgaker, T.; Jørgensen, P. J. Chem. Phys. 1991, 95, 2595-2601.
(31) Grimme, S. J. Comp. Chem. 2004, 25, 1463-1473.
(32) Ernzerhof, M.; Scuseria, G. J. Chem. Phys. 1999, 110, 5029-5036.
(33) Maseras, F.; Mokomura, K., J. Comput. Chem. 1995, 16, 1170-1179.
(34) Rappe AK, Casewit CJ, Colwell KS, Goddard, WA, Skiff WM, J. Amer. Chem. Soc., 1992, 114, 10024-10035
(35) Van Wuellen, C. Phys. Chem. Chem. Phys. 2000, 2, 2137-2144.
(36) a) Sebastiani, D. Mod. Phys. Lett. B 2003, 17, 1301; (b) Widdifield, C. M.; Schurko, R. W. Concepts Magn. Reson. Part A 2009, 34A, 91 (c) Weber, J., Gunne, J. S. A. D. Phys.Chem. Chem. Phys. 2010, 12, 583-603.
(37) Liu W., Wang W. D., Wang W., Bai S., Dybowski C., J.
Phys. Chem. B 2010, 114 16641−16649
(38) Nowicka K., Bujacz A., Paluch P., Sobczuk A., Jeziorna A., Ciesielski W., Bujacz G. D., Jurczak J.,. Potrzebowski M. J.
Phys. Chem. Chem. Phys. 2011, 13, 6423-6433
(39) Hu, J.; Wang, W.; Liu, F.; Solum, M. S.; Alderman, D. W.; Pugmire, R. J. J. Magn. Reson., Ser. A 1995, 113, 210–222.
(40) Alderman, D. W.; McGeorge, G.; Hu, J. Z.; Pugmire, R. J.; Grant, D. M. Mol. Phys. 1998, 95, 1113–1126;
(41) Frydman, L.; Chingas, G. C.; Lee, Y. K.; Grandinetti, P.J.; Eastman, M. A.; Barral, G. A.; Pines, A. J. Chem. Phys. 1992, 97, 4800–4808;
(42) Kolbert, A. C.; Griffin, R. G. Chem. Phys. Lett. 1990, 166, 87–91.
(43) Antzutkin, O. N.; Shekar, S. C.; Levitt, M. H. J. Magn.
Reson. Ser. A 1995, 115, 7-19.
(44) b) a) Wei, Y.; Lee, D. K.; Ramamoorthy, A. J. Amer.
Chem. Soc. 2001, 123, 6118–6126, c) Birn, J.; Poon, A.; Mao, Y.; Ramamoorthy, A. J. Amer. Chem. Soc. 2006, 126, 8529–8534.
(45) Ladizhansky, V. Solid State Nucl. Mag. 2009, 36, 119-128.
(46) Wylie, B. J.; Rienstra, C. M. J. Chem. Phys. 2008, 128, 052207.
(47) Drobny, G.P.; Long, J.R.; Karlsson, T.; Shaw, W.; Popham, J.; Oyler, N.; Bower, P.; Stringer, J.; Cregory D., Mehta, M. A.; Stayton, P.S.; Annu. Rev. Phys. Chem. 2003, 54, 531-571.
(48) Schmidt-Rohr, K.; Spiess, H. W. Multidimensional Solid-State NMR And Polymers; Academic Press: London, 1994.
(49) Cobo, M. F.; Malinakova, K.; Reichert, D.; Saalwachter, K.; Deazevedo, E. R. Phys. Chem. Chem. Phys. 2009, 11, 7036-7047.
(50) Ladizhansky, V.; Vega, S. J. Chem. Phys. 2000, 112, 7158-7167.
(51) Hong, M.; Yao, X.; Jakes, K.; Huster, D. J Phys Chem B 2002, 106, 7355-7364.
(52) Ramamoorthy, A.; Wei, Y.; Lee, D. K. Annu. Rep. NMR
Spectros. 2004, 52, 1-52.
(53) Fu, R.; Tian, C.; Kim, H.; Smith, S. A.; Cross, T. A. J.
Magn. Reson. 2002, 159, 167–174
(54) Lorieau, L. J.; Day, L. A.; McDermott, A. E. Magn. Reson.
Chem. 2006, 44, 334-347.
(55) Spiess, H. W. Coll. Polym. Sci. 1983, 261, 193-209
(56) Gall, C.M.; Diverdi, J.A.; Opella, S. J.; J. Am. Chem. Soc. 1981, 103, 5039-5043.
(57) Schaefer, J.; Stejskal, E. O.; McKay, R. A.; J. Magn.
Reson. 1984, 57, 85-90.
(58) Frey, M. H.; DiVerdi, J. A.; Opella, S. J. J. Am. Chem. Soc.
1985, 107, 7311-7315.
(59) Hiyama, Y.; Silverton, J. V.; Torchia, D. A.; Gerig, J. T.; Hammond, S. J. J. Am. Chem. Soc. 1986, 108, 2715-2723.
(60) Hiraoki, T.; Kogame, A..; Nishi, N.; Tsutsumi, A. J. Mol.
Struct. 1998, 441, 243-250
Page 11 of 12
ACS Paragon Plus Environment
The Journal of Physical Chemistry
123456789101112131415161718192021222324252627282930313233343536373839404142434445464748495051525354555657585960
(61) Kamihira, M.; Naito, A. ; Tuzi, S.; Saito H. J. Phys. Chem.
A 1999, 103, 3356-3363
(62) Vold, R. L.; Hoaston, G. L. J. Magn. Reson. 2009, 198, 57-72
(63) Macho, V.; Brombacher, L.; Spiess, H. W. Appl. Magn.
Reson. 2001, 20, 405–432
(64) Sparks, S. W.; Budhu, N.; Young, P. E. J. Amer. Chem.
Soc. 1988, 110, 3359-3367
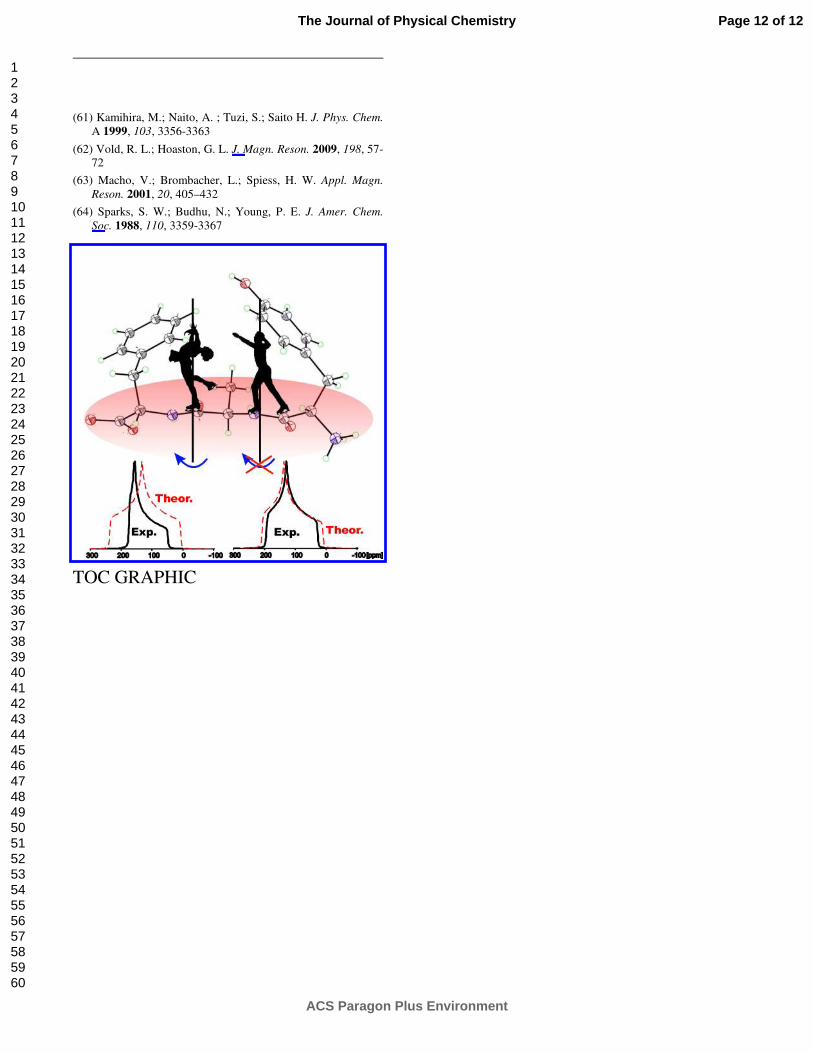
TOC GRAPHIC
Page 12 of 12
ACS Paragon Plus Environment
The Journal of Physical Chemistry
123456789101112131415161718192021222324252627282930313233343536373839404142434445464748495051525354555657585960


![1. Home [forensics.cert.org] · You will need to have YAF start on boot. A sample script is here, place it in /etc/init.d: #!/bin/bash # # yaf€€€€€€€€€€ This shell](https://static.fdocuments.in/doc/165x107/5e3a6d0af23b0832176654ef/1-home-you-will-need-to-have-yaf-start-on-boot-a-sample-script-is-here-place.jpg)