For Review Only - University of Toronto T-Space · · 2017-06-12For Review Only Spectroscopic...
24
For Review Only Spectroscopic Analysis of CdCl 2 doped PVA-PVP Blend Films Journal: Canadian Journal of Physics Manuscript ID cjp-2016-0848.R2 Manuscript Type: Article Date Submitted by the Author: 02-Mar-2017 Complete List of Authors: Baraker, Basavarajeshwari; Karnatak University's Karnatak Science College, Dharwad, Physics Lobo, Blaise; Karnatak University's Karnatak Science College, Dharwad, Physics; Keyword: PVA-PVP blend, Cadmium Chloride, FTIR, Raman, Fluorescence Please Select from this Special Issues list if applicable: N/A https://mc06.manuscriptcentral.com/cjp-pubs Canadian Journal of Physics
Transcript of For Review Only - University of Toronto T-Space · · 2017-06-12For Review Only Spectroscopic...
For Review O
nly
Spectroscopic Analysis of CdCl2 doped PVA-PVP Blend Films
Journal: Canadian Journal of Physics
Manuscript ID cjp-2016-0848.R2
Manuscript Type: Article
Date Submitted by the Author: 02-Mar-2017
Complete List of Authors: Baraker, Basavarajeshwari; Karnatak University's Karnatak Science College, Dharwad, Physics Lobo, Blaise; Karnatak University's Karnatak Science College, Dharwad, Physics;
Keyword: PVA-PVP blend, Cadmium Chloride, FTIR, Raman, Fluorescence
Please Select from this Special Issues list if applicable:
N/A
https://mc06.manuscriptcentral.com/cjp-pubs
Canadian Journal of Physics

For Review O
nly
1
Spectroscopic Analysis of CdCl2 doped PVA-PVP Blend Films
Basavarajeshwari M. Baraker1
and Blaise Lobo1*
1Department of Physics, Karnatak University’s Karnatak Science College, Dharwad 580 001,
Karnataka, India
*E- Mail: [email protected]
Abstract: The changes in molecular chemical structure of polyvinyl alcohol (PVA) and
polyvinyl pyrrolidone (PVP), caused by doping PVA-PVP blend with cadmium chloride
(CdCl2), have been studied using UV-Visible (UV-Vis) spectroscopy, Fourier Transform Raman
spectroscopy and Fourier Transform Infrared (FTIR) spectroscopy. The formation of cadmium
nano-structures and microstructures in CdCl2 doped PVA-PVP blend has been visualized using
Scanning Electron Microscopy (SEM), in the range of doping levels varying from 0.5 wt% up to
10.2 wt% (doping level in weight percentage). The incorporation of dopant in PVA-PVP blend is
confirmed using Energy Dispersive x-ray Spectroscopy (EDS). The optical absorbance (UV-Vis)
spectra of PVA-PVP blend films doped with CdCl2 from 0.5 wt% up to 2.2 wt%, showed a
prominent absorption hump with peak at the wavelength 370 nm, in addition to other
intermediate energy bands caused by the interactions of CdCl2 with molecules of PVA and PVP.
The photo-luminescence (emission/ fluorescence) spectra show significant quenching of
fluorescence in CdCl2 doped PVA-PVP blend films. Analysis of FTIR and Raman spectra
suggest the possible modes of interaction of cadmium ions (Cd2+
) and chlorine ions (Cl-) with
reactive functional groups (C-N, hydroxyl and carbonyl groups) of polymeric molecules in the
blend. A reaction scheme for interaction of CdCl2 with PVA-PVP blend is proposed, on the basis
of spectroscopic studies on these films.
Key words: PVA-PVP blend, Cadmium Chloride, FTIR, Raman, Fluorescence, UV Visible
spectroscopy.
1. Introduction
Experimental studies on the structure and properties of metal salt doped polymeric materials
have assumed importance due to their potential applications (as solid polymeric electrolyte
(SPE)) in batteries, fuel cells, display devices and gas sensors [1-4]. Incorporation of metal salt
in a polymeric system could result in microstructural changes in the host polymer, and
consequently, this affects the physical and chemical properties of the polymeric material.
Researchers have studied the effect of inorganic salts on the microstructure and properties of
hydrophilic polymeric materials [5-8].
Poly vinylalcohol (PVA) is a semi-crystalline polymeric material, whereas polyvinyl
pyrrolidone (PVP) is an amorphous polymeric material. PVA and PVP have been studied
rigorously by many researchers, because they possess desirable properties like water solubility,
Page 1 of 23
https://mc06.manuscriptcentral.com/cjp-pubs
Canadian Journal of Physics

For Review O
nly
2
charge storage capacity and good film formation ability. The use of blending and doping
techniques for preparing a polymeric material usually results in a new material with enhanced
electrical conductivity (due to modified band structure) and changes in other physical properties.
These changes depend on the chemical behavior of the dopant, mainly the way in which it
interacts with polymeric molecules of the host [9, 10]. The doping of metal salts in a polymer
blend is more complicated when compared to that in a homo-polymeric host, because the effect
of dopant ions on each component of the blend needs to be considered. The effect of doping
polymeric blends with different chemical agents (reduction / oxidation agents) has been a matter
of contemporary research interest. In particular, the effects of metal ions on the structure and
properties of polymeric blends have been investigated by several researchers [11-13].
Cadmium chloride (CdCl2) is a hygroscopic, crystalline compound (inorganic metallic
salt) comprising of cadmium (Cd) and chlorine (Cl). It is highly soluble in water. Cadmium has a
significant neutron absorption cross-section, and is useful as a neutron shielding material. Hence,
a polymeric material comprising cadmium salt as a dopant assumes significance as a radiation
shielding material [14, 15]. It is to be noted that certain compounds of cadmium, when added to
plastics (PVC), results in stabilizing (light, heat and weathering stabilization) of the compounded
polymeric material [16]. Also, filling CdCl2 in polyvinyl chloride (PVC) has been shown to
result in degradation of the polymeric material [17, 18].
Significant changes are observed in the microstructure and properties of PVA-PVP
blends doped with CdCl2, the details of which have been published elsewhere [19-21]. At low
concentrations of CdCl2, from 0.5 wt% up to 2.2 wt%, cadmium nano-structures in the form of
nano-spheres and nano-rods are observed in SEM micrographs of the CdCl2 doped PVA-PVP
blend films. At 3.3 wt% doping level, a network of complex structural features is observed. It is
interesting to note that, these nano-structural features hinder the motion of mobile charge carriers
in the polymeric material, and this is manifested as an increase in electrical resistivity of the
sample (observed for doping levels ranging from 0.5 wt% up to 3.3 wt%) [19]. At doping levels
varying from 4.4 wt% up to 7.2 wt%, flower shaped nanostructures are seen in the SEM images.
However, at 10.2 wt% doping level, micro-globules of the dopant are seen in the polymeric host,
which disintegrate at dopant concentration of 12.1 wt%, yielding a homogeneous morphology at
15.5 wt% and above [20]. These changes in micro-structural features (visualized using SEM
images) are accompanied by significant changes in degree of crystallinity of the doped blend, as
evidenced by XRD and DSC scans of the sample (details are presented/ published elsewhere)
[19, 21]. The microstructural analysis of CdCl2 doped PVA-PVP blend films suggests that it can
be used as SPE for films with CdCl2 doping level above 15.5 wt%, when the sample is
completely amorphous. Nanda Prakash et al [22] have suggested that CdCl2 doped PVA is a SPE
which is suitable for energy storage devices (like batteries / fuel cells). The study of AC
conductivity properties of CdCl2 filled PVA-PVP blend by Pandey et al [23, 24] has revealed
that this composite is suitable for application as a SPE, due to its desirable electrical impedance
and conductivity properties.
Page 2 of 23
https://mc06.manuscriptcentral.com/cjp-pubs
Canadian Journal of Physics

For Review O
nly
3
The spectroscopic investigation of CdCl2 doped PVA-PVP blend films will contribute to an
understanding of this doped polymeric system; especially, with regard to chemical structural
changes taking place in molecules of the polymeric blend (PVA and PVP), due to doping (with
CdCl2). Using FTIR spectra and Fourier Transform (FT)-Raman spectra, the fundamental modes
of vibration are observed at different frequencies, due to induced dipole moment and polarization
effect in the material, respectively [25]. In addition, absorbance and photoluminescence spectra
have also been studied, in order to analyze the structural modifications and formation of charge
transfer complexes in the doped polymeric material.
2. Materials and Methods
2.1.Materials
Semicrystalline PVA (1,40,000 molecular weight), amorphous PVP (50,000 molecular weight)
and cadmium chloride monohydrate (CdCl2.H2O) were purchased from HiMedia Laboratories
Pvt. Ltd, Mumbai.
2.2.Sample Preparation
Solution casting method was used in order to prepare CdCl2 doped PVA-PVP blend films. In the
first step, aqueous solutions of PVA-PVP blend were prepared in different beakers. In order to
do this, two grams each of PVA and PVP were taken in each beaker, and the mixture was
dissolved in 100 ml of double distilled water. Translucent, homogeneous solutions of PVA-PVP
blend were obtained, by stirring the mixtures (taken in different beakers) continuously for more
than 24 hours, using magnetic stirrers. The standard solution of CdCl2 was obtained by
dissolving CdCl2.H2O in double distilled water. Different volumes of this standard solution were
added to PVA-PVP aqueous solutions kept ready in different beakers, in order to prepare the
CdCl2 doped PVA-PVP aqueous blend solutions, with doping levels varying from 0.5 wt% up to
21.5 wt%. After doping, contents of the different beakers were stirred in order to get
homogeneous aqueous solutions of the CdCl2 doped PVA-PVP blend. After stirring and filtering,
contents of the beakers were poured into properly labelled glass petridishes, which were then
kept inside an air cooled oven maintained at 40℃ (for evaporation of the solvent). After fifteen
days, dry films were peeled off carefully from the glass substrates and then stored in a desiccator,
in order to avoid absorption of ambient moisture. The CdCl2 doping level (DL) in each film was
calculated using equation (1).
�����%� =�
�� × 100 (1)
In equation (1), �� is the weight of dopant (CdCl2) and �� is the weight of the polymer blend
(PVA+PVP).
Page 3 of 23
https://mc06.manuscriptcentral.com/cjp-pubs
Canadian Journal of Physics

For Review O
nly
4
2.3.Characterization Methods
NXR FT-Raman module spectrometer, at 4 cm-1
resolution, was used to acquire Raman spectra
of the CdCl2 doped PVA-PVP blends films in the wavenumber range 100-3750 cm-1
.
FTIR spectra of CdCl2 doped PVA-PVP blends were recorded in the wavenumber range 400-
4000 cm-1
, using NICOLET 6700 FTIR Spectrometer, by following the potassium bromide
(KBr) pellet method.
3. Results and Discussion
3.1 FT- Raman Spectroscopy
The different modes of molecular vibration, namely, stretching, bending, scissor, twisting and
wagging motions of different molecular groups in CdCl2 doped PVA-PVP blend have been
studied. Raman spectroscopy has been used to study the interaction of cadmium containing
chemical species with PVA [26] and PVP [27]. Raman spectra, at different concentrations
(expressed in weight percentage (wt%)) of CdCl2 in PVA-PVP blend films, are shown in fig. 1.
The inter-molecular and intra- molecular interactions in PVA, PVP and CdCl2 have been
investigated (see fig. 2: interaction/ reaction scheme).
CH2 symmetric stretch:
In the Raman spectra, a sharp peak is observed at 2920 cm-1
(see fig.1a), which is attributed to
CH2 symmetric stretch in the polymer chains. At 0.0 wt% of CdCl2 in PVA-PVP (that is, pure or
un-doped) blend, this peak is at 2921 cm-1
. There is significant variation in peak intensity, rather
than wavenumber, in all doped samples. The decrease in full width at half maximum (FWHM)
of this peak, from doping level 0.5 wt% up to 6.3 wt% is a result of electrical interactions
between hydroxyl (OH) group and carbonyl group (C=O) with Cd2+
and Cl- ions.
C=O stretching
The most prominent vibration in CdCl2 doped PVA-PVP blend films is carbonyl (C=O)
stretching due to both the acetyl group of un-hydrolyzed PVA and carbonyl group in the lactum
ring of PVP. The vibration at 1660 cm-1
is attributed to carbonyl group in PVP, which is
observed as a weak peak in fig.1b. This reveals that PVP is involved in the formation of charge
transfer complexes by transferring electron/ electrons from lactum ring [28] to Cd2+
/ Cl- ions of
CdCl2, (see reaction scheme; Fig. 2 ). Hence, there is an increase in degree of crystallinity of the
doped blend films, from 0.5% up to 6.3%, in the lower dopant concentration region (confirmed
using XRD; details published elsewhere [19]); this is also reflected in the FTIR spectra. The
decrease in FWHM of this peak at lower dopant levels reveals that, since sufficient ions of
dopant (both cations (Cd2+
) and anions (Cl-)) are available in the films to interact with the
electronegative oxygen (O-) and electropositive nitrogen (N
+) atom of PVP and to form nano-
clusters of the dopant in the PVA-PVP matrix. These nanostructures are visualized in the SEM
images of the CdCl2 doped PVA-PVP blend films (see reference [19] and fig. 4 a-e (SEM images
Page 4 of 23
https://mc06.manuscriptcentral.com/cjp-pubs
Canadian Journal of Physics

For Review O
nly
5
inset)). At higher concentration (above 10.2%) of CdCl2 in PVA-PVP blend, there is a significant
decrease in intensity and a shift in wavenumber (refer table.1) due to carbonyl group, which is
because of reduced molecular interactions between CdCl2 and PVA-PVP matrix. The peak at
1730 cm-1
is attributed to carbonyl (C=O) stretching, due to the acetyl group of un-hydrolyzed
PVA.
C-O stretch and CH2 scissor:
In fig.1 (a-b), the peak around 1430 cm-1
is attributed to both C-O stretch and CH2 scissor. The
peaks at 1437 cm-1
and 1436-1444 cm-1
are seen in both pure and doped PVA-PVP blends,
respectively. The intensity of this peak, and the variation of full width at half maximum
(FWHM) of its profile is suggestive of a change in functional group from C=O to C-O in PVP
and acetyl groups of unhydrolyzed PVA by transferring an electron, while interacting with the
dopant ions (see resonance structure in the reaction scheme; Fig. 2).
CH-OH bending and C-H bending:
The just resolved peak at 1360 cm-1
corresponds to C-H bending in pure PVA-PVP blend, and
varies between 1360-1375 cm-1
in CdCl2 doped PVA-PVP samples due to inter/intra molecular
interactions. A shoulder to C-H bending peak is seen at 1300 cm-1
(see fig.1b), which is due to
CH-OH bending in PVA during intra-molecular interactions in PVA and intermolecular
interactions in PVA-PVP blend (see reaction scheme; fig. 2). CH-OH bending is a result of
electrical interactions between Cd2+
/Cl- ions and PVA-PVP polymer matrix [29]. This peak is
observed at 1301 cm-1
in pure PVA-PVP blend, and varies from 1308 cm-1
up to 1317 cm-1
in the
doped samples. The CH-OH bending in CdCl2 doped PVA-PVP is due to formation of charge
transfer complexes (such as, PVA+Cd2+
/Cl-) by intermolecular interactions between PVA-PVP
blend and the dopant (Cd2+
and Cl-) ions.
C-C chain, ring and breathing:
The three different peaks at 750 cm-1
, 848 cm-1
and 920 cm-1
(see fig.1c) are due to C-C chain in
polymer backbone. In doped polymers, the peak frequencies (actually, wavenumbers) vary
between 747-762 cm-1
, 848-854 cm-1
and 923-939 cm-1
. The variation of peak intensity in doped
samples confirms chemical structure modification due to inter/intra molecular interactions
between CdCl2 and PVA/ PVP molecules of the polymeric blend.
LO phonon vibrons (vibrations):
In Raman spectra, a strong peak is observed at frequency 163 cm-1
in CdCl2, and at 179 cm-1
in
pure (un-doped) PVA-PVP blend films. This peak varies in wavenumber, from 179 cm-1
up to
183 cm-1
in CdCl2 doped PVA-PVP blend films. No significant shift in wavenumber is observed,
but increased FWHM of this peak (see fig.1c) is seen from 0.5 wt% up to 6.3 wt%, which
decreases in the samples doped from 10.2 wt% up to 21.5 wt%. This peak is attributed to first
overtone harmonic of longitudinal optical (LO) phonon effect [30]; �LO and �2LO are at 322 cm-1
and 355 cm-1
in pure CdCl2 and pure PVA-PVP blend, respectively. In the case of pure CdCl2,
Page 5 of 23
https://mc06.manuscriptcentral.com/cjp-pubs
Canadian Journal of Physics

For Review O
nly
6
the peak at 220 cm-1
is assigned to Cd-Cl stretching. The peaks due to cadmium and chlorine ions
in PVA-PVP matrix have been assigned [31, 32].
Figure 1: Raman spectra at different concentrations (expressed in weight percentage (wt%)) of CdCl2 in PVA-PVP
blend films. (a) Raman spectra of the CdCl2 doped PVA-PVP blend films in the entire wavenumber range, from 100
cm-1
up to 3750 cm-1
. (b) Raman spectra of the CdCl2 doped PVA-PVP blend films in the wavenumber range of
interest, from 1000 cm-1
up to 2000 cm-1
. (c) Raman spectra of the CdCl2 doped PVA-PVP blend films in the
wavenumber range of specific interest, from 100 cm-1
up to 1000 cm-1
.
1000 800 600 400 200
Ram
an Inte
nsity (a.u
)
Raman shift (cm-1
)
21.5%
15.5%
10.2%
6.3%
5.4%
2.2%
0.5%
0.0%
c)
Page 6 of 23
https://mc06.manuscriptcentral.com/cjp-pubs
Canadian Journal of Physics

For Review O
nly
7
CH CH2
OH
n
CH CH2
OC
O
CH3
n
CHCH2
NO
n
Poly(vinyl alcohol) PVA
Poly(vinyl acetate)
PVAc
Poly(vinyl pyrrolidone)
PVP
C C
H
HH
N
H2C
H2C CH2
C O
H H
C C
H N+
H2C
H2C CH2
C O +-
22 CdCl2
Resonance structure of lactum ring of PVP
C C
H N+
H2C
H2C CH2
C O -
Cl-
Cd2+
CC
H
N+
CH2
CH2H2C
C
H H
Cl-
O -
Cd
Interaction of CdCl2 with PVP
H H
+2e-
C C
H
HH
C
O
+ CdCl2
CH3
O O
C C
H
C
O
CH3
H H
2 2-
Resonance structure of PVAc
O
C C
H
C
O
CH3
H
O
C C
H
C
O
CH3
H H H
Cd2+
- -
Cd
Interaction of CdCl2 with PVAc
2e-
C C
H N +
H2C
H2C CH2
C O -
HH
Cl-
Cd2+
CC
H
N+
CH2
CH2H2C
C
H H
Cl-
O -
Interaction of CdCl2 with PVP
Cd
O
C C
H
C
O
CH3
H
O
C C
H
C
O
CH3
H H H
Cd2+
- -
Cd
Interaction of CdCl2 with PVA/PVAc
C C
H O
H H
C C
H O
H H
H H
- -
+
Cl-2e -
2e -
+
C C
H
O -
+
+H
H
H
C C
H
O -
+H
H
H
CC
H
N+
CH2
CH2H2C
C
H H
O -
PVA-PVP blending
Interactions of CdCl2 with PVA-PVP blend
Figure 2: Reaction schemes, suggesting possible modes of chemical interaction between dopant ions (Cd2+
and Cl-)
and polymer molecules (PVA and PVP molecules), in addition to inter/ intra- molecular hydrogen bond interactions
in the PVA-PVP blend films.
Page 7 of 23
https://mc06.manuscriptcentral.com/cjp-pubs
Canadian Journal of Physics
For Review O
nly
8
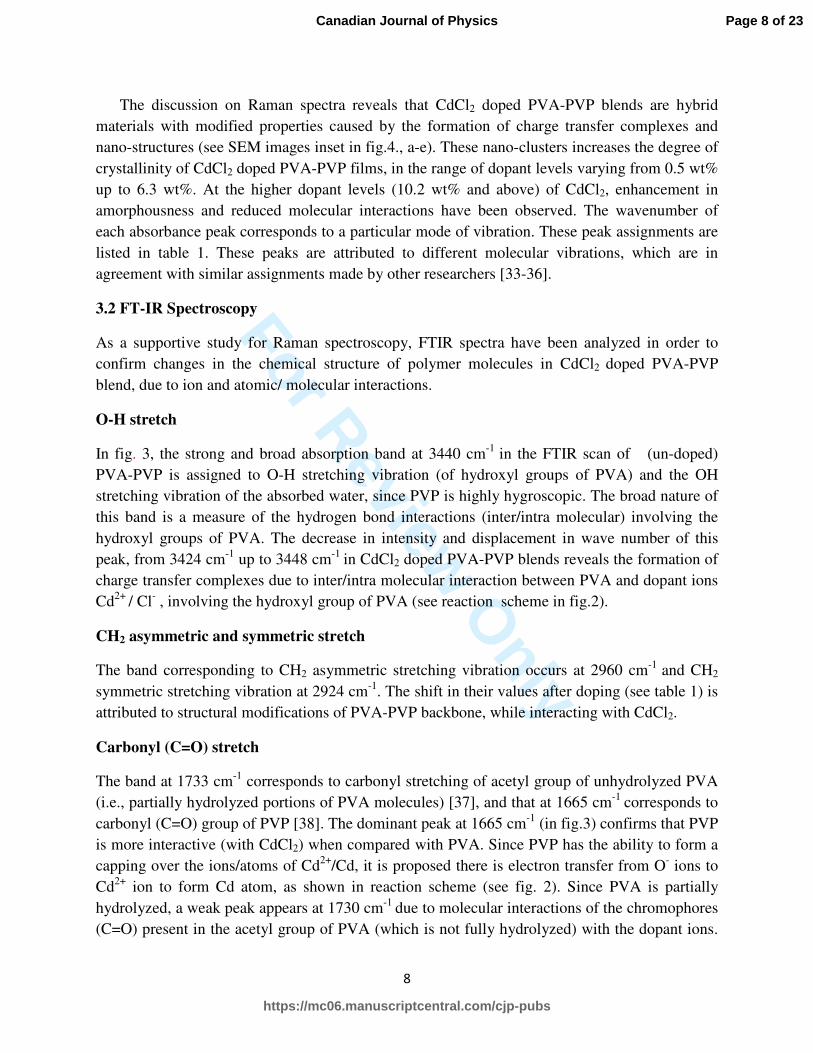
The discussion on Raman spectra reveals that CdCl2 doped PVA-PVP blends are hybrid
materials with modified properties caused by the formation of charge transfer complexes and
nano-structures (see SEM images inset in fig.4., a-e). These nano-clusters increases the degree of
crystallinity of CdCl2 doped PVA-PVP films, in the range of dopant levels varying from 0.5 wt%
up to 6.3 wt%. At the higher dopant levels (10.2 wt% and above) of CdCl2, enhancement in
amorphousness and reduced molecular interactions have been observed. The wavenumber of
each absorbance peak corresponds to a particular mode of vibration. These peak assignments are
listed in table 1. These peaks are attributed to different molecular vibrations, which are in
agreement with similar assignments made by other researchers [33-36].
3.2 FT-IR Spectroscopy
As a supportive study for Raman spectroscopy, FTIR spectra have been analyzed in order to
confirm changes in the chemical structure of polymer molecules in CdCl2 doped PVA-PVP
blend, due to ion and atomic/ molecular interactions.
O-H stretch
In fig. 3, the strong and broad absorption band at 3440 cm-1
in the FTIR scan of (un-doped)
PVA-PVP is assigned to O-H stretching vibration (of hydroxyl groups of PVA) and the OH
stretching vibration of the absorbed water, since PVP is highly hygroscopic. The broad nature of
this band is a measure of the hydrogen bond interactions (inter/intra molecular) involving the
hydroxyl groups of PVA. The decrease in intensity and displacement in wave number of this
peak, from 3424 cm-1
up to 3448 cm-1
in CdCl2 doped PVA-PVP blends reveals the formation of
charge transfer complexes due to inter/intra molecular interaction between PVA and dopant ions
Cd2+
/ Cl- , involving the hydroxyl group of PVA (see reaction scheme in fig.2).
CH2 asymmetric and symmetric stretch
The band corresponding to CH2 asymmetric stretching vibration occurs at 2960 cm-1
and CH2
symmetric stretching vibration at 2924 cm-1
. The shift in their values after doping (see table 1) is
attributed to structural modifications of PVA-PVP backbone, while interacting with CdCl2.
Carbonyl (C=O) stretch
The band at 1733 cm-1
corresponds to carbonyl stretching of acetyl group of unhydrolyzed PVA
(i.e., partially hydrolyzed portions of PVA molecules) [37], and that at 1665 cm-1
corresponds to
carbonyl (C=O) group of PVP [38]. The dominant peak at 1665 cm-1
(in fig.3) confirms that PVP
is more interactive (with CdCl2) when compared with PVA. Since PVP has the ability to form a
capping over the ions/atoms of Cd2+
/Cd, it is proposed there is electron transfer from O- ions to
Cd2+
ion to form Cd atom, as shown in reaction scheme (see fig. 2). Since PVA is partially
hydrolyzed, a weak peak appears at 1730 cm-1
due to molecular interactions of the chromophores
(C=O) present in the acetyl group of PVA (which is not fully hydrolyzed) with the dopant ions.
Page 8 of 23
https://mc06.manuscriptcentral.com/cjp-pubs
Canadian Journal of Physics

For Review O
nly
9
The variation in intensity and wavenumber of this vibration indicates formation of charge
transfer complexes (such as PVP+Cd2+
and PVA+Cd2+
); the transfer of electrons from polymeric
molecules (PVA and PVP) to Cd2+
leads to formation of Cd atoms, which evolve (aggregate) to
form cadmium nano-structures in the CdCl2 doped PVA-PVP blend films, which are observed
using SEM; see Fig. 4 (inset).
Figure 3: FTIR spectra at different concentrations (expressed in weight percentage (wt%)) of CdCl2 in films of
PVA-PVP blend.
C-N stretch and CH2 wagging
The peak at 1260 cm-1
is due to C-N stretch in lactum ring of PVP and also CH2 wagging in
PVA-PVP backbone. Since PVP contains C-N linkage, there could be interactions of N+ with Cl
-
ion of dopant as shown in the reaction scheme (see fig. 2), Hence, there is considerable shift in
both the wave-number corresponding to C-N absorbance, in both FTIR and Raman spectra of
CdCl2 doped PVA-PVP blend films. The sharp band at 1030 cm-1
in pure PVA-PVP blend
corresponds to C-N vibrations in PVP, and shift of this peak between 1020 cm-1
to 1044 cm-1
indicates the formation of charge transfer complexes, as illustrated in resonance structure of PVP
Page 9 of 23
https://mc06.manuscriptcentral.com/cjp-pubs
Canadian Journal of Physics

For Review O
nly
10
(in reaction scheme; see fig. 2) and due to inter-molecular and molecule –ion interactions; for
example, PVP + Cl-.
N-C=O bend, ring deformation
The broad peaks at 550 cm-1
and 650 cm-1
in pure PVA-PVP blends have been assigned to N-C-
O bend and ring deformation, the peak frequencies (actually, wavenumbers) vary from 515 - 550
cm-1
and 613 - 650 cm-1
at different concentrations of dopant (CdCl2) in the PVA-PVP blends
(due to inter/ intra-molecular interactions). The shift in vibration frequency associated with
stretching, wagging, twist and other phenomenon in CdCl2 doped samples are due to intra/inter
molecular hydrogen bonding with the adjacent OH group of PVA. All possible structural
deformations are assigned at different frequencies, and the same is listed in table1 (and seen in
fig. 3). Due to these molecular interactions, there are chemical/ structural changes which lead to
microstructural modifications in CdCl2 doped PVA-PVP blend films. These changes also affect
the band structure of CdCl2 doped PVA-PVP blend films.
3.3.Energy Dispersive X-ray Spectroscopy (EDS)
Energy Dispersive X-ray Spectrometry (EDS) is an analytical technique for
determination of the elemental constituents in a sample (material). In the recorded EDS spectra
of CdCl2 doped PVA-PVP blends (shown in fig. 4), it is observed that there are five cadmium
(Cd) peaks and two chlorine (Cl) peaks, which confirm the presence of dopant atoms in films of
the doped polymeric blend. Since Carbon (C), Nitrogen (N) and Oxygen (O) atoms are present in
the parent (original polymer) chains of PVA/PVP blend, the peaks corresponding to these
elements are also observed in the EDS spectra of CdCl2 doped PVA-PVP blend films (see fig.4).
With an increase in CdCl2 concentration in PVA-PVP blend, there is an increased intensity of Cd
and Cl peaks in the recorded EDS spectra; this reveals the presence of a larger number of dopant
ions/atoms in the polymer matrix (doped blend films), at higher doping levels. The peaks due to
fluorescence x-rays of Cd, namely, LI, Lα1, Lβ1, Lβ2, 15 and Lγ1 are observed at 2.76 keV, 3.14
keV, 3.35 keV, 3.53 keV and 3.72 keV, respectively. The two x-rays peaks attributed due to Cl
are at 2.66 keV and 2.81 keV; they are attributed to Kα1 and Kβ1 fluorescence x-rays of Cl.
Page 10 of 23
https://mc06.manuscriptcentral.com/cjp-pubs
Canadian Journal of Physics

For Review O
nly
11
855
760
665
570
475
285
190
380
95
Fig4 (a)
0.0 wt%
Page 11 of 23
https://mc06.manuscriptcentral.com/cjp-pubs
Canadian Journal of Physics

For Review O
nly
12
0.5 wt%
Fig 4 (b)
801
712
623
534
445
356
267
178
89
333
296
259
222
185
148
111
74
37
Fig4 (c)
2.2 wt%
Page 12 of 23
https://mc06.manuscriptcentral.com/cjp-pubs
Canadian Journal of Physics

For Review O
nly
13
Figure 4: EDS spectra at different concentrations; Fig. 4(a): 0.0 wt% (Pure PVA-PVP blend), Fig. 4(b): 0.5 wt%,
Fig. 4(c): 2.2 wt%, Fig 4. (d):10.2 wt% and Fig 4. (e): 21.5 wt% doping level of CdCl2 in PVA-PVP blend films.
SEM images for the corresponding doping levels are inset.
21.5 wt%
Fig 4(d)
10.2 wt%
Fig 4(e)
819
728
637
546
455
364
273
182
91
1.4k
1.2k
1.0k
0.8k
0.6k
0.4k
0.2k
Page 13 of 23
https://mc06.manuscriptcentral.com/cjp-pubs
Canadian Journal of Physics

For Review O
nly
14
3.1 UV-Visible Spectroscopy
The optical absorbance (UV-Vis) spectra of PVA-PVP blend samples doped with CdCl2 from 0.5
wt% up to 2.2 wt% show a prominent absorption hump, with peak at the wavelength 370 nm, in
addition to intermediate energy bands, which are caused by the interactions of CdCl2 with
molecules of PVA and PVP (See fig. 5). Also, at these doping levels, the SEM images (see inset
images in fig. 4 (b, c)) show nanostructures due to dopant; the possibility of localized Surface
Plasmon Resonance (LSPR) due to Cd nanostructures causing this absorption hump needs to be
discussed. LSPR is the collective oscillations of electrons in metallic nanostructures in the
presence of suitable optical excitation energy [39, 40]. The absorption band intensity and
wavelength are characteristic of LSPR and which are sensitive to size, size distribution, shape of
nanostructures and surrounding medium [41, 42]. The enhanced interest towards study of LSPR
by researchers is due to its exploitation in the field of sensors; chemical sensors, biosensors and
optical devices [43-46]. The use of a UV-Visible (UV-Vis) spectrometer offers a simple
technique for recognition of metallic nano-particles, since they exhibit the phenomenon of LSPR
phenomenon, characterized by a strong absorption of electromagnetic (EM) radiation in a certain
wavelength range (resonance absorption) of the visible spectrum. On observing intense
absorption band at 370 nm, the LSPR is proposed to be due to cadmium nanostructures in CdCl2
doped with PVA-PVP blend. Since LSPR is observed for low doping levels of CdCl2 in PVA-
PVP blends, these samples can be used to fabricate sensors. The ongoing research on noble metal
nano-particles has gained increased attention of researchers due to enhancement in electric field
on their surface and the manner in which these nanostructures affect the local environment. An
enhancement in fluorescence intensity is seen for small nanoclusters when compared to bulk. In
the case of CdCl2 doped PVA-PVP films, this enhancement in fluorescence intensity is observed
in case of films doped to 0.5 wt% doping level (See Fig. 6a). However, fluorescence quenching
is observed in case of CdCl2 doped PVA-PVP blend films with doping level above 0.5 wt%.
Since self grown nano-rods of larger aspect ratio (length/width) are seen in CdCl2 doped PVA-
PVP blend films, fluorescence quenching has been observed, which is attributed to non-radiative
energy transfer from excited fluorophore to the cadmium nano-rods. Although PVP plays a
major dual role as a reducing and capping agent of cadmium nano-particles, the incorporation of
PVA helps in the formation of a self- supporting film (of PVA-PVP blend), on solution casting.
The cadmium ions (Cd2+
) get converted to cadmium atoms (Cd) by accepting electrons from
PVP (as explained in reaction scheme in fig. 2). The size and aspect ratio of nano-spheres is ten
times less than that of nano rods (see fig. 5d), which result in decrease in area and full width half
maximum (FWHM); these values were estimated by fitting the spectra using multiple Gaussian
and Lorentzian shapes to the LSPR absorption band (see table 2, Fig. 5b and Fig. 5c) in the UV-
Visible spectra of CdCl2 doped PVA-PVP blend films.
Page 14 of 23
https://mc06.manuscriptcentral.com/cjp-pubs
Canadian Journal of Physics
For Review O
nly
15
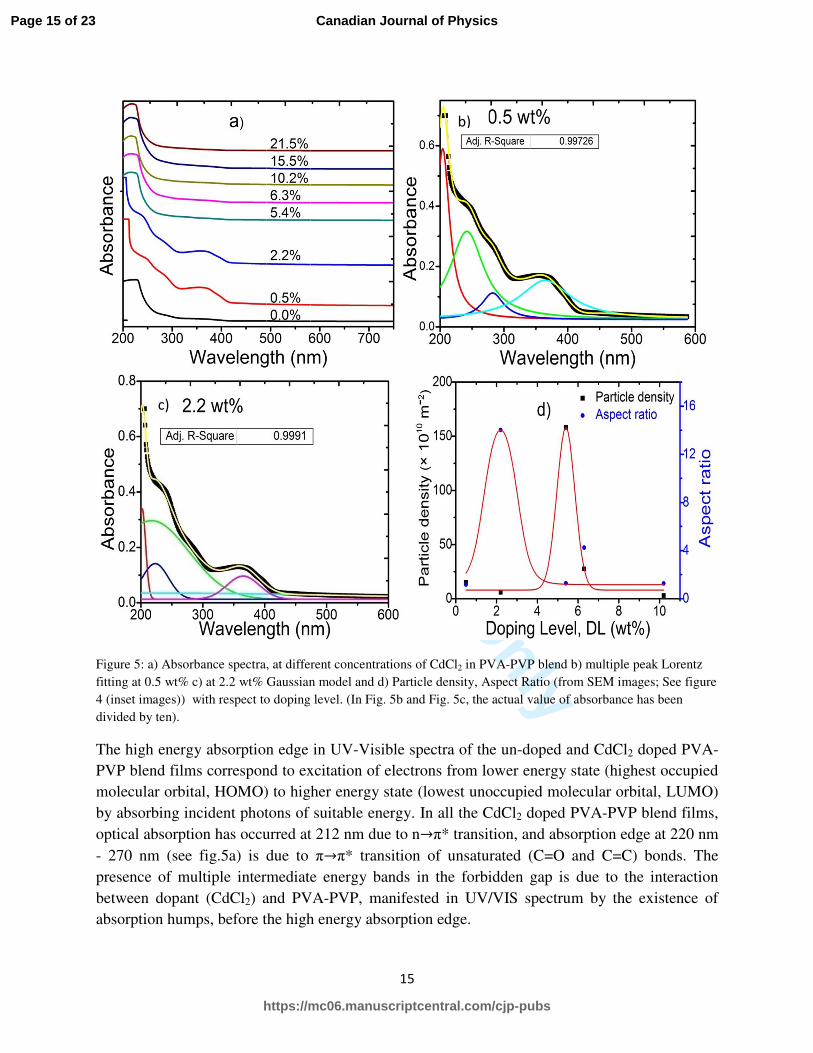
Figure 5: a) Absorbance spectra, at different concentrations of CdCl2 in PVA-PVP blend b) multiple peak Lorentz
fitting at 0.5 wt% c) at 2.2 wt% Gaussian model and d) Particle density, Aspect Ratio (from SEM images; See figure
4 (inset images)) with respect to doping level. (In Fig. 5b and Fig. 5c, the actual value of absorbance has been
divided by ten).
The high energy absorption edge in UV-Visible spectra of the un-doped and CdCl2 doped PVA-
PVP blend films correspond to excitation of electrons from lower energy state (highest occupied
molecular orbital, HOMO) to higher energy state (lowest unoccupied molecular orbital, LUMO)
by absorbing incident photons of suitable energy. In all the CdCl2 doped PVA-PVP blend films,
optical absorption has occurred at 212 nm due to n→π* transition, and absorption edge at 220 nm
- 270 nm (see fig.5a) is due to π→π* transition of unsaturated (C=O and C=C) bonds. The
presence of multiple intermediate energy bands in the forbidden gap is due to the interaction
between dopant (CdCl2) and PVA-PVP, manifested in UV/VIS spectrum by the existence of
absorption humps, before the high energy absorption edge.
b)
c)
Page 15 of 23
https://mc06.manuscriptcentral.com/cjp-pubs
Canadian Journal of Physics

For Review O
nly
16
SEM images were utilized to extract the data required to plot fig. 5d. Some of the SEM
images are shown in Fig. 4 (inset). The details of microstructural changes caused in PVA-PVP
blend (on doping with CdCl2) have been presented elsewhere [20]. The ratio of length to the
breadth is used to calculate aspect ratio of cadmium nanostructures in CdCl2 doped PVA-PVP
films, at different doping levels. The variation of the aspect ratio with respect to doping level is
shown in fig. 5d. The maximum aspect ratio is observed for 2.2 wt% sample, because of
significantly larger length of nanorods, when compared to their diameter. Particle density is
determined by counting the number of particles per unit area from SEM images of the doped
polymeric blend, for samples doped to different levels. The following procedure was adopted. A
circle of radius ‘r’ was drawn on a photocopy of the recorded SEM image. Then, the number of
nano structures (N) inside that circle was counted, and this number was divided by area of the
drawn circle. Thus, the analysis required to extract information from SEM images was done
manually. Some of the SEM images of CdCl2 doped PVA-PVP films are shown in Fig. 4 (a-e)
(inset). It was expected to observe a shift in peak wavelength with increase in size of nano cluster
and two absorption bands for nano-rods, corresponding to longitudinal (low-energy) and
transverse (high-energy) surface plasmon bands [47, 48]; however, these effects are not observed
in case of CdCl2 doped PVA-PVP blend films. Also, the effect of LSPR is not clearly seen for
the CdCl2 doped PVA-PVP blend films in the doping range from 5.4 wt% up to 10.2 wt%.
3.4.Analysis of Photo-luminescence Spectra
The emission (photo-luminescence) peaks of CdCl2 doped PVA-PVP blend are obtained at the
excitation wavelength 355 nm. As seen from fig. 6a, there are two emission peaks at the
wavelengths 412 nm and 434 nm, in addition to the just resolved peaks at 458 nm and 463 nm.
These fluorescence peaks have been identified by multi-peak Gaussian fitting (see fig.6c
illustrated for 5.4 wt%) and listed in table 2. The fluorescence peak at 412 nm is due to
fluorophore of complex Cd2+
/Cl-+PVP [49] and Cd
2+/Cl
-+PVA; peaks at 434 nm, 458 nm and
463 nm are due to Cd2+
/Cl-+PVA [50]. Since C=O group is present in both PVP and acetyl
groups of unhydrolyzed parts of PVA, electron transfer to cadmium ion takes place from both of
these molecules. At 0.5 wt% of CdCl2 in PVA-PVP, the fluorescence peak at 434 nm is
dominant when compared to the peak at 412 nm, which indicates that the charge transfer
complexes formed due to PVA are more available for the excitation.
It is observed that there is enhancement in fluorescence intensity due to smaller size of
nano particle at 0.5 wt%. But in the dopant range varying from 2.2 wt% up to 10.2 wt%, the role
of PVP is more important. This is confirmed from FTIR spectra; PVP acts as a capping agent by
accumulating electrons on the surface of cadmium atoms as evidenced by the enhancement in the
peak intensity at 412 nm when compared to that at 434 nm.
Page 16 of 23
https://mc06.manuscriptcentral.com/cjp-pubs
Canadian Journal of Physics

For Review O
nly
17
Figure 6: a) Emission spectra at different concentration of CdCl2 in PVA-PVP blend. b) The variation of peak
intensity at four different wavelengths. c) Multiple peaks fitting at 5.4 wt% using Gaussian model. d) Simplified
Jablonskii diagram at 5.4 wt% doping level of CdCl2 in PVA-PVP blend.
The emission spectra, at various concentrations of CdCl2 in films of PVA-PVP blend (
above 0.5 wt% doping level) reveals a quenching effect of the fluorophore (see fig. 6b). This
could be due to the transfer of electrons from PVA/ PVP to the cadmium ions (and resulting in
formation of Cd atoms). Thus, these electrons of the polymeric host are not available for
radiative transition. Another reason for fluorescence quenching could be close proximity of
chromophores to the surface of Cd nanostructures. i.e., if the chromophore of PVA-PVP is about
5 nm from the surface of metal (Cd) nanoparticles, excited electrons from chromophores (i.e.,
non-bonding electrons of oxygen in C=O group) gets tranferred to Cd nanostructures, and hence
the fluorescence quenching takes place via non-radiative pathways. Fluorescence enhancement
can be achieved by maintaning a distance of 10 nm or more between the chromophore and the
surface of Cd nano-structures, because in this situation the Cd nano-structures will have less
Page 17 of 23
https://mc06.manuscriptcentral.com/cjp-pubs
Canadian Journal of Physics

For Review O
nly
18
interaction with chromophores of the polymer molecules (PVA/ PVP). Hence, a reduction in
fluorescence intensity is observed in the latter case.
The energy transfer could take place in two ways; radiative energy transfer, in which the
fluorophore deexcites from excited state to ground state by emission of a photon and by non-
radiative energy transfer, in which, during the de-excitation process from a metastable state the
fluorophore loses its energy by transferring it to its surrounding medium. These radiative and
non-radiative energy transitions occur in different energy regions. These are illustrated (for 5.4
wt% doping level) in the simplified Jablonskii diagram (see fig. 6d). PVP has a crucial character,
that of encapsulating metal (Cd) nano particles and thus, it acts as capping agent by transferring
electron from rigid pyrrolidone group to cadmium ion to form cadmium atom, as explained in
reaction scheme shown in fig. 2. Hence, fluorescence quenching is observed in the CdCl2 doped
PVA-PVP blend films. The non-radiative energy transfer from PVA-PVP matrix to cadmium
atoms results in fluorescence quenching due to the close proximity of chromophores from the
surface of Cd nanostructures.
Conclusions
FT-Raman and FTIR spectral analysis of pure and CdCl2 doped PVA-PVP blend films reveals
the inter/intra-molecular interactions via hydroxyl (OH) and carbonyl (C=O) group of PVA/
PVAc and PVP with the Cd+ and Cl
- ions of the dopant. A possible reaction scheme for the
interaction of CdCl2 with PVA and PVP molecules has been proposed. From the EDS spectra,
evidence for the presence of CdCl2 in polymer matrix is seen, and increased intensity of Cd and
Cl x-ray fluorescent peaks is observed with increased content of CdCl2. SEM images give
evidence for formation of Cd nanostructures in CdCl2 doped PVA-PVP films. From the UV-Vis
spectra, an absorbance hump is seen at 370 nm in CdCl2 doped PVA-PVP blend films, for
doping levels between 0.5 wt% and 2.2 wt%, and the possibility of attributing this to LSPR by
self-formed Cd metal nanospheres and nanorods has been discussed. The study of fluorescence
spectra reveals that there is fluorescence quenching in PVA-PVP blend due to transfer of
electrons from polymer molecules to Cd2+
, ultimately resulting in formation of Cd nanostructures
in the doped film.
Acknowledgements:
The facilities at University Science Instrument Centre (USIC), Karnatak University, Dharwad
(KUD) have been used for recording the Raman, FTIR, UV/VIS and fluorescence spectra. We
extend our thanks to Sophisticated Test and Instrumentation Centre (STIC), STIC-SAIF, Cochin
University, Kochi (Kerala, India) for the SEM images. B. M. Baraker thanks KUD for the UPE
fellowship.
Page 18 of 23
https://mc06.manuscriptcentral.com/cjp-pubs
Canadian Journal of Physics

For Review O
nly
19
References
[1] J.Y. Song, Y.Y. Wang, and C.C. Wan. J. Power Sources 77, 183 (1999).
doi:10.1016/S0378-7753(98)00193-1
[2] A.L. Gopalan, P. Santhosh, K.M. Manesh, J.H. Nho, S. Chul-Gyun Hwang, and K.P. Lee. J.
Membr. Sci. 325, 683 (2008). doi: 10.1016/j.memsci.2008.08.047
[3] B.P. Tripathi and V.K. Shahi. Prog. Polym. Sci. 36, 945 (2011). doi:
10.1016/j.progpolymsci.2010.12.005
[4] A. Bhide and K. Hariharan. Eur. Polym. J. 43, 4253 (2007). doi:
10.1016/j.eurpolymj.2007.07.038
[5] N.A. Choudhary, S. Sampath, and A.K. Shukla. Energy Environ. Sci. 2, 55 (2009). doi:
10.1039/b811217g
[6] Y. Pavani, M. Ravi, S. Bhavani, A.K. Sharma, and V.V.R.N. Rao. Polym. Eng. Sci. 52,
1685 (2012). doi: 10.1002/pen.23118
[7] L.G. Gilman. Solid solutions of lithium perchlorate in polymer. US Patent. US 3148097 A
(1964). https://www.google.com/patents/US3148097
[8] M.R. Ranganath, R.V. Patil, and B. Lobo. Morphological modifications in potassium
permanganate doped poly (vinyl alcohol) films. In Proceedings of the International
Workshop on Applications of Nanotechnology to Energy, Environment and Biotechnology.
ISBN: 978-81-920274-0-1, St. Aloysius College (Autonomous), Mangalore, India.
December 14- 16, 2010. p 82-88. doi: 10.13140/RG.2.1.2312.1125
[9] H.M. Zidan. J. Appl. Polym. Sci. 88, 1115 (2003). doi: 10.1002/app.12123
[10] P.K. Khare, S.K. Paliwal, R. Kuraria, H.L. Vishwakarma, A. Verma, and S.K. Jain. Bull.
Mater. Sci. 21, 139 (1998). doi: 10.1007/BF02927562
[11] R.V. Patil, M.R. Ranganath, and B. Lobo. AIP Conf. Proc. 1591, 183 (2014). doi:
10.1063/1.4872537
[12] D. Vanitha, S.A. Bahadur, N. Nallamuthu, S. Athimoolam, and A. Manikandan. J. Inorg.
Organomet. Polym. Mater. 27, 257 (2017). doi: 10.1007/s10904-016-0468-6
[13] M.R. Ranganath and B. Lobo. Study of the UV- Visible absorption spectra of aqueous
ferric chloride doped polyvinylalcohol – polyvinylpyrrolidone blend films. In Abstract Book
of the International Conference on Condensed Matter Physics. Edited by B.K. Sharma, J.V.
Yakhmi et al. ISBN: 81-903610-3-1, University of Rajasthan, Jaipur, India. November 25-
28, 2007. p 118. doi: 10.13140/RG.2.1.2298.2888
[14] D. Sayala. Composite materials and techniques for neutron and gamma radiation
shielding. US Patent. US 7250119 B2 (2007). https://www.google.com/patents/US7250119 [15] R.G. Hoff, N.E. Huston, and C.W Wheelock. Method and apparatus for reactor safety
control. US Patent. US 2987455 A (1961). https://www.google.com/patents/US2987455 [16] T.C. Jennings and W.H. Starnes Jr., PVC Stabilizers and Lubricants In PVC Handbook,
ISBN: 9781569903797, Edited by C.E Wilkes, J. W. Summers and C. A. Daniels, Hanser
Verlag, p 149, 2005. http://files.hanser.de/hanser/docs/20050818_2581819739-53_3-446-
22714-8_Inhalt.pdf [17] M.I. Sarwar, S. Rafiq, S.M. Yousaf, and Z. Ahmad. Int. J. Polym. Mater. Polym.
Biomater. 41, 185 (1998). doi: 10.1080/00914039808041043
Page 19 of 23
https://mc06.manuscriptcentral.com/cjp-pubs
Canadian Journal of Physics

For Review O
nly
20
[18] W. Khan and Z. Ahmad. Polym. Degrad. Stab. 53, 243 (1996). doi: 10.1016/0141-
3910(96)00078-x [19] B.M. Baraker and B. Lobo. Indian J. Pure Appl. Phys. 54, 634 (2016).
http://nopr.niscair.res.in/bitstream/123456789/35893/1/IJPAP%2054(10)%20634-640.pdf
[20] B.M. Baraker and B. Lobo. Microstructure of cadmium chloride doped PVA/PVP blend
films. In Abstract book of the International Conference on Advanced Materials and
Applications, B.M.S. Engineering College, Bengaluru, India. June 15-17, 2016. p 129.
[21] B.M. Baraker, P.B. Hammannavar, and B. Lobo. AIP Conf. Proc. 1665, 070037 (2015). doi: 10.1063/1.4917901
[22] M.B. Nanda Prakash, A. Manjunath, and R. Somashekar. Adv. Condens. Matter Phys.
2013, Article ID 690629 (2013). doi: 10.1155/2013/690629
[23] M. Pandey, G.M. Joshi, K. Deshmukh, and J. Ahmad. Adv. Mater. Lett. 6, 165 (2015).
doi: 10.5185/amlett.2015.5639
[24] M. Pandey, G.M. Joshi, and A.R. Polu. Karbala International Journal of Modern Science
1, 194 (2015). doi: 10.1016/j.kijoms.2015.10.009 [25] M.W. Urban. Fourier Transform Infrared and Fourier Transform Raman Spectroscopy of
Polymers (Chapter 1) In Structure-Property Relations in Polymers, ISBN: 0-8412-2525-7,
Edited by M. W. Urban and C. D. Craver, Advances in Chemistry; American Chemical
Society (ACS) Publications, Washington, DC, Volume 236, p 3, 1993. doi: 10.1021/ba-
1993-0236.ch001
[26] S.P. Mondal, A. Dhar, S.K. Ray, and A.K. Chakraborty. J. Appl. Phys. 105, 084309
(2009). doi: 10.1063/1.3111971.
[27] E. Rani, R. Aggarwal, A. A. Ingale, K. Bapna, C. Mukherjee, M. K. Singh, P. Tiwari, and
A. K. Srivastava. J. Mater. Sci. 51, 1581 (2016). doi: 10.1007/s10853-015-9481-3.
[28] N. Tanaka, K. Ito and H. Kitano. Macromol. Chem. Phys. 195, 3369 (1994). doi:
10.1002/macp.1994.021951008
[29] S. Roy. J. Appl. Polym. Sci. 110, 2693 (2008). doi: 10.1002/app.28332.
[30] V.G Plotnichenko, Yu.A. Mityagin, and L.K. Vodop’yanov. Fiz. Tverd. Tela 19, 1706
(1977). https://inis.iaea.org/search/search.aspx?orig_q=RN:9412867
[31] J-Y. Zhang, X-Y. Wang, M. Xiao, L. Qu, and X. Peng. Appl. Phys. Lett. 81, 2076 (2002).
doi: 10.1063/1.1507613.
[32] C. Trallero-Giner, A. Debernardi, M. Cardona, E. Menéndez-Proupín, and A. I. Ekimov.
Phys. Rev. B 57, 4664 (1998). doi: 10.1103/PhysRevB.57.4664
[33] Y.A. Badr, K.M. Abd El-Kader, and R.M. Khafagy. J. Appl. Polym. Sci. 92, 1984(2004).
doi: 10.1002/app.20017
[34] B.H. Stuart. Vib. Spectrosc. 10, 79 (1996). doi: 10.1016/0924-2031(95)00042-9
[35] B. Fanconi. Annu. Rev. Phys. Chem. 31, 265 (1980). doi:
10.1146/annurev.pc.31.100180.001405.
[36] X. Qi, X. Yao, S. Deng, T. Zhou, and Q. Fu. J. Mater. Chem. A 2, 2240 (2014). doi:
10.1039/C3TA14340F
[37] S. Krimm, C.Y. Liang, and G.B.B.M. Sutherland. J. Polym. Sci., Part A: Polym. Chem.
22, 227 (1956). doi: 10.1002/pol.1956.1202210106
[38] M. Ravi, Y. Pavani, K. Kiran Kumar, S. Bhavani, A.K. Sharma, and V.V.R.N. Rao.
Mater. Chem. Phys. 130, 442 (2011). doi: 10.1016/j.matchemphys.2011.07.006
[39] S. Link and M.A. El-Sayed. J. Phys. Chem. B 103, 8410 (1999). doi: 10.1021/jp9917648
[40] P. Mulvaney. Langmuir 12, 788 (1996). doi: 10.1021/la9502711
Page 20 of 23
https://mc06.manuscriptcentral.com/cjp-pubs
Canadian Journal of Physics

For Review O
nly
21
[41] N. Nath and A. Chilkoti. Anal. Chem. 76, 5370 (2004). doi: 10.1021/ac049741z
[42] J. Zheng, C. Zhang, and R. M. Dickson. Phys. Rev. Lett. 93, 077402 (2004). doi:
10.1103/PhysRevLett.93.077402
[43] W. Fritzsche and T.A. Taton. Nanotechnology 14, R63 (2003). doi: 10.1088/0957-
4484/14/12/R01
[44] S.O. Obare, R.E. Hollowell, and C.J. Murphy. Langmuir 18, 10407 (2002). doi:
10.1021/la0260335
[45] N. Nath and A. Chilkoti. Proc. SPIE 4626, 441 (2002). doi: 10.1117/12.472110
[46] J-M. Nam, C.S. Thaxton, and C.A. Mirkin. Science 301, 1884 (2003). doi:
10.1126/science.1088755
[47] C.J. Murphy and N.R. Jana. Adv. Mater. (Weinheim, Ger.) 14, 80 (2002).
https://www.researchgate.net/publication/228556843
[48] E. Hutter and J.H. Fendler. Adv. Mater. (Weinheim, Ger.) 16, 1685 (2004). doi:
10.1002/adma.200400271
[49] B.S. Amma, K. Manzoor, K. Ramakrishna, and M. Pattabi. Mater. Chem. Phys. 112, 789
(2008). doi: 10.1016/j.matchemphys.2008.06.043
[50] D. Patra and A.K. Mishra. Sens. Actuators, B 80, 278 (2001). doi: 10.1016/S0925-
4005(01)00919-4
Page 21 of 23
https://mc06.manuscriptcentral.com/cjp-pubs
Canadian Journal of Physics

For Review O
nly
22
Table 1: FT-Raman and FTIR peak assignments, for pure and CdCl2 doped PVA-PVP films.
Peak Assignment Raman Assignments
Wavenumber (cm-1
)
Pure Doped
PVA-PVP PVA- PVA
FTIR Assignments
Wavenumber (cm-1
)
Pure Doped
PVA-PVP PVA- PVA
O-H stretching … … 3440 3424-3448
Asy CH2 stretch, chain … 2987 2960 2966-2969
Sy CH2 stretch, chain 2921 2921-2925 2924 2922-2926
C-H stretch …. 2832-2857 2856 2848-2856
C=O stretching
(acetyl group/ PVAc)
1732 1710-1735 1734 1732-1744
C=O stretching(s); PVP 1652 1632-1665 1651 1627-1636
C-N stretch 1528 1513-1594 1500 1500-1562
C-O stretch or CH2
scissor
1436 1436-1444 1460 1413-1467
C-H bend 1360 1360-1375 1380 1356-1391
CH-OH bending 1301 1301-1317 …. ….
C-N , C-H2 wagging 1229 1201-1260 1262 1260-1271
as C-OH valence ring
vibrations, C-O-C stretch
1116 1113-1180 1103 1095-1124
C-N vibrations …. --- 1030 1021-1043
C-C , ring breathing 927 923-939 930 …..
C-C Ring 849 848-854 850 801-861
C-C chain, C=O bending 750 747-762 740 702-718
N-C=O bend, ring def 551, 630 515, 640 550, 650 515, 613
Out of plane vibration 451 430-490 421 425-430
Di-substituted acetylene 355 355-390 … …
CH3 twisting, C-C-C def 220 220-265 … …
�LO 179 178-183 … …
Page 22 of 23
https://mc06.manuscriptcentral.com/cjp-pubs
Canadian Journal of Physics

For Review O
nly
23
Table 2: Intensity (Ii), wavelength (λi) and full width half maximum (FWHM) for four different
(i= 1 to 4) emission (fluorescence) peaks, from multiple Gaussian fitting at a different dopant
concentration of CdCl2 in PVA-PVP blend. The excitation wavelength is 355 nm.
CdCl2
(wt%)
0.0 0.5 2.2 5.4 6.3 10.2 15.5 21.5
λ1
(nm)
411.6±0.05 412.0±0.06 411.0±0.06 412.3±0.053 412.3±0.061 412.1±0.039 411.8±0.04 412.0±0.053
I1
(a.u)
3425.3±0.01 3296.8 1774.1 2174.8 2803.8 2275.7 1541.7 1061.1
FWHM1
(nm)
17.0±0.07 16.9±0.08 17.0±0.07 16.7±0.06 16.6±0.07 15.9±0.05 16.8±0.01 17.1±0.06
λ2
(nm)
433.5±0.05 433.6±0.06 433.4±0.07 434.0±0.07 434.0±0.07 434.4±0.05 434.2±.06 434.0±0.06
I2
(a.u)
3328.7 3248.6 1552.1 1979.9 2602.2 2184.4 1406.1 923.2
FWHM2
(nm)
19.8±0.18 19.8±0.21 20.4±0.23 20.5±0.21 20.6±0.24 21.4±0.18 21.3±0.02 20.6±0.22
λ3
(nm)
457.7±0.32 458.4±0.35 458.7±0.38 458.3±0.39 458.2±0.44 460.7±0.29 459.5±0.32 458.4±0.37
I3
(a.u)
1217.2 1108.7 481.3 725.2 945.9 668.4 474.2 348.4
FWHM3
(nm)
25.4±0.46 24.7±0.53 23.4±0.54 26.5±0.51 26.2±0.54 23.9±0.40 24.5±0.45 26.4±0.45
λ4
(nm)
459.3±0.26 454.1±0.21 448.5±0.16 461.0±0.22 464.5±0.27 456.2±0.17 463.3±0.22 462.8±0.19
I4
(a.u)
942.8 1150.6 606.9 599.1 720.38 641.9 396.9 287.9
FWHM4
(nm)
73.5±0.43 71.7±0.44 79.6±0.49 81.2±0.41 84.0±0.45 80.7±0.4 87.4±0.35 90.3±0.39
Page 23 of 23
https://mc06.manuscriptcentral.com/cjp-pubs
Canadian Journal of Physics