For: Providence Park Subdivision Placer County, Ca
28
Preliminary Post‐Construction Storm Water Quality Plan For: Providence Park Subdivision Placer County, Ca PLN16‐00103 APN: 474‐130‐007, ‐009, ‐010, ‐017, ‐018, ‐022, ‐024 & 474‐120‐017 Prepared for: Rob Wilson Forward Planning Manager Meritage Homes 1671 E. Monte Vista Ave, Suite 214 Vacaville, CA 95688 (707)‐359‐2026 Prepared by: TSD Engineering, Inc. 31 Natoma Street, Suite 160 Folsom, CA 95630 (916) 608‐0707 Preparation Date: 9/22/2016 Approval Date:_____________________
Transcript of For: Providence Park Subdivision Placer County, Ca
Preliminary Post‐Construction Storm
Water Quality PlanFor:
Providence Park SubdivisionPlacer County, Ca
PLN16‐00103
APN: 474‐130‐007, ‐009, ‐010, ‐017, ‐018, ‐022, ‐024 & 474‐120‐017
Prepared for:
Rob WilsonForward Planning Manager
Meritage Homes1671 E. Monte Vista Ave, Suite 214
Vacaville, CA 95688(707)‐359‐2026
Prepared by:
TSD Engineering, Inc.
31 Natoma Street, Suite 160
Folsom, CA 95630
(916) 608‐0707
Preparation Date: 9/22/2016
Approval Date:_____________________
Project Site Address:
Owner Name:
Title
Company
Address
City, State, Zip Code
Telephone #
Signature Date
Engineer:*PE Stamp*
Title
Company
Address
City, State, Zip Code
Telephone #
Signature
Brief Description of Project:
(Attach additional sheets as
necessary)
East and west of Antelope North Road and PFE Road.
Forward Planning Manager
Meritage Homes
1671 E. Monte Vista Ave, Suite 214
Rob Wilson
Vacaville, CA 95688
Folsom, CA 95630
Casey Feickert
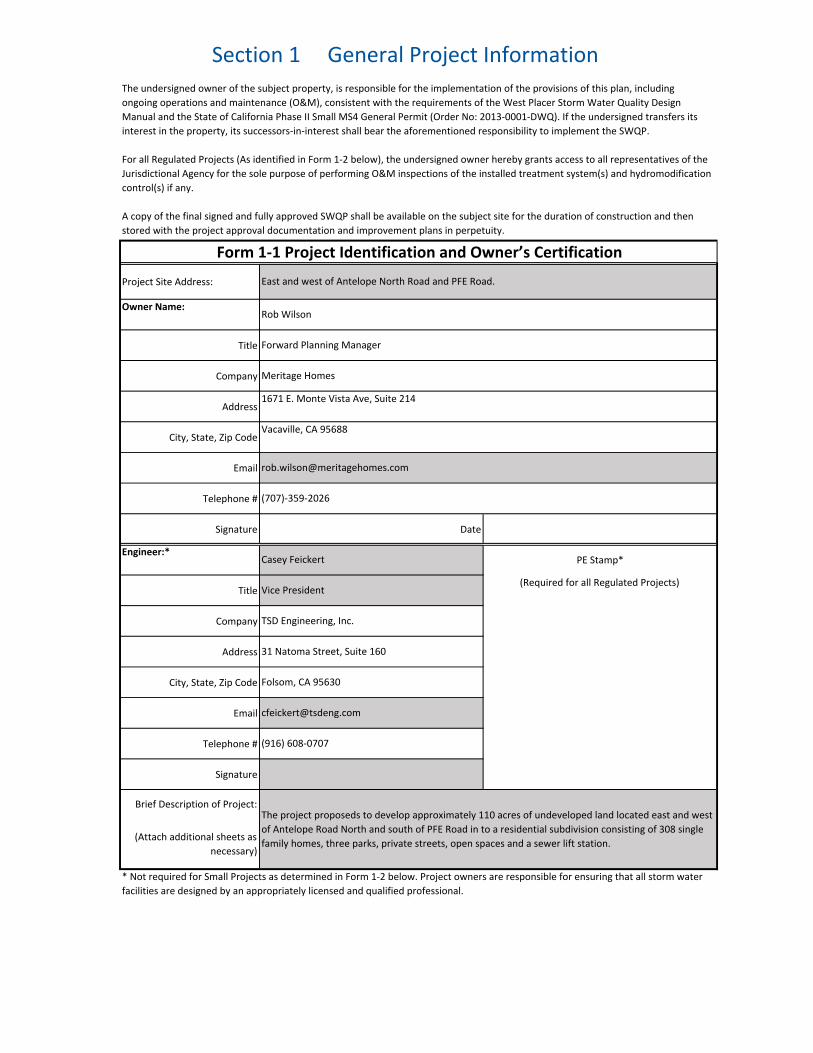
Section 1 General Project Information
* Not required for Small Projects as determined in Form 1‐2 below. Project owners are responsible for ensuring that all storm water
facilities are designed by an appropriately licensed and qualified professional.
The project proposeds to develop approximately 110 acres of undeveloped land located east and west
of Antelope Road North and south of PFE Road in to a residential subdivision consisting of 308 single
family homes, three parks, private streets, open spaces and a sewer lift station.
Vice President(Required for all Regulated Projects)
TSD Engineering, Inc.
31 Natoma Street, Suite 160
(916) 608‐0707
(707)‐359‐2026
The undersigned owner of the subject property, is responsible for the implementation of the provisions of this plan, including
ongoing operations and maintenance (O&M), consistent with the requirements of the West Placer Storm Water Quality Design
Manual and the State of California Phase II Small MS4 General Permit (Order No: 2013‐0001‐DWQ). If the undersigned transfers its
interest in the property, its successors‐in‐interest shall bear the aforementioned responsibility to implement the SWQP.
For all Regulated Projects (As identified in Form 1‐2 below), the undersigned owner hereby grants access to all representatives of the
Jurisdictional Agency for the sole purpose of performing O&M inspections of the installed treatment system(s) and hydromodification
control(s) if any.
A copy of the final signed and fully approved SWQP shall be available on the subject site for the duration of construction and then
stored with the project approval documentation and improvement plans in perpetuity.
Form 1‐1 Project Identification and Owner’s Certification

PROJECT SITE
VICINITY MAPN.T.S.

1Small Project – All projects, except LUPs, that create and/or replace between
2,500‐5,000 ft2 of impervious surface or detached single family homes that
create and/or replace 2,500 ft2 or more of impervious surface and are not part
of a larger plan of development. 2Enter total new and/or replaced impervious surface (ft2)
3Regulated Project – All projects that create and/or replace 5,000 ft2 or more of
impervious surface. 4Regulated Redevelopment Project with equal to, or greater than 50 percent
increase in impervious area5Regulated Redevelopment Project with less than 50 percent increase in
impervious area6Enter total pre‐project impervious surface (ft2)
7Enter total new and/or replaced impervious surface (ft2)8Regulated Road or linear underground/overhead project (LUP) creating 5,000
ft2 or more of newly constructed contiguous impervious surface.
9Enter total new and/or replaced impervious surface (ft2)10Regulated Hydromodification Management Project – Regulated projects that
create and/or replace 1 acre or more of impervious surface. A project that does
not increase impervious surface area over the pre‐project condition is not a
hydromodification management project.
x
11Enter total new and/or replaced impervious surface (ft2) 1,884,435
Form 1‐2 Project CategoryDevelopment Category (Select all that apply)
3 Elevation
(ft. above sea level)
485th Percentile, 24 Hour Design Storm
Depth (in):
Yes
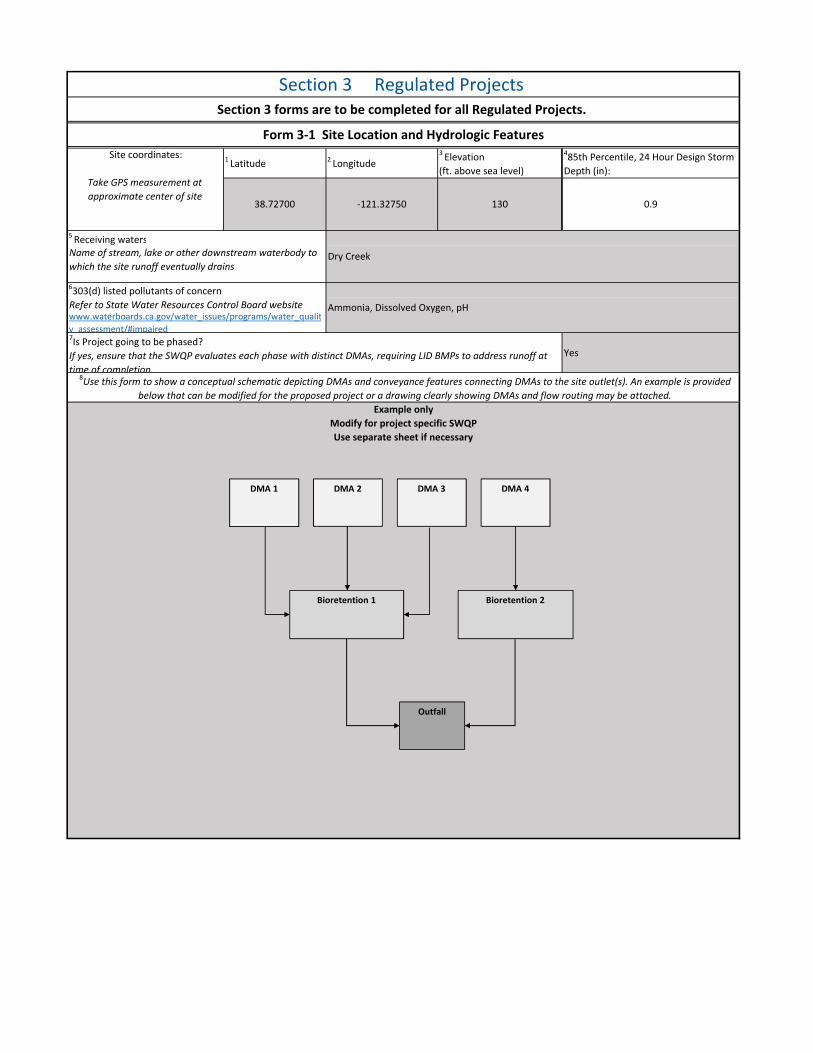
Section 3 Regulated Projects Section 3 forms are to be completed for all Regulated Projects.
Site coordinates:
Take GPS measurement at
approximate center of site
Form 3‐1 Site Location and Hydrologic Features
38.72700
2 Longitude
‐121.32750
1 Latitude
130 0.9
5 Receiving watersName of stream, lake or other downstream waterbody to
which the site runoff eventually drains
6303(d) listed pollutants of concern
8Use this form to show a conceptual schematic depicting DMAs and conveyance features connecting DMAs to the site outlet(s). An example is provided
below that can be modified for the proposed project or a drawing clearly showing DMAs and flow routing may be attached.
Example only
Modify for project specific SWQP
Use separate sheet if necessary
7Is Project going to be phased?
If yes, ensure that the SWQP evaluates each phase with distinct DMAs, requiring LID BMPs to address runoff at
time of completion.
www.waterboards.ca.gov/water_issues/programs/water_qualit
y assessment/#impaired
Dry Creek
Ammonia, Dissolved Oxygen, pHRefer to State Water Resources Control Board website
DMA 1 DMA 2 DMA 3 DMA 4
Bioretention 1 Bioretention 2
Outfall

CONCEPTUAL CONVEYANCE SCHEMATIC
AutoCAD SHX Text
DMAs 1-9
AutoCAD SHX Text
BIO-RETENTION 1-9
AutoCAD SHX Text
UNDERGROUND SYSTEM
AutoCAD SHX Text
OUTFALL A
AutoCAD SHX Text
DMA 29
AutoCAD SHX Text
PERMEABLE PAVEMENT
AutoCAD SHX Text
DMAs 10-28
AutoCAD SHX Text
BIO-RETENTION 1-9
AutoCAD SHX Text
UNDERGROUND SYSTEM
AutoCAD SHX Text
OUTFALLS B & C
AutoCAD SHX Text
DMAs 30-31
AutoCAD SHX Text
PERMEABLE PAVEMENT

LEGEND
O.R.P.C.
ROBERT & NANCY
PRUETT
APN: 474-130-027
STEPHEN BARRETT
APN: 474-130-005
KEITH & LISETTE
HUTCHENS
APN: 474-130-006
LUIS AGUILAR
APN: 474-130-004
BRUCE LONG
APN: 474-130-001
KENNETH & BARBARA
HADSELL
APN: 474-130-002
KENNETH & BARBARA
HADSELL
APN: 474-130-003
TSD ENGINEERING, INC.
31 Natoma Street, Suite #160Folsom, CA 95630Phone: (916) 608-0707Fax: (916) 608-0701
expect more.
PFE ROAD
PROVIDENCE PARKDRAINAGE MANAGEMENT AREA MAP
PLACER COUNTY, CA
FLOOD ZONEPROJECT IS LOCATED WITHIN FLOOD ZONESDESIGNATED AS AE, BASE FLOOD ELEVATIONSDETERMINED, AND X, AREAS DETERMINED TOBE OUTSIDE THE 500-YEAR FLOOD PLAIN PERFLOOD INSURANCE PROGRAM COMMUNITYPANEL NO. 06061C0483G DATED NOVEMBER 21,2001.
(NGVD29) RM130A PK NAIL AND METAL DISC STAMPED "303"IN THE TOP SOUTHEAST CORNER OF THECONCRETE HEADWALL OF THE PFE ROADBRIDGE 0.13 MILE ± WEST OF VIKING PLACE.
COUNTY OF PLACER DATUMBENCHMARK: ELEV.=106.995
N
S
EW
scale: 1"=20'
N. A
NT
ELO
PE R
OA
D
DMA 1
TOT. AREA=4.08 AC
IMP. AREA=2.04 AC
EAST VILLAGE
CENTRALVILLAGE
WESTVILLAGE
DMA 2
TOT. AREA=4.44 AC
IMP. AREA=2.22 AC
DMA 3
TOT. AREA=4.78 AC
IMP. AREA=2.39 AC
DMA 5
TOT. AREA=5.19 AC
IMP. AREA=2.59 AC
DMA 6
TOT. AREA=1.81 AC
IMP. AREA=0.89 AC DMA 7
TOT. AREA=1.81 AC
IMP. AREA=0.91 AC
DMA 9
TOT. AREA=1.00 AC
IMP. AREA=0.20 AC
DMA 11
TOT. AREA=3.57 AC
IMP. AREA=1.79 AC
DMA 12
TOT. AREA=2.82 AC
IMP. AREA=1.41 AC
DMA 13
TOT. AREA=0.99 AC
IMP. AREA=0.50 ACDMA 14
TOT. AREA=2.10 AC
IMP. AREA=1.05 AC
DMA 15
TOT. AREA=2.69 AC
IMP. AREA=1.34 AC
DMA 16
TOT. AREA=1.46 AC
IMP. AREA=0.73 AC
DMA 17
TOT. AREA=1.92 AC
IMP. AREA=0.96 AC
DMA 18
TOT. AREA=2.74 AC
IMP. AREA=1.37 AC
DMA 19
TOT. AREA=2.74 AC
IMP. AREA=1.37 AC
DMA 20
TOT. AREA=1.73 AC
IMP. AREA=0.87 AC
DMA 21
TOT. AREA=0.54 AC
IMP. AREA=0.27 AC
DMA 22
TOT. AREA=1.71 AC
IMP. AREA=0.85 AC
DMA 23
TOT. AREA=1.27 AC
IMP. AREA=0.63 AC
DMA 24
TOT. AREA=1.89 AC
IMP. AREA=0.95 AC
DMA 25
TOT. AREA=1.30 AC
IMP. AREA=0.65 AC
DMA 26
TOT. AREA=2.86 AC
IMP. AREA=1.43 AC
DMA 27
TOT. AREA=3.70 AC
IMP. AREA=1.85 AC
DMA 28
TOT. AREA=2.36 AC
IMP. AREA=1.18 AC
DMA 10
TOT. AREA=4.44 AC
IMP. AREA=2.22 AC
DMA 8
TOT. AREA=0.64 AC
IMP. AREA=0.32 AC
DMA 29
(WEST VILLAGE ROW)
TOT. AREA=4.36 AC
IMP. AREA=3.26 AC
DMA 30
(CENTRAL VILLAGE ROW)
TOT. AREA=4.98 AC
IMP. AREA=3.72 AC
DMA 31
(EAST VILLAGE ROW)
TOT. AREA=4.37 AC
IMP. AREA=3.30 AC
AutoCAD SHX Text
103
AutoCAD SHX Text
137.99
AutoCAD SHX Text
110
AutoCAD SHX Text
145.05
AutoCAD SHX Text
117
AutoCAD SHX Text
134.97
AutoCAD SHX Text
111
AutoCAD SHX Text
127.16
AutoCAD SHX Text
120
AutoCAD SHX Text
125
AutoCAD SHX Text
125
AutoCAD SHX Text
125
AutoCAD SHX Text
130
AutoCAD SHX Text
130
AutoCAD SHX Text
130
AutoCAD SHX Text
130
AutoCAD SHX Text
130
AutoCAD SHX Text
130
AutoCAD SHX Text
130
AutoCAD SHX Text
130
AutoCAD SHX Text
130
AutoCAD SHX Text
130
AutoCAD SHX Text
135
AutoCAD SHX Text
135
AutoCAD SHX Text
135
AutoCAD SHX Text
135
AutoCAD SHX Text
135
AutoCAD SHX Text
135
AutoCAD SHX Text
135
AutoCAD SHX Text
135
AutoCAD SHX Text
135
AutoCAD SHX Text
135
AutoCAD SHX Text
135
AutoCAD SHX Text
135
AutoCAD SHX Text
135
AutoCAD SHX Text
135
AutoCAD SHX Text
135
AutoCAD SHX Text
140
AutoCAD SHX Text
140
AutoCAD SHX Text
140
AutoCAD SHX Text
140
AutoCAD SHX Text
140
AutoCAD SHX Text
140
AutoCAD SHX Text
140
AutoCAD SHX Text
140
AutoCAD SHX Text
140
AutoCAD SHX Text
140
AutoCAD SHX Text
140
AutoCAD SHX Text
140
AutoCAD SHX Text
140
AutoCAD SHX Text
140
AutoCAD SHX Text
140
AutoCAD SHX Text
140
AutoCAD SHX Text
140
AutoCAD SHX Text
140
AutoCAD SHX Text
140
AutoCAD SHX Text
140
AutoCAD SHX Text
140
AutoCAD SHX Text
145
AutoCAD SHX Text
145
AutoCAD SHX Text
145
AutoCAD SHX Text
145
AutoCAD SHX Text
145
AutoCAD SHX Text
145
AutoCAD SHX Text
145
AutoCAD SHX Text
145
AutoCAD SHX Text
145
AutoCAD SHX Text
145
AutoCAD SHX Text
145
AutoCAD SHX Text
145
AutoCAD SHX Text
145
AutoCAD SHX Text
145
AutoCAD SHX Text
145
AutoCAD SHX Text
145
AutoCAD SHX Text
145
AutoCAD SHX Text
145
AutoCAD SHX Text
150
AutoCAD SHX Text
150
AutoCAD SHX Text
150
AutoCAD SHX Text
150
AutoCAD SHX Text
150
AutoCAD SHX Text
150
AutoCAD SHX Text
150
AutoCAD SHX Text
155
AutoCAD SHX Text
155
AutoCAD SHX Text
155
AutoCAD SHX Text
155
AutoCAD SHX Text
155
AutoCAD SHX Text
140
AutoCAD SHX Text
140
AutoCAD SHX Text
140
AutoCAD SHX Text
105
AutoCAD SHX Text
105
AutoCAD SHX Text
105
AutoCAD SHX Text
105
AutoCAD SHX Text
105
AutoCAD SHX Text
110
AutoCAD SHX Text
110
AutoCAD SHX Text
110
AutoCAD SHX Text
110
AutoCAD SHX Text
110
AutoCAD SHX Text
110
AutoCAD SHX Text
110
AutoCAD SHX Text
110
AutoCAD SHX Text
110
AutoCAD SHX Text
110
AutoCAD SHX Text
110
AutoCAD SHX Text
110
AutoCAD SHX Text
115
AutoCAD SHX Text
115
AutoCAD SHX Text
115
AutoCAD SHX Text
115
AutoCAD SHX Text
115
AutoCAD SHX Text
115
AutoCAD SHX Text
115
AutoCAD SHX Text
115
AutoCAD SHX Text
115
AutoCAD SHX Text
115
AutoCAD SHX Text
115
AutoCAD SHX Text
115
AutoCAD SHX Text
115
AutoCAD SHX Text
115
AutoCAD SHX Text
115
AutoCAD SHX Text
115
AutoCAD SHX Text
120
AutoCAD SHX Text
120
AutoCAD SHX Text
120
AutoCAD SHX Text
120
AutoCAD SHX Text
120
AutoCAD SHX Text
120
AutoCAD SHX Text
120
AutoCAD SHX Text
120
AutoCAD SHX Text
120
AutoCAD SHX Text
120
AutoCAD SHX Text
120
AutoCAD SHX Text
120
AutoCAD SHX Text
120
AutoCAD SHX Text
120
AutoCAD SHX Text
125
AutoCAD SHX Text
125
AutoCAD SHX Text
125
AutoCAD SHX Text
125
AutoCAD SHX Text
125
AutoCAD SHX Text
125
AutoCAD SHX Text
125
AutoCAD SHX Text
125
AutoCAD SHX Text
130
AutoCAD SHX Text
130
AutoCAD SHX Text
130
AutoCAD SHX Text
130
AutoCAD SHX Text
130
AutoCAD SHX Text
130
AutoCAD SHX Text
130
AutoCAD SHX Text
135
AutoCAD SHX Text
135
AutoCAD SHX Text
135
AutoCAD SHX Text
135
AutoCAD SHX Text
140
AutoCAD SHX Text
140
AutoCAD SHX Text
140
AutoCAD SHX Text
208
AutoCAD SHX Text
118.27
AutoCAD SHX Text
113
AutoCAD SHX Text
128.57
AutoCAD SHX Text
201
AutoCAD SHX Text
116.82
AutoCAD SHX Text
140
AutoCAD SHX Text
125
AutoCAD SHX Text
120
AutoCAD SHX Text
115
AutoCAD SHX Text
110
AutoCAD SHX Text
105
AutoCAD SHX Text
110
AutoCAD SHX Text
10" Tree w/20' Spread
AutoCAD SHX Text
14" Tree w/28' Spread
AutoCAD SHX Text
15" Tree w/30' Spread
AutoCAD SHX Text
14" Tree w/30' Spread TAG 721
AutoCAD SHX Text
10" Tree w/45' Spread X5 TAG 720
AutoCAD SHX Text
11" Tree w/33' Spread X3
AutoCAD SHX Text
10" Tree w/20' Spread
AutoCAD SHX Text
6" Tree w/25' Spread X4
AutoCAD SHX Text
8" Tree w/15' Spread
AutoCAD SHX Text
5" Tree w/12' Spread
AutoCAD SHX Text
10" Tree w/20' Spread
AutoCAD SHX Text
8" Tree w/15' Spread
AutoCAD SHX Text
10" Tree w/35' Spread X2 TAG 719
AutoCAD SHX Text
24" Tree w/48' Spread
AutoCAD SHX Text
8" Tree w/15' Spread
AutoCAD SHX Text
11" Tree w/20' Spread
AutoCAD SHX Text
11" Tree w/20' Spread
AutoCAD SHX Text
11" Tree w/20' Spread
AutoCAD SHX Text
11" Tree w/20' Spread
AutoCAD SHX Text
8" Tree w/22' Spread X3
AutoCAD SHX Text
10" Tree w/18' Spread
AutoCAD SHX Text
10" Tree w/18' Spread
AutoCAD SHX Text
32" Tree w/55' Spread
AutoCAD SHX Text
25" Tree w/50' Spread
AutoCAD SHX Text
24" Tree w/50' Spread 7.55FT
AutoCAD SHX Text
24" Tree w/50' Spread LO
AutoCAD SHX Text
W
AutoCAD SHX Text
ANTENNA
AutoCAD SHX Text
ANTENNA
AutoCAD SHX Text
WATER TANK
AutoCAD SHX Text
GUY ANCHOR
AutoCAD SHX Text
EM
AutoCAD SHX Text
ELECTRICAL METER
AutoCAD SHX Text
WOOD OR WIRE FENCE
AutoCAD SHX Text
UNDERGROUND GAS LINE
AutoCAD SHX Text
OFFICIAL RECORDS OF PLACER COUNTY
AutoCAD SHX Text
FOUND MONUMENT AS NOTED
AutoCAD SHX Text
135
AutoCAD SHX Text
ELEVATION CONTOUR
AutoCAD SHX Text
UTILITY POLE
AutoCAD SHX Text
OVERHEAD UTILITY LINES
AutoCAD SHX Text
W
AutoCAD SHX Text
CHAIN LINK FENCE
AutoCAD SHX Text
ELECTRICAL METER
AutoCAD SHX Text
WATER BOX
AutoCAD SHX Text
SIGN
AutoCAD SHX Text
MANHOLE
AutoCAD SHX Text
TUBULAR STEEL FENCE
AutoCAD SHX Text
TAG 702
AutoCAD SHX Text
9
AutoCAD SHX Text
16
AutoCAD SHX Text
17
AutoCAD SHX Text
8
AutoCAD SHX Text
9
AutoCAD SHX Text
16
AutoCAD SHX Text
17
AutoCAD SHX Text
8
AutoCAD SHX Text
9
AutoCAD SHX Text
16
AutoCAD SHX Text
17
AutoCAD SHX Text
8
AutoCAD SHX Text
24" Tree w/40' Spread
AutoCAD SHX Text
CPT
AutoCAD SHX Text
CPT
AutoCAD SHX Text
CPT
AutoCAD SHX Text
CPT
AutoCAD SHX Text
CPT
AutoCAD SHX Text
3801
AutoCAD SHX Text
3802
AutoCAD SHX Text
3803
AutoCAD SHX Text
3808
AutoCAD SHX Text
3809
AutoCAD SHX Text
3810
AutoCAD SHX Text
3804
AutoCAD SHX Text
3814
AutoCAD SHX Text
3811
AutoCAD SHX Text
3816
AutoCAD SHX Text
3807
AutoCAD SHX Text
3815
AutoCAD SHX Text
3819
AutoCAD SHX Text
3818
AutoCAD SHX Text
3817
AutoCAD SHX Text
3816
AutoCAD SHX Text
3826
AutoCAD SHX Text
3820
AutoCAD SHX Text
3823
AutoCAD SHX Text
3824
AutoCAD SHX Text
3835
AutoCAD SHX Text
3834
AutoCAD SHX Text
3833
AutoCAD SHX Text
3832
AutoCAD SHX Text
3829
AutoCAD SHX Text
3822
AutoCAD SHX Text
3828
AutoCAD SHX Text
3825
AutoCAD SHX Text
3836
AutoCAD SHX Text
3837
AutoCAD SHX Text
3840
AutoCAD SHX Text
3839
AutoCAD SHX Text
3845
AutoCAD SHX Text
3844
AutoCAD SHX Text
3846
AutoCAD SHX Text
3847
AutoCAD SHX Text
3849
AutoCAD SHX Text
3850
AutoCAD SHX Text
3851
AutoCAD SHX Text
3854
AutoCAD SHX Text
3853
AutoCAD SHX Text
3865
AutoCAD SHX Text
3866
AutoCAD SHX Text
3886
AutoCAD SHX Text
3867
AutoCAD SHX Text
3870
AutoCAD SHX Text
3877
AutoCAD SHX Text
3883
AutoCAD SHX Text
3884
AutoCAD SHX Text
3879
AutoCAD SHX Text
3878
AutoCAD SHX Text
3944
AutoCAD SHX Text
3943
AutoCAD SHX Text
3940
AutoCAD SHX Text
3941
AutoCAD SHX Text
3938
AutoCAD SHX Text
3937
AutoCAD SHX Text
3934
AutoCAD SHX Text
3933
AutoCAD SHX Text
3931
AutoCAD SHX Text
3925
AutoCAD SHX Text
3924
AutoCAD SHX Text
3921
AutoCAD SHX Text
3920
AutoCAD SHX Text
3917
AutoCAD SHX Text
3918
AutoCAD SHX Text
3914
AutoCAD SHX Text
3894
AutoCAD SHX Text
3898
AutoCAD SHX Text
3895
AutoCAD SHX Text
3902
AutoCAD SHX Text
3892
AutoCAD SHX Text
3904
AutoCAD SHX Text
3903
AutoCAD SHX Text
3908
AutoCAD SHX Text
3906
AutoCAD SHX Text
3913
AutoCAD SHX Text
3915
AutoCAD SHX Text
3885
AutoCAD SHX Text
3887
AutoCAD SHX Text
3888
AutoCAD SHX Text
3889
AutoCAD SHX Text
3896
AutoCAD SHX Text
3806
AutoCAD SHX Text
3812
AutoCAD SHX Text
3813
AutoCAD SHX Text
9
AutoCAD SHX Text
10
AutoCAD SHX Text
11
AutoCAD SHX Text
12
AutoCAD SHX Text
13
AutoCAD SHX Text
14
AutoCAD SHX Text
15
AutoCAD SHX Text
16
AutoCAD SHX Text
17
AutoCAD SHX Text
18
AutoCAD SHX Text
19
AutoCAD SHX Text
20
AutoCAD SHX Text
21
AutoCAD SHX Text
22
AutoCAD SHX Text
61
AutoCAD SHX Text
62
AutoCAD SHX Text
63
AutoCAD SHX Text
64
AutoCAD SHX Text
65
AutoCAD SHX Text
66
AutoCAD SHX Text
67
AutoCAD SHX Text
68
AutoCAD SHX Text
69
AutoCAD SHX Text
52
AutoCAD SHX Text
53
AutoCAD SHX Text
54
AutoCAD SHX Text
55
AutoCAD SHX Text
56
AutoCAD SHX Text
57
AutoCAD SHX Text
58
AutoCAD SHX Text
59
AutoCAD SHX Text
60
AutoCAD SHX Text
43
AutoCAD SHX Text
44
AutoCAD SHX Text
45
AutoCAD SHX Text
46
AutoCAD SHX Text
47
AutoCAD SHX Text
48
AutoCAD SHX Text
49
AutoCAD SHX Text
50
AutoCAD SHX Text
51
AutoCAD SHX Text
33
AutoCAD SHX Text
35
AutoCAD SHX Text
36
AutoCAD SHX Text
37
AutoCAD SHX Text
38
AutoCAD SHX Text
39
AutoCAD SHX Text
40
AutoCAD SHX Text
41
AutoCAD SHX Text
42
AutoCAD SHX Text
23
AutoCAD SHX Text
24
AutoCAD SHX Text
25
AutoCAD SHX Text
26
AutoCAD SHX Text
27
AutoCAD SHX Text
28
AutoCAD SHX Text
29
AutoCAD SHX Text
30
AutoCAD SHX Text
31
AutoCAD SHX Text
32
AutoCAD SHX Text
70
AutoCAD SHX Text
71
AutoCAD SHX Text
72
AutoCAD SHX Text
73
AutoCAD SHX Text
74
AutoCAD SHX Text
75
AutoCAD SHX Text
76
AutoCAD SHX Text
77
AutoCAD SHX Text
78
AutoCAD SHX Text
79
AutoCAD SHX Text
80
AutoCAD SHX Text
81
AutoCAD SHX Text
82
AutoCAD SHX Text
83
AutoCAD SHX Text
84
AutoCAD SHX Text
85
AutoCAD SHX Text
86
AutoCAD SHX Text
87
AutoCAD SHX Text
88
AutoCAD SHX Text
89
AutoCAD SHX Text
90
AutoCAD SHX Text
91
AutoCAD SHX Text
92
AutoCAD SHX Text
93
AutoCAD SHX Text
94
AutoCAD SHX Text
95
AutoCAD SHX Text
96
AutoCAD SHX Text
97
AutoCAD SHX Text
98
AutoCAD SHX Text
99
AutoCAD SHX Text
100
AutoCAD SHX Text
101
AutoCAD SHX Text
102
AutoCAD SHX Text
103
AutoCAD SHX Text
104
AutoCAD SHX Text
105
AutoCAD SHX Text
106
AutoCAD SHX Text
107
AutoCAD SHX Text
108
AutoCAD SHX Text
109
AutoCAD SHX Text
110
AutoCAD SHX Text
111
AutoCAD SHX Text
112
AutoCAD SHX Text
113
AutoCAD SHX Text
114
AutoCAD SHX Text
115
AutoCAD SHX Text
116
AutoCAD SHX Text
117
AutoCAD SHX Text
118
AutoCAD SHX Text
119
AutoCAD SHX Text
120
AutoCAD SHX Text
121
AutoCAD SHX Text
122
AutoCAD SHX Text
123
AutoCAD SHX Text
124
AutoCAD SHX Text
125
AutoCAD SHX Text
126
AutoCAD SHX Text
127
AutoCAD SHX Text
128
AutoCAD SHX Text
129
AutoCAD SHX Text
130
AutoCAD SHX Text
131
AutoCAD SHX Text
132
AutoCAD SHX Text
133
AutoCAD SHX Text
134
AutoCAD SHX Text
135
AutoCAD SHX Text
136
AutoCAD SHX Text
137
AutoCAD SHX Text
138
AutoCAD SHX Text
139
AutoCAD SHX Text
140
AutoCAD SHX Text
141
AutoCAD SHX Text
142
AutoCAD SHX Text
143
AutoCAD SHX Text
144
AutoCAD SHX Text
145
AutoCAD SHX Text
146
AutoCAD SHX Text
147
AutoCAD SHX Text
148
AutoCAD SHX Text
149
AutoCAD SHX Text
150
AutoCAD SHX Text
151
AutoCAD SHX Text
152
AutoCAD SHX Text
153
AutoCAD SHX Text
154
AutoCAD SHX Text
155
AutoCAD SHX Text
156
AutoCAD SHX Text
157
AutoCAD SHX Text
158
AutoCAD SHX Text
182
AutoCAD SHX Text
183
AutoCAD SHX Text
184
AutoCAD SHX Text
159
AutoCAD SHX Text
160
AutoCAD SHX Text
161
AutoCAD SHX Text
162
AutoCAD SHX Text
163
AutoCAD SHX Text
164
AutoCAD SHX Text
165
AutoCAD SHX Text
166
AutoCAD SHX Text
167
AutoCAD SHX Text
168
AutoCAD SHX Text
169
AutoCAD SHX Text
170
AutoCAD SHX Text
171
AutoCAD SHX Text
172
AutoCAD SHX Text
173
AutoCAD SHX Text
174
AutoCAD SHX Text
175
AutoCAD SHX Text
176
AutoCAD SHX Text
177
AutoCAD SHX Text
178
AutoCAD SHX Text
179
AutoCAD SHX Text
180
AutoCAD SHX Text
181
AutoCAD SHX Text
185
AutoCAD SHX Text
186
AutoCAD SHX Text
187
AutoCAD SHX Text
188
AutoCAD SHX Text
189
AutoCAD SHX Text
190
AutoCAD SHX Text
191
AutoCAD SHX Text
192
AutoCAD SHX Text
193
AutoCAD SHX Text
194
AutoCAD SHX Text
195
AutoCAD SHX Text
196
AutoCAD SHX Text
197
AutoCAD SHX Text
198
AutoCAD SHX Text
199
AutoCAD SHX Text
200
AutoCAD SHX Text
201
AutoCAD SHX Text
202
AutoCAD SHX Text
203
AutoCAD SHX Text
204
AutoCAD SHX Text
205
AutoCAD SHX Text
206
AutoCAD SHX Text
1
AutoCAD SHX Text
3
AutoCAD SHX Text
5
AutoCAD SHX Text
4
AutoCAD SHX Text
6
AutoCAD SHX Text
7
AutoCAD SHX Text
8
AutoCAD SHX Text
207
AutoCAD SHX Text
208
AutoCAD SHX Text
209
AutoCAD SHX Text
210
AutoCAD SHX Text
211
AutoCAD SHX Text
212
AutoCAD SHX Text
213
AutoCAD SHX Text
214
AutoCAD SHX Text
215
AutoCAD SHX Text
216
AutoCAD SHX Text
217
AutoCAD SHX Text
218
AutoCAD SHX Text
219
AutoCAD SHX Text
220
AutoCAD SHX Text
221
AutoCAD SHX Text
222
AutoCAD SHX Text
223
AutoCAD SHX Text
224
AutoCAD SHX Text
225
AutoCAD SHX Text
226
AutoCAD SHX Text
227
AutoCAD SHX Text
234
AutoCAD SHX Text
233
AutoCAD SHX Text
232
AutoCAD SHX Text
231
AutoCAD SHX Text
235
AutoCAD SHX Text
236
AutoCAD SHX Text
237
AutoCAD SHX Text
238
AutoCAD SHX Text
239
AutoCAD SHX Text
240
AutoCAD SHX Text
241
AutoCAD SHX Text
242
AutoCAD SHX Text
243
AutoCAD SHX Text
244
AutoCAD SHX Text
245
AutoCAD SHX Text
246
AutoCAD SHX Text
248
AutoCAD SHX Text
249
AutoCAD SHX Text
250
AutoCAD SHX Text
253
AutoCAD SHX Text
266
AutoCAD SHX Text
254
AutoCAD SHX Text
255
AutoCAD SHX Text
256
AutoCAD SHX Text
257
AutoCAD SHX Text
259
AutoCAD SHX Text
260
AutoCAD SHX Text
261
AutoCAD SHX Text
262
AutoCAD SHX Text
263
AutoCAD SHX Text
264
AutoCAD SHX Text
265
AutoCAD SHX Text
267
AutoCAD SHX Text
280
AutoCAD SHX Text
281
AutoCAD SHX Text
268
AutoCAD SHX Text
269
AutoCAD SHX Text
270
AutoCAD SHX Text
271
AutoCAD SHX Text
273
AutoCAD SHX Text
274
AutoCAD SHX Text
275
AutoCAD SHX Text
276
AutoCAD SHX Text
277
AutoCAD SHX Text
278
AutoCAD SHX Text
279
AutoCAD SHX Text
228
AutoCAD SHX Text
230
AutoCAD SHX Text
284
AutoCAD SHX Text
283
AutoCAD SHX Text
282
AutoCAD SHX Text
285
AutoCAD SHX Text
286
AutoCAD SHX Text
287
AutoCAD SHX Text
288
AutoCAD SHX Text
289
AutoCAD SHX Text
290
AutoCAD SHX Text
291
AutoCAD SHX Text
292
AutoCAD SHX Text
293
AutoCAD SHX Text
294
AutoCAD SHX Text
295
AutoCAD SHX Text
296
AutoCAD SHX Text
297
AutoCAD SHX Text
298
AutoCAD SHX Text
299
AutoCAD SHX Text
300
AutoCAD SHX Text
301
AutoCAD SHX Text
302
AutoCAD SHX Text
303
AutoCAD SHX Text
304
AutoCAD SHX Text
305
AutoCAD SHX Text
306
AutoCAD SHX Text
307
AutoCAD SHX Text
308
AutoCAD SHX Text
34
AutoCAD SHX Text
229
AutoCAD SHX Text
247
AutoCAD SHX Text
251
AutoCAD SHX Text
252
AutoCAD SHX Text
258
AutoCAD SHX Text
272
AutoCAD SHX Text
2
AutoCAD SHX Text
"D
AutoCAD SHX Text
24
AutoCAD SHX Text
"D
AutoCAD SHX Text
12
AutoCAD SHX Text
"D
AutoCAD SHX Text
18
AutoCAD SHX Text
"D
AutoCAD SHX Text
24
AutoCAD SHX Text
"D
AutoCAD SHX Text
24
AutoCAD SHX Text
"D
AutoCAD SHX Text
18
AutoCAD SHX Text
"D
AutoCAD SHX Text
12
AutoCAD SHX Text
"D
AutoCAD SHX Text
12
AutoCAD SHX Text
"D
AutoCAD SHX Text
12
AutoCAD SHX Text
"D
AutoCAD SHX Text
24
AutoCAD SHX Text
"D
AutoCAD SHX Text
12
AutoCAD SHX Text
"D
AutoCAD SHX Text
12
AutoCAD SHX Text
"D
AutoCAD SHX Text
12
AutoCAD SHX Text
"D
AutoCAD SHX Text
18
AutoCAD SHX Text
"D
AutoCAD SHX Text
18
AutoCAD SHX Text
"D
AutoCAD SHX Text
12
AutoCAD SHX Text
"D
AutoCAD SHX Text
12
AutoCAD SHX Text
"D
AutoCAD SHX Text
24
AutoCAD SHX Text
"D
AutoCAD SHX Text
18
AutoCAD SHX Text
"D
AutoCAD SHX Text
24
AutoCAD SHX Text
"D
AutoCAD SHX Text
18
AutoCAD SHX Text
"D
AutoCAD SHX Text
24
AutoCAD SHX Text
"D
AutoCAD SHX Text
24
AutoCAD SHX Text
"D
AutoCAD SHX Text
24
AutoCAD SHX Text
"D
AutoCAD SHX Text
24
AutoCAD SHX Text
"D
AutoCAD SHX Text
12
AutoCAD SHX Text
"D
AutoCAD SHX Text
12
AutoCAD SHX Text
"D
AutoCAD SHX Text
12
AutoCAD SHX Text
"D
AutoCAD SHX Text
12
AutoCAD SHX Text
"D
AutoCAD SHX Text
24
AutoCAD SHX Text
"D
AutoCAD SHX Text
24
AutoCAD SHX Text
"D
AutoCAD SHX Text
24
AutoCAD SHX Text
"D
AutoCAD SHX Text
12
AutoCAD SHX Text
"D
AutoCAD SHX Text
12
AutoCAD SHX Text
"D
AutoCAD SHX Text
12
AutoCAD SHX Text
"D
AutoCAD SHX Text
12
AutoCAD SHX Text
"D
AutoCAD SHX Text
12
AutoCAD SHX Text
"D
AutoCAD SHX Text
18
AutoCAD SHX Text
"D
AutoCAD SHX Text
12
AutoCAD SHX Text
"D
AutoCAD SHX Text
24
AutoCAD SHX Text
"D
AutoCAD SHX Text
24
AutoCAD SHX Text
"D
AutoCAD SHX Text
24
AutoCAD SHX Text
"D
AutoCAD SHX Text
18
AutoCAD SHX Text
"D
AutoCAD SHX Text
12
AutoCAD SHX Text
"D
AutoCAD SHX Text
24
AutoCAD SHX Text
"D
AutoCAD SHX Text
18
AutoCAD SHX Text
"D
AutoCAD SHX Text
12
AutoCAD SHX Text
"D
AutoCAD SHX Text
12
AutoCAD SHX Text
"D
AutoCAD SHX Text
12
AutoCAD SHX Text
"D
AutoCAD SHX Text
12
AutoCAD SHX Text
"D
AutoCAD SHX Text
12
AutoCAD SHX Text
"D
AutoCAD SHX Text
12
AutoCAD SHX Text
"D
AutoCAD SHX Text
24
AutoCAD SHX Text
BIKE
AutoCAD SHX Text
LANE
AutoCAD SHX Text
BIKE
AutoCAD SHX Text
LANE
AutoCAD SHX Text
BIKE
AutoCAD SHX Text
LANE
AutoCAD SHX Text
BIKE
AutoCAD SHX Text
LANE
AutoCAD SHX Text
BIKE
AutoCAD SHX Text
LANE
AutoCAD SHX Text
BIKE
AutoCAD SHX Text
LANE
AutoCAD SHX Text
BIKE
AutoCAD SHX Text
LANE
AutoCAD SHX Text
BIKE
AutoCAD SHX Text
LANE
AutoCAD SHX Text
BIKE
AutoCAD SHX Text
LANE
AutoCAD SHX Text
BIKE
AutoCAD SHX Text
LANE
AutoCAD SHX Text
BIKE
AutoCAD SHX Text
LANE
AutoCAD SHX Text
BIKE
AutoCAD SHX Text
LANE
AutoCAD SHX Text
DEVELOPED STORM WATER QUALITY DRAINAGE MANAGEMENT AREA MAP SEPTEMBER 20, 2016
AutoCAD SHX Text
SHEET 2/2
AutoCAD SHX Text
No. 58930 Exp. 6-30-176-30-17
AutoCAD SHX Text
100
AutoCAD SHX Text
50
AutoCAD SHX Text
100
AutoCAD SHX Text
0
AutoCAD SHX Text
50

YesNot Applicable
(Include brief explanation)
Define the development envelope and protected areas, identifying areas that are most
suitable for development areas to be left undisturbed.X
Concentrate development on portions of the site with less permeable soils and preserve areas
that can promote infiltration.NA, All onsite soils similar
Limit overall impervious coverage of the site with paving and roofs. X
Set back development from creeks, wetlands, and riparian habitats. X
Preserve significant trees. X
Conform site layout along natural landforms. X
Avoid excessive grading and disturbance of vegetation and soils. X
Replicate the site's natural drainage patterns. X
Detain and retain runoff throughout the site. X
Form 3‐2 Site Assessment and Layout Documentation
Topographic data with 1 ft. contoursExisting natural hydrologic features (depressions, watercourses, wetlands, riparian corridors)Environmentally sensitive areas and areas to be preserved.
Site BoundarySoil types and areal extents, test pit and infiltration test locations
Attach a Site Plan that incorporates the applicable considerations above. Ensure that the following items are included in the Site Plan:
Has this Item been considered in the Site Layout and
depicted in the Site Plan?
Proposed locations and footprints of improvements creating new, or replaced, impervious surfaces Potential pollutant sources and locationsEntire site divided into separate DMAs with unique identifiers Existing and proposed site drainage network with flow directions and site run‐on and discharge locationsProposed design features and surface treatments used to minimize imperviousness and reduce runoffProposed locations and footprints of treatment and hydromodification management facilitiesDesign features for managing authorized non‐stormwater dischargesAreas of soil and/or groundwater contaminationExisting utilities and easements
Maintenance areas

PresentNot
Applicable
Accidental spills or leaksAll materials will be stored inside and properly sealed
Interior floor drains
Parking/storage areas and maintenance
Indoor and structural pest controlEnvironmentally friendly materials will be used and will be stored
inside and properly sealed.
Pools, spas, ponds, decorative fountains,
and other water features
Landscape/outdoor pesticide useAll manufacturer recommendations and regulations will be followed.
Minimum amounts will be used.
Restaurants, grocery stores, and other food
service operations
Refuse areas
Industrial Processes
Outdoor storage of equipment or materials
Vehicle and equipment cleaning
Vehicle and equipment repair and
maintenance
Fuel dispensing areas
Loading docks
Fire sprinkler test waterTo be disposed in the santiary sewer
Drain or wash water from boiler drain lines,
condensate drain lines, rooftop equipment,
drainage sumps, and other sources
Unauthorized non‐storm water discharges
Building and grounds maintenanceLandscape maintenance and use of minumal fertilizers.
The source control measures identified in this table shall be designed consistent with recommendations from the CASQA Stormwater BMP
Handbook for New Development and Redevelopment1, or from another equivalent manual.
Describe the source control measures to be implemented for each
potential pollutant generating activity or source present on the
project as listed in Appendix C and in the CASQA Fact Sheets. Include
any special features, materials, or methods of construction that will
be used.
[1] California Stormwater BMP Handbook New Development and Redevelopment. California Stormwater Quality Association (CASQA).
January 2003.
Form 3‐3 Source Control Measures
Check OnePotential Pollutant Generating Activity or
Source

Site Design Measure
Runoff
Reduction
(ft3)
Runoff
Reduction
(ft3)
Runoff
Reduction
(ft3)
Runoff
Reduction
(ft3)
Aimp (ft2) impervious drainage area 0 0 0 0
V85 (in)runoff volume from 85th percentile,
24‐hour storm 0.8 0.8 0.8 0.8
Apond (ft2) ponding area 639 2520 3668 0
Dpond (ft) ponding depth 0.5 0.5 0.5 0.0
Asa (ft2) soil amendment area 639 2520 3668 0
Dsa (ft) depth of amended soil 2.5 2.5 2.5 0.0
n porosity of amended soil 0.3 0.3 0.3 0.0ne number of new evergreen trees 0 0 0 0nd number of new deciduous trees 32 70 47 0
Atc (ft2)
canopy area of existing trees to remain
on the property0 0 0 0
V85 (in)runoff volume from 85th percentile,
24‐hour storm 0.8 0.8 0.8 0.8
Aimp (ft2) impervious drainage area 88867 96741 104068 0
V85 (in)runoff volume from 85th percentile,
24‐hour storm 0.8 0.8 0.8 0.8
Ares (ft2) area of gravel storage layer
Dres (ft)depth of gravel storage layer
nagg porosity of aggregate
C efficiency factor
Aimp (ft2) impervious drainage area
V85 (in)runoff volume from 85th percentile,
24‐hour storm 0.8 0.8 0.8 0.8
N number of rain barrels and/or cisterns
Va (ft3)
volume of each rain barrel and/or cistern
Yes No
Runoff Reduction Parameters
1 2 3 41DMA ID No.
4 Tree Planting and
Preservation235
8 Rain Barrels and Cisterns
3150
02 Adjacent/On‐Site Stream
Setbacks and Buffers0 0 0
0 0 0
0 0
7025 0
0
7 Vegetated Swales 0
5999
3 Soil Quality Improvement
and Maintenance799 4585
135934 159405 0
10195 11955 0
515 346 0
6530
93770
0
6 Porous Pavement 0
5 Rooftop and Impervious
Area Disconnection
0 0 0
10 Total Volume Reduction (ft3) 7033
11 Effective Treated Impervious Area (ft2)
Form 3‐4 Runoff Reduction Calculator for Site Design Measures on Regulated Projects
9 Do all Site Design Measures meet the design requirements outlined in the Fact Sheets?

DMA ID No.
Runoff Reduction Parameters
Runoff
Reduction
(ft3)
Runoff
Reduction
(ft3)
Runoff
Reduction
(ft3)
Runoff
Reduction
(ft3)
Runoff
Reduction (ft3)
Runoff
Reduction
(ft3)
Runoff
Reduction (ft3)
Runoff
Reduction
(ft3)
impervious drainage area 0 0 0 0 0 0 0
runoff volume from 85th percentile,
24‐hour storm 0.8 0.8 0.8 0.8 0.8 0.8 0.8 0.8
ponding area 4596 1827 1340 1825 3656 1081 2467 4082
ponding depth 0.5 0.5 0.5 0.5 0.5 0.5 0.5 0.5
soil amendment area 4596 1827 1340 1825 3656 1081 2467 4082
depth of amended soil 2.5 2.5 2.5 2.5 2.5 2.5 2.5 2.5porosity of amended soil 0.3 0.3 0.3 0.3 0.3 0.3 0.3 0.3
number of new evergreen trees 0 0 0 0 0 0 0 0
number of new deciduous trees 51 19 18 11 34 39 31 29canopy area of existing trees to
remain on the property0 0 0 0 0 0 0 0
runoff volume from 85th percentile,
24‐hour storm 0.8 0.8 0.8 0.8 0.8 0.8 0.8 0.8
impervious drainage area 113037 38689 39450 13877 8712 96706 77776 61465
runoff volume from 85th percentile,
24‐hour storm 0.8 0.8 0.8 0.8 0.8 0.8 0.8 0.8
area of gravel storage layer
depth of gravel storage layer
porosity of aggregateefficiency factor
impervious drainage area runoff volume from 85th percentile,
24‐hour storm 0.8 0.8 0.8 0.8 0.8 0.8 0.8 0.8
number of rain barrels and/or cisterns
volume of each rain barrel and/or
cistern
Total Volume Reduction
Effective Treated Impervious Area
5 6 7 8
0 0 0 0
0
5745 2284 1675 2281
375 140 132 81
7630 2612 2663 937
0 0 0
5035 4470 3299
67134 59604 43985
13750
183336
0 0 0 0
0 0 0 0
0 0 0 0
9 10 11 12
250 287 228 213
4570 1351 3084 5103
0 0 0 0
588 6528 5250 4149
0 0 0 0
0 0 0 0
5408
72110
8166 8562 9465
108878 114156 126197
Form 3‐4 Runoff Reduction Calculator for Site Design Measures on Regulated Projects

DMA ID No.
Runoff Reduction Parameters
Runoff
Reduction
(ft3)
Runoff
Reduction
(ft3)
Runoff
Reduction
(ft3)
Runoff
Reduction
(ft3)
Runoff
Reduction
(ft3)
Runoff
Reduction
(ft3)
Runoff
Reduction
(ft3)
Runoff
Reduction
(ft3)
impervious drainage area 0 0 0 0 0 0 0 0
runoff volume from 85th percentile,
24‐hour storm 0.8 0.8 0.8 0.8 0.8 0.8 0.8 0.8
ponding area 914 1828 2041 1127 655 4082 4082 442
ponding depth 0.5 0.5 0.5 0.5 0.5 0.5 0.5 0.5
soil amendment area 914 1828 2041 1127 655 4082 4082 442
depth of amended soil 2.5 2.5 2.5 2.5 2.5 2.5 2.5 2.5porosity of amended soil 0.3 0.3 0.3 0.3 0.3 0.3 0.3 0.3
number of new evergreen trees 0 0 0 0 0 0 0 0
number of new deciduous trees 15 18 21 12 23 32 32 16canopy area of existing trees to remain
on the property0 0 0 0 0 0 0 0
runoff volume from 85th percentile,
24‐hour storm 0.8 0.8 0.8 0.8 0.8 0.8 0.8 0.8
impervious drainage area 21663 45733 58501 31790 41884 59611 59682 37688
runoff volume from 85th percentile,
24‐hour storm 0.8 0.8 0.8 0.8 0.8 0.8 0.8 0.8
area of gravel storage layer
depth of gravel storage layer
porosity of aggregateefficiency factor
impervious drainage area runoff volume from 85th percentile,
24‐hour storm 0.8 0.8 0.8 0.8 0.8 0.8 0.8 0.8
number of rain barrels and/or cisterns
volume of each rain barrel and/or
cistern
Total Volume Reduction
Effective Treated Impervious Area
14 15 16
0 0 0 0
13
2285 2551 1409
110 132 155 88
1143
3087 3949 2146
0 0 0 0
1462
0 0 0
0 0 0 0
0
0 0 0 0
17 18 19 20
169 235 235 118
819 5103 5103 553
0 0 0 0
2827 4024 4029 2544
0 0 0 0
0 0 0 0
2715 5504 6655 3643 3815 9362 9366 3214
36202 73392 88728 48572 50869 124822 124886 42855
Form 3‐4 Runoff Reduction Calculator for Site Design Measures on Regulated Projects

DMA ID No.
Runoff Reduction Parameters
Runoff
Reduction
(ft3)
Runoff
Reduction
(ft3)
Runoff
Reduction
(ft3)
Runoff
Reduction
(ft3)
Runoff
Reduction
(ft3)
Runoff
Reduction
(ft3)
Runoff
Reduction
(ft3)
Runoff
Reduction
(ft3)
impervious drainage area 0 0 0 0 0 0 0 0
runoff volume from 85th percentile,
24‐hour storm 0.8 0.8 0.8 0.8 0.8 0.8 0.8 0.8
ponding area 442 1828 818 3656 1165 3168 2467 901
ponding depth 0.5 0.5 0.5 0.5 0.5 0.5 0.5 0.5
soil amendment area 442 1828 818 3656 1165 3168 2467 901
depth of amended soil 2.5 2.5 2.5 2.5 2.5 2.5 2.5 2.5porosity of amended soil 0.3 0.3 0.3 0.3 0.3 0.3 0.3 0.3
number of new evergreen trees 0 0 0 0 0 0 0 0
number of new deciduous trees 10 18 19 24 16 30 37 22canopy area of existing trees to
remain on the property0 0 0 0 0 0 0 0
runoff volume from 85th percentile,
24‐hour storm 0.8 0.8 0.8 0.8 0.8 0.8 0.8 0.8
impervious drainage area 11736 37194 27715 41193 28454 62306 80493 51509
runoff volume from 85th percentile,
24‐hour storm 0.8 0.8 0.8 0.8 0.8 0.8 0.8 0.8
area of gravel storage layer
depth of gravel storage layer
porosity of aggregateefficiency factor
impervious drainage area runoff volume from 85th percentile,
24‐hour storm 0.8 0.8 0.8 0.8 0.8 0.8 0.8 0.8
number of rain barrels and/or cisterns
volume of each rain barrel and/or
cistern
Total Volume Reduction
Effective Treated Impervious Area
22 23 24
0 0 0 0
21
2285 1023 4570
74 132 140 177
553
2511 1871 2781
0 0 0 0
792
0 0 0
0 0 0 0
0
0 0 0 0
25 26 27 28
1921 4206 5433 3477
118 221 272 162
1456 3960 3084 1126
0 0 0 0
0 0 0 0
0 0 0 0
1418 4928
18910 65707
4765
40441 100361 46595 111818 117190
3033 7527 3495 8386 8789
63533
Form 3‐4 Runoff Reduction Calculator for Site Design Measures on Regulated Projects

DMA ID No.
Runoff Reduction Parameters
Runoff
Reduction
(ft3)
Runoff
Reduction
(ft3)
Runoff
Reduction
(ft3)
Runoff
Reduction
(ft3)
Runoff
Reduction
(ft3)
Runoff
Reduction
(ft3)
Runoff
Reduction
(ft3)
Runoff
Reduction
(ft3)
impervious drainage area 0 0
runoff volume from 85th percentile,
24‐hour storm 0.8 0.8 0.8 0.8 0.8 0.8 0.8 0.8
ponding area
ponding depth
soil amendment area
depth of amended soil porosity of amended soil
number of new evergreen trees
number of new deciduous treescanopy area of existing trees to
remain on the property
runoff volume from 85th percentile,
24‐hour storm 0.8 0.8 0.8 0.8 0.8 0.8 0.8 0.8
impervious drainage area 142013 162003 143885
runoff volume from 85th percentile,
24‐hour storm 0.8 0.8 0.8 0.8 0.8 0.8 0.8 0.8
area of gravel storage layer 48088 54816 46359
depth of gravel storage layer 1.3 1.3 1.3
porosity of aggregate 0.3 0.3 0.3efficiency factor 0.6 0.6 0.6
impervious drainage area runoff volume from 85th percentile,
24‐hour storm 0.8 0.8 0.8 0.8 0.8 0.8 0.8 0.8
number of rain barrels and/or cisterns
volume of each rain barrel and/or
cistern
Total Volume Reduction
Effective Treated Impervious Area
30 31 32
0 0 0 0
29
9586
0 0 0
0 0 0 0
0
0 0 0 0
0
10935 9712 0
10820
0 0 0
0 0
0 0 0 0
12827 10848 0
0 0 0 0
0 0 0 0
23762 20560 0
0 0 0 0
0 0 0 020406
272076 316829 274137 0
0 0 00
0 0 0 0
0 0
33 34 35 36
0 0 0 0
Form 3‐4 Runoff Reduction Calculator for Site Design Measures on Regulated Projects

DMA ID No. 1 2 3 4 5 6 7 8 9 10 11 12 13 14 15 16 17 18 19 20 21 22
1Total impervious area requiring treatment 88867 96741 104068 113037 38689 39450 13877 8712 96706 77776 61465 21663 45733 58501 31790 41884 59611 59682 37688 11736 37194
2 Impervious area untreated by Site Design
Measures (ft2)
Item 1 – Form 3‐4 Item 11
0 0 0 0 0 0 0 0 0 0 0 0 0 0 0 0 0 0 0 0 0 0
3Additional pervious area draining to BMP
(ft2)0 0 0 0 0 0 0 0 0 0 0 0 0 0 0 0 0 0 0 0 0
4 Composite DMA Runoff Coefficient (Rc)
Enter area weighted composite runoff
coefficient representing entire DMA
0.70 0.70 0.70 0.70 0.70 0.70 0.70 0.70 0.70 0.70 0.70 0.70 0.70 0.70 0.70 0.70 0.70 0.70 0.70 0.70 0.70
5 Water Quality Volume (WQV) (ft3)
WQV = 1/12 * [Item 2 + Item 3) *Item 4] *
Unit WQV
0 0 0 0 0 0 0 0 0 0 0 0 0 0 0 0 0 0 0 0 0 0
6 Water Quality Flow (WQF) (cfs)
WQF = 1/43,200 * [0.2* (Item 2 + Item 3) *
Item4]
0.000 0.000 0.000 0.000 0.000 0.000 0.000 0.000 0.000 0.000 0.000 0.000 0.000 0.000 0.000 0.000 0.000 0.000 0.000 0.000 0.000 0.000
DMA ID No. 23 24 25 26 27 28 29 30 31 32 33 34 35 36 37 38 39 40 41 42 43 44
1Total impervious area requiring treatment 27715 41193 28454 62306 80493 51509 142013 162003 143885
2 Impervious area untreated by Site Design
Measures (ft2)
Item 1 – Form 3‐4 Item 11
0 0 0 0 0 0 0 0 0 0 0 0 0 0 0 0 0 0 0 0 0 0
3Additional pervious area draining to BMP
(ft2)0 0 0 0 0 0 0 0 0
4 Composite DMA Runoff Coefficient (Rc)
Enter area weighted composite runoff
coefficient representing entire DMA
0.70 0.70 0.70 0.70 0.70 0.70 0.90 0.90 0.90
5 Water Quality Volume (WQV) (ft3)
WQV = 1/12 * [Item 2 + Item 3) *Item 4] *
Unit WQV
0 0 0 0 0 0 0 0 0 0 0 0 0 0 0 0 0 0 0 0 0 0
6 Water Quality Flow (WQF) (cfs)
WQF = 1/43,200 * [0.2* (Item 2 + Item 3) *
Item4]
0.000 0.000 0.000 0.000 0.000 0.000 0.000 0.000 0.000 0.000 0.000 0.000 0.000 0.000 0.000 0.000 0.000 0.000 0.000 0.000 0.000 0.000
Form 3‐5 Computation of Water Quality Design Criteria for Stormwater Treatment and Baseline Hydromodification Measures

1DMA ID No.
If combining multiple DMAs from Form 3‐5, enter a new
unique DMA ID No.
1 2 3
2WQV (ft3) Item 5 in Form 3‐5
If combining multiple DMAs from Form 3‐5, enter the sum
of their respective WQVs.
0 0 0
3Surface Loading Rate Maximum 5.0 in/hr 5 5 54BMP Surface Area (ft2)
Top of BMP639 2520 3668
5Infiltration rate of underlying soils (in/hr) 0.12 0.12 0.12
6Maximum ponding depth (ft)
BMP specific, see BMP design details0.5 0.5 0.5
7Ponding Depth (ft)
d BMP = Minimum of (1/12 * Item 5 * 48 hrs) or Item 6 0.5 0.5 0.5 ‐
8Infiltrating surface area, SA BMP (ft2)
Bottom of BMP639 2520 3668
9Planting media depth, d media (ft) 1.5 1.5 1.5
10Planting media porosity 0.30 0.30 0.3011Gravel depth, d media (ft)
Only included in certain BMP types 1.3 1.3 1.2
12Gravel porosity 0.30 0.30 0.3013Retention Volume (ft3)
V retention = Item 8 * [Item7 + (Item 9 * Item 10) + (Item 11 *
Item 12) + (1.5* (Item 5 / 12))]
833.9 3,288.6 4,764.7 ‐
14Untreated Volume (ft3)
V untreated = Item 2 – Item 13
If greater than zero, adjust BMP sizing variables and re‐
compute retention volume
0 0 0 0
15 Treated Flow Rate (ft3/s)
Qtreated = 1/43,200*(Item 3 * Item 4)0.0740 0.2917 0.4245 0.0000
16Total Treated Flow Rate for Project (ft3/s)
Q total = Sum of Item 15 for all DMAs
17Is WQV for each DMA treated on‐site? Yes x No
6.634
Form 3‐6 Volume‐Based Infiltrating Bioretention Measures

1DMA ID No.
If combining multiple DMAs from Form 3‐5, enter a new
unique DMA ID No.
5 6 7 8
2WQV (ft3) Item 5 in Form 3‐5
If combining multiple DMAs from Form 3‐5, enter the sum
of their respective WQVs.
0 0 0 0
3Surface Loading Rate Maximum 5.0 in/hr 5 5 5 54BMP Surface Area (ft2)
Top of BMP4596 1827 1340 1825
5Infiltration rate of underlying soils (in/hr) 0.12 0.12 0.12 0.12
6Maximum ponding depth (ft)
BMP specific, see BMP design details0.5 0.5 0.5 0.5
7Ponding Depth (ft)
d BMP = Minimum of (1/12 * Item 5 * 48 hrs) or Item 6 0.5 0.5 0.5 0.5
8Infiltrating surface area, SA BMP (ft2)
Bottom of BMP4596 1827 1340 1825
9Planting media depth, d media (ft) 1.5 1.5 1.5 1.5
10Planting media porosity 0.30 0.30 0.30 0.3011Gravel depth, d media (ft)
Only included in certain BMP types 1.3 1.3 1.3 1.3
12Gravel porosity 0.30 0.30 0.30 0.3013Retention Volume (ft3)
V retention = Item 8 * [Item7 + (Item 9 * Item 10) + (Item 11 *
Item 12) + (1.5* (Item 5 / 12))]
5,997.8 2,384.3 1,748.7 2,381.6
14Untreated Volume (ft3)
V untreated = Item 2 – Item 13
If greater than zero, adjust BMP sizing variables and re‐
compute retention volume
0 0 0 0
15 Treated Flow Rate (ft3/s)
Qtreated = 1/43,200*(Item 3 * Item 4)0.5319 0.2115 0.1551 0.2112
Form 3‐6 Volume‐Based Infiltrating Bioretention Measures

1DMA ID No.
If combining multiple DMAs from Form 3‐5, enter a new
unique DMA ID No.
9 10 11 12
2WQV (ft3) Item 5 in Form 3‐5
If combining multiple DMAs from Form 3‐5, enter the sum
of their respective WQVs.
0 0 0 0
3Surface Loading Rate Maximum 5.0 in/hr 5 5 5 54BMP Surface Area (ft2)
Top of BMP3656 1081 2467 4082
5Infiltration rate of underlying soils (in/hr) 0.12 0.12 0.12 0.12
6Maximum ponding depth (ft)
BMP specific, see BMP design details0.5 0.5 0.5 0.5
7Ponding Depth (ft)
d BMP = Minimum of (1/12 * Item 5 * 48 hrs) or Item 6 0.5 0.5 0.5 0.5
8Infiltrating surface area, SA BMP (ft2)
Bottom of BMP3656 1081 2467 4082
9Planting media depth, d media (ft) 1.5 1.5 1.5 1.5
10Planting media porosity 0.30 0.30 0.30 0.3011Gravel depth, d media (ft)
Only included in certain BMP types 1.3 1.3 1.3 1.3
12Gravel porosity 0.30 0.30 0.30 0.3013Retention Volume (ft3)
V retention = Item 8 * [Item7 + (Item 9 * Item 10) + (Item 11 *
Item 12) + (1.5* (Item 5 / 12))]
4,771.1 1,410.7 3,219.5 5,327.0
14Untreated Volume (ft3)
V untreated = Item 2 – Item 13
If greater than zero, adjust BMP sizing variables and re‐
compute retention volume
0 0 0 0
15 Treated Flow Rate (ft3/s)
Qtreated = 1/43,200*(Item 3 * Item 4)0.4231 0.1251 0.2855 0.4725
Form 3‐6 Volume‐Based Infiltrating Bioretention Measures

1DMA ID No.
If combining multiple DMAs from Form 3‐5, enter a new
unique DMA ID No.
13 14 15 16
2WQV (ft3) Item 5 in Form 3‐5
If combining multiple DMAs from Form 3‐5, enter the sum
of their respective WQVs.
0 0 0 0
3Surface Loading Rate Maximum 5.0 in/hr 5 5 5 54BMP Surface Area (ft2)
Top of BMP914 1828 2041 1127
5Infiltration rate of underlying soils (in/hr) 0.12 0.12 0.12 0.12
6Maximum ponding depth (ft)
BMP specific, see BMP design details0.5 0.5 0.5 0.5
7Ponding Depth (ft)
d BMP = Minimum of (1/12 * Item 5 * 48 hrs) or Item 6 0.5 0.5 0.5 0.5
8Infiltrating surface area, SA BMP (ft2)
Bottom of BMP914 1828 2041 1127
9Planting media depth, d media (ft) 1.5 1.5 1.5 1.5
10Planting media porosity 0.30 0.30 0.30 0.3011Gravel depth, d media (ft)
Only included in certain BMP types 1.3 1.3 1.3 1.3
12Gravel porosity 0.30 0.30 0.30 0.3013Retention Volume (ft3)
V retention = Item 8 * [Item7 + (Item 9 * Item 10) + (Item 11 *
Item 12) + (1.5* (Item 5 / 12))]
1,192.8 2,385.6 2,663.5 1,470.8
14Untreated Volume (ft3)
V untreated = Item 2 – Item 13
If greater than zero, adjust BMP sizing variables and re‐
compute retention volume
0 0 0 0
15 Treated Flow Rate (ft3/s)
Qtreated = 1/43,200*(Item 3 * Item 4)0.1058 0.2116 0.2362 0.1304
Form 3‐6 Volume‐Based Infiltrating Bioretention Measures
1DMA ID No.
If combining multiple DMAs from Form 3‐5, enter a new
unique DMA ID No.
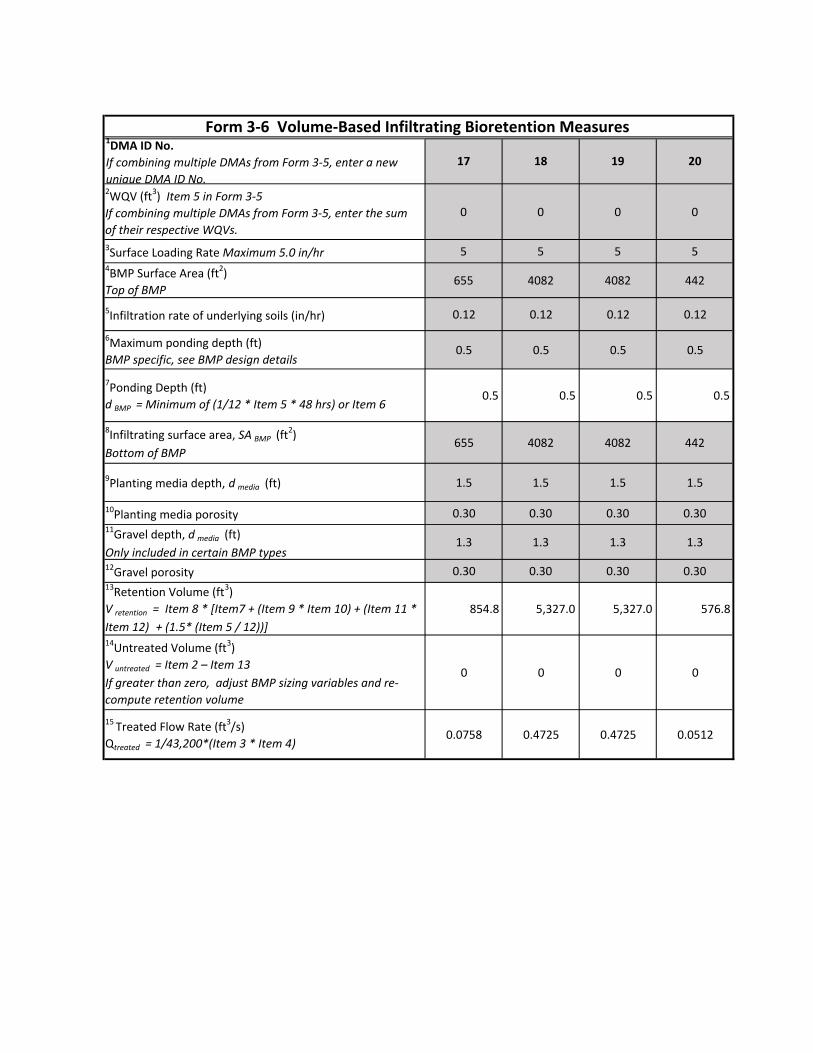
17 18 19 20
2WQV (ft3) Item 5 in Form 3‐5
If combining multiple DMAs from Form 3‐5, enter the sum
of their respective WQVs.
0 0 0 0
3Surface Loading Rate Maximum 5.0 in/hr 5 5 5 54BMP Surface Area (ft2)
Top of BMP655 4082 4082 442
5Infiltration rate of underlying soils (in/hr) 0.12 0.12 0.12 0.12
6Maximum ponding depth (ft)
BMP specific, see BMP design details0.5 0.5 0.5 0.5
7Ponding Depth (ft)
d BMP = Minimum of (1/12 * Item 5 * 48 hrs) or Item 6 0.5 0.5 0.5 0.5
8Infiltrating surface area, SA BMP (ft2)
Bottom of BMP655 4082 4082 442
9Planting media depth, d media (ft) 1.5 1.5 1.5 1.5
10Planting media porosity 0.30 0.30 0.30 0.3011Gravel depth, d media (ft)
Only included in certain BMP types 1.3 1.3 1.3 1.3
12Gravel porosity 0.30 0.30 0.30 0.3013Retention Volume (ft3)
V retention = Item 8 * [Item7 + (Item 9 * Item 10) + (Item 11 *
Item 12) + (1.5* (Item 5 / 12))]
854.8 5,327.0 5,327.0 576.8
14Untreated Volume (ft3)
V untreated = Item 2 – Item 13
If greater than zero, adjust BMP sizing variables and re‐
compute retention volume
0 0 0 0
15 Treated Flow Rate (ft3/s)
Qtreated = 1/43,200*(Item 3 * Item 4)0.0758 0.4725 0.4725 0.0512
Form 3‐6 Volume‐Based Infiltrating Bioretention Measures

1DMA ID No.
If combining multiple DMAs from Form 3‐5, enter a new
unique DMA ID No.
21 22 23 24
2WQV (ft3) Item 5 in Form 3‐5
If combining multiple DMAs from Form 3‐5, enter the sum
of their respective WQVs.
0 0 0 0
3Surface Loading Rate Maximum 5.0 in/hr 5 5 5 54BMP Surface Area (ft2)
Top of BMP442 1828 818 3656
5Infiltration rate of underlying soils (in/hr) 0.12 0.12 0.12 0.12
6Maximum ponding depth (ft)
BMP specific, see BMP design details0.5 0.5 0.5 0.5
7Ponding Depth (ft)
d BMP = Minimum of (1/12 * Item 5 * 48 hrs) or Item 6 0.5 0.5 0.5 0.5
8Infiltrating surface area, SA BMP (ft2)
Bottom of BMP442 1828 818 3656
9Planting media depth, d media (ft) 1.5 1.5 1.5 1.5
10Planting media porosity 0.30 0.30 0.30 0.3011Gravel depth, d media (ft)
Only included in certain BMP types 1.3 1.3 1.3 1.3
12Gravel porosity 0.30 0.30 0.30 0.3013Retention Volume (ft3)
V retention = Item 8 * [Item7 + (Item 9 * Item 10) + (Item 11 *
Item 12) + (1.5* (Item 5 / 12))]
576.8 2,385.6 1,067.5 4,771.1
14Untreated Volume (ft3)
V untreated = Item 2 – Item 13
If greater than zero, adjust BMP sizing variables and re‐
compute retention volume
0 0 0 0
15 Treated Flow Rate (ft3/s)
Qtreated = 1/43,200*(Item 3 * Item 4)0.0512 0.2116 0.0947 0.4231
Form 3‐6 Volume‐Based Infiltrating Bioretention Measures

1DMA ID No.
If combining multiple DMAs from Form 3‐5, enter a new
unique DMA ID No.
25 26 27 28
2WQV (ft3) Item 5 in Form 3‐5
If combining multiple DMAs from Form 3‐5, enter the sum
of their respective WQVs.
0 0 0 0
3Surface Loading Rate Maximum 5.0 in/hr 5 5 5 54BMP Surface Area (ft2)
Top of BMP1165 3168 2467 901
5Infiltration rate of underlying soils (in/hr) 0.12 0.12 0.12 0.12
6Maximum ponding depth (ft)
BMP specific, see BMP design details0.5 0.5 0.5 0.5
7Ponding Depth (ft)
d BMP = Minimum of (1/12 * Item 5 * 48 hrs) or Item 6 0.5 0.5 0.5 0.5
8Infiltrating surface area, SA BMP (ft2)
Bottom of BMP1165 3168 2467 901
9Planting media depth, d media (ft) 1.5 1.5 1.5 1.5
10Planting media porosity 0.30 0.30 0.30 0.3011Gravel depth, d media (ft)
Only included in certain BMP types 1.3 1.3 1.3 1.3
12Gravel porosity 0.50 0.30 0.30 0.3013Retention Volume (ft3)
V retention = Item 8 * [Item7 + (Item 9 * Item 10) + (Item 11 *
Item 12) + (1.5* (Item 5 / 12))]
1,811.6 4,134.3 3,219.5 1,175.8
14Untreated Volume (ft3)
V untreated = Item 2 – Item 13
If greater than zero, adjust BMP sizing variables and re‐
compute retention volume
0 0 0 0
15 Treated Flow Rate (ft3/s)
Qtreated = 1/43,200*(Item 3 * Item 4)0.1348 0.3667 0.2855 0.1043
Form 3‐6 Volume‐Based Infiltrating Bioretention Measures

1DMA ID No.
If combining multiple DMAs from Form 3‐5, enter a new
unique DMA ID No.
29 30 31
2WQV (ft3) Item 5 in Form 3‐5
If combining multiple DMAs from Form 3‐5, enter the sum
of their respective WQVs.
0 0 0
3Surface Loading Rate Maximum 5.0 in/hr 5 5 54BMP Surface Area (ft2)
Top of BMP0 0 0
5Infiltration rate of underlying soils (in/hr) 0.12 0.12 0.12
6Maximum ponding depth (ft)
BMP specific, see BMP design details0.0 0.0 0.0
7Ponding Depth (ft)
d BMP = Minimum of (1/12 * Item 5 * 48 hrs) or Item 6 ‐ ‐ ‐ ‐
8Infiltrating surface area, SA BMP (ft2)
Bottom of BMP0 0 0
9Planting media depth, d media (ft) 0.0 0.0 0.0
10Planting media porosity 0.00 0.00 0.0011Gravel depth, d media (ft)
Only included in certain BMP types 0.0 0.0 0.0
12Gravel porosity 0.00 0.00 0.0013Retention Volume (ft3)
V retention = Item 8 * [Item7 + (Item 9 * Item 10) + (Item 11 *
Item 12) + (1.5* (Item 5 / 12))]
0.0 0.0 0.0 ‐
14Untreated Volume (ft3)
V untreated = Item 2 – Item 13
If greater than zero, adjust BMP sizing variables and re‐
compute retention volume
0 0 0 0
15 Treated Flow Rate (ft3/s)
Qtreated = 1/43,200*(Item 3 * Item 4)0.0000 0.0000 0.0000 0.0000
Form 3‐6 Volume‐Based Infiltrating Bioretention Measures
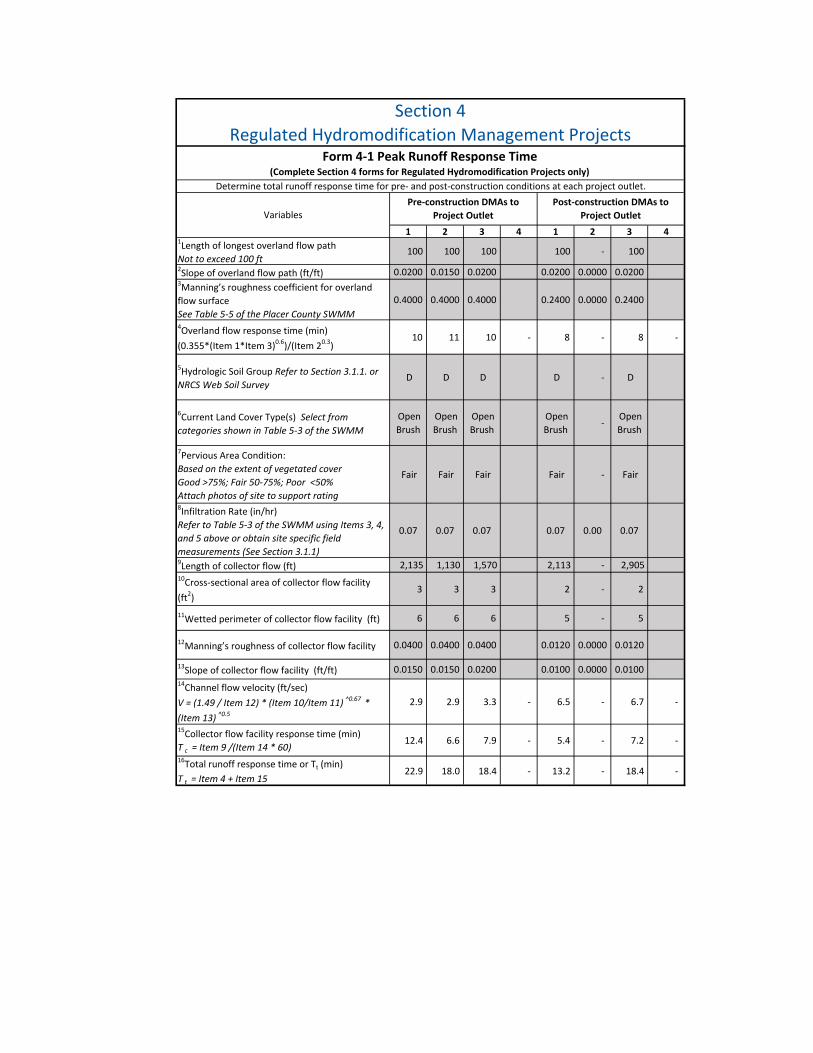
1 2 3 4 1 2 3 41Length of longest overland flow path
Not to exceed 100 ft 100 100 100 100 ‐ 100
2Slope of overland flow path (ft/ft) 0.0200 0.0150 0.0200 0.0200 0.0000 0.02003Manning’s roughness coefficient for overland
flow surface
See Table 5‐5 of the Placer County SWMM
0.4000 0.4000 0.4000 0.2400 0.0000 0.2400
4Overland flow response time (min)
(0.355*(Item 1*Item 3)0.6)/(Item 20.3) 10 11 10 ‐ 8 ‐ 8 ‐
5Hydrologic Soil Group Refer to Section 3.1.1. or
NRCS Web Soil Survey D D D D ‐ D
6Current Land Cover Type(s) Select from
categories shown in Table 5‐3 of the SWMM
Open
Brush
Open
Brush
Open
Brush
Open
Brush ‐
Open
Brush
7Pervious Area Condition:
Based on the extent of vegetated cover
Good >75%; Fair 50‐75%; Poor <50%
Attach photos of site to support rating
Fair Fair Fair Fair ‐ Fair
8Infiltration Rate (in/hr)
Refer to Table 5‐3 of the SWMM using Items 3, 4,
and 5 above or obtain site specific field
measurements (See Section 3.1.1)
0.07 0.07 0.07 0.07 0.00 0.07
9Length of collector flow (ft) 2,135 1,130 1,570 2,113 ‐ 2,905 10Cross‐sectional area of collector flow facility
(ft2) 3 3 3 2 ‐ 2
11Wetted perimeter of collector flow facility (ft) 6 6 6 5 ‐ 5
12Manning’s roughness of collector flow facility 0.0400 0.0400 0.0400 0.0120 0.0000 0.0120
13Slope of collector flow facility (ft/ft) 0.0150 0.0150 0.0200 0.0100 0.0000 0.0100
14Channel flow velocity (ft/sec)
V = (1.49 / Item 12) * (Item 10/Item 11) ^0.67 *
(Item 13) ^0.5 2.9 2.9 3.3 ‐ 6.5 ‐ 6.7 ‐
15Collector flow facility response time (min)
T c = Item 9 /(Item 14 * 60) 12.4 6.6 7.9 ‐ 5.4 ‐ 7.2 ‐
16Total runoff response time or Tt (min)
T t = Item 4 + Item 15 22.9 18.0 18.4 ‐ 13.2 ‐ 18.4 ‐
Section 4
Regulated Hydromodification Management Projects
Variables
Form 4‐1 Peak Runoff Response Time (Complete Section 4 forms for Regulated Hydromodification Projects only)
Pre‐construction DMAs to
Project Outlet
Post‐construction DMAs to
Project Outlet
Determine total runoff response time for pre‐ and post‐construction conditions at each project outlet.

1 2 3 4 1 2 3 4
2,122,679 861,181 1,998,533 1,969,348 ‐ 3,016,094
212,268 0 0 1,575,478 0 2,412,875
0.28 0.25 0.25 0.21 0.00 0.25
0.73 0.83 0.82 ‐ 0.97 ‐ 0.82 ‐
0.12 0.12 0.12 ‐ 0.12 ‐ 0.12 ‐
30.46 14.06 32.14 ‐ 43.33 ‐ 55.27 ‐
7Total Pre‐Project Peak Runof (ft3/s)
Q total = Sum of Item 6 for all Pre‐
construction DMAs 76.668 Is the total post‐project peak runoff equal
to or less than the total pre‐project peak
runoff?
Yes, if Item 7 is greater than or equal to the
sum of the Total Treated Flow Rates from
Form 3‐6 Item 16 and 3‐7 Item 12.
YES
6 Peak runoff from DMAs (cfs)
Q p = Item 1 * Item 4 – Item 5 * (Item 1 ‐
Item 2)
Form 4‐2 Hydromodification Target for Peak Runoff
Pre‐construction DMAs to Project Outlet Post‐construction DMAs to Project Outlet
5 Infiltration factor (cfs/acre)
F i = Form 4‐1 Item 8 * (1 + 1 /(1.3 + 0.0005
* Form 3‐1 Item 3))
Variables
1 Drainage Area (ft2)
Sum of all outlet level DMAs should equal
total project area.
2 Impervious Area (ft2)
Sum of all outlet level DMAs should equal
total project impervious area.
3 Rainfall depth for 2yr storm with duration
equal to response time (in)
See Placer County SWMM Table 5‐A‐1 for
elevation of site and duration equal to
response time
4 Unit peak runoff (cfs/acre)
q = 60/Form 4‐1 Item 16 * Item 3
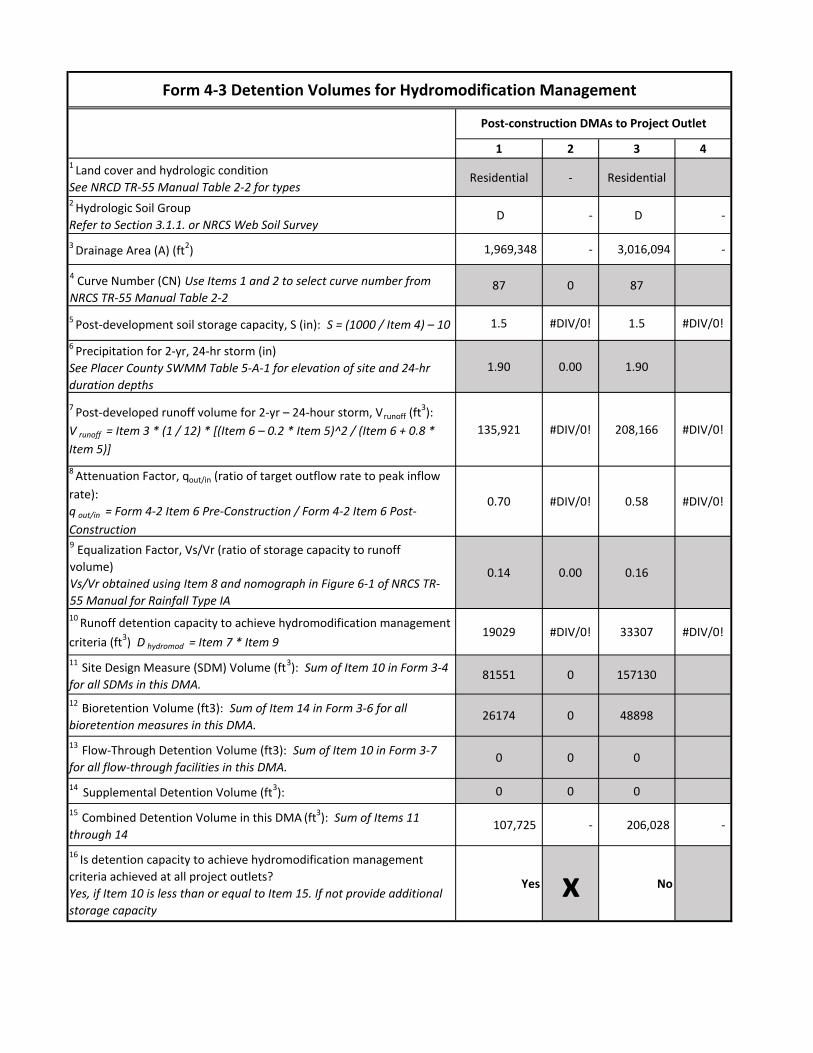
1 2 3 41 Land cover and hydrologic condition
See NRCD TR‐55 Manual Table 2‐2 for typesResidential ‐ Residential
2 Hydrologic Soil Group
Refer to Section 3.1.1. or NRCS Web Soil Survey D ‐ D ‐
3 Drainage Area (A) (ft
2) 1,969,348 ‐ 3,016,094 ‐
4 Curve Number (CN) Use Items 1 and 2 to select curve number from
NRCS TR‐55 Manual Table 2‐287 0 87
5 Post‐development soil storage capacity, S (in): S = (1000 / Item 4) – 10 1.5 #DIV/0! 1.5 #DIV/0!
6 Precipitation for 2‐yr, 24‐hr storm (in)
See Placer County SWMM Table 5‐A‐1 for elevation of site and 24‐hr
duration depths
1.90 0.00 1.90
7 Post‐developed runoff volume for 2‐yr – 24‐hour storm, Vrunoff (ft3):
V runoff = Item 3 * (1 / 12) * [(Item 6 – 0.2 * Item 5)^2 / (Item 6 + 0.8 *
Item 5)]
135,921 #DIV/0! 208,166 #DIV/0!
8 Attenuation Factor, qout/in (ratio of target outflow rate to peak inflow
rate):
q out/in = Form 4‐2 Item 6 Pre‐Construction / Form 4‐2 Item 6 Post‐
Construction
0.70 #DIV/0! 0.58 #DIV/0!
9 Equalization Factor, Vs/Vr (ratio of storage capacity to runoff
volume)
Vs/Vr obtained using Item 8 and nomograph in Figure 6‐1 of NRCS TR‐
55 Manual for Rainfall Type IA
0.14 0.00 0.16
10 Runoff detention capacity to achieve hydromodification management
criteria (ft3) D hydromod = Item 7 * Item 9 19029 #DIV/0! 33307 #DIV/0!
11 Site Design Measure (SDM) Volume (ft3): Sum of Item 10 in Form 3‐4
for all SDMs in this DMA.81551 0 157130
12 Bioretention
Volume (ft3): Sum of Item 14 in Form 3‐6 for all
bioretention measures in this DMA.26174 0 48898
13 Flow‐Through Detention Volume (ft3): Sum of Item 10 in Form 3‐7
for all flow‐through facilities in this DMA.0 0 0
14 Supplemental Detention Volume (ft
3): 0 0 0
15 Combined Detention Volume in this DMA (ft3): Sum of Items 11
through 14 107,725 ‐ 206,028 ‐
16 Is detention capacity to achieve hydromodification management
criteria achieved at all project outlets?
Yes, if Item 10 is less than or equal to Item 15. If not provide additional
storage capacity
Yes x No
Form 4‐3 Detention Volumes for Hydromodification Management
Post‐construction DMAs to Project Outlet

BMP Inspection Point and Frequency Maintenance Activity Required
Inlets and outlets / Quarterly or as
needed
Remove debris
Plants and Vegatation / Monthly Irrigate, weed ccontrol, trim grasses
Check for standing water / 72 hours
after rain event
Remove debris from outlet
Pest Control / Monthly Implement environmentally friendly
pest control.Inspect surface / Quarterly Check for sediment, debris
accumulation, pavement failure.Check for standing water / 30 minutes
after rain event
Remove debris
Inspect underdrain outlets / October 1
and mid rainy season
Remove debris
Preventative Cleaning / Quarterly or as
needed per surface inspection
surface cleaning using vacuum sweeper
and power washing.
Form 5‐1 BMP Inspection and Maintenance
Permable
Pavement
Bio‐Retention
Basins
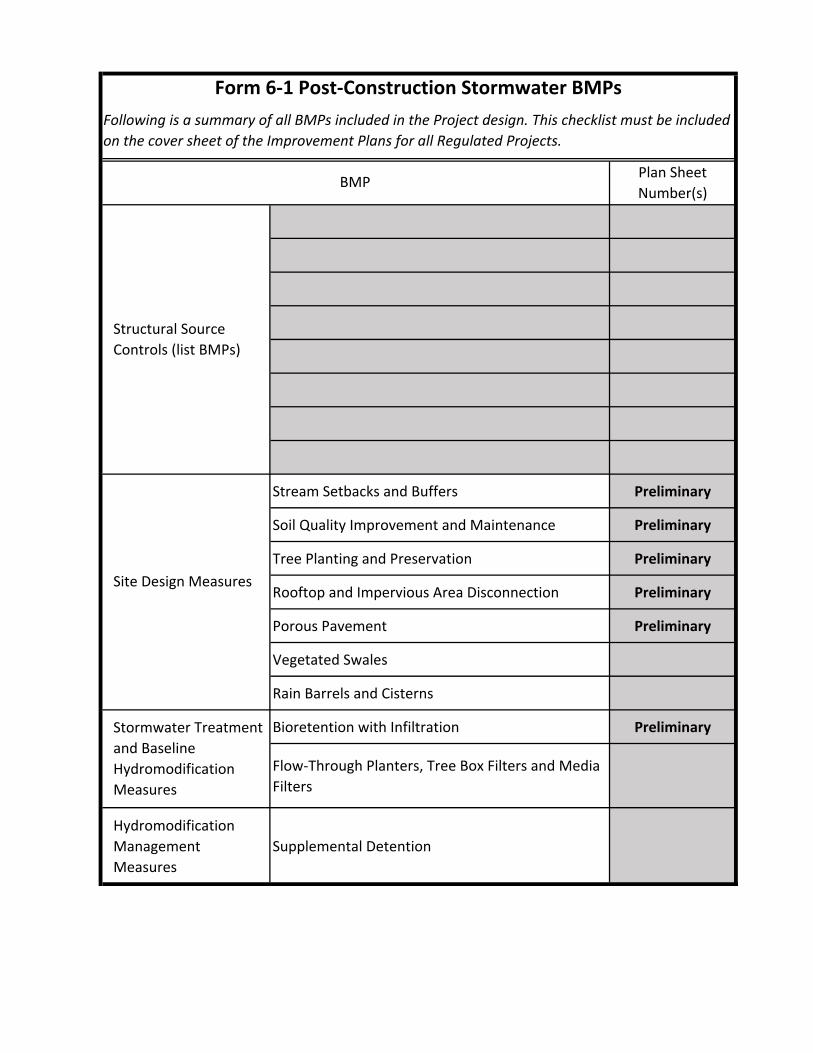
Plan Sheet
Number(s)
Stream Setbacks and Buffers Preliminary
Soil Quality Improvement and Maintenance Preliminary
Tree Planting and Preservation Preliminary
Rooftop and Impervious Area Disconnection Preliminary
Porous Pavement Preliminary
Vegetated Swales
Rain Barrels and Cisterns
Bioretention with Infiltration Preliminary
Flow‐Through Planters, Tree Box Filters and Media
Filters
Hydromodification
Management
Measures
Supplemental Detention
Structural Source
Controls (list BMPs)
Stormwater Treatment
and Baseline
Hydromodification
Measures
Form 6‐1 Post‐Construction Stormwater BMPs
Following is a summary of all BMPs included in the Project design. This checklist must be included
on the cover sheet of the Improvement Plans for all Regulated Projects.
BMP
Site Design Measures