For-profit colleges are a growing sector - The...
29
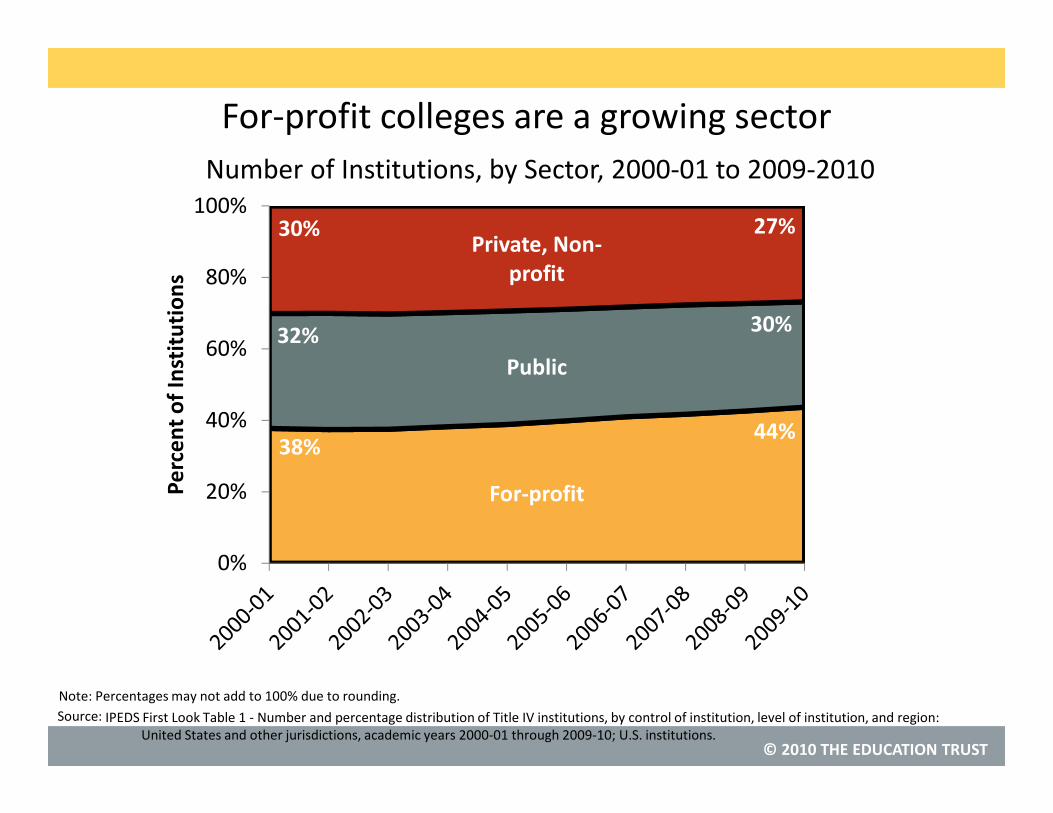
© 2010 THE EDUCATION TRUST Source: For-profit colleges are a growing sector IPEDS First Look Table 1 -Number and percentage distribution of Title IV institutions, by control of institution, level of institution, and region: United States and other jurisdictions, academic years 2000-01 through 2009-10; U.S. institutions. For-profit Public Private, Non- profit 0% 20% 40% 60% 80% 100% Percent of Institutions 38% 32% 30% 44% 30% 27% Number of Institutions, by Sector, 2000-01 to 2009-2010 Note:Percentages may not add to 100% due to rounding.
Transcript of For-profit colleges are a growing sector - The...
© 2010 THE EDUCATION TRUST
Source:
For-profit colleges are a growing sector
IPEDS First Look Table 1 - Number and percentage distribution of Title IV institutions, by control of institution, level of institution, and region:
United States and other jurisdictions, academic years 2000-01 through 2009-10; U.S. institutions.
For-profit
Public
Private, Non-
profit
0%
20%
40%
60%
80%
100%
Pe
rce
nt
of
Inst
itu
tio
ns
38%
32%
30%
44%
30%
27%
Number of Institutions, by Sector, 2000-01 to 2009-2010
Note: Percentages may not add to 100% due to rounding.

© 2010 THE EDUCATION TRUST
Source:
For-profits enroll 12% of all college students, and 60%
of for-profit students are enrolled in 4-yr institutions
Ed Trust analysis of IPEDS, 12-Month Enrollment Survey, 12-month unduplicated headcount enrollment at Title IV U.S. institutions, 2008-09.
Public
75%
Private,
non-profit
13%
For-profit
12%
Enrollment at
all colleges and universities
4-yr
60%
2-yr
24%
Less than
2-yr
16%
Enrollment at for-profit
colleges and universities
© 2010 THE EDUCATION TRUST
Source:
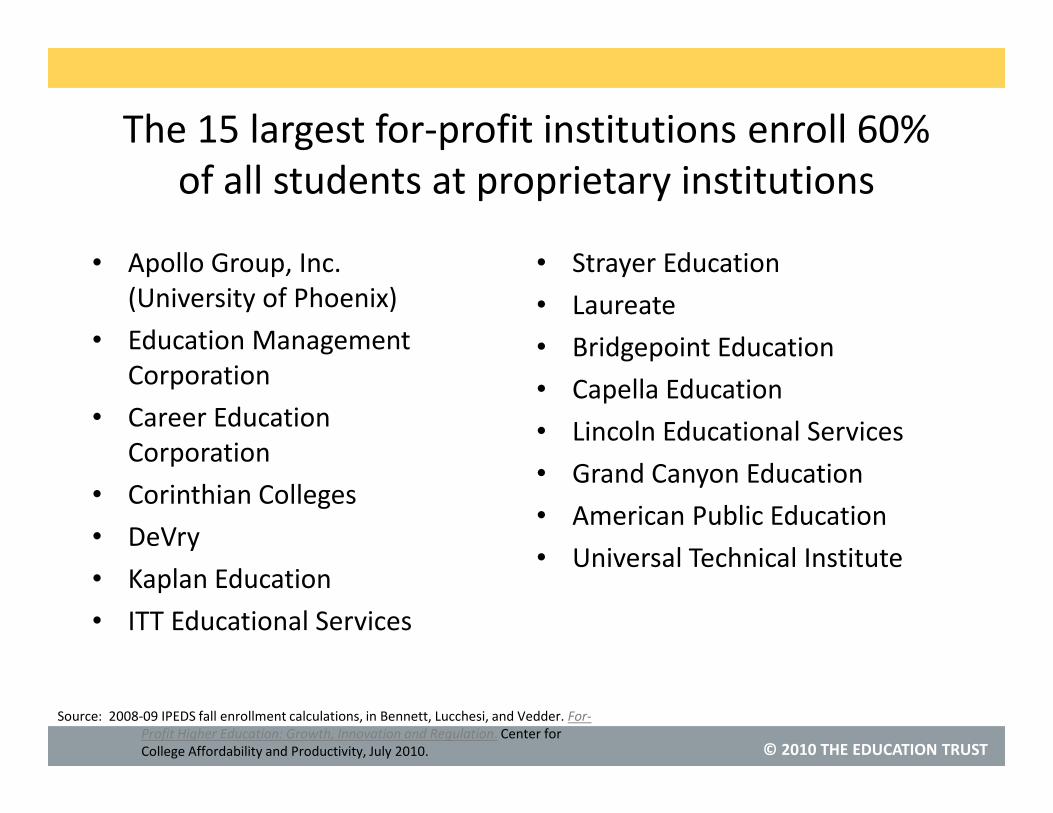
The 15 largest for-profit institutions enroll 60%
of all students at proprietary institutions
• Apollo Group, Inc.
(University of Phoenix)
• Education Management
Corporation
• Career Education
Corporation
• Corinthian Colleges
• DeVry
• Kaplan Education
• ITT Educational Services
2008-09 IPEDS fall enrollment calculations, in Bennett, Lucchesi, and Vedder. For-
Profit Higher Education: Growth, Innovation and Regulation. Center for
College Affordability and Productivity, July 2010.
• Strayer Education
• Laureate
• Bridgepoint Education
• Capella Education
• Lincoln Educational Services
• Grand Canyon Education
• American Public Education
• Universal Technical Institute
© 2010 THE EDUCATION TRUST
Source:
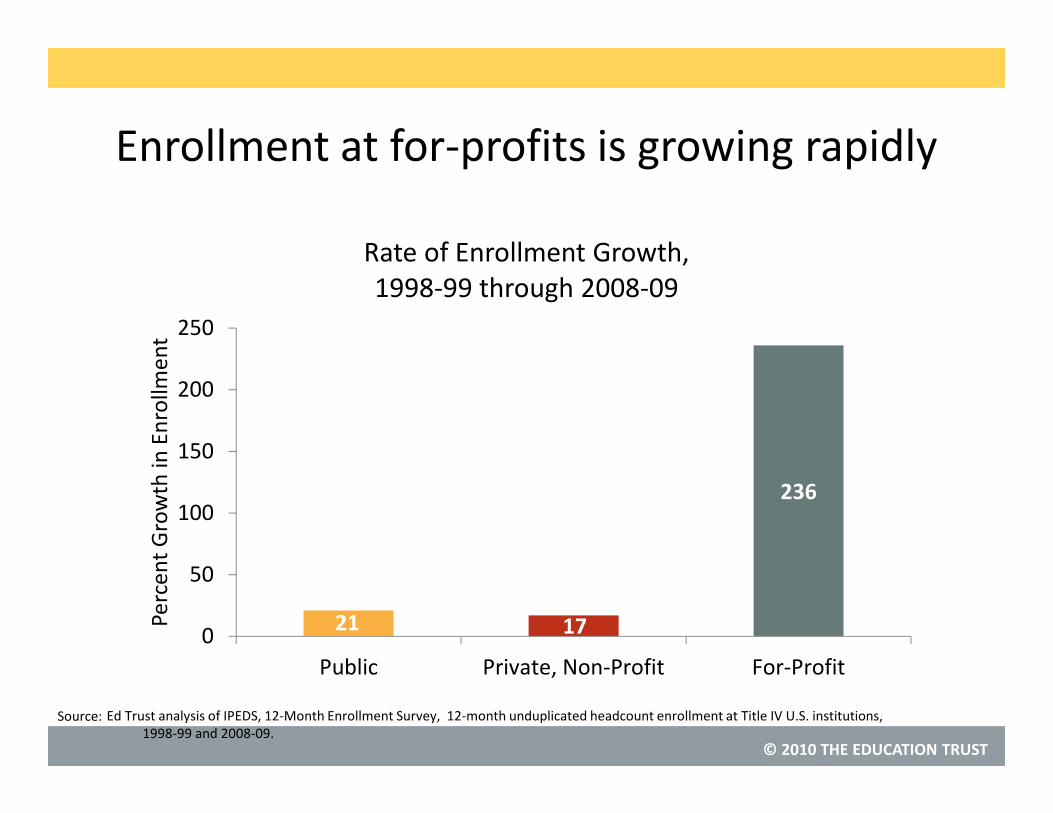
Enrollment at for-profits is growing rapidly
Ed Trust analysis of IPEDS, 12-Month Enrollment Survey, 12-month unduplicated headcount enrollment at Title IV U.S. institutions,
1998-99 and 2008-09.
21 17
236
0
50
100
150
200
250
Public Private, Non-Profit For-Profit
Pe
rce
nt
Gro
wth
in E
nro
llme
nt
Rate of Enrollment Growth,
1998-99 through 2008-09

© 2010 THE EDUCATION TRUST
Source:
Last fall, the University of Phoenix
enrolled more students than
the entire sector did in 1991.
TICAS analysis of 1991 and 2009 IPEDS fall enrollment data, Fall Enrollment Survey, in “Testimony of Lauren
Asher, President, The Institute for College Access & Success Before the Senate Committee on Health,
Education, Labor, and Pensions Hearing on the Federal Investment in For-Profit Education: Are Students
Succeeding?” September 30, 2010.
© 2010 THE EDUCATION TRUST
Source:
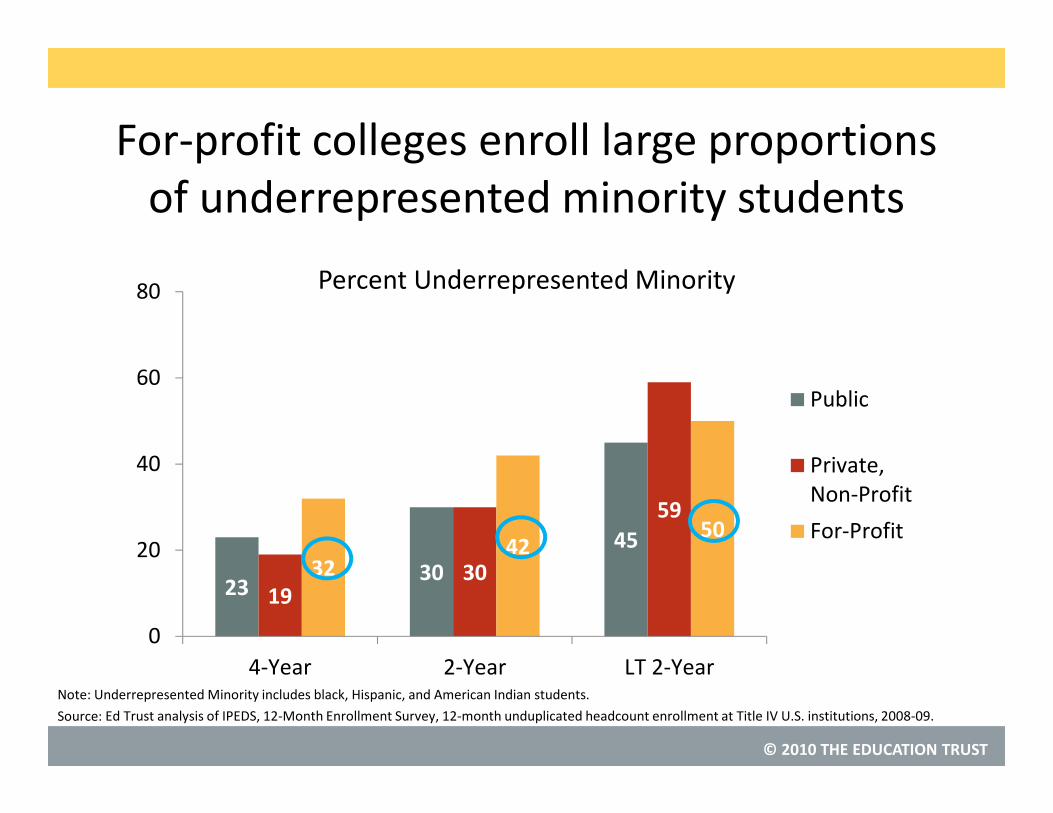
For-profit colleges enroll large proportions
of underrepresented minority students
2330
45
1930
59
3242
50
0
20
40
60
80
4-Year 2-Year LT 2-Year
Percent Underrepresented Minority
Public
Private,
Non-Profit
For-Profit
Ed Trust analysis of IPEDS, 12-Month Enrollment Survey, 12-month unduplicated headcount enrollment at Title IV U.S. institutions, 2008-09.
Note: Underrepresented Minority includes black, Hispanic, and American Indian students.
© 2010 THE EDUCATION TRUST
Source:
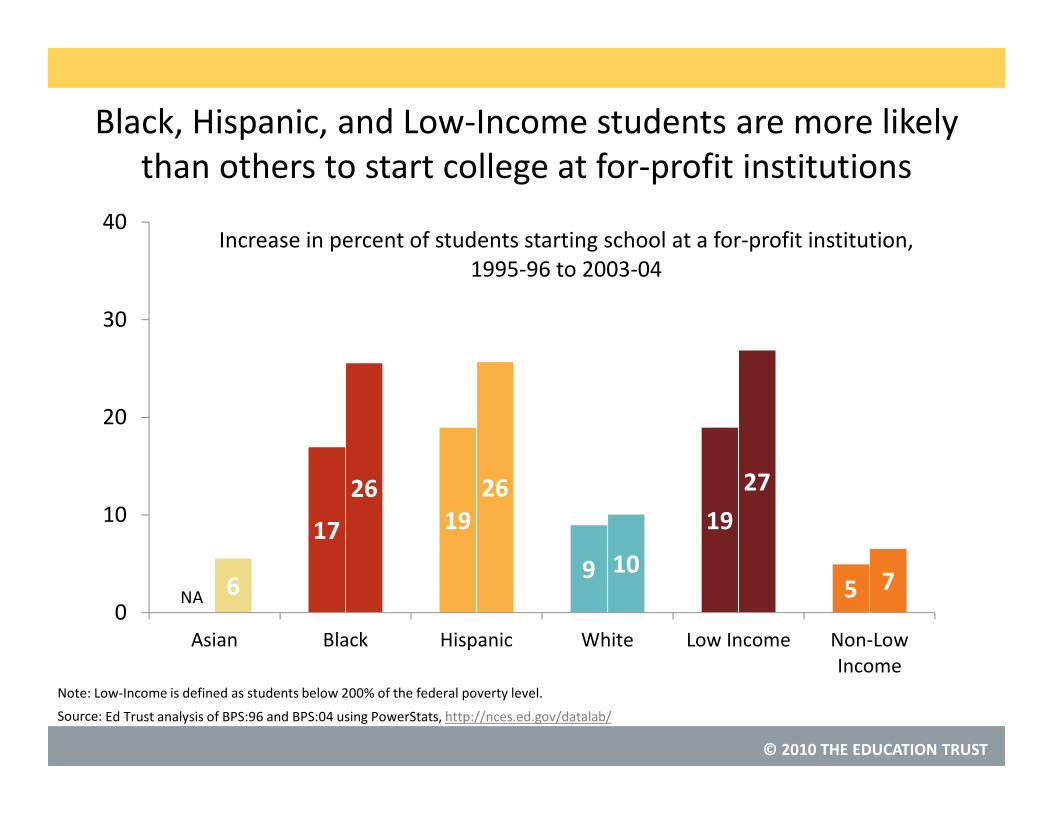
Black, Hispanic, and Low-Income students are more likely
than others to start college at for-profit institutions
Ed Trust analysis of BPS:96 and BPS:04 using PowerStats, http://nces.ed.gov/datalab/
17 19
9
19
56
26 26
10
27
70
10
20
30
40
Asian Black Hispanic White Low Income Non-Low
Income
Increase in percent of students starting school at a for-profit institution,
1995-96 to 2003-04
NA
Note: Low-Income is defined as students below 200% of the federal poverty level.
© 2010 THE EDUCATION TRUST
Source:
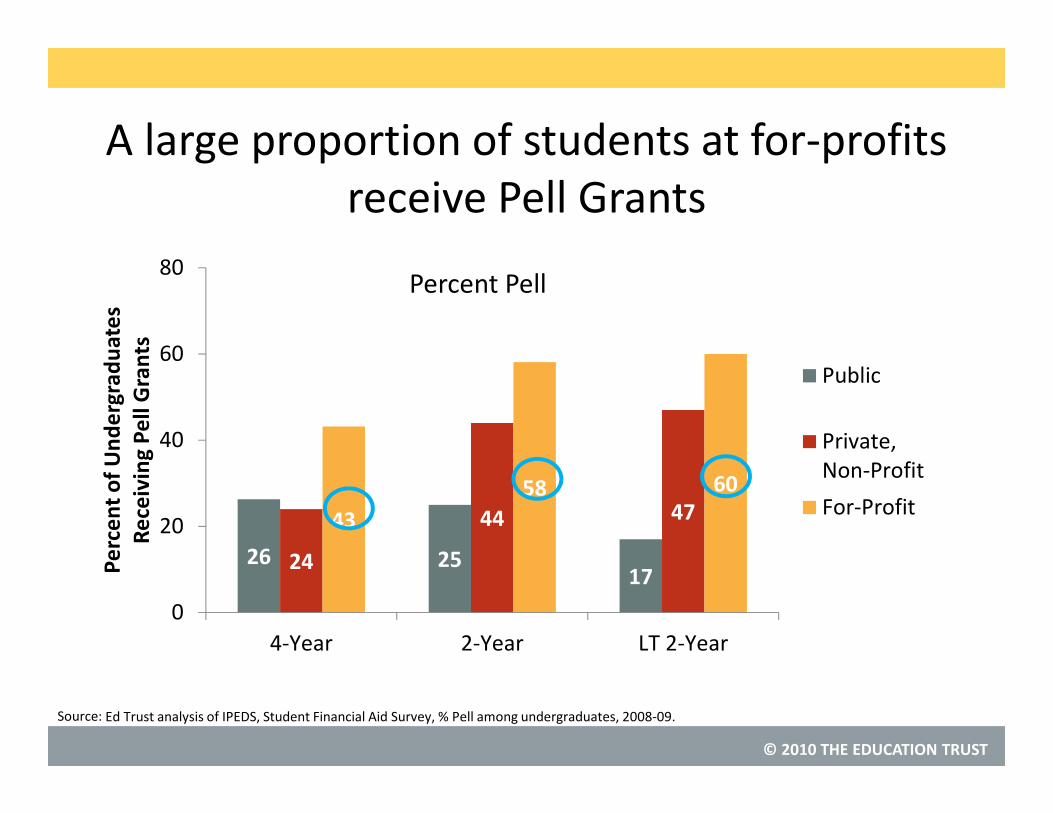
A large proportion of students at for-profits
receive Pell Grants
Ed Trust analysis of IPEDS, Student Financial Aid Survey, % Pell among undergraduates, 2008-09.
26 2517
24
44 4743
58 60
0
20
40
60
80
4-Year 2-Year LT 2-Year
Pe
rce
nt
of
Un
de
rgra
du
ate
s
Re
ceiv
ing
Pe
ll G
ran
ts
Percent Pell
Public
Private,
Non-Profit
For-Profit
© 2010 THE EDUCATION TRUST
Source:
About 12% of all students are enrolled at
for-profit colleges, but 20% of black
students and 24% of Pell recipients are
concentrated in these schools.
Ed Trust analysis of IPEDS, 12-Month Enrollment Survey, 12-month unduplicated headcount enrollment at Title IV
U.S. institutions, 2008-09 and Federal Pell Grant Program End-of-Year report, 2008-09, Table 5: Distribution
of Federal Pell Grant Recipients by Expected Family Contribution and Type and Control of Institution.

© 2010 THE EDUCATION TRUST
Source:
The federal government is investing billions of
taxpayer dollars in for-profit colleges each year.
Majority staff calculation of data provided by U.S. Department of Education in “Emerging Risk?:
An Overview of Growth, Spending, Student Debt and Unanswered Questions in For-Profit
Higher Education.” Senate HELP Committee. 24 June 2010.
© 2010 THE EDUCATION TRUST
Source:
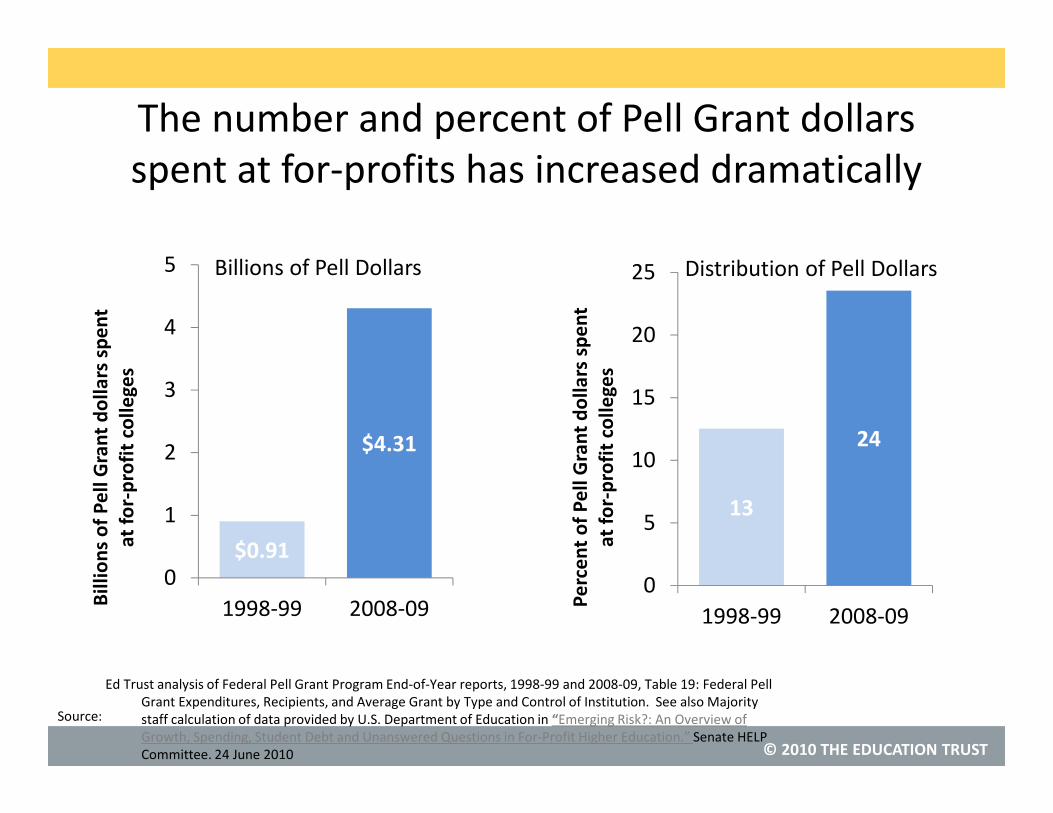
The number and percent of Pell Grant dollars
spent at for-profits has increased dramatically
Ed Trust analysis of Federal Pell Grant Program End-of-Year reports, 1998-99 and 2008-09, Table 19: Federal Pell
Grant Expenditures, Recipients, and Average Grant by Type and Control of Institution. See also Majority
staff calculation of data provided by U.S. Department of Education in “Emerging Risk?: An Overview of
Growth, Spending, Student Debt and Unanswered Questions in For-Profit Higher Education.” Senate HELP
Committee. 24 June 2010
$0.91
$4.31
0
1
2
3
4
5
1998-99 2008-09Bil
lio
ns
of
Pe
ll G
ran
t d
oll
ars
sp
en
t
at
for-
pro
fit
coll
eg
es
Billions of Pell Dollars
13
24
0
5
10
15
20
25
1998-99 2008-09
Pe
rce
nt
of
Pe
ll G
ran
t d
oll
ars
sp
en
t
at
for-
pro
fit
coll
eg
es
Distribution of Pell Dollars
© 2010 THE EDUCATION TRUST
Source:
In 2009-10, one institution
—University of Phoenix—
became the first college ever to receive
over $1 billion in Pell Grant funding.
2009-2010 Award Year Grant Volume by School, Department of Education Data Center in “U of Phoenix Makes History.” The Quick and the Ed.
20 July 2010. http://www.quickanded.com/2010/07/phoenix-makes-history.html
© 2010 THE EDUCATION TRUST
Source:
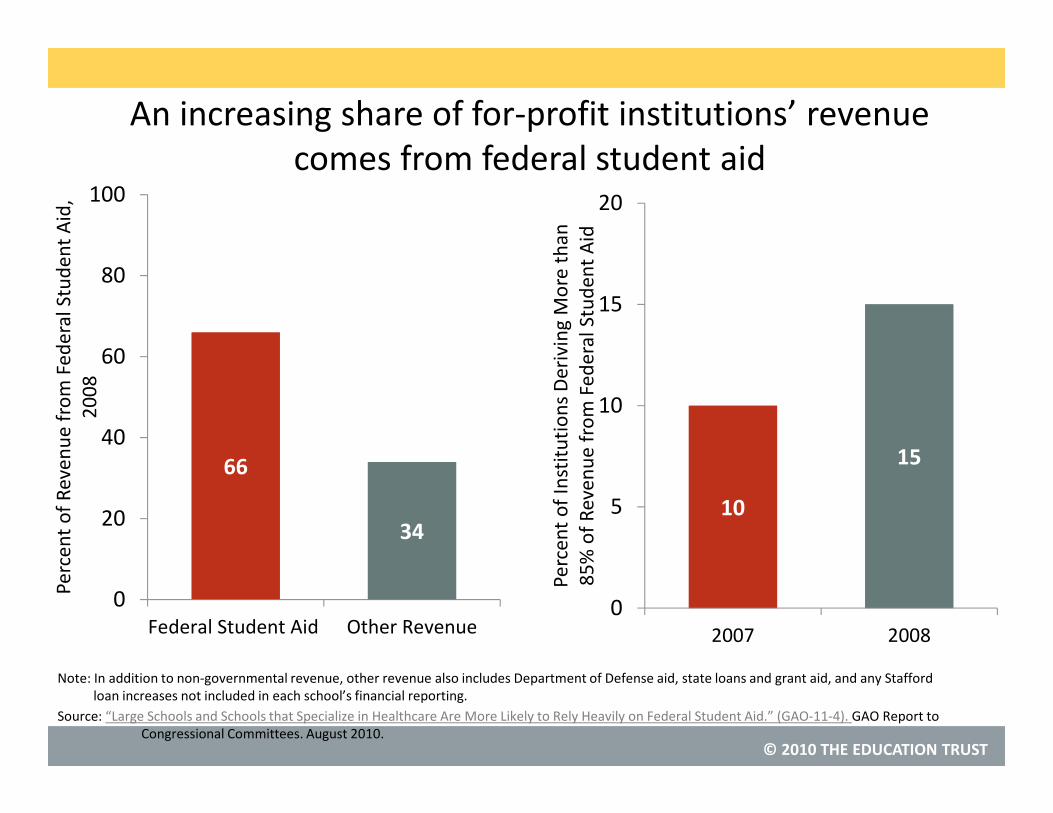
An increasing share of for-profit institutions’ revenue
comes from federal student aid
“Large Schools and Schools that Specialize in Healthcare Are More Likely to Rely Heavily on Federal Student Aid.” (GAO-11-4). GAO Report to
Congressional Committees. August 2010.
66
34
0
20
40
60
80
100
Federal Student Aid Other Revenue
Pe
rce
nt
of
Re
ven
ue
fro
m F
ed
era
l St
ud
en
t A
id,
20
08
Note: In addition to non-governmental revenue, other revenue also includes Department of Defense aid, state loans and grant aid, and any Stafford
loan increases not included in each school’s financial reporting.
10
15
0
5
10
15
20
2007 2008
Pe
rce
nt
of
Inst
itu
tio
ns
De
rivi
ng
Mo
re t
ha
n
85
% o
f R
eve
nu
e f
rom
Fe
de
ral
Stu
de
nt
Aid
© 2010 THE EDUCATION TRUST
Source:
Is this federal investment paying off?

© 2010 THE EDUCATION TRUST
Source:
4-year for-profits have much lower graduation
rates than non-profits
5565
22
0
20
40
60
80
4-Year
IPEDS Graduation Rate, 2008
Public
Private,
Non-Profit
For-Profit
IPEDS First Look 2008-09, Table 5. Graduation rates at Title IV institutions, by race/ethnicity, level and
control of institution, gender, and degree at the institution where the students started as full-
time, first-time students: United States, cohort year 2002.
© 2010 THE EDUCATION TRUST
Source:
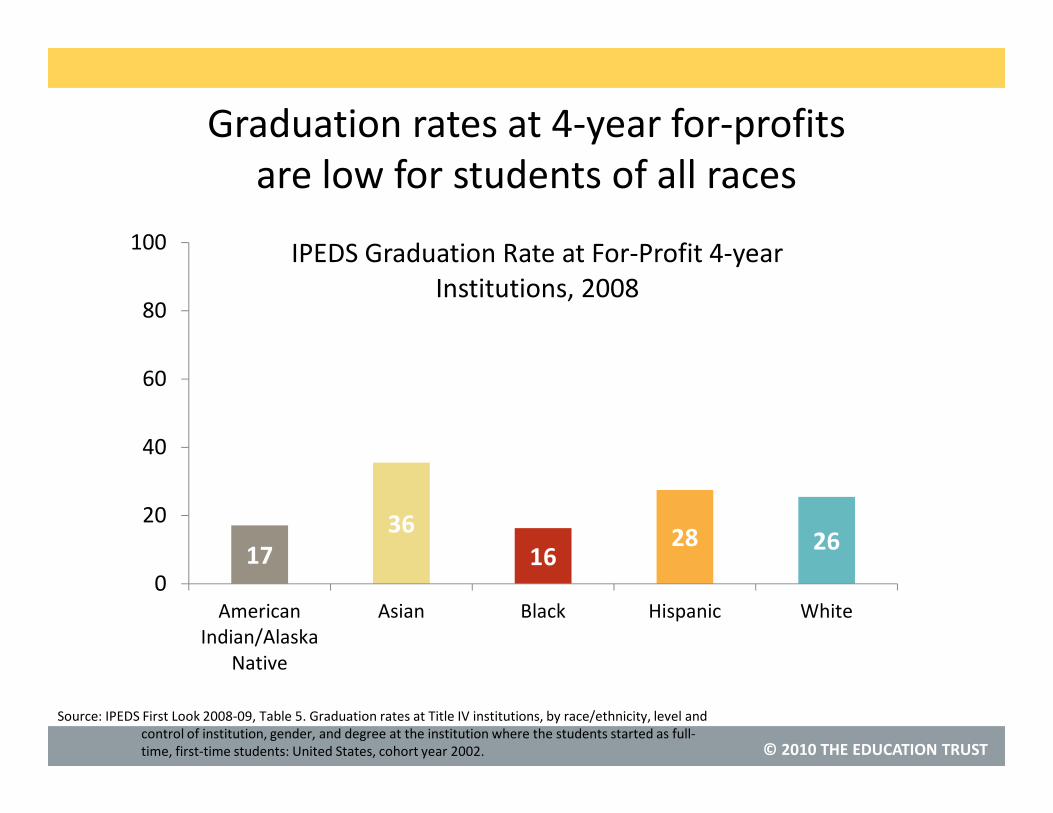
Graduation rates at 4-year for-profits
are low for students of all races
17
36
1628 26
0
20
40
60
80
100
American
Indian/Alaska
Native
Asian Black Hispanic White
IPEDS Graduation Rate at For-Profit 4-year
Institutions, 2008
IPEDS First Look 2008-09, Table 5. Graduation rates at Title IV institutions, by race/ethnicity, level and
control of institution, gender, and degree at the institution where the students started as full-
time, first-time students: United States, cohort year 2002.

© 2010 THE EDUCATION TRUST
Source:
2-year for-profits have higher graduation rates
than public community colleges
26 22
74
4251
74
4660 66
0
20
40
60
80
100
4-Year* 2-Year LT 2-Year
IPEDS Graduation Rate, 2008
Public
Private,
Non-Profit
For-Profit
IPEDS First Look 2008-09, Table 5. Graduation rates at Title IV institutions, by race/ethnicity, level and control of
institution, gender, and degree at the institution where the students started as full-time, first-time students:
United States, cohort year 2005; and Ed Trust analysis of IPEDS Graduation Rate Survey, Other
degree/certificate-seeking subcohort (4-year institutions), 2008.
* In 2002, 49,484 first-time, full-time students entered 4-yr for-profit institutions seeking an AA or certificate. 64,957 and 24,373 first-time, full-time AA or
certificate-seeking students entered public and private 4-yr institutions, respectively. In these graduation rate calculations, Ed Trust analysis includes
as graduates students in these cohorts who completed any credential.
© 2010 THE EDUCATION TRUST
Source:
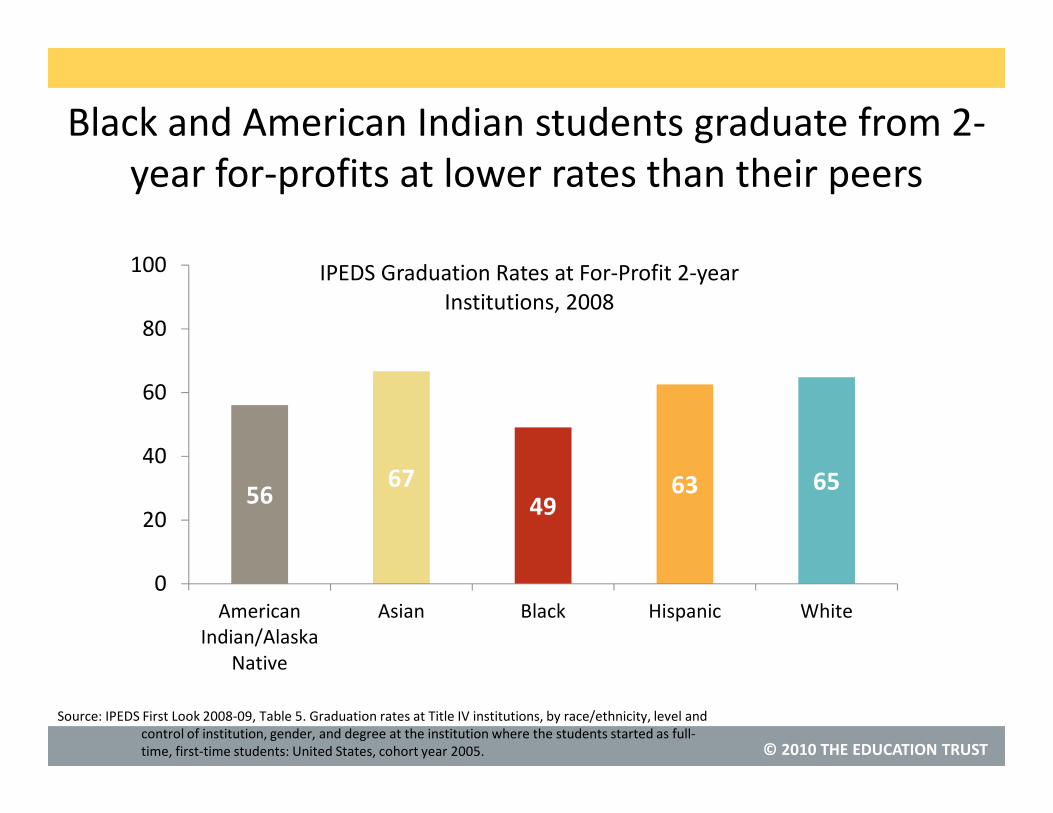
Black and American Indian students graduate from 2-
year for-profits at lower rates than their peers
5667
4963 65
0
20
40
60
80
100
American
Indian/Alaska
Native
Asian Black Hispanic White
IPEDS Graduation Rates at For-Profit 2-year
Institutions, 2008
IPEDS First Look 2008-09, Table 5. Graduation rates at Title IV institutions, by race/ethnicity, level and
control of institution, gender, and degree at the institution where the students started as full-
time, first-time students: United States, cohort year 2005.

© 2010 THE EDUCATION TRUST
Source:
A large portion of students at for-profit colleges attend full-
time
22
61
42
17
30
11
27
11 14
0
20
40
60
80
4-Year 2-Year LT 2-Year
Percent Part-Time
Public
Private,
Non-Profit
For-Profit
IPEDS First Look 2008-09, Table 1. Enrollment at Title IV institutions, by control and
level of institution, student level, attendance status, gender, and
race/ethnicity: United States, fall 2008.
© 2010 THE EDUCATION TRUST
Source:
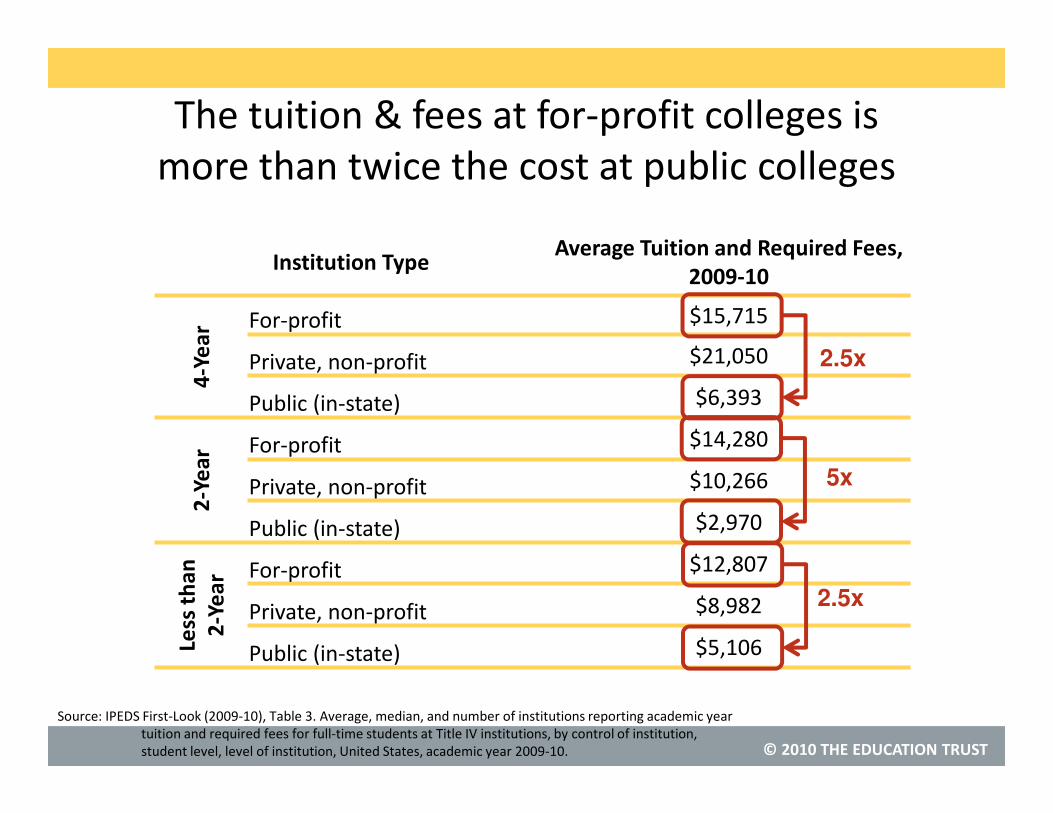
The tuition & fees at for-profit colleges is
more than twice the cost at public colleges
IPEDS First-Look (2009-10), Table 3. Average, median, and number of institutions reporting academic year
tuition and required fees for full-time students at Title IV institutions, by control of institution,
student level, level of institution, United States, academic year 2009-10.
Institution TypeAverage Tuition and Required Fees,
2009-10
4-Y
ea
r For-profit $15,715
Private, non-profit $21,050
Public (in-state) $6,393
2-Y
ea
r For-profit $14,280
Private, non-profit $10,266
Public (in-state) $2,970
Less
th
an
2-Y
ea
r For-profit $12,807
Private, non-profit $8,982
Public (in-state) $5,106
5x
2.5x
2.5x

© 2010 THE EDUCATION TRUST
Source:
Unmet need among low-income students is exponentially
higher at for-profits than at public colleges
Ed Trust analysis of NPSAS:08 using PowerStats, http://nces.ed.gov/datalab/; Full-time, full-year, one-
institution dependent students in the bottom half of the income distribution are included in this
analysis.
Type of Institution
Cost of
Attendance,
2007
EFC,
2007
All Grant
Aid,
2007
Unmet Need,
2007
4-Y
ea
r
For-profit $31,976 $3,518 $3,501 $24,957
Private, non-profit $34,110 $3,911 $13,624 $16,574
Public $18,062 $3,798 $5,676 $8,588
2-Y
ea
r For-profit $26,690 $1,882 $3,736 $21,072
Public $11,660 $3,659 $2,523 $5,478
Less
tha
n
2-Y
ea
r For-profit $20,032 $2,005 $2,874 $15,154
Public $16,193 $3,791 $1,424 $10,978
Unmet Need of Low-Income Students
Note: Data are not available for private, non-profit 2-year and less than 2-year institutions because of small sample sizes.

© 2010 THE EDUCATION TRUST
Source:
Private, non-profit institutions cost
students less, but spend
3.5 times more on each student.
Enrollment in Postsecondary Institutions, Fall 2008; Graduation Rates, 2002 & 2005 Cohorts; and Financial
Statistics, Fiscal Year 2008 in Bennett, Lucchesi, and Vedder. For-Profit Higher Education: Growth, Innovation
and Regulation. Center for College Affordability and Productivity, July 2010.

© 2010 THE EDUCATION TRUST
Source:
Students at for-profit colleges are more likely
than others to take out student loans
47
14 18
5950
95 97
78
0
20
40
60
80
100
4-Year 2-Year LT 2-Year
Percent of students taking out loans, 2007-08
Public
Private,
Non-Profit
For-Profit
NA
Ed Trust analysis of loan data in NPSAS:08 using PowerStats, http://nces.ed.gov/datalab/

© 2010 THE EDUCATION TRUST
Source:
Students at for-profit colleges are more likely than
others to take out risky private loans
Ed Trust analysis of loan data in NPSAS:08 using PowerStats, http://nces.ed.gov/datalab/
Institution Type
Percent of Students Receiving Loans
Stafford Private
4-Y
ea
r For-profit 94 46
Private, non-profit 54 25
Public 42 14
2-Y
ea
r For-profit 95 42
Private, non-profit 47 18
Public 11 5
Less
th
an
2-Y
ea
r For-profit 67 34
Private, non-profit 31 NA
Public 15 7
© 2010 THE EDUCATION TRUST
Source:
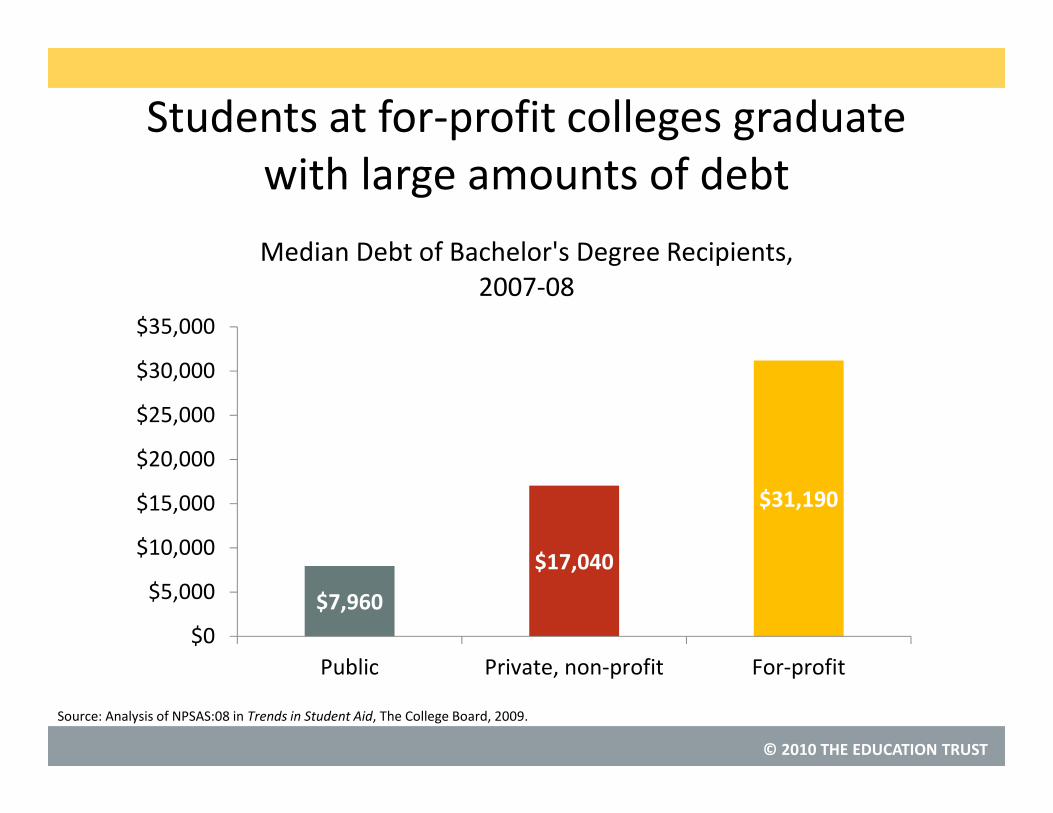
Students at for-profit colleges graduate
with large amounts of debt
$7,960
$17,040
$31,190
$0
$5,000
$10,000
$15,000
$20,000
$25,000
$30,000
$35,000
Public Private, non-profit For-profit
Median Debt of Bachelor's Degree Recipients,
2007-08
Analysis of NPSAS:08 in Trends in Student Aid, The College Board, 2009.

© 2010 THE EDUCATION TRUST
Source:
Students at for-profits are more likely to
take on large amounts of debt
Analysis of NPSAS:08 in Trends in Student Aid, The College Board, 2010, Excel data for Figure 19A.
132 1
26
57
193
0
20
40
60
Bachelor's Associate Certificate
Percent of students with at least $30,000 in debt,
2007-08
Public
Private,
Non-Profit
For-Profit
NANA
© 2010 THE EDUCATION TRUST
Source:
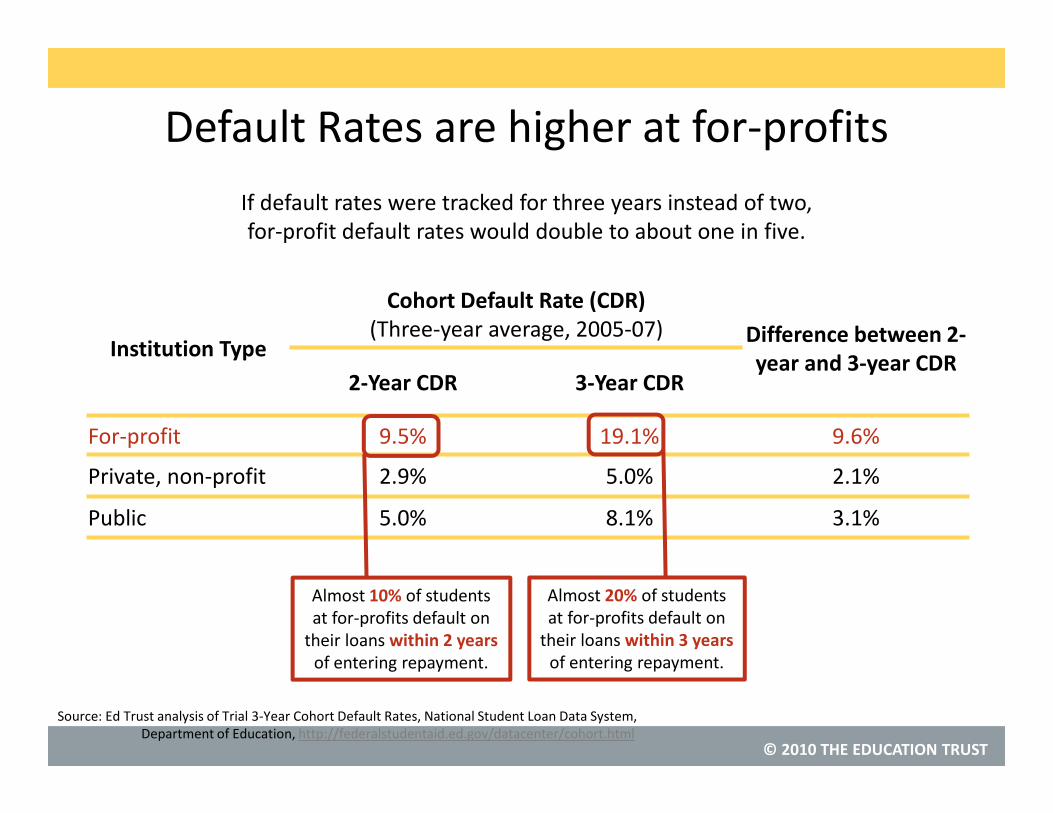
Default Rates are higher at for-profits
Ed Trust analysis of Trial 3-Year Cohort Default Rates, National Student Loan Data System,
Department of Education, http://federalstudentaid.ed.gov/datacenter/cohort.html
Institution Type
Cohort Default Rate (CDR)
(Three-year average, 2005-07) Difference between 2-
year and 3-year CDR2-Year CDR 3-Year CDR
For-profit 9.5% 19.1% 9.6%
Private, non-profit 2.9% 5.0% 2.1%
Public 5.0% 8.1% 3.1%
If default rates were tracked for three years instead of two,
for-profit default rates would double to about one in five.
Almost 10% of students
at for-profits default on
their loans within 2 years
of entering repayment.
Almost 20% of students
at for-profits default on
their loans within 3 years
of entering repayment.
© 2010 THE EDUCATION TRUST
Source:
Even when controlling for student
demographics and completion rates,
default rates are still higher at for-
profit institutions than at other
colleges.
Guryan and Thompson. “Report on Gainful Employment.” Charles River Associates. 2 April 2010 in “Testimony of Lauren Asher, President, The
Institute for College Access & Success Before the Senate Committee on Health, Education, Labor, and Pensions Hearing on the Federal
Investment in For-Profit Education: Are Students Succeeding?” September 30, 2010.
© 2010 THE EDUCATION TRUST
Source:
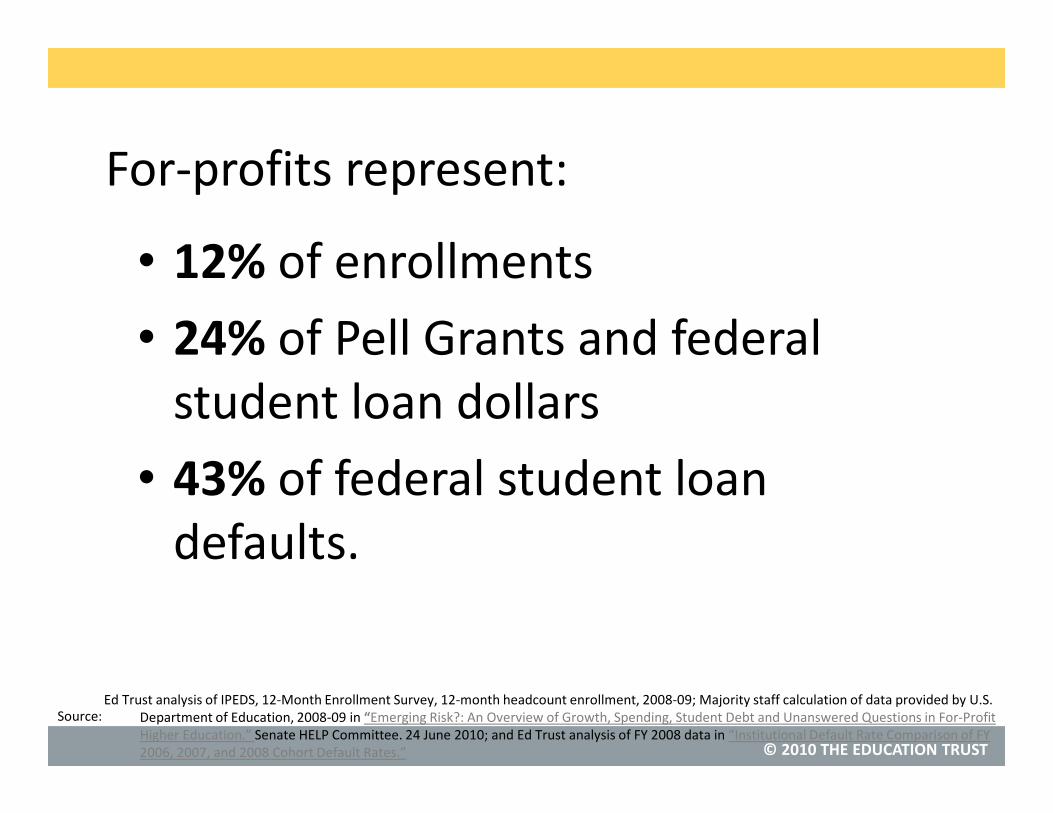
For-profits represent:
• 12% of enrollments
• 24% of Pell Grants and federal
student loan dollars
• 43% of federal student loan
defaults.
Ed Trust analysis of IPEDS, 12-Month Enrollment Survey, 12-month headcount enrollment, 2008-09; Majority staff calculation of data provided by U.S.
Department of Education, 2008-09 in “Emerging Risk?: An Overview of Growth, Spending, Student Debt and Unanswered Questions in For-Profit
Higher Education.” Senate HELP Committee. 24 June 2010; and Ed Trust analysis of FY 2008 data in “Institutional Default Rate Comparison of FY
2006, 2007, and 2008 Cohort Default Rates.”