For personal use only - ASX · For personal use only 26 August 2015 . ... • On target delivery of...
20
Orora Full Year Results Year Ended 30 June 2015 Nigel Garrard – Managing Director and CEO Stuart Hutton – Chief Financial Officer 26 August 2015 For personal use only
Transcript of For personal use only - ASX · For personal use only 26 August 2015 . ... • On target delivery of...

Orora Full Year Results Year Ended 30 June 2015
Nigel Garrard – Managing Director and CEO
Stuart Hutton – Chief Financial Officer
26 August 2015 For
per
sona
l use
onl
y
Orora Ltd 2014
Disclaimer
Forward Looking Statements This presentation contains forward-looking statements that involve subjective judgment and analysis and are subject to significant uncertainties, risks and contingencies, many of which are outside the control of, and are unknown to Orora. Forward-looking statements can generally be identified by the use of forward-looking words such as “may”, “will”, “expect”, “intend”, “plan”, “seeks”, “estimate”, “anticipate”, “believe”. “continue”, or similar words. No representation, warranty or assurance (express or implied) is given or made in relation to any forward looking statement by any person (including Orora). In addition, no representation, warranty or assurance (express or implied) is given in relation to any underlying assumption or that any forward looking statements will be achieved. Actual future events may vary materially from the forward looking statement and the assumptions on which the forward looking statements are based. Given these uncertainties, readers are cautioned not to place undue reliance on such forward looking statements. In particular, we caution you that these forward looking statements are based on management’s current economic predictions and assumptions and business and financial projections. Orora’s business is subject to uncertainties, risks and changes that may cause its actual results, performance or achievements to differ materially from any future results, performance or achievements expressed or implied by these forward-looking statements. The factors that may affect Orora’s future performance include, among others: • Changes in the legal and regulatory regimes in which Orora operates; • Changes in behaviour of Orora’s major customers; • Changes in behaviour of Orora’s major competitors; • The impact of foreign currency exchange rates; and • General changes in the economic conditions of the major markets in which Orora operates. These forward looking statements speak only as of the date of this presentation. Subject to any continuing obligations under applicable law or any relevant stock exchange listing rule, Orora disclaims any obligation or undertaking to publicly update or revise any of the forward looking statements in this presentation, whether as a result of new information, or any change in events conditions or circumstances on which any statement is based.
Non-IFRS information Throughout this presentation, Orora has included certain non-IFRS financial information. This information is presented to assist in making appropriate comparisons with prior periods and to assess the operating performance of the business. Orora uses these measures to assess the performance of the business and believes that the information is useful to investors. EBIT and EBITDA before Significant Items and Significant items have not been audited but have been extracted form Orora’s audited financial statements. All other non-IFRS information unless otherwise stated, have not been extracted from Orora’s financial statements. Minor Reclassification of Prior Year Numbers Certain prior year amounts have been reclassified for consistency with the current period presentation. Comparative financial information Effective 17 December 2013, Orora Limited (the Company) and its controlled entities (collectively referred to as the Orora Group) demerged from Amcor Limited. The Company was listed as a separate standalone entity on the Australian Securities Exchange on 18 December 2013 and the demerger was implemented on 31 December 2013. Prior to the demerger, the Company and Amcor Limited were required to undertake an internal corporate restructure (Corporate Restructure). The Corporate Restructure took place as at 31 October 2013 and as a result the statutory financial information for the comparative period does not give a relevant view of the performance of the Orora Group as it is currently structured. As Orora Group has been operating as a standalone entity for the entire twelve month period ended 30 June 2015, there has been no need for the Company to provide pro forma financial information in respect of the current period. However, unless otherwise indicated, the comparative financial information contained in this presentation for the twelve month period ended 30 June 2014 has been presented on a pro forma basis. The pro forma comparative financial information has been prepared to assist stakeholders’ understanding of Orora Group’s business as it is now structured and as an independent company listed on the Australian Securities Exchange. The pro forma comparative financial information has not been audited. Commentary throughout this presentation primarily refers to the pro forma comparative financial information unless otherwise stated.
For
per
sona
l use
onl
y
Orora Ltd 2014
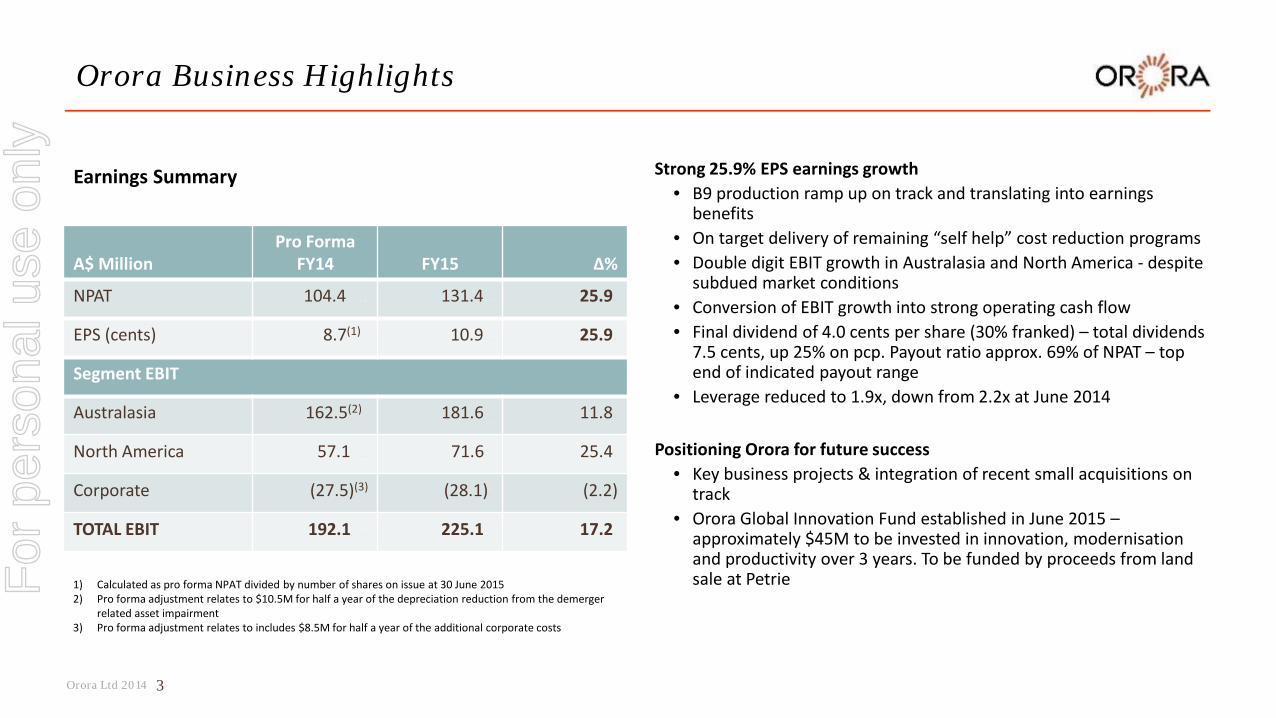
A$ Million Pro Forma
FY14 FY15 ∆%
NPAT 104.4 .. 131.4.. 25.9.
EPS (cents) 8.7(1) . 10.9.. 25.9.
Segment EBIT
Australasia 162.5(2).. 181.6 . 11.8.
North America 57.1 .. 71.6 . 25.4.
Corporate (27.5)(3) (28.1). (2.2)
TOTAL EBIT 192.1 . 225.1 . 17.2.
Strong 25.9% EPS earnings growth • B9 production ramp up on track and translating into earnings
benefits • On target delivery of remaining “self help” cost reduction programs • Double digit EBIT growth in Australasia and North America - despite
subdued market conditions • Conversion of EBIT growth into strong operating cash flow • Final dividend of 4.0 cents per share (30% franked) – total dividends
7.5 cents, up 25% on pcp. Payout ratio approx. 69% of NPAT – top end of indicated payout range
• Leverage reduced to 1.9x, down from 2.2x at June 2014
Positioning Orora for future success • Key business projects & integration of recent small acquisitions on
track • Orora Global Innovation Fund established in June 2015 –
approximately $45M to be invested in innovation, modernisation and productivity over 3 years. To be funded by proceeds from land sale at Petrie
Orora Business Highlights
Earnings Summary
3
1) Calculated as pro forma NPAT divided by number of shares on issue at 30 June 2015 2) Pro forma adjustment relates to $10.5M for half a year of the depreciation reduction from the demerger
related asset impairment 3) Pro forma adjustment relates to includes $8.5M for half a year of the additional corporate costs
For
per
sona
l use
onl
y

Orora Ltd 2014
Safety improvement remains a priority – an ongoing journey • Steady reduction in RCFR over past few years • LTIFR remains stable – an area of ongoing focus
Continued emphasis on implementing best practice & processes
• Enhancement of safety management system to focus resources in an objective, risk based fashion
• Further development of safety engagement strategies • Completed the Glass furnace (G1) rebuild without a recordable case
or lost time injury
Orora safety performance
4
June 2013 June 2014 June 2015
RCFR 8.5 6.6 5.9
LTIFR 1.9 1.8 1.9
Note: Safety calculations based on a rolling 12 month performance
Safety of our employees is fundamental One injury is one too many
For
per
sona
l use
onl
y
Orora Ltd 2014
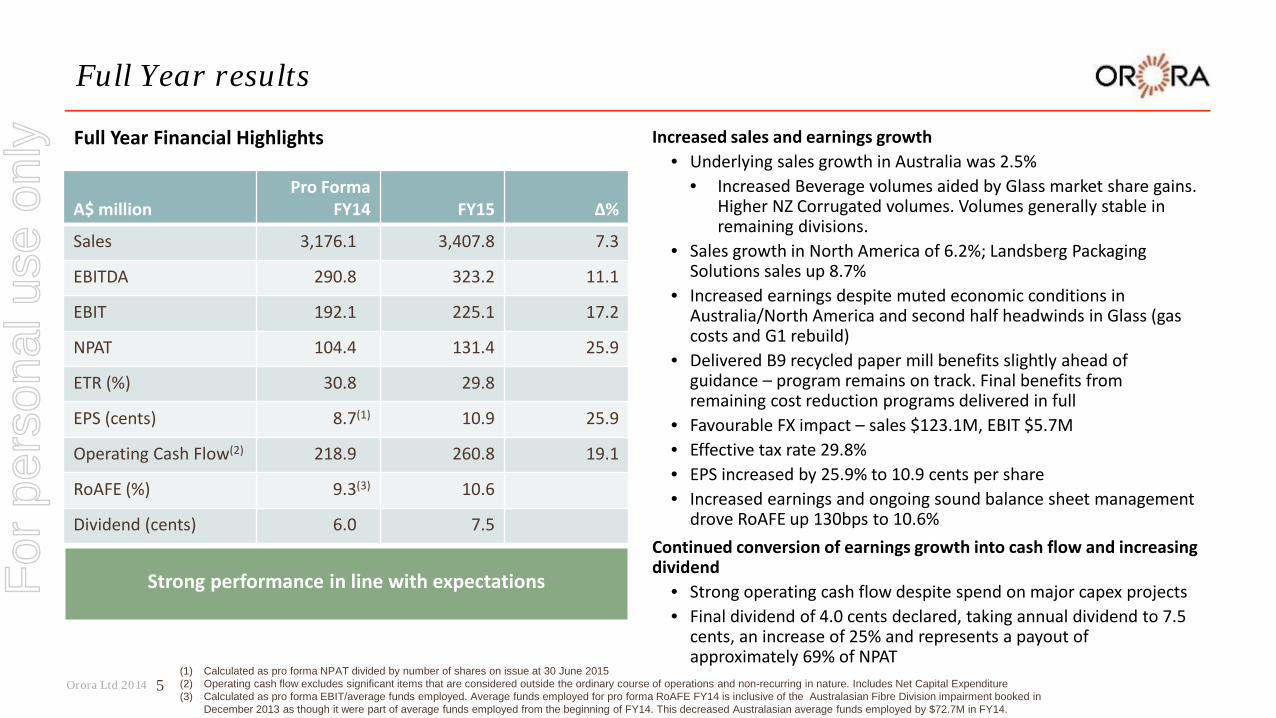
Increased sales and earnings growth • Underlying sales growth in Australia was 2.5%
• Increased Beverage volumes aided by Glass market share gains. Higher NZ Corrugated volumes. Volumes generally stable in remaining divisions.
• Sales growth in North America of 6.2%; Landsberg Packaging Solutions sales up 8.7%
• Increased earnings despite muted economic conditions in Australia/North America and second half headwinds in Glass (gas costs and G1 rebuild)
• Delivered B9 recycled paper mill benefits slightly ahead of guidance – program remains on track. Final benefits from remaining cost reduction programs delivered in full
• Favourable FX impact – sales $123.1M, EBIT $5.7M • Effective tax rate 29.8% • EPS increased by 25.9% to 10.9 cents per share • Increased earnings and ongoing sound balance sheet management
drove RoAFE up 130bps to 10.6% Continued conversion of earnings growth into cash flow and increasing dividend
• Strong operating cash flow despite spend on major capex projects • Final dividend of 4.0 cents declared, taking annual dividend to 7.5
cents, an increase of 25% and represents a payout of approximately 69% of NPAT
Full Year results
Strong performance in line with expectations
Full Year Financial Highlights
5
A$ million Pro Forma
FY14 FY15 ∆%
Sales 3,176.1(2) 3,407.8 7.3
EBITDA 290.8(2) 323.2 11.1
EBIT 192.1(2) 225.1 17.2
NPAT 104.4(2) 131.4 25.9
ETR (%) 30.8(2) 29.8
EPS (cents) 8.7(1) 10.9 25.9
Operating Cash Flow(2) 218.9(2) 260.8 19.1
RoAFE (%) 9.3(3) 10.6
Dividend (cents) 6.0(2) 7.5
(1) Calculated as pro forma NPAT divided by number of shares on issue at 30 June 2015 (2) Operating cash flow excludes significant items that are considered outside the ordinary course of operations and non-recurring in nature. Includes Net Capital Expenditure (3) Calculated as pro forma EBIT/average funds employed. Average funds employed for pro forma RoAFE FY14 is inclusive of the Australasian Fibre Division impairment booked in
December 2013 as though it were part of average funds employed from the beginning of FY14. This decreased Australasian average funds employed by $72.7M in FY14.
For
per
sona
l use
onl
y

Orora Ltd 2014
A$ Million Pro Forma
FY14 FY15 ∆.
Sales Revenue 1,912.9 1,935.5(1) 1.2%.
EBIT 162.5 181.6. . 11.8%.
EBIT Margin % 8.5 9.4 . .
Operating Cash Flow 201.3 217.2 . $15.9M
RoAFE % 8.9 10.2 .
Operating results in line with expectations despite flat market conditions • Underlying sales growth(1) of 2.5%, in line with GDP
o Higher Beverage volume – Glass market share gains offsetting slight underlying volume decline. Can volumes stable
o Fibre volumes generally steady, higher NZ Corrugated sales
• Earnings up 11.8% - both Fibre and Beverage divisions contributing
o Manufacturing efficiency and cost reduction benefits offsetting second half Glass headwinds (higher gas costs & Glass furnace rebuild)
• EBIT margin increased by 90 bps to 9.4% - efficiency and productivity continues to improve
• Strong operating cash flow despite capex spend on glass furnace rebuild
• RoAFE increased 130 bps to 10.2% - driven by higher earnings with benefits from previous large scale investments materialising
On target delivery of ‘self help’ benefits • Realised cost reduction & innovation/sales synergy benefits slightly
ahead of guidance
• Final benefits from legacy cost improvement & plant closure/portfolio exits programs delivered in full
• $25.3M of incremental ‘self help’ benefits in FY15 over pcp
Orora Australasia
Improved Beverage volumes, operational efficiencies and cost reduction/B9 benefits driving higher earnings
Earnings Summary (EBIT)
6
(1) Underlying sales up 2.5% after adjusting for the impact of prior years footprint rationalisation (Petrie), lower recycling sales due to the progressive exit of surplus tonnes, B9 paper previously sold externally now sold internally to Orora North America, partially offset by impact of higher aluminium prices.
For
per
sona
l use
onl
y
Orora Ltd 2014
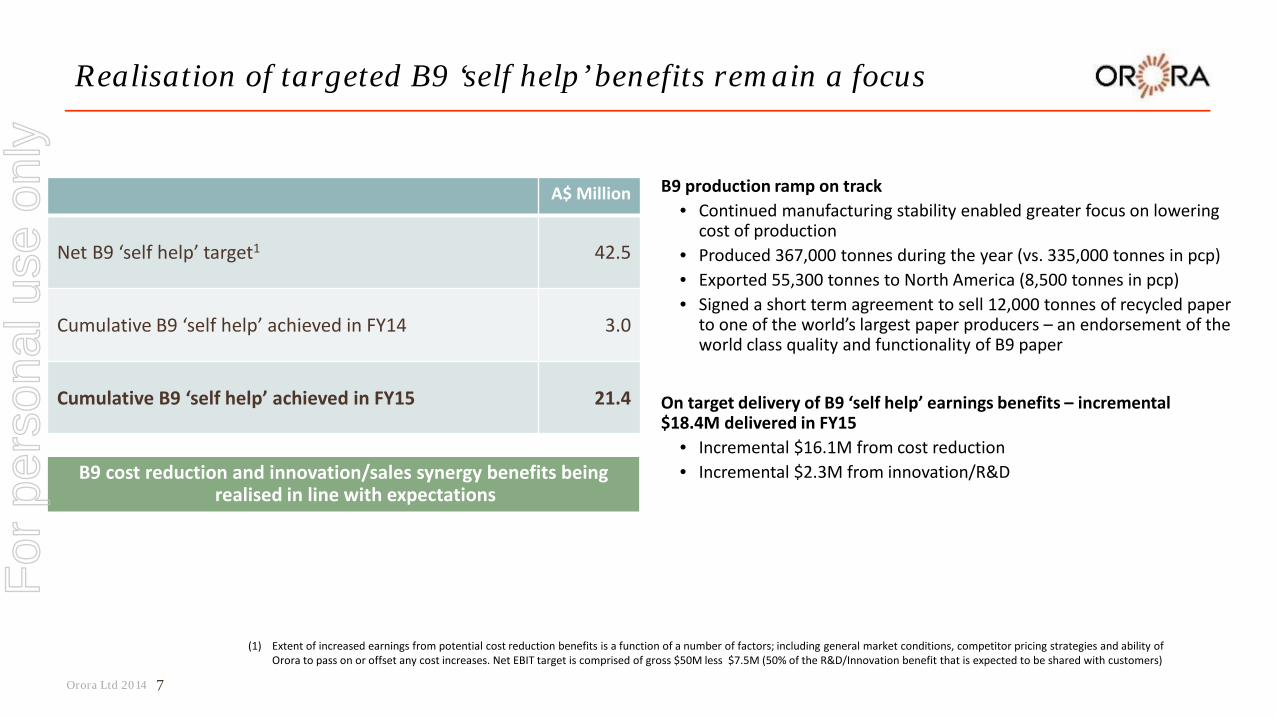
Realisation of targeted B9 ‘self help’ benefits remain a focus
B9 cost reduction and innovation/sales synergy benefits being realised in line with expectations
7
(1) Extent of increased earnings from potential cost reduction benefits is a function of a number of factors; including general market conditions, competitor pricing strategies and ability of Orora to pass on or offset any cost increases. Net EBIT target is comprised of gross $50M less $7.5M (50% of the R&D/Innovation benefit that is expected to be shared with customers)
A$ Million
Net B9 ‘self help’ target1 42.5
Cumulative B9 ‘self help’ achieved in FY14 3.0
Cumulative B9 ‘self help’ achieved in FY15 21.4
B9 production ramp on track • Continued manufacturing stability enabled greater focus on lowering
cost of production • Produced 367,000 tonnes during the year (vs. 335,000 tonnes in pcp) • Exported 55,300 tonnes to North America (8,500 tonnes in pcp) • Signed a short term agreement to sell 12,000 tonnes of recycled paper
to one of the world’s largest paper producers – an endorsement of the world class quality and functionality of B9 paper
On target delivery of B9 ‘self help’ earnings benefits – incremental $18.4M delivered in FY15
• Incremental $16.1M from cost reduction • Incremental $2.3M from innovation/R&D
For
per
sona
l use
onl
y

Orora Ltd 2014
Australasia EBIT growth
On target delivery of cost reduction & B9 benefits and positive vol/mix/efficiency driving earnings growth
Solid result despite headwinds faced by the business (e.g. Glass furnace rebuild, higher gas costs, Carbon Tax repeal)
8
11.8% Earnings Growth
(A$’M)
162.5
(1.5) (4.6)
Pro Forma FY14 EBIT
FY15 EBIT Other Vol/Mix/ Efficiency
Self Help Gas (Glass Division)
Glass Furnace (G1) Rebuild
181.6
7.3 (7.4) 25.3
For
per
sona
l use
onl
y
Orora Ltd 2014
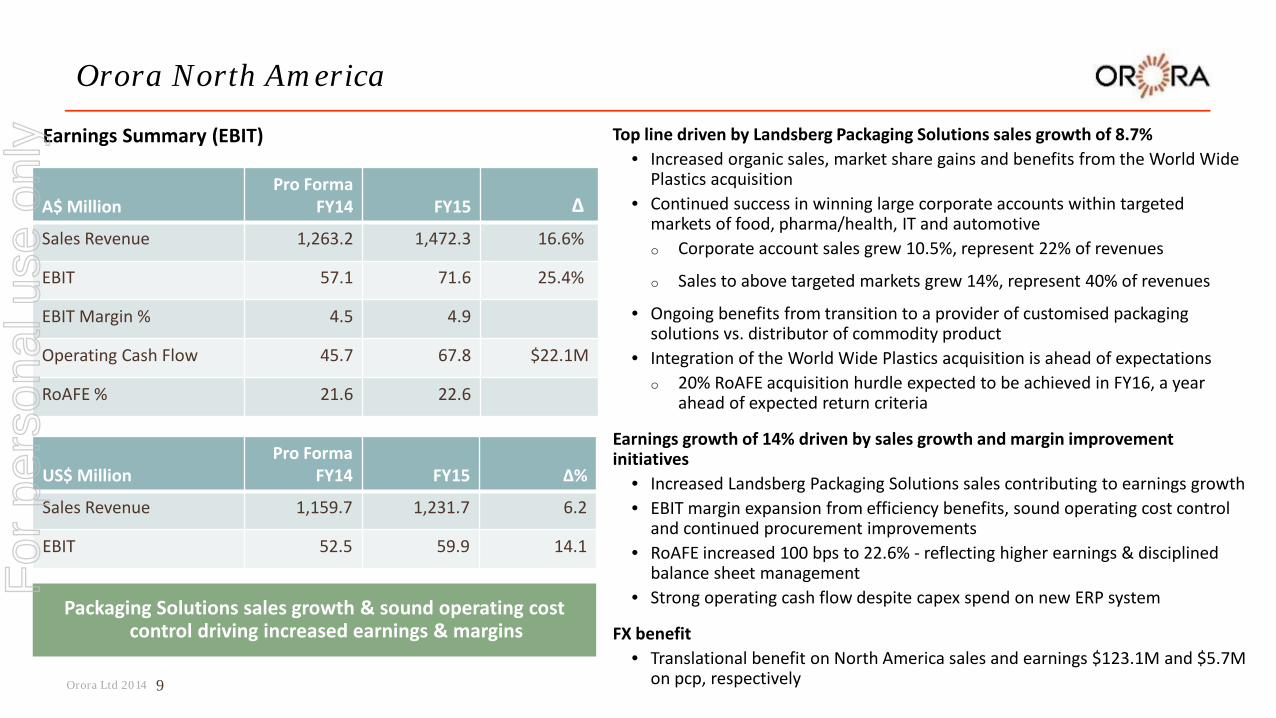
A$ Million Pro Forma
FY14 FY15 ∆.
Sales Revenue 1,263.2 1,472.3 16.6%.
EBIT 57.1 71.6 25.4%.
EBIT Margin % 4.5 4.9
Operating Cash Flow 45.7 67.8 $22.1M
RoAFE % 21.6 22.6
Top line driven by Landsberg Packaging Solutions sales growth of 8.7% • Increased organic sales, market share gains and benefits from the World Wide
Plastics acquisition • Continued success in winning large corporate accounts within targeted
markets of food, pharma/health, IT and automotive o Corporate account sales grew 10.5%, represent 22% of revenues
o Sales to above targeted markets grew 14%, represent 40% of revenues
• Ongoing benefits from transition to a provider of customised packaging solutions vs. distributor of commodity product
• Integration of the World Wide Plastics acquisition is ahead of expectations o 20% RoAFE acquisition hurdle expected to be achieved in FY16, a year
ahead of expected return criteria
Earnings growth of 14% driven by sales growth and margin improvement initiatives
• Increased Landsberg Packaging Solutions sales contributing to earnings growth • EBIT margin expansion from efficiency benefits, sound operating cost control
and continued procurement improvements • RoAFE increased 100 bps to 22.6% - reflecting higher earnings & disciplined
balance sheet management • Strong operating cash flow despite capex spend on new ERP system
FX benefit • Translational benefit on North America sales and earnings $123.1M and $5.7M
on pcp, respectively
Orora North America
Packaging Solutions sales growth & sound operating cost control driving increased earnings & margins
Earnings Summary (EBIT)
9
US$ Million Pro Forma
FY14 FY15 ∆%
Sales Revenue 1,159.7 1,231.7 6.2
EBIT 52.5 59.9 14.1
For
per
sona
l use
onl
y
Orora Ltd 2014
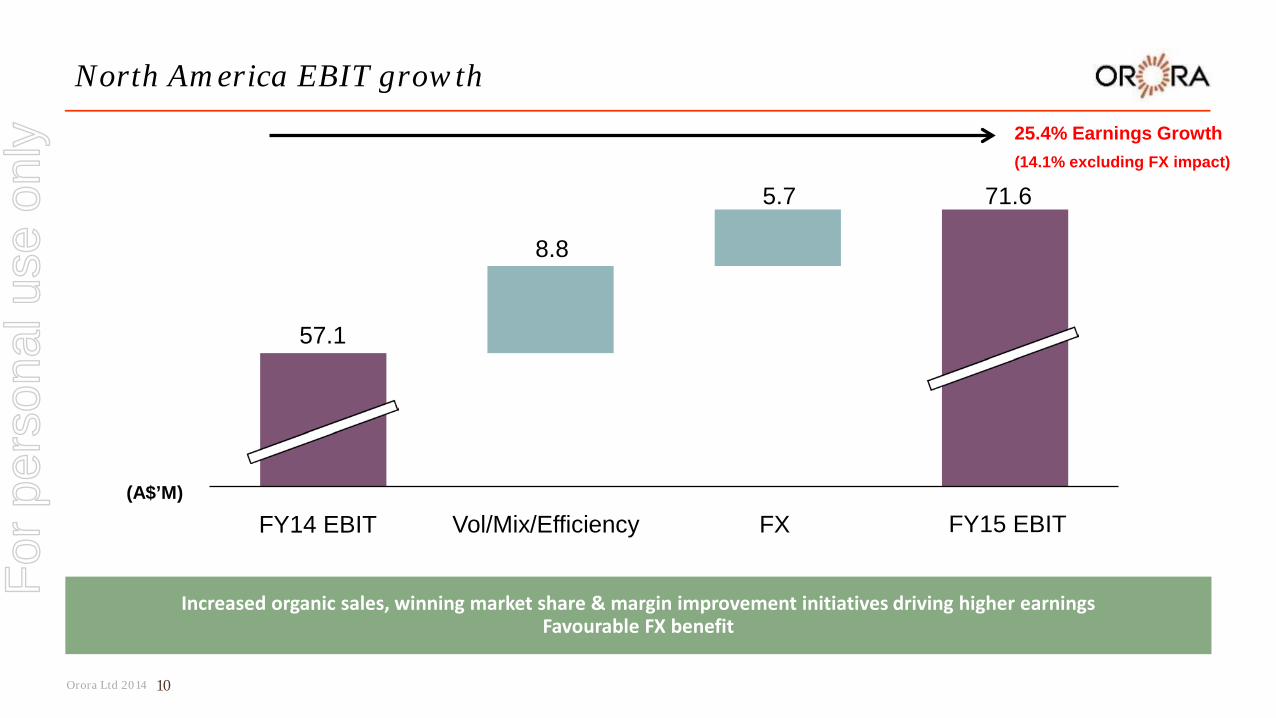
North America EBIT growth
Increased organic sales, winning market share & margin improvement initiatives driving higher earnings Favourable FX benefit
10
25.4% Earnings Growth (14.1% excluding FX impact)
FY15 EBIT Vol/Mix/Efficiency FX FY14 EBIT
57.1
(A$’M)
5.7
8.8
71.6
For
per
sona
l use
onl
y
Orora Ltd 2014
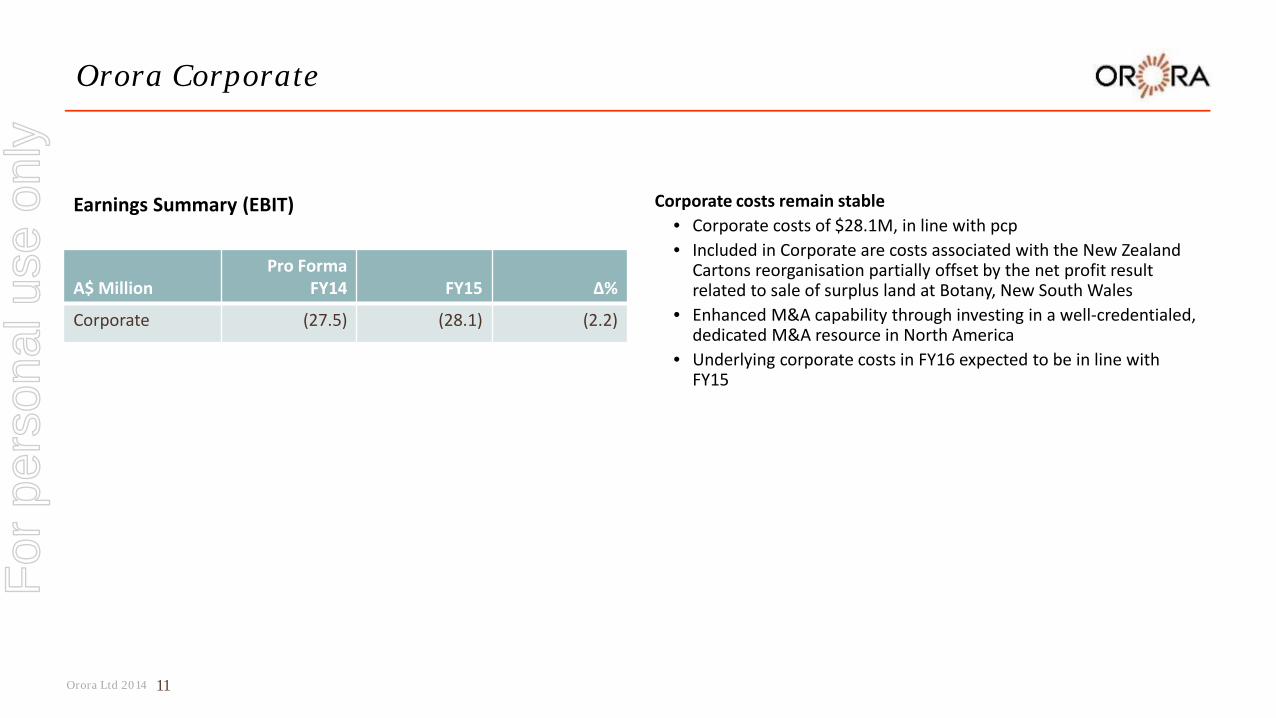
A$ Million Pro Forma
FY14 FY15 ∆%
Corporate (27.5) (28.1) (2.2)
Corporate costs remain stable • Corporate costs of $28.1M, in line with pcp • Included in Corporate are costs associated with the New Zealand
Cartons reorganisation partially offset by the net profit result related to sale of surplus land at Botany, New South Wales
• Enhanced M&A capability through investing in a well-credentialed, dedicated M&A resource in North America
• Underlying corporate costs in FY16 expected to be in line with FY15
Orora Corporate
Earnings Summary (EBIT)
11
For
per
sona
l use
onl
y
Orora Ltd 2014
A$ Million
Pro Forma...
FY14... FY15.
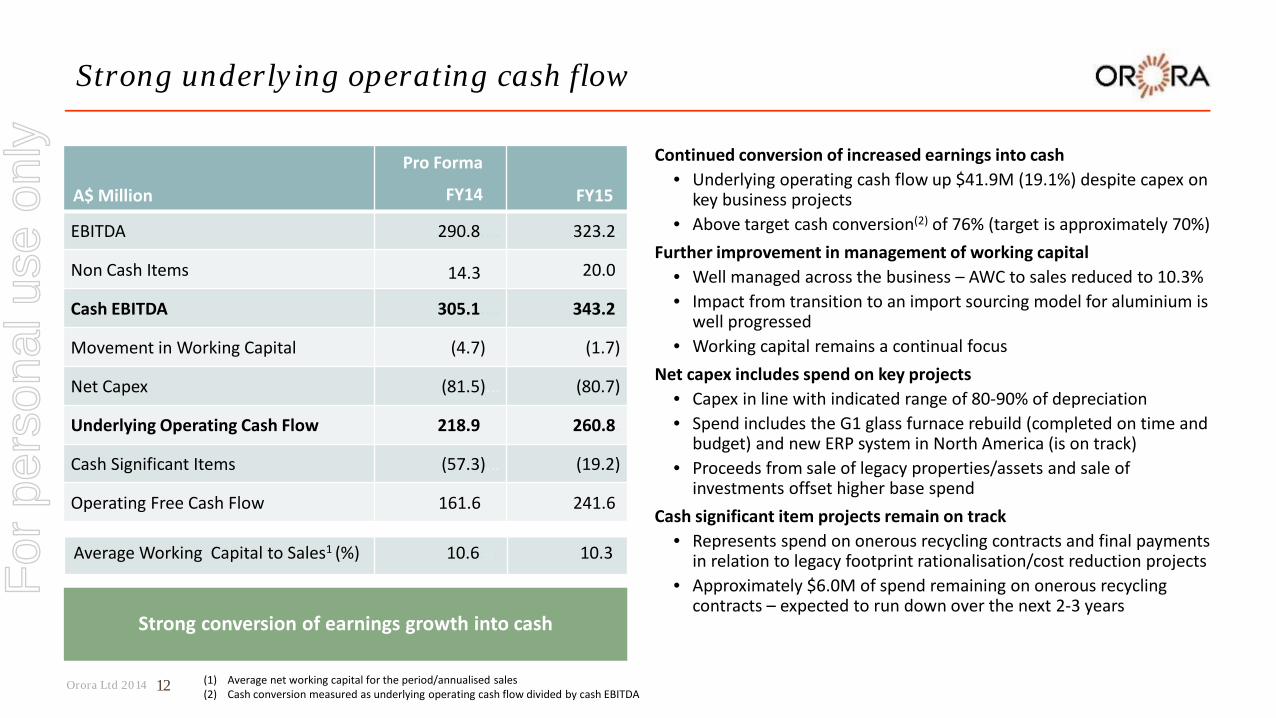
EBITDA 290.8.... 323.2.
Non Cash Items 14.3 . 20.0.
Cash EBITDA 305.1.... 343.2.
Movement in Working Capital (4.7)... (1.7)
Net Capex (81.5)... (80.7)
Underlying Operating Cash Flow 218.9.... 260.8.
Cash Significant Items (57.3)... (19.2)
Operating Free Cash Flow 161.6.... 241.6.
Continued conversion of increased earnings into cash • Underlying operating cash flow up $41.9M (19.1%) despite capex on
key business projects • Above target cash conversion(2) of 76% (target is approximately 70%)
Further improvement in management of working capital • Well managed across the business – AWC to sales reduced to 10.3% • Impact from transition to an import sourcing model for aluminium is
well progressed • Working capital remains a continual focus
Net capex includes spend on key projects • Capex in line with indicated range of 80-90% of depreciation • Spend includes the G1 glass furnace rebuild (completed on time and
budget) and new ERP system in North America (is on track) • Proceeds from sale of legacy properties/assets and sale of
investments offset higher base spend Cash significant item projects remain on track
• Represents spend on onerous recycling contracts and final payments in relation to legacy footprint rationalisation/cost reduction projects
• Approximately $6.0M of spend remaining on onerous recycling contracts – expected to run down over the next 2-3 years
Strong underlying operating cash flow
Strong conversion of earnings growth into cash
12
Average Working Capital to Sales1 (%) 10.6. . 10.3.
(1) Average net working capital for the period/annualised sales (2) Cash conversion measured as underlying operating cash flow divided by cash EBITDA
For
per
sona
l use
onl
y
Orora Ltd 2014
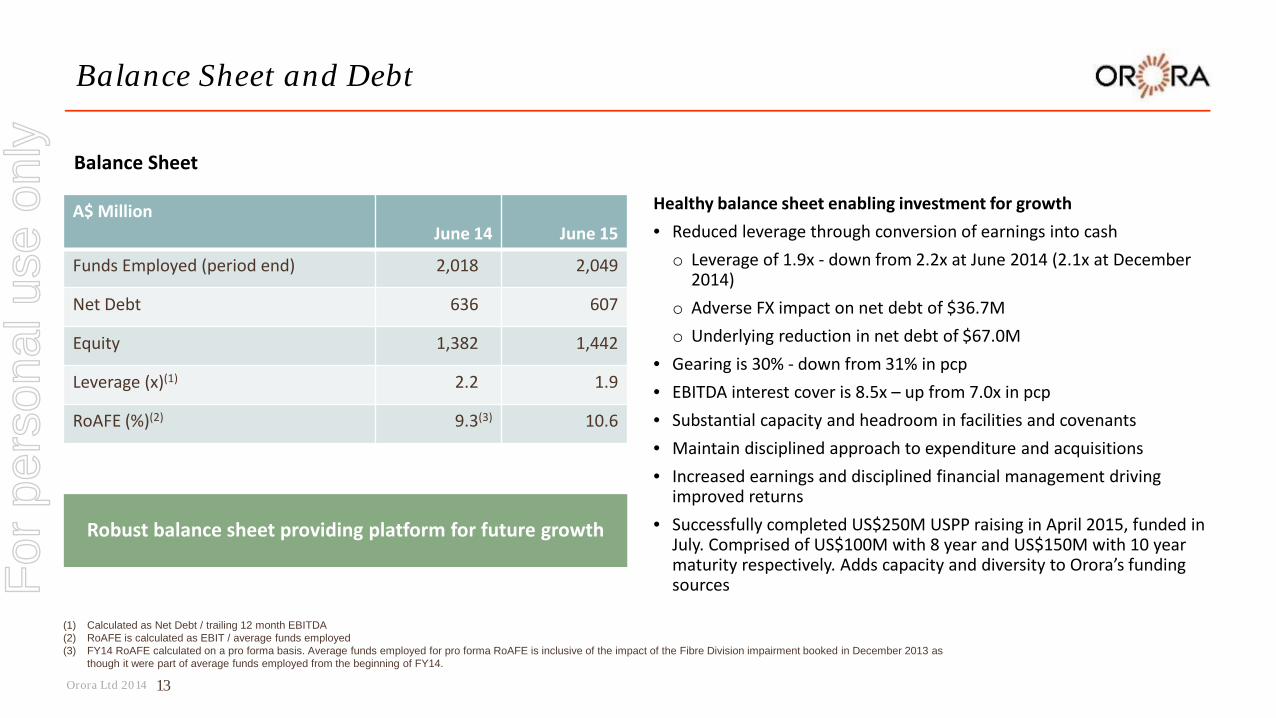
A$ Million June 14 June 15
Funds Employed (period end) 2,018(2) 2,049
Net Debt 636(2) 607
Equity 1,382(2) 1,442
Leverage (x)(1) 2.2(2) 1.9
RoAFE (%)(2) 9.3(3) 10.6
Healthy balance sheet enabling investment for growth • Reduced leverage through conversion of earnings into cash o Leverage of 1.9x - down from 2.2x at June 2014 (2.1x at December
2014) o Adverse FX impact on net debt of $36.7M o Underlying reduction in net debt of $67.0M
• Gearing is 30% - down from 31% in pcp • EBITDA interest cover is 8.5x – up from 7.0x in pcp • Substantial capacity and headroom in facilities and covenants • Maintain disciplined approach to expenditure and acquisitions • Increased earnings and disciplined financial management driving
improved returns • Successfully completed US$250M USPP raising in April 2015, funded in
July. Comprised of US$100M with 8 year and US$150M with 10 year maturity respectively. Adds capacity and diversity to Orora’s funding sources
Balance Sheet and Debt
Robust balance sheet providing platform for future growth
Balance Sheet
13
(1) Calculated as Net Debt / trailing 12 month EBITDA (2) RoAFE is calculated as EBIT / average funds employed (3) FY14 RoAFE calculated on a pro forma basis. Average funds employed for pro forma RoAFE is inclusive of the impact of the Fibre Division impairment booked in December 2013 as
though it were part of average funds employed from the beginning of FY14.
For
per
sona
l use
onl
y
Orora Ltd 2014
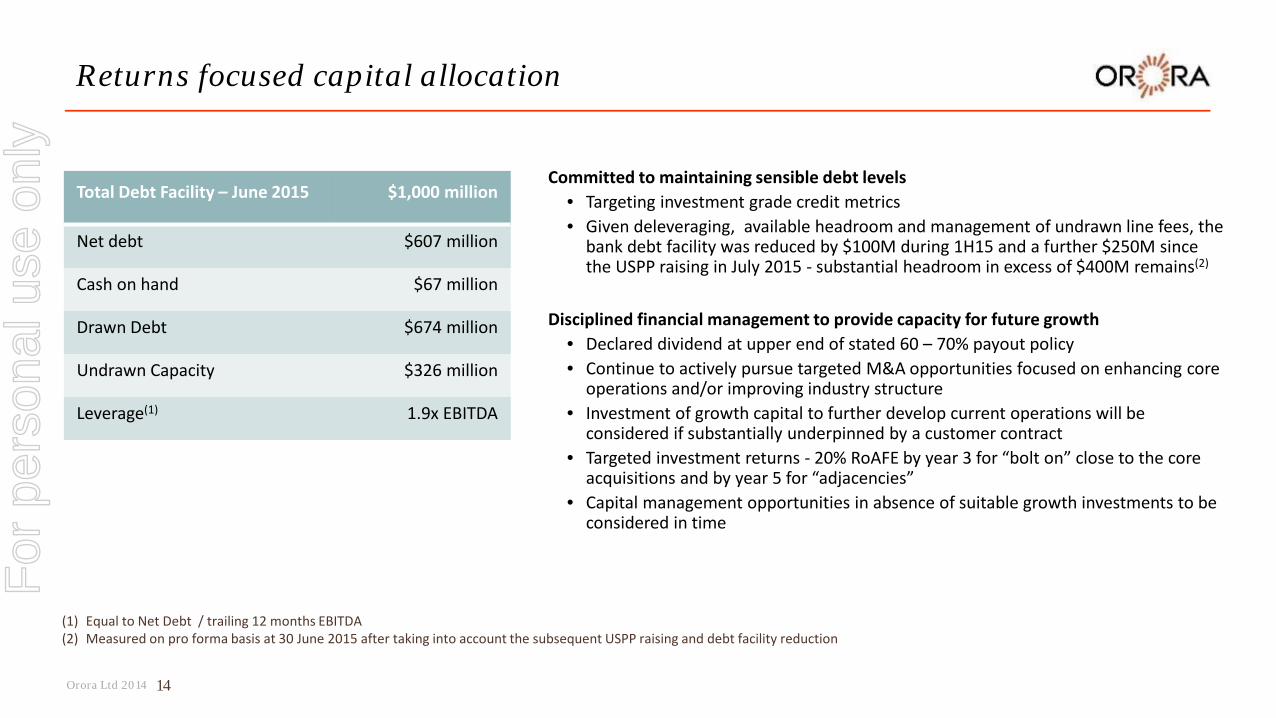
Committed to maintaining sensible debt levels • Targeting investment grade credit metrics • Given deleveraging, available headroom and management of undrawn line fees, the
bank debt facility was reduced by $100M during 1H15 and a further $250M since the USPP raising in July 2015 - substantial headroom in excess of $400M remains(2)
Disciplined financial management to provide capacity for future growth
• Declared dividend at upper end of stated 60 – 70% payout policy • Continue to actively pursue targeted M&A opportunities focused on enhancing core
operations and/or improving industry structure • Investment of growth capital to further develop current operations will be
considered if substantially underpinned by a customer contract • Targeted investment returns - 20% RoAFE by year 3 for “bolt on” close to the core
acquisitions and by year 5 for “adjacencies” • Capital management opportunities in absence of suitable growth investments to be
considered in time
Returns focused capital allocation
14
(1) Equal to Net Debt / trailing 12 months EBITDA (2) Measured on pro forma basis at 30 June 2015 after taking into account the subsequent USPP raising and debt facility reduction
Total Debt Facility – June 2015 $1,000 million
Net debt $607 million
Cash on hand $67 million
Drawn Debt $674 million
Undrawn Capacity $326 million
Leverage(1) 1.9x EBITDA
For
per
sona
l use
onl
y

Orora Ltd 2014
Our Orora – culture of driving outperformance
15 Customer led culture to drive sustainable outperformance
For
per
sona
l use
onl
y
Orora Ltd 2014
Shareholder value creation blue print
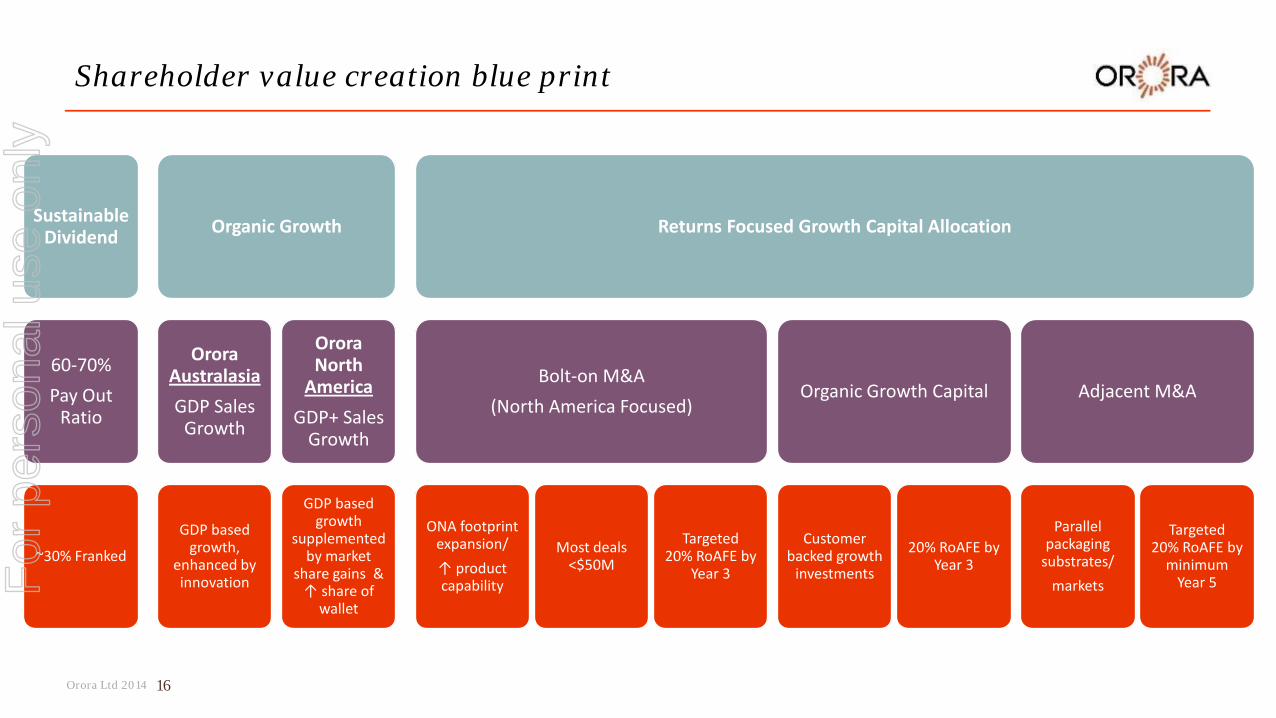
Sustainable Dividend
60-70% Pay Out
Ratio
~30% Franked
Organic Growth
Orora Australasia GDP Sales
Growth
GDP based growth,
enhanced by innovation
Orora North
America GDP+ Sales
Growth
GDP based growth
supplementedby market
share gains & ↑ share of
wallet
Returns Focused Growth Capital Allocation
Bolt-on M&A (North America Focused)
ONA footprint expansion/ ↑ product capability
Most deals <$50M
Targeted 20% RoAFE by
Year 3
Organic Growth Capital
Customer backed growth
investments
20% RoAFE by Year 3
Adjacent M&A
Parallel packaging
substrates/ markets
Targeted 20% RoAFE by
minimum Year 5
16
For
per
sona
l use
onl
y

Orora Ltd 2014
Orora acquires Jakait – in line with growth strategy
Orora North America has signed an agreement to acquire the assets and business of Jakait
• Supplier of packaging, logistics services and label products to the greenhouse produce sector
• Based in Ontario, Canada
• Initial consideration C$16.5M (A$17.2M)
• Represents an EBITDA multiple of 5.6 times
• Additional returns based consideration component of up to C$5.5M (A$5.7M) payable over 5 years
• Anticipated effective date of acquisition 1 September 2015
• Funded from existing cash/debt facilities
17
North America Strategy
Bolt on with expected synergies
Target preferred markets of food, pharma/health, IT & automotive
Enhance geographic footprint
Target 20% RoAFE by year 3 for bolt-ons
Targeted synergies expected to be realised over next 2 years
Food sector
Expands Canadian footprint
Expect 20% RoAFE by year 3
Acquisition in line with Orora North America’s objective to drive regional growth & expand capability
For
per
sona
l use
onl
y
Orora Ltd 2014
Committed to creating shareholder value
18
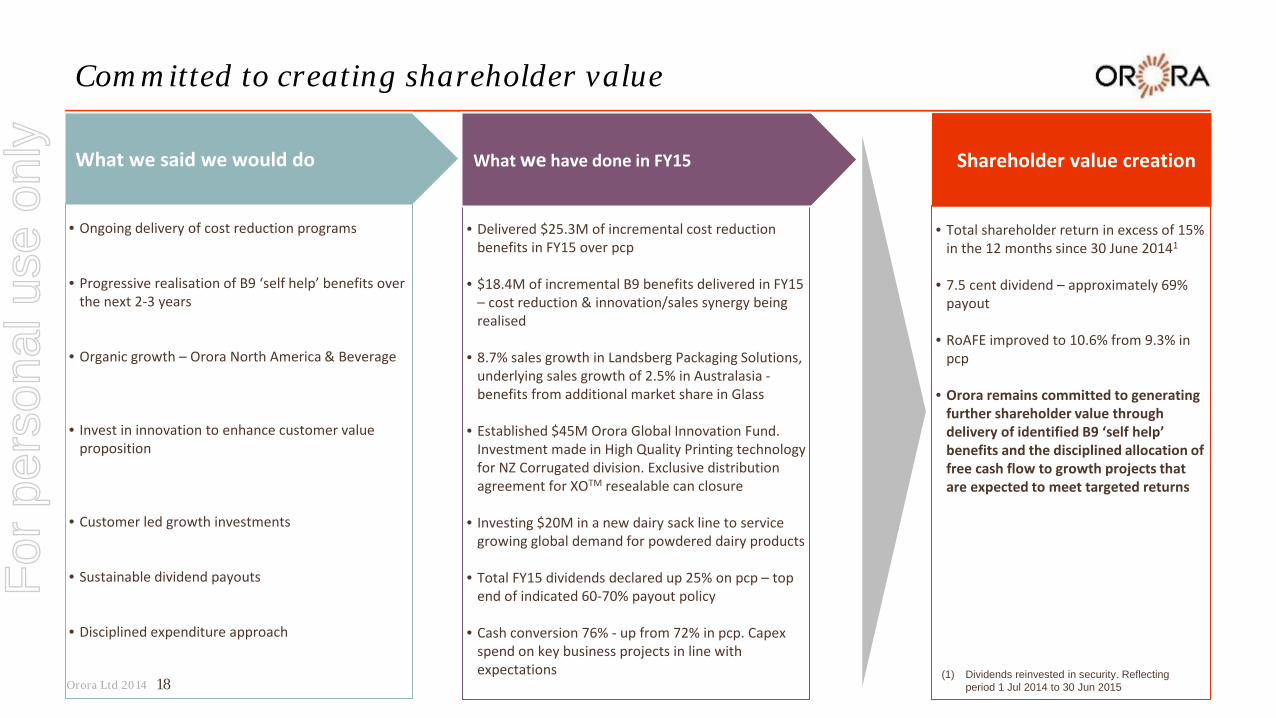
What we said we would do
• Ongoing delivery of cost reduction programs
• Progressive realisation of B9 ‘self help’ benefits over the next 2-3 years
• Organic growth – Orora North America & Beverage
• Invest in innovation to enhance customer value proposition
• Customer led growth investments
• Sustainable dividend payouts
• Disciplined expenditure approach
• Delivered $25.3M of incremental cost reduction benefits in FY15 over pcp
• $18.4M of incremental B9 benefits delivered in FY15 – cost reduction & innovation/sales synergy being realised
• 8.7% sales growth in Landsberg Packaging Solutions, underlying sales growth of 2.5% in Australasia - benefits from additional market share in Glass
• Established $45M Orora Global Innovation Fund. Investment made in High Quality Printing technology for NZ Corrugated division. Exclusive distribution agreement for XOTM resealable can closure
• Investing $20M in a new dairy sack line to service growing global demand for powdered dairy products
• Total FY15 dividends declared up 25% on pcp – top end of indicated 60-70% payout policy
• Cash conversion 76% - up from 72% in pcp. Capex spend on key business projects in line with expectations
What we have done in FY15
• Total shareholder return in excess of 15% in the 12 months since 30 June 20141
• 7.5 cent dividend – approximately 69%
payout
• RoAFE improved to 10.6% from 9.3% in pcp
• Orora remains committed to generating further shareholder value through delivery of identified B9 ‘self help’ benefits and the disciplined allocation of free cash flow to growth projects that are expected to meet targeted returns
(1) Dividends reinvested in security. Reflecting period 1 Jul 2014 to 30 Jun 2015
Shareholder value creation
For
per
sona
l use
onl
y
Orora Ltd 2014
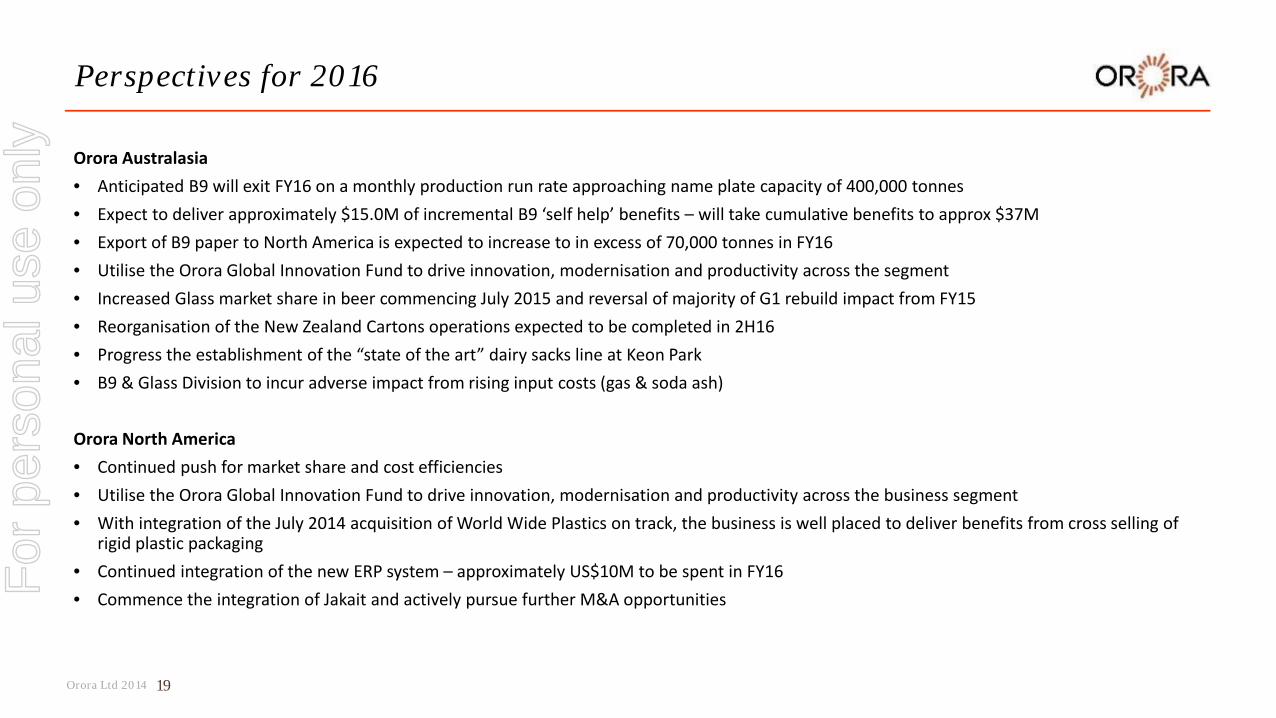
Perspectives for 2016
Orora Australasia • Anticipated B9 will exit FY16 on a monthly production run rate approaching name plate capacity of 400,000 tonnes • Expect to deliver approximately $15.0M of incremental B9 ‘self help’ benefits – will take cumulative benefits to approx $37M • Export of B9 paper to North America is expected to increase to in excess of 70,000 tonnes in FY16 • Utilise the Orora Global Innovation Fund to drive innovation, modernisation and productivity across the segment • Increased Glass market share in beer commencing July 2015 and reversal of majority of G1 rebuild impact from FY15 • Reorganisation of the New Zealand Cartons operations expected to be completed in 2H16 • Progress the establishment of the “state of the art” dairy sacks line at Keon Park • B9 & Glass Division to incur adverse impact from rising input costs (gas & soda ash) Orora North America • Continued push for market share and cost efficiencies • Utilise the Orora Global Innovation Fund to drive innovation, modernisation and productivity across the business segment • With integration of the July 2014 acquisition of World Wide Plastics on track, the business is well placed to deliver benefits from cross selling of
rigid plastic packaging • Continued integration of the new ERP system – approximately US$10M to be spent in FY16 • Commence the integration of Jakait and actively pursue further M&A opportunities
19
For
per
sona
l use
onl
y
Orora Ltd 2014
Outlook
• Orora expects to continue to drive organic growth, deliver on the B9 ‘self help’ initiatives and invest in innovation and growth during 2016, with earnings expected to be higher than reported in 2015, subject to global economic conditions
20
For
per
sona
l use
onl
y