For personal use only - ASXOct 18, 2013 · Designed and produced by teamscope.com.au AbAcus...
157
Dear Sirs, Abacus Property Group 2013 Annual Report On 17 October 2013, we lodged with ASX our 2013 Annual Report. We have now noticed that the Auditor’s Independent Declaration found on page 52 has been included again on page 143 instead of the second page of the Auditor’s opinion. Attached is a new 2013 Annual Report with the corrected pages included. Yours faithfully, Abacus Property Group 18 October 2013 ASX Market Announcements ASX Limited 20 Bridge Street Sydney NSW 2000 For personal use only
Transcript of For personal use only - ASXOct 18, 2013 · Designed and produced by teamscope.com.au AbAcus...

Dear Sirs, Abacus Property Group 2013 Annual Report On 17 October 2013, we lodged with ASX our 2013 Annual Report. We have now noticed that the Auditor’s Independent Declaration found on page 52 has been included again on page 143 instead of the second page of the Auditor’s opinion. Attached is a new 2013 Annual Report with the corrected pages included. Yours faithfully, Abacus Property Group
18 October 2013 ASX Market Announcements ASX Limited 20 Bridge Street Sydney NSW 2000
For
per
sona
l use
onl
y

2013abacus property group annual report
abacus property Grouplevel 34 australia Square264-278 George StreetSydney nSW 2000t +61 2 9253 8600F +61 2 9253 8616e [email protected]
www.abacusproperty.com.au
abacuS property Group 2013 annual report
For
per
sona
l use
onl
y

Des
igne
d a
nd p
rod
uced
by
team
scop
e.co
m.a
u
AbAcus ProPerty GrouP
At 30 June 2012, Abacus Property Group comprised Abacus Trust, Abacus Income Trust, Abacus Storage Property Trust, Abacus Group Holdings Limited, Abacus Group Projects Limited and Abacus Storage Operations Limited. The Group structure is illustrated below.
AGHL has been identified as the parent entity of the Group. The financial reports of the Group for the year ended 30 June 2013 comprise the consolidated financial reports of AGHL and its controlled entities, AT and its controlled entities, AGPL and its controlled entities, AIT and its controlled entities, ASOL and its controlled entities, ASPT and its controlled entities, Abacus Hospitality Fund and its controlled entities, Abacus Diversified Income Fund II and its controlled entities, Abacus Miller Street Holding Trust and its controlled entity and Abacus Wodonga Land Fund.
GLossAry
Abacus Abacus Funds Management Limited, the responsible entity of the trusts
AGHL Abacus Group Holdings Limited
AGPL Abacus Group Projects Limited
AIT Abacus Income Trust
APG Abacus Property Group
ASOL Abacus Storage Operations Limited
ASPT Abacus Storage Property Trust
AT Abacus Trust
Group Abacus Property Group
AbAcus ProPerty GrouPListed Entities: AGHL/AGPL/ ASOL/AT/AIT/ASPT
Abacus Property Group has significant influence over these managed funds and the adoption of AASB 10 results in the consolidation of these funds.
Property Ventures
Office Storage
Retail Industrial
Other
Investment Portfolio
Funds Management
Abacus Miller Street
Fund
Abacus Hospitatlity
Funds
ADIF II
Abacus Wodonga Land
Fund
For
per
sona
l use
onl
y

01 annual report 2013
02 Who is Abacus
06 Financial highlights
08 Chairman & Managing Director’s report
12 Recent acquisitions
15 Sustainability
18 Board members
20 Senior executive team
22 Directors report
52 Auditor’s independence declaration
54 Consolidated income statement
55 Consolidated statement of other comprehensive income
56 Consolidated statement of financial position
58 Consolidated statement of changes in equity
59 Consolidated statement of cash flow
60 Notes to the financial statements
141 Directors’ declaration
142 Independent audit report
144 Corporate governance report
149 ASX additional information
CONTENTS
For
per
sona
l use
onl
y
02 abacus property group
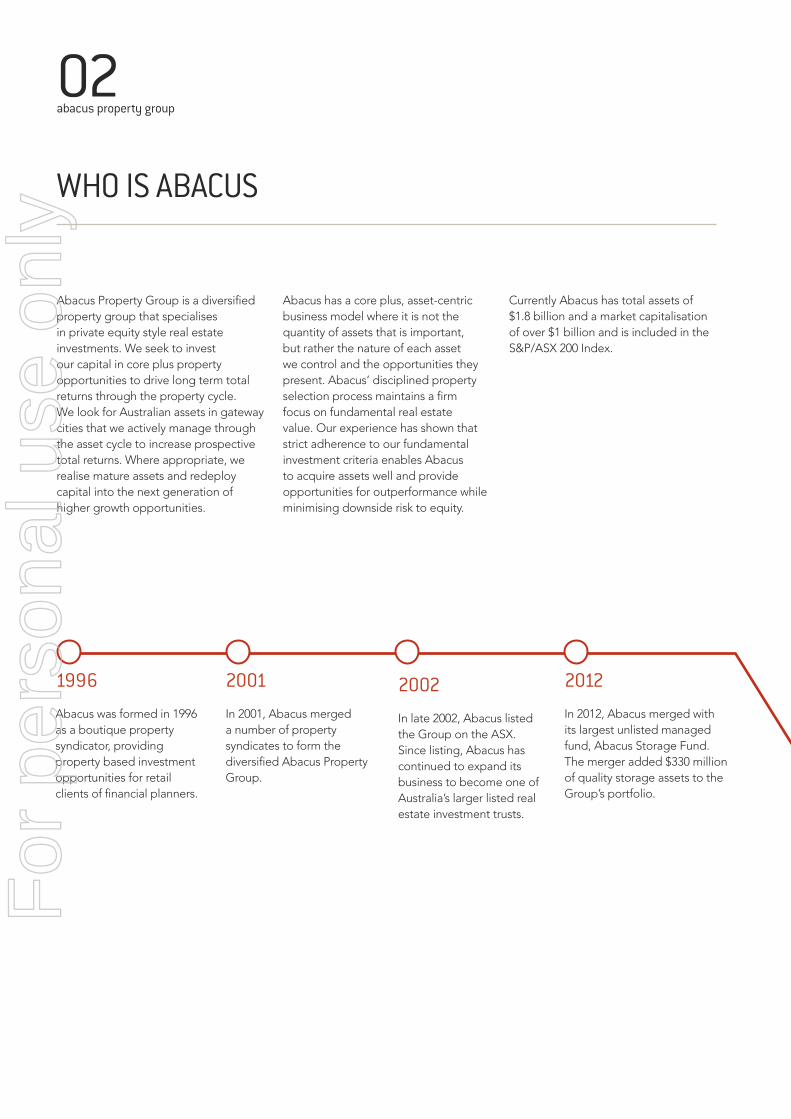
WhO IS ABACuS
Abacus Property Group is a diversified property group that specialises in private equity style real estate investments. We seek to invest our capital in core plus property opportunities to drive long term total returns through the property cycle. We look for Australian assets in gateway cities that we actively manage through the asset cycle to increase prospective total returns. Where appropriate, we realise mature assets and redeploy capital into the next generation of higher growth opportunities.
Abacus has a core plus, asset-centric business model where it is not the quantity of assets that is important, but rather the nature of each asset we control and the opportunities they present. Abacus’ disciplined property selection process maintains a firm focus on fundamental real estate value. Our experience has shown that strict adherence to our fundamental investment criteria enables Abacus to acquire assets well and provide opportunities for outperformance while minimising downside risk to equity.
Currently Abacus has total assets of $1.8 billion and a market capitalisation of over $1 billion and is included in the S&P/ASX 200 Index.
1996
Abacus was formed in 1996 as a boutique property syndicator, providing property based investment opportunities for retail clients of financial planners.
2001
In 2001, Abacus merged a number of property syndicates to form the diversified Abacus Property Group.
2002
In late 2002, Abacus listed the Group on the ASX. Since listing, Abacus has continued to expand its business to become one of Australia’s larger listed real estate investment trusts.
2012
In 2012, Abacus merged with its largest unlisted managed fund, Abacus Storage Fund. The merger added $330 million of quality storage assets to the Group’s portfolio.
For
per
sona
l use
onl
y

03 annual report 2013
Our philOsOphy
Our investment objective is to provide our investors with reliable and increasing returns. We look for property assets that are capable of providing growth in:
• rental income; and • asset value
as a result of our diligent active management.
Abacus is first and foremost a property investor seeking to extract value through active management.
The diagram on this page depicts the investment process that Abacus undertakes.
Abacus has three integrated property businesses built on our core expertise in accessing properties and projects and actively managing them to realise their full value.
Our flat corporate structure and business model supports strong synergies across our businesses and contributes to the overall success of the businesses and the Group.
In total, Abacus has $2.1 billion of assets under management.
INVESTMENT REAlISATION
Where appropriate asset is returned
to market
ASSET MANAgEMENT
Significant asset management
experience is applied to drive returns
PROPERTy ACquISITION
Properties that have realistic prospects
for increased capital growth through active
managmentFor
per
sona
l use
onl
y

04 abacus property group
investment pOrtFOliO
Abacus Property Group holds a diversified investment portfolio of primarily commercial, storage, industrial and retail properties. Rental income from these properties is the largest contributor to the earnings of the Group. Abacus’ disciplined property selection process maintains a firm focus on fundamental real estate value. The Group’s property portfolio is primarily located on the Eastern seaboard of Australia and New Zealand.
prOperty ventures
Abacus participates in a range of projects by combining our capital and property expertise with the regional or sector-specific expertise of our business partners.
Funds management
Abacus has historically offered a wide range of high quality investment solutions designed to meet the needs of different groups of retail investors. The Group has now redirected its focus towards wholesale third party capital.
WhO IS ABACuSCONTINuED
For
per
sona
l use
onl
y

5 annual report 2013
05 annual report 2013
199 geOrge street BrisBane Qld
For
per
sona
l use
onl
y

06 abacus property group
pleasing grOWth and COrrelatiOn BetWeen COre FinanCial metriCs
25.4FY10
28.6FY11
8.561.1
FY12 FY13
64.6FY10
66.8FY11
79.6 105.7FY12 FY13
64.9FY10
72.2FY11
76.8 83.8FY12 FY13
52.8FY10
61.8FY11
67.8 74.1FY12 FY13
statutOry prOFit ($ milliOn)
CashFlOW FrOm OperatiOns ($ milliOn)
underlying prOFit ($ milliOn)
distriButiOns ($ milliOn)
FINANCIAl hIghlIghTS
For
per
sona
l use
onl
y

07 annual report 2013
FinanCial highlights 2013 2012Consolidated statutory net profit1 $61.1m $8.5m
Underlying profit2 $83.8m $76.8m
Cashflow from operations $105.7m $79.6m
Cashflow from operations per security 23.7c 19.9c
Distributions per security3 16.5c 16.5c
Interest over ratio4 3.3x 3.2x
BalanCe sheet metriCsTotal assets $1.8bn $1.7bn
Net tangible assets5 $1.0bn $1.0bn
NTA per security $2.32 $2.34
Gearing6 28.4% 28.6%
Covenant gearing7 36.6% 36.8%
Total debt drawn $565m $567m
Debt term to maturity 2.1yrs 3.0yrs
Average cost of debt8 6.1% 7.3%
1 Excludes non controlling interests.2 Calculated in accordance with the AICD/Finsia principles for reporting underlying profit.3 Includes distributions declared post period end (1 July 2013, 2 July 2012).4 Calculated as underlying EBITDA divided by interest expense.5 Excludes external non-controlling interests pf $43.8 million (2012: $51.0 million).6 Bank debt minus cash divided by total assets minus cash.7 Total liabilities (net of cash) divided by Total Tangible Assets (net of cash).8 Weighted average base rate plus margin on drawn amount plus facility line fees.
For
per
sona
l use
onl
y

08 abacus property group
ChAIRMAN & MANAgINg DIRECTOR’S REPORT
For
per
sona
l use
onl
y

09 annual report 2013
dear seCurityhOlders
We are very pleased tO present tO yOu Our 2013 annual repOrt.
Once again, Abacus Property Group has delivered a strong result for the financial year. It was pleasing to see consistent growth of our underlying profit and cashflow from operations which illustrates the strength of our diversified business. These metrics remain our key focus as we believe they best illustrate the health of the business.
Abacus is a long term investor in property. We are focused on the performance of our portfolio over the investment cycle and will not be drawn into short term asset acquisitions if they do not represent fundamental property value.
The underlying profit for the financial year to 30 June 2013 was $83.8 million, a 9.1% increase over the prior year. Abacus also improved its cashflow from operations to $105.7 million from $79.6 million a year before. These results underwrote Abacus’s distributions to securityholders of approximately $74.1 million and allowed for capital to be re-invested to further grow returns to securityholders. We achieved a 19.4% total securityholder return over the year.
Since 2010, 96% of securityholder distributions have been paid from recurring revenue sources. Abacus has, over this time, focused on driving revenues from recurring sources to support and grow our distributions. Surplus profits provide Abacus with additional capital to be re-invested into business activities to drive longer term returns to securityholders.
The accompanying annual financial report includes our operating and financial review (OFR) on pages 22 to 33. The objectives of the OFR are to provide our securityholders with a narrative and analysis to supplement the financial report and assist in understanding our operations, financial position, business strategies and prospects. It contains information you need to make an informed assessment of the Group and we encourage you to read the OFR in its entirety.
Fy13 FinanCial results
The main financial and capital metrics are presented below:
• Statutory profit increased to $61.1 million, up from $8.5 million in the 2012 financial year
• Underlying profit increased to $83.8 million, up 9.1%
• Cashflow from operations increased to $105.7 million, up 32.8% to 23.7 cents per security
Abacus’ total assets remained fairly stable over the year at $1.8 billion, with net assets of $1.0 billion. The Group’s net tangible asset backing per security improved slightly to $2.32 from $2.30 in December 2012.
The Abacus balance sheet continues to be strong with gearing remaining low at 28.4%, well within our target gearing limit of 35%. Abacus has no significant debt expiries until late 2014 and an average debt term to maturity of over two years.
We continue to improve and reweight the balance sheet with a focus on disciplined capital management strategies. We anticipate Abacus’ weighted average interest rate will remain relatively stable as current capacity is utilised and anticipate it should be no greater than 6.5% over the 2014 financial year.
1 Underlying profit and earnings per security are a non-AIFRS measure that the Group uses to assess performance and distribution levels. They are calculated in accordance with the AICD/Finsia principles.
2 Cashflow from operations of Abacus excludes cost of inventory sales of $47.9 million.
For
per
sona
l use
onl
y

10 abacus property group
OvervieW OF Our Operating divisiOns
investment pOrtFOliO
Our investment portfolio generated a $63.8 million EBITDA4 result for the financial year. This result was below 2012 and was attributable to the delayed reinvestment of sales proceeds into new acquisitions. Our commercial portfolio metrics have largely remained consistent with the previous year despite a weakening economic environment. The slight decrease in occupancy and WALE was also largely due to the impact of sales and acquisitions during the year. The portfolio offers embedded long term capital and earnings growth that we are focused on delivering through the property cycle.
The portfolio is diversified across asset classes that are well located, largely along the eastern seaboard in major metropolitan areas. While some geographic areas are challenging, we nevertheless believe the geographic diversification provides a level of security and stability to the portfolio’s property income and cashflows.
The Group is focused on maintaining revenue and cashflows to support securityholder distributions.
The storage portfolio has delivered a consistent trading performance across the portfolio providing resilient underlying cashflows despite the subdued economic environment and a competitive storage market. The Australian market has experienced increased competition leading to discounting by market participants. As a result the portfolio experienced a slight decrease over the year in average gross rental to $237 from $238 per m². Despite this fall in rate, the portfolio continued to deliver positive revenue growth of 0.5% pa from the Australian portfolio and 4.5% pa from the New Zealand portfolio largely from an overall improvement in occupancy.
While focused on improving occupancy and rental growth from the storage facilities, Abacus also sees the delivery of expansion opportunities in the current portfolio where strong demand allows for low cost expansion as a core focus to driving portfolio returns.
3 Like for like properties excluding those assets classified as development 4 Earnings before interest, depreciation, tax and amortisation
ChAIRMAN & MANAgINg DIRECTOR’S REPORT CONTINuED
94 investment properties valued
at $1.26 billion
47 commercial properties valued
at $888 million
47 storage facilities valued at $373 million•
Commercial portfolio
occupancy of 92.8%
Commercial portfolio rent
growth3 of 3.4%
• Retail portfolio continues to
deliver strong results
Storage portfolio
occupancy: 83.5%
Storage facility rental gross rent:
$237 per m2
For
per
sona
l use
onl
y

11 annual report 2013
prOperty venturesThe property ventures business invests in projects that focus on select residential and commercial development opportunities in core locations with experienced local joint venture partners. Abacus has total assets of $313 million in property venture projects, reflecting only 17% of the balance sheet assets but provides potential for outperformance as projects and investments complete.
The division generated a strong EBITDA result, which was 5% above that delivered in the previous year. A site at Lewisham, which was part of the RCL portfolio, was sold in August 2012 for $48.5 million. Our residential development projects at Rosebery (Sydney, NSW) and Bay Street (Brighton, VIC) made significant progress during the year. Rosebery was completed in May 2013. Our Bay Street project is progressing well and is currently ahead of schedule. Settlement is anticipated by the end of the current calendar year. Abacus also initiated a number of new projects during the year including Jack Road in Cheltenham VIC which comprises a mixed townhouse development of up to 160 residential products and Carlton project in Melbourne VIC, a high density residential apartment development of up to 190 units.
Funds managementThe funds management business generated a contribution of $16.6 million for the year providing a return of 7.8% on total funds invested across the platform. This contribution before fair value adjustments was slightly below the 2012 financial year as a consequence of the merger of the Storage Fund.
sustainaBilityAbacus has always operated its business activities in a sustainable manner and with regard for the natural environment. Abacus has now enhanced its commitment in this area by adopting a formal sustainability protocol. The protocol is on page 15 of the Annual Report. We have developed a number of measures that will enable us to monitor and benchmark the sustainability performance of our assets. We intend to report on these measures in next year’s Annual Report.
Page 17 of this report highlights one such example at our property at 51 Allara Street in Canberra. Here Abacus has completed an upgrade to the building for a Government tenant to include energy efficient lighting, upgraded and efficient air conditioning systems and a 60 place childcare centre.
OutlOOk
Abacus has delivered a good result that illustrates the strength of the Abacus business, with a strong underlying profit and cashflow from operations. We have a clear focus on activities that will support and generate cashflow.
We believe the Abacus portfolio is well placed to cope with the current challenging conditions and we have created a strong diversified asset base with a clear strategy for major assets and projects. Our income is diversified by asset class, tenancy and geography.
We are long term property investors seeking to develop, deliver and acquire new opportunities to drive long term securityholder returns.
Finally, we and the other members of our Board would like to thank you, our investors and our other stakeholders for your continued support. We are pleased with what we have been able to achieve in light of that and we are confident that we are positioning Abacus well in order to deliver strong long term total returns to investors in the future. This would not be possible without the dedication and hard work of everyone at Abacus. Therefore, on behalf of the Board, we would like to thank our executive team and all our staff.
John Thame Frank Wolf Chairman Managing Director
For
per
sona
l use
onl
y

33 Queen street and 199 geOrge street, BrisBane Qld These properties were acquired as one for $34 million in April 2013 and represented an initial yield of 9.4%. 33 Queen Street is an historic seven level building with frontage to the Queen Street Mall and immediately adjoining and connected is 199 George Street, a recently constructed modern office and retail tower with frontage to George Street. 33 Queen Street has an unrivalled location at the top of Queen Street Mall, on one of Brisbane’s best corners. The heritage building has total NLA of 3,313m2, including 1,290m2 of retail space leased to Westpac Bank and 2,023m2 leased to a number of smaller tenants. Westpac Bank has occupied the retail area for over 160 years. The building is almost fully let. 199 George Street is a near new 2,769m2 ten level, A grade commercial office building that connects to all floors of the adjoining heritage building. The property is approximately 90% occupied and has 16 car spaces.
01
12 abacus property group
RECENT ACquISITIONS
For
per
sona
l use
onl
y

13 annual report 2013
For
per
sona
l use
onl
y

14 abacus property group
01
03 02
BrOWns rOad, ClaytOn viCThis industrial property in Clayton was acquired in May 2013 for $19.55 million. The transaction represents a sale and lease back for 10 years on triple net terms and represented an initial yield of 9.8%. The property comprises 31,873 sqm of improvements on 6.1 hectares of land. The property represents a strong acquisition with appropriate risk adjusted returns providing an attractive yield and triple net lease. The site’s location is an established residential area 21km’s SE from the Melbourne CBD, close to local railway and transport nodes and shopping and medical facilities suggesting a residential rezoning, with initial indications showing up to 325 dwellings, may be the highest and best use for the site at some time in the future.
BaCChus marsh village shOpping Centre, BaCChus marsh viCThis sub-regional shopping centre was acquired for $31.6 million in June 2013. The property is a well presented and dominant convenience based shopping centre located approximately 50km west of the Melbourne CBD. The total site area is 4.4 hectares of which 0.84 hectares is vacant land with development potential. The acquisition reflects $2,086psm of gross lettable area representing strong value metrics for an established centre in a location illustrating good demographics and an undersupply of supermarket facilities. The shopping centre has a total gross lettable area of 15,147sqm and is anchored by a Coles supermarket. The other major retail tenants include Aldi, Target Country and Reject Shop. The property provides great enhancement opportunities to increase the net income over the medium term via a renewed leasing and re-positioning strategy, with the vacant land allowing strong development potential.
02 03
RECENT ACquISITIONS CONTINuED
For
per
sona
l use
onl
y

15 annual report 2013
SuSTAINABIlITy
sustainaBility prOtOCOl
Abacus Property Group (Abacus) is a diversified A-REIT that specialises in investing in core plus property opportunities across Australia. We seek to take advantage of value-adding opportunities to maximise securityholder value, through the acquisition, re-development, refurbishment, re-positioning and re-leasing of assets. Our core plus approach means that our assets are actively managed and often undergo significant change over their lifecycle.
Abacus believes it is important to understand and respond to the environmental, social and governance impacts of our business activities. We believe that integrating sustainability issues into our investment decision-making and business operations is congruent with the responsibility we have to our stakeholders.
We are committed to implementing sustainability practices in our investments, property management, development activities and workplaces. We will use these practices to manage risks, create opportunities and strengthen our operations. We have always applied an ethical approach to our business and we are committed to:
• Ongoing communication with our stakeholders on environmental, social and governance issues.
• Incorporating environmental issues including climate change in our decision-making processes.
• Managing our buildings efficiently to conserve the use of limited natural resources.
• Supporting and developing our employees to use their skills and expertise to respond to the sustainability challenges.
• Maintaining a safety-aware culture ensuring proper standards of workplace health and safety for our staff, contractors and other users of, and visitors to, our properties.
We will work to implement these commitments over time having regard to the nature, context and strategy of individual property assets and the interests of our stakeholders by:
• Developing and implementing appropriate systems to monitor and benchmark the sustainability performance of our assets.
• Pursuing cost effective and efficient use of energy and water and waste reduction.
• Adopting sustainable design practices in our asset improvement and development projects where appropriate.
• Reporting on our sustainability progress and performance.
• Implementing our commitment to sustainability in a practicable manner.
• Influencing our employees and other stakeholders to operate in a manner that supports our sustainability commitments.
This protocol provides the foundation for Abacus’ commitment to sustainability. All our employees are responsible for the implementation of this protocol, which will evolve over time in response to our business needs and the reasonable expectations of our stakeholders.
Signed by:
Frank Wolf Managing Director
For
per
sona
l use
onl
y

16 abacus property group
SuSTAINABIlITyCONTINuED
For
per
sona
l use
onl
y

17 annual report 2013
Case study 51 allara street CanBerra aCt
51 Allara Street was acquired by Abacus Property Group in January 2008. The eight level office block is centrally located in the Canberra CBD in the major government office precinct. When the property was acquired it was leased to a number of tenants including EY and the Australian Taxation Office. With the property facing upcoming lease expiries from EY the ATO, Abacus looked to the future and understood that significant private and government sector tenants require properties that satisfy their sustainability requirements. We then undertook a comprehensive review of the property’s services. Abacus identified a number of services in the building that could be upgraded. These included lighting, lifts, air conditioning, mechanical ventilation, hot water systems and sub-metering of equipment.
A complete modelling of energy usage led to a plan for refurbishment that would not only reduce energy usage but also upgrade building services which were approximately 20 years old. Abacus commenced a substantial refurbishment of the property in 2011 which included an upgrade to the builders 3.5 star NABERS rating with the aim of achieving a 4.5 star rating.
While the refurbishment was underway Abacus negotiated an improved lease with the Department of Resources, Energy and Tourism to increase the area it currently leased to include all vacated space to approximately 8,000m² or approximately 65% of the building’s lettable area for 10 years. Abacus’ commitment to improving the NABERS rating assisted in positive leasing negotiations.
The major works on the above systems includes the following:
• Conversion of lights in office areas to T5 and low voltage lights in the common areas plus the use of timers and motion sensors to automatically turn off excess lighting when not in use;
• Upgrade of lifts including new traction gearless motors which are more efficient;
• Replacement of chillers with more efficient chillers, installation of variable speed drives on high efficiency motors and upgrading boiler burners;
• Installation of solar panels to generate domestic hot water; and
• Sub-metering mains power to allow for more efficient monitoring.
The works were completed in November 2012 and the building has since achieved a NABERS rating of 4.5 stars. These works dramatically reduce the amount of energy required across the property and not only save ongoing costs but also the carbon impact on the environment. Abacus was able to access the Federal Government’s Green Building Fund program to assist in the cost of the building upgrade. Additional fine tuning of the building systems indicate that the building may achieve a NABERS rating of 5 stars when the next assessment is undertaken in late 2013.
DRET had also made enquiries regarding childcare requirements for its employees during its leasing negotiation. Working with the tenant, we were able to convert some commercial internal and external space into a brand new childcare centre. The centre caters for 60 children and provides a useful community service to the building.
Our work at 51 Allara Street showcases the ability of Abacus to work with its tenants and properties to deliver sustainable requirements where required with regard to the natural environment. In undertaking the refurbishment and upgrade works Abacus was able to secure a long term high quality covenant on a 10 year lease to 2021 and maintain the building’s standing and desirability into the future.
For
per
sona
l use
onl
y

18 abacus property group
BOARD MEMBERS
malCOlm irving Mr Irving is a Non-Executive Director and has over 40 years’ experience in company management, including 12 years as Managing Director of CIBC Australia Limited. He is also a director of O’Connell Street Associates Pty Ltd, Macquarie University Hospital and is Chairman of Macquarie Graduate School of Management.
Frank WOlF Dr Wolf is the Managing Director and has over 20 years’ experience in the property and financial services industries, including involvement in retail, commercial, industrial and hospitality-related assets in Australia, New Zealand and the United States. Dr Wolf has been instrumental in over $2 billion worth of property related transactions, corporate acquisitions and divestments and has financed specialist property-based assets in the retirement and hospitality sectors. He is also a director of HGL Limited, a diversified public listed investment company.
JOhn thame Mr Thame is the Chairman and has over 30 years’ experience in the retail financial services industry in senior management positions. His 26-year career with Advance Bank included 10 years as Managing Director until the Bank’s merger with St George Bank Limited in 1997. Mr Thame was Chairman (2004 to 2008) and a director (1997 to 2008) of St George Bank Limited and St George Life Limited. He is also a director of Reckon Limited.
For
per
sona
l use
onl
y

19 annual report 2013
myra salkinder Mrs Salkinder is a Non-Executive Director and is a senior executive of the Kirsh Group. She has been integrally involved over many years with the continued expansion of the Kirsh Group’s property and other investments, both in South Africa and internationally. Mrs Salkinder is a director of various companies associated with the Kirsh Group worldwide.
William J BartlettMr Bartlett is a Non-Executive Director. As a partner at Ernst & Young for 23 years, he held the roles of Chairman of Worldwide Insurance Practice, National Director of Australian Financial Services Practice and Chairman of the Client Service Board. Mr Bartlett is a director of Suncorp Group Limited, GWA Limited, Reinsurance Group of America Inc and RGA Reinsurance Company of Australia Limited. He is Chairman of the Cerebral Palsy Foundation of Australia.
For
per
sona
l use
onl
y

20 abacus property group
SENIOR EXECuTIVETEAM
rOB BaulderstOne Chief Financial Officer
Rob is responsible for the Group’s financial reporting.
phil petersOn associate director – investments
Phil is responsible for all investment and development activities in addition to the general day to day management of the Group’s Storage assets.
Cate aarOns (nOt piCtured) head of strategy
Cate is responsible for strategy for the Group and for its managed funds.
peter strain director property
Peter is responsible for the asset management activities of the Group.
CamerOn laird Joint director property ventures
Cameron is responsible for the Group’s joint venture developments and fostering new property ventures. In addition he is responsible for the asset management and development activities across the Group’s retail portfolio.
neil summerField head of investor relations
Neil is responsible for investor relations, communications and marketing activities to the Group’s listed and wholesale stakeholders.
For
per
sona
l use
onl
y

21 annual report 2013
gavin leChem director specialised Capital
Gavin is responsible for matching the capital requirements of the Group’s current and future opportunities with those of the investment community.
alan thake associate director – investments
Alan is the fund manager for the Groups other unlisted funds including the Abacus Hospitality Fund and ADIF II. He is responsible for investment, development and capital management activities in addition to the general day to day management of the funds.
JOhn l’estrange Joint director property ventures
John is responsible for building the Group’s property ventures business by overseeing current projects and fostering new opportunities.
ellis vareJes Chief Operating Officer and Company secretary
Ellis is responsible for the Group’s transactional and business functions.
len llOyd managing director abacus property services
Len overviews management and administration activities of the Group’s property portfolio. Len is also involved in acquisitions, sales and development activities of the portfolio.
For
per
sona
l use
onl
y
22 abacus property group
The Directors of Abacus Group Holdings Limited (“AGHL”), Abacus Funds Management Limited (“AFML”) – the Responsible entity of Abacus Trust (“AT”) and Abacus Income Trust (“AIT”), Abacus Group Projects Limited (“AGPL”), Abacus Storage Funds Management Limited (“ASFML”) – the Responsible Entity of Abacus Storage Property Trust (“ASPT”) and Abacus Storage Operations Limited (“ASOL”) present their report for the year ended 30 June 2013.
prinCipal aCtivitiesThe principal activities of Abacus Property Group were investment in office, retail and industrial properties, investment in self-storage facilities, participation in property ventures and developments and property funds management. There has been no significant change in the nature of these activities during the year.
Operating and FinanCial revieWThe operating and financial review is intended to convey the Directors’ perspective of Abacus Property Group and its operational and financial performance. It sets out information to assist securityholders to understand and interpret the financial statements prepared in accordance with Australian International Financial Reporting Standards (“AIFRS”) included in this report. It should be read in conjunction with the financial statements and accompanying notes.
Listed Structure / EntitiesThe listed Abacus Property Group is a diversified property group that operates predominantly in Australia. It comprises AGHL, AT, AGPL, AIT, ASPT and ASOL (collectively “Abacus”) and its securities trade on the Australian Securities Exchange (“ASX”) as ABP. Abacus was listed on the ASX in November 2002 and its market capitalisation was over $1 billion at 30 June 2013.
Shares in AGHL, AGPL and ASOL and units in AT, AIT and ASPT have been stapled together so that none can be dealt with without the others and are traded together on the ASX as Abacus securities. An Abacus security consists of one share in AGHL, one unit in AT, one share in AGPL, one unit in AIT, one share in ASOL and one unit in ASPT. A transfer, issue or reorganisation of a share or unit in any of the component parts requires, while they continue to be stapled, a corresponding transfer, issue or reorganisation of a share or unit in each of the other component parts.
AGHL, AGPL and ASOL are companies that are incorporated and domiciled in Australia. AT, AIT and ASPT are Australian registered managed investment schemes. AFML is the Responsible Entity of AT and AIT and ASFML is the Responsible Entity of ASPT. Both AFML and ASFML are incorporated and domiciled in Australia and are wholly-owned subsidiaries of AGHL.
Abacus Property Group ConsolidationThe application of AASB10 by Abacus results in the consolidation of Abacus Hospitality Fund, Abacus Diversified Income Fund II, Abacus Miller Street Holding Trust and Abacus Wodonga Land Fund (the “Group”). This is due to the combination of Abacus’ role as responsible entity, variable returns arising from its collective equity and loan investments in these funds, and certain guarantees.
AGHL has been identified as the parent entity of the Group. The financial reports of the Group for the year ended 30 June 2013 comprise the consolidated financial reports of AGHL and its controlled entities, AT and its controlled entities, AGPL and its controlled entities, AIT and its controlled entities, ASOL and its controlled entities, ASPT and its controlled entities, Abacus Hospitality Fund and its controlled entities, Abacus Diversified Income Fund II and its controlled entities, Abacus Miller Street Holding Trust and its controlled entity and Abacus Wodonga Land Fund.
The principal activities of Abacus that contributed to its earnings during the course of the year ended 30 June 2013 included:• investment in office, retail and industrial properties to derive rental and fee income;• investment in self-storage facilities to derive storage fee income;• participation in property ventures and developments to derive interest income and capital profits; and• property funds management to derive fee income and equity returns.
DIRECTORS’ REPORT30 JuNE 2013
For
per
sona
l use
onl
y

23 annual report 2013
Operating and FinanCial revieW (COntinued)These activities are reported through our four core reportable segments of Property, Storage, Property Ventures and Funds Management, respectively.
Abacus is also a member of the S&P/ASX 200 A-REIT index (ASX:XPJ), a sub-index of the S&P/ASX 200 index that contains the listed vehicles classified as A-REITs. Abacus is the only dedicated core plus investor in the XPJ index and offers some differentiation to the market providing a more active management model to the other members of the XPJ index which are focused on rent collection or funds management.
OuR STRATEgyAbacus’ objective is to provide securityholders with strong and stable cash backed distributions from a diversified portfolio of property exposures that provides genuine potential for capital growth. Our strategy is to invest Abacus’ capital into core plus properties and take advantage of value adding opportunities to drive long term total returns and maximise securityholder value. Abacus does this through the acquisition, development and active management of property assets. In particular:
• We take advantage of our specialised knowledge and market position as the only listed core plus investor.
• We drive value through active management of the asset portfolio and through the reinvestment of proceeds from the sales of mature or low growth core plus assets, assets that have realised their core plus potential and assets that require a disproportionate investment of management time relative to their value or potential.
• We are committed to simplifying our balance sheet and redeploying realised capital into accretive core plus property investments that are expected to yield 12-15% per annum equity total returns over time.
• Our core plus presence and track record has facilitated joint ventures with a number of sophisticated global third party capital providers, and we are actively working within this market to expand our capacity.
Abacus seeks assets in capital cities, typically on the Eastern seaboard of Australia and New Zealand that are mispriced by the market and which we believe are capable of both cashflow and capital growth. Abacus generally invests in commercial assets up to $100 million in value. These assets are usually B-Grade assets in good core locations in major trading or CBD areas, as they generally offer more attractive core plus and enhancement characteristics and therefore better opportunities to deliver enhanced returns. Our philosophy with self-storage properties is focused on Australia and New Zealand and includes regional locations.
gROuP RESulTS SuMMARyThe Board monitors a range of financial information and operating performance indicators to measure performance over time. We use several measures to monitor the financial success of our overall strategy. The key measure is underlying profit.
2013 2012
Revenue ($ million) 281.0 236.1
Total income ($ million) 305.9 250.0
Statutory net profit excluding non-controlling interests ($ million) 61.1 8.5
Underlying profit^ ($ million) 83.8 76.8
Underlying profit per security^ (c) 18.76 19.17
Cashflow from operating activities ($ million) 168.8 86.3
Cashflow from operating activities per security (c) 37.82 21.51
Distributions per security^ (c) 16.50 16.50
Interest cover ratio 3.3x 3.2x
Weighted securities on issue^ (million) 446.4 400.9
^ Abacus
For
per
sona
l use
onl
y
24 abacus property group
DIRECTORs’ REPORT 30 JUNE 2013CONTINUED
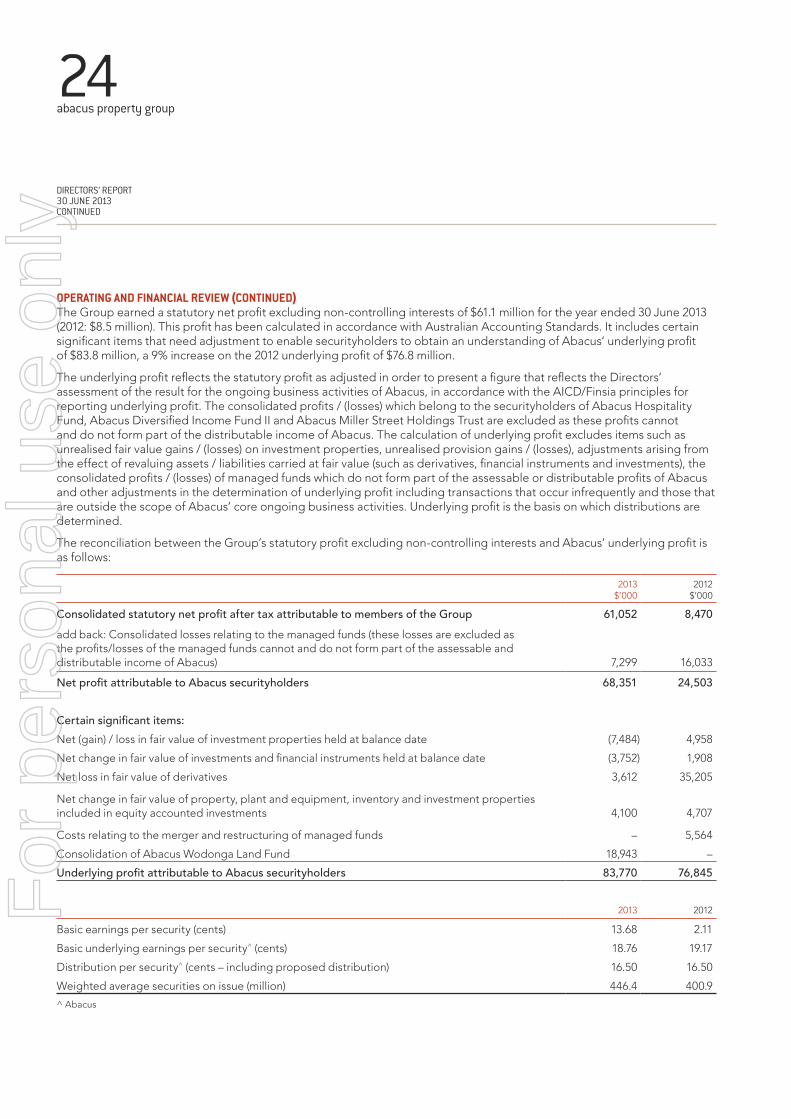
Operating and FinanCial revieW (COntinued)The Group earned a statutory net profit excluding non-controlling interests of $61.1 million for the year ended 30 June 2013 (2012: $8.5 million). This profit has been calculated in accordance with Australian Accounting Standards. It includes certain significant items that need adjustment to enable securityholders to obtain an understanding of Abacus’ underlying profit of $83.8 million, a 9% increase on the 2012 underlying profit of $76.8 million.
The underlying profit reflects the statutory profit as adjusted in order to present a figure that reflects the Directors’ assessment of the result for the ongoing business activities of Abacus, in accordance with the AICD/Finsia principles for reporting underlying profit. The consolidated profits / (losses) which belong to the securityholders of Abacus Hospitality Fund, Abacus Diversified Income Fund II and Abacus Miller Street Holdings Trust are excluded as these profits cannot and do not form part of the distributable income of Abacus. The calculation of underlying profit excludes items such as unrealised fair value gains / (losses) on investment properties, unrealised provision gains / (losses), adjustments arising from the effect of revaluing assets / liabilities carried at fair value (such as derivatives, financial instruments and investments), the consolidated profits / (losses) of managed funds which do not form part of the assessable or distributable profits of Abacus and other adjustments in the determination of underlying profit including transactions that occur infrequently and those that are outside the scope of Abacus’ core ongoing business activities. Underlying profit is the basis on which distributions are determined.
The reconciliation between the Group’s statutory profit excluding non-controlling interests and Abacus’ underlying profit is as follows:
2013 $’000
2012 $’000
Consolidated statutory net profit after tax attributable to members of the Group 61,052 8,470 add back: Consolidated losses relating to the managed funds (these losses are excluded as the profits/losses of the managed funds cannot and do not form part of the assessable and distributable income of Abacus)
7,299
16,033
Net profit attributable to Abacus securityholders 68,351 24,503
Certain significant items:Net (gain) / loss in fair value of investment properties held at balance date (7,484) 4,958
Net change in fair value of investments and financial instruments held at balance date (3,752) 1,908
Net loss in fair value of derivatives 3,612 35,205
Net change in fair value of property, plant and equipment, inventory and investment properties included in equity accounted investments
4,100
4,707
Costs relating to the merger and restructuring of managed funds – 5,564
Consolidation of Abacus Wodonga Land Fund 18,943 –
Underlying profit attributable to Abacus securityholders 83,770 76,845
2013 2012
Basic earnings per security (cents) 13.68 2.11
Basic underlying earnings per security^ (cents) 18.76 19.17
Distribution per security^ (cents – including proposed distribution) 16.50 16.50
Weighted average securities on issue (million) 446.4 400.9
^ Abacus
For
per
sona
l use
onl
y

25 annual report 2013
Operating and FinanCial revieW (COntinued)The Australian property market throughout the period has been characterised by a dislocation between pricing and underlying fundamentals. This is driven by strong demand for product by domestic and international buyers attributable to large gaps between bond rates and property yields in institutional markets across the developed world. This demand has largely ignored the weak fundamentals attributable to a slowdown in office activity and uncertain economic conditions. As a result, Abacus proceeded cautiously with its acquisition strategy during the year as fundamental value was difficult to find in traditional Sydney or Melbourne CBD markets. This provided a lag between asset realisations of $74 million of sales of mature, lower growth assets early in the financial year and the purchase of $84 million of property (including equity accounted properties) in the final months of the year as Abacus was able to re-invest the capital proceeds appropriately outside of its traditional markets causing a drag on rental income.
The market outlook for the short term remains relatively subdued with a continuation of tough leasing conditions and high market incentives, which will impact our ability to find attractive core plus opportunities. However, as demonstrated towards the end of the current year, Abacus remained able to find sound, mispriced core plus properties. The medium term expectations are anticipating an improvement driven by better economic conditions and white collar employment growth.
The increase in the Group’s statutory net profit excluding non-controlling interests was principally due to a movement of $53 million in the fair value decrement to interest rate swaps in the prior year. The Group has sought to use these interest rate swaps to fix the cost of its borrowings, manage interest cover covenants and align these borrowings with the net revenue earned by the property portfolio.
When considering the underlying profit attributable to Abacus securityholders, the increase in profits by 9% was largely driven by the completion of transactions including the sale of the Lewisham joint venture residential development project.
The impact of both year-end fair value adjustments and the Group’s performance on its financial position were as follows:
2013 2012
Total assets ($ million) 2,127.8 2,106.8
Gearing^ (%) 28.4 28.6
Net assets* ($ million) 1,084.0 1,056.9
Net tangible assets*^ ($ million) 1,049.2 1,016.1
NTA per security^ ($) 2.32 2.34
NTA per security post distribution^ ($) 2.23 2.25
^ Abacus – gearing calculated as debt minus cash divided by total assets minus cash.* Excluding external non-controlling interests of $43.8 million (2012: $51.0 million).
The increase in net assets of the Group by 3% reflects the improved performance compared to the previous year. During the year, the Group’s total assets increased slightly due to property acquisitions towards the end of the year, while the Group’s total liabilities year on year remained constant.
The Group has $164.3 million of interest bearing loans and borrowings maturing in the coming year, of which $124.4 million are in the managed funds. The Group is actively engaging with counterparties to either extend or refinance most of the loans and $27.1 million of vendor finance loans will be repaid in the coming financial year. Despite the increase in current liabilities and a reduction in investment properties earmarked for sale, net current assets remained positive at $72.3 million.F
or p
erso
nal u
se o
nly

26 abacus property group
DIRECTORs’ REPORT 30 JUNE 2013CONTINUED
Operating and FinanCial revieW (COntinued)Capital managementThe Abacus balance sheet continues to be strong with gearing remaining low at 28.4%, well within our target gearing limit of 35%. At 30 June 2013, Abacus had $108 million of available liquidity that provided capacity for use for up to $160 million of accretive acquisitions. Following the settlement of Bacchus Marsh Village Shopping Centre for $31.6 million in late July, Abacus’ acquisition capacity reduced to circa $125 million.
Abacus has no significant debt expiring until late 2014. We continue to improve and reweight the balance sheet to larger, higher quality assets with a focus on disciplined capital management strategies. We anticipate Abacus’ weighted average interest rate will remain relatively stable as current capacity is utilised and anticipate it should be no greater than 6.5% over the next year.
CORE SEgMENT RESulTS SuMMARyBusiness activities that specifically contributed to the Abacus’ operating performance and financial condition for the financial year were:
PropertyAs at 30 June 2013, Abacus’ property segment delivered a result of $64.1 million for the year. This represented an increase of 15.0% largely attributable to the impact of an increase in the fair value of investment properties offsetting the lost income from significant asset sales at the beginning of the period. These properties were not replaced until the end of the year. The 47 assets that make up the commercial portfolio (45 at the commencement of the year) had a total value of $888 million at year end.
Pursuant to the 2013 portfolio valuation process 23 out of 37 of the commercial properties (excluding equity accounted properties) or 73% by value were independently valued during the year to 30 June 2013. The remaining properties were subject to internal review and, where appropriate, their values were adjusted. The valuation process resulted in a net full year revaluation gain of $6.6 million (2012: $7.2 million charge) or 0.7% of assets. A significant contributor to this increase was Ashfield Mall, Sydney NSW as a result of a combined improvement in capitalisation rate and rental income following encouraging repositioning and re-leasing works.
During the year Abacus acquired an interest in the following properties:
Office180 Queen Street, Brisbane QLD (25% indirect ownership) $7.4m
Wharf 10, Sydney NSW (25% indirect ownership) $8.0m
35 Boundary Street, Brisbane QLD (25% indirect ownership) $10.1m
33 Queen Street, Brisbane QLD (100% direct ownership) $34.0m
IndustrialBrowns Road, Clayton VIC (100% direct ownership) $19.6m
The acquisition of Bacchus Marsh Village Shopping Centre, Victoria for $31.6 million was announced on 24 June 2013 (although settlement occurred after year end).
Abacus sold five properties during the year, including Lennon’s Plaza in the Brisbane CBD, for $74.0 million which realised a gain of $2.8 million.
The commercial portfolio is diversified across asset classes which are well located, largely along the eastern seaboard in major metropolitan areas. While some geographic areas are challenging we nevertheless believe this provides a level of security and stability to the portfolio’s property income and cash flows.
For
per
sona
l use
onl
y
27 annual report 2013
Operating and FinanCial revieW (COntinued)
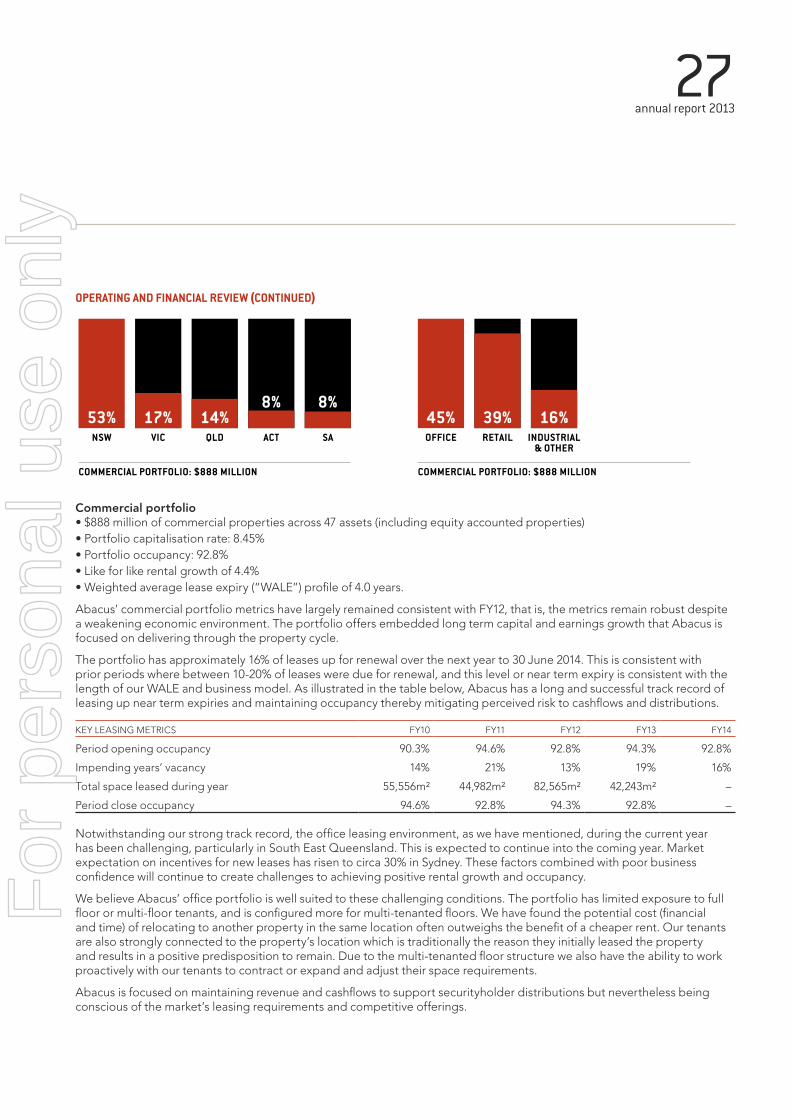
Commercial portfolio• $888 million of commercial properties across 47 assets (including equity accounted properties)• Portfolio capitalisation rate: 8.45%• Portfolio occupancy: 92.8%• Like for like rental growth of 4.4%• Weighted average lease expiry (“WALE”) profile of 4.0 years.
Abacus’ commercial portfolio metrics have largely remained consistent with FY12, that is, the metrics remain robust despite a weakening economic environment. The portfolio offers embedded long term capital and earnings growth that Abacus is focused on delivering through the property cycle.
The portfolio has approximately 16% of leases up for renewal over the next year to 30 June 2014. This is consistent with prior periods where between 10-20% of leases were due for renewal, and this level or near term expiry is consistent with the length of our WALE and business model. As illustrated in the table below, Abacus has a long and successful track record of leasing up near term expiries and maintaining occupancy thereby mitigating perceived risk to cashflows and distributions.
KEY LEASING METRICS FY10 FY11 FY12 FY13 FY14
Period opening occupancy 90.3% 94.6% 92.8% 94.3% 92.8%
Impending years’ vacancy 14% 21% 13% 19% 16%
Total space leased during year 55,556m² 44,982m² 82,565m² 42,243m² –
Period close occupancy 94.6% 92.8% 94.3% 92.8% –
Notwithstanding our strong track record, the office leasing environment, as we have mentioned, during the current year has been challenging, particularly in South East Queensland. This is expected to continue into the coming year. Market expectation on incentives for new leases has risen to circa 30% in Sydney. These factors combined with poor business confidence will continue to create challenges to achieving positive rental growth and occupancy.
We believe Abacus’ office portfolio is well suited to these challenging conditions. The portfolio has limited exposure to full floor or multi-floor tenants, and is configured more for multi-tenanted floors. We have found the potential cost (financial and time) of relocating to another property in the same location often outweighs the benefit of a cheaper rent. Our tenants are also strongly connected to the property’s location which is traditionally the reason they initially leased the property and results in a positive predisposition to remain. Due to the multi-tenanted floor structure we also have the ability to work proactively with our tenants to contract or expand and adjust their space requirements.
Abacus is focused on maintaining revenue and cashflows to support securityholder distributions but nevertheless being conscious of the market’s leasing requirements and competitive offerings.
53%NSW
COMMERCIAL PORTFOLIO: $888 MILLION
17%VIC
14%QLD
8%
ACT
8%
SA
45%OFFICE
COMMERCIAL PORTFOLIO: $888 MILLION
39%RETAIL
16%INDUSTRIAL
& OTHER
For
per
sona
l use
onl
y

28 abacus property group
DIRECTORs’ REPORT 30 JUNE 2013CONTINUED
Operating and FinanCial revieW (COntinued)Contribution from Third Party CapitalAbacus has continued to grow its third party capital joint ventures and envisages the platform being an integral component of Abacus’ future strategy. Abacus typically acquires 25% to 50% of the assets and our capital partners own the balance. Management of the property remains with Abacus and as a result we are able to leverage our capital to gain greater exposure to a higher number of core plus assets. This leads to greater earnings from fees and rental income. We will focus on driving our third party strategy to expand our capital base to add to the $570 million of high quality assets that Abacus has acquired with its joint venture partners since 2009.
StorageAs at 30 June 2013, Abacus’ storage portfolio delivered a result of $24.4 million for the year. This represents an increase on the FY12’s result of $12.6 million and can be attributed to the impact of a full year’s contribution from the storage portfolio. Portfolio assets totalled $373 million across a total portfolio of 47 assets, an overall increase of two assets during the period.
Pursuant to the 2013 valuation process 24 storage assets out of 47 or 54% by value were independently valued during the year to 30 June 2013. The remaining properties were subject to internal review and, where appropriate, their values were adjusted. The valuation process resulted in a net full year revaluation gain of $0.9 million (2012: $2.3 million gain) or 0.2% of assets.
The storage portfolio is well diversified in Australia and New Zealand.
• $373 million of storage assets• Portfolio capitalisation rate: 9.2%• Occupancy: 81.8%• Rental gross rent: $237 per m²
A consistent trading performance across the storage portfolio has continued to deliver resilient underlying cashflows despite the subdued economic environment and a competitive storage market. The Australian market has experienced competition leading to increased discounting from other market participants during the year. The portfolio experienced a slight decrease over the year in gross rental to $237 from $238 per m² as a result. Despite this fall in rate, the portfolio continued to deliver positive revenue growth via the Australian portfolio at 0.5% pa and the New Zealand market at 4.5% pa largely from an overall improvement in occupancy.
27%VIC
STORAGE PORTFOLIO: $373 MILLION
21%NZ
19%QLD
17%ACT
16%NSW
For
per
sona
l use
onl
y

29 annual report 2013
Operating and FinanCial revieW (COntinued)While focused on improving occupancy and rental growth, Abacus also sees the delivery of expansion opportunities in the current portfolio where strong demand allows for low cost expansion as a core focus to driving portfolio returns. Abacus currently has a number of store expansions and new store developments that will utilise existing Abacus property holdings to grow the storage platform. These include:• Expansion of our store at Riccarton, NZ which will be completed by December 2013. It will provide around 3,000m² of new
fitout over 2 levels.
• Acquisition of the neighbouring property to our Blacktown, NSW facility which settled in June 2013 providing an additional 3,300m² of gross floor area. We will look to integrate this with the existing storage operation to expand and provide a mix of storage and warehouse space until demand warrants full conversion to storage.
• Castle Hill, NSW: Development approval has been obtained to develop a new facility. This will deliver a new facility of circa 3,500m² on completion once fully developed. We anticipate trading to commence during FY14.
• Wodonga, VIC: A development application has been lodged with council to develop a new facility on our land. This should deliver circa 3,000m² of net lettable area once fully developed.
• Villawood, NSW: A development application has been lodged with council in one tenancy of an Abacus industrial property. This should deliver circa 2,000m² as part of stage one, with potential to grow the facility as demand requires.
Property VenturesThe Property Ventures business invests in projects that focus on select residential and commercial development opportunities in core locations with experienced local joint venture partners. Abacus has total assets of $325 million in property venture projects, an increase of $69 million from the previous year. Abacus initiated a number of new projects during the year including:• Jack Road, Cheltenham VIC. A mixed townhouse development of up to 160 residential products.
• Carlton, Melbourne VIC. A high density residential apartment development of up to 190 units.
The Property Ventures division generated a result of $30.4 million for the year, an increase of 43% to FY12 result of $21.3 million following strong transactional profits in the year. A site at Lewisham, which was part of the RCL portfolio, was sold in August 2012 for $48.5 million. The sale contributed $6.3 million to the division’s result. Our residential development projects at Rosebery (Sydney, NSW) and Bay Street (Brighton, VIC) made significant progress during the year. Rosebery was completed in May 2013 with Abacus generating a total profit of over $5 million. Our Bay Street project is progressing well and is currently ahead of schedule. It remains on target for settlement by the end of the current calendar year.
Funds ManagementThe funds management business generated a result of $16.6 million for the year providing a return of 7.8% on total funds invested across the platform. This result before fair value adjustments was slightly below the FY12 result of $18 million, which is consistent with a reduction of fee and interest income by virtue of the merger of the Storage Fund in FY12 and a reduction in assets under management. Abacus continues to manage these unlisted funds to try to optimise the returns with selective sales of assets where opportunity and market conditions allow.
The progress of the management for each of the funds is set out in the non-core segment results summary is as follows.For
per
sona
l use
onl
y

30 abacus property group
DIRECTORs’ REPORT 30 JUNE 2013CONTINUED
Operating and FinanCial revieW (COntinued) NON-CORE SEgMENT RESulTS SuMMARyAs a result of AASB10, the managed funds are consolidated into the Group financial statements and the Group’s statutory profit includes the financial performance of these funds. These funds are treated as non-core segments as the assets of the funds are not directly owned by Abacus securityholders and do not contribute directly to Abacus’ underlying profit and distributable income.
An overview of the financial performance of each of the funds for the year ended 30 June 2013 is as follows:
Abacus Hospitality Fund (AHF)AHF owns four hotels: Rydges Tradewinds in Cairns, North Queensland with 246 rooms; Rydges Esplanade in Cairns, North Queensland with 242 rooms; Novotel Twin Waters Resort on the Sunshine Coast, Queensland with 374 rooms and Chateau on the Park, Christchurch, New Zealand with 192 rooms.
The Queensland market remains difficult. Domestic and overseas visitor numbers are lower than in previous years because of the strong Australian dollar (although recent weakening should improve overseas visitor numbers). There are however some signs of improvement in the Cairns market with a pick-up in demand from Japanese tourists which had declined in previous years after the Japanese tsunami natural disaster. The Novotel Twin Waters Resort on the Sunshine Coast has experienced a reduction in revenue largely due to a weak corporate conference market. AHF has exchanged contracts to purchase a 7ha parcel of land adjacent to the hotel for $1.3 million which is currently used for car parking. The land was previously leased from the Crown.
The Chateau on the Park hotel in Christchurch is presently undergoing a major repair to fix the damage caused by the 2011 earthquake. Repair work has continued for almost a year and is expected to be completed in this calendar year. A number of rooms have consequently been unavailable resulting in lower hotel occupancy and room revenue compared with the prior year corresponding period (the previous year benefited from high occupancy through demand from emergency and construction workers assessing the earthquake damage throughout the Christchurch CBD). The total cost of the repair works is around NZ$7.0 million. Most of the repair cost is expected to be covered by insurance, but there will be an assessment by the insurer to determine if any of the works are improvements rather than repairs to damage caused by the earthquake. The insurer also provided business interruption cover until the end of February 2013.
AHF has a bank facility expiring in June 2014.
Abacus Diversified Income Fund II (ADIF II)At 30 June 2013 ADIF II owned 21 investment properties diversified by sector and state. The property portfolio was approximately 95% occupied and had a weighted average lease term of 3.5 years. The portfolio occupancy and average lease term have remained relatively stable during the year as a result of signing new leases and renewing expiring leases.
During the year ADIF II sold four properties for $18.4 million. Sales proceeds were used to acquire 37 Epping Road, Macquarie Park, NSW for $17.4 million in March 2013. ADIF II also exercised the property option over 79-85 Melville Street, Hobart, TAS in May 2013.
ADIF II has two bank facilities. One of the facilities with a drawn balance of $32.2 million expires in September 2013. The other facility expires in November 2014.
Abacus Miller Street Holdings Trust (AMSHT)AMSHT owns the commercial property at 50 Miller Street North Sydney. The ten floors of office space are leased by National Australia Bank (“NAB”) and there are six retail tenancies on the ground floor. In accordance with the lease agreement, NAB will hand back one floor of 750 m² around November 2013 and continue to lease the remaining nine floors until October 2017. NAB has sublet six of its nine floors to National Broadband Network (“NBN”).
The property is being marketed for sale in accordance with the recommendation from the responsible entity. It has a weighted average lease expiry of approximately 4 years, a NABERs rating of 5, large contiguous floor space and it is well located in North Sydney. The bank facility which was to expire in September 2013 has been extended to March 2014 to allow for an orderly sales process to occur.
For
per
sona
l use
onl
y

31 annual report 2013
Operating and FinanCial revieW (COntinued) Abacus Wodonga Land Fund (AWLF)AWLF owns the estate known as White Box Rise located in Wodonga, Victoria. During the year 84 residential lots and 5 commercial lots were sold for combined gross proceeds of $15.7 million. Construction of new residential stages is ongoing to maintain inventory for a range of markets including first home buyers, families, investors and retirees. In February 2013 Wodonga council opened its new aquatic centre located at White Box Rise. This will complement the estate’s primary school and Woolworths shopping centre.
White Box Rise has approximately 700 residential lots left in accordance with the approved masterplan.
At 30 June 2013, the bank loan was drawn to $6.7 million against a facility limit of $12 million. The loan was re-drawn to $10.5 million at August 2013, secured on the new residential lots constructed.
FuTuRE PROSPECTS AND RISKSAbacus remains committed to growing its core segments and will achieve this through the acquisition and ownership of core plus assets either through joint venture or directly on balance sheet. We will continue to actively manage our portfolio and where appropriate recycle the mature, lower growth assets realising its improved capital position to help provide liquidity to fund future acquisitions. We believe that increasing our allocation to core plus assets will improve recurring earnings to support and grow our distributions and cash flows, optimising securityholder returns in the coming years. At 30 June 2013 Abacus held sufficient acquisition capacity to acquire a further $160 million of properties directly on the balance sheet.
This capacity can be further leveraged to acquire a larger number of assets through joint venture acquisitions. The total portfolio is anticipated to deliver an increased level of rental income in the coming year as the full year impact of recent acquisitions is captured. The on-going weakness in the leasing markets and the currently high level of incentives provided to new tenants is likely to have a negative influence on revenue growth. Growth in revenue through further acquisitions will be driven by our ability to access markets for core plus opportunities that deliver our required equity returns.
Abacus remains committed to delivering transactional returns to securityholders in addition to returns from recurring income. The timing and nature of transactional returns are unpredictable and uncertain therefore making it difficult to forecast.
There are a number of risk factors associated with property-related businesses that may have an impact on the financial prospects of Abacus. Some of the key risks are outlined below. This outline is not exhaustive, and performance may be affected adversely by any of these risk and other factors.
• Returns from investment – Returns from investment in real property and other related property exposures depend largely on the amount of rental income that can be generated from the property, the expenses incurred in operations, including the management and maintenance of the property, as well as changes in the market value of the property. Factors which may adversely impact these returns include: • the overall conditions in the national and local economy, such as changes in gross domestic product, employment
trends, inflation and interest rates;• local real estate conditions, such as the level of demand for and supply of retail, commercial and industrial space;• the perception of prospective tenants of the attractiveness, practicality and convenience of the rental space;• changes in tenancy laws and planning approval requirements;• external factors including major world events such as war, terrorist attacks or force majeure events;• unforeseen capital expenditures;• supply of new property and other investment assets;• cost of property outgoings and recoverability from tenants; and• investor demand/liquidity in investment markets.
For
per
sona
l use
onl
y
32 abacus property group
DIRECTORs’ REPORT 30 JUNE 2013CONTINUED
Operating and FinanCial revieW (COntinued) • Leasing terms and tenant defaults – The future financial performance of Abacus will depend, in part, on its ability
to continue to lease existing retail, office, industrial, storage and hotel space that is vacant or becomes vacant on economically favourable terms. In addition, the ability to lease new asset space in line with expected terms will impact on the financial performance of Abacus.The ability of major tenants to meet their rental and other contractual commitments to Abacus (such as in situations of insolvency or closure of their businesses) may have an adverse impact on the income from properties, which may result in an adverse impact on the financial performance of Abacus.
This risk is managed through active asset management including ongoing liaison with tenants, regular maintenance and refurbishment of properties to attract tenants, timely marketing programs for vacant space and due diligence on the financial strength of prospective tenants prior to completing leases.
• Funding – The property investment and development sector is highly capital intensive. The ability of Abacus to raise funds (equity and debt) on acceptable terms will depend on a number of factors including capital market conditions, general economic and political conditions, Abacus’ performance, and credit availability. Changes in the cost of current and future borrowings and equity raisings may impact the earnings of Abacus, and impact the availability of funding for new acquisitions, projects or increase the refinancing risks as debt facilities mature.
Abacus uses debt funding provided by major banks. Any downgrade of Abacus’ bank credit assessment may increase overall debt funding costs and adversely affect Abacus’ access to debt funding and the terms on which that funding is offered.
Abacus staggers the debt maturity profile to reduce the concentration of refinancing risks at any point in time and obtains funding through different banks to reduce credit and counterparty risks.
• Insurance – While Abacus will carry customary property insurance, there are types of losses (such as against floods and earthquakes) that are generally not insured at full replacement cost or that are insured subject to larger deductibles or insurance may not be able to be obtained. Additionally, Abacus will face risks associated with the financial strength of its insurers to meet their indemnity obligations when called upon which could lead to an adverse effect on earnings.
Abacus mitigates this risk through the use of insurance brokers to seek to place cover with well rated insurers and ensure that this insurance risk is diversified across various insurers. The diversification of the property portfolio across geographical regions reduces the impact of any potential losses to Abacus.
• Environmental – Abacus may from time to time be exposed to a range of environmental risks including those resulting from soil and water contamination, construction, cultural heritage and flora and fauna (e.g. native vegetation). In addition, there is a risk that property owned by or projects undertaken by Abacus from time to time may be contaminated by materials harmful to human health (such as asbestos or other hazardous materials). Also, returns may be adversely impacted by changes to sustainability and environmental requirements and potentially costs associated with the carbon pricing or the introduction of new regulations referable to the property industry.
In these circumstances, Abacus may be required to undertake remedial works on contaminated sites. Additional expenses may result from changes in environmental regulations across the industry. Abacus as part of the property acquisition due diligence engages experts to advise on any potential environmental risks and factors these into the acquisition price of the property. Abacus also constantly monitors for any potential exposure in changes in environmental regulations to manage any costs and impacts associated with these risks.F
or p
erso
nal u
se o
nly

33 annual report 2013
Operating and FinanCial revieW (COntinued) • Treasury risk – Abacus manages its exposure to financial market risks by way of a formal treasury policy encompassing
among other things interest rate, funding, liquidity and credit risk management. Risk management is undertaken over multiple timeframes with risk management activity reviewed on a regular basis by our Treasury Management Committee, a formally documented senior management committee. The overarching treasury policy parameters for interest rate and funding risk management reflect the objective of balancing a desired level of certainty for interest expense against retaining an appropriate level of flexibility to respond to external developments within not only domestic and global financial markets but also the wider domestic and global economies. The Treasury Policy is reviewed on a regular basis by senior management and the Board. This is enhanced by utilising the in-depth market knowledge of Abacus’ external independent treasury adviser.
With high levels of uncertainty not only in domestic financial markets but also in the Australasian residential and commercial property sectors and the wider global economy, Abacus has focused its interest rate risk management activity over the last financial year on the near-term, albeit within the overall interest rate risk management hedging requirements of our Treasury Policy. Funding risk management has focused on the timely renegotiation of maturing facilities and where possible seeks to increase the overall maturity profile.
signiFiCant Changes in the state OF aFFairsThe contributed equity of the Group increased $36.4 million to $1,268.4 million compared to $1,232.0 million as at 30 June 2012 due to securityholder participation in the distribution reinvestment plan.
Total equity increased by $19.9 million to $1,127.8 million at 30 June 2013 compared to $1,107.9 million at 30 June 2012 principally as a result of the performance of the Group.
On 30 June 2013 the Group consolidated Abacus Wodonga Land Fund in application of AASB10 – Consolidated Financial Statements. This is due to the combination of Abacus’ role as responsible entity and variable returns arising from its equity and loan investments in the fund. The fair value of the fund’s assets and liabilities were determined at the date of consolidation and a loss of $18.9 million was recognised by the Group.
distriButiOnsAbacus’ distributions in respect of the year ended 30 June 2013 were $74.1 million (2012: $67.8 million), which is equivalent to 16.5 cents per stapled security (2012: 16.5 cents). This distribution includes 8.25 cents ($37.4 million) that was paid on 15 August 2013. Further details on the distributions, including distributions by the managed funds are set out in note 9 of the financial statements.
signiFiCant events aFter BalanCe dateOther than as disclosed in this report and to the knowledge of directors, there has been no other matter or circumstance that has arisen since the end of the financial year that has significantly affected, or may affect, the Group’s operations in future financial years, the results of those operations or the Group’s state of affairs in future financial years.
likely develOpments and eXpeCted resultsThe Group will continue to pursue strategies that seek to improve total securityholder returns during the coming year as described in the operating and financial review section of this report.
For
per
sona
l use
onl
y

34 abacus property group
DIRECTORs’ REPORT 30 JUNE 2013CONTINUED
direCtOrs and seCretaryThe Directors of AGHL, AFML, ASOL and AGPL in office during the financial year and until the date of this report are as follows. Directors were in office for this entire period unless otherwise stated.
John Thame Chairman (Non-executive)Frank Wolf Managing DirectorWilliam Bartlett Non-executive DirectorDavid Bastian Non-executive Director
(retired 14 November 2012)Malcolm Irving Non-executive DirectorMyra Salkinder Non-executive Director
The qualifications, experience and special responsibilities of the Directors and Company Secretary are as follows:
John Thame AIBF, FCPA – Chairman (non-executive)
Mr Thame has over 30 years’ experience in the retail financial services industry in senior management positions. His 26-year career with Advance Bank included 10 years as Managing Director until the Bank’s merger with St George Bank Limited in 1997. Mr Thame was Chairman (2004 to 2008) and a director (1997 to 2008) of St George Bank Limited and St George Life Limited. He is also a director of Reckon Limited.
Mr Thame is Chairman of the Due Diligence Committee and a member of the Audit & Risk and Remuneration & Nomination Committees.
Frank Wolf OAM, PhD, BA (Hons) – Managing Director
Dr Wolf has over 20 years’ experience in the property and financial services industries, including involvement in retail, commercial, industrial and hospitality-related assets in Australia, New Zealand and the United States. Dr Wolf has been instrumental in over $2 billion worth of property related transactions, corporate acquisitions and divestments and has financed specialist property-based assets in retirement and hospitality sectors. He is also a director of HGL Limited, a diversified publicly listed investment company.
Malcolm Irving AM, FCPA, SF Fin, BCom, Hon DLitt
Mr Irving is a Non-Executive Director and has over 40 years’ experience in company management, including 12 years as Managing Director of CIBC Australia Limited. He is also a director of O’Connell Street Associates Pty Ltd, Macquarie University Hospital and is Chairman of Macquarie Graduate School of Management.
Mr Irving is Chairman of the Audit & Risk and Compliance Committees and a member of the Due Diligence Committees.
William J Bartlett FCA, CPA, FCMA, CA(SA)
Mr Bartlett is a Non-Executive Director. As a partner at Ernst & Young for 23 years, he held the roles of Chairman of Worldwide Insurance Practice, National Director of Australian Financial Services Practice and Chairman of the Client Service Board. Mr Bartlett is a director of Suncorp Group Limited, GWA Limited, Reinsurance Group of America Inc and RGA Reinsurance Company of Australia Limited. He is Chairman of the Cerebral Palsy Foundation of Australia.
Mr Bartlett is Chairman of the Remuneration & Nomination Committee and a member of the Due Diligence and Audit & Risk Committee.
For
per
sona
l use
onl
y

35 annual report 2013
direCtOrs and seCretary (COntinued)
Myra Salkinder MBA, BA
Mrs Salkinder is a Non-Executive Director and is a senior executive of the Kirsh Group. She has been integrally involved over many years with the continued expansion of the Kirsh Group’s property and other investments, both in South Africa and internationally. Mrs Salkinder is a director of various companies associated with the Kirsh Group worldwide.
Mrs Salkinder is a member of the Due Diligence and Remuneration & Nomination Committees.
Ellis Varejes BCom, LLB – Company Secretary and Chief Operating Officer
Mr Varejes has been the Company Secretary since September 2006. He has over 25 years’ experience as a corporate lawyer in private practice.
As at the date of this report, the relevant interests of the directors in the stapled securities of ABP Group were as follows:
DIRECTORS ABP SECURITIES HELD
J Thame 55,364F Wolf 2,837,464W Bartlett 22,806M Irving 31,471
direCtOrs’ meetingsThe number of meetings of directors (including meetings of committees of directors) of AGHL, AFML (the Responsible Entity of AT and AIT), AGPL, ASFML (the Responsible Entity of ASPT) and ASOL, held during the year and the number of meetings attended by each director were as follows:
BOARDAUDIT & RISK COMMITTEE
REMUNERATION & NOMINATION COMMITTEE
HELD ATTENDED HELD ATTENDED HELD ATTENDED
J Thame 14 14 4 4 2 2
F Wolf 14 14
W Bartlett 14 14 4 4 2 2
D Bastian 6 6 1 1
M Irving 14 14 4 4 2 2
M Salkinder 14 14 4 4
Indemnification and Insurance of Directors and OfficersThe Group has paid an insurance premium in respect of a contract insuring all directors, full time executive officers and the secretary. The terms of this policy prohibit disclosure of the nature of the risks insured or the premium paid.
envirOnmental regulatiOn and perFOrmanCeThe Group is subject to significant environmental regulation in respect of its property activities. Adequate systems are in place for the management of the Group’s environmental responsibilities and compliance with the various licence requirements and regulations. No material breaches of requirements or any environmental issues have been identified during the year. The Group is a core plus investor, not a builder of new buildings. The Group endeavours to choose sustainable options whenever that is a cost-effective outcome.
For
per
sona
l use
onl
y

36 abacus property group
DIRECTORs’ REPORT 30 JUNE 2013CONTINUED
auditOrs independenCe deClaratiOnWe have obtained an independence declaration from our auditor, Ernst & Young, and such declaration is shown on page 52.
nOn-audit serviCesThe following non-audit services were provided by the Group’s auditor, Ernst & Young. The Directors are satisfied that the provision of non-audit services is compatible with the general standard of independence for auditors imposed by the Corporations Act 2001. The nature and scope of each type of non-audit service provided means that auditor independence was not compromised.
Ernst & Young did not receive or are due to receive amounts for the provision of non-audit services:
rOundingThe amounts contained in this report and in the half-year financial report have been rounded to the nearest $1,000 (where rounding is applicable) under the option available to the group under ASIC Class Order 98/100. The group is an entity to which the Class Order applies.
remuneratiOn repOrt (audited)This Remuneration Report outlines Abacus’ remuneration arrangements for directors and executives in accordance with the requirements of the Corporations Act and Regulations. For the purposes of this report Key Management Personnel are defined as those persons having authority and responsibility for planning, directing and controlling the major activities of Abacus, directly or indirectly, including any director (whether executive or otherwise) of the parent company, and includes the executives receiving the highest remuneration.
For the purposes of this report, the term executive encompasses the Managing Director and other senior executives of Abacus.
Details of key management personnel (KMPs)
(i) Non-executive Directors J. Thame Chairman W. Bartlett Director D. Bastian Director (retired 14 November 2012) M. Irving Director M. Salkinder Director
(ii) Executive Director F. Wolf Managing Director
(iii) Executives E. Varejes Chief Operating Officer C. Aarons Head of Strategy R. Baulderstone Chief Financial Officer (appointed 30 November 2012) R. de Aboitiz Chief Financial Officer (resigned 30 November 2012) C. Laird Director Property Ventures J. L’Estrange Director Property Ventures L. Lloyd Managing Director – Abacus Property Services P. Strain Director Property
REMuNERATION AT A glANCEFixed RemunerationBase salaries paid to executives increased by an average of 5% in the year ended 30 June 2013. The average annual increase over the last two years was 2.5% (as there was no increase in the previous year).
For
per
sona
l use
onl
y

37 annual report 2013
remuneratiOn repOrt (audited) (COntinued)Variable RemunerationCurrent Variable RemunerationCurrent variable remuneration totalling $1,560,000 is payable to the executives of Abacus for the year ended 30 June 2013 as compared with $1,700,000 paid in the previous year. The details are set out in table 1. Current variable remuneration is generally payable only if the underlying profit target is met. The group target was exceeded in the current year. The amount of each award was determined by reference to the performance of the executive against key performance indicators (KPIs) and other aspects of the executive’s performance considered relevant in the context of the assessment.
Deferred Variable RemunerationIn June 2012 the rights issued under the former long term incentive plan were cancelled. The executives had received no benefits from the operation of the plan.
During the 2013 financial year the Remuneration & Nomination Committee worked with its independent remuneration consultant, Guerdon Associates, to update the deferred variable remuneration plan in order to align it more closely with Abacus’ growth objectives. The first issue of security acquisition rights (SARs) was made in May 2013 under the Security Acquisition Rights Plan (SARs Plan). A total of 701,316 SARs were issued to key management personnel under the SARs Plan. The rights will (subject to the terms of the Plan, which include claw back provisions) vest in equal tranches over a four year period.
Board oversight of remunerationRemuneration & Nomination CommitteeThe Remuneration & Nomination Committee of the Board of Directors is responsible for making recommendations to the Board on the remuneration arrangements for the non-executive directors and executives.
The Committee must comprise at least three non-executive directors with a majority of independent members. The members of the Committee during the year were:
W. Bartlett – Chairman (independent non-executive)
D. Bastian – (independent non-executive) – retired 14 November 2012
M. Irving – (independent non-executive)
J. Thame – Ex-officio member (independent non-executive)
On 10 July 2013 Ms Salkinder replaced Mr Irving as a member of the Committee.
Under its charter the Committee must meet at least two times during a year. The Committee met two times during the year and the attendance records are set out in the Directors’ Report. The Committee’s charter can be downloaded from the Corporate Governance section of the Abacus website.
The Committee assesses the appropriateness of the nature and amount of remuneration of non-executive directors and executives on a periodic basis by reference to relevant employment market conditions with the overall objective of ensuring maximum stakeholder benefit from the retention of a quality performing Board and attracting motivating and retaining a quality executive team.F
or p
erso
nal u
se o
nly

38 abacus property group
DIRECTORs’ REPORT 30 JUNE 2013CONTINUED
remuneratiOn repOrt (audited) (COntinued) Board oversight of remuneration (continued)Remuneration policyThe remuneration policy supports the achievement of the group’s overall objective of producing sustainable earnings growth and continuing growth in security value. Total remuneration levels are positioned at market median, with higher rewards justified by performance. The policy framework is designed to reward individual performance while closely aligning the interests of the executives to those of securityholders through the use of variable remuneration. To this end, Abacus embodies the following principles in its remuneration framework:• provide sufficient rewards to attract and retain skilled executives who are well qualified and experienced;• link executive rewards to Abacus’ performance;• have a reasonable portion of executive remuneration at risk while not encouraging excessive risk taking so as to protect
the defensive nature of the stock; and• establish performance hurdles for the variable components of executive remuneration that require sustainable non-volatile
earnings performance over time.
Executive remuneration consists of the following key elements:• fixed remuneration• variable remuneration
o current variable remunerationo deferred variable remuneration with a claw back feature.
The fixed remuneration component includes base salary, statutory superannuation and non-monetary benefits (car parking and the applicable fringe benefits tax). Abacus aims to ensure that the split of fixed and variable remuneration for executives is appropriate for the type of business it operates, namely, a cyclical, mature business that seeks to provide stable income earnings with a high level of distribution to securityholders. Volatile outcomes are not valued by the stock market and therefore remuneration is not highly incentive leveraged. The variable remuneration is designed to reward consistency of sustainable distributions and steady improvement to the underlying financial strength of the business. The result is a higher proportion of fixed remuneration for executives compared to other A-REITs and a lower proportion of variable remuneration. It also recognises that long term value is the outcome of a string of sustained short term outcomes. Volatile earnings and security distribution outcomes are not acceptable. For this reason, reward is contingent on annual performance, and the maintenance of that annual performance in succeeding years. The two are not considered independent, and therefore the reward structure does not allow for separate short term and long term measures. This is a deliberate remuneration strategy that differs from traditional standards and, in the board’s view, better reflects the group’s positioning in the A-REIT industry.
Security Trading policyAbacus has a security trading policy in place for directors and employees. The policy can be downloaded from the Corporate Governance section of the Abacus website. Trading in Abacus securities is only permitted within the six week periods commencing on the second trading day after the half-year and full-year results are announced and after the annual general meeting. The Chairman may approve trading windows at other times of the year. Trading is not permitted at any time if directors and employees are in receipt of confidential information.
Remuneration structureIn accordance with corporate governance best practice, the separate structure of non-executive director and executive remuneration is as follows.F
or p
erso
nal u
se o
nly

39 annual report 2013
remuneratiOn repOrt (audited) (COntinued)Board oversight of remuneration (continued) Non-executive director remuneration
ObjectiveThe Board seeks to set aggregate remuneration at a level that enables Abacus to attract, motivate and retain directors of the highest calibre, while incurring a cost that is market competitive.
StructureAbacus’ constituent documents and the ASX Listing Rules specify that the aggregate remuneration of non-executive directors must be determined from time to time by securityholders. The last determination was at the annual general meeting held on 12 November 2010 when securityholders approved an aggregate remuneration limit of $800,000 per year. This amount is a limit on non-executive directors’ total fees, not the actual fees paid to non-executive directors which are set out in Table 1. Following the review of the Board’s composition Mr David Bastian retired as a director in November 2012. This reduced the number of directors to five, the majority of whom are independent. The Board believes that it has a sufficient complement of experienced directors to manage the group.
The aggregate remuneration limit and the fee structure are reviewed annually and fees were last increased in October 2011. There was no increase in the year ended 30 June 2013.
Fees payable, inclusive of superannuation, to non-executive directors are as follows:
BOARD/COMMITTEE ROLE FEE
Board Chairman $191,000
Board Member $71,000
Audit & Risk Committee Chairman $20,000
Audit & Risk Committee Member $10,000
Compliance Committee Chairman $10,000
Due Diligence Committee Chairman $15,000
Due Diligence Committee Member $5,000
Remuneration & Nomination Committee Chairman $12,000
Remuneration & Nomination Committee Member $8,000
Abacus Storage Funds Management Limited Board Member $9,000
The payment of additional fees for serving on a Board committee or on the Board of Abacus Storage Funds Management Limited recognises the additional time commitment required by directors who serve in those capacities.
The non-executive directors do not receive retirement benefits. Nor do they participate in any incentive programs. The remuneration of non-executive directors for the years ended 30 June 2013 and 2012 is detailed in Table 1 of this report.
For
per
sona
l use
onl
y

40 abacus property group
DIRECTORs’ REPORT 30 JUNE 2013CONTINUED
remuneratiOn repOrt (audited) (COntinued)Executive remuneration
ObjectiveAbacus aims to reward executives with a level and mix of remuneration commensurate with their position and responsibilities so as to:• reward executives for group, business unit and individual performance against targets set by reference to appropriate
benchmarks;• maintain consistent performance over time;• align the interests of executives with those of securityholders; and• ensure remuneration is appropriate by market standards.
Abacus’ key gateway financial measure for variable remuneration is underlying profit, which the Board believes is the appropriate way to ensure that variable remuneration is aligned with the interests of securityholders. Abacus does not issue market guidance, but the gateway has been determined by the Board as appropriately challenging.
StructureIn determining the level and make-up of executive remuneration, the Remuneration & Nomination Committee received advice from its external consultants, Guerdon Associates. (Guerdon Associates did not make remuneration recommendations in relation to any of the KMPs.)
Executive remuneration consists of the following key elements:• fixed remuneration (base salary, superannuation and non-monetary benefits)• variable remuneration
o current variable remuneration; ando deferred variable remuneration with a claw back feature.
The Board has determined that within the context of providing median levels of total remuneration to Abacus executives, it is appropriate that:
(a) executives have a reasonable and motivating portion of their total remuneration at risk by linking it to the performance of the business and their own contributions to that performance; and
(b) executive remuneration be delivered with the proportion of fixed to potential maximum variable pay being, with exceptions for outstanding personal achievement, in the ratio of approximately 60:40 (with the variable component generally allocated as to half to current variable remuneration and half to deferred variable remuneration).
These arrangements apply only to those executives who are invited to participate in the Abacus deferred variable remuneration plan. Participation is limited to those executives whose positions have the potential to affect the medium to long term value of the group. By definition, all KMPs are eligible to participate because of their potential to influence sustained underlying profit, security value and distributions over the longer term.
Abacus has an investment strategy principally ensuring that at least 70% of its balance sheet exposure is to directly held core plus property providing a sustainable recurring income stream, with the balance focused on active real estate positions. Abacus’ investment philosophy is to provide investors with stable returns derived primarily from sound rental income and improvement of asset values results from diligent asset management of core plus assets with upside potential from active positions.
Reflecting Abacus’ investment philosophy, the variable remuneration plan design is directed to rewarding activities that are in the medium to long term interests of securityholders. The variable remuneration strategy is consequently designed to drive sustainable and growing underlying profit (determined in accordance with the AICD/Finsia principles for reporting underlying profit) that covers the distribution level implicit in the Abacus security price and incremental growth in capital value.
For
per
sona
l use
onl
y
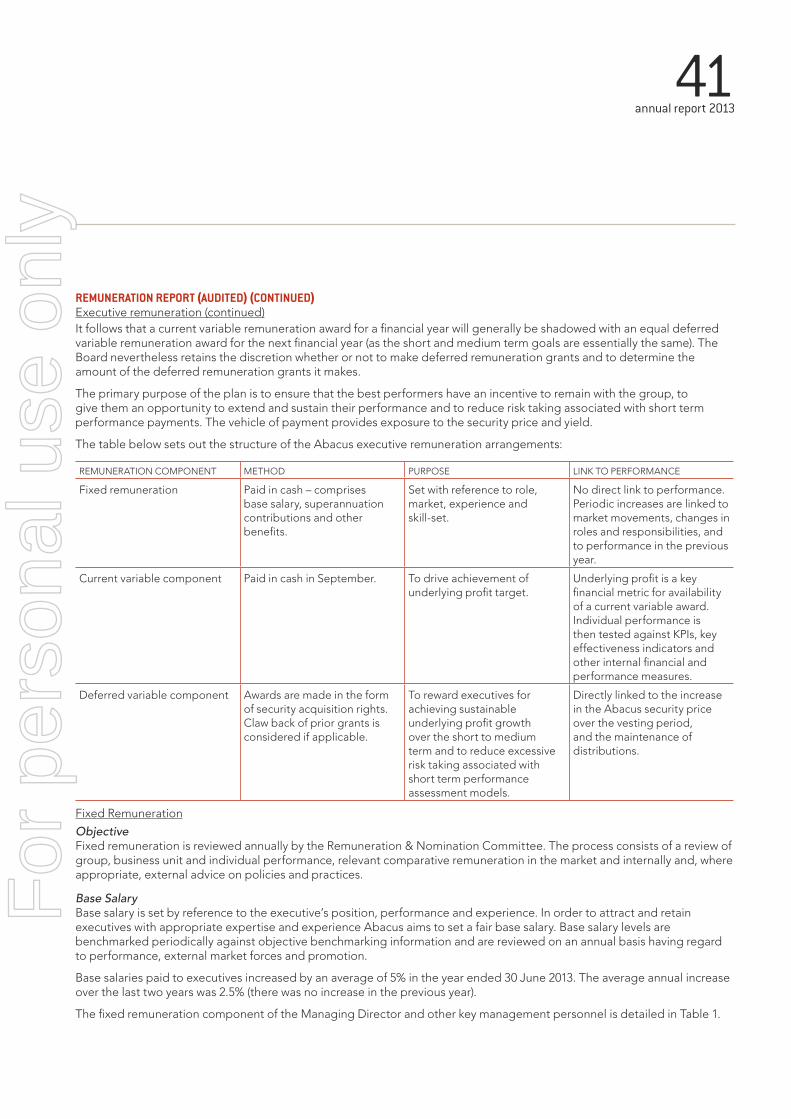
41 annual report 2013
remuneratiOn repOrt (audited) (COntinued)Executive remuneration (continued)It follows that a current variable remuneration award for a financial year will generally be shadowed with an equal deferred variable remuneration award for the next financial year (as the short and medium term goals are essentially the same). The Board nevertheless retains the discretion whether or not to make deferred remuneration grants and to determine the amount of the deferred remuneration grants it makes.
The primary purpose of the plan is to ensure that the best performers have an incentive to remain with the group, to give them an opportunity to extend and sustain their performance and to reduce risk taking associated with short term performance payments. The vehicle of payment provides exposure to the security price and yield.
The table below sets out the structure of the Abacus executive remuneration arrangements:
REMUNERATION COMPONENT METHOD PURPOSE LINK TO PERFORMANCE
Fixed remuneration Paid in cash – comprises base salary, superannuation contributions and other benefits.
Set with reference to role, market, experience and skill-set.
No direct link to performance. Periodic increases are linked to market movements, changes in roles and responsibilities, and to performance in the previous year.
Current variable component Paid in cash in September. To drive achievement of underlying profit target.
Underlying profit is a key financial metric for availability of a current variable award. Individual performance is then tested against KPIs, key effectiveness indicators and other internal financial and performance measures.
Deferred variable component Awards are made in the form of security acquisition rights. Claw back of prior grants is considered if applicable.
To reward executives for achieving sustainable underlying profit growth over the short to medium term and to reduce excessive risk taking associated with short term performance assessment models.
Directly linked to the increase in the Abacus security price over the vesting period, and the maintenance of distributions.
Fixed Remuneration
ObjectiveFixed remuneration is reviewed annually by the Remuneration & Nomination Committee. The process consists of a review of group, business unit and individual performance, relevant comparative remuneration in the market and internally and, where appropriate, external advice on policies and practices.
Base SalaryBase salary is set by reference to the executive’s position, performance and experience. In order to attract and retain executives with appropriate expertise and experience Abacus aims to set a fair base salary. Base salary levels are benchmarked periodically against objective benchmarking information and are reviewed on an annual basis having regard to performance, external market forces and promotion.
Base salaries paid to executives increased by an average of 5% in the year ended 30 June 2013. The average annual increase over the last two years was 2.5% (there was no increase in the previous year).
The fixed remuneration component of the Managing Director and other key management personnel is detailed in Table 1.
For
per
sona
l use
onl
y

42 abacus property group
DIRECTORs’ REPORT 30 JUNE 2013CONTINUED
remuneratiOn repOrt (audited) (COntinued)Managing Director’s remunerationIn determining the Managing Director’s remuneration the Board considered independent benchmarking information for the property industry as well as data from the stock market (general listed industry companies of comparable size and, within that, A-REITs of comparable size) to determine an appropriate market-competitive level of pay, his personal performance and his value to the group. The board also evaluated his performance against agreed strategic goals and other performance metrics. Abacus considers that this approach works well in achieving its performance and remuneration objectives and that the Managing director has been appropriately rewarded based on his achievement of these goals and metrics.
Variable Remuneration – current variable remuneration
ObjectiveThe objective of the current variable remuneration plan is to link the achievement of Abacus’ operational targets with the remuneration received by the executives charged with meeting those targets.
Structure The current variable remuneration plan is designed to link financial rewards with performance consistency, and steady improvement of the underlying financial strength of the business:• Current variable remuneration pool – available for current variable remuneration awards – is linked directly to the
achievement of an underlying profit target for the assessment year that meets stakeholder and market expectations.
• KPIs – the performance measures that determine individual current variable remuneration rewards represent the contributions to be made by executives to Abacus’ financial and operating performance.
Securityholders expect that the Board consider the financial performance of the business when forming decisions about whether to pay a current variable remuneration award or not, and, if so, how much will be paid. The Board has established a process to manage the assessment and payment of current variable remuneration entitlements through KPIs and key effectiveness indicators. The process is set out as follows:
* The Board has compared Abacus’ performance against several financial performance measures over annual periods to determine the strength of the relationship between the measures and security-holder value creation (measured by total security-holder return) and hence the most appropriate measure to determine entitlements to variable remuneration. Based on this analysis the Board has adopted underlying profit as the measure. Underlying profit reflects the statutory profit as adjusted in order to present a figure that reflects the Directors’ assessment of the result for the ongoing business activities of Abacus, in accordance with the AICD/Finsia principles for reporting underlying profit. The underlying profit is not audited.
Beginning OF the year
Set the plan parameters• Underlying profit target
gateway* for coming year• KPIs for each participant• Maximum current
variable remuneration payable for each participant based on remuneration ratio
• Determine maximum current variable remuneration
• pool size based on the sum of individual theoretical maximum entitlements calculated in accordance with the remuneration ratio
year-end
Measure Abacus financial performance• Is underlying profit
target gateway met or exceeded?
• If no, a payment will generally not be made (subject to Board discretion)
• If yes, gateway is passed
aFter year-end
Distribute current variable remuneration• Assess individual
performance against KPIs and other measures
• Pay current variable remuneration entitlements
For
per
sona
l use
onl
y

43 annual report 2013
remuneratiOn repOrt (audited) (COntinued)Variable Remuneration – current variable remuneration (continued)
Structure (continued)For each relevant year the Board will specify an underlying profit target that operates as a gateway that must be passed if current variable remuneration awards are to be generally payable. The Board retains the discretion, based on its view of the circumstances at the time, to adjust the current variable remuneration pool size.
If the underlying profit target is missed, the Board retains the discretion to make the current variable remuneration pool, or a reduced pool, generally available if it determines the circumstances warrant such action. If performance has been exceptionally strong the Board may increase the total pool size to provide additional current variable remuneration awards reflective of the above target performance. Where the financial gateway has not been achieved and the Board determines that no part of the current variable remuneration pool will be generally available, it retains the discretion to pay current variable remuneration awards to selected individuals to reward them for their personal above target performance. The application of any of these discretions will be disclosed.
If an executive is no longer employed at the time when Abacus pays current variable remuneration awards for any relevant year then that executive will generally not be entitled to be paid their current variable remuneration awards if the relevant executive resigned for any reason or if their employment was terminated with cause.
Key Performance IndicatorsWhen the financial gateway has been passed, and current variable remuneration awards are to be paid, it is necessary to determine how these entitlements will be quantified for participating executives.
Current variable remuneration payments made to each executive depend on the extent to which KPIs set at the beginning of the financial year are met. Account is also taken of qualitative indicators of effectiveness, performance and behaviour. They are the primary tools the Board uses as a means of determining performance against expectations in order to distribute current variable remuneration awards where the financial performance gateway specified by the Board has been achieved.
PERFORMANCE MEASURESPROPORTION OF CURRENT VARIABLE REMUNERATION AWARD MEASURE APPLIES TO
MANAGING DIRECTOR OTHER EXECUTIVES
Financial measure:• Contribution to Abacus underlying profit• Contribution to sustainability of distribution• Contributions to projects expected to grow security value
60% 20-40% (dependent on role)
Non-financial measures:• Quality of analysis and recommendations• Reporting and financial requirements• Tax and compliance requirements• Transaction and project management• Key growth activities• Risk management• Leadership, staff management, teambuilding and succession• Other performance measures focuses on achieving business imperatives
40% 60-80%
These measures were chosen as they represent the key drivers for the short-term success of the business and provide a framework for long term securityholder value.
The Board is mindful of the competing needs for Abacus to:• maintain a robust framework by which performance expectations are set and measured; and • retain its flexibility to reward exceptional achievement.
For
per
sona
l use
onl
y

44 abacus property group
DIRECTORs’ REPORT 30 JUNE 2013CONTINUED
remuneratiOn repOrt (audited) (COntinued)Key Performance Indicators (continued)The Board has the discretion to consider each executive’s total contribution to the group in addition to the specific KPIs selected for the relevant year.
The target levels of performance set by the Board are challenging, and payment of 100% of the current variable remuneration award opportunity to an executive requires superior performance.
The payment of current variable remuneration awards to executives is subject to a recommendation by the Remuneration and Nomination Committee to, and approval of, the Board. The Committee considers the performance of the executive against the KPIs and other applicable measures and approves the amount, if any, of the current variable remuneration to be paid. For the 2013 financial year current variable remuneration awards of $1,560,000 have been accrued and will be paid in September 2013.
For the 2012 financial year, 100% of the current variable remuneration awards of $1,700,000 accrued in that year vested and were paid to executives in the 2013 financial year. There were no forfeitures.
Performance and its link to variable remuneration of the Managing DirectorThe financial measures driving variable remuneration outcomes are underlying profit and sustainable distributions. In addition Abacus has a number of non-financial measures that it uses to determine variable remuneration.
The following table sets out performance of the Managing Director against these targets:
PERFORMANCE MEASURE FY13 PERFORMANCE AGAINST TARGETS
FinancialUnderlying profit Above target
Sustainable distribution At target
Non-financial Strategic planning Above target
Reporting and financial requirements At target
Key growth activities Above target
Risk management At target
Leadership, team building Above target
Variable Remuneration – deferred variable remunerationThe KMPs and other selected executives were invited by the Board to participate in the deferred variable remuneration plan which rewards sustainability of distributions each year over a four year period.
ObjectiveThe objective of the deferred variable remuneration plan is to reward executives for sustaining underlying profit that covers the distribution level implicit in the Abacus security price.
Deferred Security Acquisition Rights Plan The deferred variable remuneration plan has been designed to align the interests of executives with those of securityholders by providing for a significant portion of the remuneration of participating executives to be linked to the delivery of sustainable underlying profit that covers the distribution level implicit in the Abacus security price.
The deferred security acquisition rights plan (SARs Plan) is a deferred variable remuneration plan under which deferred variable remuneration awards in the form of security acquisition right (SAR’s) may be awarded in accordance with the remuneration ratio. Key executives may be allocated a deferred variable remuneration award value in any financial year generally equal to the last current variable remuneration award paid. Allocations in a financial year are based on the performance assessment completed in determining current variable remuneration awards for the prior financial year, adjusted to take into account other factors that the Board considers specifically relevant to the purpose of providing deferred variable remuneration awards. Adjustments may be needed, for example, to take into account an award of a current variable remuneration award above the theoretical maximum, the potential of an executive, or their impending retirement.
For
per
sona
l use
onl
y

45 annual report 2013
remuneratiOn repOrt (audited) (COntinued)Deferred Security Acquisition Rights Plan (continued)The Board has the discretion to award SARs in excess of the cap in the case of exceptional performance.
The deferred variable remuneration grant value allocated to a plan participant for a financial year will be divided by the 10 day volume weighted average price (VWAP) of Abacus Property Group securities (ABP securities) for the period commencing on the second trading day after the full year results announcement for the previous financial year was released to the market (the business day after that 10 day period ends is the allocation date). The quotient will be the number of SARs to be allocated to the relevant executive for that financial year.
The SARs allocated to an executive for a financial year will vest in four equal annual tranches on the first, second, third and fourth anniversaries of the allocation date.
To receive the deferred remuneration award the executive must remain employed by Abacus, unless they are considered a “good leaver” (that is, through death, disability, or genuine retirement, or some other circumstance considered acceptable or the board in its discretion). All other leavers are considered a “bad leavers” for the purposes of the SARs Plan.
As well the Board will have the discretion, if the amount of distributions per ABP security falls by more than a percentage determined by the Board for each respective SARs issue, to claw back any unvested tranches. For example, if the Board determines at the time of a new allocation of SARs that a sustainable annual distribution rate for the whole vesting period for that allocation of SARs is 16.5 cents per security then the Board may decide that if that rate falls by more than 5% in respect of any financial year before all of the tranches of SARs in that allocation have vested, the Board may claw back the unvested SARs that formed part of that allocation. The allocation of SARs for the following year may have a higher distribution rate and negative variance buffer set, and so on for succeeding years.
If an executive is not a bad leaver but the Board determines that the executive is responsible for misconduct resulting in material non-compliance with financial reporting requirements or for excessive risk taking, the executive will forfeit all unvested SARs entitlements.
When a tranche of SARs vests the SARs in that tranche will convert into ABP securities on a one for one basis or (exceptionally, subject to the discretion of the Board where an executive already has a significant holding of ABP securities) a cash amount equal to the product derived by multiplying the number of SARs in that tranche by the VWAP of ABP securities over the first 10 trading days after the date the relevant tranche vests.
To achieve a closer alignment of the interests of securityholders and senior executives, when a tranche of SARs vests, the holder will also be paid in respect of each SAR vesting an amount (a notional distribution) equivalent to the aggregate of the distributions per ABP security paid during the period from allocation date of the relevant tranche to the vesting date for the relevant tranche plus the amount of any distribution per security declared and unpaid as at the vesting date . This entitlement will be satisfied in ABP securities . In that event the number of additional securities will be calculated by dividing the amount of the notional distribution by the VWAP of ABP securities over the first 10 trading days after the date the relevant tranche vests.
Executives will be entitled before any trance of SARs vests, to extend the vesting date for that tranche by 12 months. This right may be exercised at any time and from time to time in respect of any unvested tranche while the executive’s employment continues.
1 If the entitlements on a vesting of SARs is satisfied in ABP securities that are cum distribution then the amount of that unpaid distribution will not be included in the notional distribution.
2 Subject to the Board’s discretion to satisfy this in cash.
For
per
sona
l use
onl
y

46 abacus property group
DIRECTORs’ REPORT 30 JUNE 2013CONTINUED
remuneratiOn repOrt (audited) (COntinued)Deferred Security Acquisition Rights Plan (continued) The grant and vesting levels of SARs for key management personnel during the 2013 financial year were as follows:
Allocation of SARs to key management personnel
GRANT DATE NUMBER FAIR VALUE PER RIGHT
FAIR VALUE RECOGNISED
IN FY13 ON UNVESTED
RIGHTS
THE FOLLOWING RIGHTS WILL VEST IN THE PERIODS INDICATED SUBJECT TO PERFORMANCE AND
POTENTIAL CLAW BACK
FY14 FY15 FY16 FY17
Director
F Wolf 15/05/2013 212,420 $2.41 $266,632 53,105 53,105 53,105 53,105
Executives
E Varejes 15/05/2013 84,968 $2.41 $106,653 21,242 21,242 21,242 21,242
C Aarons 15/05/2013 65,360 $2.41 $82,040 16,340 16,340 16,340 16,340
R Baulderstone 15/05/2013 65,360 $2.41 $82,040 16,340 16,340 16,340 16,340
J L'Estrange 15/05/2013 74,920 $2.41 $94,040 18,730 18,730 18,730 18,730
C Laird 15/05/2013 71,652 $2.41 $89,938 17,913 17,913 17,913 17,913
L Lloyd 15/05/2013 61,276 $2.41 $76,914 15,319 15,319 15,319 15,319
P Strain 15/05/2013 65,360 $2.41 $82,040 16,340 16,340 16,340 16,340
701,316 $880,297 175,329 175,329 175,329 175,329
The expense recognised for security based payments (Note 29) includes SARs issued to other executives in the Group. There was no grant of rights in the previous period.
For the purpose of determining remuneration Abacus subscribes to an independent property salary and remuneration survey recommended to it by EY and Abacus performs a review of the published remuneration of the members of the S&P ASX 200 Index and the S&P/ASX 300 A-REIT Index.
Tax advice on the deferred variable remuneration plan was provided by Minter Ellison.
For
per
sona
l use
onl
y

47 annual report 2013
remuneratiOn repOrt (audited) (COntinued)Link between remuneration policy and Abacus’ performanceAbacus’ performance is compared with its peers in the S&P/ASX 300 A-REIT index. This peer group reflects Abacus’ competitors for capital transactions and talent. As previously discussed, KMPs and other selected executives are eligible to receive current variable remuneration and a deferred variable remuneration. Both are risk-related components of total remuneration as payment entitlements are dependent on performance. The group’s objective is for remuneration policy to encourage business strategy and implementation that achieves growth in total securityholder returns and favourable peer comparison.
The variable remuneration strategy is designed to drive sustainable and growing underlying profit that covers the distribution level implicit in the Abacus security price.
Abacus’ performance in comparison with the S&P/ASX 300 A-REIT index is set out in the following graph:
Abacus’ performance for the past five years is as follows:
2009 2010 2011* 2012 2013
Underlying earnings per security (cents) 8.30 3.90 19.38 19.17 18.76
Distributions paid and proposed (cents) 7.75 3.15 16.50 16.50 16.50
Closing security price (30 June) $0.37 $0.41 $2.31 $2.04 $2.27
Net tangible assets per security** $0.62 $0.58 $2.51 $2.34 $2.32
Weighted average securities on issue 867.5m 1,662.5m 372.3m 400.9m 446.4m
* Abacus securities were consolidated on a 5:1 basis on 29 November 2010.** Net tangible assets per security includes the impact of the fair value movements.
ABPS&P/ASX 300 Accumulation
APG AND S&P/ASX 300 A-REIT ACCUMULATION INDEX TOTAL RETURN(Since 1 July 2008)
-80
-60
-40
-20
0
20
40
60
80
100
For
per
sona
l use
onl
y

48 abacus property group
DIRECTORs’ REPORT 30 JUNE 2013CONTINUED
remuneratiOn repOrt (audited) (COntinued)Employment contractsManaging DirectorThe Managing Director, Dr Wolf, is employed under a rolling contract. The current employment contract commenced on 10 October 2002. Under the terms of the contract:• Dr Wolf receives a base salary that is reviewed annually;• he is eligible to participate in the deferred variable income plans that are made available and to receive current variable
remuneration payments;• Dr Wolf may resign from his position and thus terminate this contract by giving 6 months written notice; and • Abacus may terminate this employment agreement by providing 12 months written notice or providing payment in lieu of
notice (based on the fixed component of Dr Wolf’s remuneration).
Other ExecutivesThe other executives are employed on an ongoing basis under letter agreements until (generally) one month’s notice is given by either party. Abacus may terminate an executive’s service at any time without notice if serious misconduct has occurred. Where termination with cause occurs the executive is only entitled to remuneration up to the date of termination. Deferred variable remuneration allocations vest according to the SARs plan rules.
For
per
sona
l use
onl
y

49 annual report 2013
taBl
e 1:
rem
uner
atiO
n OF
key
man
agem
ent
pers
Onne
l
2013
SHO
RT-
TER
M B
ENEF
ITS
POST
EM
PLO
YM
ENT
LON
G-T
ERM
B
ENEF
ITS
SEC
UR
ITY-
BA
SED
PA
YM
ENT
TOTA
LPE
RFO
RM
AN
CE
R
ELA
TED
SA
RS
REL
ATE
D
SALA
RY
&
FEE
S
CU
RR
ENT
VAR
IAB
LE
INC
ENTI
VE
NO
N-
MO
NE
TAR
Y B
ENEF
ITS
TOTA
L C
ASH
PA
YM
ENTS
A
ND
SH
OR
T TE
RM
B
ENEF
ITS
SUPE
RA
NN
UA
TIO
NLE
AVE
ON
TE
RMIN
ATI
ON
LON
G
SER
VIC
E LE
AV
E*
SEC
URI
TY
AC
QU
ISIT
ION
R I
GH
TS ( S
ARS
)*
$$
$$
$$
$$
$%
%
Non-
exec
utive
dire
ctor
sJ
Tham
e –
Cha
irm
an 1
83,5
30
–
– 18
3,53
0 1
6,47
0 –
–
–
2
00,0
00
–
–
W B
artle
tt 9
3,57
8 –
–
93,
578
8,4
22
–
–
–
102,
000
–
–
D B
astia
n (re
tired
14
Nov
emb
er 2
012)
17,
999
–
–
17,99
9 2
0,75
1 –
–
–
3
8,75
0 –
–
M Ir
ving
133
,000
–
–
133,
000
–
–
–
–
133,
000
–
–
M S
alki
nder
8
7,15
6 –
– 8
7,156
7
,844
–
–
–
9
5,00
0 –
–
Sub-
tota
l non
-exe
cutiv
e di
rect
ors
515,
263
– –
515,
263
53,
487
– –
– 5
68,75
0
Exec
utive
Dire
ctor
sF
Wo
lf –
Man
agin
g D
irect
or
1,2
75,0
00
625
,000
5
,135
1,
905,1
35
25,
000
–
38,
023
266
,632
2
,234
,790
4012
Oth
er ke
y man
agem
ent p
erso
nnel
E Va
reje
s –
Chi
ef O
per
atin
g O
ffice
r 4
95,0
00
150
,000
5
,135
6
50,13
5 2
5,00
0 –
1
0,49
9 1
06,6
53
792
,287
32
13
C A
aro
ns –
Hea
d o
f Str
ateg
y# 3
75,0
00
100
,000
5
,135
4
80,13
5 2
5,00
0 –
3
4,37
1 8
2,04
0 6
21,5
46
2913
R d
e A
bo
itiz
– C
hief
Fin
anci
al O
ffice
r^ 1
97,3
04
– –
19
7,304
6
,863
2
1,24
7 2
,609
–
2
28,0
23
–
–
R B
auld
erst
one
– C
hief
Fin
anci
al O
ffice
r^ 2
30,4
17
150
,000
–
3
80,41
7 1
4,58
3 –
3
,226
8
2,04
0 4
80,2
66
4817
C L
aird
– D
irect
or P
rop
erty
Ven
ture
s 4
22,0
30
175
,000
2
,568
59
9,598
1
6,47
0 –
3
8,09
1 8
9,93
8 74
4,09
7 36
12
J L'
Est
rang
e –
Dire
cto
r Pro
per
ty V
entu
res
433
,500
1
10,0
00
5,1
35
548
,635
2
5,00
0 –
6
,774
9
4,04
0 67
4,44
9 30
14
L Ll
oyd
– M
anag
ing
Dire
ctor
, Pro
per
ty S
ervi
ces
375
,000
1
00,0
00
–
475,
000
25,
000
–
6,2
62
76,
914
583
,176
3013
P St
rain
– D
irect
or P
rop
erty
412
,750
1
50,0
00
5,1
35
567
,885
2
5,00
0 –
9
,031
8
2,04
0 6
83,95
6 34
12
Sub-
tota
l exe
cutiv
e KM
P 4,
216,
001
1,56
0,00
0 2
8,24
3 5
,804
,244
18
7,916
2
1,247
14
8,88
6 8
80,2
97
7,04
2,59
0 To
tal
4,73
1,264
1,5
60,0
00
28,
243
6,3
19,5
07
241
,403
2
1,247
14
8,88
6 8
80,2
97
7,61
1,340
#
Ms
Aar
ons
was
ap
po
inte
d to
the
Exe
cuti
ve C
om
mit
tee
on
1 Ju
ly 2
012.
^ M
r de
Ab
oit
iz re
sig
ned
and
Mr B
auld
erst
one
was
ap
po
inte
d in
No
vem
ber
201
2.
*
Acc
rued
no
t pre
sent
ly e
ntit
led
For
per
sona
l use
onl
y

50 abacus property group
DIRE
CTOR
S’ R
EPOR
T 30
JuNE
201
3 CO
NTIN
uED
taBl
e 1:
rem
uner
atiO
n OF
key
man
agem
ent
pers
Onne
l (C
Onti
nued
)
2012
SHO
RT-
TER
M B
ENEF
ITS
POST
EM
PLO
YM
ENT
LON
G-T
ERM
B
ENEF
ITS
SEC
UR
ITY-
BA
SED
PA
YM
ENT
TOTA
LPE
RFO
RM
AN
CE
R
ELA
TED
SALA
RY
&
FEE
SC
ASH
B
ON
US
NO
N-
MO
NE
TAR
Y B
ENEF
ITS
T OTA
L C
ASH
P A
YM
ENTS
A
ND
SH
OR
T TE
RM
B
ENEF
ITS
SUPE
RA
NN
UA
TIO
NRE
TIRE
MEN
T B
ENEF
ITS
LON
G
SER
VIC
E LE
AV
E*
APP
REC
IATI
ON
RI
GH
TS
$$
$$
$$
$$
$%
Non-
exec
utive
dire
ctor
sJ
Tham
e –
Cha
irm
an 1
82,2
25
–
–
182,
225
15,
775
–
–
–
198,
000
–
W B
artle
tt 9
0,13
8 –
–
9
0,138
8
,112
–
–
–
9
8,25
0 –
D B
astia
n 4
2,25
0 –
–
4
2,25
0 5
0,00
0 –
–
–
9
2,25
0 –
M Ir
ving
126
,750
–
–
12
6,75
0 –
–
–
–
12
6,75
0 –
M S
alki
nder
8
6,00
9 –
–
8
6,00
9 7
,741
–
–
–
9
3,75
0 –
Sub-
tota
l non
-exe
cutiv
e di
rect
ors
527
,372
–
– 5
27,3
72
81,6
28
– –
– 6
09,0
00
_
Exec
utive
Dire
ctor
sF
Wo
lf –
Man
agin
g D
irect
or
1,1
50,0
00
750
,000
5
,150
1,
905,1
50
50,
000
–
19,
683
–
1,97
4,83
3 38
Oth
er ke
y man
agem
ent p
erso
nnel
E Va
reje
s –
Chi
ef O
per
atin
g O
ffice
r 4
59,2
23
175
,000
5
,150
6
39,3
73
40,
777
–
8,0
12
–
688
,162
25
R d
e A
bo
itiz
– C
hief
Fin
anci
al O
ffice
r 4
74,2
25
150
,000
–
6
24,2
25
15,
775
–
47,
087
–
687
,087
22
C L
aird
– D
irect
or P
rop
erty
Ven
ture
s 4
09,2
25
150
,000
2
,997
5
62,2
22
15,
775
–
–
–
577
,997
26
J L'
Est
rang
e –
Dire
cto
r Pro
per
ty V
entu
res
411
,225
2
00,0
00
5,1
50
616,
375
33,
775
–
6,4
75
–
656
,625
30
L Ll
oyd
– M
anag
ing
Dire
ctor
, Pro
per
ty S
ervi
ces
350
,000
1
25,0
00
–
475,
000
50,
000
–
6,3
35
–
531
,335
24
P St
rain
– D
irect
or P
rop
erty
375
,000
1
50,0
00
5,1
50
530
,150
50,
000
–
6,7
14
–
586
,864
26
Sub-
tota
l exe
cutiv
e KM
P3,
628,
898
1,70
0,00
0 2
3,59
7 5
,352
,495
2
56,10
2 –
94,3
06
– 5
,702,9
03
Tota
l 4
,156,
270
1,70
0,00
0 2
3,59
7 5
,879
,867
3
37,73
0 –
94,3
06
– 6
,311
,903
* A
ccru
ed b
ut n
ot p
rese
ntly
ent
itle
d
For
per
sona
l use
onl
y

51 annual report 2013
Signed in accordance with a resolution of the directors. Abacus Group Holdings Limited (ABN 31 080 604 619)
John Thame Frank Wolf Chairman Managing DirectorSydney, 28 August 2013
For
per
sona
l use
onl
y

52 abacus property group
DIRECTORs’ REPORT 30 JUNE 2013CONTINUED
For
per
sona
l use
onl
y

53 annual report 2013
FINANCIAL STATEMENTS30 JuNE 2013
DIRECTORYAbacus Group Holdings Limited ABN: 31 080 604 619
Abacus Group Projects Limited ABN: 11 104 066 104
Abacus Storage Operations Limited ABN: 37 112 457 075
Abacus Funds Management Limited ABN: 66 007 415 590
Abacus Storage Funds Management Limited ABN: 41 109 324 834
Registered Office Level 34, Australia Square 264-278 George Street SYDNEY NSW 2000 Tel: (02) 9253 8600 Fax: (02) 9253 8616 Website: www.abacusproperty.com.au
Custodian Perpetual Trustee Company Limited Level 12 Angel Place 123 Pitt Street SYDNEY NSW 2000
Directors of Responsible Entities and Abacus Group Holdings Limited John Thame, Chairman Frank Wolf, Managing Director William Bartlett Malcolm Irving Myra Salkinder
Company Secretary Ellis Varejes
Auditor (Financial and Compliance Plan) Ernst & Young Ernst & Young Centre 680 George Street SYDNEY NSW 2000
Share Registry Boardroom Pty Ltd Level 7, 207 Kent St SYDNEY NSW 2000 Tel: 1300 737 760 Fax: 1300 653 459
It is recommended that this Annual Financial Report should be read in conjunction with the Annual Financial Report of Abacus Trust, Abacus Group Projects Limited, Abacus Income Trust, Abacus Storage Property Trust and Abacus Storage Operations Limited as at 30 June 2013. It is also recommended that the report be considered together with any public announcements made by the Abacus Property Group in accordance with its continuous disclosure obligations arising under the Corporations Act 2001.
For
per
sona
l use
onl
y

54 abacus property group
CONSOLIDATED INCOME STATEMENTYEAR ENDED 30 JuNE 2013
NOTES2013
$’0002012
$’000
REVENUERental income 95,010 101,506
Storage income 45,249 47,093
Hotel income 55,184 52,011
Finance income 6(a) 21,721 28,997
Funds management income 6(b) 7,509 6,509
Sale of inventory 56,347 –
Total Revenue 281,020 236,116 Net change in fair value of investment properties derecognised 1,973 9,456
Net change in fair value of investments and financial instruments derecognised 6,854 (132)
Net change in fair value of investment properties and property, plant & equipment held at balance date 497 (2,235)Net change in fair value of investments held at balance date 6(c) 5,409 (1,244)
Share of profit / (loss) from equity accounted investments 17(b) 10,164 7,379
Other – 686
Total Revenue and Other Income 305,917 250,026
Property expenses and outgoings (17,806) (18,123)
Storage expenses (15,981) (16,410)
Hotel expenses (38,928) (40,010)
Depreciation, amortisation and impairment expense 7(a) (6,999) (7,800)
Cost of inventory sales 7(b) (48,176) –
Net change in fair value of derivatives (1,153) (54,315)
Loss on consolidation 27 (18,943) –
Finance costs 7(c) (56,244) (73,043)
Impairment charges – related parties – (3,507)
Administrative and other expenses 7(d) (27,368) (26,318)PROFIT BEFORE TAX 74,319 10,500
Income tax expense 8(a) (6,839) (2,474)NET PROFIT AFTER TAX 67,480 8,026
PROFIT ATTRIBUTABLE TO:Equity holders of the parent entity (AGHL) 3,691 450
Equity holders of other stapled entities
AT members 32,074 6,507
AGPL members 5,391 208
AIT members 6,751 1,964
ASPT members (12,820) (11,071)
ASOL members 25,965 10,412
Stapled security holders 61,052 8,470 Net profit / (loss) attributable to external non-controlling interests 6,428 (444)
NET PROFIT 67,480 8,026
Basic and diluted earnings per stapled security (cents) 10 13.68 2.11
For
per
sona
l use
onl
y

55 annual report 2013
CONSOLIDATED STATEMENT OF OTHER COMPREHENSIVE INCOMEYEAR ENDED 30 JuNE 2013
2013 $’000
2012 $’000
NET PROFIT AFTER TAX 67,480 8,026
OTHER COMPREHENSIVE INCOMEItems that will not be reclassified subsequently to the income statement
Revaluation of assets, net of tax (6,062) 3,957
Items that may be reclassified subsequently to the income statement
Foreign exchange translation adjustments, net of tax 1,737 3,782
TOTAL COMPREHENSIVE INCOME FOR THE YEAR 63,155 15,765
Total comprehensive income attributable to:Members of the APG Group 62,099 9,808
External non-controlling interests 1,056 5,957
TOTAL COMPREHENSIVE INCOME FOR THE YEAR 63,155 15,765
Total comprehensive income / (loss) attributable to members of the Group analysed by amounts attributable to:AGHL members 3,288 1,788
AT members 32,074 6,507
AGPL members 5,469 208
AIT members 6,751 1,964
ASPT members (11,517) (11,071)
ASOL members 26,034 10,412
TOTAL COMPREHENSIVE INCOME AFTER TAX ATTRIBUTABLE TO MEMBERS OF THE GROUP 62,099 9,808
For
per
sona
l use
onl
y

56 abacus property group
CONSOLIDATED STATEMENT OF FINANCIAL POSITIONYEAR ENDED 30 JuNE 2013
NOTES2013
$’0002012
$’000
CURRENT ASSETSCash and cash equivalents 11 44,822 54,129
Trade and other receivables 12(a) 19,560 11,918
Investment properties held for sale 16 175,710 190,821
Inventory 15(a) 72,992 26,479
Property loans 13(a) 2,452 19,098
Other financial assets 13(b) – 8,053
Other 3,636 3,004 TOTAL CURRENT ASSETS 319,172 313,502
NON-CURRENT ASSETSTrade and other receivables 12(b) 6,897 6,212
Investment properties 16 1,221,395 1,181,203
Inventory 15(b) 91,942 100,974
Property loans 13(c) 138,370 154,758
Other financial assets 13(d) 28,282 24,489
Property, plant and equipment 14 152,100 154,065
Equity accounted investments 17 124,458 121,833
Deferred tax assets 8(c) 11,923 16,320
Intangible assets and goodwill 18 33,261 33,461 TOTAL NON-CURRENT ASSETS 1,808,628 1,793,315
TOTAL ASSETS 2,127,800 2,106,817
CURRENT LIABILITIESTrade and other payables 19(a) 63,313 30,426
Interest-bearing loans and borrowings 20 164,318 29,950
Derivatives at fair value 1,263 -
Income tax payable 876 636
Other financial liabilities 30 11,000 –
Other 6,112 4,516 TOTAL CURRENT LIABILITIES 246,882 65,528
NON-CURRENT LIABILITIESTrade and other payables 19(b) – 12,725
Interest-bearing loans and borrowings 20 639,290 772,260
Derivatives at fair value 55,942 79,752
Deferred tax liabilities 8(c) 10,312 10,183
Other financial liabilities 30 45,250 56,250
Other 2,304 2,227 TOTAL NON-CURRENT LIABILITIES 753,098 933,397
TOTAL LIABILITIES 999,980 998,925
NET ASSETS 1,127,820 1,107,892
TOTAL EQUITY 1,127,820 1,107,892
For
per
sona
l use
onl
y
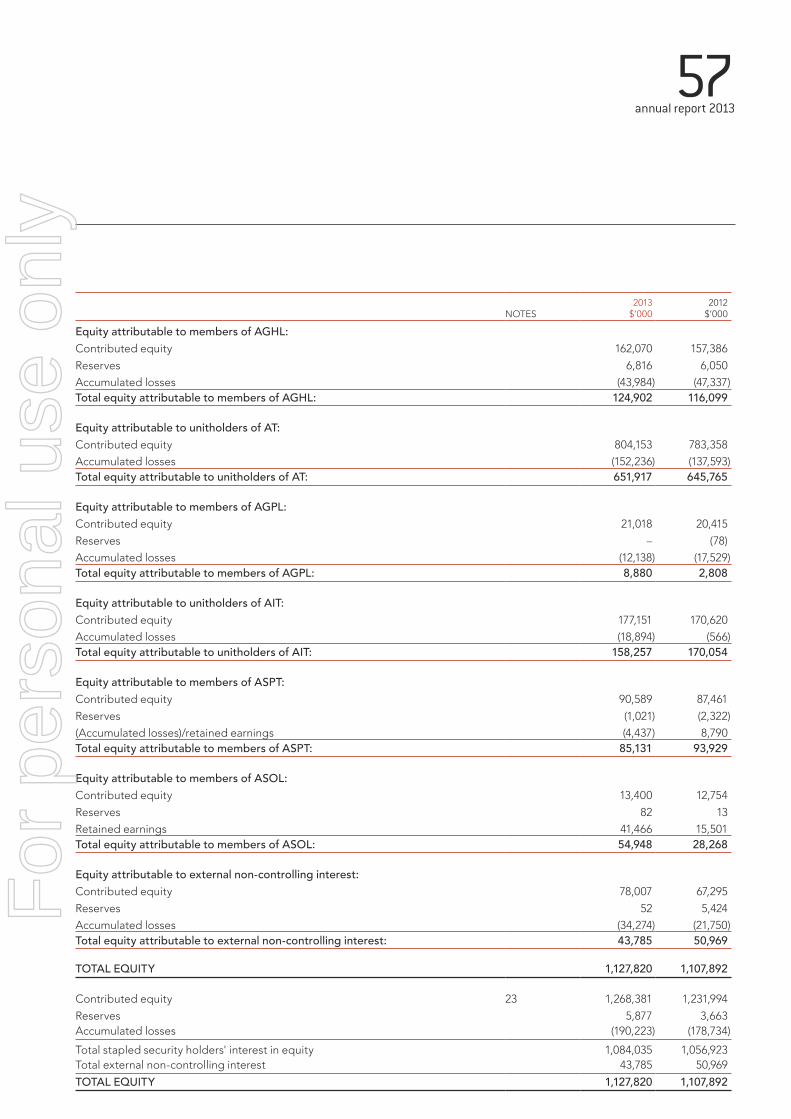
57 annual report 2013
NOTES2013
$’0002012
$’000
Equity attributable to members of AGHL:Contributed equity 162,070 157,386
Reserves 6,816 6,050
Accumulated losses (43,984) (47,337)Total equity attributable to members of AGHL: 124,902 116,099
Equity attributable to unitholders of AT:Contributed equity 804,153 783,358
Accumulated losses (152,236) (137,593)Total equity attributable to unitholders of AT: 651,917 645,765
Equity attributable to members of AGPL:Contributed equity 21,018 20,415
Reserves – (78)
Accumulated losses (12,138) (17,529)Total equity attributable to members of AGPL: 8,880 2,808
Equity attributable to unitholders of AIT:Contributed equity 177,151 170,620
Accumulated losses (18,894) (566)Total equity attributable to unitholders of AIT: 158,257 170,054
Equity attributable to members of ASPT:Contributed equity 90,589 87,461
Reserves (1,021) (2,322)
(Accumulated losses)/retained earnings (4,437) 8,790 Total equity attributable to members of ASPT: 85,131 93,929
Equity attributable to members of ASOL:Contributed equity 13,400 12,754
Reserves 82 13
Retained earnings 41,466 15,501 Total equity attributable to members of ASOL: 54,948 28,268
Equity attributable to external non-controlling interest:Contributed equity 78,007 67,295
Reserves 52 5,424
Accumulated losses (34,274) (21,750)Total equity attributable to external non-controlling interest: 43,785 50,969
TOTAL EQUITY 1,127,820 1,107,892
Contributed equity 23 1,268,381 1,231,994
Reserves 5,877 3,663 Accumulated losses (190,223) (178,734)
Total stapled security holders' interest in equity 1,084,035 1,056,923 Total external non-controlling interest 43,785 50,969
TOTAL EQUITY 1,127,820 1,107,892
For
per
sona
l use
onl
y

58 abacus property group
CONSOLIDATED STATEMENT OF CHANGES IN EQuITYYEAR ENDED 30 JuNE 2013
ATTRIBuTABLE TO THE STAPLED SECuRITy HOLDER EXTERNAL
CONSOLIDATED
ISSuED CAPITAL
$’000
ASSET REVALuATION
RESERVE $’000
FOREIGN CuRRENCy
TRANSLATION $’000
EMPLOyEE EquITy
BENEFITS $’000
RETAINED EARNINGS
$’000
NON- CONTROLLING
INTEREST $’000
TOTAL EquITy
$’000
At 1 July 2012 1,231,994 612 (2,397) 5,448 (178,734) 50,969 1,107,892
Other comprehensive income – (573) 1,619 – – (5,371) (4,325)
Net income for the year – – – – 61,052 6,428 67,480
Total comprehensive income for the year – (573) 1,619 – 61,052 1,057 63,155 Distribution reinvestment plan 36,387 – – – – – 36,387
Security acquisition rights – – – 1,168 – – 1,168
Distribution to security holders – – – – (72,541) (8,241) (80,782)
At 30 June 2013 1,268,381 39 (778) 6,616 (190,223) 43,785 1,127,820
CONSOLIDATED
ISSuED CAPITAL
$’000
ASSET REVALuATION
RESERVE $’000
FOREIGN CuRRENCy
TRANSLATION $’000
EMPLOyEE EquITy
BENEFITS $’000
RETAINED EARNINGS
$’000
NON- CONTROLLING
INTEREST $’000
TOTAL EquITy
$’000
At 1 July 2011 1,139,824 1,021 (4,142) 5,448 (148,411) 146,670 1,140,410
Other comprehensive income – (409) 1,745 – – 6,403 7,739
Net income for the year – – – – 8,470 (444) 8,026
Total comprehensive income for the year – (409) 1,745 – 8,470 5,959 15,765 Equity raisings^ 56,528 – – – – – 56,528
Return of capital^ (61,873) – – – – – (61,873)
Distribution reinvestment plan 36,189 – – – – – 36,189
Issue costs (2,168) – – – – – (2,168)
Acq. of non-controlling interest – – – – – (1,754) (1,754)
Merger of ASOL / ASPT 63,494 – – – 24,387 (87,881) –
Distribution to security holders – – – – (63,180) (12,025) (75,205)
At 30 June 2012 1,231,994 612 (2,397) 5,448 (178,734) 50,969 1,107,892 ^ Capital was returned to securityholders that was applied to the issue of securities as part of the merger between the ABP Group and ASF.
For
per
sona
l use
onl
y
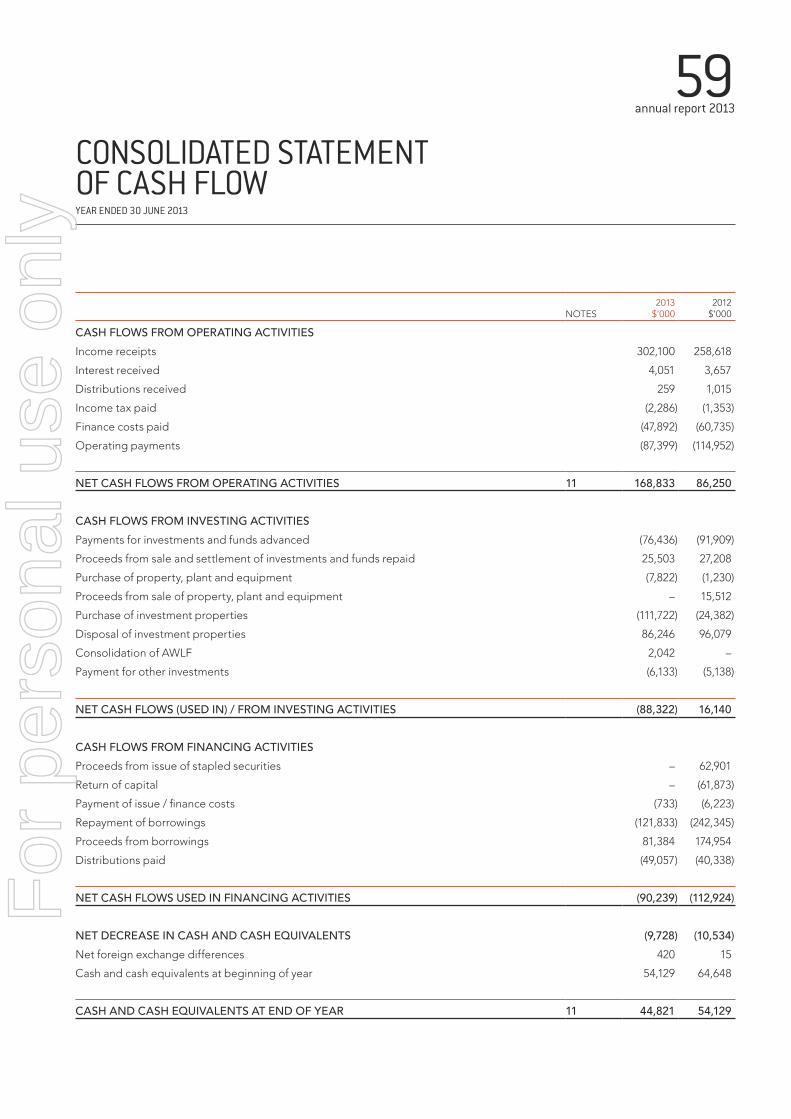
59 annual report 2013
CONSOLIDATED STATEMENT OF CASH FLOWYEAR ENDED 30 JuNE 2013
NOTES2013
$’0002012
$’000
CASH FLOWS FROM OPERATING ACTIVITIESIncome receipts 302,100 258,618
Interest received 4,051 3,657
Distributions received 259 1,015
Income tax paid (2,286) (1,353)
Finance costs paid (47,892) (60,735)
Operating payments (87,399) (114,952)
NET CASH FLOWS FROM OPERATING ACTIVITIES 11 168,833 86,250
CASH FLOWS FROM INVESTING ACTIVITIESPayments for investments and funds advanced (76,436) (91,909)
Proceeds from sale and settlement of investments and funds repaid 25,503 27,208
Purchase of property, plant and equipment (7,822) (1,230)
Proceeds from sale of property, plant and equipment – 15,512
Purchase of investment properties (111,722) (24,382)
Disposal of investment properties 86,246 96,079
Consolidation of AWLF 2,042 –
Payment for other investments (6,133) (5,138)
NET CASH FLOWS (USED IN) / FROM INVESTING ACTIVITIES (88,322) 16,140
CASH FLOWS FROM FINANCING ACTIVITIESProceeds from issue of stapled securities – 62,901
Return of capital – (61,873)
Payment of issue / finance costs (733) (6,223)
Repayment of borrowings (121,833) (242,345)
Proceeds from borrowings 81,384 174,954
Distributions paid (49,057) (40,338)
NET CASH FLOWS USED IN FINANCING ACTIVITIES (90,239) (112,924)
NET DECREASE IN CASH AND CASH EQUIVALENTS (9,728) (10,534)Net foreign exchange differences 420 15
Cash and cash equivalents at beginning of year 54,129 64,648
CASH AND CASH EQUIVALENTS AT END OF YEAR 11 44,821 54,129
For
per
sona
l use
onl
y

60 abacus property group
1. CORPORATE INFORMATIONAbacus Property Group (“APG” or the “Group”) is comprised of Abacus Group Holdings Limited (“AGHL”) (the nominated parent entity), Abacus Trust (“AT”), Abacus Group Projects Limited (“AGPL”), Abacus Income Trust (“AIT”), Abacus Storage Property Trust (“ASPT”) and Abacus Storage Operations Limited (“ASOL”). Shares in AGHL, AGPL and ASOL and units in AT, AIT and ASPT have been stapled together so that neither can be dealt with without the other. The securities trade as one security on the Australian Securities Exchange (the “ASX”) under the code ABP. The units in ASPT and the shares in ASOL were stapled to the Group in March 2012.
The financial report of the Group for the year ended 30 June 2013 was authorised for issue in accordance with a resolution of the directors on 28 August 2013.
The nature of the operations and principal activities of the Group are described in the Directors’ report.
2. SUMMARY OF SIGNIFICANT ACCOUNTING POLICIES(a) Basis of PreparationThe financial report is a general-purpose financial report, which has been prepared in accordance with the requirements of the Corporations Act 2001 and Australian Accounting Standards. The financial report has also been prepared on a historical cost basis, except for investment properties and derivative financial instruments which have been measured at fair value, interests in joint ventures and associates which are accounted for using the equity method, and certain investments and financial assets measured at fair value.
The financial report is presented in Australian dollars and all values are rounded to the nearest thousand dollars ($’000) unless otherwise stated under the option available to the Group under ASIC Class Order 98/100. The Group is an entity to which the class order applies.
(b) Statement of ComplianceThe financial report complies with Australian Accounting Standards and International Financial Reporting Standards (IFRS), as issued by the AASB and IASB respectively.
(c) New accounting standards and interpretations(i) Changes in accounting policy and disclosuresThe accounting policies adopted are consistent with those of the previous financial year except as follows:
The Group has adopted the following new and amended Australian Accounting Standards and AASB interpretations as of 1 July 2012. Adoption of these standards and interpretations did not have any material effect on the financial position or performance of the Group.
– AASB 2011-9 Presentation of Other Comprehensive Income – This standard requires entities to group items presented in other comprehensive income on the basis of whether they might be reclassified subsequently to profit or loss and those that will not.
– AASB 2010-8 Deferred Tax: Recovery of Underlying Assets – The amendment addresses the determination of deferred tax on investment property measured at fair value and introduces a rebuttable presumption that deferred tax is measured on the basis that the carrying amount will be recoverable through sale rather than use. This amendment will have no impact on the Group as the majority of investment properties are held within the Group’s Trusts and where the investment property is held within a company, the Group already had a policy to assess recoverability and record deferred tax where appropriate based on the assessment of recoverability of the carrying value per property.
NOTES TO THE FINANCIAL STATEMENTS30 JuNE 2013
For
per
sona
l use
onl
y

61 annual report 2013
2. SUMMARY OF SIGNIFICANT ACCOUNTING POLICIES (CONTINUED)The Group early adopted the following standards during the year ended 30 June 2012:
– AASB 10 Consolidated Financial Statements – establishes a new control model that applies to all entities. It replaces parts of AASB 127 Consolidated and Separate Financial Statements dealing with the accounting for consolidated financial statements and UIG-112 Consolidation – Special Purpose Entities.
The new control model broadens the situations when an entity is considered to be controlled by another entity and includes new guidance for applying the model to specific situations, including when acting as a manager may give control, the impact of potential voting rights and when holding less than a majority voting rights may give control.
Adoption resulted in the consolidation of Abacus Hospitality Fund, Abacus Diversified Income Fund II and Abacus Miller Street Holding Trust. This is due to the combination of APG’s role as responsible entity, variable returns arising from its collective equity and loan investments in these funds and certain guarantees.
– AASB 11 Joint Arrangements - replaces AASB 131 Interests in Joint Ventures and UIG-113 Jointly controlled Entities – Non-monetary Contributions by Ventures. AASB 11 uses the principle of control in AASB 10 to define joint control, and therefore the determination of whether joint control exists may change. In addition it removes the option to account for jointly controlled entities (JCEs) using proportionate consolidation. Instead, accounting for a joint arrangement is dependent on the nature of the rights and obligations arising from the arrangement. Joint operations that give the parties a right to the underlying assets and obligations themselves is accounted for by recognising the share of those assets and obligations. Joint ventures that give the parties a right to the net assets is accounted for using the equity method.
Adoption had no impact in the Group’s method of accounting for its joint arrangements.
– AASB 12 Disclosure of Interests in Other Entities – includes all disclosures relating to an entity’s interests in subsidiaries, joint arrangements, associates and structures entities. New disclosures have been introduced about the judgements made by management to determine whether control exists, and to require summarised information about certain joint arrangements, associates and structured entities and subsidiaries with non controlling interests.
Adoption resulted in the Group disclosing the summarised financial information of material investments in joint arrangements. Prior to adoption of AASB12, the Group’s share of summarised financial information was disclosed.
For
per
sona
l use
onl
y

62 abacus property group
NOTES TO THE FINANCIAL STATEMENTS 30 JUNE 2013CONTINUED
2. SUMMARY OF SIGNIFICANT ACCOUNTING POLICIES (CONTINUED)(c) New accounting standards and interpretations (continued)(i) Accounting standards and Interpretations issues but not yet effectiveAustralian Accounting Standards and Interpretations that have recently been issued or amended but are not yet effective have not been adopted by the Group for the annual reporting period ended 30 June 2013. These are outlined in the following table.
REFERENCE SuMMARy
APPLICATION DATE OF STANDARD* IMPACT ON GROuP FINANCIAL REPORT
APPLICATION DATE FOR GROuP*
AASB 9 AASB 9 includes requirements for the classification and measurement of financial assets. It was further amended by AASB 2010-7 to reflect amendments to the accounting for financial liabilities.
These requirements improve and simplify the approach for classification and measurement of financial assets compared with the requirements of AASB 139. The main changes are described below.
(a) Financial assets that are debt instruments will be classified based on (1) the objective of the entity’s business model for managing the financial assets; (2) the characteristics of the contractual cash flows.
(b) Allows an irrevocable election on initial recognition to present gains and losses on investments in equity instruments that are not held for trading in other comprehensive income. Dividends in respect of these investments that are a return on investment can be recognised in profit or loss and there is no impairment or recycling on disposal of the instrument.
(c) Financial assets can be designated and measured at fair value through profit or loss at initial recognition if doing so eliminates or significantly reduces a measurement or recognition inconsistency that would arise from measuring assets or liabilities, or recognising the gains and losses on them, on different bases.
(d) Where the fair value option is used for financial liabilities the change in fair value is to be accounted for as follows:– The change attributable to changes
in credit risk are presented in other comprehensive income (OCI)
– The remaining change is presented in profit or loss.
Consequential amendments were also made to other standards as a result of AASB 9, introduced by AASB 2009-11 and superseded by AASB 2010-7 and 2010-10.
1 January 2015
The Group will review the classification of its existing financial assets and liabilities in line with the standard, such as secured and related party loans, options and derivatives.
The tests above with respect to any potential reclassification of financial assets with variable cash flows will depend on the facts applicable at transition date.
1 July 2015
For
per
sona
l use
onl
y

63 annual report 2013
2. SUMMARY OF SIGNIFICANT ACCOUNTING POLICIES (CONTINUED)(c) New accounting standards and interpretations (continued)
REFERENCE SuMMARy
APPLICATION DATE OF STANDARD* IMPACT ON GROuP FINANCIAL REPORT
APPLICATION DATE FOR GROuP*
AASB 13 AASB 13 establishes a single source of guidance for determining the fair value of assets and liabilities. AASB 13 does not change when an entity is required to use fair value, but rather, provides guidance on how to determine fair value when fair value is required or permitted. Application of this definition may result in different fair values being determined for the relevant assets.
AASB 13 also expands the disclosure requirements for all assets or liabilities carried at fair value. This includes information about the assumptions made and the qualitative impact of those assumptions on the fair value determined.
Consequential amendments were also made to other standards via AASB 2011-8.
1 January 2013
The Group will review the assets and liabilities requiring measurement at fair value. The standard is unlikely to have a material financial impact on the Group however the Group may be required to increase its level of disclosure.
1 July 2013
AASB 119 The main change introduced by this standard is to revise the accounting for defined benefit plans. The amendment removes the options for accounting for the liability, and requires that the liabilities arising from such plans is recognised in full with actuarial gains and losses being recognised in other comprehensive income. It also revised the method of calculating the return on plan assets.
The revised standard changes the definition of short-term employee benefits. The distinction between short-term and other long-term employee benefits is now based on whether the benefits are expected to be settled wholly within 12 months after the reporting date.
Consequential amendments were also made to other standards via AASB 2011-10.
1 January 2013
This revision will have no impact on how the Group measures its employee benefits.
1 July 2013
AASB 2012-5
AASB 2012-5 makes amendments resulting from the 2009-2011 Annual Improvements Cycle. The standard addresses a range of improvements, including the following:– Repeat application of AASB 1 is permitted– Clarification of the comparative information
requirements when an entity provides a third balance sheet (AASB 101 Presentation of Financial Statements).
1 July 2013 The Group will review any amendments to the standards when adopted by the AASB.
1 July 2013For
per
sona
l use
onl
y

64 abacus property group
NOTES TO THE FINANCIAL STATEMENTS 30 JUNE 2013CONTINUED
2. SUMMARY OF SIGNIFICANT ACCOUNTING POLICIES (CONTINUED)(c) New accounting standards and interpretations (continued)
REFERENCE SuMMARy
APPLICATION DATE OF STANDARD* IMPACT ON GROuP FINANCIAL REPORT
APPLICATION DATE FOR GROuP*
AASB 2011-4 This amendment deletes from AASB124 individual key management personnel disclosure requirements for disclosing entities that are not companies. It also removes the individual KMP disclosure requirements for all disclosing entities in relation to equity holdings, loans and other related party transactions.
1 July 2013 The amendment will have no impact on the disclosures for the Group.
1 July 2013
AASB 1053 Application of Tiers of Australian Accounting Standards
This Standard establishes a differential financial reporting framework consisting of two Tiers of reporting requirements for preparing general purpose financial statements:
(a) Tier 1: Australian Accounting Standards(b) Tier 2: Australian Accounting Standards –
Reduced Disclosure Requirements
Tier 2 comprises the recognition, measurement and presentation requirements of Tier 1 and substantially reduced disclosures corresponding to those requirements.
The following entities apply Tier 1 requirements in preparing general purpose financial statements:(a) For-profit entities in the private sector that
have public accountability (as defined in this Standard)
(b) The Australian Government and State, Territory and Local Governments
The following entities apply either Tier 2 or Tier 1 requirements in preparing general purpose financial statements:(a) For-profit private sector entities that do not
have public accountability(b) All not-for-profit private sector entities(c) Public sector entities other than the
Australian Government and State, Territory and Local Governments.
1 July 2013 The Group is required to report under the Tier 1 requirement as a for-profit entity in the private sector that has public accountability. There will be no impact to the reporting requirements of the Group.
1 July 2013
*designates the beginning of the applicable annual reporting period
AASB 2012-2, AASB 2012-4, AASB 2012-9, AASB 2012-10, AASB 2012-2 and Interpretation 20 will have no application to the Group.
For
per
sona
l use
onl
y
65 annual report 2013
2. SUMMARY OF SIGNIFICANT ACCOUNTING POLICIES (CONTINUED)(d) Basis of consolidationThe consolidated financial statements comprise the financial statements of AGHL and its subsidiaries, AT and its subsidiaries, AGPL and its subsidiaries, AIT and its subsidiaries, ASPT and its subsidiaries and ASOL and its subsidiaries collectively referred to as the Group.
Subsidiaries are all those entities over which the Group has power over the investee such that the Group is able to direct the relevant activities, has exposure or rights to variable returns from its involvement with the investee and has the ability to use its power over the investee to affect the amount of the investor’s returns.
The adoption of AASB 10 in the year ended 30 June 2012 led to the consolidation of Abacus Hospitality Fund, Abacus Diversified Income Fund II and Abacus Miller Street Holding Trust. In the year ended 30 June 2013 the Group also consolidated Abacus Wodonga Land Fund. This is due to the combination of the Group’s role as responsible entity and its exposure to variable returns arising from its collective equity and loan investments in these funds and certain guarantees.
The financial statements of subsidiaries are prepared for the same reporting period as the parent company, using consistent accounting policies with adjustments made to bring into line any dissimilar accounting policies that may exist.
All intercompany balances and transactions, including unrealised profits from intra-group transactions, have been eliminated in full and subsidiaries are consolidated from the date on which control is transferred to the Group and cease to be consolidated from the date on which control is transferred out of the Group. Where there is a loss of control of a subsidiary, the consolidated financial statements include the results for the part of the reporting period during which the Group has control.
The acquisition of subsidiaries is accounted for using the purchase method of accounting. The purchase method of accounting involves allocating the cost of the business combination to the fair value of the assets acquired and the liabilities and contingent liabilities assumed at the date of acquisition.
Non-controlling interests are allocated their share of net profit after tax in the consolidated income statement and are presented within equity in the consolidated statement of financial position, separately from the equity of the owners of the parent.
Non-controlling interests represent those equity interests in Abacus Hospitality Fund, Abacus Miller Street Holding Trust, Abacus Jigsaw Trust and Abacus Independent Retail Property Trust that are not held by the Group and are presented separately in the income statement and within equity in the consolidated statement of financial position.
(e) Foreign currency translationFunctional and presentation currencyBoth the functional and presentation currency of the Group are in Australian dollars. Each entity in the Group determines its own functional currency and items are included in the financial statements of each entity are measured using that functional currency.
Transactions and balancesTransactions in foreign currencies are initially recorded in the functional currency by applying the exchange rates ruling at the date of the transaction. Monetary assets and liabilities denominated in foreign currencies are retranslated at the rate of exchange ruling at the balance sheet date.
All exchange differences in the consolidated financial report are taken to profit or loss with the exception of differences on foreign currency borrowings on translation of foreign operations that provide a hedge against a net investment in a foreign operation. These are taken directly to equity until the disposal of the net investment, at which time they are recognised in profit or loss. On disposal of a foreign operation, the cumulative amount recognised in equity relating to that particular foreign operation is recognised in profit or loss. Tax charges and credits attributable to exchange differences on those borrowings are also recognised in equity.
Non-monetary items that are measured in terms of historical cost in a foreign currency are translated using the exchange rate as at the date of the initial transaction. Non-monetary items measured at fair value in a foreign currency are translated using the exchange rates at the date when the fair value was determined.
For
per
sona
l use
onl
y

66 abacus property group
NOTES TO THE FINANCIAL STATEMENTS 30 JUNE 2013CONTINUED
2. SUMMARY OF SIGNIFICANT ACCOUNTING POLICIES (CONTINUED)(e) Foreign currency translation (continued)At reporting date the assets and liabilities of foreign operations are translated into the presentation currency of the Group at the rate of exchange prevailing at balance date and the financial performance is translated at the average exchange rate prevailing during the reporting period. The exchange differences arising on translation are taken directly to the foreign currency translation reserve in equity.
(f) Revenue recognitionRevenue is recognised and measured at the fair value of the consideration received or receivable to the extent it is probable that the economic benefits will flow to the Group and the revenue can be reliably measured. The following specific recognition criteria must also be met before revenue is recognised:
Rental and Storage incomeRental income from investment properties is accounted for on a straight-line basis over the lease term. Contingent rental income is recognised as income in the periods in which it is earned. Lease incentives granted are recognised as an integral part of the total rental income.
Hotel IncomeRevenue from rooms is recognised and accrued on the provision of rooms or on the date of which rooms are to be provided in accordance with the terms and conditions of the bookings. Advance deposits from customers received are not recognised as revenue until such time when the rooms have been provided or when the customers forfeit the deposits due to failure of attendance.
Finance IncomeRevenue is recognised as interest accrues using the effective interest method. This is a method of calculating the amortised cost of a financial asset and allocating the interest income over the relevant period using the effective interest rate, which is the rate that exactly discounts estimated future cash receipts through the expected life of the financial asset to the net carrying amount of the financial asset.
Income from the sale of joint venture profit share rights is recognised when the Group enters into arrangements with other parties which result in the Group receiving consideration for the sale of its right to receive a profit share from the joint venture
Dividends and distributionsRevenue is recognised when the Group’s right to receive the payment is established.
Net change in fair value of investments and financial instruments derecognised during the yearRevenue from sale of investments is recognised on settlement when the significant risks and rewards of the ownership of the investments have been transferred to the buyer. Risks and rewards are generally considered to have passed to the buyer at the time of settlement of the sale. Financial instruments are derecognised when the right to receive or pay cash flows from the financial derivative has expired or when the entity transfers substantially all the risks and rewards of the financial derivative through termination. Gains or losses due to derecognition are recognised in the statement of comprehensive income.
Net change in fair value of investments held at balance dateChanges in market value of investments are recognised as revenue or expense in determining the net profit for the period.
Property development salesRevenue from property development sales is recognised when the significant risks, rewards of ownership and effective control has been transferred to the purchaser which has been determined to occur upon settlement and after contractual duties are completed.
No revenue is recognised if there are significant uncertainties regarding recovery of the consideration due, the costs incurred or to be incurred cannot be measured reliably, there is a risk of return or there is continuing management involvement to the degree usually associated with ownership.
For
per
sona
l use
onl
y

67 annual report 2013
2. SUMMARY OF SIGNIFICANT ACCOUNTING POLICIES (CONTINUED)(g) ExpensesExpenses including rates, taxes and other outgoings, are brought to account on an accrual basis and any related payables are carried at cost.
(h) Cash and cash equivalentsCash and cash equivalents in the balance sheet comprise cash at bank and in hand and short-term deposits with an original maturity of three months or less that are readily convertible to known amounts of cash which are subject to an insignificant risk of changes in value.
For the purposes of the Statement of Cash Flow, cash and cash equivalents consist of cash and cash equivalents as defined above.
(i) Trade and other receivables Trade receivables, which generally have 30 day terms, are recognised at amortised cost, which in the case of the Group, is the original invoice amount less an allowance for any uncollectible amounts.
Collectibility of trade receivables is reviewed on an ongoing basis. An allowance for doubtful debts is raised when there is objective evidence that collection of the full amount is no longer probable. Bad debts are written off when identified.
(j) Derivative financial instruments and hedgingThe Group utilises derivative financial instruments, both foreign exchange and interest rate swaps to manage the risk associated with foreign currency and interest rate fluctuations. Such derivative financial instruments are recognised at fair value.
The Group has set defined policies and implemented hedging policies to manage interest and exchange rate risks. Derivative instruments are transacted in line with these policies to achieve the economic outcomes in line with the Group’s treasury and hedging policy. They are not transacted for speculative purposes.
The Group does not employ hedge accounting and as such derivatives are recorded at fair value with gains or losses arising from the movement in fair values recorded in the income statement.
(k) Investments and other financial assets All investments are initially recognised at cost, being the fair value of the consideration given.
Financial assets in the scope of AASB 139 Financial Instruments: Recognition and Measurement are classified as either financial assets at fair value through profit or loss, loans and receivables, held to maturity investments, or available-for-sale financial assets. The Group determines the classification of its financial assets after initial recognition and, when allowed and appropriate, re-evaluates this designation at each financial year-end. At 30 June 2013 the Group’s investments in listed and unlisted securities have been classified as financial assets at fair value through profit or loss and property loans are classified as loans and receivables.
Recognition and derecognitionPurchases and sales of financial assets that require delivery of assets within the time frame generally established by regulation or convention in the market place are recognised on the trade date i.e. the date that the Group commits to purchase the assets. Financial assets are derecognised when the right to receive cash flows from the financial assets have expired or been transferred.
After initial recognition, investments, which are classified as held for trading, are measured at fair value. Financial assets are classified as held for trading if they are acquired for the purpose of selling in the near term with the intention of making a profit. Gains or losses on investments held for trading are recognised in the income statement.
For investments that are actively traded in organised financial markets, fair value is determined by reference to the Australian Securities Exchange quoted market bid prices at the close of business on the balance sheet date.
For investments where there is no quoted market or unit price, fair value is determined by reference to the current market value of another instrument which is substantially the same or is calculated based on the expected cash flows of the underlying net asset base of the investment.
For
per
sona
l use
onl
y

68 abacus property group
NOTES TO THE FINANCIAL STATEMENTS 30 JUNE 2013CONTINUED
2. SUMMARY OF SIGNIFICANT ACCOUNTING POLICIES (CONTINUED)(k) Investments and other financial assets (continued)Financial assets at fair value through profit or lossA financial asset or financial liability at fair value is designated by the entity at fair value through the profit and loss upon initial recognition. APG uses this designation where doing so results in more relevant information. This group of financial assets and liabilities are managed and their performance evaluated on a fair value basis, in accordance with APG’s documented risk management and investment strategy which outlines that these assets and liabilities are managed on a total rate of return basis, and information about the instruments is provided internally on that basis to the entity’s key management personnel and the Board.
APG enters into loans and receivables with associated options that provide for a variety of outcomes including repayment of principal and interest, satisfaction through obtaining interests in equity or property or combinations thereof. The fair value of the maximum exposure to credit risk in relation to these instruments was $28.2 million (2012: $27.9 million).
Loans and receivablesLoans and receivables are non-derivative financial assets with fixed or determinable payments that are not quoted in an active market. Such assets are carried at amortised cost using the effective interest method. Gains and losses are recognised in profit or loss when the loans and receivables are derecognised or impaired, as well as through the amortisation process.
SubsidiariesInvestment in subsidiaries are held at lower of cost or recoverable amount.
(l) Investment in associatesThe Group’s investments in its associates are accounted for under the equity method of accounting in the consolidated financial statements. The associates are entities over which the Group has significant influence but not control and accordingly are neither subsidiaries nor joint ventures.
The investment in the associates is carried in the consolidated balance sheet at cost plus post-acquisition changes in the Group’s share of net assets of the associates, less any impairment in value. The Group’s share of its associates’ post-acquisition profits or losses is recognised in the income statement, and its share of post-acquisition movements in reserves is recognised in reserves. The cumulative post-acquisition movements are adjusted against the carrying amount of the investment.
When the Group’s share of losses in an associate equals or exceeds its interest in the associate, including any unsecured long-term receivable and loans, the Group does not recognise further losses, unless it has incurred obligations or made payments on behalf of the associate.
The reporting dates of the associates and the Group are identical and the associates’ accounting policies conform to those used by the Group for like transactions and events in similar circumstances.
Investments in associates held by the parent are held at lower of cost and recoverable amount in the parent’s financial statements.
(m) Interest in joint arrangementsThe Group’s interest in joint venture entities is accounted for under the equity method of accounting in the consolidated financial statements. The investment in the joint venture entities is carried in the consolidated balance sheet at cost plus post-acquisition changes in the Group’s share of net assets of the joint ventures, less any impairment in value. The consolidated income statement reflects the Group’s share of the results of operations of the joint ventures.
Investments in joint ventures are held at lower of cost or recoverable amount in the investing entities.
The Group’s interest in joint operations that give the parties a right to the underlying assets and obligations themselves is accounted for by recognising the share of those assets and obligations.
For
per
sona
l use
onl
y

69 annual report 2013
2. SUMMARY OF SIGNIFICANT ACCOUNTING POLICIES (CONTINUED)(n) Property, plant and equipmentHotel property, plant and equipmentProperty (including land and buildings), plant and equipment represent owner-occupied properties and are initially measured at cost including transaction costs and acquisition costs. Subsequent to initial recognition, properties are measured at fair value less accumulated depreciation and any impairment in value after the date of revaluation.
Depreciation is calculated on a straight-line basis over the estimated useful life of the asset as follows:Buildings – 50 years Plant and equipment – 3 to 20 years
Revaluations of land and buildingsAny revaluation increment is credited to the asset revaluation reserve included in the equity section of the balance sheet except to the extent that it reverses a revaluation decrease of the same asset previously recognised in profit or loss, in which case the increase is recognised in profit or loss.
Any revaluation decrease is recognised in profit or loss except to the extent that it offsets a previous revaluation increase for the same asset in which case the decrease is debited directly to the asset revaluation reserve to the extent of the credit balance existing in the revaluation reserve for that asset.
Gains and losses on disposals are determined by comparing proceeds with the carrying amount. These are included in the income statement.
Any accumulated depreciation as at the revaluation date is eliminated against the gross carrying amounts of the assets and the net amounts are restated to the revalued amounts of the assets.
OtherLand and buildings are measured at fair value, based on periodic valuations by external independent valuers, less accumulated depreciation on buildings and less any impairment losses recognised after the date of the revaluation.
Plant and equipment is stated at historical cost less accumulated depreciation and any impairment losses.
Depreciation is calculated on a straight-line basis over the estimated useful life of the asset as follows:
Buildings – 40 years Plant and equipment – over 5 to 15 years
ImpairmentThe carrying values of property, plant and equipment are reviewed for impairment when events or changes in circumstances indicate the carrying value may not be recoverable. For an asset that does not generate largely independent cash inflows, the recoverable amount is determined for the cash-generating unit to which the asset belongs.
If any such indication exists and where the carrying values exceed the estimated recoverable amount, the assets or cash-generating units are written down to their recoverable amount.
The recoverable amount of property (including land and buildings), plant and equipment is the greater of fair value less costs to sell and value in use. In assessing value in use, the estimated future cash flows are discounted to their present value using a pre-tax discount rate that reflects current market assessments of the time value of money and the risks specific to the assets.
Impairment losses are recognised in the income statement.
Independent valuations are performed with sufficient regularity to ensure that the carrying amount does not differ materially from the asset’s fair value at the balance sheet date.
DisposalAn item of property, plant and equipment is derecognised upon disposal or when no future economic benefits are expected to arise from the continued use of the asset.
For
per
sona
l use
onl
y
70 abacus property group
NOTES TO THE FINANCIAL STATEMENTS 30 JUNE 2013CONTINUED
2. SUMMARY OF SIGNIFICANT ACCOUNTING POLICIES (CONTINUED)(n) Property, plant and equipment (continued)Any gain or loss arising on derecognition of the asset (calculated as the difference between the net disposal proceeds and the carrying amount of the asset) is included in the income statement in the year the asset is derecognised.
(o) Investment propertiesInvestment properties are measured initially at cost, including transaction costs. The carrying amount includes the cost of replacing parts of an existing investment property at the time that the cost is incurred if the recognition criteria are met, and excludes the costs of day-to-day servicing of an investment property. Subsequent to initial recognition, investment properties are stated at fair value, which reflects market and property specific conditions at the balance sheet date. Gains or losses arising from changes in the fair values of investment properties are recognised in the income statement in the year in which they arise.
Investment properties are derecognised either when they have been disposed of or when the investment property is permanently withdrawn from use and no future economic benefit is expected from its disposal. Any gains or losses on the retirement or disposal of an investment property are recognised in the income statement in the year of retirement or disposal.
Investment properties under construction are carried at fair value after allowing for the remaining expected costs of completion plus an appropriate risk adjusted development margin.
Transfers are made to investment property when, and only when, there is a change in use, evidenced by commencement of an operating lease to another party or ending of construction or development. Transfers are made from investment property when, and only when, there is a change in use, evidenced by commencement of development with a view to sale.
For a transfer from investment property to inventories, the deemed cost of property for subsequent accounting is its fair value at the date of change in use. For a transfer from inventories to investment property, any difference between the fair value of the property at that date and its previous carrying amount is recognised in profit or loss. When the Group completes the construction or development of a “self-constructed investment property”, any difference between the fair value of the property at that date and its previous carrying amount is recognised in profit or loss.
Land and buildings are considered to have the function of an investment and are therefore regarded as a composite asset, the overall value of which is influenced by many factors, the most prominent being income yield, rather than diminution in value of the building content due to the passing of time. Accordingly, the buildings and all components thereof, including integral plant and equipment, are not depreciated.
Investment properties are independently valued on a staggered basis every two years unless the underlying financing requires a more frequent independent valuation cycle. In determining fair value, the capitalisation of net income method and the discounting of future cashflows to their present value have been used.
Lease incentives provided by the Group to lessees, and rental guarantees which may be received by the Group from third parties (arising from the acquisition of investment properties) are included in the measurement of fair value of investment property. Leasing costs are treated as separate assets and are amortised over the respective periods to which the lease incentives and rental guarantees apply, either using a straight-line basis, or a basis which is more representative of the pattern of benefits.
under AASB 140, investment properties, including any plant and equipment, are not subject to depreciation. However, depreciation allowances in respect of certain buildings, plant and equipment are currently available to investors for taxation purposes.
For
per
sona
l use
onl
y

71 annual report 2013
2. SUMMARY OF SIGNIFICANT ACCOUNTING POLICIES (CONTINUED)(p) LeasesThe determination of whether an arrangement is or contains a lease is based on the substance of the arrangement and requires an assessment of whether the fulfilment of the arrangement is dependent on the use of a specific asset or assets and the arrangement conveys a right to use the asset.
Group as lesseeOperating lease payments are recognised as an expense in the income statement on a straight-line basis over the lease term. Lease incentives are recognised in the income statement as an integral part of the total lease expense.
Group as a lessorLeases in which the Group retains substantially all the risks and benefits of ownership of the lease assets are classified as operating leases.
(q) Goodwill and IntangiblesGoodwillGoodwill on acquisition is initially measured at cost being the excess of the cost of the business combination over the acquirer’s interest in the net fair value of the identifiable assets, liabilities and contingent liabilities. Following initial recognition, goodwill is measured at cost less any accumulated impairment losses and is not amortised. Goodwill is reviewed for impairment, annually or more frequently if events or changes in circumstances indicate that the carrying value may be impaired.
For the purpose of impairment testing, goodwill acquired in a business combination is, from the acquisition date, allocated to each of the Group’s cash-generating units, or groups of cash-generating units, that are expected to benefit from the synergies of the combination, irrespective of whether other assets or liabilities of the Group are assigned to those units or groups of units. Each unit or group of units to which the goodwill is so allocated:• Represents the lowest level within the Group at which the goodwill is monitored for internal management purposes; and• Is not larger than a segment based on either the Group’s primary or the Group’s secondary reporting format determined
in accordance with AASB 8 Operating Segments.
Impairment is determined by assessing the recoverable amount of the cash-generating unit (group of cash-generating units), to which the goodwill relates. When the recoverable amount of the cash-generating unit (group of cash-generating units) is less that the carrying amount, an impairment loss is recognised. When goodwill forms part of a cash-generating unit (group of cash-generating units) and an operation within that unit is disposed of, the goodwill associated with the operation disposed of is included in the carrying amount of the operation when determining the gain or loss on disposal of the operation. Goodwill disposed of in this manner is measured based on the relative values of the operation disposed of and the portion of the cash-generating unit retained.
Impairment losses recognised for goodwill are not subsequently reversed.
Intangible assetsIntangible assets acquired separately or in a business combination are initially measured at cost. Following initial recognition, intangibles are carried at cost less accumulated amortisation and impairment losses.
Intangible assets created within the business are not capitalised and expenditure is charged against profits in the period in which the expenditure is incurred.
The useful lives of these intangible assets are assessed to be either finite or indefinite. Intangible assets with finite lives are amortised over the useful life and assessed for impairment whenever there is an indication that the intangible asset maybe impaired. The amortisation period and the amortisation method for an intangible asset with a finite life is reviewed at least each financial year-end. Changes in the expected useful life or the expected pattern of consumption of future economic benefit embodied in the asset are accounted for prospectively by changing the amortisation period or method, as appropriate, which is a change in an accounting estimate. The amortisation expense on intangible assets with finite lives is recognised in the income statement through the ‘depreciation and amortisation expense’ line item.
For
per
sona
l use
onl
y

72 abacus property group
NOTES TO THE FINANCIAL STATEMENTS 30 JUNE 2013CONTINUED
2. SUMMARY OF SIGNIFICANT ACCOUNTING POLICIES (CONTINUED)(q) Goodwill and Intangibles (continued)Intangible assets with indefinite useful lives are tested for impairment annually either individually or at the cash generating unit level. Such intangibles are not amortised. The useful life of an intangible asset with an indefinite life is reviewed each reporting period to determine whether the indefinite life assessment continues to be supportable. If not, the change in the useful life assessment from indefinite to finite is accounted for as a change in an accounting estimate and is thus accounted for on a prospective basis.
(r) Impairment of non-financial assets other than goodwillIntangible assets that have an indefinite useful life are not subject to amortisation and are tested annually for impairment, or more frequently if events or changes in circumstances indicate that they might be impaired. Other assets are tested for impairment whenever events or changes in circumstances indicate that the carrying amount may not be recoverable. An impairment loss is recognised for the amount by which the asset’s carrying amount exceeds its recoverable amount. Recoverable amount is the higher of an asset’s fair value less costs to sell and value in use. For the purposes of assessing impairment, assets are grouped at the lowest levels for which there are separately identifiable cash inflows that are largely independent of the cash inflows from other assets or groups of assets (cash-generating units). Non-financial assets other that goodwill that suffered an impairment are tested for possible reversal of the impairment whenever events or changes in circumstances indicate that the impairment may have reversed.
(s) Trade and other payablesTrade payables and other payables are carried at amortised cost. They represent liabilities for goods and services provided to the Group prior to the end of the financial year that are unpaid and arise when the Group becomes obliged to make future payments in respect of the purchase of these goods and services. The amounts are unsecured and are usually paid within 30 days of recognition.
(t) Provisions and employee leave benefitsProvisions are recognised when the Group has a present obligation (legal or constructive) as a result of a past event and it is probable that an outflow of resources embodying economic benefits will be required to settle the obligation and a reliable estimate can be made of the amount of the obligation.
Provisions are measured at the present value of management’s best estimate of the expenditure required to settle the present obligation at the balance sheet date. If the effect of the time value of money is material, provisions are discounted using a current pre-tax rate that reflects the time value of money and the risks specific to the liability. The increase in the provision resulting from the passage of time is recognised in finance costs.
Employee leave benefits(i) Wages, salaries, annual leave and sick leaveLiabilities for wages and salaries, including non-monetary benefits, annual leave and accumulating sick leave expected to be settled within 12 months of the reporting date are recognised in respect of employees’ services up to the reporting date. They are measured at the amounts expected to be paid when the liabilities are settled. Liabilities for non-accumulating sick leave are recognised when the leave is taken and are measured at the rates paid or payable.
(ii) Long service leaveThe liability for long service leave is recognised and measured as the present value of expected future payments to be made in respect of services provided by employees up to the reporting date using the projected unit credit method. Consideration is given to expected future wage and salary levels, experience of employee departures, and periods of service. Expected future payments are discounted using market yields at the reporting date on national government bonds with terms to maturity and currencies that match, as closely as possible, the estimated future cash outflows.
For
per
sona
l use
onl
y

73 annual report 2013
2. SUMMARY OF SIGNIFICANT ACCOUNTING POLICIES (CONTINUED)(u) Distributions and dividendsTrusts generally distribute their distributable assessable income to their unitholders. Such distributions are determined by reference to the taxable income of the respective trusts. Distributable income may include capital gains arising from the disposal of investments and tax-deferred income. Unrealised gains and losses on investments that are recognised as income are usually retained and are generally not assessable or distributable until realised. Capital losses are not distributed to security holders but are retained to be offset against any future realised capital gains.
A liability for dividend or distribution is recognised in the Balance Sheet if the dividend or distribution has been declared, determined or publicly recommended prior to balance date.
(v) Interest-bearing loans and borrowings All loans and borrowings are initially recognised at cost, being the fair value of the consideration received net of transaction costs associated with the borrowing.
After initial recognition, interest-bearing loans and borrowings are subsequently measured at amortised cost using the effective interest method. Fees paid in the establishment of loan facilities that are yield related are included as part of the carrying amount of loans and borrowings.
Borrowings are classified as non-current liabilities where the Group has an unconditional right to defer settlement of the liability for at least 12 months after the balance sheet date.
Borrowing CostsBorrowing costs are recognised as an expense when incurred unless they relate to a qualifying asset or to upfront borrowing establishment and arrangement costs, which are deferred and amortised as an expense over the life of the facility. A qualifying asset is an asset that generally takes more than 12 months to get ready for its intended use or sale. In these circumstances, the financing costs are capitalised into the cost of the asset. Where funds are borrowed by the Group for the acquisition or construction of a qualifying asset, the amount of the borrowing costs capitalised are those incurred in relation to the borrowing.
(w) Contributed equityIssued and paid up capital is recognised at the fair value of the consideration received by the Group. Stapled securities are classified as equity. Incremental costs directly attributable to the issue of new securities are shown in equity as a deduction, net of tax, from the proceeds.
(x) Transfers to / (from) total equityIn respect of the Group, revaluation increments or decrements arising from changes in the fair value of investment properties and derivative financial instruments, unrealised gains and losses in the net value of investments, accrued income not yet assessable and expenses provided for or accrued not yet deductible, net capital losses and tax free or tax deferred amounts maybe transferred to equity and may not be included in the determination of distributable income.
(y) Non-current assets held for saleBefore classification as held for sale the measurement of the assets is updated. Upon classification as held for sale, assets are recognised at the lower of carrying amount and fair value less costs to sell with the exception of investment properties which are valued in accordance with 2(o).
Gains and losses from revaluations on initial classification and subsequent re-measurement are recognised in the income statement.
For
per
sona
l use
onl
y

74 abacus property group
NOTES TO THE FINANCIAL STATEMENTS 30 JUNE 2013CONTINUED
2. SUMMARY OF SIGNIFICANT ACCOUNTING POLICIES (CONTINUED)(z) InventoriesProperty DevelopmentInventories are stated at the lower of cost and net realisable value. Net realisable value is determined on the basis of sales in the ordinary course of business. Expenses of marketing, selling and distribution to customers are estimated and deducted to establish net realisable value. Where the net realisable value of inventory is less than cost, an impairment expense is recognised in the consolidated income statement. Reversals of previously recognised impairment charges are recognised in the consolidated income statement such that the inventory is always carried at the lower of cost and net realisable value. Cost includes the purchase consideration, development costs and holding costs such as borrowing costs, rates and taxes.
HotelInventories are valued at the lower of cost and net realisable value.
Net realisable value is the estimated selling price in the ordinary course of business, less the estimated costs necessary to make the sale.
(za) TaxationThe Group comprises taxable and non-taxable entities. A liability for current and deferred tax and tax expense is only recognised in respect of taxable entities that are subject to income tax and potential capital gains tax as detailed below.
Trust income taxunder current Australian income tax legislation AT, AIT, ASPT, AHT, ADIFII and AMSHT are not liable to Australian income tax provided security holders are presently entitled to the taxable income of the trusts and the trusts generally distribute their taxable income.
Company income taxAGHL and its Australian resident wholly-owned subsidiaries, ASOL and its Australian resident wholly-owned subsidiaries and AHL and its Australian resident wholly-owned subsidiaries have formed separate tax consolidation groups. AGHL, ASOL and AHL have entered into tax funding agreements with their Australian resident wholly-owned subsidiaries, so that each subsidiary agrees to pay or receive its share of the allocated tax at the current tax rate.
The head tax entity and the controlled entities in each tax consolidated group continue to account for their own current and deferred tax amounts.
In addition to its own current and deferred tax amounts, the head tax entity also recognises the current tax liabilities (or assets) and the deferred tax assets arising from unused tax losses and unused tax credits assumed from controlled entities in the tax consolidated group.
Assets or liabilities arising under tax funding agreements with the tax consolidated entities are recognised as amounts receivable from or payable to other entities in the group.
Any difference between the amounts assumed and amounts receivable of payable under the tax funding agreements are recognised as a contribution to (or distribution from) wholly-owned tax consolidated entities.
Current tax assets and liabilities for the current and prior periods are measured at the amount expected to be recovered from or paid to the taxation authorities. The tax rates and tax laws used to compute the amount are those that are enacted or substantively enacted by the balance sheet date.
Deferred income tax assets are recognised for all deductible temporary differences, carry forward of unused tax assets and unused tax losses, to the extent that it is probable that taxable profit will be available against which the deductible temporary differences, and the carry-forward of unused tax assets and unused tax losses can be utilised, except:
For
per
sona
l use
onl
y
75 annual report 2013
2. SUMMARY OF SIGNIFICANT ACCOUNTING POLICIES (CONTINUED)(za) Taxation (continued)Company income tax (continued)• when the deferred income tax asset relating to the deductible temporary difference arises from the initial recognition of
an asset or liability in a transaction that is not a business combination and, at the time of the transaction, affects neither the accounting profit nor taxable profit or loss; or
• when the deductible temporary differences associated with investments in subsidiaries, associates and interests in joint ventures, deferred tax assets are only recognised to the extent that it is probable that the temporary differences will reverse in the foreseeable future and taxable profit will be available against which the temporary differences can be utilised.
The carrying amount of deferred income tax assets is reviewed at each balance sheet date and reduced to the extent that it is no longer probable that sufficient taxable profit will be available to allow all or part of the deferred income tax asset to be utilised.
unrecognised deferred income tax assets are reassessed at each balance sheet date and are recognised to the extent that it has become probable that future taxable profit will allow the deferred tax asset to be recovered.
Deferred income tax is provided on all temporary differences at the balance sheet date between the tax bases of assets and liabilities and their carrying amounts for financial reporting purposes.
Deferred income tax liabilities are recognised for all taxable temporary differences, except:• when the deferred income tax liability arises from the initial recognition of an asset or liability in a transaction that is not a
business combination and, at the time of the transaction, affects neither the accounting profit nor taxable profit or loss; or • when the taxable temporary differences associated with investments in subsidiaries, associates and interests in joint
ventures, and the timing of the reversal of the temporary differences can be controlled and it is probable that the temporary differences will not reverse in the foreseeable future.
Deferred income tax assets and liabilities are measured at the tax rates that are expected to apply to the year when the asset is realised or the liability is settled, based on tax rates (and tax laws) that have been enacted or substantively enacted at the balance sheet date.
Income taxes relating to items recognised directly in equity are recognised in equity and not in the income statement.
Deferred tax assets and deferred tax liabilities are offset only if a legally enforceable right exists to set off current tax assets against current tax liabilities and the deferred tax assets and liabilities relate to the same taxable entity and the same taxation authority.
New ZealandThe trusts that operate in New Zealand (“NZ”) are treated as a company for NZ income tax purposes and are taxed at the corporate tax rate of 28% (2012: 28%). NZ income tax paid the Trusts can be claimed as foreign tax credits to offset against foreign income and distributable to security holders. NZ tax losses are carried forward provided the continuity test of ownership is satisfied. Interest expense from the Trusts are fully deductible subject to thin capitalisation considerations. Property revaluation gains or losses are to be excluded from taxable income, with no deferred tax implications as capital gains are not taxed in NZ.
Income derived by companies which are incorporated in Australia and registered in NZ as overseas companies is exempt from tax in Australia where the income has been taxed in NZ. This income is regarded as non-assessable non-exempt income. As such, income tax is calculated on the companies’ NZ taxable income and taxed at the NZ corporate rate of 28% (2012: 28%).
For
per
sona
l use
onl
y

76 abacus property group
NOTES TO THE FINANCIAL STATEMENTS 30 JUNE 2013CONTINUED
2. SUMMARY OF SIGNIFICANT ACCOUNTING POLICIES (CONTINUED)(za) Taxation (continued)Goods and services tax (GST)Revenues, expenses and assets are recognised net of the amount of GST except when the GST incurred on a purchase of goods and services is not recoverable from the taxation authority, in which case the GST is recognised as part of the cost of acquisition of the asset or as part of the expense item as applicable; and receivables and payables are stated with the amount of GST included.
The net amount of GST recoverable from, or payable to, the taxation authority is included as part of receivables or payables in the balance sheet.
Cash flows are included in the Cash Flow Statement on a gross basis and the GST component of cash flows arising from investing and financing activities, which is recoverable from, or payable to, the taxation authority are classified as operating cash flows.
Commitments and contingencies are disclosed net of the amount of GST recoverable from, or payable to, the taxation authority.
(zb) Earnings per stapled security (EPSS)Basic EPSS is calculated as net profit attributable to stapled security holders, adjusted to exclude costs of servicing equity (other than distributions) divided by the weighted average number of stapled securities on issue during the period under review.
Diluted EPSS is calculated as net profit attributable to stapled security holders, adjusted for:• costs of servicing equity (other than distributions);• the after tax effect of dividends and interest associated with dilutive potential stapled securities that have been recognised
as expenses; and • other non-discretionary changes in revenues or expenses during the period that would result from the dilution of potential
stapled securities;
divided by the weighted average number of stapled securities and dilutive potential stapled securities, adjusted for any bonus element.
(zc) Security based payment plansExecutives of the Group receive remuneration in the form of security based payments, whereby Executives render services as consideration for equity instruments (equity-settled transactions).
The cost of equity-settled transactions is recognised, together with a corresponding increase in other capital reserves in equity, over the period in which the performance and/or service conditions are fulfilled. The cumulative expense recognised for equity-settled transactions at each reporting date until the vesting date reflects the extent to which the vesting period has expired and the Group’s best estimate of the number of equity instruments that will ultimately vest. The income statement expense or credit for a period represents the movement in cumulative expense recognised as at the beginning and end of that period and is recognised in employee benefits expense (note 29).
No expense is recognised for awards that do not ultimately vest, except for equity-settled transactions for which vesting is conditional upon a market or non-vesting condition. These are treated as vesting irrespective of whether or not the market or non-vesting conditions are satisfied, provided that all other performance and / or service conditions are satisfied.
When the terms of an equity-settled award are modified, the minimum expense recognised is the expense had the terms not been modified, if the original terms of the award are met. An additional expense is recognised for any modification that increases the total fair value of the security based payment transaction, or is otherwise beneficial to the employee as measured at the date of modification.
When an equity-settled award is cancelled, it is treated as if it vested on the date of cancellation, and any expense not yet recognised for the award is recognised immediately. This includes any award where non-vesting conditions within the control of either the entity or the employee are not met.
For
per
sona
l use
onl
y

77 annual report 2013
3. FINANCIAL RISK MANAGEMENTThe risks arising from the use of the Group’s financial instruments are credit risk, liquidity risk and market risk (interest rate risk, price risk and foreign currency risk).
The Group’s financial risk management focuses on mitigating the unpredictability of the financial markets and its impact on the financial performance of the Group. The Board reviews and agrees policies for managing each of these risks, which are summarised below.
Primary responsibility for identification and control of financial risks rests with the Treasury Management Committee under the authority of the Board. The Board reviews and agrees policies for managing each of the risks identified below, including the setting of limits for trading in derivatives, hedging cover of interest rate risks and cash flow forecast projections.
The main purpose of the financial instruments used by the Group is to raise finance for the Group’s operations. The Group has various other financial assets and liabilities such as trade receivables and trade payables, which arise directly from its operations. The Group also enters into derivative transactions principally interest rate swaps. The purpose is to manage the interest rate exposure arising from the Group’s operations and its sources of finance.
Details of the significant accounting policies and methods adopted, including the criteria for recognition, the basis of measurement and the basis on which income and expenses are recognised, in respect of each class of financial asset, financial liability and equity instrument are disclosed in notes 2 and 4 to the financial statements.
(a) Credit RiskCredit risk is the risk of financial loss to the Group if a customer or counterparty to a financial instrument fails to meet its contractual obligations, and arises principally from the Group’s receivables from customers, investment in securities and options, secured property loans and interest bearing loans and derivatives with banks.
The Group manages its exposure to risk by:– derivative counterparties and cash transactions are limited to high credit quality financial institutions;– policy which limits the amount of credit exposure to any one financial institution;– providing loans as an investment into joint ventures, associates, related parties and third parties where it is satisfied with
the underlying property exposure within that entity;– regularly monitoring loans and receivables balances on an ongoing basis;– regularly monitoring the performance of its associates, joint ventures, related parties and third parties on an ongoing basis;
and– obtaining collateral as security (where required or appropriate).
The Group’s credit risk is predominately driven by its Property Ventures business which provides loans to third parties, those using the funds for property development and / or investment. The Group mitigates the exposure to this risk by evaluation of the application before acceptance. The analysis will specifically focus on:– the Loan Valuation Ratio (LVR) at drawdown;– mortgage ranking;– background of the developer (borrower) including previous developments;– background of the owner (borrower) including previous investment track record;– that the terms and conditions of higher ranking mortgages are acceptable to the Group;– appropriate property insurances are in place with a copy provided to the Group; and– market analysis of the completed development being used to service drawdown.
The Group also mitigates this risk by ensuring adequate security is obtained and timely monitoring of the financial instrument to identify any potential adverse changes in the credit quality.
For
per
sona
l use
onl
y

78 abacus property group
NOTES TO THE FINANCIAL STATEMENTS 30 JUNE 2013CONTINUED
3. FINANCIAL RISK MANAGEMENT (CONTINUED)(b) Liquidity riskPrudent liquidity risk management implies maintaining sufficient cash and marketable securities, the availability of funding through an adequate and diverse amount of committed credit facilities, the ability to close out market positions and the flexibility to raise funds through the issue of new stapled securities or the distribution reinvestment plan.
The Group’s policy is to maintain an available loan facility with banks sufficient to meet expected operational expenses and to finance investment acquisitions for a period of 90 days, including the servicing of financial obligations. Current loan facilities are assessed and extended for a maximum period based on the Group’s expectations of future interest and market conditions.
As at 30 June 2013, the Group had undrawn committed facilities of $262.7 million and cash of $44.8 million which are adequate to cover short term funding requirements.
Further information regarding the Group’s debt profile is disclosed in Note 20.
(c) Refinancing RiskRefinancing risk is the risk that unfavorable interest rate and credit market conditions result in an unacceptable increase in the Group’s credit margins and interest cost. Refinancing risk arises when the Group is required to obtain debt to fund existing and new debt positions.
The Group is exposed to refinancing risks arising from the availability of finance as well as the interest rates and credit margins at which financing is available. The Group manages this risk by spreading maturities of borrowings and interest rate swaps, diversification of lenders and reviewing potential transactions to understand the impact on the Group’s credit worthiness.
(d) Market RiskMarket risk is the risk that changes in market prices, such as foreign exchange rates, interest rates and equity prices will affect the Group’s income or the value of its holdings of financial instruments. The objective of market risk management is to manage and control market risk exposures within acceptable parameters, while optimising the return.
Foreign currency risk The Group is exposed to currency risk on its investment in foreign operations, equity investments, investment in associates and property loans denominated in a currency other than the functional currency of Group entities. The currencies in which these transactions are conducted are primarily are denominated in NZD.
As a result the Group’s balance sheet can be affected by movements in the A$/NZ$ exchange rates.
Interest rate riskAPG’s exposure to the risk of changes in market interest rates relates primarily to APG’s long-term bank debt obligations which are based on floating interest rates. APG’s policy is to maintain a mix of floating exposure and fixed interest rate hedging with fixed rate cover highest in years 1 to 5.
Similar policies are employed for the funds consolidated by the Group (AHF, ADIF II and AMSHT).
The Group hedges to minimise interest rate risk by entering variable to fixed interest rate swaps which also helps deliver interest covenant compliance and positive carry (net rental income in excess of interest expense) on the property portfolio. Interest rate swaps have the economic effect of converting borrowings from variable rates to fixed rates. Under the interest rate swaps, the Group agrees to exchange, at specified intervals, the difference between fixed and variable rate interest amounts calculated by reference to the agreed notional principal amounts. At 30 June 2013, after taking into account the effect of interest rate swaps, approximately 83.0% of the Group’s drawn debt is subject to fixed rate hedges (2012: 97.0%). Hedge cover as a percentage of available facilities at 30 June 2013 is 59.5% (2012: 69.7%).
For
per
sona
l use
onl
y

79 annual report 2013
3. FINANCIAL RISK MANAGEMENT (CONTINUED)(d) Market Risk (continued)Fair value interest rate riskAs the Group holds interest rate swaps against its variable rate debt there is a risk that the economic value of a financial instrument will fluctuate because of changes in market interest rates. The level of swapped and fixed rate debt is disclosed in note 22.
(e) Other market price riskThe Group is exposed to equity securities price risk. The key risk variable is the quoted price of securities which is influenced by a range of factors, most of which are outside the control of the Group. Management of the Group monitors the securities in its investment portfolio based on market indices and published prices. Investments within the portfolio are managed on an individual basis and all buy / sell decisions are approved by the Managing Director and the Chief Financial Officer.
4. SIGNIFICANT ACCOUNTING JUDGMENTS, ESTIMATES AND ASSUMPTIONSIn applying the Group’s accounting policies management continually evaluates judgments, estimates and assumptions based on experience and other factors, including expectations of future events that may have an impact on the Group. All judgments, estimates and assumptions made are believed to be reasonable based on the most current set of circumstances available to management. Actual results may differ from the judgments, estimates and assumptions. Significant judgments, estimates and assumptions made by management in the preparation of these financial statements are outlined below:
(i) Significant accounting judgmentsOperating lease commitments – Group as lessorThe Group has entered into commercial property leases on its investment property portfolio. The Group has determined that it retains all the significant risks and rewards of ownership of these properties and has thus classified the leases as operating leases.
Recovery of deferred tax assetsDeferred tax assets are recognised for deductible temporary differences and tax losses on revenue account as management considers that it is probable that future taxable profits will be available to utilise those temporary differences and tax losses.
Classification of and valuation of investmentsThe Group has decided to classify investments in listed and unlisted securities as ‘held for trading’ investments and movements in fair value are recognised directly in profit or loss. The fair value of listed securities has been determined by reference to published price quotations in an active market. The fair value of unlisted securities has been determined by reference to the net assets of the entity and available redemption facilities.
Impairment of property loans and financial assetsThe Group assesses impairment of all assets at each reporting date by evaluating conditions specific to the Group and to the particular asset that may lead to impairment. If an impairment trigger exists the recoverable amount of the asset is determined. For property loans and interim funding to related funds this involves value in use calculations, which incorporate a number of key estimates and assumptions around cashflows and fair value of underlying investment properties held by the borrower and expected timing of cashflows from equity raisings of related funds.
Accounting policy – financial assets and liabilities at fair value through profit and lossA financial asset or financial liability is designated by the entity as being at fair value through profit or loss upon initial recognition. APG uses this designation where doing so results in more relevant information, because it is a group of financial assets and liabilities which is managed and its performance is evaluated on a fair value basis, in accordance with APG’s documented risk management and investment strategy, and information about the instruments is provided internally on that basis to the entity’s key management personnel and the Board.
For
per
sona
l use
onl
y

80 abacus property group
NOTES TO THE FINANCIAL STATEMENTS 30 JUNE 2013CONTINUED
4. SIGNIFICANT ACCOUNTING JUDGMENTS, ESTIMATES AND ASSUMPTIONS (CONTINUED)(i) Significant accounting judgments (continued)Control and significant influenceIn determining whether the Group has control over an entity, the Group assess its exposure or rights to variable returns from its involvement with the entity and whether it has the ability to affect those returns through its power over the investee. The Group may have significant influence over an entity when it has the power to participate in the financial and operating policies decisions of the entity but is not in control or joint control of those policies.
(ii) Significant accounting estimates and assumptionsImpairment of goodwill and intangibles with indefinite useful livesThe Group determines whether goodwill and intangibles with indefinite useful lives are impaired at least on an annual basis. This requires an estimation of the recoverable amount of the cash-generating units to which the goodwill and intangibles with indefinite useful lives are allocated. For goodwill this involves value in use calculations which incorporate a number of key estimates and assumptions around cash flows and fair value of investment properties upon which these determine the revenue / cash flows. The assumptions used in the estimations of the recoverable amount and the carrying amount of goodwill and intangibles with indefinite useful lives are discussed in note 18.
Fair value of derivativesThe fair value of derivatives is determined using closing quoted market prices (where there is an active market) or a suitable pricing model based on discounted cash flow analysis using assumptions supported by observable market rates. Where the derivatives are not quoted in an active market their fair value has been determined using (where available) quoted market inputs and other data relevant to assessing the value of the financial instrument, including financial guarantees granted by the Group, estimates of the probability of exercise.
Valuation of investment properties and property, plant and equipment held at fair valueThe Group makes judgements in respect of the fair value of investment properties (note 2(o)). The fair value of these properties are reviewed regularly by management with reference to external independent property valuations and market conditions existing at reporting date, using generally accepted market practices. The assumptions underlying estimated fair values are those relating to the receipt of contractual rents, expected future market rentals, maintenance requirements, capitalisation rates and discount rates that reflect current market conditions and current or recent property investment prices. If there is any material change in these assumptions or regional, national or international economic conditions, the fair value of investment properties may differ and may need to be re-estimated.
Net realisable value of inventoryInventories are carried at the lower of cost and net realisable value. Net realisable value is the estimated selling price in the ordinary course of business less the estimated costs of completion and selling expenses. The estimates take into consideration fluctuations of price or cost directly relating to events occurring after the end of the period to the extent that such events confirm conditions existing at the end of the period. The key assumptions that require the use of management judgment are reviewed half-yearly. If the net realisable value is less than the carrying value of inventory, an impairment loss is recognised in the income statement.
Fair value of financial assetsAPG enters into loans and receivables with associated options that provide for a variety of outcomes including repayment of principal and interest, satisfaction through obtaining interests in equity or property or combinations thereof. At the end of the year, the fair value of the maximum exposure to credit risk in relation to these instruments was $23.6 million (2012: $27.9 million).
For
per
sona
l use
onl
y
81 annual report 2013
5. SEGMENT INFORMATIONThe Group predominately operates in Australia. Following are the Group’s operating segments, which are regularly reviewed by the Chief Operating Decision Maker (“CODM”) to make decisions about resources allocation and to assess performance:
(a) Property: the segment is responsible for the investment in and ownership of commercial, retail and industrial properties. This segment also includes the equity accounting of material co-investments in property entities not engaged in development and construction projects;
(b) Funds Management: the segment includes development, origination, co-investment and fund management revenues and expenses in addition to discharging the Group’s responsible entity obligations;
(c) Property Ventures: provides secured lending and related property financing solutions and is also responsible for the Group’s investment in joint venture and associates’ development and construction projects, which includes revenue from debt and equity investments in joint ventures and associates. This segment also is responsible for the Group’s investment in property securities; and
(d) Storage: the segment is responsible for the investment in and ownership of self-storage facilities.
Segment result includes transactions between operating segments which are then eliminated.
AASB 10 - in application of the standard the Group has consolidated the Abacus Hospitality Fund, Abacus Diversified Income Fund II, Abacus Miller Street Holding Trust and Abacus Wodonga Land Fund. The performances of these entities which are operated as externally managed investment schemes are considered to be non-core segments and are reviewed separately to that of the performance of the Group’s business segments.
For
per
sona
l use
onl
y
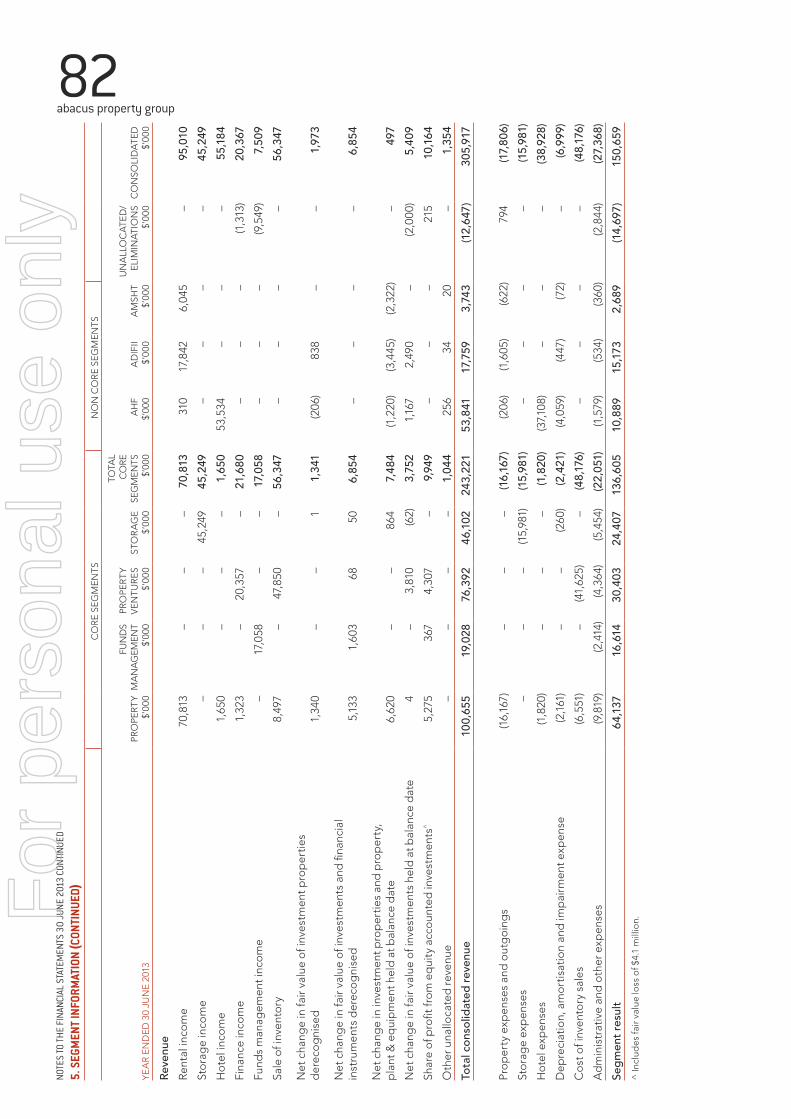
82 abacus property group
NOTE
S TO
THE
FINA
NCIA
L ST
ATEM
ENTS
30
JuNE
201
3 CO
NTIN
uED
5. S
EGM
ENT
INFO
RMAT
ION
(CON
TINU
ED)
CO
RE
SEG
MEN
TSN
ON
CO
RE
SEG
MEN
TS
Y EA
R EN
DED
30
JUN
E 20
13PR
OPE
RT
y $’
000
FuN
DS
MA
NA
GEM
ENT
$’00
0
PRO
PER
Ty
VEN
T uR
ES
$’00
0ST
OR
AG
E
$’00
0
TOTA
L C
ORE
SE
GM
ENTS
$’
000
AH
F $’
000
AD
IFII
$’00
0A
MSH
T $’
000
UN
ALL
OC
ATE
D/
ELIM
INA
TIO
NS
$’00
0C
ON
SOLI
DA
TED
$’
000
Reve
nue
Rent
al in
com
e 7
0,81
3 –
–
–
70
,813
3
10
17,
842
6,0
45
–
95,
010
Sto
rag
e in
com
e –
–
–
4
5,24
9 4
5,24
9 –
–
–
–
4
5,24
9 H
ote
l inc
om
e 1
,650
–
–
–
1,
650
53,
534
–
–
–
55,1
84
Fina
nce
inco
me
1,3
23
–
20,
357
–
21,6
80
–
–
–
(1,3
13)
20,
367
Fund
s m
anag
emen
t inc
om
e –
1
7,05
8 –
–
17
,058
–
–
–
(9
,549
) 7,
509
Sale
of i
nven
tory
8,4
97
–
47,
850
–
56,
347
–
–
–
–
56,
347
Net
cha
nge
in fa
ir va
lue
of in
vest
men
t pro
per
ties
d
erec
og
nise
d 1
,340
–
–
1
1,
341
(206
) 8
38
–
–
1,97
3
Net
cha
nge
in fa
ir va
lue
of in
vest
men
ts a
nd fi
nanc
ial
inst
rum
ents
der
eco
gni
sed
5,1
33
1,6
03
68
50
6,8
54
–
–
–
–
6,8
54
Net
cha
nge
in in
vest
men
t pro
per
ties
and
pro
per
ty,
pla
nt &
eq
uip
men
t hel
d a
t bal
ance
dat
e 6
,620
–
–
8
64
7,48
4 (1
,220
) (3
,445
) (2
,322
) –
4
97
Net
cha
nge
in fa
ir va
lue
of in
vest
men
ts h
eld
at b
alan
ce d
ate
4
–
3,8
10
(62)
3,75
2 1
,167
2
,490
–
(2
,000
) 5
,409
Sh
are
of p
rofit
fro
m e
qui
ty a
cco
unte
d in
vest
men
ts^
5,2
75
367
4
,307
–
9,
949
–
–
–
215
10
,164
Oth
er u
nallo
cate
d re
venu
e –
–
–
–
1,
044
256
3
4 2
0 –
1,
354
Tota
l con
solid
ated
reve
nue
100,
655
19,0
28
76,3
92
46,1
02
243,
221
53,
841
17,75
9 3
,743
(12,
647)
305
,917
Pro
per
ty e
xpen
ses
and
out
go
ing
s (1
6,16
7) –
–
–
(1
6,167
) (2
06)
(1,6
05)
(622
) 7
94
(17,8
06)
Sto
rag
e ex
pen
ses
–
–
–
(15,
981)
(15,9
81)
–
–
–
–
(15,9
81)
Ho
tel e
xpen
ses
(1,8
20)
–
–
–
(1,8
20)
(37,
108)
–
–
–
(38,9
28)
Dep
reci
atio
n, a
mo
rtis
atio
n an
d im
pai
rmen
t exp
ense
(2,1
61)
–
–
(260
) (2
,421
) (4
,059
) (4
47)
(72)
–
(6,99
9)C
ost
of i
nven
tory
sal
es (6
,551
) –
(4
1,62
5) –
(4
8,176
) –
–
–
–
(4
8,176
)A
dm
inis
trat
ive
and
oth
er e
xpen
ses
(9,8
19)
(2,4
14)
(4,3
64)
(5,4
54)
(22,
051)
(1,5
79)
(534
) (3
60)
(2,8
44)
(27,3
68)
Segm
ent r
esul
t 6
4,137
16
,614
30,
403
24,4
07
136,
605
10,8
89
15,17
3 2
,689
(1
4,69
7) 15
0,65
9 ^
Incl
udes
fair
valu
e lo
ss o
f $4.
1 m
illio
n.For
per
sona
l use
onl
y

83 annual report 2013
NOTE
S TO
THE
FINA
NCIA
L ST
ATEM
ENTS
30
JuNE
201
3 CO
NTIN
uED
5. S
EGM
ENT
INFO
RMAT
ION
(CON
TINU
ED)
CO
RE
SEG
MEN
TSN
ON
CO
RE
SEG
MEN
TS
Y EA
R EN
DED
30
JUN
E 20
13PR
OPE
RT
y $ ’
000
FuN
DS
MA
NA
GEM
ENT
$’00
0
PRO
PER
Ty
VEN
TuR
ES
$’00
0ST
OR
AG
E
$’00
0
TOTA
L C
ORE
SE
GM
ENTS
$’
000
AH
F $’
000
AD
IFII
$’00
0A
MSH
T $’
000
UN
ALL
OC
ATE
D/
E LIM
INA
TIO
NS
$’00
0C
ON
SOLI
DA
TED
$’
000
Loss
on
cons
olid
atio
n* (1
8,943
) –
–
–
–
(1
8,943
)N
et c
hang
e in
fair
valu
e of
der
ivat
ives
(3,61
2) 9
1
,704
7
46
–
(1,15
3)Fi
nanc
e co
sts
(38,
318)
(10,
270)
(11,
899)
(4,0
72)
8,3
15
(56,
244)
Profi
t / (l
oss
) bef
ore
tax
75,73
2 6
28
4,9
78
(637
) (6
,382
) 74
,319
In
com
e ta
x b
enefi
t / (e
xpen
se)
(5,78
6) (8
91)
(162
) –
–
(6
,839
)Ne
t pro
fit /
(loss
) for
the
year
69,9
46
(263
) 4
,816
(6
37)
(6,3
82)
67,4
80
less
no
n-co
ntro
lling
inte
rest
(1,5
95)
(5,2
78)
–
445
–
(6
,428
)
Net p
rofit
/ (lo
ss) f
or th
e ye
ar at
tribu
tabl
e to
mem
bers
of
the
Grou
p 6
8,35
1 (5
,541
) 4
,816
(1
92)
(6,3
82)
61,0
52
* A
WLF
was
co
nso
lidat
ed b
y th
e G
roup
on
30 J
une
2013
. Acc
ord
ing
ly t
he G
roup
has
no
t rec
ord
ed a
ny in
com
e an
d e
xpen
ses
of t
he F
und
for t
he y
ear e
nded
30
June
201
3.
For
per
sona
l use
onl
y

84 abacus property group
NOTE
S TO
THE
FINA
NCIA
L ST
ATEM
ENTS
30
JuNE
201
3 CO
NTIN
uED
5. S
EGM
ENT
INFO
RMAT
ION
(CON
TINU
ED)
CO
RE
SEG
MEN
TSN
ON
CO
RE
SEG
MEN
TS
YEA
R EN
DED
30
JUN
E 20
12PR
OPE
RT
y $’
000
FuN
DS
MA
NA
GEM
ENT
$’00
0
PRO
PER
Ty
VEN
TuR
ES
$’00
0ST
OR
AG
E* $’
000
TOTA
L C
ORE
SE
GM
ENTS
$’
000
AH
F $’
000
ASF
$’
000
AD
IFII
$’00
0A
MSH
T $’
000
UN
ALL
OC
ATE
D/
ELIM
INA
TIO
NS
$’00
0C
ON
SOLI
DA
TED
$’
000
Reve
nue
Rent
al in
com
e 7
6,48
5 –
–
–
76
,485
1
,337
–
1
8,11
1 5
,573
–
10
1,506
St
ora
ge
inco
me
1,8
64
–
–
17,
013
18,8
77
–
28,
216
–
–
–
47,0
93
Ho
tel i
nco
me
2,6
25
–
–
–
2,6
25
49,
386
–
–
–
–
52,
011
Fina
nce
inco
me
1,3
16
–
26,
635
–
27,9
51
–
–
–
–
(1,3
16)
26,
635
Fund
s m
anag
emen
t inc
om
e –
1
9,50
3 –
–
19
,503
–
–
–
–
(1
2,99
4) 6
,509
Net
cha
nge
in fa
ir va
lue
of in
vest
men
t pro
per
ties
der
eco
gni
sed
9,8
69
–
–
–
9,86
9 –
–
(4
13)
–
–
9,45
6
Net
cha
nge
in fa
ir va
lue
of in
vest
men
ts a
nd fi
nanc
ial
inst
rum
ents
der
eco
gni
sed
–
560
–
(5
0) 51
0 –
–
–
–
(6
42)
(132
)
Net
cha
nge
in fa
ir va
lue
of in
vest
men
ts a
nd fi
nanc
ial
inst
rum
ents
hel
d a
t bal
ance
dat
e (9
,225
) –
7
0 2
,290
(6
,865
) 4
,317
1
,603
9
,750
4
23
(12,
707)
(3,4
79)
Shar
e of
pro
fit fr
om
eq
uity
acc
oun
ted
inve
stm
ents
4,8
06
2,0
69
82
–
6,95
7 –
–
–
–
4
22
7,37
9 O
ther
reve
nue
5
942
6
–
9
53
–
675
–
–
(9
42)
686
O
ther
una
lloca
ted
reve
nue
1,85
4 3
41
63
50
54
2,3
62
Tota
l con
solid
ated
reve
nue
87,7
45
23,
074
26,
793
19,2
53
158,
719
55,
381
30,
557
27,4
98
6,0
50
(28,1
79)
250
,026
Pro
per
ty e
xpen
ses
and
out
go
ing
s (1
6,23
7) –
–
–
(1
6,23
7) (3
42)
14
(1,4
85)
(826
) 7
53
(18,1
23)
Sto
rag
e ex
pen
ses
(753
) –
–
(5
,815
) (6
,568
) –
(9
,842
) –
–
–
(1
6,41
0)H
ote
l exp
ense
s (3
,018
) –
–
–
(3
,018
) (3
6,99
2) –
–
–
–
(4
0,01
0)D
epre
ciat
ion,
am
ort
isat
ion
and
imp
airm
ent e
xpen
se (2
,835
) –
–
(1
16)
(2,95
1) (4
,134
) (1
40)
(388
) (1
87)
–
(7,8
00)
Ad
min
istr
ativ
e an
d o
ther
exp
ense
s (9
,124
) (4
,915
) (5
,489
) (1
,467
) (2
0,995
) (1
,723
) (1
,226
) (3
60)
(362
) (1
,652
) (2
6,31
8)Se
gmen
t res
ult
55,7
78
18,15
9 2
1,304
11
,855
10
8,950
12,19
019
,363
25,
265
4,67
5 (2
9,078
) 14
1,365
*
com
men
ced
in M
arch
201
2 fo
llow
ing
the
mer
ger
of A
bac
us S
tora
ge
Fund
wit
h A
bac
us P
rop
erty
Gro
up.
For
per
sona
l use
onl
y

85 annual report 2013
NOTE
S TO
THE
FINA
NCIA
L ST
ATEM
ENTS
30
JuNE
201
3 CO
NTIN
uED
5. S
EGM
ENT
INFO
RMAT
ION
(CON
TINU
ED)
CO
RE
SEG
MEN
TSN
ON
CO
RE
SEG
MEN
TS
Y EA
R EN
DED
30
JUN
E 20
12PR
OPE
RT
y $ ’
000
FuN
DS
MA
NA
GEM
ENT
$’00
0
PRO
PER
Ty
VEN
TuR
ES
$’00
0ST
OR
AG
E
$’00
0
TOTA
L C
ORE
SE
GM
ENTS
$’
000
AH
F $’
000
ASF
$’
000
AD
IFII
$’00
0A
MSH
T $’
000
UN
ALL
OC
ATE
D/
E LIM
INA
TIO
NS
$’00
0C
ON
SOLI
DA
TED
$’
000
Imp
airm
ent c
harg
e –
rela
ted
par
ty (3
,507
) –
–
–
–
–
(3
,507
)N
et c
hang
e in
fair
valu
e of
der
ivat
ives
(35,
205)
(10,
684)
(2,9
98)
(4,5
55)
(873
) –
(5
4,31
5)Fi
nanc
e co
sts
(43,
860)
(11,
308)
(11,
698)
(12,
653)
(4,3
17)
10,
793
(73,
043)
Profi
t / (l
oss
) bef
ore
tax
26,
378
(9,8
02)
4,6
67
8,0
57
(515
) (1
8,28
5) 10
,500
In
com
e ta
x b
enefi
t / (e
xpen
se)
(1,18
5) 8
(8
90)
(407
) –
–
(2
,474
)Ne
t pro
fit /
(loss
) for
the
year
25,1
93
(9,79
4) 3
,777
7,
650
(515
) (1
8,28
5) 8
,026
le
ss n
on-
cont
rolli
ng in
tere
st (6
90)
3,8
74
(3,0
98)
–
358
–
4
44
Net p
rofit
/ (lo
ss) f
or th
e ye
ar at
tribu
tabl
e
to m
embe
rs o
f the
Gro
up 2
4,50
3 (5
,920)
679
7,65
0 (1
57)
(18,
285)
8,4
70
For
per
sona
l use
onl
y

86 abacus property group
NOTE
S TO
THE
FINA
NCIA
L ST
ATEM
ENTS
30
JuNE
201
3 CO
NTIN
uED
5. S
EGM
ENT
INFO
RMAT
ION
(CON
TINU
ED)
CO
RE
SEG
MEN
TSN
ON
CO
RE
SEG
MEN
TS
YEA
R EN
DED
30
JUN
E 20
13PR
OPE
RT
y $’
000
FuN
DS
MA
NA
GEM
ENT
$’00
0
P RO
PER
Ty
VEN
TuR
ES
$’00
0ST
OR
AG
E
$’00
0u
NA
LLO
CA
TED
$’
000
TOTA
L $’
000
AH
F $’
000
AD
IFII
$’00
0A
MSH
T $’
000
AW
LF*
$’00
0EL
IMIN
ATI
ON
S $’
000
CO
NSO
LID
ATE
D
$’00
0
Cur
rent
ass
ets
110
,671
–
6
7,17
9 –
4
6,42
8 2
24,2
78
15,
758
6,6
89
62,
214
10,
978
(745
) 31
9,172
N
on-
curr
ent a
sset
s
Inve
stm
ent p
rop
ertie
s 6
69,2
97
–
–
371
,558
–
1,0
40,8
55
–
180
,540
–
–
–
1,
221,3
95
Inve
nto
ry –
–
7
2,90
5 –
–
72
,905
–
–
–
21,
072
(2,0
35)
91,9
42
Pro
per
ty, p
lant
& e
qui
pm
ent
4,6
90
–
–
1,7
78
–
6,4
68
145
,620
–
–
1
2 –
15
2,100
O
ther
136
,463
1
35,8
92
184
,512
–
4
1,21
1 4
98,0
78
3,0
62
110
–
–
(1
58,0
59)
343
,191
Tota
l ass
ets
921
,121
135,
892
324
,596
3
73,3
36
87,6
39 1
,842
,584
16
4,44
0 18
7,339
6
2,21
4 3
2,06
2 (1
60,8
39)
2,12
7,800
Cur
rent
liab
ilitie
s 1
3,35
7 1
3,96
8 3
1,82
6 8
,016
4
0,68
2 10
7,849
6
7,79
0 3
5,38
8 3
5,68
2 1
73
–
246
,882
N
on-
curr
ent l
iab
ilitie
s 5
68
35,
376
253
3
16
603
,773
6
40,2
86
117
,798
1
50,7
58
20,
348
48,
053
(224
,145
) 75
3,09
8 To
tal li
abilit
ies 13
,925
49,3
44
32,
079
8,3
32
644
,455
74
8,135
18
5,58
8 18
6,146
5
6,03
0 4
8,22
6 (2
24,14
5) 9
99,98
0 Ne
t ass
ets
907
,196
86,
548
292
,517
365
,004
(5
56,8
16)
1,094
,449
(2
1,148
) 1,
193
6,18
4 (1
6,164
) 6
3,30
6 1,
127,8
20
* A
WLF
was
co
nso
lidat
ed b
y th
e G
roup
on
30 J
une
2013
.T
he p
rese
ntat
ion
of t
he c
ore
seg
men
ts re
flect
s th
e ad
just
men
ts a
risi
ng fr
om
the
ad
op
tio
n o
f AA
SB10
and
is c
ons
iste
nt w
ith
the
rep
ort
ing
to t
he C
OD
M.
For
per
sona
l use
onl
y

87 annual report 2013
NOTE
S TO
THE
FINA
NCIA
L ST
ATEM
ENTS
30
JuNE
201
3 CO
NTIN
uED
5. S
EGM
ENT
INFO
RMAT
ION
(CON
TINU
ED)
CO
RE
SEG
MEN
TSN
ON
CO
RE
SEG
MEN
TS
YEA
R EN
DED
30
JUN
E 20
12PR
OPE
RT
y $’
000
FuN
DS
MA
NA
GEM
ENT
$’00
0
P RO
PER
Ty
VEN
TuR
ES
$’00
0ST
OR
AG
E
$’00
0u
NA
LLO
CA
TED
$’
000
TOTA
L $’
000
AH
F $’
000
AD
IFII
$’00
0A
MSH
T $’
000
ELIM
INA
TIO
NS
$’00
0C
ON
SOLI
DA
TED
$’
000
Cur
rent
ass
ets
132
,996
–
1
9,26
7 –
5
3,34
1 2
05,6
04
27,
326
17,
207
63,
365
–
313,
502
No
n-cu
rren
t ass
ets
Inve
stm
ent p
rop
ertie
s 6
52,9
97
–
–
357
,761
–
1,0
10,75
8 –
1
70,4
45
–
–
1,18
1,203
In
vent
ory
25,
310
–
75,
664
–
–
100,9
74
–
–
–
–
100,9
74
Pro
per
ty, p
lant
and
eq
uip
men
t 4
,889
–
–
7
20
–
5,6
09
148
,456
–
–
–
15
4,06
5 O
ther
126
,343
1
58,3
40
160
,218
–
4
5,02
8 4
89,92
9 3
,734
1
7 –
(1
36,6
07)
357
,073
To
tal a
sset
s 94
2,53
5 15
8,34
0 2
55,14
9 3
58,4
81
98,
369
1,81
2,87
4 17
9,516
18
7,669
6
3,36
5 (1
36,6
07)
2,10
6,81
7
Cur
rent
liab
ilitie
s 8
,725
3
,722
4
,962
5
,411
3
0,55
4 5
3,37
4 7
,461
3
,865
8
28
–
65,
528
No
n-cu
rren
t lia
bili
ties
3,1
44
56,
431
10,
367
242
6
18,8
38
689
,022
1
84,9
25
182
,829
5
4,85
9 (1
78,2
38)
933
,397
To
tal li
abilit
ies 11
,869
6
0,153
15
,329
5
,653
6
49,3
92
742,
396
192,
386
186,
694
55,
687
(178
,238
) 9
98,92
5 Ne
t ass
ets
930
,666
9
8,187
2
39,8
20
352
,828
(5
51,0
23) 1
,070
,478
(1
2,87
0) 9
75
7,67
8 41
,631
1,
107,8
92
The
prio
r yea
r has
bee
n re
stat
ed fo
r com
para
bilit
y with
curre
nt ye
ar
For
per
sona
l use
onl
y

88 abacus property group
NOTES TO THE FINANCIAL STATEMENTS 30 JUNE 2013CONTINUED
6. REVENUE
2013 $’000
2012 $’000
(a) Finance income
Interest and fee income on secured loans 20,367 15,635
Sale of joint venture profit share rights – 11,000
Bank interest 1,354 2,362
Total finance income 21,721 28,997
(b) Funds management income
Asset / property management fees 3,977 3,002
Interest on loans 3,532 3,507
Total funds management income 7,509 6,509
(c) Net change in fair value of investments held at balance date
Net change in fair value of property securities held at balance date (73) (280)
Net change in fair value of options held at balance date 4,130 503
Net change in fair value of other investments held at balance date 1,352 (1,467)
Total change in fair value of investments held at balance date 5,409 (1,244)
For
per
sona
l use
onl
y

89 annual report 2013
7. ExPENSES
2013 $’000
2012 $’000
(a) Depreciation, amortisation and impairment expense
Depreciation and amortisation of property, plant and equipment and software 4,559 4,728
Net loss on property, plant and equipment remeasured at fair value (24) 688
Impairment of intangible assets – 12
Amortisation – leasing costs 2,464 2,372
Total depreciation, amortisation and impairment expense 6,999 7,800
(b) Cost of inventory sales
Acquisition and holdings costs 35,800 –
Additional development costs* 12,376 –
Total cost of inventory sales 48,176 – * co-owner contribution to the Lewisham residential development
(c) Finance costs
Interest on loans 51,631 66,229
Amortisation of finance costs 4,613 4,756
Finance costs incurred in the merger with Abacus Storage Fund – 2,058
Total finance costs 56,244 73,043
(d) Administrative and other expenses
Wages and salaries 13,976 11,363
Contributions to defined contribution plans 776 753
Other expenses 12,616 14,202
Total administrative and other expenses 27,368 26,318
For
per
sona
l use
onl
y

90 abacus property group
NOTES TO THE FINANCIAL STATEMENTS 30 JUNE 2013CONTINUED
8. INCOME TAx
2013 $’000
2012 $’000
(a) Income tax expense
The major components of income tax expense are:
Income StatementCurrent income tax
Current income tax charge 5,861 1,831
Adjustments in respect of current income tax of previous years 2,076 (123)
Deferred income tax
Movement in depreciable assets tax depreciation – 201
Relating to origination and reversal of temporary differences (1,098) 565
Income tax expense reported in the income statement 6,839 2,474
(b) Numerical reconciliation between aggregate tax expense
recognised in the income statement and tax expense
calculated per the statutory income tax rate
A reconciliation between tax expense and the product of the
accounting profit before income tax multiplied by the
Group's applicable income tax rate is as follows:
Profit before income tax expense 74,319 10,500
Prima facie income tax expense calculated at 30% (Au) 22,153 2,743
Prima facie income tax expense calculated at 28% (NZ) 143 380
Less prima facie income tax expense on profit from Trusts (18,124) (1,541)
Prima Facie income tax of entities subject to income tax 4,171 1,582
Adjustment of prior year tax applied 2,076 (123)
Derecognition of deferred tax assets 1,000 857
Entertainment 19 21
Foreign exchange translation adjustments 34 (51)
Franked dividends (175) –
Other items (net) (286) 188
Income tax expense 6,839 2,474
Income tax expense reported in the consolidated income statement 6,839 2,474 The Group has capital tax losses for which no deferred tax asset is recognised on the balance sheet of gross $7.21 million (2012: $6.82 million), which are available indefinitely for offset against future gains subject to continuing to meet relevant statutory tests.
For
per
sona
l use
onl
y

91 annual report 2013
8. INCOME TAx (CONTINUED)
2013 $’000
2012 $’000
(c) Recognised deferred tax assets and liabilities
Deferred income tax at 30 June 2013 relates to the following:
Deferred tax liabilitiesRevaluation of investment properties at fair value 9,356 7,317
Revaluation of financial instruments at fair value 1,092 2,123
Revaluation of property, plant and equipment – 229
Reset of tax cost bases 1,048 1,048
Other 1,185 871
Gross deferred income tax liabilities 12,681 11,588
Set off of deferred tax assets (2,369) (1,405)
Net deferred income tax liabilities 10,312 10,183
Deferred tax assets
Revaluation of financial instruments at fair value 2,408 5,355
Provisions – other 8,343 5,387
Provisions – employee entitlements 1,060 1,028
Derecognition of deferred tax asset (1,000) –
Losses available for offset against future taxable income 2,958 5,791
Other 523 164
Gross deferred income tax assets 14,292 17,725
Set off of deferred tax assets (2,369) (1,405)
Net deferred income tax assets 11,923 16,320
Unrecognised temporary differencesAt 30 June 2013, the Group has unrecognised deferred tax assets on capital account in relation to the fair value of investments ($1.1 million gross) (2012: $1.2 million) and fair value of investment properties ($3.6 million gross) (2012: $3.8 million).
Tax consolidationAGHL and its 100% owned Australian resident subsidiaries, ASOL and its 100% owned Australian resident subsidiaries and AHL and its 100% owned Australian resident subsidiaries have formed separate tax consolidated groups. AGHL, ASOL and AHL are the head entity of their respective tax consolidated groups. The head entity and the controlled entities in the tax consolidated group continue to account for their own current and deferred tax amounts. The current and deferred tax amounts are measured in a manner that is consistent with the broad principles in AASB 112 Income Taxes. The nature of the tax funding agreement is discussed further below.
Nature of the tax funding agreementMembers of the respective tax consolidated groups have entered into tax funding agreements. The tax funding agreements require payments to/from the head entity to be recognised via an inter-entity receivable (payable) which is at call. To the extent that there is a difference between the amount allocated under the tax funding agreement and the allocation under uIG 1052, the head entity accounts for these as equity transactions.
The amounts receivable or payable under the tax funding agreements are due upon receipt of the funding advice from the head entity, which is issued as soon as practicable after the end of each financial year. The head entity may also require payment of interim funding amounts to assist with its obligations to pay tax instalments.
For
per
sona
l use
onl
y

92 abacus property group
NOTES TO THE FINANCIAL STATEMENTS 30 JUNE 2013CONTINUED
9. DISTRIBUTIONS PAID AND PROPOSED
Abacus Property Group*2013
$’0002012
$’000
(a) Distributions paid during the year
June 2012 half: 8.25 cents per stapled security (2011: 8.25 cents) 35,886 31,217
December 2012 half: 8.25 cents per stapled security (2011: 8.25 cents) 36,702 31,963
72,588 63,180
(b) Distributions proposed and not recognised as a liability^
June 2013 half: 8.25 cents per stapled security (2012: 8.25 cents) 37,376 35,886
Distributions were paid from Abacus Trust and Abacus Income Trust (which do not pay tax provided they distribute all their taxable income) hence, there were no franking credits attached.
* Excludes Abacus Hospitality Fund, Abacus Diversified Income Fund II, Abacus Miller Street Holding Trust and Abacus Wodonga Land Fund.
^ The final distribution of 8.25 cents per stapled security was declared on 1 July 2013. The distribution being paid on or about 15 August 2013 will be approximately $37.4 million. No provision for the distribution has been recognised in the balance sheet at 30 June 2013 as the distribution had not been declared by the end of the year.
Abacus Hospitality Fund2013
$’0002012
$’000
(a) Distributions paid during the year
June 2012 quarter: 1.125 cents per security (2011: 1.125 cents) 552 551
September 2012 quarter: 1.125 cents per security (2011: 1.125 cents) 556 551
December 2012 quarter: 1.125 cents per security (2011: 1.125 cents) 552 551
March 2013 quarter: 0.500 cents per security (2012: 1.125 cents) 248 551
1,908 2,204
(b) Distributions proposed and recognised as a liability
June 2013 quarter: 0.500 cents per stapled security (2012: 1.125 cents) 248 551
Abacus Miller Street Holding Trust2013
$’0002012
$’000
(a) Distributions paid during the yearJune 2012 quarter: 1.125 cents per unit (2011: Nil cents) 214 –
September 2012 quarter: 1.125 cents per unit (2011: 1.125 cents) 214 214
December 2012 quarter: 1.125 cents per unit (2011: 1.125 cents) 214 214
March 2013 quarter: 1.125 cents per unit (2012: 1.125 cents) 214 214
856 642
(b) Distributions proposed and recognised as a liability
June 2013 quarter: 1.125 cents per unit (2012: 1.125 cents) 214 214
For
per
sona
l use
onl
y
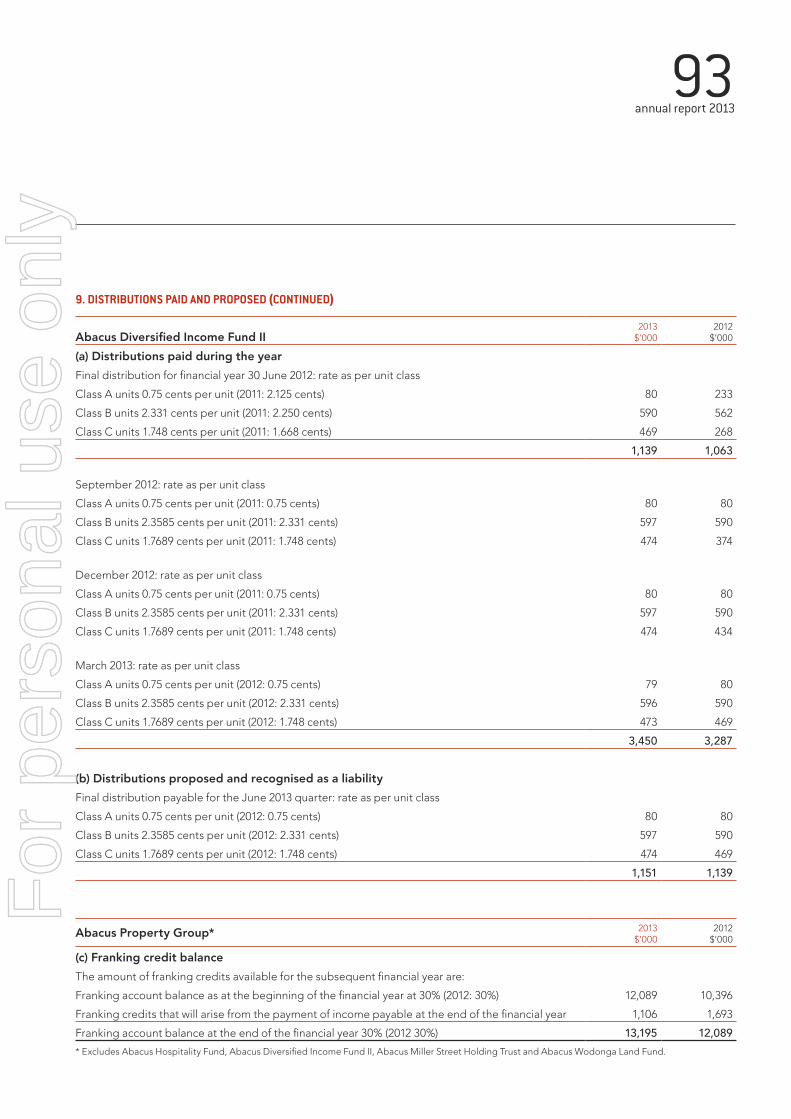
93 annual report 2013
9. DISTRIBUTIONS PAID AND PROPOSED (CONTINUED)
Abacus Diversified Income Fund II2013
$’0002012
$’000
(a) Distributions paid during the year
Final distribution for financial year 30 June 2012: rate as per unit class
Class A units 0.75 cents per unit (2011: 2.125 cents) 80 233
Class B units 2.331 cents per unit (2011: 2.250 cents) 590 562
Class C units 1.748 cents per unit (2011: 1.668 cents) 469 268
1,139 1,063
September 2012: rate as per unit class
Class A units 0.75 cents per unit (2011: 0.75 cents) 80 80
Class B units 2.3585 cents per unit (2011: 2.331 cents) 597 590
Class C units 1.7689 cents per unit (2011: 1.748 cents) 474 374
December 2012: rate as per unit class
Class A units 0.75 cents per unit (2011: 0.75 cents) 80 80
Class B units 2.3585 cents per unit (2011: 2.331 cents) 597 590
Class C units 1.7689 cents per unit (2011: 1.748 cents) 474 434
March 2013: rate as per unit class
Class A units 0.75 cents per unit (2012: 0.75 cents) 79 80
Class B units 2.3585 cents per unit (2012: 2.331 cents) 596 590
Class C units 1.7689 cents per unit (2012: 1.748 cents) 473 469
3,450 3,287
(b) Distributions proposed and recognised as a liability
Final distribution payable for the June 2013 quarter: rate as per unit class
Class A units 0.75 cents per unit (2012: 0.75 cents) 80 80
Class B units 2.3585 cents per unit (2012: 2.331 cents) 597 590
Class C units 1.7689 cents per unit (2012: 1.748 cents) 474 469
1,151 1,139
Abacus Property Group* 2013 $’000
2012 $’000
(c) Franking credit balance
The amount of franking credits available for the subsequent financial year are:
Franking account balance as at the beginning of the financial year at 30% (2012: 30%) 12,089 10,396
Franking credits that will arise from the payment of income payable at the end of the financial year 1,106 1,693
Franking account balance at the end of the financial year 30% (2012 30%) 13,195 12,089 * Excludes Abacus Hospitality Fund, Abacus Diversified Income Fund II, Abacus Miller Street Holding Trust and Abacus Wodonga Land Fund.
For
per
sona
l use
onl
y

94 abacus property group
NOTES TO THE FINANCIAL STATEMENTS 30 JUNE 2013CONTINUED
10. EARNINGS PER STAPLED SECURITY
2013 $’000
2012 $’000
Basic and diluted earnings per stapled security (cents) 13.68 2.11
Reconciliation of earnings used in calculating earnings per stapled securityBasic and diluted earnings per stapled security
Net profit 61,052 8,470
Weighted average number of stapled securities:Weighted average number of stapled securities for basic earning per security 446,427 400,921
11. CASH AND CASH EQUIVALENTS
2013 $’000
2012 $’000
Reconciliation to Cash Flow StatementFor the purposes of the Cash Flow Statement, cash and
cash equivalents comprise the following at 30 June 2013:
Cash at bank and in hand(i) 44,822 54,129
(i) Cash at bank earns interest at floating rates. The carrying amounts of cash and cash equivalents represent fair value.
(a) Reconciliation of net profit after tax to net cash flows from operations
Net profit 67,480 8,026
Adjustments for:Depreciation and amortisation of non-current assets 6,999 7,800
Provision for doubtful debts 1,060 348
Diminution of inventory – 1,500
Restructuring charge – related parties – 3,507
Loss on consolidation 18,943 –
Net change in fair value of derivatives 1,153 54,315
Net change in fair value of investment properties held at balance date (497) 2,235
Net change in fair value of investments held at balance date (5,409) 1,244
Net change in fair value of investment properties derecognised (1,973) (9,456)
Net change in fair value of investments and financial instruments derecognised (6,854) (132)
Increase/(decrease) in payables 17,768 (2,518)
Increase/(decrease) in unearned revenue 14,750 –
(Increase)/decrease in inventories 48,176 –
(Increase)/decrease in receivables and other assets 7,234 19,381
Net cash from operating activities 168,830 86,250
(b) Disclosure of financing facilitiesRefer to note 20d.
(c) Disclosure of non-cash financing activitiesNon-cash financing activities include capital raised pursuant to APG’s distribution reinvestment plan. During the year 18.6 million stapled securities were issued with a cash equivalent of $36.6 million.
For
per
sona
l use
onl
y

95 annual report 2013
12. TRADE AND OTHER RECEIVABLES
2013 $’000
2012 $’000
(a) Current
Trade debtors 645 935
Other debtors 20,913 13,549
Gross receivables 21,558 14,484
Less provision for doubtful debts (1,998) (2,566)
Net current receivables 19,560 11,918
(b) Non-current
Other debtors 6,897 6,212
Non-current receivables 6,897 6,212
13. PROPERTY LOANS AND OTHER FINANCIAL ASSETS
2013 $’000
2012 $’000
(a) Current property loans
Secured loans – amortised cost(i) 2,047 17,713
Interest receivable on secured loans – amortised cost 405 1,385
2,452 19,098
(b) Current other financial assets
Investments in securities – listed – fair value – 168
Other financial assets – fair value(ii) – 7,885
– 8,053
(c) Non-current property loans
Secured loans – amortised cost(i) 116,404 137,938
Interest receivable on secured loans – amortised cost 21,966 16,820
138,370 154,758
(d) Non-current other financial assets
Investments in securities – unlisted – fair value 4,642 4,489
Other financial assets – fair value(ii) 23,640 20,000
28,282 24,489 (i) Mortgages are secured by real property assets. The current facilities are scheduled to mature and are expected to be realised on or before 30 June 2014
and the non-current facilities will mature between 1 July 2014 and 24 December 2018. For 30 June 2012, an amount of $33.1 million relates to a loan to Abacus Wodonga Land Fund, a related party, which consolidated into the Group on 30 June 2013.
(ii) Abacus enters into loans and receivables with associated options that provide for a variety of outcomes including repayment of principal and interest, satisfaction through obtaining interests in equity or property or combinations thereof. At the end of the period, the maximum exposure to credit risk in relation to these instruments was $23.6 million (2012: $27.9 million).
For
per
sona
l use
onl
y
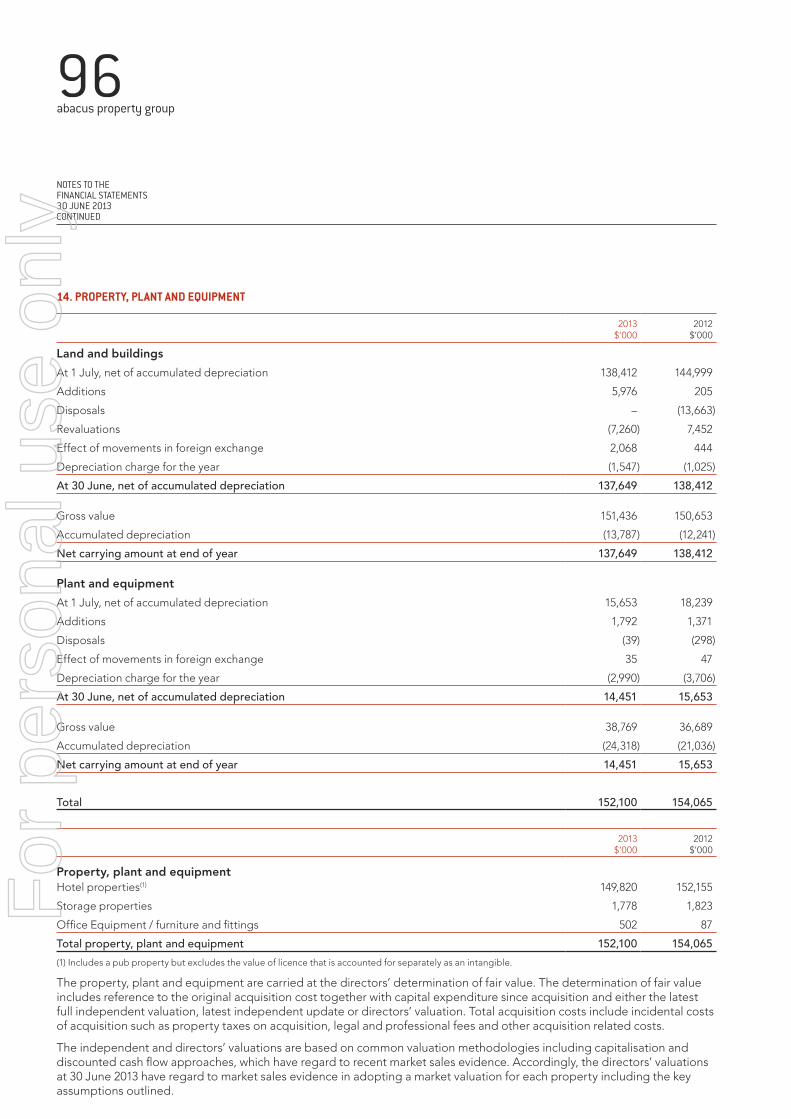
96 abacus property group
NOTES TO THE FINANCIAL STATEMENTS 30 JUNE 2013CONTINUED
14. PROPERTY, PLANT AND EQUIPMENT
2013 $’000
2012 $’000
Land and buildings
At 1 July, net of accumulated depreciation 138,412 144,999
Additions 5,976 205
Disposals – (13,663)
Revaluations (7,260) 7,452
Effect of movements in foreign exchange 2,068 444
Depreciation charge for the year (1,547) (1,025)
At 30 June, net of accumulated depreciation 137,649 138,412
Gross value 151,436 150,653
Accumulated depreciation (13,787) (12,241)
Net carrying amount at end of year 137,649 138,412
Plant and equipment
At 1 July, net of accumulated depreciation 15,653 18,239
Additions 1,792 1,371
Disposals (39) (298)
Effect of movements in foreign exchange 35 47
Depreciation charge for the year (2,990) (3,706)
At 30 June, net of accumulated depreciation 14,451 15,653
Gross value 38,769 36,689
Accumulated depreciation (24,318) (21,036)
Net carrying amount at end of year 14,451 15,653
Total 152,100 154,065
2013 $’000
2012 $’000
Property, plant and equipmentHotel properties(1) 149,820 152,155
Storage properties 1,778 1,823
Office Equipment / furniture and fittings 502 87
Total property, plant and equipment 152,100 154,065 (1) Includes a pub property but excludes the value of licence that is accounted for separately as an intangible.
The property, plant and equipment are carried at the directors’ determination of fair value. The determination of fair value includes reference to the original acquisition cost together with capital expenditure since acquisition and either the latest full independent valuation, latest independent update or directors’ valuation. Total acquisition costs include incidental costs of acquisition such as property taxes on acquisition, legal and professional fees and other acquisition related costs.
The independent and directors’ valuations are based on common valuation methodologies including capitalisation and discounted cash flow approaches, which have regard to recent market sales evidence. Accordingly, the directors’ valuations at 30 June 2013 have regard to market sales evidence in adopting a market valuation for each property including the key assumptions outlined.
For
per
sona
l use
onl
y
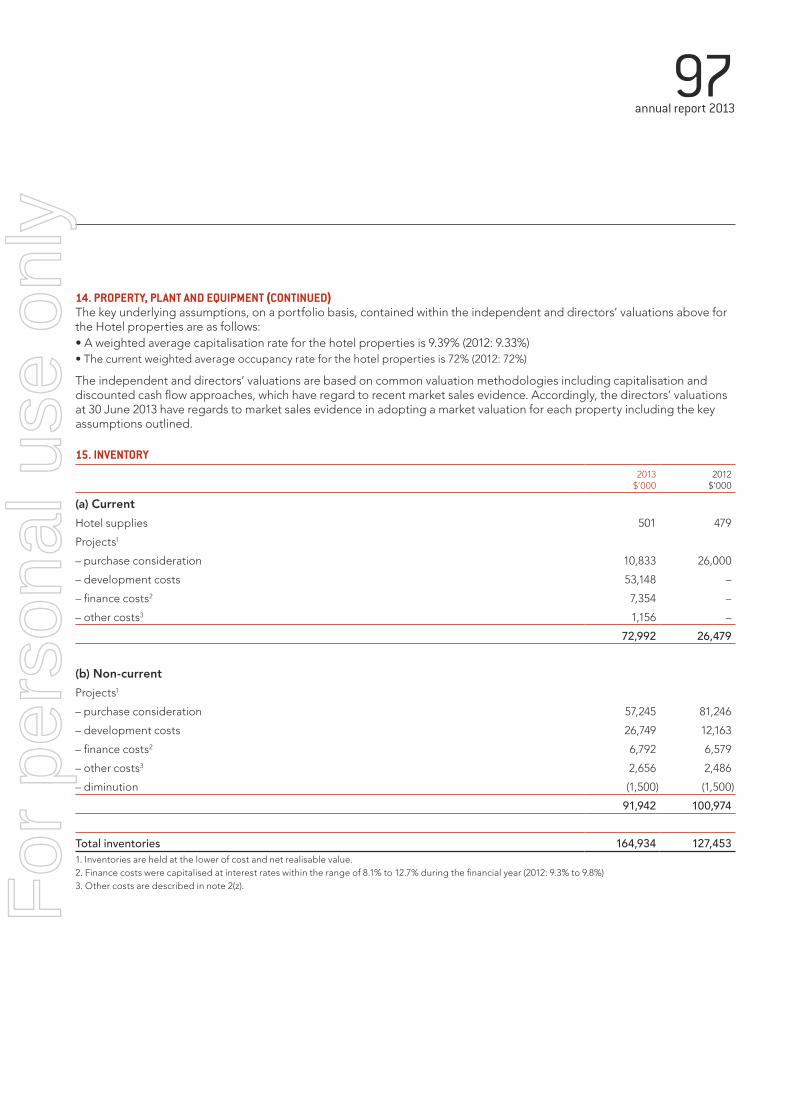
97 annual report 2013
14. PROPERTY, PLANT AND EQUIPMENT (CONTINUED)The key underlying assumptions, on a portfolio basis, contained within the independent and directors’ valuations above for the Hotel properties are as follows:• A weighted average capitalisation rate for the hotel properties is 9.39% (2012: 9.33%)• The current weighted average occupancy rate for the hotel properties is 72% (2012: 72%)
The independent and directors’ valuations are based on common valuation methodologies including capitalisation and discounted cash flow approaches, which have regard to recent market sales evidence. Accordingly, the directors’ valuations at 30 June 2013 have regards to market sales evidence in adopting a market valuation for each property including the key assumptions outlined.
15. INVENTORY2013
$’0002012
$’000
(a) Current
Hotel supplies 501 479
Projects1
– purchase consideration 10,833 26,000
– development costs 53,148 –
– finance costs2 7,354 –
– other costs3 1,156 –
72,992 26,479
(b) Non-current
Projects1
– purchase consideration 57,245 81,246
– development costs 26,749 12,163
– finance costs2 6,792 6,579
– other costs3 2,656 2,486
– diminution (1,500) (1,500)
91,942 100,974
Total inventories 164,934 127,453 1. Inventories are held at the lower of cost and net realisable value.2. Finance costs were capitalised at interest rates within the range of 8.1% to 12.7% during the financial year (2012: 9.3% to 9.8%)3. Other costs are described in note 2(z).F
or p
erso
nal u
se o
nly

98 abacus property group
NOTES TO THE FINANCIAL STATEMENTS 30 JUNE 2013CONTINUED
16. INVESTMENT PROPERTIES
2013 $’000
2012 $’000
Investment properties held for sale
Retail 69,710 23,801
Commercial 93,000 144,550
Industrial 13,000 9,220
Other – 13,250
Total investment properties held for sale 175,710 190,821
2013 $’000
2012 $’000
Investment properties
Retail 266,249 296,507
Commercial 362,279 310,395
Industrial 198,083 198,740
Storage 371,558 357,761
Other 23,226 17,800
Total investment properties 1,221,395 1,181,203
Total investment properties including held for sale 1,397,105 1,372,024 The current investment properties represent 12 properties which are either subject to a sales contract or an active sales campaign and are expected to be sold by 30 June 2014.
ReconciliationA reconciliation of the carrying amount of investment properties excluding properties held for sale at the beginning and end of the year is as follows:
2013 $’000
2012 $’000
Carrying amount at beginning of the financial year 1,181,203 1,338,130
Straight lining rental assets – (167)
Additions and capital expenditure 113,133 35,152
Fair value adjustments for properties held at balance date 3,914 (2,263)
Disposals (15,404) (61,636)
Effect of movements in foreign exchange 5,115 368
Properties transferred to held for sale (92,950) (158,621)
Transfers 26,384 30,240
Carrying amount at end of the financial year 1,221,395 1,181,203
Investment properties are carried at the Directors’ determination of fair value. The determination of fair value includes reference to the original acquisition cost together with capital expenditure since acquisition and either the latest full independent valuation, latest independent update or directors’ valuation. Total acquisition costs include incidental costs of acquisition such as property taxes on acquisition, legal and professional fees and other acquisition related costs.
Investment properties are independently valued on a staggered basis every two years unless the underlying financing requires a more frequent independent valuation cycle. The key underlying assumptions, on a portfolio basis, contained within the independent and director valuations above are as follows:
For
per
sona
l use
onl
y

99 annual report 2013
16. INVESTMENT PROPERTIES (CONTINUED)Abacus Property Group*
• A weighted average capitalisation rate for each category is as follows:• Group – 8.67% (2012: 8.69%)• Retail – 7.89% (2012: 8.18%)• Commercial – 8.51% (2012: 8.38%)• Industrial – 9.81% (2012: 9.78%)• Storage – 9.20% (2012: 9.18%)• Other – 7.49% (2012: 8.75%)
• The current occupancy rate for the principal portfolio excluding development and self-storage assets is 92.8% (2012: 94.3%). The current occupancy rate for self-storage assets is 81.8% (2012: 82.8%).
• A weighted average rent review for the 12 months to 30 June 2013 of 4.0% (2012: 3.7%).
During the year ended 30 June 2013, 56% (2012: 62%) of the number of investment properties in the portfolio was subject to external valuations, the remaining 44% (2012: 38%) was subject to internal valuation.
Abacus Diversified Income Fund II• A weighted average capitalisation rate for each category is as follows:
• Commercial – 10.41% (2012: 9.34%)• Industrial – 8.85% (2012: 8.86%)
• The current occupancy rate for the portfolio is 95% (2012: 97%).
• The weighted average lease expiry term is 3.48 years (30 June 2012: 4.08 years).
During the year ended 30 June 2013, 100% of the number of properties in the portfolio was subject to external valuations.
Abacus Miller Street Holding Trust• A capitalisation rate of 8.75% (2012: 8.75%).
• The current occupancy rate of the property is 100% (2012: 98%).
• A weighted average rent review for the 12 months to 30 June 2013 of 4.0% (2012: 4.0%).
The property was externally valued as at 30 June 2013.
The independent and director valuations are based on common valuation methodologies including capitalisation and discounted cash flow approaches, which have regard to recent market sales evidence. Accordingly, the directors’ valuations at 30 June 2013 have regard to market sales evidence in adopting a market valuation for each property including the key assumptions outlined.
The majority of the investment properties are used as security for secured bank debt.
* Excludes Abacus Hospitality Fund, Abacus Diversified Income Fund II, Abacus Miller Street Holding Trust and Abacus Wodonga Land Fund.For
per
sona
l use
onl
y
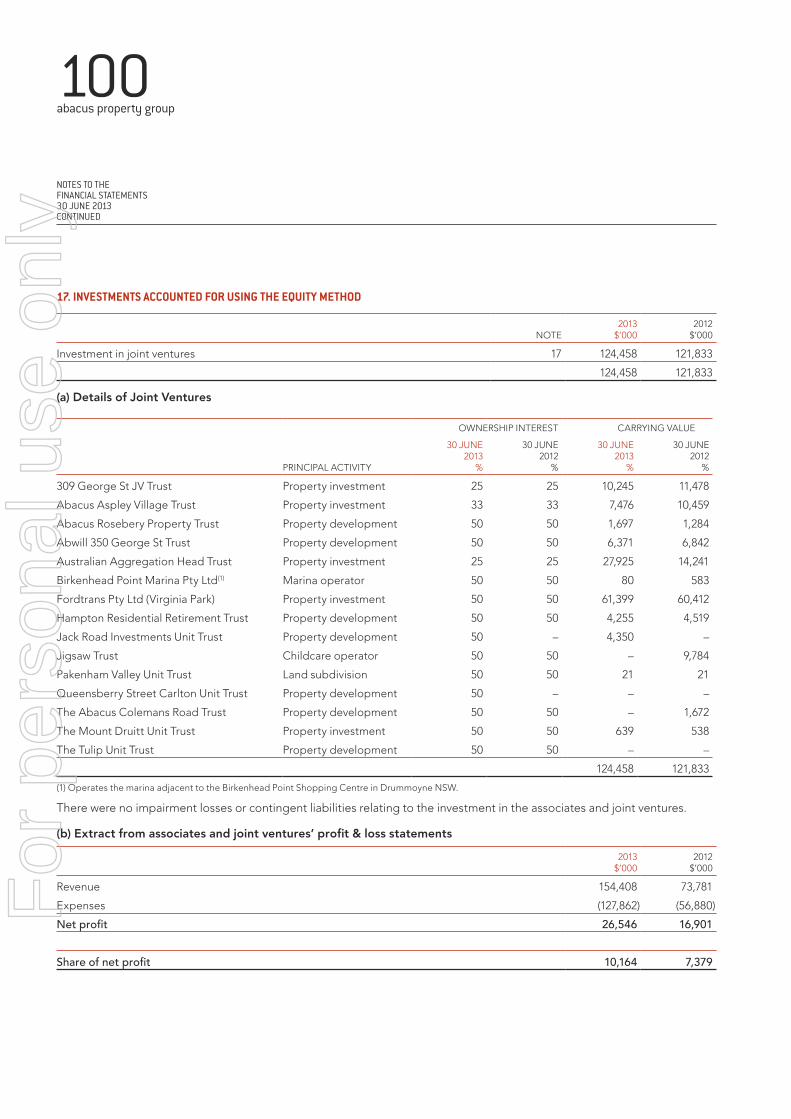
100 abacus property group
NOTES TO THE FINANCIAL STATEMENTS 30 JUNE 2013CONTINUED
17. INVESTMENTS ACCOUNTED FOR USING THE EQUITY METHOD
NOTE2013
$’0002012
$’000
Investment in joint ventures 17 124,458 121,833
124,458 121,833
(a) Details of Joint Ventures
OWNERSHIP INTEREST CARRyING VALuE
PRINCIPAL ACTIVITy
30 JUNE 2013
%
30 JUNE 2012
%
30 JUNE 2013
%
30 JUNE 2012
%
309 George St JV Trust Property investment 25 25 10,245 11,478
Abacus Aspley Village Trust Property investment 33 33 7,476 10,459
Abacus Rosebery Property Trust Property development 50 50 1,697 1,284
Abwill 350 George St Trust Property development 50 50 6,371 6,842
Australian Aggregation Head Trust Property investment 25 25 27,925 14,241
Birkenhead Point Marina Pty Ltd(1) Marina operator 50 50 80 583
Fordtrans Pty Ltd (Virginia Park) Property investment 50 50 61,399 60,412
Hampton Residential Retirement Trust Property development 50 50 4,255 4,519
Jack Road Investments Unit Trust Property development 50 – 4,350 –
Jigsaw Trust Childcare operator 50 50 – 9,784
Pakenham Valley unit Trust Land subdivision 50 50 21 21
queensberry Street Carlton unit Trust Property development 50 – – –
The Abacus Colemans Road Trust Property development 50 50 – 1,672
The Mount Druitt unit Trust Property investment 50 50 639 538
The Tulip unit Trust Property development 50 50 – –
124,458 121,833
(1) Operates the marina adjacent to the Birkenhead Point Shopping Centre in Drummoyne NSW.
There were no impairment losses or contingent liabilities relating to the investment in the associates and joint ventures.
(b) Extract from associates and joint ventures’ profit & loss statements
2013 $’000
2012 $’000
Revenue 154,408 73,781
Expenses (127,862) (56,880)
Net profit 26,546 16,901
Share of net profit 10,164 7,379
For
per
sona
l use
onl
y

101 annual report 2013
17. INVESTMENTS ACCOUNTED FOR USING THE EQUITY METHOD (CONTINUED)(c) Extract from associates and joint ventures’ balance sheets
2013 $’000
2012 $’000
Current assets 41,413 48,492
Non-current assets 572,535 524,846
613,948 573,338
Current liabilities (18,098) (18,485)
Non-current liabilities (239,813) (239,282)
(257,911) (257,767)
Net assets 356,037 315,571
Share of net assets 124,458 121,833
Material investments in joint ventures follows.
Fordtrans Pty Ltd (Virginia Park) (“VP”)The Group has a 50% interest in the ownership and voting rights of Fordtrans Pty Ltd. VP’s principal place of business is in Bentleigh East, Victoria.
VP owns a sizeable Business Park providing a mixture of industrial and office buildings as well as supporting facilities including gymnasium, swim centre, child care centre, children’s play centre, cafe, yoga centre and martial arts centre. The site has recently been enhanced following the purchase of a neighbouring site by the Group that offers expansion potential and residential opportunity.
The Group jointly controls the venture with the other partner under the terms of unitholders Agreement and requires unanimous consent for all major decisions over the relevant activities.
The Group’s share of income (including distributions) for the year ended 30 June 2013 was $4.79 million (2012: $4.54 million).
Summarised Financial InformationSummarised financial information in respect of VP is as follows:
2013 $’000
2012 $’000
Cash & cash equivalents 843 1,134
Other current assets 15,745 11,233
Total current assets 16,588 12,367 Total non-current assets 176,783 176,286 Total assets 193,371 188,653
Other current liabilities 6,188 3,377
Total current liabilities 6,188 3,377
Non-current financial liabilities 64,732 64,389
Total non-current liabilities 64,732 64,389
Total liabilities 70,920 67,766
Net assets 122,451 120,887
For
per
sona
l use
onl
y

102 abacus property group
NOTES TO THE FINANCIAL STATEMENTS 30 JUNE 2013CONTINUED
17. INVESTMENTS ACCOUNTED FOR USING THE EQUITY METHOD (CONTINUED)Fordtrans Pty Ltd (Virginia Park) (“VP”) (continued)Summarised Statement of Comprehensive Income
2013 $’000
2012 $’000
Revenue 16,578 15,559
Interest income 3,416 2,416
Interest expense (4,558) (4,026)
Profit before tax 8,929 8,853 Income tax expense – –
Total comprehensive income 8,929 8,853
18. INTANGIBLE ASSETS AND GOODWILL
2013 $’000
2012 $’000
GoodwillBalance at 1 July 32,461 32,461
Balance at 30 June 32,461 32,461
Licences and entitlementsAt 1 July, net of accumulated amortisation 1,000 2,712
Disposal (200) (1,700)
Impairment – (12)
At 30 June, net of accumulated amortisation 800 1,000
Total goodwill and intangibles 33,261 33,461
Description of the Group’s intangible assets and goodwillGoodwillAfter initial recognition, goodwill acquired in a business combination is measured at cost less any accumulated impairment losses. Goodwill is not amortised but is subject to impairment testing on an annual basis or whenever there is an indication of impairment.
Licences and entitlementsLicences and entitlements represent intangible assets acquired through the acquisition of certain hotel assets. Licences and entitlements essentially relate to gaming and liquor licence rights attaching to the hotel assets. These intangible assets have been determined to have indefinite useful lives and the cost model is utilised for their measurement. These licences and entitlements have been granted for an indefinite period by the relevant government department. This supports the Group’s assertion that these assets have an indefinite useful life. As these licences and entitlements are an integral part of owning a hotel asset, they are subjected to impairment testing on an annual basis or whenever there is an indication of impairment as part of the annual property valuation and review process of the hotels as a going concern.
For
per
sona
l use
onl
y

103 annual report 2013
18. INTANGIBLE ASSETS AND GOODWILL (CONTINUED)Impairment tests for goodwill and intangibles with indefinite useful lives(i) Description of the cash generating units and the other relevant information
Goodwill acquired through business combinations and licences and entitlements have been allocated to two individual cash generating units, each of which is a reportable segment, for impairment testing as follows:• Funds Management – property / asset management business• Property – or specifically the hotel assets
Funds ManagementThe recoverable amount of the Funds Management unit has been determined based on a value in use calculation using cash flow projections as at 30 June 2013 covering a five-year period.
A pre tax discount rate of 9.49% (2012: 9.49%) and a terminal growth rate of 3% (2012: 3%) have been applied to the cash flow projections.
PropertyThe recoverable amount of the indefinite life intangible assets has been determined based on the independent and directors’ valuations of the hotels on a going concern basis. Common valuation methodologies including capitalisation and discounted cash flow approaches are used, with assumptions reference to recent market sales evidence. Accordingly, the directors’ valuations at 30 June 2013 have regards to market sales evidence in adopting a market valuation for each property including the key assumptions outlined.
(ii) Carrying amounts of goodwill, management rights, licences and entitlements allocated to each of the cash generating units
The carrying amounts of goodwill, management rights, licences and entitlements are allocated to Funds Management and Property as follows:
FuNDS MANAGEMENT PROPERTy TOTAL
2013 $’000
2012 $’000
2013 $’000
2012 $’000
2013 $’000
2012 $’000
Goodwill 32,394 32,394 67 67 32,461 32,461
Management rights, licences and entitlements – – 800 1,000 800 1,000
(iii) Key assumptions used in valuation calculations
Funds Management GoodwillThe calculation of value in use is most sensitive to the following assumptions:
a. Fee income
b. Discount rates
c. Property values of the funds/properties under management
Fee income – fee income is based on actual income in the year preceding the start of the budget period and actual funds under management.
Discount rates – discount rates reflect management’s estimate of the time value of money and the risks specific to each unit that are not reflected in the cash flows.
Property values – property values are based on the fair value of properties which are valued on a staggered two year basis by independent valuers.
For
per
sona
l use
onl
y

104 abacus property group
NOTES TO THE FINANCIAL STATEMENTS 30 JUNE 2013CONTINUED
18. INTANGIBLE ASSETS AND GOODWILL (CONTINUED)(iii) Key assumptions used in valuation calculations (continued)
Hotel Intangible AssetsThe calculation of the hotel valuations is most sensitive to the following assumptions:
a. Hotel income
b. Discount rates and capitalisation rates with reference to market sales evidence
c. Other value adding or potential attributes of the hotel asset
Hotel income – hotel income is based on actual income in the year preceding the start of the budget period, adjusted based on industry norms for valuation purposes.
Discount rates and capitalisation rates – these rates reflect the independent valuers’ and management’s estimate of the time value of money and the risks specific to each unit that are not reflected in the cash flows, with reference to recent market sales evidence. The weighted average capitalisation rate used for the hotel valuation at June 2013 was 11.5% (2012: 12.5%).
Other value adding or potential attributes – unique features of individual hotel assets that will add or have the potential to add value to the property in determining the total fair value of the hotel.
(iv) Sensitivity to changes in assumptions
Significant and prolonged property value falls and market influences which could increase discount rates could cause goodwill to be impaired in the future, however, the goodwill valuation as at 30 June 2013 has significant head room thus reasonable changes in the assumptions such as a 1% change in the discount rate or a 10% fall in revenue assumptions would not cause any impairment.
Intangibles have been impaired on the basis that they now represent recoverable amount. A decrease in hotel income or increase in discount rate have already been taken into consideration in the sensitivity of market factors as part of the external valuation.
19. TRADE AND OTHER PAYABLES2013
$’0002012
$’000
(a) Current
Trade creditors 503 962
Other creditors 24,325 13,028
unearned revenue 25,889 –
Rental guarantee 2,785 900
Goods and services tax 1,146 6,907
Accrued expenses 8,665 8,629
63,313 30,426
(b) Non-current
unearned revenue – 10,125
Rental guarantee – 2,600
– 12,725
For
per
sona
l use
onl
y

105 annual report 2013
20. INTEREST BEARING LOANS AND BORROWINGS
2013 $’000
2012 $’000
Abacus Property Group*
CurrentBank loans – A$ 8,600 29,950
Other loans – A$ 31,367 –
39,967 29,950
Abacus Hospitality Fund
CurrentBank loans – A$ 36,740 –
Bank loans – A$ value of NZ$ denominated loan 21,538 –
58,278 –
Abacus Diversified Income Fund II
CurrentBank loans – A$ 32,189 –
Less: Unamortised borrowing costs (106) –
32,083 –
Abacus Miller Street Holding Trust
CurrentBank loans – A$ 34,000 –
Less: Unamortised borrowing costs (10) –
33,990 –
(a) Total current 164,318 29,950 * Excludes Abacus Hospitality Fund, Abacus Diversified Income Fund II, Abacus Miller Street Holding Trust and Abacus Wodonga Land Fund.
For
per
sona
l use
onl
y

106 abacus property group
NOTES TO THE FINANCIAL STATEMENTS 30 JUNE 2013CONTINUED
20. INTEREST BEARING LOANS AND BORROWINGS (CONTINUED)
2013 $’000
2012 $’000
Abacus Property Group*
Non-currentBank loans – A$ 500,548 484,484
Other loans – A$ – 29,354
Bank loans – A$ value of NZ$ denominated loan 55,374 53,038
Less: Unamortised borrowing costs (2,719) (6,546)
553,203 560,330
Abacus Hospitality Fund
Non-currentBank loans – A$ – 49,240
Bank loans – A$ value of NZ$ denominated loan – 20,020
Loans from other parties 27,350 25,267
Less: Unamortised borrowing costs (235) (469)
27,115 94,058
Abacus Diversified Income Fund II
Non-currentBank loans – A$ 52,349 84,319
Less: Unamortised borrowing costs (34) (427)
52,315 83,892
Abacus Miller Street Holding Trust
Non-currentBank loans – A$ – 34,000
Less: Unamortised borrowing costs – (20)
– 33,980
Abacus Wodonga Land Fund
Non-currentBank loans – A$ 6,657 –
6,657 –
(b) Total non-current 639,290 772,260 * Excludes Abacus Hospitality Fund, Abacus Diversified Income Fund II, Abacus Miller Street Holding Trust and Abacus Wodonga Land Fund.
For
per
sona
l use
onl
y

107 annual report 2013
20. INTEREST BEARING LOANS AND BORROWINGS (CONTINUED)
2013 $’000
2012 $’000
(c) Maturity profile of current and non-current interest bearing loansDue within one year 164,434 29,950
Due between one and five years 642,278 779,722
Due after five years – –
806,712 809,672
Abacus Property Group*
The Group maintains a range of interest-bearing loans and borrowings. The sources of funding are spread over a number of counterparties and the terms of the instruments are negotiated to achieve a balance between capital availability and cost of debt.
Bank loans are $A and $NZ denominated and are provided by several banks at interest rates which are set periodically on a floating basis. The term to maturity for the loans varies from May 2014 to April 2016. The bank loans are secured by charges over the investment properties, certain inventory and certain property, plant and equipment.
Approximately 83% (2012: 97%) of bank debt drawn was subject to fixed rate hedges. The bank debt drawn at 30 June 2013 has a weighted average term to maturity of 2.1 years (2012: 3 years). Hedge cover as a percentage of available facilities at 30 June 2013 is 59.5% (2012: 69.7%).
APG’s weighted average interest rate as at 30 June 2013 was 6.05% (2012: 7.27%). Line fees on undrawn facilities contributed to 0.47% of the weighted average interest rate at 30 June 2013 (2012: 0.40%). APG’s weighted average interest rate excluding the undrawn facilities line fees as at 30 June 2013 was 5.58% (2012: 6.87%).
* Excludes Abacus Hospitality Fund, Abacus Diversified Income Fund II, Abacus Miller Street Holding Trust and Abacus Wodonga Land Fund.
Abacus Hospitality FundAHF’s $A and $NZ bank facility matures in June 2014. The facility is secured by a charge over AHF’s hotel assets and at 30 June 2013 approximately 73.7% (2012: 62.0%) of drawn bank debt facilities were subject to current fixed rate hedges. The bank debt drawn at 30 June 2013 has a weighted average term to maturity of 1.0 year (2012: 2.0 years).
AHF’s weighted average interest rate as at 30 June 2013 was 8.0% (2012: 8.1%). Line fees on undrawn facilities contributed to 0.41% of the weighted average interest rate at 30 June 2013 (2012: 0.18%). AHF’s weighted average interest rate excluding the undrawn facilities line fees as at 30 June 2013 was 7.59% (2012: 7.92%).
Abacus Diversified Income Fund IIADIF II has financed its Australian investment property portfolio via two $A facilities provided by two major Australian banks which mature in September 2013 and November 2014 respectively.
The facilities are secured by charges over ADIF II’s investment properties and at 30 June 2013 approximately 92.9% (2012: 93.1%) of drawn bank debt facilities were subject to fixed rate hedges. The bank debt drawn at 30 June 2013 has a weighted average term to maturity of 0.9 years (2012: 1.9 years).
ADIF II’s weighted average interest rate as at 30 June 2013 was 8.86% (2012: 8.85%). Line fees on undrawn facilities contributed to 0.29% of the weighted average interest rate at 30 June 2013 (2012: 0.20%). ADIF II’s weighted average interest rate excluding the undrawn facilities line fees as at 30 June 2013 was 8.57% (2012: 8.65%).
For
per
sona
l use
onl
y
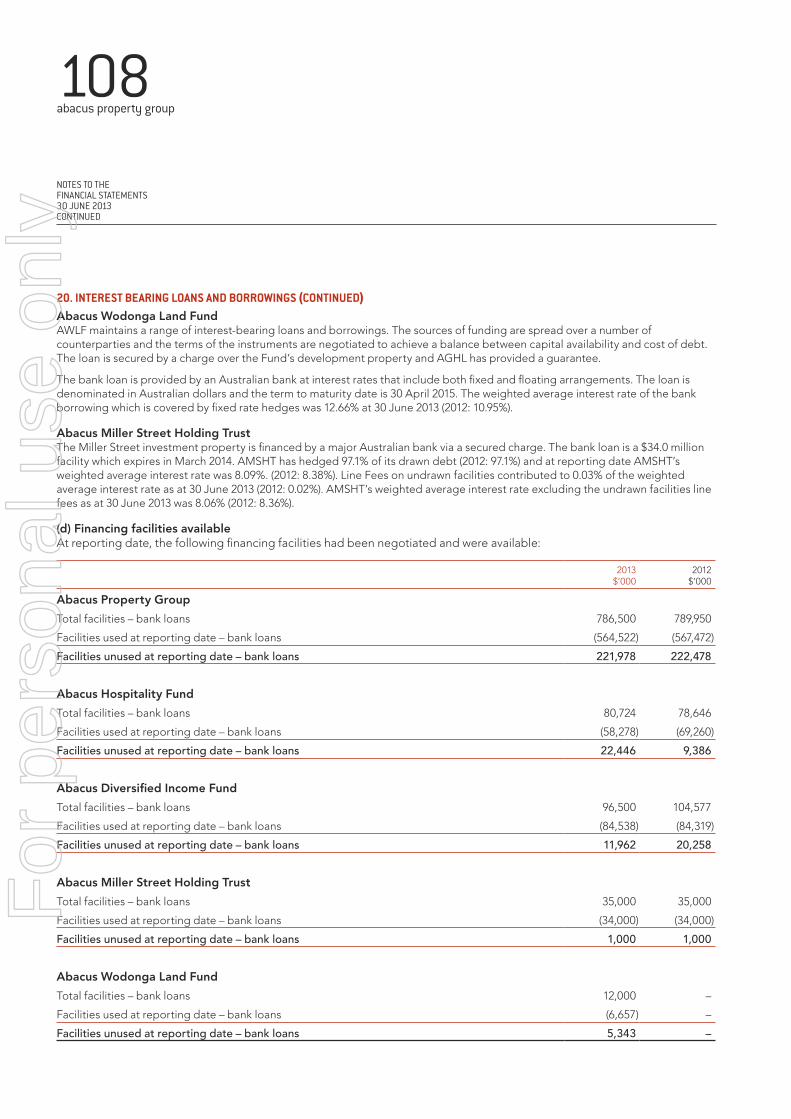
108 abacus property group
NOTES TO THE FINANCIAL STATEMENTS 30 JUNE 2013CONTINUED
20. INTEREST BEARING LOANS AND BORROWINGS (CONTINUED)Abacus Wodonga Land FundAWLF maintains a range of interest-bearing loans and borrowings. The sources of funding are spread over a number of counterparties and the terms of the instruments are negotiated to achieve a balance between capital availability and cost of debt. The loan is secured by a charge over the Fund’s development property and AGHL has provided a guarantee.
The bank loan is provided by an Australian bank at interest rates that include both fixed and floating arrangements. The loan is denominated in Australian dollars and the term to maturity date is 30 April 2015. The weighted average interest rate of the bank borrowing which is covered by fixed rate hedges was 12.66% at 30 June 2013 (2012: 10.95%).
Abacus Miller Street Holding TrustThe Miller Street investment property is financed by a major Australian bank via a secured charge. The bank loan is a $34.0 million facility which expires in March 2014. AMSHT has hedged 97.1% of its drawn debt (2012: 97.1%) and at reporting date AMSHT’s weighted average interest rate was 8.09%. (2012: 8.38%). Line Fees on undrawn facilities contributed to 0.03% of the weighted average interest rate as at 30 June 2013 (2012: 0.02%). AMSHT’s weighted average interest rate excluding the undrawn facilities line fees as at 30 June 2013 was 8.06% (2012: 8.36%).
(d) Financing facilities availableAt reporting date, the following financing facilities had been negotiated and were available:
2013 $’000
2012 $’000
Abacus Property Group
Total facilities – bank loans 786,500 789,950
Facilities used at reporting date – bank loans (564,522) (567,472)
Facilities unused at reporting date – bank loans 221,978 222,478
Abacus Hospitality Fund
Total facilities – bank loans 80,724 78,646
Facilities used at reporting date – bank loans (58,278) (69,260)
Facilities unused at reporting date – bank loans 22,446 9,386
Abacus Diversified Income Fund
Total facilities – bank loans 96,500 104,577
Facilities used at reporting date – bank loans (84,538) (84,319)
Facilities unused at reporting date – bank loans 11,962 20,258
Abacus Miller Street Holding Trust
Total facilities – bank loans 35,000 35,000
Facilities used at reporting date – bank loans (34,000) (34,000)
Facilities unused at reporting date – bank loans 1,000 1,000
Abacus Wodonga Land Fund
Total facilities – bank loans 12,000 –
Facilities used at reporting date – bank loans (6,657) –
Facilities unused at reporting date – bank loans 5,343 –
For
per
sona
l use
onl
y

109 annual report 2013
20. INTEREST BEARING LOANS AND BORROWINGS (CONTINUED)(e) Assets pledged as securityThe carrying amounts of assets pledged as security for current and non-current interest bearing liabilities are:
2013 $’000
2012 $’000
CurrentFirst mortgage
Inventory 72,489 –
Investment properties held for sale 175,710 190,821
Total current assets pledged as security 248,199 190,821
Non-current
First mortgage
Freehold land and buildings 6,216 5,609
Property, plant and equipment 145,620 148,456
Inventory 58,422 54,663
Investment properties 1,194,931 1,173,163
Total non-current assets pledged as security 1,405,189 1,381,891
Total assets pledged as security 1,653,388 1,572,712
(f) Defaults and breachesDuring the current and prior years, there were no defaults or breaches on any of the loans.
For
per
sona
l use
onl
y

110 abacus property group
NOTES TO THE FINANCIAL STATEMENTS 30 JUNE 2013CONTINUED
21. PARENT ENTITY FINANCIAL INFORMATION2013
$’0002012
$’000
Results of the parent entityProfit / (loss) for the year* 4,978 (72,912)
Total comprehensive income / (expense) for the year 4,978 (72,912)
Financial position of the parent entity at year endCurrent assets 9,951 21,808
Total assets 183,904 155,723 Current liabilities 118 11,884
Total liabilities 52,638 35,539 Net assets 131,266 120,184
Total equity of the parent entity comprising of:Issued capital 165,611 160,673
Retained earnings (40,960) (45,937)
Employee options reserve 6,615 5,448
Total equity 131,266 120,184 * Includes diminution of subsidiary of $98 million in 2012 which is eliminated in the consolidation of the Group’s results.
Parent entity contingenciesThe parent entity has entered into the following agreement in the year ended 30 June 2011 which is current as at 30 June 2013:
• Provide a corporate guarantee to a bank to increase the amount of drawn funds available and to guarantee the payment of interest on a tranche. The maximum liability is approximately $5.1 million (2012: $6.8 million). No property security has been provided by the parent.
Parent entity capital commitmentsThere are no capital commitments of the parent entity as at 30 June 2013 (2012: Nil).
For
per
sona
l use
onl
y

111 annual report 2013
22. FINANCIAL INSTRUMENTS(i) Credit RiskCredit Risk ExposuresThe Group’s maximum exposure to credit risk at the reporting date was:
CARRyING AMOuNT
2013 $’000
2012 $’000
Receivables 26,457 18,130
Secured property loans 140,822 173,856
Other financial assets 28,281 32,542
Cash and cash equivalents 44,822 54,129
240,382 278,657
As at 30 June 2013, the Group had the following concentrations of credit risk:
• Secured property loans: a loan which represents 43% of the portfolio covers two large projects at Riverlands and Camelia;
• Other financial assets (fair value) is represented by 2 issuers (2012: 2 issuers)
Secured property loansThe following table illustrates grouping of the Group’s investment in secured loans. As noted in disclosure note 3, the Group mitigates the exposure to this risk by evaluation of the credit submission before acceptance, ensuring security is obtained and consistent and timely monitoring of the financial instrument to identify any potential adverse changes in the credit quality.
30 JUNE 2013TOTAL
$’000
ORIGINAL TERM $’000
RENEWED/ EXTENDED
TERM(1) $’000
PAST DuE TERM(2)
$’000IMPAIRED(3)
$’000
Loans 140,822 56,321 84,501 – –
less: provisioning – – – – –
Total 140,822 56,321 84,501 – –
30 JUNE 2012TOTAL
$’000
ORIGINAL TERM $’000
RENEWED/ EXTENDED
TERM(1) $’000
PAST DuE TERM(2)
$’000IMPAIRED(3)
$’000
Loans 173,856 150,121 23,735 – –
less: provisioning – – – – –
Total 173,856 150,121 23,735 – – For
per
sona
l use
onl
y

112 abacus property group
NOTES TO THE FINANCIAL STATEMENTS 30 JUNE 2013CONTINUED
22. FINANCIAL INSTRUMENTS (CONTINUED)(i) Credit Risk (continued)
Secured property loans (continued)1) Loans are generally renewed / extended on comparable terms.
2) For loans with past due terms all are less than two years old and are expected to be recovered.
3) In considering the impairment of loans, the Group will undertake a market analysis of the secured property development which is used to service the loan and identify if a deficiency of security exists and the extent of that deficiency, if any. If there is an indicator of impairment, fair value calculations of expected future cashflows are determined and if there are any differences to the carrying value of the loan, an impairment is recognised.
Other financial assets of $28.3 million (2012: $32.5 million) include options totalling $23.6 million (2012: $27.9 million) which are both on original or renewed terms.
The movement in the allowance for impairment in respect of secured property loans and receivables during the year was as follows:
2013 $’000
2012 $’000
Balance at 1 July 2012 – –
movement during the year – –
Balance at 30 June 2013 – –
(ii) Liquidity RiskThe table below shows an analysis of the contractual maturities of key liabilities which forms part of the Group’s assessment of liquidity risk.
Abacus Property Group*
30 JUNE 2013
CARRyING AMOuNT
$’000
CONTRACTuAL CASH FLOWS
$’000
1 yEAR OR LESS $’000
OVER 1 yEAR TO 5 yEARS
$’000
OVER 5 yEARS
$’000
LiabilitiesTrade and other payables 51,787 51,787 51,787 – –
Interest bearing loans and borrowings incl derivatives# 628,862 715,475 79,834 624,742 10,899
Total liabilities 680,649 767,262 131,621 624,742 10,899
30 JUNE 2012
CARRyING AMOuNT
$’000
CONTRACTuAL CASH FLOWS
$’000
1 yEAR OR LESS $’000
OVER 1 yEAR TO 5 yEARS
$’000
OVER 5 yEARS
$’000
LiabilitiesTrade and other payables 32,735 32,735 20,010 12,725 –
Interest bearing loans and borrowings incl derivatives# 643,566 724,007 82,846 635,311 5,850
Total liabilities 676,301 756,742 102,856 648,036 5,850 # Carrying amount includes fair value of derivative liabilities. Contractual cash flows includes contracted debt and net swap payments using prevailing
forward rates.* Excludes Abacus Hospitality Fund, Abacus Diversified Income Fund II, Abacus Miller Street Holding Trust and Abacus Wodonga Land Fund.
For
per
sona
l use
onl
y

113 annual report 2013
22. FINANCIAL INSTRUMENTS (CONTINUED)(ii) Liquidity Risk (continued)
Abacus Hospitality Fund
30 JUNE 2013
CARRyING AMOuNT
$’000
CONTRACTuAL CASH FLOWS
$’000
1 yEAR OR LESS $’000
OVER 1 yEAR TO 5 yEARS
$’000
OVER 5 yEARS
$’000
LiabilitiesTrade and other payables 8,645 8,645 8,645 – –
Interest bearing loans and borrowings incl derivatives# 96,645 105,957 64,796 19,960 21,201
Total liabilities 105,290 114,602 73,441 19,960 21,201
30 JUNE 2012
CARRyING AMOuNT
$’000
CONTRACTuAL CASH FLOWS
$’000
1 yEAR OR LESS $’000
OVER 1 yEAR TO 5 yEARS
$’000
OVER 5 yEARS
$’000
LiabilitiesTrade and other payables 6,895 6,895 6,895 – –
Interest bearing loans and borrowings incl derivatives# 85,969 96,700 8,117 88,584 –
Total liabilities 92,864 103,595 15,012 88,584 – # Carrying amount includes fair value of derivative liabilities. Contractual cash flows includes contracted debt and net swap payments using prevailing
forward rates.
Abacus Diversified Income Fund II
30 JUNE 2013
CARRyING AMOuNT
$’000
CONTRACTuAL CASH FLOWS
$’000
1 yEAR OR LESS $’000
OVER 1 yEAR TO 5 yEARS
$’000
OVER 5 yEARS
$’000
LiabilitiesTrade and other payables 1,919 1,919 1,919 – –
Interest bearing loans and borrowings incl derivatives# 90,750 96,241 37,321 58,920 –
Total liabilities 92,669 98,160 39,240 58,920 –
30 JUNE 2012
CARRyING AMOuNT
$’000
CONTRACTuAL CASH FLOWS
$’000
1 yEAR OR LESS $’000
OVER 1 yEAR TO 5 yEARS
$’000
OVER 5 yEARS
$’000
LiabilitiesTrade and other payables 2,724 2,724 2,724 – –
Interest bearing loans and borrowings incl derivatives# 92,233 100,615 7,380 93,235 –
Total liabilities 94,957 103,339 10,104 93,235 – # Carrying amount includes fair value of derivative liabilities. Contractual cash flows includes contracted debt and net swap payments using prevailing
forward rates.
For
per
sona
l use
onl
y

114 abacus property group
NOTES TO THE FINANCIAL STATEMENTS 30 JUNE 2013CONTINUED
22. FINANCIAL INSTRUMENTS (CONTINUED)(ii) Liquidity Risk (continued)
Abacus Miller Street Holding Trust
30 JUNE 2013
CARRyING AMOuNT
$’000
CONTRACTuAL CASH FLOWS
$’000
1 yEAR OR LESS $’000
OVER 1 yEAR TO 5 yEARS
$’000
OVER 5 yEARS
$’000
LiabilitiesTrade and other payables 715 715 715 – –
Interest bearing loans and borrowings incl derivatives# 35,086 36,244 36,244 – –
Total liabilities 35,801 36,959 36,959 – –
30 JUNE 2012
CARRyING AMOuNT
$’000
CONTRACTuAL CASH FLOWS
$’000
1 yEAR OR LESS $’000
OVER 1 yEAR TO 5 yEARS
$’000
OVER 5 yEARS
$’000
LiabilitiesTrade and other payables 828 828 828 – –
Interest bearing loans and borrowings incl derivatives# 35,843 38,073 2,749 35,324 –
Total liabilities 36,671 38,901 3,577 35,324 – # Carrying amount includes fair value of derivative liabilities. Contractual cash flows includes contracted debt and net swap payments using prevailing
forward rates.
Abacus Wodonga Land Fund
30 JUNE 2013
CARRyING AMOuNT
$’000
CONTRACTuAL CASH FLOWS
$’000
1 yEAR OR LESS $’000
OVER 1 yEAR TO 5 yEARS
$’000
OVER 5 yEARS
$’000
LiabilitiesTrade and other payables 140 140 140 – –
Interest bearing loans and borrowings# 9,614 11,754 1,226 10,466 23
Total liabilities 9,754 11,894 1,366 10,466 23 # Carrying amount includes fair value of derivative liabilities. Contractual cash flows includes contracted debt and net swap payments using prevailing
forward rates.
For
per
sona
l use
onl
y

115 annual report 2013
22. FINANCIAL INSTRUMENTS (CONTINUED)(iii) Currency RiskThe following table shows the Group’s investments denominated in a foreign currency.
AuD NZD GBP
2013 $’000
2012 $’000
2013 $’000
2012 $’000
2013 £’000
2012 £’000
AssetsCash at bank 3,982 8,028 4,727 10,253 – –
Investment in securities 4,270 4,026 – – 2,593 2,629
Total assets 8,252 12,054 4,727 10,253 2,593 2,629
LiabilitiesInterest bearing loans and borrowings 76,911 73,058 91,302 93,303 – –
Total liabilities 76,911 73,058 91,302 93,303 – –
The Abacus Property Group and Abacus Hospitality Fund borrow funds in New Zealand dollars to substantially match the foreign currency property asset value exposure with a corresponding foreign currency liability and therefore expects to substantially mitigate the foreign currency risk on their New Zealand denominated asset values.
The following sensitivity is based on the foreign risk exposures in existence at the balance sheet date.
At 30 June 2013, had the Australian Dollar moved, as illustrated in the table below, with all other variables held consistent, post tax profit and equity would have been affected as follows:
POST TAX PROFIT HIGHER/(LOWER)
EquITy HIGHER/(LOWER)
JUDGEMENTS OF REASONABLY POSSIBLE MOVEMENTS:2013
$’0002012
$’0002013
$’0002012
$’000
AUD/GBP + 10% (388) (366) – –
AUD/GBP - 10% 474 447 – –
AUD/NZD + 10% (5,381) (5,537) – –
AUD/NZD - 10% 6,577 6,767 – –
For
per
sona
l use
onl
y

116 abacus property group
NOTES TO THE FINANCIAL STATEMENTS 30 JUNE 2013CONTINUED
22. FINANCIAL INSTRUMENTS (CONTINUED)(iv) Interest rate riskThe Group’s exposure to interest rate risk and the effective weighted average interest rates for each class of financial asset and financial liability are:
Abacus Property Group^
30 JUNE 2013
FLOATING INTEREST RATE
$’000
FIXED INTEREST LESS THAN
1 yEAR $’000
FIXED INTEREST 1 TO 5 yEARS
$’000
FIXED INTEREST OVER 5 yEARS
$’000
NON INTEREST BEARING
$’000TOTAL
$’000
Financial AssetsCash and cash equivalents 29,686 – – – – 29,686 Receivables – – 6,897 – 13,839 20,736 Secured loans – 2,452 138,370 – – 140,822
Total financial assets 29,686 2,452 145,267 – 13,839 191,244
Weighted average interest rate* 1.30% 7.00% 11.07%
Financial liabilitiesInterest bearing liabilities – bank 561,802 – – – – 561,802 Interest bearing liabilities – other – 27,075 – – 4,292 31,367 Derivatives – – – – 35,691 35,691 Payables – – – – 51,787 51,787
Total financial liabilities 561,802 27,075 – – 91,770 680,647
Notional principal swap balance maturities* – – 288,066 180,000 – 468,066
Weighted average interest rate on drawn bank debt* 6.05%
30 JUNE 2012
FLOATING INTEREST RATE
$’000
FIXED INTEREST LESS THAN
1 yEAR $’000
FIXED INTEREST 1 TO 5 yEARS
$’000
FIXED INTEREST OVER 5 yEARS
$’000
NON INTEREST BEARING
$’000TOTAL
$’000
Financial AssetsCash and cash equivalents 43,114 – – – – 43,114 Receivables – – – – 14,170 14,170 Secured loans – 19,068 154,759 – 30 173,857
Total financial assets 43,114 19,068 154,759 – 14,200 231,141
Weighted average interest rate* 3.30% 13.11% 10.70%
Financial liabilitiesInterest bearing liabilities – bank 560,926 – – – – 560,926 Interest bearing liabilities – other – – 25,062 – 4,292 29,354 Derivatives – – – – 53,286 53,286 Payables – – – – 32,735 32,735
Total financial liabilities 560,926 – 25,062 – 90,313 676,301
Notional principal swap balance maturities* – 98,703 306,999 225,000 – 630,702
Weighted average interest rate on drawn bank debt* 7.27%
* rate calculated at 30 June excluding forward starts.^ Excludes Abacus Hospitality Fund, Abacus Diversified Income Fund II, Abacus Miller Street Holding Trust and Abacus Wodonga Land Fund.
For
per
sona
l use
onl
y
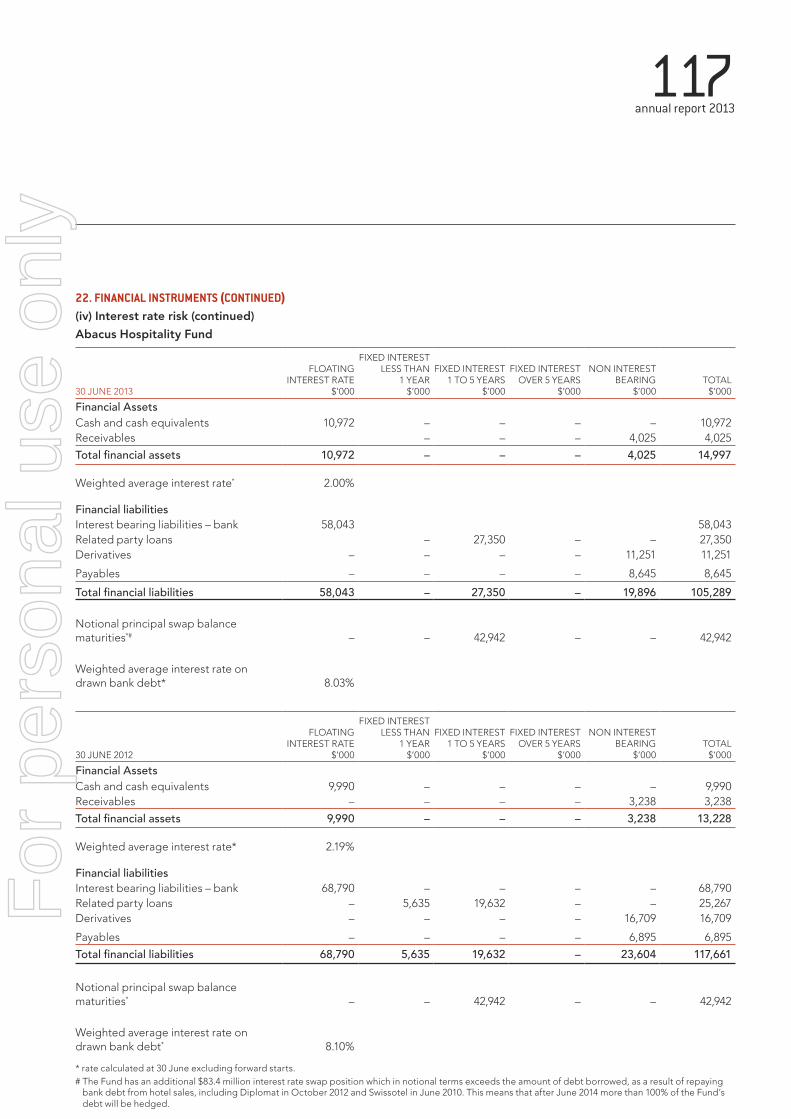
117 annual report 2013
22. FINANCIAL INSTRUMENTS (CONTINUED)(iv) Interest rate risk (continued)
Abacus Hospitality Fund
30 JUNE 2013
FLOATING INTEREST RATE
$’000
FIXED INTEREST LESS THAN
1 yEAR $’000
FIXED INTEREST 1 TO 5 yEARS
$’000
FIXED INTEREST OVER 5 yEARS
$’000
NON INTEREST BEARING
$’000TOTAL
$’000
Financial AssetsCash and cash equivalents 10,972 – – – – 10,972 Receivables – – – 4,025 4,025
Total financial assets 10,972 – – – 4,025 14,997
Weighted average interest rate* 2.00%
Financial liabilitiesInterest bearing liabilities – bank 58,043 58,043 Related party loans – 27,350 – – 27,350 Derivatives – – – – 11,251 11,251
Payables – – – – 8,645 8,645
Total financial liabilities 58,043 – 27,350 – 19,896 105,289
Notional principal swap balance maturities*# – – 42,942 – – 42,942
Weighted average interest rate on drawn bank debt* 8.03%
30 JUNE 2012
FLOATING INTEREST RATE
$’000
FIXED INTEREST LESS THAN
1 yEAR $’000
FIXED INTEREST 1 TO 5 yEARS
$’000
FIXED INTEREST OVER 5 yEARS
$’000
NON INTEREST BEARING
$’000TOTAL
$’000
Financial AssetsCash and cash equivalents 9,990 – – – – 9,990 Receivables – – – – 3,238 3,238
Total financial assets 9,990 – – – 3,238 13,228
Weighted average interest rate* 2.19%
Financial liabilitiesInterest bearing liabilities – bank 68,790 – – – – 68,790 Related party loans – 5,635 19,632 – – 25,267 Derivatives – – – – 16,709 16,709
Payables – – – – 6,895 6,895
Total financial liabilities 68,790 5,635 19,632 – 23,604 117,661
Notional principal swap balance maturities* – – 42,942 – – 42,942
Weighted average interest rate on drawn bank debt* 8.10%
* rate calculated at 30 June excluding forward starts.# The Fund has an additional $83.4 million interest rate swap position which in notional terms exceeds the amount of debt borrowed, as a result of repaying
bank debt from hotel sales, including Diplomat in October 2012 and Swissotel in June 2010. This means that after June 2014 more than 100% of the Fund’s debt will be hedged.
For
per
sona
l use
onl
y

118 abacus property group
NOTES TO THE FINANCIAL STATEMENTS 30 JUNE 2013CONTINUED
22. FINANCIAL INSTRUMENTS (CONTINUED)(iv) Interest rate risk (continued)
Abacus Diversified Income Fund II
30 JUNE 2013
FLOATING INTEREST RATE
$’000
FIXED INTEREST LESS THAN
1 yEAR $’000
FIXED INTEREST 1 TO 5 yEARS
$’000
FIXED INTEREST OVER 5 yEARS
$’000
NON INTEREST BEARING
$’000TOTAL
$’000
Financial AssetsCash and cash equivalents 468 – – – – 468 Receivables – – – – 1,218 1,218
Total financial assets 468 – – – 1,218 1,686
Weighted average interest rate* 1.30%
Financial liabilitiesInterest bearing liabilities – bank 84,505 – – – – 84,505 Derivatives – – – – 6,210 6,210 Payables – – – – 1,919 1,919
Total financial liabilities 84,505 – – – 8,129 92,634
Notional principal swap balance maturities* – 25,000 53,500 – – 78,500
Weighted average interest rate on drawn bank debt* 8.86%
30 JUNE 2012
FLOATING INTEREST RATE
$’000
FIXED INTEREST LESS THAN
1 yEAR $’000
FIXED INTEREST 1 TO 5 yEARS
$’000
FIXED INTEREST OVER 5 yEARS
$’000
NON INTEREST BEARING
$’000TOTAL
$’000
Financial AssetsCash and cash equivalents 226 – – – – 226 Receivables – – – – 1,058 1,058
Total financial assets 226 – – – 1,058 1,284
Weighted average interest rate* 2.30%
Financial liabilitiesInterest bearing liabilities – bank 83,932 – – – – 83,932 Derivatives – – – – 7,914 7,914Payables – – – – 2,724 2,724
Total financial liabilities 83,932 – – – 10,638 94,570
Notional principal swap balance maturities* – – 78,500 – – 78,500
Weighted average interest rate on drawn bank debt* 8.85%
* rate calculated at 30 June.
For
per
sona
l use
onl
y

119 annual report 2013
22. FINANCIAL INSTRUMENTS (CONTINUED)(iv) Interest rate risk (continued)
Abacus Miller Street Holding Trust
30 JUNE 2013
FLOATING INTEREST RATE
$’000
FIXED INTEREST LESS THAN
1 yEAR $’000
FIXED INTEREST 1 TO 5 yEARS
$’000
FIXED INTEREST OVER 5 yEARS
$’000
NON INTEREST BEARING
$’000TOTAL
$’000
Financial AssetsCash and cash equivalents 1,653 – – – – 1,653 Receivables – – – – 50 50
Total financial assets 1,653 – – – 50 1,703
Weighted average interest rate* 1.30%
Financial liabilitiesInterest bearing liabilities – bank 34,000 – – – – 34,000 Derivatives – – – – 1,096 1,096 Payables – – – – 715 715
Total financial liabilities 34,000 – – – 1,811 35,811
Notional principal swap balance maturities* – 33,000 – – – 33,000
Weighted average interest rate on drawn bank debt* 8.09%
30 JUNE 2012
FLOATING INTEREST RATE
$’000
FIXED INTEREST LESS THAN
1 yEAR $’000
FIXED INTEREST 1 TO 5 yEARS
$’000
FIXED INTEREST OVER 5 yEARS
$’000
NON INTEREST BEARING
$’000TOTAL
$’000
Financial AssetsCash and cash equivalents 799 – – – – 799 Receivables – – – – 9 9
Total financial assets 799 – – – 9 808
Weighted average interest rate* 2.30%
Financial liabilitiesInterest bearing liabilities – bank 34,000 – – – – 34,000 Derivatives – – – – 1,843 1,843 Payables – – – – 828 828
Total financial liabilities 34,000 – – – 2,671 36,671
Notional principal swap balance maturities* – – 33,000 – – 33,000
Weighted average interest rate on drawn bank debt* 8.38%
* rate calculated at 30 June.
For
per
sona
l use
onl
y

120 abacus property group
NOTES TO THE FINANCIAL STATEMENTS 30 JUNE 2013CONTINUED
22. FINANCIAL INSTRUMENTS (CONTINUED)(iv) Interest rate risk (continued)
Abacus Wodonga Land Fund
30 JUNE 2013
FLOATING INTEREST RATE
$’000
FIXED INTEREST LESS THAN
1 yEAR $’000
FIXED INTEREST 1 TO 5 yEARS
$’000
FIXED INTEREST OVER 5 yEARS
$’000
NON INTEREST BEARING
$’000TOTAL
$’000
Financial AssetsCash and cash equivalents 2,042 – – – – 2,042 Receivables – – – – 427 427
Total financial assets 2,042 – – – 427 2,469
Weighted average interest rate* 2.74%
Financial liabilitiesInterest bearing liabilities – bank 6,657 – – – – 6,657 Derivatives – – – – 2,957 2,957 Payables – – – – 174 174
Total financial liabilities 6,657 – – – 3,131 9,788
Notional principal swap balance maturities* – – – 10,000 – 10,000
Weighted average interest rate on drawn bank debt* 12.66%
Summarised interest rate sensitivity analysisThe table below illustrates the potential impact a change in $A interest rates by +/- 1% would have had on the Group’s profit and equity on a pre-tax basis:
AuD
-1% +1%
30 JUNE 2013
CARRyING AMOuNT
FLOATING $’000
PROFIT $’000
EquITy $’000
PROFIT $’000
EquITy $’000
Financial assets 44,822 (448) – 448 –
Financial liabilities 176,036 (26,330) – 26,619 –
30 JUNE 2012
Financial assets 54,129 (541) – 541 –
Financial liabilities 123,113 (29,555) – 25,101 –
The analysis for the interest rate sensitivity of financial liabilities includes derivatives.
For
per
sona
l use
onl
y

121 annual report 2013
22. FINANCIAL INSTRUMENTS (CONTINUED)(v) Price riskThe Group is exposed to equity securities risk. Equity securities price risk arises from investments in listed and unlisted securities. The key risk variable is the quoted price of the securities, which is influenced by a range of factors, most of which are outside the control of the Group. As a result, the Group does not use financial instruments to manage the price risk exposure on property securities but instead regularly monitors levels of exposure and conducts sensitivity analysis for fluctuations in the quoted securities prices.
A fluctuation of 15% in the price of the equity securities would impact the net profit after income tax expense of the Group, with all other variables held constant, by an increase/(decrease) of $0.49 million (2012: $0.51 million).
(vi) Fair valuesThe fair value of the Group’s financial assets and liabilities are approximately equal to that of their carrying values.
In accordance with AASB 7 Financial Instruments: Disclosures the Group’s financial instruments are classified into the following fair value measurement hierarchy:
(a) Level 1 Quoted prices (unadjusted) in active market for identical assets or liabilities;
(b) Level 2 Inputs other than quoted prices included in level 1 that are observable for the asset or liability, either directly (i.e. as prices) or indirectly (i.e. derived from prices); and
(c) Level 3 Inputs for the asset or liability that are not based on observable market data.
For
per
sona
l use
onl
y

122 abacus property group
NOTES TO THE FINANCIAL STATEMENTS 30 JUNE 2013CONTINUED
22. FINANCIAL INSTRUMENTS (CONTINUED)(vi) Fair values (continued)The following table presents the Group’s assets and liabilities measured and recognised at fair value at 30 June 2013.
30 JUNE 2013
LEVEL 1 2013
$’000
LEVEL 2 2013
$’000
LEVEL 3 2013
$’000
LEVEL 4 2013
$’000
CurrentDerivative liabilities – (1,263) – (1,263)
Total current – (1,263) – (1,263)
Non-currentInvestment in securities – unlisted 371 – 4,270 4,641
Investment in options – – 23,640 23,640
Derivative liabilities – (55,942) – (55,942)
Total non-current 371 (55,942) 27,910 (27,661)
30 JUNE 2012
LEVEL 1 2013
$’000
LEVEL 2 2013
$’000
LEVEL 3 2013
$’000
LEVEL 4 2013
$’000
CurrentInvestment in securities – listed 168 – – 168
Investment in options – – 7,885 7,885
Total current 168 – 7,885 8,053
Non-currentInvestment in securities – unlisted – – 4,490 4,490
Investment in options – – 20,000 20,000
Derivative liabilities – (79,752) – (79,752)
Total non-current – (79,752) 24,490 (55,262)There were no transfers between Levels 1, 2 and 3 during the year.
For
per
sona
l use
onl
y

123 annual report 2013
22. FINANCIAL INSTRUMENTS (CONTINUED)(vi) Fair values (continued)The following table is a reconciliation of the movements in unlisted securities and options classified as Level 3 for the year ended 30 June 2013.
uNLISTED SECuRITIES
$000OPTIONS
$’000TOTAL
$’000
opening balance as at 30 June 2012 4,490 27,885 32,375
fair value movement through the income statement 170 3,640 3,810
transfers to investment properties – (7,885) (7,885)
redemptions / conversions (19) – (19)
closing balance as at 30 June 2013 4,641 23,640 28,281
uNLISTED SECuRITIES
$000OPTIONS
$’000TOTAL
$’000
opening balance as at 30 June 2011 4,795 27,382 32,177
fair value movement through the income statement (50) 503 453
redemptions / conversions (255) – (255)
closing balance as at 30 June 2012 4,490 27,885 32,375
Determination of fair valueThe fair value of listed securities is determined by reference to the quoted bid price of the entity at balance date. The fair value of unlisted securities is determined by reference to the net assets of the underlying entities.
The fair value of interest rate swaps is determined using a generally accepted pricing model on a discounted cash flow analysis using assumptions supported by observable market rates.
The fair value of the options is determined using generally accepted pricing models including Black-Scholes and adjusted for specific features of the options including share price, underlying net assets and property valuations and prevailing exchange rates.
Sensitivity of Level 3The potential effect of using reasonable possible alternative assumptions based on a change in the property valuations by 5%, a change in the property capitalisation rate by 0.5% and a change in the unit price of securities of 10% would have the effect of reducing the fair value by up to $0.4 million (2012: $0.4 million) or increase the fair value by $12.1 million (2012: $8.2 million).F
or p
erso
nal u
se o
nly

124 abacus property group
NOTES TO THE FINANCIAL STATEMENTS 30 JUNE 2013CONTINUED
23. CONTRIBUTED EQUITY2013
$’0002012
$’000
(a) Issued stapled securitiesStapled securities 1,308,406 1,271,794
Issue costs (40,025) (39,800)
Total contributed equity 1,268,381 1,231,994
(b) Movement in stapled securities on issue
STAPLED SECuRITIES
NuMBER ‘000
VALuE $’000
At 30 June 2012 434,983 1,231,994
– distribution reinvestment plan 18,057 36,612
– less transaction costs – (225)
Securities on issue at 30 June 2013 453,040 1,268,381
24. CAPITAL MANAGEMENTAbacus Property Group*The Group seeks to manage its capital requirements through a mix of debt and equity funding. It also ensures that Group entities comply with capital and distribution requirements of their constitutions and/or trust deeds, the capital requirements of relevant regulatory authorities and continue to operate as going concerns. The Group also protects its equity in assets by taking out insurance.
The Group assesses the adequacy of its capital requirements, cost of capital and gearing (i.e. debt/equity mix) as part of its broader strategic plan. In addition to tracking actual against budgeted performance, the Group reviews its capital structure to ensure sufficient funds and financing facilities (on a cost effective basis) are available to implement the Group’s strategy that adequate financing facilities are maintained and distributions to members are made within the stated distribution guidance (i.e. paid out of underlying profits).
The following strategies are available to the Group to manage its capital: issuing new stapled securities, activating its distribution reinvestment plan, electing to have the distribution reinvestment plan underwritten, adjusting the amount of distributions paid to members, activating a security buyback program, divesting assets, active management of the Group’s fixed rate swaps, directly purchasing assets in managed funds and joint ventures, or (where practical) recalibrating the timing of transactions and capital expenditure so as to avoid a concentration of net cash outflows.
The Group manages the cash flow effect of interest rate risk by entering into interest rate swap agreements that are used to convert floating interest rate borrowings to fixed interest rates. Such interest rate swaps are entered into with the objective of hedging the risk of interest rate fluctuations in respect of underlying borrowings. Under the interest rate swaps, the Group agrees with other parties to exchange, at specified intervals (mainly monthly), the difference between fixed contract rates and floating rate interest amounts calculated by reference to the agreed notional principal amounts.
Interest rate swap contracts have been recorded on the Statement of Financial Position at their fair value in accordance with AASB 139 Financial Instruments: Recognition and Measurement. The AIFRS documentation, designation and effectiveness requirements cannot be met in all circumstances, as a result derivatives do not qualify for hedge accounting and are recorded at fair value through the Statement of Income.
* Excludes Abacus Hospitality Fund, Abacus Diversified Income Fund II, Abacus Miller Street Holding Trust and Abacus Wodonga Land Fund.
For
per
sona
l use
onl
y
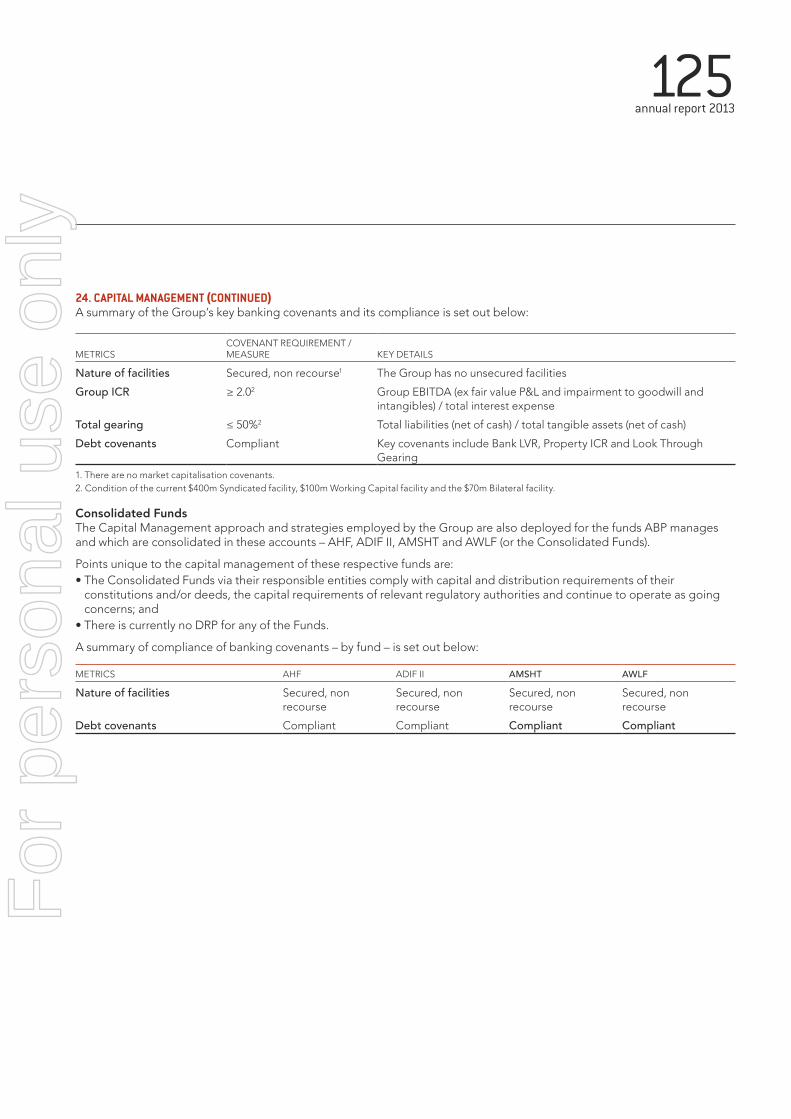
125 annual report 2013
24. CAPITAL MANAGEMENT (CONTINUED)A summary of the Group’s key banking covenants and its compliance is set out below:
METRICSCOVENANT REQUIREMENT / MEASuRE KEy DETAILS
Nature of facilities Secured, non recourse1 The Group has no unsecured facilities
Group ICR ≥ 2.02 Group EBITDA (ex fair value P&L and impairment to goodwill and intangibles) / total interest expense
Total gearing ≤ 50%2 Total liabilities (net of cash) / total tangible assets (net of cash)
Debt covenants Compliant Key covenants include Bank LVR, Property ICR and Look Through Gearing
1. There are no market capitalisation covenants.2. Condition of the current $400m Syndicated facility, $100m Working Capital facility and the $70m Bilateral facility.
Consolidated FundsThe Capital Management approach and strategies employed by the Group are also deployed for the funds ABP manages and which are consolidated in these accounts – AHF, ADIF II, AMSHT and AWLF (or the Consolidated Funds).
Points unique to the capital management of these respective funds are:• The Consolidated Funds via their responsible entities comply with capital and distribution requirements of their
constitutions and/or deeds, the capital requirements of relevant regulatory authorities and continue to operate as going concerns; and
• There is currently no DRP for any of the Funds.
A summary of compliance of banking covenants – by fund – is set out below:
METRICS AHF ADIF II AMSHT AWLF
Nature of facilities Secured, non recourse
Secured, non recourse
Secured, non recourse
Secured, non recourse
Debt covenants Compliant Compliant Compliant Compliant
For
per
sona
l use
onl
y

126 abacus property group
NOTES TO THE FINANCIAL STATEMENTS 30 JUNE 2013CONTINUED
25. INTEREST IN SUBSIDIARIES(a) Interest in subsidiaries with material non-controlling interest (“NCI”)
The Group has the following subsidiaries with material non-controlling interest:
NAME OF ENTITy
PRINCIPAL PLACE OF BuSINESS
% HELD By NCI
(PROFIT)/LOSS ALLOCATED TO
NCI $’000
ACCuMuLATED NCI
$’000
30 June 2013Abacus Hospitality Fund* Australia 90 (5,278) 30,041
Abacus Miller Street Holding Trust Australia 70 445 4,329
Abacus Wodonga Land Fund^ Australia 85 – –
(4,833) 34,370
30 June 2012Abacus Hospitality Fund Australia 90 3,874 32,039
Abacus Storage Fund** Australia 80 (3,098) –
Abacus Miller Street Holding Trust Australia 70 358 5,375
1,134 37,414
The country of incorporation is the same as the principal place of business, unless stated otherwise.
* The Abacus working capital facility ranks pari passu for downside but not on upside at fund wind up.^ Abacus Wodonga Land Fund consolidated into the Group on 30 June 2013, therefore, there is no profit and loss.** The Abacus Storage Fund merged with the Abacus Property Group in March 2012. Therefore, the only profit and loss had material non-controlling interest
for the period 1 July 2011 to 6 March 2012 with the statement of financial position being Nil.
Significant RestrictionsThere are no significant restrictions.
(b) Summarised financial information about subsidiary with material NCI
Summarised statement of financial position
ABACuS HOSPITALITy FuND2013
$’0002012
$’000
Current assets 15,758 27,326
Current liabilities (67,790) (7,461)
Net current assets (52,032) 19,865
Non-current assets 148,682 152,190
Non-current liabilities (117,798) (184,925)
Net non-current assets 30,884 (32,735)
Net deficiency (21,148) (12,870)
For
per
sona
l use
onl
y

127 annual report 2013
25. INTEREST IN SUBSIDIARIES (CONTINUED)(b) Summarised financial information about subsidiary with material NCI (continued)
ABACuS MILLER STREET HOLDING TRuST2013
$’0002012
$’000
Current assets 62,214 63,365
Current liabilities (35,682) (828)
Net current assets 26,532 62,537
Non-current assets – –
Non-current liabilities (20,348) (54,859)
Net non-current assets (20,348) (54,859)
Net assets 6,184 7,678
ABACuS WODONGA LAND FuND2013
$’0002012
$’000
Current assets 10,978 –
Current liabilities (173) –
Net current assets 10,805 –
Non-current assets 21,084 –
Non-current liabilities (48,053) –
Net non-current assets (26,969) –
Net deficiency (16,164) –
Summarised statement of comprehensive income
ABACuS HOSPITALITy FuND2013
$’0002012
$’000
Revenue 53,841 51,064
Profit / (loss) before income tax 628 (9,802)Income tax expense (891) 8
Profit / (loss) after tax (263) (9,794)Other comprehensive income (5,372) 4,789
Total comprehensive income / (expense) (5,635) (5,005)
ABACuS MILLER STREET HOLDING TRuST2013
$’0002012
$’000
Revenue 3,743 5,627
Loss before income tax (637) (515)Income tax expense – –
Loss after tax (637) (515)Other comprehensive income – –
Total comprehensive income / (expense) (637) (515)
For
per
sona
l use
onl
y
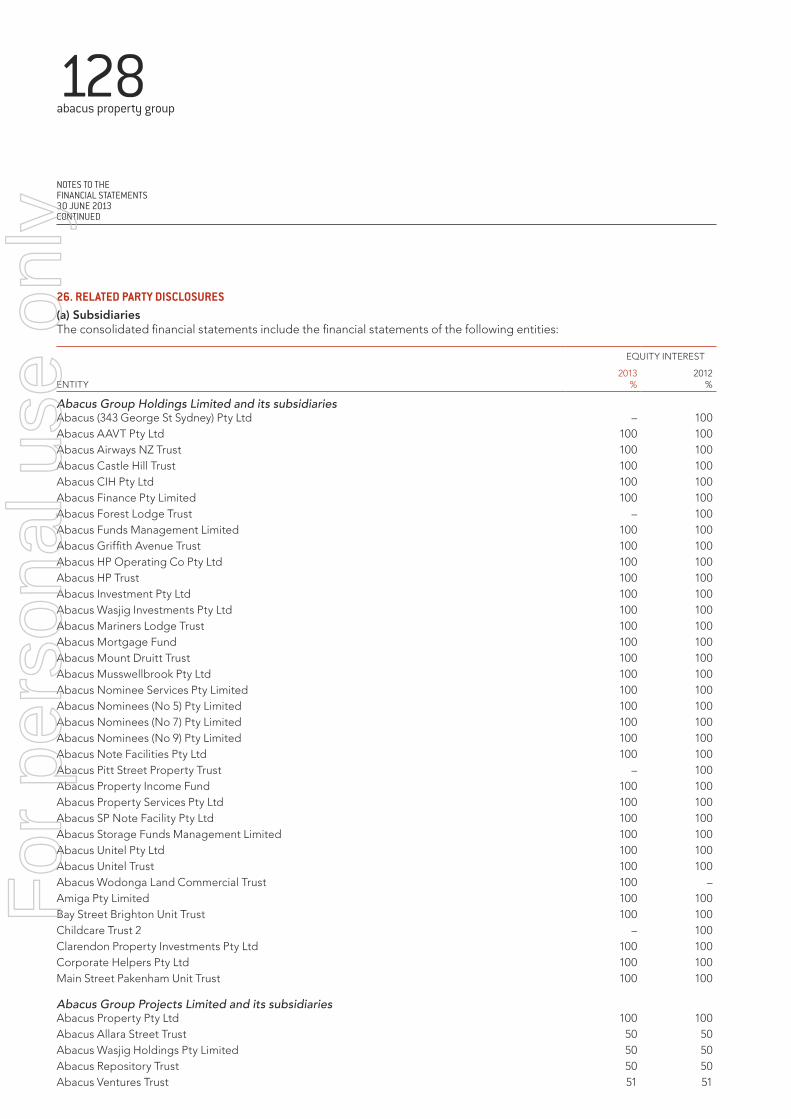
128 abacus property group
NOTES TO THE FINANCIAL STATEMENTS 30 JUNE 2013CONTINUED
26. RELATED PARTY DISCLOSURES(a) SubsidiariesThe consolidated financial statements include the financial statements of the following entities:
EquITy INTEREST
ENTITy2013
%2012
%
Abacus Group Holdings Limited and its subsidiariesAbacus (343 George St Sydney) Pty Ltd – 100Abacus AAVT Pty Ltd 100 100Abacus Airways NZ Trust 100 100Abacus Castle Hill Trust 100 100Abacus CIH Pty Ltd 100 100Abacus Finance Pty Limited 100 100Abacus Forest Lodge Trust – 100Abacus Funds Management Limited 100 100Abacus Griffith Avenue Trust 100 100Abacus HP Operating Co Pty Ltd 100 100Abacus HP Trust 100 100Abacus Investment Pty Ltd 100 100Abacus Wasjig Investments Pty Ltd 100 100Abacus Mariners Lodge Trust 100 100Abacus Mortgage Fund 100 100Abacus Mount Druitt Trust 100 100Abacus Musswellbrook Pty Ltd 100 100Abacus Nominee Services Pty Limited 100 100Abacus Nominees (No 5) Pty Limited 100 100Abacus Nominees (No 7) Pty Limited 100 100Abacus Nominees (No 9) Pty Limited 100 100Abacus Note Facilities Pty Ltd 100 100Abacus Pitt Street Property Trust – 100Abacus Property Income Fund 100 100Abacus Property Services Pty Ltd 100 100Abacus SP Note Facility Pty Ltd 100 100Abacus Storage Funds Management Limited 100 100Abacus unitel Pty Ltd 100 100Abacus unitel Trust 100 100Abacus Wodonga Land Commercial Trust 100 –Amiga Pty Limited 100 100Bay Street Brighton unit Trust 100 100Childcare Trust 2 – 100Clarendon Property Investments Pty Ltd 100 100Corporate Helpers Pty Ltd 100 100Main Street Pakenham unit Trust 100 100
Abacus Group Projects Limited and its subsidiariesAbacus Property Pty Ltd 100 100Abacus Allara Street Trust 50 50Abacus Wasjig Holdings Pty Limited 50 50Abacus Repository Trust 50 50Abacus Ventures Trust 51 51
For
per
sona
l use
onl
y

129 annual report 2013
26. RELATED PARTY DISCLOSURES (CONTINUED)(a) Subsidiaries (continued)
EquITy INTEREST
ENTITy2013
%2012
%
Abacus Trust and its subsidiaries:Abacus 1769 Hume Highway Trust 100 100Abacus Alderley Trust 100 100Abacus Alexandria Trust 100 100Abacus Ashfield Mall Property Trust 100 100Abacus Birkenhead Point Trust 100 100Abacus Browns Road Trust 100 –Abacus Campbell Property Trust 100 100Abacus Epping Park Property Trust – 100Abacus Greenacre Trust 100 100Abacus Australian Aggregation Holding Trust 100 100Abacus Hurstville Trust 100 100Abacus Industrial Property Trust 100 100Abacus Lisarow Trust 100 100Abacus Liverpool Plaza Trust 100 100Abacus Macquarie Street Trust 100 100Abacus Moorabbin Trust 100 100Abacus Moore Street Trust 100 100Abacus Northshore Trust 1* 25 25Abacus Northshore Trust 2* 25 25
Abacus North Sydney Car park Trust 100 100Abacus Premier Parking Trust 100 100Abacus Sanctuary Holdings Pty Limited* 25 25Abacus Shopping Centre Trust 100 100Abacus Smeaton Grange Trust 100 100Abacus SP Fund 100 100Abacus Varsity Lakes Trust 100 100Abacus Virginia Trust 100 100Abacus Westpac House Trust 100 100Abacus 14 Martin Place Trust 100 100Abacus 171 Clarence Street Trust 100 100Abacus 309 George Street Trust 100 100Abacus 33 queen Street Trust 100 –
Abacus Income Trust and its subsidiaries:Abacus Campbellfield Trust 100 100Abacus Chermside Trust – 100Abacus Eagle Farm Trust 100 100Abacus Independent Retail Property Trust 75 75Abacus Lennons Plaza Trust 100 100Abacus Mertz Apartments – 100Abacus Retail Property Trust 100 100Abacus Stafford Trust – 100Abacus Tamworth Retail Trust – 100Abacus Wollongong Property Trust 100 100* These entities are wholly owned by Abacus
For
per
sona
l use
onl
y

130 abacus property group
NOTES TO THE FINANCIAL STATEMENTS 30 JUNE 2013CONTINUED
26. RELATED PARTY DISCLOSURES (CONTINUED)(a) Subsidiaries (continued)
EquITy INTEREST
ENTITy2013
%2012
%
Abacus Storage Operations Limited and its subsidiaries:Balmain Storage Pty Limited 100 100Abacus Storage (Bulleen and Greensborough) Pty Limited 100 100Abacus Storage NZ Operations Pty Limited 100 100Abacus Storage Solutions Pty Limited 100 100Abacus Storage Solutions NZ Pty Limited 100 100Abacus uSI C Trust 100 100Abacus u Stow It A1 Trust 100 100Abacus u Stow It B1 Trust 100 100Abacus u Stow It A2 Trust 100 100Abacus u Stow It B2 Trust 100 100u Stow It Holdings Limited 100 100u Stow It Pty Limited 100 100
Abacus Storage Property Trust and its subsidiary:Abacus Storage NZ Property Trust 100 100
Abacus Diversified Income Fund II – –Abacus Hospitality Fund 10 10Abacus Miller Street Holding Trust 30 30Abacus Wodonga Land Fund 15 15
Subsidiaries controlled by the Group with material non-controlling interestAbacus Hospitality Fund: The Group is deemed under AASB10 Consolidated Financial Statements to have control of AHF based upon the aggregate impact of (a) the Group’s role as responsible entity of AHF and (b) the size and variable nature of returns arising from the Group’s loans to AHF (as the loans provided by the Group to AHF rank pari passu for downside but not on upside at fund wind up).
Abacus Diversified Income Fund II: The Group is deemed under AASB10 Consolidated Financial Statements to have control of ADIFII based upon the aggregate impact of (a) the Group’s role as responsible entity of ADIFII (b) the size and variable nature of returns arising from the Group’s loans to ADIFII (as the Abacus Working Capital Facility provided by the Group to ADIFII ranks pari passu on downside, but not the upside, at wind up) and (c) the capital and income guarantees made by the Group to unitholders of ADIFII under the ADIFII offer documents.
Abacus Miller Street Holding Trust: The Group is deemed under AASB10 Consolidated Financial Statements to have control of AMSHT a) the Group’s role as responsible entity of AMSHT and (b) the Group’s 30% direct interest in the fund and the relative dispersion of the remaining interests not held by the Group.
Abacus Wodonga Land Fund: The Group is deemed under AASB10 Consolidated Financial Statements to have control of AWLF a) the Group’s role as responsible entity of AWLF (waiving of fees) and (b) the Group’s 15% direct interest in the fund and the relative dispersion of the remaining interests not held by the Group.
(b) Ultimate parentAGHL has been designated as the parent entity of the Group.
(c) Key Management PersonnelDetails of key management personnel are disclosed in Note 28.
For
per
sona
l use
onl
y

131 annual report 2013
26. RELATED PARTY DISCLOSURES (CONTINUED)(d) Transactions with related parties
2013 $’000
2012 $’000
Transactions with related parties other than associates and joint venturesRevenuesProperty management fees received / receivable 169 153
Transactions with associates and joint venturesRevenuesManagement fees received / receivable from joint ventures 2,163 1,394
Management fees received / receivable from associates 279 557
Distributions received / receivable from joint ventures 6,466 5,818
Interest revenue from associates – 3,507
Interest revenue from joint ventures 1,352 1,122
Other transactionsLoan advanced to associates – (8,186)
Loan repayments from associates – 4,527
Loan advanced to joint ventures (3,461) (134)
Loan repayments from joint ventures – 2,860
Loan advanced from joint ventures 2,083 1,929
Impairment charge – (3,507)
Purchase of property from associates 6,345 –
Terms and conditions of transactionsSales and fees to and purchases and fees charged from related parties are made in arm’s length transactions both at normal market prices and on normal commercial terms.
Outstanding balances at year-end are unsecured and settlement occurs in cash.
No provision for doubtful debts has been recognised or bad debts incurred with respect to amounts payable or receivable from related parties during the year.
For
per
sona
l use
onl
y

132 abacus property group
NOTES TO THE FINANCIAL STATEMENTS 30 JUNE 2013CONTINUED
26. RELATED PARTY DISCLOSURES (CONTINUED)(d) Transactions with related parties (continued)Entity with significant influenceCalculator Australia Pty Ltd (“Kirsh”) is a significant securityholder in the Group with a holding of approximately 47% of the ordinary securities of the Group (2012: 41%).
During the year, Abacus Property Services Pty Ltd was engaged to manage the following properties:
PROPERTy RELATIONSHIP WITH KIRSH CHARGE PER ANNuM AMT $
Birkenhead Point Shopping Centre Tenants in common 3% of gross rental 548,955
14 Martin Place Tenants in common 3% of gross rental 286,991
4 Martin Place 100% owned by Kirsh 3% of gross rental 169,499
Birkenhead Point Marina Pty Ltd Joint Venture 3% of gross rental 55,414
During the year, Abacus Funds Management Limited charged an asset management fee to the following entities:
PROPERTy RELATIONSHIP WITH KIRSH CHARGE PER ANNuM AMT $
Birkenhead Point Shopping Centre Tenants in common 0.2% of gross assets 396,075
Mrs Myra Salkinder is a non-executive director of the Group and is a senior executive of Kirsh.
For
per
sona
l use
onl
y

133 annual report 2013
27. CONSOLIDATION OF ABACUS WODONGA LAND FUNDOn 30 June 2013, the Group consolidated Abacus Wodonga Land Fund in application of AASB 10 Consolidated Financial Statements. This is due to the combination of APG’s role as responsible entity and variable returns arising from its equity and loan investments in this fund. A loss on consolidation was incurred of $18.9 million.
The fair value of the net assets of Abacus Wodonga Land Fund at the date of consolidation are set out below:
$’000
CURRENT ASSETSCash and cash equivalents 2,042
Trade and other receivables 428
Inventory 7,763
TOTAL CURRENT ASSETS 10,233
NON-CURRENT ASSETSInventory 19,037
Property, plant and equipment 13
TOTAL NON-CURRENT ASSETS 19,050
TOTAL ASSETS 29,283
CURRENT LIABILITIESTrade and other payables 174
TOTAL CURRENT LIABILITIES 174
NON-CURRENT LIABILITIESInterest-bearing loans and borrowings 6,657
Related party loans 19,495
Derivatives at fair value 2,957
TOTAL NON-CURRENT LIABILITIES 29,109
TOTAL LIABILITIES 29,283
NET ASSETS – For
per
sona
l use
onl
y

134 abacus property group
NOTES TO THE FINANCIAL STATEMENTS 30 JUNE 2013CONTINUED
28. KEY MANAGEMENT PERSONNEL(a) Compensation for Key Management Personnel
2013 $’000
2012 $’000
Short-term employee benefits 6,319,507 5,879,867
Post-employment benefits 262,650 337,730
Other long-term benefits 148,886 94,306
Security-based payments 880,297 –
7,611,340 6,311,903
(b) Security holdings of Key Management PersonnelSecurities held in Abacus Property Group (number)
30 JUNE 2013BALANCE
1 JULY 2012APPOINTED/
(RETIRED)PURCHASES/
(SALES)BALANCE
30 JUNE 13
DirectorsJ Thame 55,364 – – 55,364
F Wolf 2,837,464 – – 2,837,464
W Bartlett 22,806 – – 22,806
D Bastian 545,000 (545,000) – –
M Irving 29,063 – 2,408 31,471
ExecutivesC Aarons – 26,889 – 26,889
R de Aboitiz 33,425 (33,425) – –
R Baulderstone – 5,378 – 5,378
P Strain 57,577 – (19,190) 38,387
E Varejes 75,414 – – 75,414
Total 3,656,113 (546,158) (16,782) 3,093,173
30 JUNE 2012BALANCE
1 JULY 2011APPOINTED/
(RETIRED)PURCHASES/
(SALES)BALANCE
30 JUNE 12
DirectorsJ Thame 55,364 – – 55,364
F Wolf 2,837,464 – – 2,837,464
W Bartlett 22,806 – – 22,806
D Bastian 900,000 – (355,000) 545,000
M Irving 26,718 – 2,345 29,063
ExecutivesR de Aboitiz 3,939 – 29,486 33,425
L Lloyd 11,185 – (11,185) –
P Strain 32,590 – 24,987 57,577
E Varejes 61,975 – 13,439 75,414
Total 3,952,041 – (295,928) 3,656,113 All equity transactions with key management personnel other than those arising from the exercise of remuneration options have been entered into under terms and conditions no more favourable than those the Group would have adopted if dealing at arm’s length.
For
per
sona
l use
onl
y

135 annual report 2013
28. KEY MANAGEMENT PERSONNEL (CONTINUED)(c) Loans to Key Management PersonnelThere were no loans to individuals that exceeded $100,000 at any time in 2013 or in the prior year.
(d) Other transactions and balances with Key Management Personnel and their related partiesDuring the financial year, transactions occur between the Group and Key Management Personnel which are within normal employee, customer or supplier relationship on terms and conditions no more favourable to than those with which it is reasonable to expect the entity would have adopted if dealing with Key Management Personnel or director-related entity at arm’s length in similar circumstances including, for example, performance of contracts of employment, the reimbursement of expenses and the payment of distributions on their stapled securities in the Group and on their investment in various Trusts managed by Abacus Funds Management Limited as Responsible Entity.
29. SECURITY BASED PAYMENTS(a) Recognised security payment expensesThe expense recognised for employee services received during the year is as follows:
2013 $’000
2012 $’000
Expense arising from equity-settled payment transactions 1,168 –
The security-based payment are described below.
(b) Type of security-based payment planSecurity Acquisition Rights (SARs)The deferred variable incentive plan has been designed to align the interests of executives with those of securityholders by providing for a significant portion of the remuneration of participating executives to be linked to the delivery of sustainable underlying profit that covers the distribution level implicit in the Group’s security price.
Key executives have been allocated SARs in the current financial year generally equal to the last current variable incentive paid. Allocations were based on the performance assessment completed in determining current variable incentive awards for the prior financial year, adjusted to take into account other factors that the Board considers specifically relevant to the purpose of providing deferred variable incentives.
The SARs granted during the year vest as follows:
VESTING DATE AMOuNT VESTED*
POTENTIAL NuMBER TO VEST
September 2013 One quarter of the initial issue 232,313
September 2014 One quarter of the initial issue 232,313
September 2015 One quarter of the initial issue 232,313
September 2016 One quarter of the initial issue 232,313
* The Board is able to claw back unvested SARs if the distribution level fails by more than 10% below the sustainable annual distribution rate.
For valuation purposes the SARs are equivalent to European call options (in that they may be “exercised” only at their maturity (i.e. vesting date)). The fair value of the SARs granted is estimated at the date of the grant using a trinomial tree model (using 500 steps) cross checked by a modified Black-Scholes model. The trinomial tree model and the Black-Scholes model generally produce the same values for an option over a non-dividend paying share, or where the option is entitled to the same distributions as are paid on the underlying security, as is assumed in this case, and if the time to exercise is the same, (i.e. at the end of the term).
When SARs vest they will convert into ABP securities on a one for one basis or at the Board’s discretion a cash equivalent amount will be paid.
For
per
sona
l use
onl
y

136 abacus property group
NOTES TO THE FINANCIAL STATEMENTS 30 JUNE 2013CONTINUED
29. SECURITY BASED PAYMENTS (CONTINUED)(c) Summary of SARs grantedThe following table illustrates movements in SARs during the year:
2013 NO.
2012 NO.
Opening balance – 2,976,923
Granted during the year 929,252 12,785,714
Cancelled during the year – (15,762,637)
Outstanding at the end of the year 929,252 –
Exercisable at the end of the year – –
The weighted average remaining life of the instrument at 30 June 2013 was 1.8 years (2012 N/A).
The weighted average fair value of the SARs granted during the year was $2.41 (2012 N/A).
The following table lists the inputs to the model used for the SARs plan for the year ended 30 June 2013:
2013 2012
Expected volatility (%) 20-25 n/a
Risk-free interest rate (%) 2.55-2.67 n/a
Life of instrument (years) 0.3-3.3 n/a
Model used Trinomial n/a
The expected life of the SARs is based on historical data and current expectations and is not necessarily indicative of exercise patterns that may occur. The expected volatility reflects the assumption that the historical volatility over a period similar to the life of the SARs is indicative of future trends, which may not necessarily be the actual outcome.
For
per
sona
l use
onl
y

137 annual report 2013
30. OTHER FINANCIAL LIABILITIESAbacus Property Group*
The Group has provided the following guarantees to the ADIFII unitholders:
uNIT TyPE CASH DISTRIBuTION yIELD GuARANTEE CAPITAL RETuRN GuARANTEE
Class A $1.00 $1.00 per unit on 30 September 2013.
Class B $1.00 9% pa plus indexation (indexed in line with inflation in each year after 1 July 2011).
$1.00 per unit at Fund termination (no later than 30 June 2017).
Class C $0.75 9% pa plus indexation (indexed in line with inflation in each year after 1 July 2011).
$0.75 per unit at Fund termination (no later than 30 June 2017).
The underwritten Distributions will be achieved by deferring the interest on the Working Capital Facility or by deferring any of the fees payable to the Group under the constitution of ADIFII (or a combination of these things) or in any other way the Group considers appropriate. Any interest or fee deferral or other funding support may be recovered if the actual cash distribution exceeds the cash required to meet the underwritten distribution at the expiration of the Fund term or on a winding up of the Fund.
The Underwritten Capital Return will apply to all ADIFII units on issue as at 1 July 2013 (Class A) or on or after 1 July 2016 (Class B and C). At the time the Group will make an offer to acquire each Class A unit for $1.00, or ensure that each holder of Class B units receives back their $1.00 initial capital and each holder of Class C units receives back their $0.75 initial capital. The Underwritten Capital returns can be satisfied at the Group’s discretion (Class A) through either a payment in cash or by the Group issuing stapled securities in APG to an equivalent value based on the 10 day volume weighted average price of APG’s stapled securities over the period ending on 30 June 2013 or prior to issuing stapled securities as applicable.
After 30 June 2016 the Group will, if required, set off all or part of the principal of the second secured Working Capital Facility loan provided to ADIFII in satisfaction of the Group’s obligations in respect of the underwritten Capital Return in respect of the Class B and Class C units.
As a result of the consolidation of ADIFII under AASB10 the underwritten capital guarantee results in ADIFII’s units on issue being classified as a liability and at the end of the period the value was $56.3 million (2012: $56.3 million).
The offer document for ADIFII was closed in December 2011 and no further equity will be raised. The actual guarantee exposure (if any) will be determined at the maturity date of the first capital guarantee in September 2013 ($11 million or 20% of the total guarantee exposure) and the balance of the guarantee exposure will be determined at Fund termination no later than 30 June 2017.
* Excludes Abacus Hospitality Fund, Abacus Diversified Income Fund II, Abacus Miller Street Holding Trust and Abacus Wodonga Land Fund.
For
per
sona
l use
onl
y
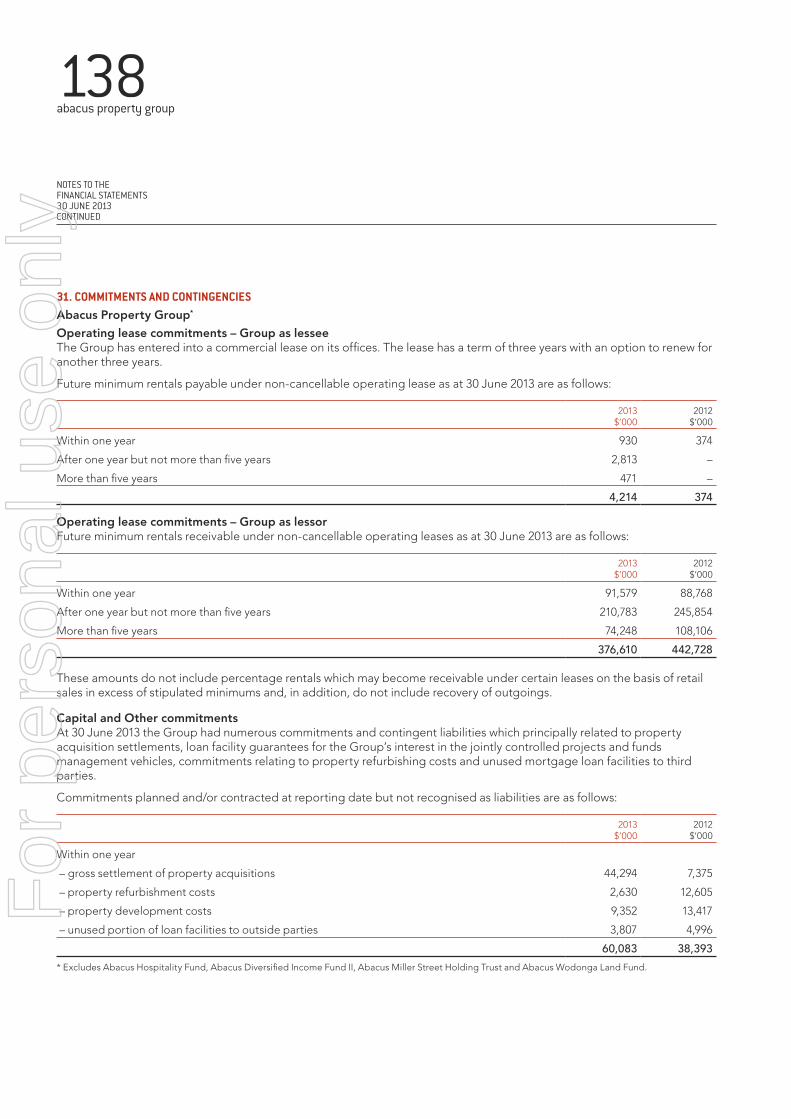
138 abacus property group
NOTES TO THE FINANCIAL STATEMENTS 30 JUNE 2013CONTINUED
31. COMMITMENTS AND CONTINGENCIESAbacus Property Group*
Operating lease commitments – Group as lesseeThe Group has entered into a commercial lease on its offices. The lease has a term of three years with an option to renew for another three years.
Future minimum rentals payable under non-cancellable operating lease as at 30 June 2013 are as follows:
2013 $’000
2012 $’000
Within one year 930 374
After one year but not more than five years 2,813 –
More than five years 471 –
4,214 374
Operating lease commitments – Group as lessorFuture minimum rentals receivable under non-cancellable operating leases as at 30 June 2013 are as follows:
2013 $’000
2012 $’000
Within one year 91,579 88,768
After one year but not more than five years 210,783 245,854
More than five years 74,248 108,106
376,610 442,728
These amounts do not include percentage rentals which may become receivable under certain leases on the basis of retail sales in excess of stipulated minimums and, in addition, do not include recovery of outgoings.
Capital and Other commitmentsAt 30 June 2013 the Group had numerous commitments and contingent liabilities which principally related to property acquisition settlements, loan facility guarantees for the Group’s interest in the jointly controlled projects and funds management vehicles, commitments relating to property refurbishing costs and unused mortgage loan facilities to third parties.
Commitments planned and/or contracted at reporting date but not recognised as liabilities are as follows:
2013 $’000
2012 $’000
Within one year
– gross settlement of property acquisitions 44,294 7,375
– property refurbishment costs 2,630 12,605
– property development costs 9,352 13,417
– unused portion of loan facilities to outside parties 3,807 4,996
60,083 38,393 * Excludes Abacus Hospitality Fund, Abacus Diversified Income Fund II, Abacus Miller Street Holding Trust and Abacus Wodonga Land Fund.
For
per
sona
l use
onl
y

139 annual report 2013
31. COMMITMENTS AND CONTINGENCIES (CONTINUED)Capital and Other commitments (continued)In accordance with Group policy, the fair value of all guarantees are estimated each period and form part of the Group’s reported AIFRS results. There has been no other material change to any contingent liabilities or contingent assets.
2013 $’000
2012 $’000
Contingent liabilities:Within one year
– corporate guarantee 5,060 6,750
5,060 6,750
Abacus Diversified Income Fund II
Operating lease commitments – as lessorFuture minimum rentals receivable under non-cancellable operating leases as at 30 June 2013 are as follows:
2013 $’000
2012 $’000
Within one year 13,025 14,168
After one year but not more than five years 32,579 40,714
More than five years 8,744 16,143
54,348 71,025
These amounts do not include percentage rentals which may become receivable under certain leases on the basis of retail sales in excess of stipulated minimums and, in addition, do not include recovery of outgoings.
Capital and Other commitments
2013 $’000
2012 $’000
Within one year
– property refurbishment costs 2,161 1,745
2,161 1,745
Abacus Miller Street Holding Trust
Operating lease commitments – as lessorFuture minimum rentals receivable under non-cancellable operating leases as at 30 June 2013 are as follows:
2013 $’000
2012 $’000
Within one year 4,702 5,047
After one year but not more than five years 17,768 18,211
More than five years 171 3,818
22,641 27,076
These amounts do not include percentage rentals which may become receivable under certain leases on the basis of retail sales in excess of stipulated minimums and, in addition, do not include recovery of outgoings.
For
per
sona
l use
onl
y

140 abacus property group
NOTES TO THE FINANCIAL STATEMENTS 30 JUNE 2013CONTINUED
31. COMMITMENTS AND CONTINGENCIES (CONTINUED)Abacus Wodonga Land Fund
Capital and Other commitments
2013 $’000
2012 $’000
Within one year
– property development costs 1,130 –
1,130 –
32. AUDITOR’S REMUNERATION2013
$’0002012
$’000
Amounts received or due and receivable by Ernst & Young Australia for:
– an audit of the financial report of the entity and any other entity in the consolidated entity 977,390 958,000
– transactional advisory services – 262,300
– other assurance services 40,800 –
1,018,190 1,220,300
33. EVENTS AFTER BALANCE SHEET DATEOther than as disclosed in this report, there has been no other matter or circumstance that has arisen since the end of the financial year that has significantly affected, or may affect, the Group’s operations in future financial years, the results of those operations or the Group’s state of affairs in future financial years.
For
per
sona
l use
onl
y

141 annual report 2013
In accordance with a resolution of the Directors of Abacus Group Holdings Limited, we state that:
In the opinion of the directors:
a. the financial statements, notes and the additional disclosures included in the directors’ report designated as audited, of the company and of the consolidated entity are in accordance with the Corporations Act 2001, including:
(i) giving a true and fair view of the company’s and consolidated entity’s financial position as at 30 June 2013 and of their performance for the year ended on that date; and
(ii) complying with Australian Accounting Standards (including Australian Accounting Interpretations) and the Corporations Regulations 2001;
b. the financial report also complies with International Financial Reporting Standards as disclosed in Note 2(b); and
c. there are reasonable grounds to believe that the Company will be able to pay its debts as and when they become due and payable.
This declaration has been made after receiving the declarations required to be made to the directors in accordance with sections 295A of the Corporations Act 2001 for the financial year ended 30 June 2013.
On behalf of the Board
John Thame Frank Wolf Chairman Managing DirectorSydney, 28 August 2013
DIRECTOR’S DECLARATION
For
per
sona
l use
onl
y

142 abacus property group
NOTES TO THE FINANCIAL STATEMENTS 30 JUNE 2013CONTINUED
For
per
sona
l use
onl
y

143 annual report 2013
For
per
sona
l use
onl
y

144 abacus property group
This report sets out the Group’s position relating to each of the ASX Corporate Governance Council Principles of Good Corporate Governance during the year. Additional information, including charters and policies, is available through a dedicated corporate governance information section on the About Abacus tab on the Abacus website at www.abacusproperty.com.au.
Principle 1: Lay solid foundations for management and oversightRecommendation 1.1The Board has adopted a charter that sets out the functions and responsibilities reserved by the Board, those delegated to the Managing Director and those specific to the Chairman. The conduct of the Board is also governed by the Constitution.
The roles of Chairman and Managing Director are not exercised by the same individual.
The primary responsibilities of the Board and the Managing Director are set out in the Board Charter.
Senior executives reporting to the Managing Director have their roles and responsibilities defined in position descriptions and are given a letter of appointment on commencement.
The Board Charter and Constitution are available on the Abacus website.
Recommendation 1.2Induction procedures are in place for all staff (including senior executives) that include a briefing on relevant aspects of Abacus’ financial position, strategies, operations and risk management policies as well as the respective rights, duties and responsibilities of the Board and senior executives.
Each year the Board, with the assistance of the Managing Director, and the Remuneration and Nomination Committee undertakes a formal process of reviewing the performance of senior executives. The measures generally relate to the performance of Abacus and the performance of the executive individually. The Managing Director is not present at the Board or Remuneration and Nomination Committee meetings when his own remuneration and performance is being considered.
An annual review has taken place in the reporting period in accordance with the process outlined above.
Principle 2: Structure the board to add valueRecommendation 2.1The board comprises one executive director and four non-executive directors. The majority of the Board (Messrs Thame, Irving and Bartlett) are independent members. The board has determined that an independent director is one who:• is not a substantial security holder or an officer of, or is not otherwise associated directly with, a substantial security holder
of the Group;• has not within the previous three years been employed in any executive capacity;• has not within the last three years been a principal of a material professional adviser or a material consultant to the Group;
or an employee materially associated with the service provided;
CORPORATE GOVERNANCE REPORT
For
per
sona
l use
onl
y

145 annual report 2013
• is not a material supplier or customer of the Group, or an officer of or otherwise associated directly or indirectly with a material supplier or customer; or
• does not have a material contractual relationship with the Group other than as a director.
No independent non-executive director has a relationship significant enough to compromise their independence on the Board. Non-executive directors confer regularly without management present.
Any change in the independence of a non-executive director would be disclosed and explained to the market in a timely manner.
Given the nature of the Group’s business and current stage of development, the Board considers its current composition provides the necessary skills and experience to ensure a proper understanding of, and competence to deal with, the current and emerging issues of the business to optimise the financial performance of the Group and returns to securityholders. Details of the skills, experience and expertise of each director are set out on page 34.
Directors’ independent adviceDirectors may seek independent professional advice with the Chairman’s consent, which will not be unreasonably withheld or delayed, on any matter connected with the performance of their duties, and which advice will be at the Group’s expense.
Recommendation 2.2The Chairman of the Board (Mr John Thame) is an independent, non-executive director.
Recommendation 2.3The roles of Chairman and Chief Executive Officer/Managing Director are not exercised by the same individual.
The division of responsibility between the Chairman and Managing Director has been agreed by the Board and is set out in the Board Charter.
Recommendation 2.4The Board has established a Remuneration and Nomination Committee. The Committee’s charter sets its role, responsibilities and membership requirements. The members of the committee and their attendance at meetings are provided on page 35.
The Chairman of the committee is independent.
The Selection and Appointment of Non-Executive Directors Policy sets out the procedures followed when considering the appointment of new directors.
The Remuneration and Nomination Committee Charter and the Selection and Appointment of Non-Executive Directors Policy are available on the Abacus website.
The Board is committed to workplace diversity, with a particular focus on supporting the representation of women at a senior level of the Group and on the Board. The Diversity Policy is available on the Abacus website.
Over 48% of Abacus’ employees are women. Abacus has female representation at both the Board (20%) and senior management (14%) level. In 2011, the Board set female representation at Board level as a priority and this was met in April 2011 with the appointment of a female director. In the current period, Abacus has recruited from a diverse pool of candidates for all positions filled during the year and has a number of employees with flexible employment arrangements to take account of domestic responsibilities.F
or p
erso
nal u
se o
nly

146 abacus property group
CORPORATE GOVERNANCE REPORT 30 JuNE 2013CONTINuED
Recommendation 2.5The Board has a documented Performance Evaluation Policy which outlines the process for evaluating the performance of the Board, its committees and individual directors.
An annual review has taken place in the reporting period in accordance with the policy.
Principle 3: Promote ethical and responsible decision-makingRecommendation 3.1The Group’s Code of Conduct promotes ethical practices and responsible decision making by directors and employees. The Code deals with confidentiality of information, protection of company assets, disclosure of potential conflicts of interest and compliance with laws and regulations.
The Code of Conduct is available on the Abacus website.
Recommendation 3.2The Diversity Policy is available on the Abacus website.
The Board is committed to workplace diversity, with a particular focus on supporting the representation of women at a senior level of the Group and on the Board.
Over 48% of Abacus’ employees are women. In 2011, the Board set female representation at Board level and senior management as a priority. Abacus currently has female representation at both the Board (20%) and senior management (14%) level. Abacus has recruited from a diverse pool of candidates for all positions filled during the year and has a number of employees with flexible employment arrangements to take account of domestic responsibilities.
Principle 4: Safeguard integrity in financial reportingRecommendation 4.1, 4.2 and 4.3The Board has established an Audit and Risk Committee.
The Audit and Risk Committee comprises three independent non-executive directors and one non-independent non-executive director and the chairman of the Committee is not the chairman of the Board. The members of the committee and their attendance at meetings are provided on page 35. Other directors that are not members of the committee, the external auditor and other senior executives attend meetings by invitation.
The Audit and Risk Committee has a formal charter which sets out its specific roles and responsibilities, and composition requirements.
The procedures for the selection and appointment of the external auditor are set out in the Audit and Risk Committee Charter.
The Audit and Risk Committee Charter is available on the Abacus website.
Principle 5: Make timely and balanced disclosureRecommendation 5.1The Group has a policy and procedures designed to ensure compliance with ASX Listing Rule disclosure requirements. The Managing Director is responsible for ensuring that the Group complies with its disclosure obligations.
The Continuous Disclosure and Securityholder Communications Policy is available on the Abacus website.For
per
sona
l use
onl
y

147 annual report 2013
Principle 6: Respect the rights of securityholdersRecommendation 6.1The Group aims to keep securityholders informed of significant developments and activities of the Group. The Group’s website is updated regularly and includes annual and half-yearly reports, distribution history and all other announcements lodged with the ASX. The Abacus website also includes webcasts of the results briefings.
The Group keeps a summary record for internal use of the issues discussed at group and one-on-one briefings with investors and analysts, including a record of those present where appropriate.
The Continuous Disclosure and Securityholder Communications Policy is available on the Abacus website.
External auditorThe external auditor attends the annual general meetings of the Group and is available to answer securityholder questions.
Principle 7: Recognise and manage risk Recommendation 7.1 and 7.2The Business Risk Management Policy dealing with oversight and management of material business risks is set out in the corporate governance information section on the Abacus website.
The Group’s Risk Management Framework was developed in consultation with an external consultant. under the compliance plan, the responsible managers report regularly on the risks they manage and any emerging risks.
Independent consultants are engaged on an ad hoc basis who review business processes and undertake formal assessments throughout the year. These assessments are provided to the Audit and Risk Committee for review.
The Audit and Risk Committee has responsibility for reviewing the Group’s risk management framework.
The risk management framework is formally reviewed annually. This review is initially carried out by the Compliance and Risk Manager and then reviewed by the Audit and Risk Committee and the Board to assess any necessary changes.
Recommendation 7.3The Managing Director and Chief Financial Officer confirm in writing to the Board that the financial statements present a true and fair view and that this statement is based on a sound system of risk management and internal compliance. The statement also confirms that the statement is founded on a sound system of risk management and internal control and that the system is operating effectively in all material respects in relation to financial reporting risks.
For
per
sona
l use
onl
y

148 abacus property group
Principle 8: Remunerate fairly and responsiblyRecommendation 8.1The Board has established a Remuneration and Nomination Committee.
The Remuneration and Nomination Committee is responsible for assessing the processes for evaluating the performance of the Board and key executives.
A copy of the committee charter is available on the Abacus website. The Chairman of the Remuneration and Nomination Committee is independent.
The Group’s remuneration policies including security-based payment plans and the remuneration of key management personnel are discussed in the Remuneration Report.
The Remuneration and Nomination Committee may seek input from individuals on remuneration policies but no individual employee is directly involved in deciding their own remuneration.
The members of the committee and their attendance at meetings are provided on page 35.
Non-executive directors are paid fees for their service and do not participate in other benefits (with the exception of Group travel insurance cover) which may be offered other than those which are statutory requirements.
CORPORATE GOVERNANCE REPORT 30 JuNE 2013CONTINuED
For
per
sona
l use
onl
y

149 annual report 2013
Abacus Property Group is made up of the Abacus Trust, Abacus Income Trust, Abacus Storage Property Trust, Abacus Group Holdings Limited, Abacus Group Projects Limited and Abacus Storage Operations Limited. The responsible entity of the Abacus Trust and Abacus Income Trust is Abacus Funds Management Limited. The responsible entity of the Abacus Storage Property Trust is Abacus Storage Funds Management Limited. Unless specified otherwise, the following information is current as at 27 August 2013.
Number of holders of ordinary fully paid stapled securities 9,293
Voting rights attached to ordinary fully paid stapled securities one vote per stapled security
Number of holders holding less than a marketable parcel of ordinary fully paid stapled securities
685
Secretary, Abacus Funds Management Limited Ellis Varejes
Secretary, Abacus Storage Funds Management Limited
Secretary, Abacus Group Holdings Limited
Secretary, Abacus Group Projects Limited
Secretary, Abacus Storage Operations Limited
Registered office Level 34, Australia Square
Abacus Funds Management Limited 264-278 George Street
Abacus Storage Funds Management Limited Sydney NSW 2000
Abacus Group Holdings Limited +61 2 9253 8600
Abacus Group Projects Limited
Abacus Storage Operations Limited
Registry Boardroom Pty Limited
Level 7, 207 Kent Street
Sydney NSW 2000
+61 2 9290 9600
Other stock exchanges on which Abacus Property Group securities are quoted none
Number and class of restricted securities or securities subject to voluntary escrow that are on issue
none
There is no current on-market buy-back
SUBSTANTIAL SECURITYHOLDER NOTIFICATIONS
SECURITYHOLDERS NUMBER OF SECURITIES
Calculator Australia Pty Limited 213,046,573
ASX ADDITIONAL INFORMATION
For
per
sona
l use
onl
y

150 abacus property group
ASX ADDITIONAL INFORMATION 30 JuNE 2013CONTINuED
SECURITIES REGISTERNuMBER OF SECuRITIES NuMBER OF SECuRITyHOLDERS
1-1,000 1,480
1,001-5,000 3,403
5,001-10,000 2,184
10,001-100,000 2,142
100,001-over 84
Totals 9,293
TOP 20 LARGEST SECURITYHOLDINGS
HOLDER NAMENuMBER OF SECuRITIES % ISSuED SECuRITIES
CITICORP NOMINEES PTy LIMITED 171,356,914 37.131
CALCULATOR AUSTRALIA PTY LIMITED <CALCULATOR AUSTRALIA A/C> 42,747,587 9.263
J P MORGAN NOMINEES AUSTRALIA LIMITED 38,053,188 8.246
HSBC CuSTODy NOMINEES (AuSTRALIA) LIMITED 29,440,277 6.379
CALCULATOR AUSTRALIA PTY LIMITED <CALCULATOR AUSTRALIA A/C> 20,389,165 4.418
NATIONAL NOMINEES LIMITED 19,925,132 4.317
BNP PARIBAS NOMS PTY LTD <DRP> 9,101,391 1.972
JP MORGAN NOMINEES AUSTRALIA LIMITED <CASH INCOME A/C> 7,240,348 1.569
RBC INVESTOR SERVICES AUSTRALIA NOMINEES PTY LIMITED <PI POOLED A/C> 7,112,691 1.541
RBC INVESTOR SERVICES AUSTRALIA NOMINEES PTY LIMITED <APN A/C> 6,136,142 1.330
RBC INVESTOR SERVICES AUSTRALIA NOMINEES PTY LIMITED <BKCUST A/C> 4,866,468 1.054
CITICORP NOMINEES PTY LIMITED <COLONIAL FIRST STATE INV A/C> 4,496,801 0.974
EQUITY TRUSTEES LIMITED <EQT SGH PROPERTY INC FUND> 3,119,063 0.676
AUSTRALIAN EXECUTOR TRUSTEES LIMITED <NO 1 ACCOUNT> 2,810,916 0.609
BuTTONWOOD NOMINEES PTy LTD 2,103,863 0.456
PLuTEuS (NO 164) PyT LIMITED 1,484,742 0.322
F M WOLF PTy LIMITED 1,272,723 0.276
RBC INVESTOR SERVICES AUSTRALIA NOMINEES PTY LIMITED <PIIC A/C> 1,254,673 0.272
NULIS NOMINEES (AUSTRALIA) LIMITED <NAVIGATOR MAST PLAN SETT A/C> 1,214,209 0.263
NAVIGATOR AUSTRALIA LTD <MLC INVESTMENT SETT A/C> 1,213,264 0.263
For
per
sona
l use
onl
y

151 annual report 2013
NOTES
For
per
sona
l use
onl
y

152 abacus property group
NOTES
For
per
sona
l use
onl
y

Des
igne
d a
nd p
rod
uced
by
team
scop
e.co
m.a
u
AbAcus ProPerty GrouP
At 30 June 2012, Abacus Property Group comprised Abacus Trust, Abacus Income Trust, Abacus Storage Property Trust, Abacus Group Holdings Limited, Abacus Group Projects Limited and Abacus Storage Operations Limited. The Group structure is illustrated below.
AGHL has been identified as the parent entity of the Group. The financial reports of the Group for the year ended 30 June 2013 comprise the consolidated financial reports of AGHL and its controlled entities, AT and its controlled entities, AGPL and its controlled entities, AIT and its controlled entities, ASOL and its controlled entities, ASPT and its controlled entities, Abacus Hospitality Fund and its controlled entities, Abacus Diversified Income Fund II and its controlled entities, Abacus Miller Street Holding Trust and its controlled entity and Abacus Wodonga Land Fund.
GLossAry
Abacus Abacus Funds Management Limited, the responsible entity of the trusts
AGHL Abacus Group Holdings Limited
AGPL Abacus Group Projects Limited
AIT Abacus Income Trust
APG Abacus Property Group
ASOL Abacus Storage Operations Limited
ASPT Abacus Storage Property Trust
AT Abacus Trust
Group Abacus Property Group
AbAcus ProPerty GrouPListed Entities: AGHL/AGPL/ ASOL/AT/AIT/ASPT
Abacus Property Group has significant influence over these managed funds and the adoption of AASB 10 results in the consolidation of these funds.
Property Ventures
Office Storage
Retail Industrial
Other
Investment Portfolio
Funds Management
Abacus Miller Street
Fund
Abacus Hospitatlity
Funds
ADIF II
Abacus Wodonga Land
Fund
For
per
sona
l use
onl
y

2013abacus property group annual report
abacus property Grouplevel 34 australia Square264-278 George StreetSydney nSW 2000t +61 2 9253 8600F +61 2 9253 8616e [email protected]
www.abacusproperty.com.au
abacuS property Group 2013 annual report
For
per
sona
l use
onl
y