For personal use only - NRW Holdings · responsibilities of the Committee were also considered at...
92
ANNUAL FINANCIAL STATEMENTS FOR THE YEAR ENDED 30 June 2019 NRW HOLDINGS LIMITED (ASX: NWH) ABN 95 118 300 217 For personal use only
Transcript of For personal use only - NRW Holdings · responsibilities of the Committee were also considered at...
ANNUAL FINANCIAL STATEMENTSFOR THE YEAR ENDED 30 June 2019
NRW HOLDINGS LIMITED (ASX: NWH) ABN 95 118 300 217
For
per
sona
l use
onl
y

1
CORPORATE REGISTRY
DIRECTORS
MICHAEL ARNETT
Chairman and Non-Executive Director
JEFF DOWLING
Non-Executive Director
PETER JOHNSTON
Non-Executive Director
JULIAN PEMBERTON
Chief Executive Officer and Managing Director
COMPANY SECRETARY
KIM HYMAN
REGISTERED OFFICE
181 Great Eastern Highway Belmont WA 6104
Telephone: +61 8 9232 4200 Facsimile: +61 8 9232 4232 Email: [email protected]
AUDITOR
Deloitte Touche Tohmatsu Tower 2 Brookfield Place Level 9 123 St Georges Terrace Perth WA 6000
SHARE REGISTRY
Link Market Services Limited 178 St Georges Terrace Perth WA 6000
Telephone: +61 1300 554 474 Facsimile: +61 2 8287 0303
ASX CODE
NWH – NRW Holdings Limited Fully Paid Ordinary Shares
nrw.com.au
For
per
sona
l use
onl
y

2
DIRECTORS’ REPORT The Directors present their report together with the financial statements of NRW Holdings Limited (“the
Company”) and of the consolidated group (also referred to as “the Group”), comprising the Company and its
subsidiaries, for the financial year ended 30 June 2019.
DIRECTORS
The following persons held office as Directors of NRW Holdings Limited during the financial year and up to the
date of this report:
MICHAEL ARNETT
Chairman and Non-Executive Director
Mr Arnett was appointed as a Non-Executive Director on 27 July 2007 and appointed Chairman on
9 March 2016.
Mr Arnett is a former consultant to, partner of and member of the Board of Directors and national head of the
Natural Resources Business Unit of the law firm Norton Rose Fulbright (formally Deacons). He has been
involved in significant corporate and commercial legal work for the resource industry for over 20 years.
JEFF DOWLING
Non-Executive Director
Mr Dowling was appointed as a Non-Executive Director on 21 August 2013.
Mr Dowling has 36 years’ experience in professional services with Ernst & Young. He has held numerous
leadership roles within Ernst & Young which focused on the mining, oil and gas and other industries.
Mr Dowling has a Bachelor of Commerce from the University of Western Australia and is a fellow of the Institute
of Chartered Accountants, the Australian Institute of Company Directors and the Financial Services Institute of
Australasia.
Mr Dowling has held the following directorships of listed companies in the three years immediately before the
end of the financial year:
• Chairman, S2 Resources Limited (Appointed 29 May 2015)
• Non-Executive Director, Fleetwood Corporation Limited (Appointed 1 July 2017)
• Non-Executive Director, Battery Minerals Limited (Appointed 25 January 2018)
PETER JOHNSTON
Non-Executive Director
Mr Johnston was appointed as a Non-Executive Director on 1 July 2016.
Mr Johnston has served with a number of national and international companies. Most recently he was appointed
Global Head of Nickel Assets for Glencore in 2013 and completed that role in December 2015. Prior to that role
he was Managing Director and Chief Executive Officer of Minara Resources Pty Ltd from 2001 to 2013.
Mr Johnston graduated from the University of Western Australia with a Bachelor of Arts majoring in psychology
and industrial relations.
Mr Johnston has held the following directorships of listed companies in the three years immediately before the
end of the financial year:
• Non-Executive Director, Tronox Ltd (NYSE) (Appointed 1 August 2012)
• Chairman, Jervois Mining Ltd (Appointed 19 June 2018)
For
per
sona
l use
onl
y
3
DIRECTORS’ REPORT (CONTINUED)
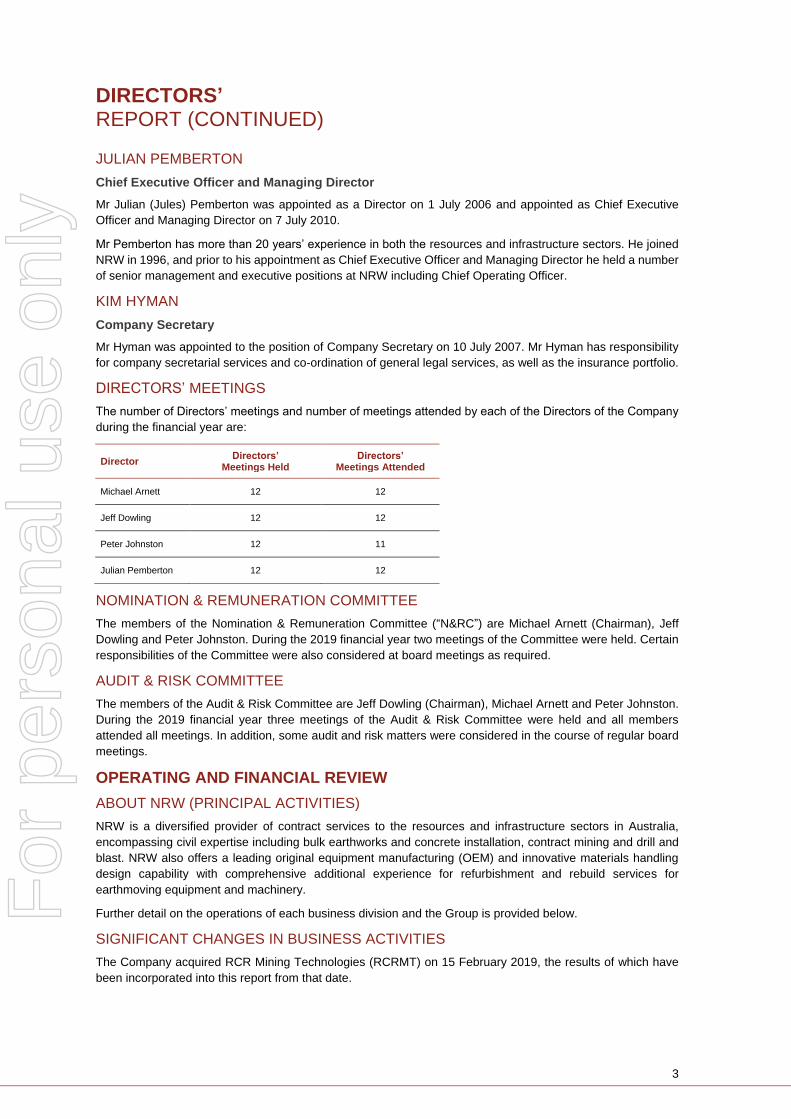
JULIAN PEMBERTON
Chief Executive Officer and Managing Director
Mr Julian (Jules) Pemberton was appointed as a Director on 1 July 2006 and appointed as Chief Executive
Officer and Managing Director on 7 July 2010.
Mr Pemberton has more than 20 years’ experience in both the resources and infrastructure sectors. He joined
NRW in 1996, and prior to his appointment as Chief Executive Officer and Managing Director he held a number
of senior management and executive positions at NRW including Chief Operating Officer.
KIM HYMAN
Company Secretary
Mr Hyman was appointed to the position of Company Secretary on 10 July 2007. Mr Hyman has responsibility
for company secretarial services and co-ordination of general legal services, as well as the insurance portfolio.
DIRECTORS’ MEETINGS
The number of Directors’ meetings and number of meetings attended by each of the Directors of the Company
during the financial year are:
Director Directors’
Meetings Held Directors’
Meetings Attended
Michael Arnett 12 12
Jeff Dowling 12 12
Peter Johnston 12 11
Julian Pemberton 12 12
NOMINATION & REMUNERATION COMMITTEE
The members of the Nomination & Remuneration Committee (“N&RC”) are Michael Arnett (Chairman), Jeff
Dowling and Peter Johnston. During the 2019 financial year two meetings of the Committee were held. Certain
responsibilities of the Committee were also considered at board meetings as required.
AUDIT & RISK COMMITTEE
The members of the Audit & Risk Committee are Jeff Dowling (Chairman), Michael Arnett and Peter Johnston.
During the 2019 financial year three meetings of the Audit & Risk Committee were held and all members
attended all meetings. In addition, some audit and risk matters were considered in the course of regular board
meetings.
OPERATING AND FINANCIAL REVIEW
ABOUT NRW (PRINCIPAL ACTIVITIES)
NRW is a diversified provider of contract services to the resources and infrastructure sectors in Australia,
encompassing civil expertise including bulk earthworks and concrete installation, contract mining and drill and
blast. NRW also offers a leading original equipment manufacturing (OEM) and innovative materials handling
design capability with comprehensive additional experience for refurbishment and rebuild services for
earthmoving equipment and machinery.
Further detail on the operations of each business division and the Group is provided below.
SIGNIFICANT CHANGES IN BUSINESS ACTIVITIES
The Company acquired RCR Mining Technologies (RCRMT) on 15 February 2019, the results of which have
been incorporated into this report from that date.
For
per
sona
l use
onl
y
4
DIRECTORS’ REPORT (CONTINUED)
GROUP RESULTS
FINANCIAL PERFORMANCE
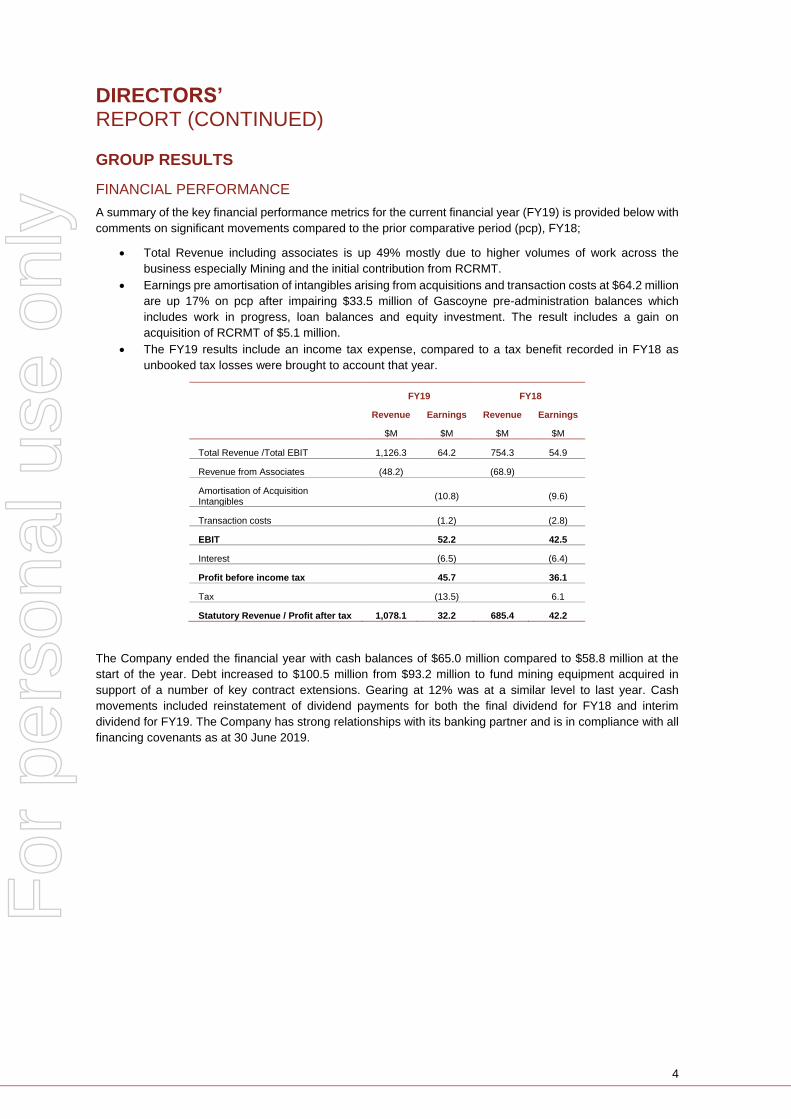
A summary of the key financial performance metrics for the current financial year (FY19) is provided below with
comments on significant movements compared to the prior comparative period (pcp), FY18;
Total Revenue including associates is up 49% mostly due to higher volumes of work across the
business especially Mining and the initial contribution from RCRMT.
Earnings pre amortisation of intangibles arising from acquisitions and transaction costs at $64.2 million
are up 17% on pcp after impairing $33.5 million of Gascoyne pre-administration balances which
includes work in progress, loan balances and equity investment. The result includes a gain on
acquisition of RCRMT of $5.1 million.
The FY19 results include an income tax expense, compared to a tax benefit recorded in FY18 as
unbooked tax losses were brought to account that year.
FY19 FY18
Revenue Earnings Revenue Earnings
$M $M $M $M
Total Revenue /Total EBIT 1,126.3 64.2 754.3 54.9
Revenue from Associates (48.2)
(68.9)
Amortisation of Acquisition Intangibles
(10.8)
(9.6)
Transaction costs
(1.2)
(2.8)
EBIT
52.2
42.5
Interest
(6.5)
(6.4)
Profit before income tax
45.7
36.1
Tax
(13.5)
6.1
Statutory Revenue / Profit after tax 1,078.1 32.2 685.4 42.2
The Company ended the financial year with cash balances of $65.0 million compared to $58.8 million at the
start of the year. Debt increased to $100.5 million from $93.2 million to fund mining equipment acquired in
support of a number of key contract extensions. Gearing at 12% was at a similar level to last year. Cash
movements included reinstatement of dividend payments for both the final dividend for FY18 and interim
dividend for FY19. The Company has strong relationships with its banking partner and is in compliance with all
financing covenants as at 30 June 2019.
For
per
sona
l use
onl
y
5
DIRECTORS’ REPORT (CONTINUED)
OPERATING SEGMENTS
Following the successful acquisition of RCRMT, NRW has structured its business reporting into four
segments, Civil, Mining, Drill & Blast and Mining Technologies.
• Civil: comprises the Civil business of NRW together with the Golding Civil and Urban businesses.
• Mining: consolidates the Mining businesses of NRW and Golding together with NRW’s Mining
support business AES Equipment Solutions.
• Drill and Blast: Action Drill & Blast.
• Mining Technologies: consolidates the newly acquired RCRMT business including Heat Treatment.
The performance of the four businesses is outlined below:
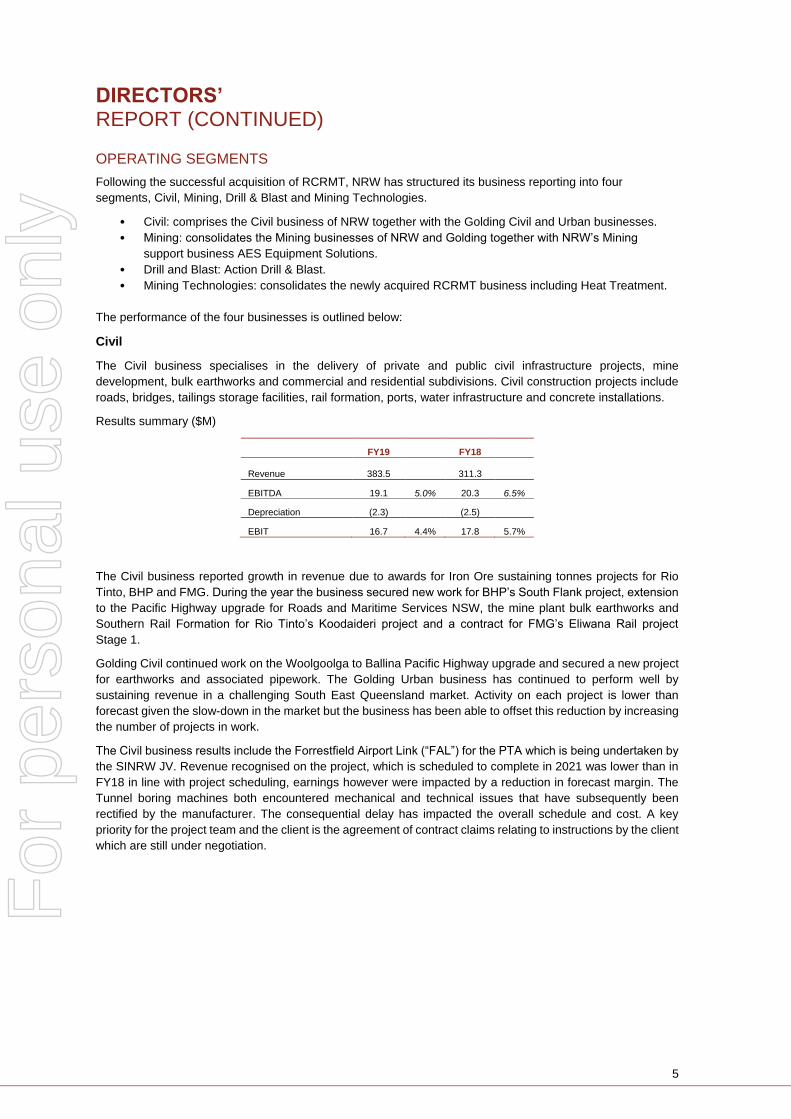
Civil
The Civil business specialises in the delivery of private and public civil infrastructure projects, mine
development, bulk earthworks and commercial and residential subdivisions. Civil construction projects include
roads, bridges, tailings storage facilities, rail formation, ports, water infrastructure and concrete installations.
Results summary ($M)
FY19 FY18
Revenue 383.5 311.3
EBITDA 19.1 5.0% 20.3 6.5%
Depreciation (2.3) (2.5)
EBIT 16.7 4.4% 17.8 5.7%
The Civil business reported growth in revenue due to awards for Iron Ore sustaining tonnes projects for Rio
Tinto, BHP and FMG. During the year the business secured new work for BHP’s South Flank project, extension
to the Pacific Highway upgrade for Roads and Maritime Services NSW, the mine plant bulk earthworks and
Southern Rail Formation for Rio Tinto’s Koodaideri project and a contract for FMG’s Eliwana Rail project
Stage.1.
Golding Civil continued work on the Woolgoolga to Ballina Pacific Highway upgrade and secured a new project
for earthworks and associated pipework. The Golding Urban business has continued to perform well by
sustaining revenue in a challenging South East Queensland market. Activity on each project is lower than
forecast given the slow-down in the market but the business has been able to offset this reduction by increasing
the number of projects in work.
The Civil business results include the Forrestfield Airport Link (“FAL”) for the PTA which is being undertaken by
the SINRW JV. Revenue recognised on the project, which is scheduled to complete in 2021 was lower than in
FY18 in line with project scheduling, earnings however were impacted by a reduction in forecast margin. The
Tunnel boring machines both encountered mechanical and technical issues that have subsequently been
rectified by the manufacturer. The consequential delay has impacted the overall schedule and cost. A key
priority for the project team and the client is the agreement of contract claims relating to instructions by the client
which are still under negotiation.
For
per
sona
l use
onl
y

6
DIRECTORS’ REPORT (CONTINUED)
OPERATING SEGMENTS (CONTINUED)
Mining
The Mining business specialises in mine management, contract mining, load and haul, dragline operations, coal
handling prep plants, maintenance services and the fabrication of water and service vehicles.
Results summary ($M)
FY19 FY18
Revenue 622.9 347.3
EBITDA 113.4 18.2% 66.5 19.1%
Depreciation (40.6) (28.1)
Gascoyne (33.5) -
EBIT 39.3 6.3% 38.4 11.0%
The Mining business reported significant growth in both revenue and earnings before the Gascoyne impairment,
which also included incremental activity on two existing mining clients operations (Isaac Plains and Curragh), a
full year’s contribution from Baralaba North for Wonbindi Coal and for Gascoyne Resources at the Dalgaranga
gold project both of which commenced in FY18. EBITDA margins were lower as a result of the higher Baralaba
revenues where Golding operate client equipment with consequently no depreciation cost.
The result includes an impairment related to Gascoyne Resources (ASX: GCY) following their entry into
voluntary administration in June 2019. NRW had been providing financial support to Gascoyne in the form of
deferred settlement terms for work performed (as secured debt and equity) required as a consequence of
processing lower grade ore in the initial start-up of operations. As a consequence of the administration, NRW
advised the ASX on 4 June 2019 of an exposure to Gascoyne totalling approximately $35 million representing
work in progress, monthly billings and the debt and equity support referred to above. NRW is continuing to work
on the project where gold output has improved significantly since the administration process commenced.
Payment terms for current work have been agreed at one week in arrears; these have been consistently met
by the administrators. Initial information on the resource strongly supports the continuation of the project and
the expectation that NRW may be able to recover a proportion of its outstanding debts over time. However,
given the uncertainty of the projects eventual financial structure and timing, all pre-administration balances
referred to above have been impaired in the FY19 accounts ($33.5 million).
Golding secured an agreement in November 2018 for a five-year extension to its mining services contract at
Isaac Plains adding approximately $500 million of new work to the existing contract. This was amended in early
July 2019 with further increases in scope adding $450 million to the overall contract value. The increased activity
has been supported with key purchases of new mining fleet and transfer of fleet from NRW’s Middlemount
operations. At Middlemount, an agreement with the client has been reached for a phased reduction in activity
to contract completion in June 2020. Whilst we have worked successfully at Middlemount, the contracting model
of fleet provision with maintenance services is not aligned to our core delivery model of full contract mining
services.
For
per
sona
l use
onl
y
7
DIRECTORS’ REPORT (CONTINUED)
OPERATING SEGMENTS (CONTINUED)
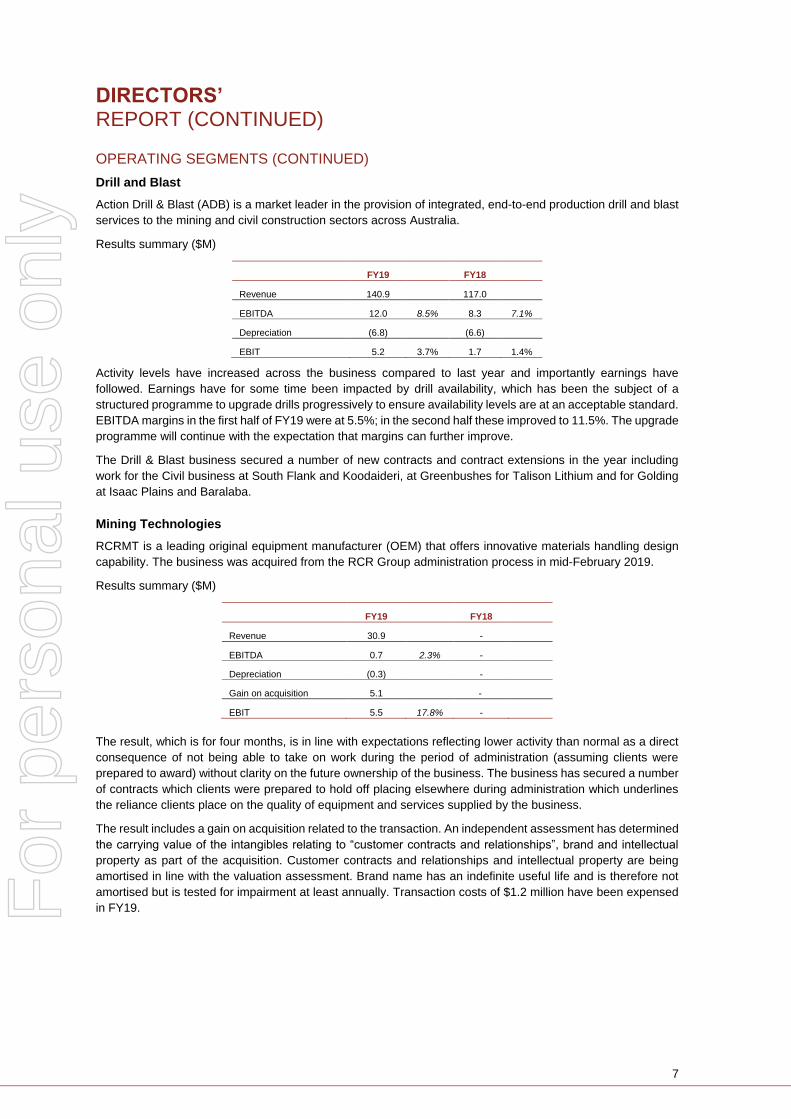
Drill and Blast
Action Drill & Blast (ADB) is a market leader in the provision of integrated, end-to-end production drill and blast
services to the mining and civil construction sectors across Australia.
Results summary ($M)
FY19 FY18
Revenue 140.9 117.0
EBITDA 12.0 8.5% 8.3 7.1%
Depreciation (6.8) (6.6)
EBIT 5.2 3.7% 1.7 1.4%
Activity levels have increased across the business compared to last year and importantly earnings have
followed. Earnings have for some time been impacted by drill availability, which has been the subject of a
structured programme to upgrade drills progressively to ensure availability levels are at an acceptable standard.
EBITDA margins in the first half of FY19 were at 5.5%; in the second half these improved to 11.5%. The upgrade
programme will continue with the expectation that margins can further improve.
The Drill & Blast business secured a number of new contracts and contract extensions in the year including
work for the Civil business at South Flank and Koodaideri, at Greenbushes for Talison Lithium and for Golding
at Isaac Plains and Baralaba.
Mining Technologies
RCRMT is a leading original equipment manufacturer (OEM) that offers innovative materials handling design
capability. The business was acquired from the RCR Group administration process in mid-February 2019.
Results summary ($M)
FY19 FY18
Revenue 30.9 -
EBITDA 0.7 2.3% -
Depreciation (0.3) -
Gain on acquisition 5.1 -
EBIT 5.5 17.8% -
The result, which is for four months, is in line with expectations reflecting lower activity than normal as a direct
consequence of not being able to take on work during the period of administration (assuming clients were
prepared to award) without clarity on the future ownership of the business. The business has secured a number
of contracts which clients were prepared to hold off placing elsewhere during administration which underlines
the reliance clients place on the quality of equipment and services supplied by the business.
The result includes a gain on acquisition related to the transaction. An independent assessment has determined
the carrying value of the intangibles relating to “customer contracts and relationships”, brand and intellectual
property as part of the acquisition. Customer contracts and relationships and intellectual property are being
amortised in line with the valuation assessment. Brand name has an indefinite useful life and is therefore not
amortised but is tested for impairment at least annually. Transaction costs of $1.2 million have been expensed
in FY19.
For
per
sona
l use
onl
y
8
DIRECTORS’ REPORT (CONTINUED)
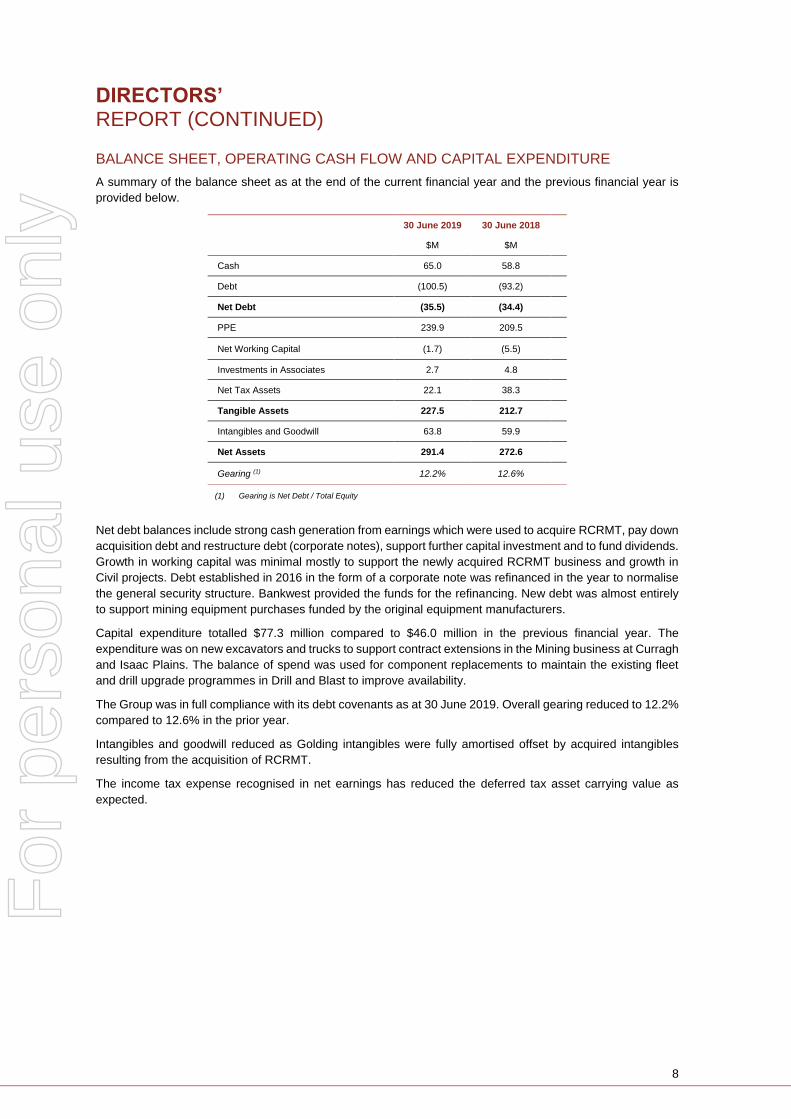
BALANCE SHEET, OPERATING CASH FLOW AND CAPITAL EXPENDITURE
A summary of the balance sheet as at the end of the current financial year and the previous financial year is
provided below.
30 June 2019 30 June 2018
$M $M
Cash 65.0 58.8
Debt (100.5) (93.2)
Net Debt (35.5) (34.4)
PPE 239.9 209.5
Net Working Capital (1.7) (5.5)
Investments in Associates 2.7 4.8
Net Tax Assets 22.1 38.3
Tangible Assets 227.5 212.7
Intangibles and Goodwill 63.8 59.9
Net Assets 291.4 272.6
Gearing (1) 12.2% 12.6%
(1) Gearing is Net Debt / Total Equity
Net debt balances include strong cash generation from earnings which were used to acquire RCRMT, pay down
acquisition debt and restructure debt (corporate notes), support further capital investment and to fund dividends.
Growth in working capital was minimal mostly to support the newly acquired RCRMT business and growth in
Civil projects. Debt established in 2016 in the form of a corporate note was refinanced in the year to normalise
the general security structure. Bankwest provided the funds for the refinancing. New debt was almost entirely
to support mining equipment purchases funded by the original equipment manufacturers.
Capital expenditure totalled $77.3 million compared to $46.0 million in the previous financial year. The
expenditure was on new excavators and trucks to support contract extensions in the Mining business at Curragh
and Isaac Plains. The balance of spend was used for component replacements to maintain the existing fleet
and drill upgrade programmes in Drill and Blast to improve availability.
The Group was in full compliance with its debt covenants as at 30 June 2019. Overall gearing reduced to 12.2%
compared to 12.6% in the prior year.
Intangibles and goodwill reduced as Golding intangibles were fully amortised offset by acquired intangibles
resulting from the acquisition of RCRMT.
The income tax expense recognised in net earnings has reduced the deferred tax asset carrying value as
expected.
For
per
sona
l use
onl
y
9
DIRECTORS’ REPORT (CONTINUED)
PEOPLE AND SAFETY / OCCUPATIONAL HEALTH AND SAFETY
NRW is committed to achieving the highest possible performance in occupational health, safety and
environmental management.
Our vision is for every employee to arrive home safely after each shift or swing. We focus on completing our
daily tasks in a safe manner, looking out for our workmates and ultimately delivering projects to our clients that
we are proud of.
Our Occupational Health and Safety Management Systems are accredited to AS4801:2001/ISO18001:2007,
the applicable Australian and International Standards and are subject to continuous auditing by an external
third party.
While health and safety remains the highest priority, it was with great sadness we reported that Jack Gerdes,
an excavator operator working for Golding at the Baralaba North Coal Mine was fatally injured on 7 July 2019.
The fatality was advised to the ASX on 8 July 2019. The investigations are still ongoing, and Golding has and
continues to co-operate with the Mines Inspectorate both onsite and at a corporate level to support their
investigation into the accident.
NRW’s Total Recordable Injury Frequency Rate (TRIFR) at June 2019 was 6.92 compared to 6.39 at June
2018.
NRW recognises that our success is the result of our dedicated workforce. A workforce that constantly returns
to NRW as more projects are secured and positions become available. We re-employ previous NRW employees
as first preference wherever possible, and transfer people from completed projects to new projects to ensure
we have the most knowledgeable people on the job. When we look for employees in the wider market we attract
new highly qualified candidates, even for short term contracts, confirming that NRW is an employer of choice.
NRW aims to recruit and retain a skilled workforce and endorses a safe environment free from harassment and
unlawful discrimination.
NRW’s current workforce levels have increased through the year as a result of the addition of the
increased activity and the acquisition of RCRMT. Headcount at June 2019 totalled circa 3,145 (June 2018 –
2,000).
NRW continues to embrace diversity and inclusiveness across all of its activities. NRW relies on and encourages
its employees to contribute a diverse range of skills and experience. Our objective is to increase participation
across a range of demographics.
NRW is focused on improving the sustainable development of local communities and traditional owners of the
areas in which it works. The Company operates a number of projects in joint venture with various Indigenous
organisations to provide sustainable business opportunities to these groups and the communities they
represent.
The Company has developed a series of initiatives to engage with indigenous communities to provide enduring
progressive opportunities. These initiatives have included the “Powerup Program” which offers Indigenous
candidates the opportunity to grow a career with NRW and gain valuable experience within the civil and mining
industries.
NRW is pleased to report an Indigenous participation rate which has ranged between 5% to 8% across its major
projects in West Australia and an employee retention rate, despite project cycles, of 85%.
For
per
sona
l use
onl
y
10
DIRECTORS’ REPORT (CONTINUED)
ENVIRONMENTAL REGULATIONS
The Group holds various licences and is subject to various environmental regulations. No known environmental
breaches have occurred in relation to the Group’s operations.
NRW operates within the strict environmental obligations defined by our clients which requires the project
“environmental footprint” to be respected at all times.
NRW is currently assessing the practicalities of implementing processes which will allow it to report on the
financial impacts that climate related risks and opportunities have on the organisation as proposed by the Task
Force on Climate-Related Financial Disclosures (TCFD).
The TCFD released recommendations for more effective climate-related disclosures which aim to provide a
voluntary, consistent disclosure framework that improves the ease of both producing and using climate-related
financial disclosures.
RISK MANAGEMENT
NRW has risk management policies and procedures in place to provide early identification of business risks and
to monitor the mitigation of those risks across all aspects of the business. These include risk assessment in the
tender and contracting phase, management of specifically identified project risks, treasury management and
credit risks. We also identify and track appropriate mitigation actions for identified risks. Further commentary on
material risks is provided in the Corporate Governance and Risk Management section of this report.
OUTLOOK
The markets in which NRW operates continue to provide opportunities for growth as demonstrated in these
results.
Four areas of focus were identified in the outlook commentary last year, progress against which is summarised
below:
Supporting the iron ore sector as plans for sustaining current production volumes are developed.
– Identified successes –
Secured South Flank contract for BHP ($176 million)
Secured Eliwana Rail project for FMG
Secured Plant site and Southern Rail packages for Rio Tinto
Secured major process infrastructure equipment orders from all three majors (RCRMT)
Growing our presence in Queensland and New South Wales on the back of the Golding acquisition.
– Identified successes –
Further extension and scope expansion of Isaac Plains contract for Stanmore Coal
Delivered significant increase in revenues from Golding business
Sustaining revenues and winning work for new clients for subdivisions in Urban in a
challenging property market
Project delivery across all contracts.
– Identified successes –
Civil project delivery completions (first half) well above bid margins
Productivity improvements now being delivered in the drill and blast business (second half)
Review opportunities to expand our service offering in our core markets and to diversify where we
have relevant expertise.
– Identified successes –
Acquired RCRMT – provides adjacent market with core NRW clients and maintenance
business
Reviewing joint opportunities between Civil and RCRMT to provide integrated solutions
For
per
sona
l use
onl
y
11
DIRECTORS’ REPORT (CONTINUED)
OUTLOOK (CONTINUED)
These focus areas have been reviewed and revised recognising the work completed to date and the recent
acquisition of RCRMT. Going forward the key focus areas are;
• Positioning in key traditional civil markets to address continued investment in iron ore;
• RCRMT integration going well – significant opportunity to generate additional value from the acquisition
and through cross selling to key clients. Reviewing options to build a broader delivery platform;
• Key focus on retaining, recruiting and training our workforce to meet strong market demand;
• NRW operating model continues to evolve as a multi-disciplined through cycle capex and opex
business; and
• Further strategic / market consolidation opportunities under review - highly disciplined approach to
assessing value (as demonstrated in other recent transactions).
The order book at 30 June 2019 is circa $2.2 billion of which around $1.1 billion is scheduled for delivery in
FY20 excluding any orders secured by Urban and RCRMT. These businesses work on a combination of medium
and short term work and are expected to contribute at least an additional $200 million of revenue to FY20
bringing the total covered work for FY20 to $1.3 billion.
The near term tender pipeline (one-year award / commencement potential) has strengthened to $8 billion of
which NRW has submitted tenders of circa $1.2 billion. We remain very confident of strong activity levels across
the resources and infrastructure sectors over the years ahead. NRW is forecasting revenue at circa $1.5 billion
in FY20.
SIGNIFICANT EVENTS AFTER PERIOD END
No matter or circumstance has arisen since the end of the financial year and the date of this report that has
significantly affected, or may significantly affect, the Group’s operations, the results of those operations, or its
state of affairs in future financial periods.
DIVIDEND
The Directors have declared a final dividend for the financial year of two cents per share. This brings the total
dividend for the year to four cents per share following the interim dividend paid in May 2019. The dividend will
be fully franked and paid on 10 December 2019.
DIRECTORS’ INTERESTS
The relevant interest of each Director in the ordinary share capital are set out in note 5.7 of Executive KMP
Remuneration Outcomes. There were no transactions between entities within the Group and Director-related
entities as disclosed in note 7.3 to the financial statements.
PERFORMANCE RIGHTS OVER UNISSUED SHARES OR INTERESTS
As at the date of this report, there are 8,213,998 Performance Rights outstanding (2018; 13,290,881).
Details of Performance Rights granted to Executives as part of their remuneration are set out in the
Remuneration Report on pages 12 to 22.
For
per
sona
l use
onl
y

12
DIRECTORS’ REPORT (CONTINUED)
LETTER FROM CHAIR OF THE NOMINATION & REMUNERATION
COMMITTEE
Dear Shareholders and readers of this report,
We are pleased to present NRW’s Remuneration report for the year ended 30 June 2019.
NRW’s remuneration framework is designed to align management remuneration with shareholder returns, the
principles of which are outlined in the “remuneration overview” section of this report.
I am pleased that we have once again been able to report significant growth in NRW as measured by Revenue,
Earnings and Market Capitalisation. I have used FY16 as the starting point to demonstrate the extent of the
company’s growth a date which also coincides with the introduction of the revised incentive plans;
• Revenue has increased from $288 million in FY16 to $1,078 million in FY19;
• Earnings (comparative EBITDA) have increased from $47.4 million in FY16 to $143.9 million in FY19;
• Market Capitalisation has increased by $884 million over three years from $59 million at June 16 to $943
million at June 19; and
• Total shareholder return over the same three years was circa $840 million.
This transformation of the company has been the result of significant commitment and hard work by NRW
employees across the business and in particular, the leadership of Jules Pemberton, our CEO and his executive
team.
The Board Remuneration Committee in establishing the reward framework for the leadership team and senior
professionals across the organisation were mindful of the nature of the work which NRW project teams
undertake, the challenges of remote environments, the breadth and diversity of the resources in which our
teams deliver infrastructure, mine operations, while providing ongoing maintenance and support to our clients
across widely dispersed regions of the country.
Details of the remuneration framework applying to the leadership team are transparently and comprehensively
disclosed in this report. Some shareholders expressed concern that the equity based awards adopted
proportional vesting over less than 3 years. This decision of the Board was deliberate. When first introduced in
2016 the company needed to deliver on many initiatives quickly. Equity awards were designed to drive those
initiatives and meet the challenges faced by our business at that time.
With the accomplishments over the last three financial years, your committee has further reviewed the structure
of reward for the leadership team for the period ahead. Details are set out below.
Our objective as a committee is to implement remuneration policies that reward value creation and deliver
sustainable value for NRW shareholders. We strongly believe that if investors and their advisers carefully review
our accomplishments and forward plans they will endorse the effectiveness of the plans implemented thus far
and those which we are proposing as set out below.
We strongly believe that the reward arrangements which we put in place and have delivered a 15 times multiple
improvement in the company’s market value since 2016 have been successful.
With respect to the key remuneration issues and outcomes in the 2019 financial year;
• We have not made any underlying changes to the fixed remuneration of the CEO, CFO and EGM’s of the
Golding and Civil and Mining businesses.
• There have been no changes to the annual incentive policy other than to develop challenging and focused
objectives for the management team to deliver through the past 12 months (FY19).
• The short term incentive percent of TFR for the CEO and CFO was increased in FY19 by 25% and 20%
respectively. This increase, which was for the current financial year, was structured to provide an incentive
to meet incremental stretch objectives set after establishing the core targets based on the budget approval.
Underlying business performance supported the establishment of these incremental incentives, however
the Gascoyne impairment ultimately meant that this element of remuneration was not achieved.
For
per
sona
l use
onl
y
13
DIRECTORS’ REPORT (CONTINUED)
LETTER FROM CHAIR OF THE NOMINATION & REMUNERATION
COMMITTEE (CONTINUED)
• I am pleased to report that the STI targets set for FY19 were achieved in part and appropriate awards are
included, with explanation in this report. In agreeing to these awards the committee has considered other
factors which can be applied as modifiers which include safety and strategic development. In making our
final assessment we have considered the fatality in July this year further commentary on which is included
in the People and Safety / Occupational Health and Safety section of the Directors Report.
• There have been no new equity awards, other than to Ian Gibbs who joined NRW on completion of the
RCRMT acquisition in February this year. The vesting period of these awards is less than three years
which given the near term growth objectives we want the business to deliver and Ian’s criticality to that
new business’s success we consider to be wholly appropriate.
• A number of Performance Rights have vested given that the challenging performance conditions
established by the committee were achieved.
• There have been no changes to the remuneration of non-executive directors in the year.
With respect to our thinking going forward;
• Some fixed remuneration increases would appear to be appropriate given the continued growth in the
company. The last time changes were made annual revenue was about half that forecast for FY20. Any
changes to the remuneration of the CEO will of course be disclosed if and when made.
• New equity awards are being considered which will reflect some of the changes “suggested” by the proxy
advisors without over complicating the scheme (and therefore diminishing the potential shareholder value
creation). The new scheme will include:
o Awards with performance periods of two and three years;
o No retest;
o The quantum of rights will vest as performance improves rather than on a specific pass/fail objective;
o Additional performance hurdles to Total Shareholder Return; and
o An award base close to the start of the performance period and which includes a period post
release of the prior year results.
The mandate of the committee remains unchanged. We urge shareholders to support us as we continue to
develop and implement schemes which we consider to be in their best interest whilst recognising the particular
challenges of the markets in which we work and the core objectives which have been set for those people
appointed to manage our businesses.
Michael Arnett
Chair Nomination and Remuneration Committee
For
per
sona
l use
onl
y
14
DIRECTORS’ REPORT (CONTINUED)
1. REMUNERATION GOVERNANCE
NRW has established a Nomination and Remuneration Committee (“N&RC”) consisting of Michael Arnett
(Chairman), Jeff Dowling and Peter Johnston. The N&RC is responsible for making recommendations to the
Board on the remuneration arrangements for Non-Executive Directors and Key Management Personnel (KMP)
as set out in the N&RC Charter. The N&RC provides advice, recommendation and assistance to the Board with
respect to the following:
• The remuneration of Non-Executive Directors, including the Chair of the Board;
• The remuneration policies which are designed to attract and retain Executives with the expertise to
enhance the competitive advantage, performance and growth of NRW;
• Ensuring that the level and composition of Executive remuneration packages are fair, reasonable
and adequate and that the remuneration received by the KMP demonstrates a clear relationship
between the performance of the individual and the performance of NRW;
• Termination and redundancy policies and payments made to outgoing Executives; and
• Disclosures to be included in the corporate governance section of NRW’s annual report which relates
to NRW’s remuneration policies and procedures.
The N&RC is mandated to engage external and independent remuneration advisors who do not have a
relationship with or advise NRW management. An advisor has been engaged to assist the committee with the
development of a revision to the current long term incentive scheme and to provide market analysis on
remuneration trends.
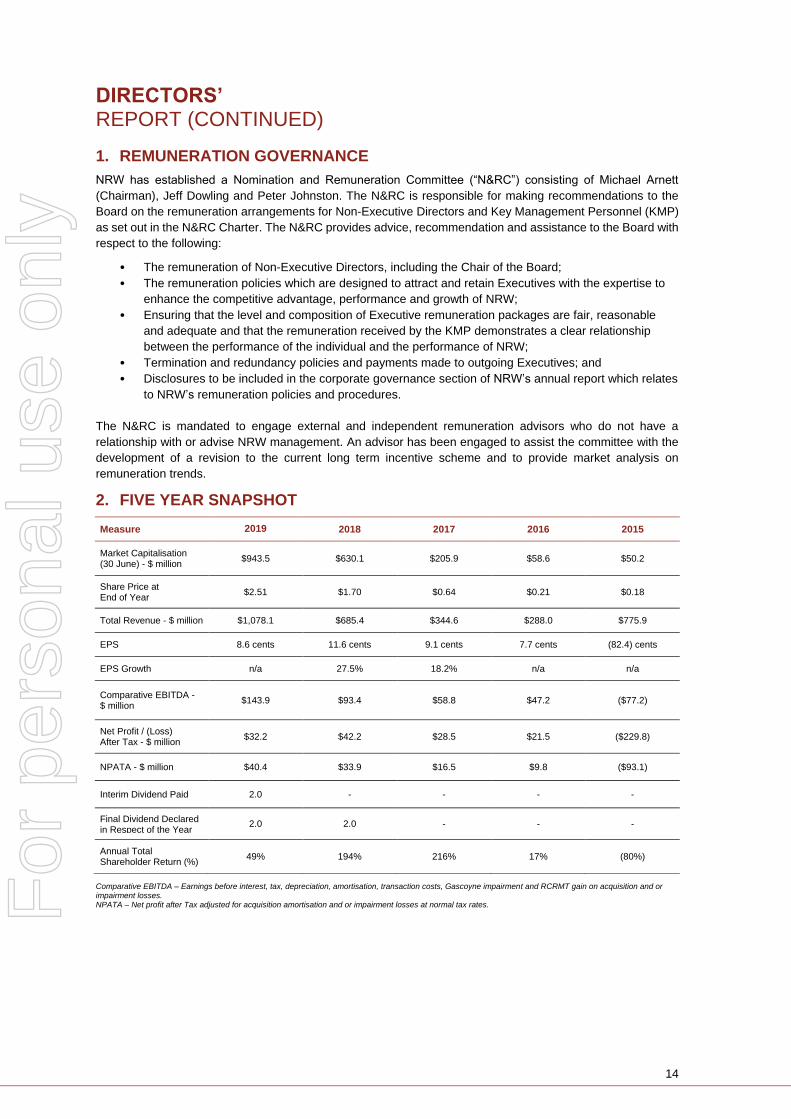
2. FIVE YEAR SNAPSHOT
Measure 2019 2018 2017 2016 2015
Market Capitalisation (30 June) - $ million
$943.5 $630.1 $205.9 $58.6 $50.2
Share Price at End of Year
$2.51 $1.70 $0.64 $0.21 $0.18
Total Revenue - $ million $1,078.1 $685.4 $344.6 $288.0 $775.9
EPS 8.6 cents 11.6 cents 9.1 cents 7.7 cents (82.4) cents
EPS Growth n/a 27.5% 18.2% n/a n/a
Comparative EBITDA - $ million
$143.9 $93.4 $58.8 $47.2 ($77.2)
Net Profit / (Loss) After Tax - $ million
$32.2 $42.2 $28.5 $21.5 ($229.8)
NPATA - $ million $40.4 $33.9 $16.5 $9.8 ($93.1)
Interim Dividend Paid 2.0 - - - -
Final Dividend Declared in Respect of the Year
2.0 2.0 - - -
Annual Total Shareholder Return (%)
49% 194% 216% 17% (80%)
Comparative EBITDA – Earnings before interest, tax, depreciation, amortisation, transaction costs, Gascoyne impairment and RCRMT gain on acquisition and or impairment losses. NPATA – Net profit after Tax adjusted for acquisition amortisation and or impairment losses at normal tax rates. F
or p
erso
nal u
se o
nly
15
DIRECTORS’ REPORT (CONTINUED)
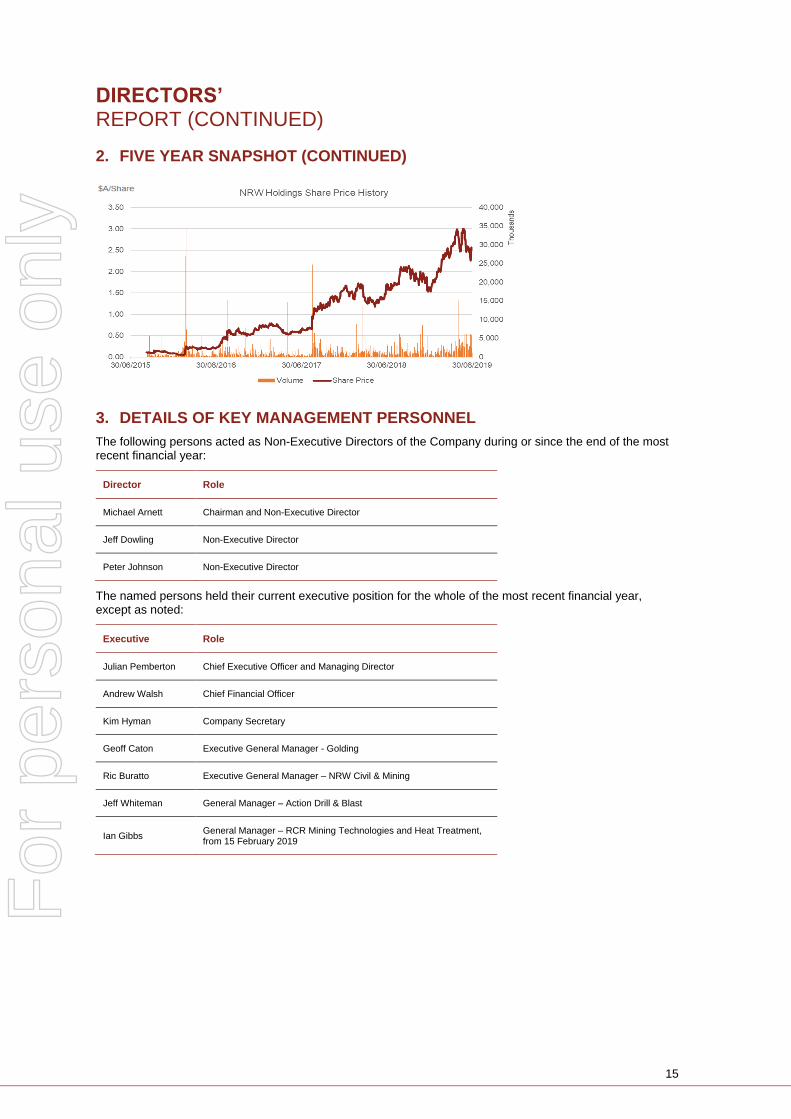
2. FIVE YEAR SNAPSHOT (CONTINUED)
3. DETAILS OF KEY MANAGEMENT PERSONNEL
The following persons acted as Non-Executive Directors of the Company during or since the end of the most recent financial year:
Director Role
Michael Arnett Chairman and Non-Executive Director
Jeff Dowling Non-Executive Director
Peter Johnson Non-Executive Director
The named persons held their current executive position for the whole of the most recent financial year, except as noted:
Executive Role
Julian Pemberton Chief Executive Officer and Managing Director
Andrew Walsh Chief Financial Officer
Kim Hyman Company Secretary
Geoff Caton Executive General Manager - Golding
Ric Buratto Executive General Manager – NRW Civil & Mining
Jeff Whiteman General Manager – Action Drill & Blast
Ian Gibbs General Manager – RCR Mining Technologies and Heat Treatment, from 15 February 2019
For
per
sona
l use
onl
y
16
DIRECTORS’ REPORT (CONTINUED)
4. EXECUTIVE KMP REMUNERATION FRAMEWORK
4.1 EXECUTIVE (KMP) REMUNERATION OVERVIEW
The Board has adopted the following over-arching principles which recognise the importance of fair, effective
and appropriate remuneration outcomes:
• Alignment: Alignment of the remuneration strategy with the interests of the Company’s shareholders;
• Attract and retain: The remuneration framework across NRW has been established and is regularly
reviewed to ensure that the company can attract and retain appropriate talent across our workforce;
• Motivate: Remuneration plans are structured to ensure that our top talent are rewarded for achieving both
short and long term business objectives. A high proportion of reward is aligned to performance, and
• Appropriate: Remuneration packages are established and reviewed regularly to ensure that they reflect
contemporary trends in sectors and regions relevant to the operations of NRW.
4.2 STRUCTURE OF EXECUTIVE KMP REMUNERATION
The NRW remuneration program and consequently the remuneration components for each Executive KMP
member comprise:
Total Fixed Remuneration (TFR)
• Comprising salary and superannuation capped at the relevant concessional contribution limit.
• The opportunity to salary sacrifice benefits on a tax compliant basis is available upon request.
Fixed remuneration is set with reference to role, market and relevant experience, which is reviewed annually
and upon promotion.
Short Term Incentive Plan (STIP)
• Executives can earn a cash based incentive by achieving specific objectives set by the N&RC.
• The maximum amount of these awards is based on a percentage of the executives TFR (which is set out
in the table 4.3).
• Specific objectives are set for each executive based on their core accountabilities.
• Awards up to the maximum amount payable can be achieved when performance is rated as superior
reflecting the achievement of stretch objectives.
• An earnings metric (e.g. EBIT or EBITDA) is a primary performance measure to ensure alignment with
group and shareholder objectives.
• Awards can be modified downwards if safety performance does not meet expectations.
• Awards are reviewed and agreed by the N&RC which also consider the executives overall performance in
the year against specific business objectives.
• Up to 25% of an award can be deferred for up to 12 months at the discretion of the N&RC if the committee
determines that additional time is required to provide more certainty on specific business related outcomes.
Long Term Incentive Plan (LTIP)
• Executives can participate in an equity based incentive through the award of Performance Rights (Rights).
• The maximum amount of an award is based on a percentage of the executives TFR (see table 4.3). The
number of performance rights is determined by the share price at the time the award is approved by the
N&RC.
• Awards are generally made annually and may be split into tranches which have specific objectives within
a specified timeframe.
• Performance rights which vest following the achievement of relevant targets, generally aligned to
shareholder return, are converted to shares when the vesting conditions are met.
• A critical requirement of the scheme is that the participant remains in employment with the Group up to
and including the vesting date.
• The normal performance period is three years, however, a number of performance rights have been
granted with periods of less than three years which recognises the following:
1. Specific milestones aligned to NRW’s recovery objectives established in the 2016 & 2017
Financial Years for the CEO and CFO.
2. The progressive implementation of a three year long term incentive plan for key executives.
For
per
sona
l use
onl
y

17
DIRECTORS’ REPORT (CONTINUED)
4.2 STRUCTURE OF EXECUTIVE KMP REMUNERATION (CONTINUED)
3. The implementation of a retention scheme for key executives who joined NRW through the
Golding and RCRMT acquisitions.
4. The implementation of broader equity participation across NRW aligned to the Golding retention
program.
• Equity grants to the CEO were aligned to the structure set out above in notes 1 & 2 and specifically
approved by shareholders at the 2016 and 2017 AGMs.
• The award of rights is governed by the ‘NRW Holdings Limited Performance Rights Plan’ approved by
shareholders in 2015.
4.3 AWARD LEVELS RELATIVE TO FIXED REMUNERATION
The table below provides information on the remuneration packages of KMP’s as at 30 June 2019.
KMP TFR (1) STIP LTIP Notice Period
Mr J Pemberton $950,000 75% 180% 6 months
Mr A Walsh $700,000 60% 80% 6 months
Mr G Caton $650,000 30% 30% 6 months
Mr E Buratto $600,000 30% 30% 6 months
Mr I Gibbs (2) $436,000 N/A 30% 6 months
Mr J Whiteman(3) N/A N/A N/A See note 4.5
Mr K Hyman $358,600 Nil Nil 6 months
(1) Annual Total Fixed Remuneration (TFR) as at 30 June 2019.
(2) Incentive plans relate to FY20 as Mr I Gibbs joined the group through the year (RCRMT).
(3) Mr J Whiteman works under a service contract.
There have been no changes to base TFR from the previous period, any changes reported in the remuneration
tables relate to timing of appointments or leave entitlements.
4.4 OTHER CONSIDERATIONS APPLICABLE TO LTI AWARDS
If a KMP’s employment with NRW ceases for reasons other than death or permanent disability any unvested
Performance Rights will lapse and expire unless the Board of NRW considers it appropriate in the circumstances
to consider the vesting of any unvested shares. Where a KMP has died or becomes permanently disabled the
Board may determine that the Performance Rights will not lapse and will be tested against the Vesting
Conditions on the applicable vesting dates.
Upon a change of control occurring in respect of NRW, the following rules will apply to determine how
Performance Rights should vest or lapse.
• Performance Rights that have met the vesting hurdle will vest on a date to be determined before the
change of control date.
• Performance Rights which have met the vesting hurdle as a consequence of the change of control (for
example a share price increment) will vest on a date to be determined before the change of control date.
• Performance Rights which have not yet met the vesting hurdle: The N&RC may (in its absolute discretion)
determine that all or a portion of these performance rights will vest, notwithstanding that time restrictions
or performance conditions applicable to the performance rights have not been satisfied.
For
per
sona
l use
onl
y
18
DIRECTORS’ REPORT (CONTINUED)
4.5 EXECUTIVE SERVICE AGREEMENTS
The Executive Service Agreements in place in respect of NRW’s KMP contain non-compete provisions
restraining the executives from operating or being associated with an entity that competes with the business of
NRW up to six months after termination.
All KMP as listed in the remuneration table, other than Mr Whiteman who is working under a service contract,
are employed on standard letters of appointment that provide for annual reviews of base salary and up to six
months’ notice of termination by either party. The appointments are not for any fixed term and carry no
termination payments other than statutory entitlements.
The N&RC determines remuneration for all KMP listed under the guidelines contained in this
remuneration report.
5. EXECUTIVE KMP REMUNERATION OUTCOMES
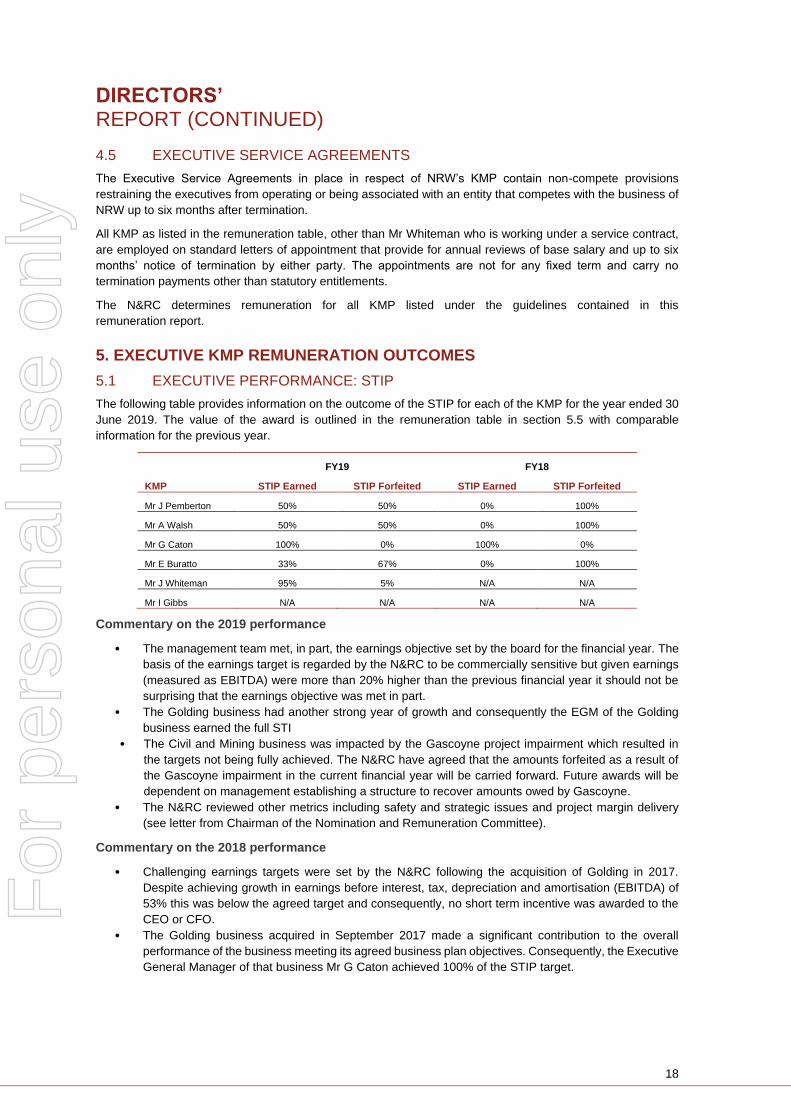
5.1 EXECUTIVE PERFORMANCE: STIP
The following table provides information on the outcome of the STIP for each of the KMP for the year ended 30
June 2019. The value of the award is outlined in the remuneration table in section 5.5 with comparable
information for the previous year.
FY19 FY18
KMP STIP Earned STIP Forfeited STIP Earned STIP Forfeited
Mr J Pemberton 50% 50% 0% 100%
Mr A Walsh 50% 50% 0% 100%
Mr G Caton 100% 0% 100% 0%
Mr E Buratto 33% 67% 0% 100%
Mr J Whiteman 95% 5% N/A N/A
Mr I Gibbs N/A N/A N/A N/A
Commentary on the 2019 performance
• The management team met, in part, the earnings objective set by the board for the financial year. The
basis of the earnings target is regarded by the N&RC to be commercially sensitive but given earnings
(measured as EBITDA) were more than 20% higher than the previous financial year it should not be
surprising that the earnings objective was met in part.
• The Golding business had another strong year of growth and consequently the EGM of the Golding
business earned the full STI
• The Civil and Mining business was impacted by the Gascoyne project impairment which resulted in
the targets not being fully achieved. The N&RC have agreed that the amounts forfeited as a result of
the Gascoyne impairment in the current financial year will be carried forward. Future awards will be
dependent on management establishing a structure to recover amounts owed by Gascoyne.
• The N&RC reviewed other metrics including safety and strategic issues and project margin delivery
(see letter from Chairman of the Nomination and Remuneration Committee).
Commentary on the 2018 performance
• Challenging earnings targets were set by the N&RC following the acquisition of Golding in 2017.
Despite achieving growth in earnings before interest, tax, depreciation and amortisation (EBITDA) of
53% this was below the agreed target and consequently, no short term incentive was awarded to the
CEO or CFO.
• The Golding business acquired in September 2017 made a significant contribution to the overall
performance of the business meeting its agreed business plan objectives. Consequently, the Executive
General Manager of that business Mr G Caton achieved 100% of the STIP target.
For
per
sona
l use
onl
y
19
DIRECTORS’ REPORT (CONTINUED)
5.1 EXECUTIVE PERFORMANCE: STIP (CONTINUED)
• The Perth based Civil and Mining businesses missed earnings targets set for the businesses. The
earnings target assumed award of new mining contracts which were expected to contribute to planned
earnings early in the financial year. The shortfall in earnings was to some extent mitigated following
the award of the Dalgaranga contract but this contract was not awarded early enough in the year to
recover to the earnings target. As a consequence, the EGM of the Civil and Mining businesses did not
earn an incentive payment.
5.2 EXECUTIVE PERFORMANCE: LTIP
The structure of the long term incentive plan is set out in section 4.2 above. Commentary is provided below on
the achievement against objectives set for each of the current long term incentive plans and the status of awards
made from 2016 to 2018. Valuation data is provided in section 5.5. The quantum of rights applicable to each
award is detailed in the table under note 4.7 in the notes to the financial statements.
2016 Incentive Plan
As disclosed in the 2017 remuneration report, rights granted in 2016 were determined to have passed the
performance test and vested in November 2017. Key points to note with respect to 2016 plan are outlined below:
• Rights were awarded in two equal tranches with a performance hurdle set for June 2016 of 30 cents
and October 2017 of 40 cents. Whilst these hurdles appear low in the context of the current share price
at 30 June 2019 ($2.51) it is important to note that the share price, on award of these rights, was below
20 cents.
The initial performance hurdle for the first tranche was not met (30 cents).
• The scheme provided for a retest of the first tranche of rights up to October 2017 which was met along
with achievement of the second tranche at the same performance hurdle.
• Rights subject to a retest required 25% of the Rights to be forfeited.
• The value of rights awarded in 2016 was assessed at nil cost (as disclosed in the 2016 accounts) given
the low value of the shares when granted.
2017 Incentive Plan
Key conditions of the 2017 plan
• Rights were awarded in two equal tranches with a performance hurdle to be met in the periods to June
2017 of 50 cents and October 2018 of 70 cents.
• Again, it is worth noting that the share price at the beginning of the 2017 financial year was 22 cents
and therefore the hurdles required increasing TSR in the performance period by more than 100%.
• The performance hurdle for Tranche 1 rights was met and rights vested in November 2017.
• The performance hurdle for Tranche 2 rights was met in FY18 and rights vested in November 2018.
2018 Incentive Plan
The 2018 scheme is structured in three distinct plans which reflect the LTIP structure as disclosed in section
4.2 above; Senior Executive plan, Golding integration plan, and Executive plan. Key terms of each of these
plans is outlined below:
Senior Executive plan & Golding integration plan
• The plan participants are the CEO and CFO.
• The structure of the plan and the quantum of rights awarded in these plans to the CEO were approved
by shareholders at the 2017 AGM.
• Rights awarded under the plans were valued based on the 60 day VWAP up to and including the day
the FY17 results and the Golding acquisition were announced (being 80 cents).
For
per
sona
l use
onl
y
20
DIRECTORS’ REPORT (CONTINUED)
5.2 EXECUTIVE PERFORMANCE: LTIP (CONTINUED)
Senior Executive plan
• Rights were awarded in three equal tranches with increasing performance hurdles set for each year.
• The performance hurdles for the three years are: increase in TSR of 79% by June 18 ($1.33); increase
in TSR by June 2019 of 111% ($1.52) and increase in TSR by June 2020 of 140% ($1.71).
• As a result of the very strong increase in the share price the performance hurdles for all three tranches
have been met. Tranche 1 rights vested in November 2018, Tranche 2 and 3 rights will vest in
November 2019 and 2020 respectively subject to the executive remaining in employment with the
Group.
Golding integration plan
• Rights were awarded in two equal tranches with assessment dates of June 2018 and June 2019.
• Rights vest subject to the delivery of key integration objectives and the Golding business meeting
agreed financial performance targets, as assessed by the NRW Board.
• Performance in the Golding business post acquisition has been extremely strong. Tranche 1 rights
vested in August 2018 and Tranche 2 rights will vest in August 2019.
Executive plan
• The plan participants are the key executives within the business.
• Rights were awarded in a single tranche.
• The performance objective is aligned with the senior executive plan (as above) being an increase in
TSR by June 2019 of 111% ($1.52).
• As a result of the very strong increase in the share price the performance hurdle has been met and
the rights will vest in November 2019 subject to the executive remaining in employment with the Group.
• The plan was extended in 2019 following the acquisition of RCRMT. The GM of the business was
awarded rights in two tranches vesting in November 2020 and 2021. The relatively short performance
period reflects the agreed business recovery objectives consistent with the acquisition valuation
assumptions.
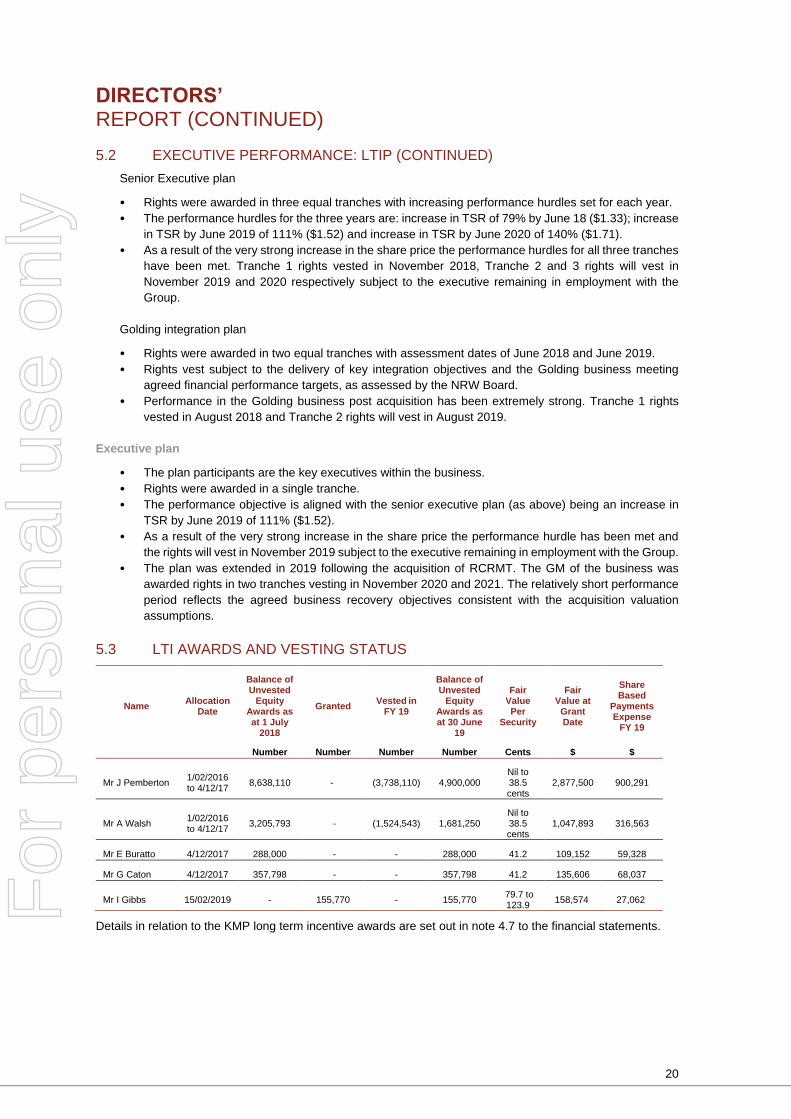
5.3 LTI AWARDS AND VESTING STATUS
Name Allocation
Date
Balance of Unvested
Equity Awards as at 1 July
2018
Granted Vested in
FY 19
Balance of Unvested
Equity Awards as at 30 June
19
Fair Value Per
Security
Fair Value at
Grant Date
Share Based
Payments Expense
FY 19
Number Number Number Number Cents $ $
Mr J Pemberton 1/02/2016 to 4/12/17
8,638,110 - (3,738,110) 4,900,000 Nil to 38.5 cents
2,877,500 900,291
Mr A Walsh 1/02/2016 to 4/12/17
3,205,793 - (1,524,543) 1,681,250 Nil to 38.5 cents
1,047,893 316,563
Mr E Buratto 4/12/2017 288,000 - - 288,000 41.2 109,152 59,328
Mr G Caton 4/12/2017 357,798 - - 357,798 41.2 135,606 68,037
Mr I Gibbs 15/02/2019 - 155,770 - 155,770 79.7 to 123.9
158,574 27,062
Details in relation to the KMP long term incentive awards are set out in note 4.7 to the financial statements.
For
per
sona
l use
onl
y
21
DIRECTORS’ REPORT (CONTINUED)
5.4 VALUATION ASSUMPTIONS
The estimation of the fair value of share-based payment awards requires judgement concerning the appropriate
valuation methodology. The choice of valuation methodology is determined by the structure of the awards,
particularly the vesting conditions.
A Monte-Carlo simulation valuation methodology was used to determine the share based payment cost relative
to TSR growth. The valuation methodology used was chosen from those available to incorporate an appropriate
amount of flexibility with respect to the particular performance and vesting conditions of the award.
Further details on the valuation assumptions and individual scheme awards are provided in note 4.7 of the
financial statements.
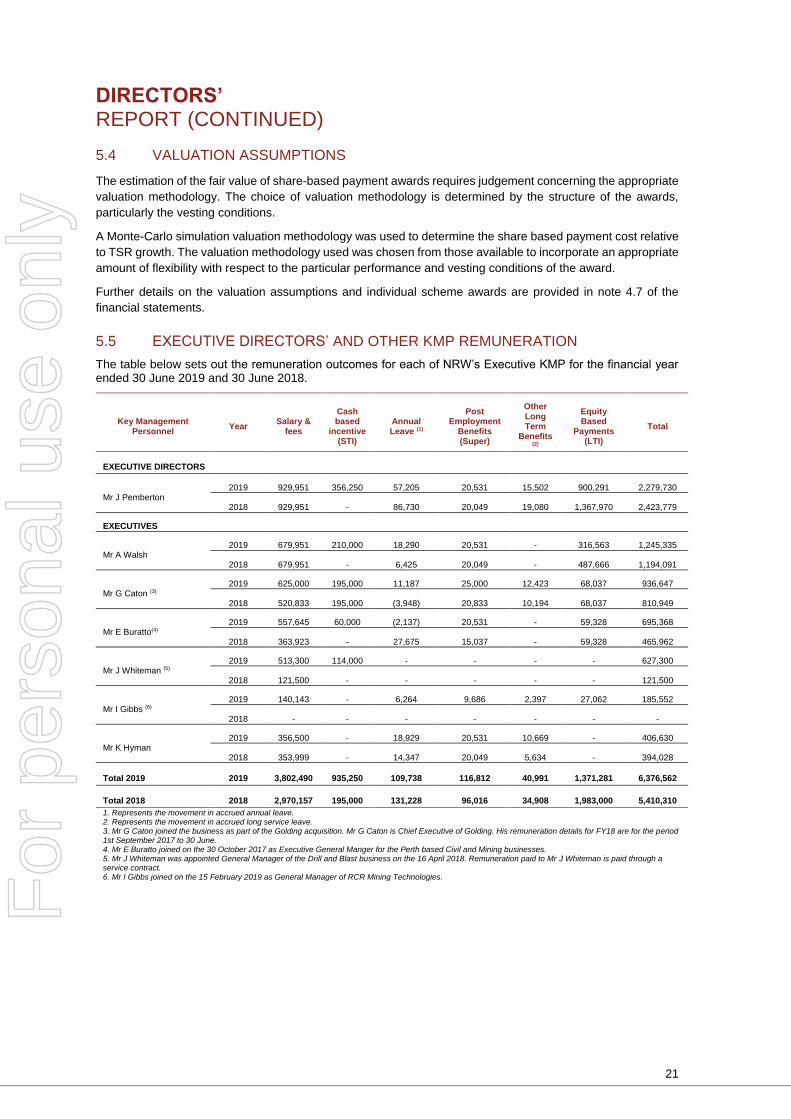
5.5 EXECUTIVE DIRECTORS’ AND OTHER KMP REMUNERATION
The table below sets out the remuneration outcomes for each of NRW’s Executive KMP for the financial year ended 30 June 2019 and 30 June 2018.
Key Management Personnel
Year Salary &
fees
Cash based
incentive (STI)
Annual Leave (1)
Post Employment
Benefits (Super)
Other Long Term
Benefits (2)
Equity Based
Payments (LTI)
Total
EXECUTIVE DIRECTORS
Mr J Pemberton 2019 929,951 356,250 57,205 20,531 15,502 900,291 2,279,730
2018 929,951 - 86,730 20,049 19,080 1,367,970 2,423,779
EXECUTIVES
Mr A Walsh 2019 679,951 210,000 18,290 20,531 - 316,563 1,245,335
2018 679,951 - 6,425 20,049 - 487,666 1,194,091
Mr G Caton (3) 2019 625,000 195,000 11,187 25,000 12,423 68,037 936,647
2018 520,833 195,000 (3,948) 20,833 10,194 68,037 810,949
Mr E Buratto(4) 2019 557,645 60,000 (2,137) 20,531 - 59,328 695,368
2018 363,923 - 27,675 15,037 - 59,328 465,962
Mr J Whiteman (5) 2019 513,300 114,000 - - - - 627,300
2018 121,500 - - - - - 121,500
Mr I Gibbs (6) 2019 140,143 - 6,264 9,686 2,397 27,062 185,552
2018 - - - - - - -
Mr K Hyman 2019 356,500 - 18,929 20,531 10,669 - 406,630
2018 353,999 - 14,347 20,049 5,634 - 394,028
Total 2019 2019 3,802,490 935,250 109,738 116,812 40,991 1,371,281 6,376,562
Total 2018 2018 2,970,157 195,000 131,228 96,016 34,908 1,983,000 5,410,310
1. Represents the movement in accrued annual leave. 2. Represents the movement in accrued long service leave. 3. Mr G Caton joined the business as part of the Golding acquisition. Mr G Caton is Chief Executive of Golding. His remuneration details for FY18 are for the period 1st September 2017 to 30 June. 4. Mr E Buratto joined on the 30 October 2017 as Executive General Manger for the Perth based Civil and Mining businesses. 5. Mr J Whiteman was appointed General Manager of the Drill and Blast business on the 16 April 2018. Remuneration paid to Mr J Whiteman is paid through a service contract. 6. Mr I Gibbs joined on the 15 February 2019 as General Manager of RCR Mining Technologies.
For
per
sona
l use
onl
y
22
DIRECTORS’ REPORT (CONTINUED)
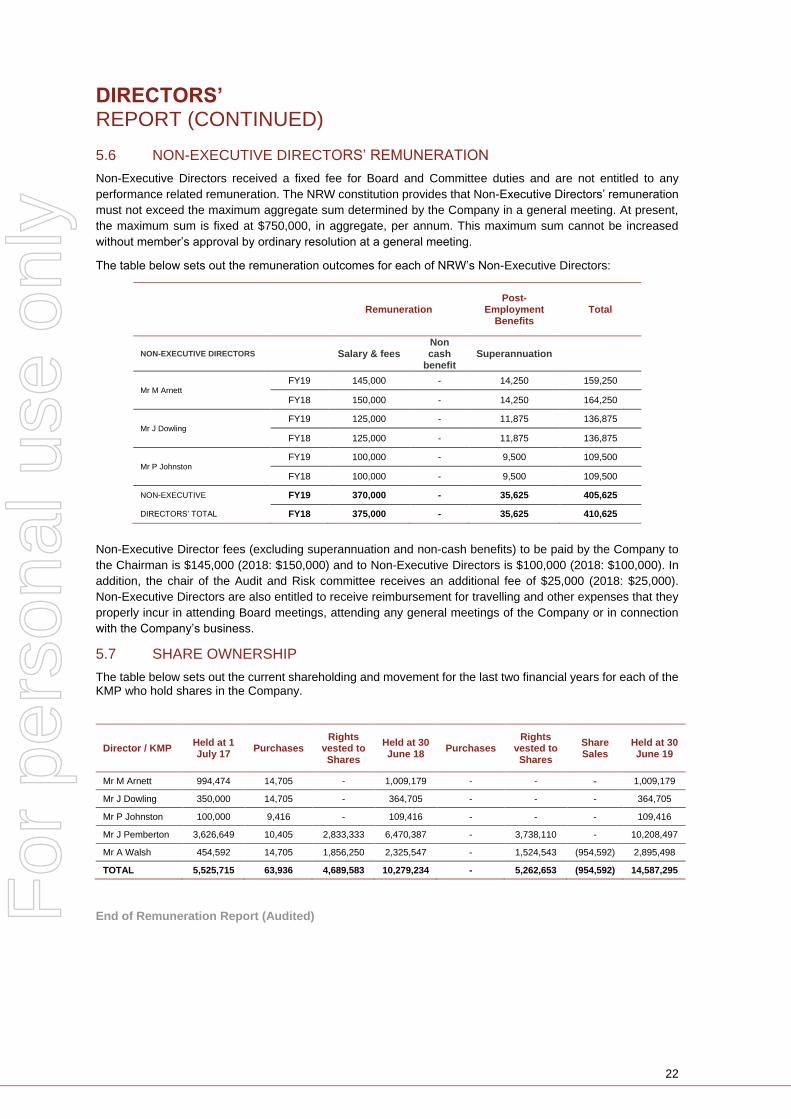
5.6 NON-EXECUTIVE DIRECTORS’ REMUNERATION
Non-Executive Directors received a fixed fee for Board and Committee duties and are not entitled to any
performance related remuneration. The NRW constitution provides that Non-Executive Directors’ remuneration
must not exceed the maximum aggregate sum determined by the Company in a general meeting. At present,
the maximum sum is fixed at $750,000, in aggregate, per annum. This maximum sum cannot be increased
without member’s approval by ordinary resolution at a general meeting.
The table below sets out the remuneration outcomes for each of NRW’s Non-Executive Directors:
Remuneration Post-
Employment Benefits
Total
NON-EXECUTIVE DIRECTORS Salary & fees Non cash
benefit Superannuation
Mr M Arnett FY19 145,000 - 14,250 159,250
FY18 150,000 - 14,250 164,250
Mr J Dowling FY19 125,000 - 11,875 136,875
FY18 125,000 - 11,875 136,875
Mr P Johnston FY19 100,000 - 9,500 109,500
FY18 100,000 - 9,500 109,500
NON-EXECUTIVE FY19 370,000 - 35,625 405,625
DIRECTORS’ TOTAL FY18 375,000 - 35,625 410,625
Non-Executive Director fees (excluding superannuation and non-cash benefits) to be paid by the Company to
the Chairman is $145,000 (2018: $150,000) and to Non-Executive Directors is $100,000 (2018: $100,000). In
addition, the chair of the Audit and Risk committee receives an additional fee of $25,000 (2018: $25,000).
Non-Executive Directors are also entitled to receive reimbursement for travelling and other expenses that they
properly incur in attending Board meetings, attending any general meetings of the Company or in connection
with the Company’s business.
5.7 SHARE OWNERSHIP
The table below sets out the current shareholding and movement for the last two financial years for each of the KMP who hold shares in the Company.
Director / KMP Held at 1 July 17
Purchases Rights
vested to Shares
Held at 30 June 18
Purchases Rights
vested to Shares
Share Sales
Held at 30 June 19
Mr M Arnett 994,474 14,705 - 1,009,179 - - - 1,009,179
Mr J Dowling 350,000 14,705 - 364,705 - - - 364,705
Mr P Johnston 100,000 9,416 - 109,416 - - - 109,416
Mr J Pemberton 3,626,649 10,405 2,833,333 6,470,387 - 3,738,110 - 10,208,497
Mr A Walsh 454,592 14,705 1,856,250 2,325,547 - 1,524,543 (954,592) 2,895,498
TOTAL 5,525,715 63,936 4,689,583 10,279,234 - 5,262,653 (954,592) 14,587,295
End of Remuneration Report (Audited)
For
per
sona
l use
onl
y
23
DIRECTORS’ REPORT (CONTINUED)
ROUNDING OF AMOUNTS
Is a Company of the kind referred to in ASIC Corporations (Rounding in Financial/Directors Reports) Instruments, dated 24 March 2016, and in accordance with that Corporations Instruments amounts in the financial report are rounded off to the nearest thousand Australian dollars, unless otherwise indicated.
This report has been made in accordance with a resolution of the Directors of the Company.
Julian Pemberton Michael Arnett
Chief Executive Officer and Managing Director Chairman and Non-Executive Director
For
per
sona
l use
onl
y
24
CORPORATE GOVERNANCE & RISK MANAGEMENT
Good corporate governance and risk management is fundamental to all aspects of NRW’s activities. Set out
below are the Company’s response to the corporate governance principles followed by a review of the key risks.
CORPORATE GOVERNANCE PRINCIPLES AND RECOMMENDATIONS
The Australian Securities Exchange Corporate Governance Council sets out best practice recommendations,
including corporate governance practices and suggested disclosures. ASX Listing Rule 4.10.3 requires
companies to disclose the extent to which they have complied with the ASX recommendations and to give
reasons for not following them.
Unless otherwise indicated the best practice recommendations of the ASX Corporate Governance Council,
including corporate governance practices and suggested disclosures, have been adopted by the Company for
the year ended 30 June 2019.
In addition, the Company has a Corporate Governance section on its website: www.nrw.com.au which includes
the relevant documentation suggested by the ASX Recommendations.
RISK MANAGEMENT
Risk is an inherent part of the NRW’s business and management of those risks is therefore critical to the
Company’s performance and financial strength.
Material risks that could adversely affect the Company have been identified below along with commentary on
the risk and mitigating actions. The risks are not listed in order of significance nor are they all encompassing,
rather they reflect the most significant risks identified at a whole-of-entity or consolidated level.
Market Risk
NRW’s financial performance is influenced by the level of activity in the resources and mining industry, which is
impacted by a number of factors outside the control of NRW. These factors include:
Demand for mining production, which may be influenced by factors including (but not limited to) prices
of commodities, exchange rates, the competitiveness of Australian mining operations and government
policy on infrastructure spend;
The policies of mine owners including their decisions to undertake their own mining operations or to
outsource these functions; and
The availability and cost of key resources including people, earth moving equipment, and critical
consumables.
Further, NRW operates in a competitive market and it is difficult to predict whether new contracts will be awarded
due to multiple factors influencing how clients evaluate potential service providers.
Mitigation actions include: The development of a diversified service offering with contractual counterparties in
infrastructure and across a range of commodities in the resources sector.
Loss of Contracts / Reduction in Contract Scope
NRW’s revenues are subject to underlying contracts with varying terms.
There is a risk that NRW’s contracts may be cancelled or may not be renewed if NRW’s clients
decide to reduce their levels of spending, potentially reducing their revenue.
Contract operations are vulnerable to the risk of interruption as a result of a variety of factors, which
may be beyond NRW’s control, including prolonged heavy rainfall or cyclones, geological instability,
accidents or unsafe conditions, equipment breakdowns, industrial relations issues, and scarcity of
materials and equipment.
Interruptions to existing operations or delays in commencing operations experienced by NRW’s clients
may result in lost revenue and, in some circumstances, result in NRW incurring additional costs, which
may have a material adverse effect on NRW’s business, results of operations and financial condition.
NRW is also dependant on client assessments of the financial viability of their projects which includes
ensuring they have access to sufficient funding to meet project working capital and debt covenant
requirements.
Mitigation actions include: NRW continues to work closely with its clients to ensure we understand issues
faced by our clients and to identify options where we can assist in ensuring the impact of the types of issues
identified above are minimised.
For
per
sona
l use
onl
y
25
CORPORATE GOVERNANCE & RISK MANAGEMENT (CONTINUED)
RISK MANAGEMENT (CONTINUED)
Delivery Performance
NRW’s execution and delivery of projects involves judgement regarding the planning, development and
management of complex operating facilities and equipment. As a result, NRW’s operations, cash flows and
liquidity could be affected if the resources or time needed to complete a project are miscalculated, if it fails to
meet contractual obligations, or if it encounters delays or unspecified conditions.
NRW is also exposed to input costs through its operations, such as the cost of fuel and energy sources,
equipment and personnel. To the extent that these costs cannot be passed on to customers in a timely manner,
or at all, NRW’s financial performance could be adversely affected. If NRW materially underestimates the cost
of providing services, equipment or plant, there is a risk of a negative impact on NRW’s financial performance.
Mitigation actions include: the development of robust tender and contract review processes which have been
structured to identify risk and develop specific mitigation plans to address issues as they arise. A number of
contracts include a rise and fall clause which mitigate changes in input costs to NRW.
Access to Resources
NRW’s growth and profitability may be limited by loss of key management or operational personnel or due to
being unable to recruit and retain skilled and experienced staff. Further NRW is reliant on third party equipment
to perform contract obligations which may not be available or may be subject to pricing premiums in order to
secure appropriate equipment.
Mitigation actions include: NRW maintains a database of staff who have worked for the Company on all of its
projects and pricing of contracts includes estimates of the likely costs required to attract the right people to
perform the contract. NRW has developed strong working relationships with a number of equipment suppliers
in order to ensure equipment requirements are understood ahead of time in order to minimise any potential risk
around availability.
For
per
sona
l use
onl
y
26
AUDITOR’S INDEPENDENCE DECLARATION
For
per
sona
l use
onl
y
27
DIRECTORS’ DECLARATION
THE DIRECTORS DECLARE THAT:
(a) in the Directors’ opinion, there are reasonable grounds to believe that the Company will be able to pay its debts as and when they become due and payable;
(b) in the Directors’ opinion, the attached financial statements are in compliance with International Financial Reporting Standards, as stated in Note 1.2 to the financial statements;
(c) in the Directors’ opinion, the attached financial statements and notes thereto are in accordance with the Corporations Act 2001, including compliance with accounting standards and giving a true and fair view of the financial position and performance of the consolidated entity; and
(d) the Directors have been given the declarations required by s.295A of the Corporations Act 2001.
At the date of this declaration, the Company is within the class of companies affected by ASIC Class Order 98/1418. The nature of the deed of cross guarantee is such that each company which is party to the deed guarantees to each creditor payment in full of any debt in accordance with the deed of cross guarantee.
In the Directors’ opinion, there are reasonable grounds to believe that the Company and the companies to which the ASIC Class Order applies, as detailed in note 7.1 to the financial statements will, as a group, be able to meet any obligations or liabilities to which they are, or may become, subject by virtue of the deed of cross guarantee.
Signed in accordance with a resolution of the Directors made pursuant to s.295(5) of the Corporations Act 2001.
ON BEHALF OF THE DIRECTORS
Julian Pemberton
Chief Executive Officer and Managing Director
Michael Arnett
Chairman and Non-Executive Director
Perth, 21 August 2019
For
per
sona
l use
onl
y

28
CONTENTS
Consolidated Statement Of Profit Or Loss And Other Comprehensive Income ............................................... 29
Consolidated Statement Of Financial Position ................................................................................................. 30
Consolidated Statement Of Changes In Equity ................................................................................................ 31
Consolidated Statement Of Cash Flows .......................................................................................................... 32
Notes To The Financial Statements ................................................................................................................. 33
1. General Notes ..................................................................................................................................... 33
2. Business Performance ........................................................................................................................ 35
3. Balance Sheet ..................................................................................................................................... 40
4. Capital Structure ................................................................................................................................. 48
5. Financing ............................................................................................................................................ 57
6. Taxation .............................................................................................................................................. 62
7. Other Notes ......................................................................................................................................... 66
Shareholder Information ................................................................................................................................... 82
Independent Auditor’s Report .......................................................................................................................... 84
Glossary…………………………………………………………………………………………………………………..89
Appendix 4E ..................................................................................................................................................... 91
For
per
sona
l use
onl
y
29
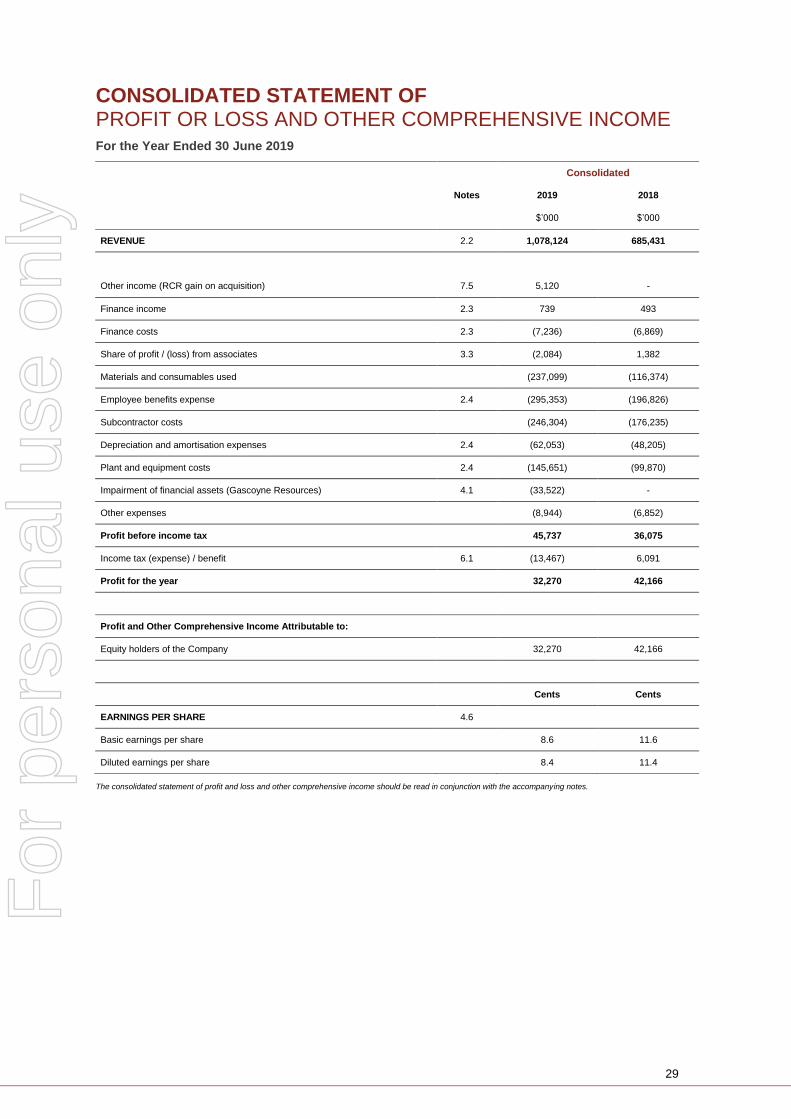
CONSOLIDATED STATEMENT OF PROFIT OR LOSS AND OTHER COMPREHENSIVE INCOME For the Year Ended 30 June 2019
Consolidated
Notes 2019 2018
$’000 $’000
REVENUE 2.2 1,078,124 685,431
Other income (RCR gain on acquisition) 7.5 5,120 -
Finance income 2.3 739 493
Finance costs 2.3 (7,236) (6,869)
Share of profit / (loss) from associates 3.3 (2,084) 1,382
Materials and consumables used (237,099) (116,374)
Employee benefits expense 2.4 (295,353) (196,826)
Subcontractor costs (246,304) (176,235)
Depreciation and amortisation expenses 2.4 (62,053) (48,205)
Plant and equipment costs 2.4 (145,651) (99,870)
Impairment of financial assets (Gascoyne Resources) 4.1 (33,522) -
Other expenses (8,944) (6,852)
Profit before income tax 45,737 36,075
Income tax (expense) / benefit 6.1 (13,467) 6,091
Profit for the year 32,270 42,166
Profit and Other Comprehensive Income Attributable to:
Equity holders of the Company 32,270 42,166
Cents Cents
EARNINGS PER SHARE 4.6
Basic earnings per share 8.6 11.6
Diluted earnings per share 8.4 11.4
The consolidated statement of profit and loss and other comprehensive income should be read in conjunction with the accompanying notes.
For
per
sona
l use
onl
y
30
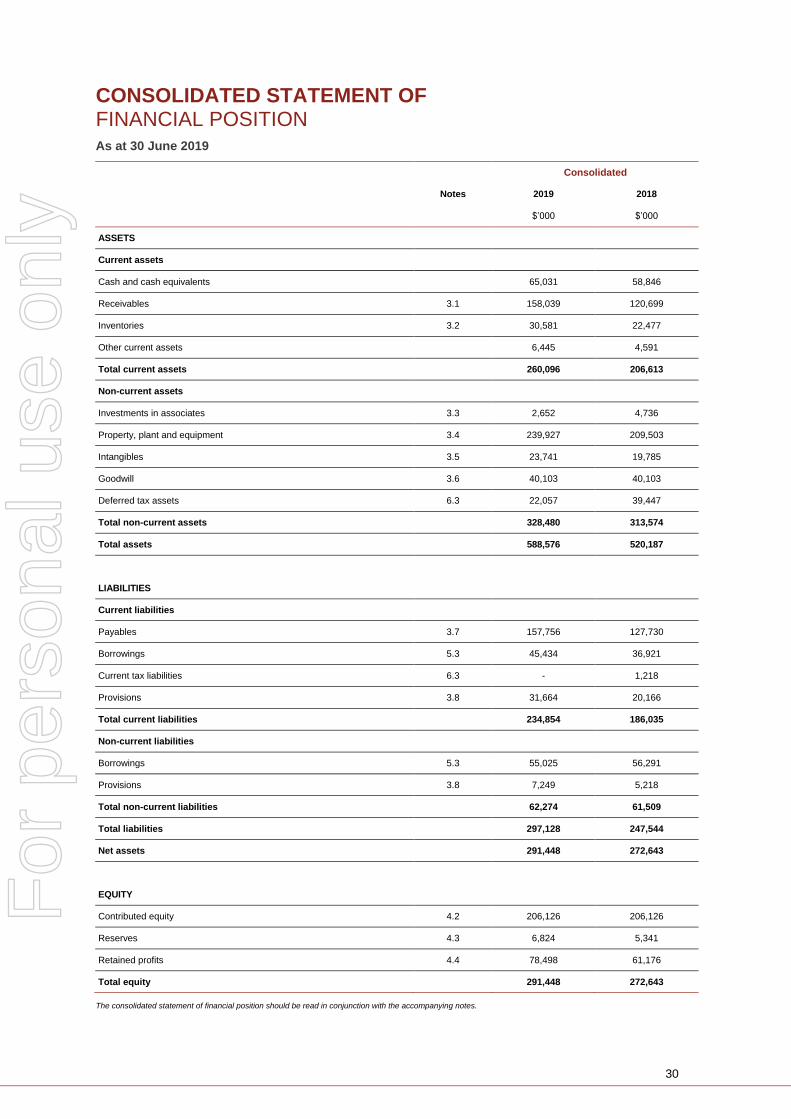
CONSOLIDATED STATEMENT OF FINANCIAL POSITION As at 30 June 2019
Consolidated
Notes 2019 2018
$’000 $’000
ASSETS
Current assets
Cash and cash equivalents 65,031 58,846
Receivables 3.1 158,039 120,699
Inventories 3.2 30,581 22,477
Other current assets 6,445 4,591
Total current assets 260,096 206,613
Non-current assets
Investments in associates 3.3 2,652 4,736
Property, plant and equipment 3.4 239,927 209,503
Intangibles 3.5 23,741 19,785
Goodwill 3.6 40,103 40,103
Deferred tax assets 6.3 22,057 39,447
Total non-current assets 328,480 313,574
Total assets 588,576 520,187
LIABILITIES
Current liabilities
Payables 3.7 157,756 127,730
Borrowings 5.3 45,434 36,921
Current tax liabilities 6.3 - 1,218
Provisions 3.8 31,664 20,166
Total current liabilities 234,854 186,035
Non-current liabilities
Borrowings 5.3 55,025 56,291
Provisions 3.8 7,249 5,218
Total non-current liabilities 62,274 61,509
Total liabilities 297,128 247,544
Net assets 291,448 272,643
EQUITY
Contributed equity 4.2 206,126 206,126
Reserves 4.3 6,824 5,341
Retained profits 4.4 78,498 61,176
Total equity 291,448 272,643
The consolidated statement of financial position should be read in conjunction with the accompanying notes.
For
per
sona
l use
onl
y
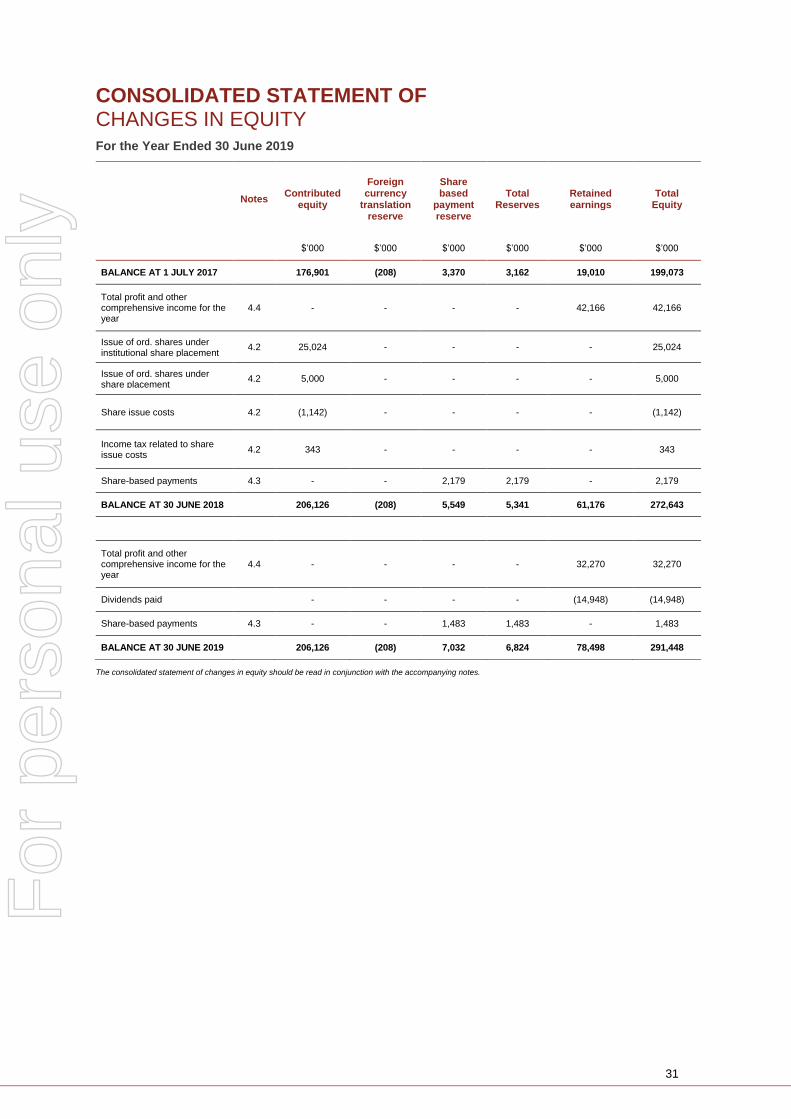
31
CONSOLIDATED STATEMENT OF CHANGES IN EQUITY For the Year Ended 30 June 2019
Notes Contributed
equity
Foreign currency
translation reserve
Share based
payment reserve
Total Reserves
Retained earnings
Total Equity
$’000 $’000 $’000 $’000 $’000 $’000
BALANCE AT 1 JULY 2017 176,901 (208) 3,370 3,162 19,010 199,073
Total profit and other comprehensive income for the year
4.4 - - - - 42,166 42,166
Issue of ord. shares under institutional share placement
4.2 25,024 - - - - 25,024
Issue of ord. shares under share placement
4.2 5,000 - - - - 5,000
Share issue costs 4.2 (1,142) - - - - (1,142)
Income tax related to share issue costs
4.2 343 - - - - 343
Share-based payments 4.3 - - 2,179 2,179 - 2,179
BALANCE AT 30 JUNE 2018 206,126 (208) 5,549 5,341 61,176 272,643
Total profit and other comprehensive income for the year
4.4 - - - - 32,270 32,270
Dividends paid - - - - (14,948) (14,948)
Share-based payments 4.3 - - 1,483 1,483 - 1,483
BALANCE AT 30 JUNE 2019 206,126 (208) 7,032 6,824 78,498 291,448
The consolidated statement of changes in equity should be read in conjunction with the accompanying notes.
For
per
sona
l use
onl
y
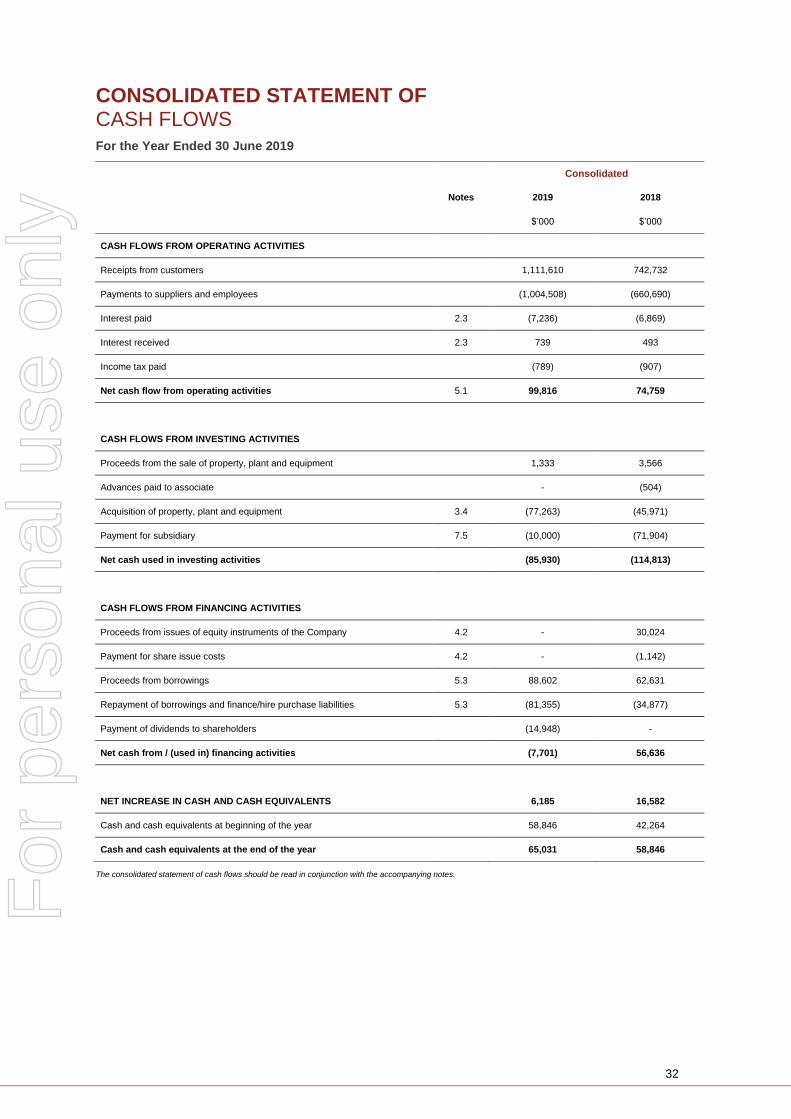
32
CONSOLIDATED STATEMENT OF CASH FLOWS For the Year Ended 30 June 2019
Consolidated
Notes 2019 2018
$’000 $’000
CASH FLOWS FROM OPERATING ACTIVITIES
Receipts from customers 1,111,610 742,732
Payments to suppliers and employees (1,004,508) (660,690)
Interest paid 2.3 (7,236) (6,869)
Interest received 2.3 739 493
Income tax paid (789) (907)
Net cash flow from operating activities 5.1 99,816 74,759
CASH FLOWS FROM INVESTING ACTIVITIES
Proceeds from the sale of property, plant and equipment 1,333 3,566
Advances paid to associate - (504)
Acquisition of property, plant and equipment 3.4 (77,263) (45,971)
Payment for subsidiary 7.5 (10,000) (71,904)
Net cash used in investing activities (85,930) (114,813)
CASH FLOWS FROM FINANCING ACTIVITIES
Proceeds from issues of equity instruments of the Company 4.2 - 30,024
Payment for share issue costs 4.2 - (1,142)
Proceeds from borrowings 5.3 88,602 62,631
Repayment of borrowings and finance/hire purchase liabilities 5.3 (81,355) (34,877)
Payment of dividends to shareholders (14,948) -
Net cash from / (used in) financing activities (7,701) 56,636
NET INCREASE IN CASH AND CASH EQUIVALENTS 6,185 16,582
Cash and cash equivalents at beginning of the year 58,846 42,264
Cash and cash equivalents at the end of the year 65,031 58,846
The consolidated statement of cash flows should be read in conjunction with the accompanying notes.
For
per
sona
l use
onl
y
33
NOTES TO THE FINANCIAL STATEMENTS
1. GENERAL NOTES
1.1 GENERAL INFORMATION
NRW Holdings Limited is a public company listed on the Australian Securities Exchange which is incorporated
and domiciled in Australia. The address of the Company’s registered office is 181 Great Eastern Highway,
Belmont, Western Australia. The consolidated financial statements of the Company for the year ended 30 June
2019 comprises the Company and its subsidiaries (together referred to as ‘consolidated’, the ‘Consolidated
Group’ or the ‘Group’). The Group is primarily involved in civil and mining contracting, urban development,
provision of drilling and blasting services and supply of innovative mining technologies.
1.2 BASIS OF PREPARATION
This section sets out the basis of preparation and the Group accounting policies that relate to the consolidated
financial statements as a whole. Significant and other accounting policies that summarise the measurement
basis used and are relevant to an understanding of the financial statements are provided throughout the notes
to the financial statements to which it relates.
The financial report is a general purpose financial report which:
• has been prepared in accordance with Australian Accounting Standards (AASBs), including Australian
Accounting Interpretations adopted by the Australian Accounting Standards Board, and the
Corporations Act 2001. The financial report of the Group also complies with International Financial
Reporting Standards (IFRSs) and Interpretations as issued by the International Accounting Standards
Board (IASB);
• has been prepared on the basis of historical cost except for the revaluation of financial instruments.
Historical cost is based on the fair values of the consideration given in exchange for goods and
services;
• is presented in Australian dollars (AUD);
• is rounded to the nearest thousand ($000), unless otherwise stated, in accordance with ASIC
Corporations (Rounding in Financial/Directors’ Reports) Instrument 2016/191;
• adopts all new and amended Accounting Standards and Interpretations issued by the AASB that are
relevant to the operations of the Group and effective for reporting periods beginning on or after
1 July 2018. Refer to note 7.8 for further details;
• does not early adopt any Accounting Standards and Interpretations that have been issued or amended
but are not yet effective. Refer to note 7.8 for further details; and
• has applied the Group accounting policies consistently to all periods presented.
The financial statements were authorised for issue by the Directors on 21 August 2019.
1.3 BASIS OF CONSOLIDATION
The consolidated financial statements incorporate the financial statements of the Company and entities
(including structured entities) controlled by the Company and its subsidiaries. Control is achieved when the
Company:
• has power over the investee;
• is exposed, or has rights, to variable returns from its involvement with the investee; and
• has the ability to use its power to affect its returns.
The Company reassesses whether or not it controls an investee if facts and circumstances indicate that there
are changes to one or more of the three elements of control listed above.
For
per
sona
l use
onl
y
34
1.3 BASIS OF CONSOLIDATION (CONTINUED)
When the Company has less than a majority of the voting rights of an investee, it has power over the investee
when the voting rights are sufficient to give it the practical ability to direct the relevant activities of the investee
unilaterally. The Company considers all relevant facts and circumstances in assessing whether or not the
Company’s voting rights in an investee are sufficient to give it power, including:
• the size of the Company’s holding of voting rights relative to the size and dispersion of holdings of the
other vote holders;
• potential voting rights held by the Company, other vote holders or other parties;
• rights arising from other contractual arrangements; and
• any additional facts and circumstances that indicate that the Company has, or does not have, the
current ability to direct the relevant activities at the time that decisions need to be made, including
voting patterns at previous shareholders’ meetings.
Consolidation of a subsidiary begins when the Company obtains control over the subsidiary and ceases when
the Company loses control of the subsidiary. Specifically, income and expenses of a subsidiary acquired or
disposed of during the year are included in the consolidated statement of profit or loss and other comprehensive
income from the date the Company gains control until the date when the Company ceases to control the
subsidiary.
Profit or loss and each component of other comprehensive income are attributed to the owners of the Company
and to the non-controlling interests. Total comprehensive income of subsidiaries is attributed to the owners of
the Company and to the non-controlling interests even if this results in the non-controlling interests having a
deficit balance.
The financial statements of subsidiaries where appropriate are consistent with the Group’s accounting policies.
All intragroup assets and liabilities, equity, income, expenses and cash flows relating to transactions between
members of the Group are eliminated in full on consolidation.
1.4 ACCOUNTING JUDGMENTS AND ESTIMATES
In the application of the Group’s accounting policies, the Directors are required to make judgements, estimates
and assumptions about the carrying amounts of assets and liabilities. The estimates and associated
assumptions are based on historical experience and other factors that are considered to be relevant. Actual
results may differ from these estimates.
The estimates and underlying assumptions are reviewed on an ongoing basis. Revisions to accounting
estimates are recognised in the period in which the estimate is revised:
• if the revision affects only that period; or
• in the period of the revision and future periods if the revision affects both current and future periods.
Critical Judgements in Applying Accounting Policies
Preparation of the financial report requires management to make judgements, estimates and assumptions about
future events. Information on material estimates and judgements considered when applying the accounting
policies can be found in the following notes:
Key accounting judgements and estimates Note Page
Revenue recognition 7.8 76
Carrying amount of goodwill and intangibles 3.5 & 3.6 44 - 46
Acquisition accounting 7.5 72 - 75
For
per
sona
l use
onl
y
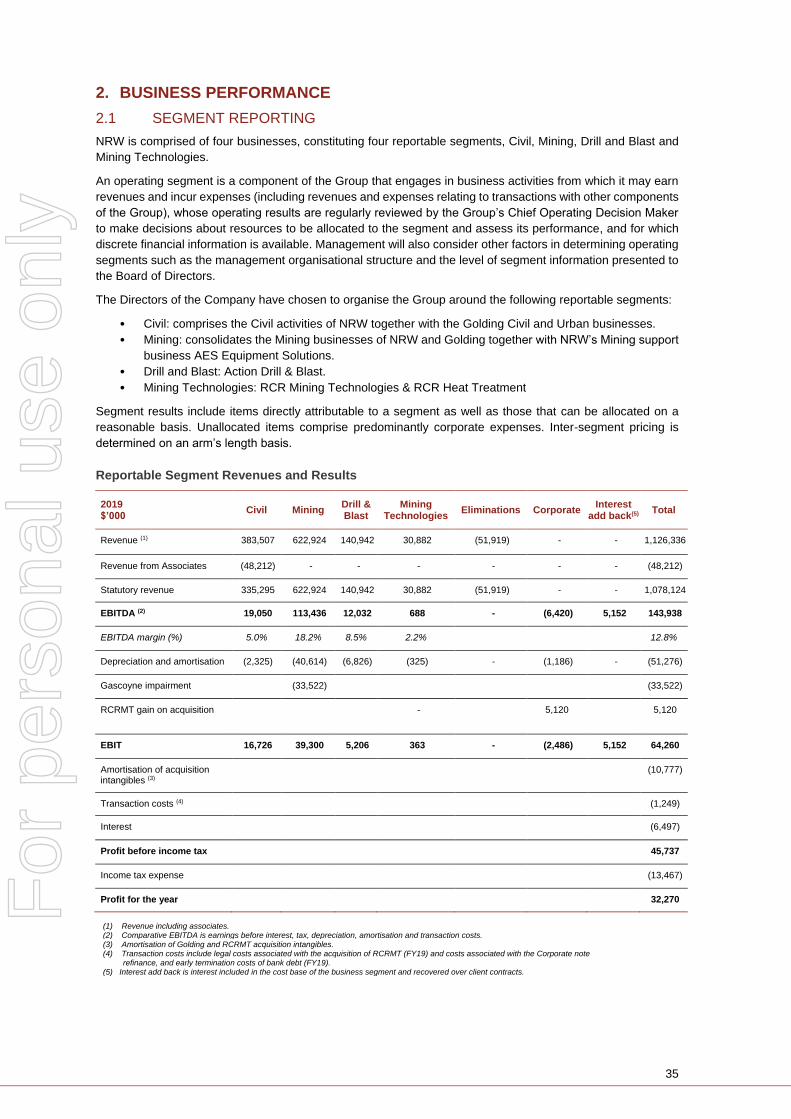
35
2. BUSINESS PERFORMANCE
2.1 SEGMENT REPORTING
NRW is comprised of four businesses, constituting four reportable segments, Civil, Mining, Drill and Blast and
Mining Technologies.
An operating segment is a component of the Group that engages in business activities from which it may earn
revenues and incur expenses (including revenues and expenses relating to transactions with other components
of the Group), whose operating results are regularly reviewed by the Group’s Chief Operating Decision Maker
to make decisions about resources to be allocated to the segment and assess its performance, and for which
discrete financial information is available. Management will also consider other factors in determining operating
segments such as the management organisational structure and the level of segment information presented to
the Board of Directors.
The Directors of the Company have chosen to organise the Group around the following reportable segments:
• Civil: comprises the Civil activities of NRW together with the Golding Civil and Urban businesses.
• Mining: consolidates the Mining businesses of NRW and Golding together with NRW’s Mining support
business AES Equipment Solutions.
• Drill and Blast: Action Drill & Blast.
• Mining Technologies: RCR Mining Technologies & RCR Heat Treatment
Segment results include items directly attributable to a segment as well as those that can be allocated on a
reasonable basis. Unallocated items comprise predominantly corporate expenses. Inter-segment pricing is
determined on an arm’s length basis.
Reportable Segment Revenues and Results
2019 $’000
Civil Mining Drill & Blast
Mining Technologies
Eliminations Corporate Interest
add back(5) Total
Revenue (1) 383,507 622,924 140,942 30,882 (51,919) - - 1,126,336
Revenue from Associates (48,212) - - - - - - (48,212)
Statutory revenue 335,295 622,924 140,942 30,882 (51,919) - - 1,078,124
EBITDA (2) 19,050 113,436 12,032 688 - (6,420) 5,152 143,938
EBITDA margin (%) 5.0% 18.2% 8.5% 2.2% 12.8%
Depreciation and amortisation (2,325) (40,614) (6,826) (325) - (1,186) - (51,276)
Gascoyne impairment (33,522) (33,522)
RCRMT gain on acquisition - 5,120 5,120
EBIT 16,726 39,300 5,206 363 - (2,486) 5,152 64,260
Amortisation of acquisition intangibles (3)
(10,777)
Transaction costs (4) (1,249)
Interest (6,497)
Profit before income tax 45,737
Income tax expense (13,467)
Profit for the year 32,270
(1) Revenue including associates. (2) Comparative EBITDA is earnings before interest, tax, depreciation, amortisation and transaction costs. (3) Amortisation of Golding and RCRMT acquisition intangibles. (4) Transaction costs include legal costs associated with the acquisition of RCRMT (FY19) and costs associated with the Corporate note refinance, and early termination costs of bank debt (FY19). (5) Interest add back is interest included in the cost base of the business segment and recovered over client contracts.
For
per
sona
l use
onl
y
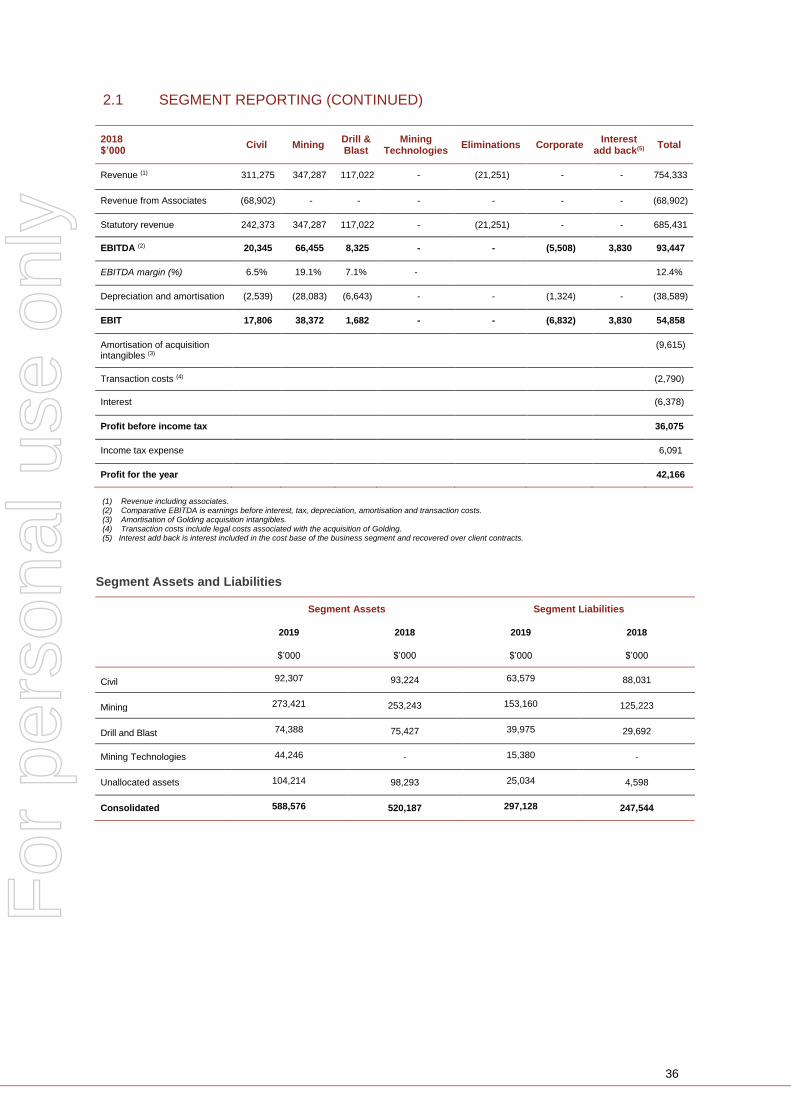
36
2.1 SEGMENT REPORTING (CONTINUED)
2018 $’000
Civil Mining Drill & Blast
Mining Technologies
Eliminations Corporate Interest
add back(5) Total
Revenue (1) 311,275 347,287 117,022 - (21,251) - - 754,333
Revenue from Associates (68,902) - - - - - - (68,902)
Statutory revenue 242,373 347,287 117,022 - (21,251) - - 685,431
EBITDA (2) 20,345 66,455 8,325 - - (5,508) 3,830 93,447
EBITDA margin (%) 6.5% 19.1% 7.1% - 12.4%
Depreciation and amortisation (2,539) (28,083) (6,643) - - (1,324) - (38,589)
EBIT 17,806 38,372 1,682 - - (6,832) 3,830 54,858
Amortisation of acquisition intangibles (3)
(9,615)
Transaction costs (4) (2,790)
Interest (6,378)
Profit before income tax 36,075
Income tax expense 6,091
Profit for the year 42,166
(1) Revenue including associates. (2) Comparative EBITDA is earnings before interest, tax, depreciation, amortisation and transaction costs. (3) Amortisation of Golding acquisition intangibles. (4) Transaction costs include legal costs associated with the acquisition of Golding. (5) Interest add back is interest included in the cost base of the business segment and recovered over client contracts.
Segment Assets and Liabilities
Segment Assets Segment Liabilities
2019 2018 2019 2018
$’000 $’000 $’000 $’000
Civil 92,307 93,224 63,579 88,031
Mining 273,421 253,243 153,160 125,223
Drill and Blast 74,388 75,427 39,975 29,692
Mining Technologies 44,246 - 15,380 -
Unallocated assets 104,214 98,293 25,034 4,598
Consolidated 588,576 520,187 297,128 247,544
For
per
sona
l use
onl
y
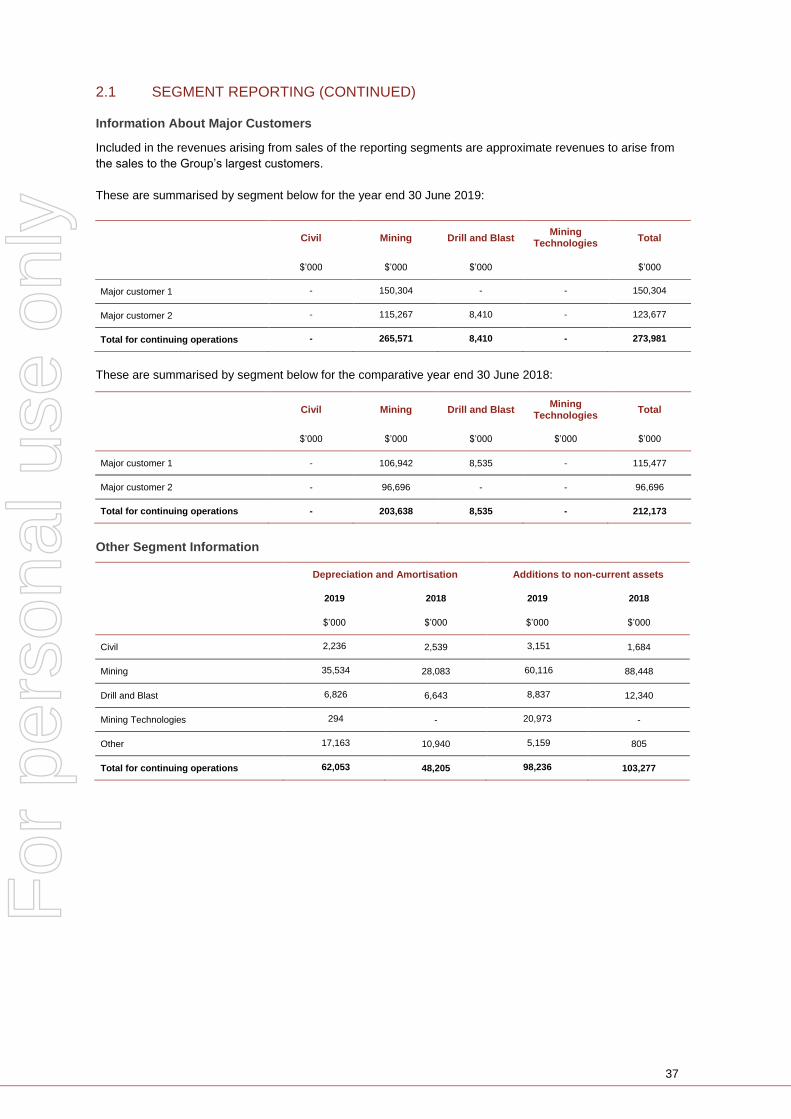
37
2.1 SEGMENT REPORTING (CONTINUED)
Information About Major Customers
Included in the revenues arising from sales of the reporting segments are approximate revenues to arise from
the sales to the Group’s largest customers.
These are summarised by segment below for the year end 30 June 2019:
Civil Mining Drill and Blast Mining
Technologies Total
$’000 $’000 $’000 $’000
Major customer 1 - 150,304 - - 150,304
Major customer 2 - 115,267 8,410 - 123,677
Total for continuing operations - 265,571 8,410 - 273,981
These are summarised by segment below for the comparative year end 30 June 2018:
Civil Mining Drill and Blast Mining
Technologies Total
$’000 $’000 $’000 $’000 $’000
Major customer 1 - 106,942 8,535 - 115,477
Major customer 2 - 96,696 - - 96,696
Total for continuing operations - 203,638 8,535 - 212,173
Other Segment Information
Depreciation and Amortisation Additions to non-current assets
2019 2018 2019 2018
$’000 $’000 $’000 $’000
Civil 2,236 2,539 3,151 1,684
Mining 35,534 28,083 60,116 88,448
Drill and Blast 6,826 6,643 8,837 12,340
Mining Technologies 294 - 20,973 -
Other 17,163 10,940 5,159 805
Total for continuing operations 62,053 48,205 98,236 103,277
For
per
sona
l use
onl
y
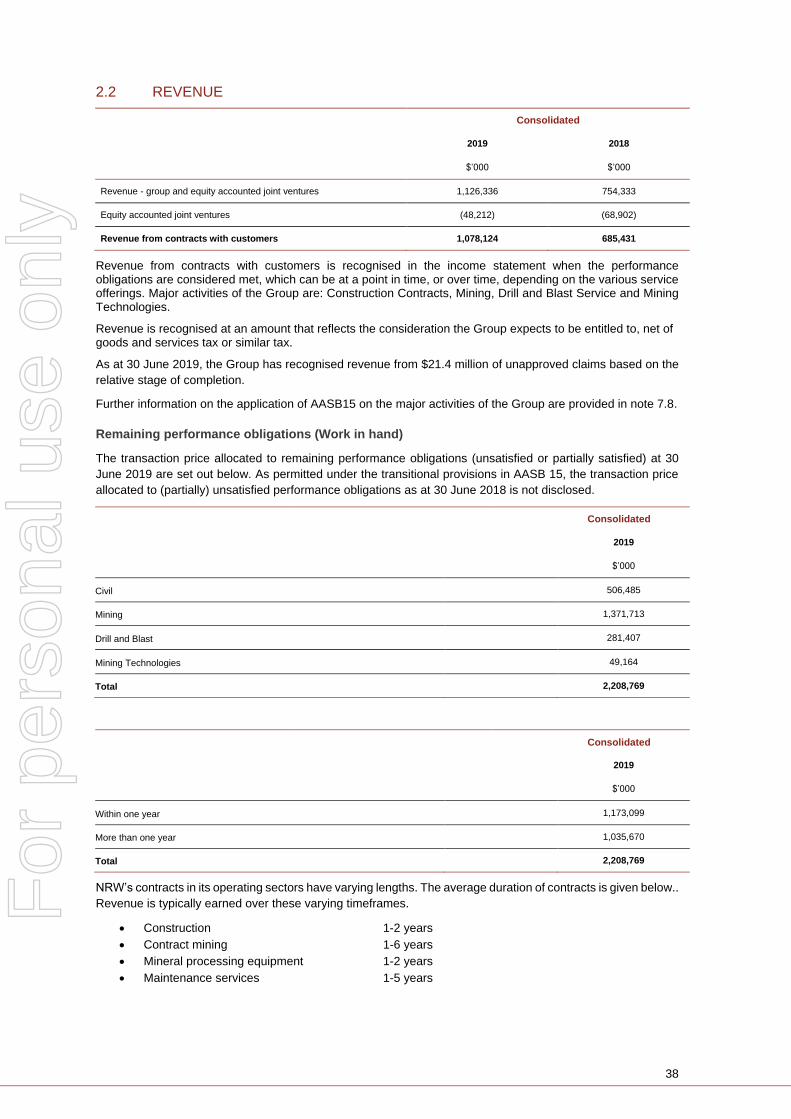
38
2.2 REVENUE
Consolidated
2019 2018
$’000 $’000
Revenue - group and equity accounted joint ventures 1,126,336 754,333
Equity accounted joint ventures (48,212) (68,902)
Revenue from contracts with customers 1,078,124 685,431
Revenue from contracts with customers is recognised in the income statement when the performance obligations are considered met, which can be at a point in time, or over time, depending on the various service offerings. Major activities of the Group are: Construction Contracts, Mining, Drill and Blast Service and Mining Technologies.
Revenue is recognised at an amount that reflects the consideration the Group expects to be entitled to, net of goods and services tax or similar tax.
As at 30 June 2019, the Group has recognised revenue from $21.4 million of unapproved claims based on the
relative stage of completion.
Further information on the application of AASB15 on the major activities of the Group are provided in note 7.8.
Remaining performance obligations (Work in hand)
The transaction price allocated to remaining performance obligations (unsatisfied or partially satisfied) at 30
June 2019 are set out below. As permitted under the transitional provisions in AASB 15, the transaction price
allocated to (partially) unsatisfied performance obligations as at 30 June 2018 is not disclosed.
Consolidated
2019
$’000
Civil 506,485
Mining 1,371,713
Drill and Blast 281,407
Mining Technologies 49,164
Total 2,208,769
Consolidated
2019
$’000
Within one year 1,173,099
More than one year 1,035,670
Total 2,208,769
NRW’s contracts in its operating sectors have varying lengths. The average duration of contracts is given below..
Revenue is typically earned over these varying timeframes.
Construction 1-2 years
Contract mining 1-6 years
Mineral processing equipment 1-2 years
Maintenance services 1-5 years
For
per
sona
l use
onl
y
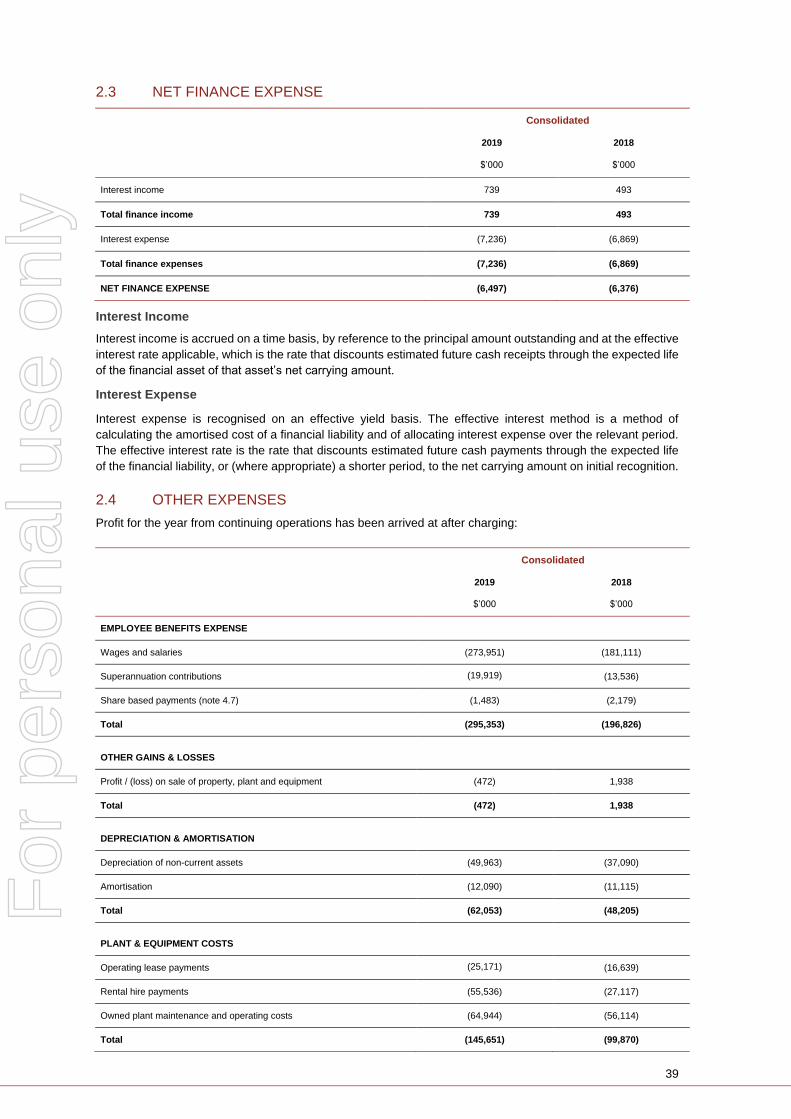
39
2.3 NET FINANCE EXPENSE
Consolidated
2019 2018
$’000 $’000
Interest income 739 493
Total finance income 739 493
Interest expense (7,236) (6,869)
Total finance expenses (7,236) (6,869)
NET FINANCE EXPENSE (6,497) (6,376)
Interest Income
Interest income is accrued on a time basis, by reference to the principal amount outstanding and at the effective
interest rate applicable, which is the rate that discounts estimated future cash receipts through the expected life
of the financial asset of that asset’s net carrying amount.
Interest Expense
Interest expense is recognised on an effective yield basis. The effective interest method is a method of
calculating the amortised cost of a financial liability and of allocating interest expense over the relevant period.
The effective interest rate is the rate that discounts estimated future cash payments through the expected life
of the financial liability, or (where appropriate) a shorter period, to the net carrying amount on initial recognition.
2.4 OTHER EXPENSES
Profit for the year from continuing operations has been arrived at after charging:
Consolidated
2019 2018
$’000 $’000
EMPLOYEE BENEFITS EXPENSE
Wages and salaries (273,951) (181,111)
Superannuation contributions (19,919)
(13,536)
Share based payments (note 4.7) (1,483) (2,179)
Total (295,353) (196,826)
OTHER GAINS & LOSSES
Profit / (loss) on sale of property, plant and equipment (472) 1,938
Total (472) 1,938
DEPRECIATION & AMORTISATION
Depreciation of non-current assets (49,963) (37,090)
Amortisation (12,090) (11,115)
Total (62,053) (48,205)
PLANT & EQUIPMENT COSTS
Operating lease payments (25,171)
(16,639)
Rental hire payments (55,536) (27,117)
Owned plant maintenance and operating costs (64,944) (56,114)
Total (145,651) (99,870)
For
per
sona
l use
onl
y
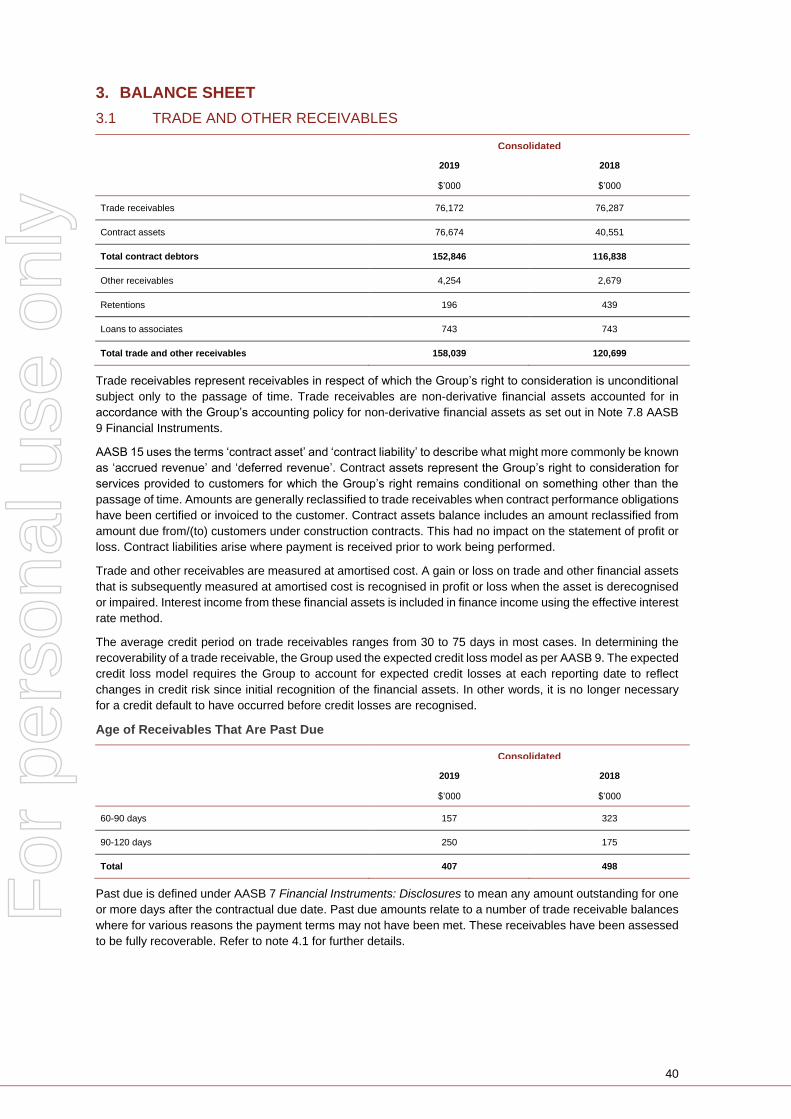
40
3. BALANCE SHEET
3.1 TRADE AND OTHER RECEIVABLES
Consolidated
2019 2018
$’000 $’000
Trade receivables 76,172 76,287
Contract assets 76,674 40,551
Total contract debtors 152,846 116,838
Other receivables 4,254 2,679
Retentions 196 439
Loans to associates 743 743
Total trade and other receivables 158,039 120,699
Trade receivables represent receivables in respect of which the Group’s right to consideration is unconditional
subject only to the passage of time. Trade receivables are non-derivative financial assets accounted for in
accordance with the Group’s accounting policy for non-derivative financial assets as set out in Note 7.8 AASB
9 Financial Instruments.
AASB 15 uses the terms ‘contract asset’ and ‘contract liability’ to describe what might more commonly be known
as ‘accrued revenue’ and ‘deferred revenue’. Contract assets represent the Group’s right to consideration for
services provided to customers for which the Group’s right remains conditional on something other than the
passage of time. Amounts are generally reclassified to trade receivables when contract performance obligations
have been certified or invoiced to the customer. Contract assets balance includes an amount reclassified from
amount due from/(to) customers under construction contracts. This had no impact on the statement of profit or
loss. Contract liabilities arise where payment is received prior to work being performed.
Trade and other receivables are measured at amortised cost. A gain or loss on trade and other financial assets
that is subsequently measured at amortised cost is recognised in profit or loss when the asset is derecognised
or impaired. Interest income from these financial assets is included in finance income using the effective interest
rate method.
The average credit period on trade receivables ranges from 30 to 75 days in most cases. In determining the
recoverability of a trade receivable, the Group used the expected credit loss model as per AASB 9. The expected
credit loss model requires the Group to account for expected credit losses at each reporting date to reflect
changes in credit risk since initial recognition of the financial assets. In other words, it is no longer necessary
for a credit default to have occurred before credit losses are recognised.
Age of Receivables That Are Past Due
Consolidated
2019 2018
$’000 $’000
60-90 days 157 323
90-120 days 250 175
Total 407 498
Past due is defined under AASB 7 Financial Instruments: Disclosures to mean any amount outstanding for one
or more days after the contractual due date. Past due amounts relate to a number of trade receivable balances
where for various reasons the payment terms may not have been met. These receivables have been assessed
to be fully recoverable. Refer to note 4.1 for further details.
For
per
sona
l use
onl
y
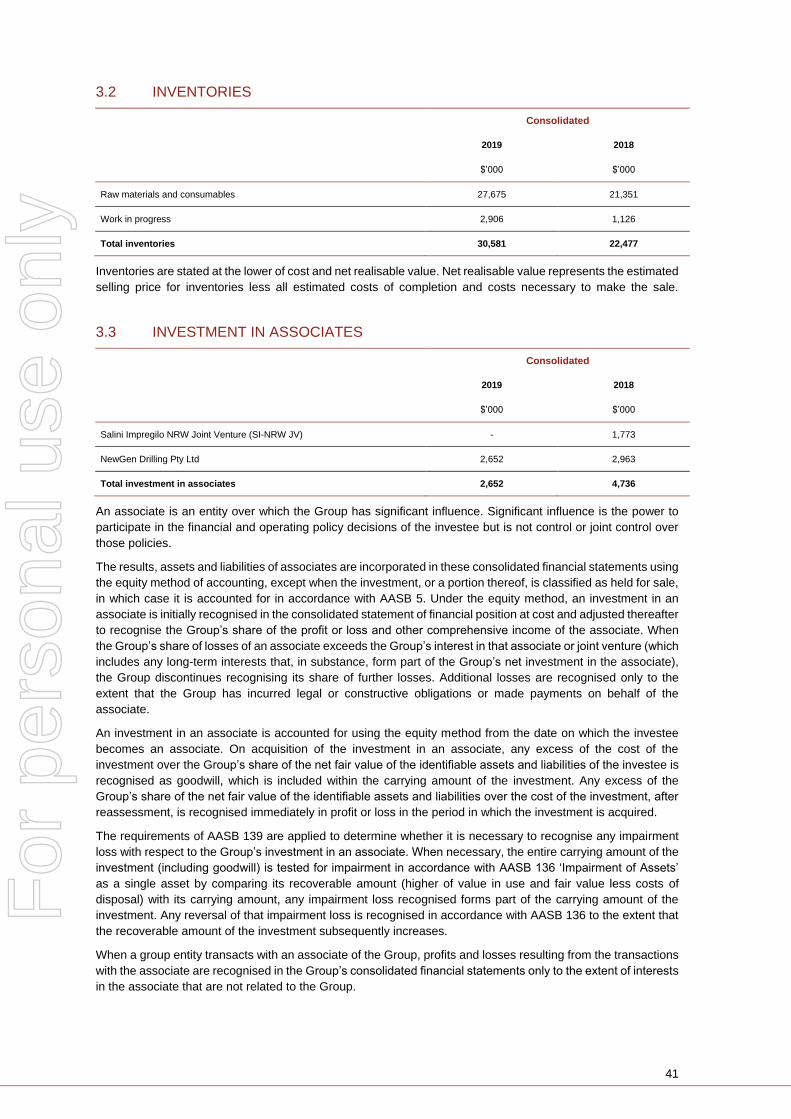
41
3.2 INVENTORIES
Consolidated
2019 2018
$’000 $’000
Raw materials and consumables 27,675 21,351
Work in progress 2,906 1,126
Total inventories 30,581 22,477
Inventories are stated at the lower of cost and net realisable value. Net realisable value represents the estimated
selling price for inventories less all estimated costs of completion and costs necessary to make the sale.
3.3 INVESTMENT IN ASSOCIATES
Consolidated
2019 2018
$’000 $’000
Salini Impregilo NRW Joint Venture (SI-NRW JV) - 1,773
NewGen Drilling Pty Ltd 2,652 2,963
Total investment in associates 2,652 4,736
An associate is an entity over which the Group has significant influence. Significant influence is the power to
participate in the financial and operating policy decisions of the investee but is not control or joint control over
those policies.
The results, assets and liabilities of associates are incorporated in these consolidated financial statements using
the equity method of accounting, except when the investment, or a portion thereof, is classified as held for sale,
in which case it is accounted for in accordance with AASB 5. Under the equity method, an investment in an
associate is initially recognised in the consolidated statement of financial position at cost and adjusted thereafter
to recognise the Group’s share of the profit or loss and other comprehensive income of the associate. When
the Group’s share of losses of an associate exceeds the Group’s interest in that associate or joint venture (which
includes any long-term interests that, in substance, form part of the Group’s net investment in the associate),
the Group discontinues recognising its share of further losses. Additional losses are recognised only to the
extent that the Group has incurred legal or constructive obligations or made payments on behalf of the
associate.
An investment in an associate is accounted for using the equity method from the date on which the investee
becomes an associate. On acquisition of the investment in an associate, any excess of the cost of the
investment over the Group’s share of the net fair value of the identifiable assets and liabilities of the investee is
recognised as goodwill, which is included within the carrying amount of the investment. Any excess of the
Group’s share of the net fair value of the identifiable assets and liabilities over the cost of the investment, after
reassessment, is recognised immediately in profit or loss in the period in which the investment is acquired.
The requirements of AASB 139 are applied to determine whether it is necessary to recognise any impairment
loss with respect to the Group’s investment in an associate. When necessary, the entire carrying amount of the
investment (including goodwill) is tested for impairment in accordance with AASB 136 ‘Impairment of Assets’
as a single asset by comparing its recoverable amount (higher of value in use and fair value less costs of
disposal) with its carrying amount, any impairment loss recognised forms part of the carrying amount of the
investment. Any reversal of that impairment loss is recognised in accordance with AASB 136 to the extent that
the recoverable amount of the investment subsequently increases.
When a group entity transacts with an associate of the Group, profits and losses resulting from the transactions
with the associate are recognised in the Group’s consolidated financial statements only to the extent of interests
in the associate that are not related to the Group.
For
per
sona
l use
onl
y
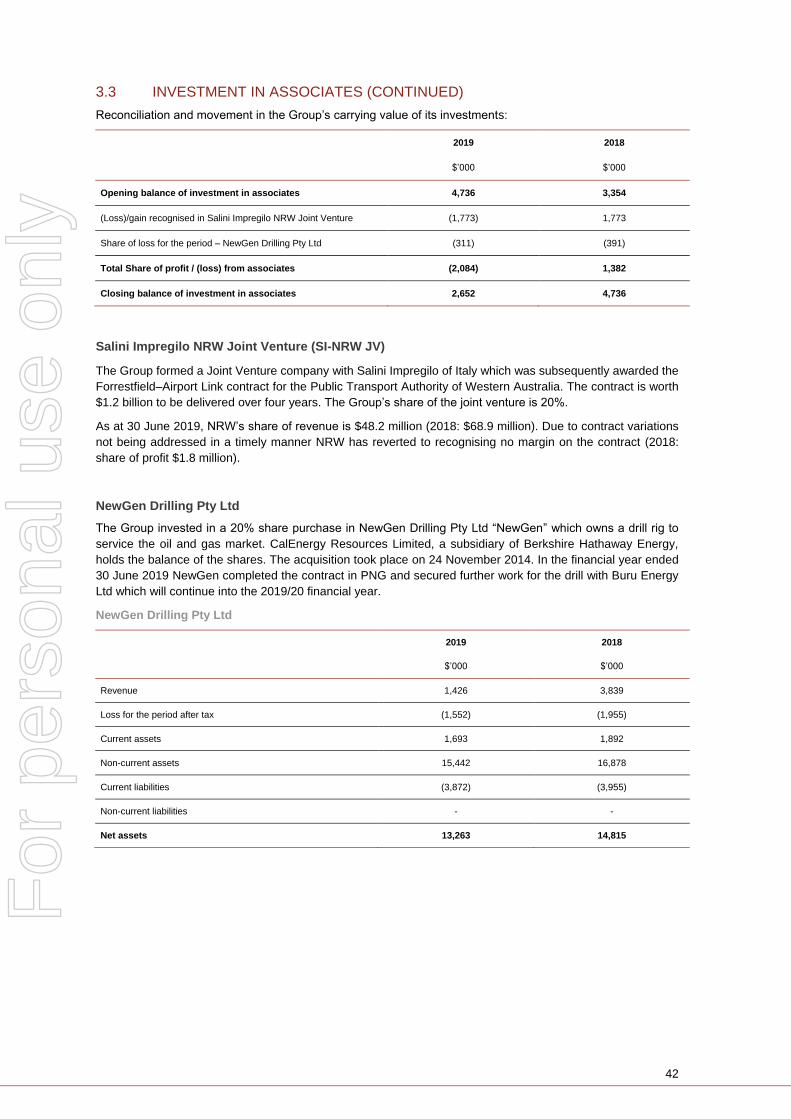
42
3.3 INVESTMENT IN ASSOCIATES (CONTINUED)
Reconciliation and movement in the Group’s carrying value of its investments:
2019 2018
$’000 $’000
Opening balance of investment in associates 4,736 3,354
(Loss)/gain recognised in Salini Impregilo NRW Joint Venture (1,773) 1,773
Share of loss for the period – NewGen Drilling Pty Ltd (311) (391)
Total Share of profit / (loss) from associates (2,084) 1,382
Closing balance of investment in associates 2,652 4,736
Salini Impregilo NRW Joint Venture (SI-NRW JV)
The Group formed a Joint Venture company with Salini Impregilo of Italy which was subsequently awarded the
Forrestfield–Airport Link contract for the Public Transport Authority of Western Australia. The contract is worth
$1.2 billion to be delivered over four years. The Group’s share of the joint venture is 20%.
As at 30 June 2019, NRW’s share of revenue is $48.2 million (2018: $68.9 million). Due to contract variations
not being addressed in a timely manner NRW has reverted to recognising no margin on the contract (2018:
share of profit $1.8 million).
NewGen Drilling Pty Ltd
The Group invested in a 20% share purchase in NewGen Drilling Pty Ltd “NewGen” which owns a drill rig to
service the oil and gas market. CalEnergy Resources Limited, a subsidiary of Berkshire Hathaway Energy,
holds the balance of the shares. The acquisition took place on 24 November 2014. In the financial year ended
30 June 2019 NewGen completed the contract in PNG and secured further work for the drill with Buru Energy
Ltd which will continue into the 2019/20 financial year.
NewGen Drilling Pty Ltd
2019 2018
$’000 $’000
Revenue 1,426 3,839
Loss for the period after tax (1,552) (1,955)
Current assets 1,693 1,892
Non-current assets 15,442 16,878
Current liabilities (3,872) (3,955)
Non-current liabilities - -
Net assets 13,263 14,815
For
per
sona
l use
onl
y

43
3.4 PROPERTY, PLANT AND EQUIPMENT
Property, plant and equipment held by the Consolidated Group include:
Land Buildings Leasehold
improvements Plant and equipment
Total
$’000 $’000 $’000 $’000 $’000
COST
Balance as at 30 June 2017 3,218 6,514 1,431 502,974 514,137
Acquisitions through business combinations (note 7.5)
- - 325 27,844 28,169
Additions - 218 - 45,753 45,971
Disposals - - (76) (21,475) (21,551)
Balance as at 30 June 2018 3,218 6,732 1,680 555,096 566,726
Acquisitions through business combinations (note 7.5)
- - - 4,925 4,925
Additions - - - 77,263 77,263
Disposals - - - (32,354) (32,354)
Balance as at 30 June 2019 3,218 6,732 1,680 604,930 616,560
DEPRECIATION
Balance as at 30 June 2017 1,000 4,969 1,431 332,656 340,055
Depreciation and amortisation expense - 284 122 36,684 37,090
Disposals - - (66) (19,857) (19,923)
Balance as at 30 June 2018 1,000 5,253 1,487 349,483 357,223
Depreciation and amortisation expense - 242 21 49,700 49,963
Disposals - - - (30,553) (30,553)
Balance as at 30 June 2019 1,000 5,495 1,508 368,630 376,633
CARRYING VALUES
At 30 June 2018 2,218 1,479 193 205,613 209,503
At 30 June 2019 2,218 1,237 172 236,300 239,927
Recognition and Measurement
The value of property, plant and equipment is measured as the cost of the asset less accumulated depreciation
and impairment. All property, plant and equipment, other than freehold land, is depreciated or amortised at rates
appropriate to the estimated useful life of the assets or in the case of certain leased plant and equipment, the
shorter lease term or hours (usage) reflecting the effective lives. The normal expected useful lives bands are:
Buildings 4 to 40 years
Leasehold improvements 2 to 7 years
Major plant and equipment 5 to 10 years (normally based on machine hours)
Minor plant and equipment 1.5 to 10 years
Office equipment 2 to 8 years
Furniture and fittings 2 to 5 years
Motor vehicles 3 to 7 years
For
per
sona
l use
onl
y
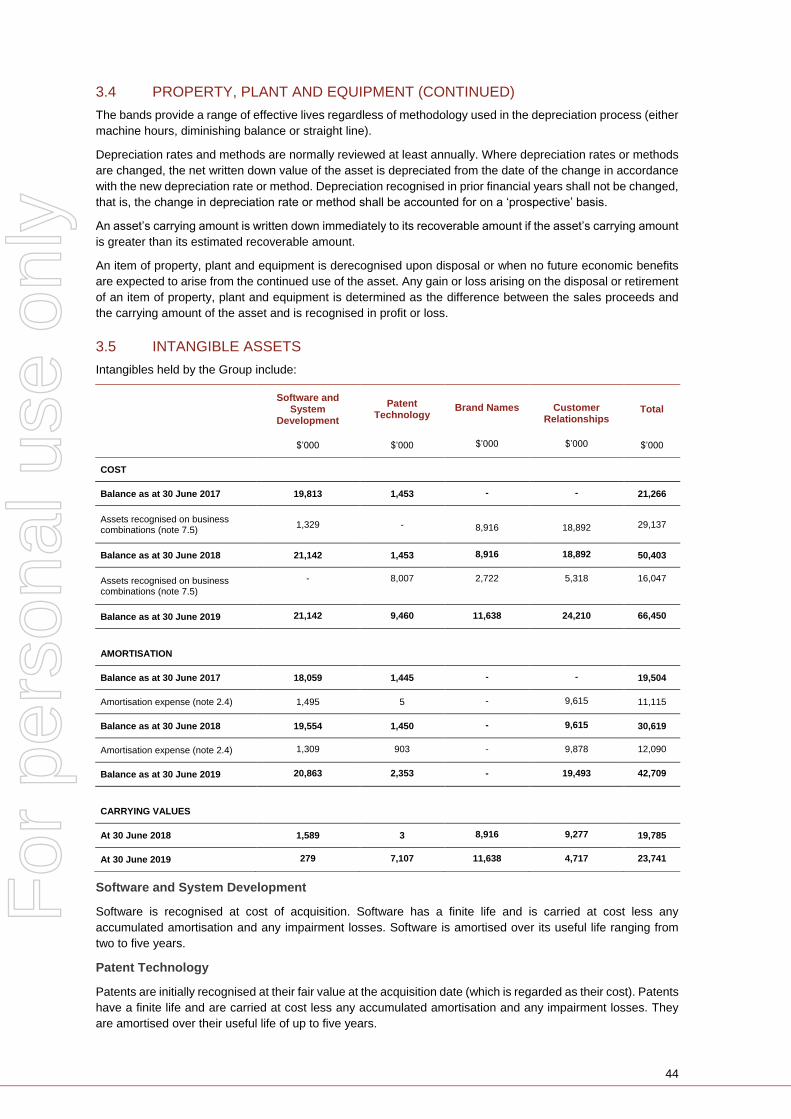
44
3.4 PROPERTY, PLANT AND EQUIPMENT (CONTINUED)
The bands provide a range of effective lives regardless of methodology used in the depreciation process (either
machine hours, diminishing balance or straight line).
Depreciation rates and methods are normally reviewed at least annually. Where depreciation rates or methods
are changed, the net written down value of the asset is depreciated from the date of the change in accordance
with the new depreciation rate or method. Depreciation recognised in prior financial years shall not be changed,
that is, the change in depreciation rate or method shall be accounted for on a ‘prospective’ basis.
An asset’s carrying amount is written down immediately to its recoverable amount if the asset’s carrying amount
is greater than its estimated recoverable amount.
An item of property, plant and equipment is derecognised upon disposal or when no future economic benefits
are expected to arise from the continued use of the asset. Any gain or loss arising on the disposal or retirement
of an item of property, plant and equipment is determined as the difference between the sales proceeds and
the carrying amount of the asset and is recognised in profit or loss.
3.5 INTANGIBLE ASSETS
Intangibles held by the Group include:
Software and System
Development
Patent Technology
Brand Names
Customer
Relationships Total
$’000 $’000 $’000 $’000 $’000
COST
Balance as at 30 June 2017 19,813 1,453 - - 21,266
Assets recognised on business combinations (note 7.5)
1,329 -
8,916
18,892 29,137
Balance as at 30 June 2018 21,142 1,453 8,916 18,892 50,403
Assets recognised on business combinations (note 7.5)
- 8,007 2,722 5,318 16,047
Balance as at 30 June 2019 21,142 9,460 11,638 24,210 66,450
AMORTISATION
Balance as at 30 June 2017 18,059 1,445 - - 19,504
Amortisation expense (note 2.4) 1,495 5 - 9,615 11,115
Balance as at 30 June 2018 19,554 1,450 - 9,615 30,619
Amortisation expense (note 2.4) 1,309 903 - 9,878 12,090
Balance as at 30 June 2019 20,863 2,353 - 19,493 42,709
CARRYING VALUES
At 30 June 2018 1,589 3 8,916 9,277 19,785
At 30 June 2019 279 7,107 11,638 4,717 23,741
Software and System Development
Software is recognised at cost of acquisition. Software has a finite life and is carried at cost less any
accumulated amortisation and any impairment losses. Software is amortised over its useful life ranging from
two to five years.
Patent Technology
Patents are initially recognised at their fair value at the acquisition date (which is regarded as their cost). Patents
have a finite life and are carried at cost less any accumulated amortisation and any impairment losses. They
are amortised over their useful life of up to five years.
For
per
sona
l use
onl
y
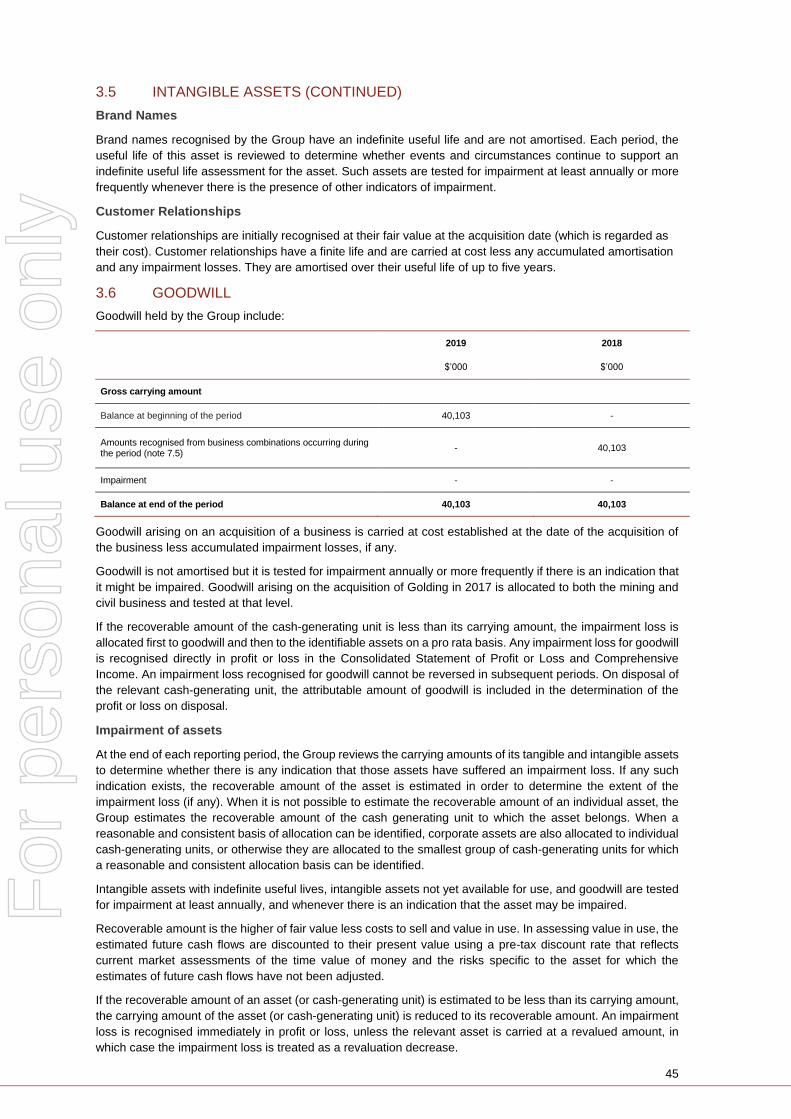
45
3.5 INTANGIBLE ASSETS (CONTINUED)
Brand Names
Brand names recognised by the Group have an indefinite useful life and are not amortised. Each period, the
useful life of this asset is reviewed to determine whether events and circumstances continue to support an
indefinite useful life assessment for the asset. Such assets are tested for impairment at least annually or more
frequently whenever there is the presence of other indicators of impairment.
Customer Relationships
Customer relationships are initially recognised at their fair value at the acquisition date (which is regarded as
their cost). Customer relationships have a finite life and are carried at cost less any accumulated amortisation
and any impairment losses. They are amortised over their useful life of up to five years.
3.6 GOODWILL
Goodwill held by the Group include:
2019 2018
$’000 $’000
Gross carrying amount
Balance at beginning of the period 40,103 -
Amounts recognised from business combinations occurring during the period (note 7.5)
- 40,103
Impairment - -
Balance at end of the period 40,103 40,103
Goodwill arising on an acquisition of a business is carried at cost established at the date of the acquisition of
the business less accumulated impairment losses, if any.
Goodwill is not amortised but it is tested for impairment annually or more frequently if there is an indication that
it might be impaired. Goodwill arising on the acquisition of Golding in 2017 is allocated to both the mining and
civil business and tested at that level.
If the recoverable amount of the cash-generating unit is less than its carrying amount, the impairment loss is
allocated first to goodwill and then to the identifiable assets on a pro rata basis. Any impairment loss for goodwill
is recognised directly in profit or loss in the Consolidated Statement of Profit or Loss and Comprehensive
Income. An impairment loss recognised for goodwill cannot be reversed in subsequent periods. On disposal of
the relevant cash-generating unit, the attributable amount of goodwill is included in the determination of the
profit or loss on disposal.
Impairment of assets
At the end of each reporting period, the Group reviews the carrying amounts of its tangible and intangible assets
to determine whether there is any indication that those assets have suffered an impairment loss. If any such
indication exists, the recoverable amount of the asset is estimated in order to determine the extent of the
impairment loss (if any). When it is not possible to estimate the recoverable amount of an individual asset, the
Group estimates the recoverable amount of the cash generating unit to which the asset belongs. When a
reasonable and consistent basis of allocation can be identified, corporate assets are also allocated to individual
cash-generating units, or otherwise they are allocated to the smallest group of cash-generating units for which
a reasonable and consistent allocation basis can be identified.
Intangible assets with indefinite useful lives, intangible assets not yet available for use, and goodwill are tested
for impairment at least annually, and whenever there is an indication that the asset may be impaired.
Recoverable amount is the higher of fair value less costs to sell and value in use. In assessing value in use, the
estimated future cash flows are discounted to their present value using a pre-tax discount rate that reflects
current market assessments of the time value of money and the risks specific to the asset for which the
estimates of future cash flows have not been adjusted.
If the recoverable amount of an asset (or cash-generating unit) is estimated to be less than its carrying amount,
the carrying amount of the asset (or cash-generating unit) is reduced to its recoverable amount. An impairment
loss is recognised immediately in profit or loss, unless the relevant asset is carried at a revalued amount, in
which case the impairment loss is treated as a revaluation decrease.
For
per
sona
l use
onl
y
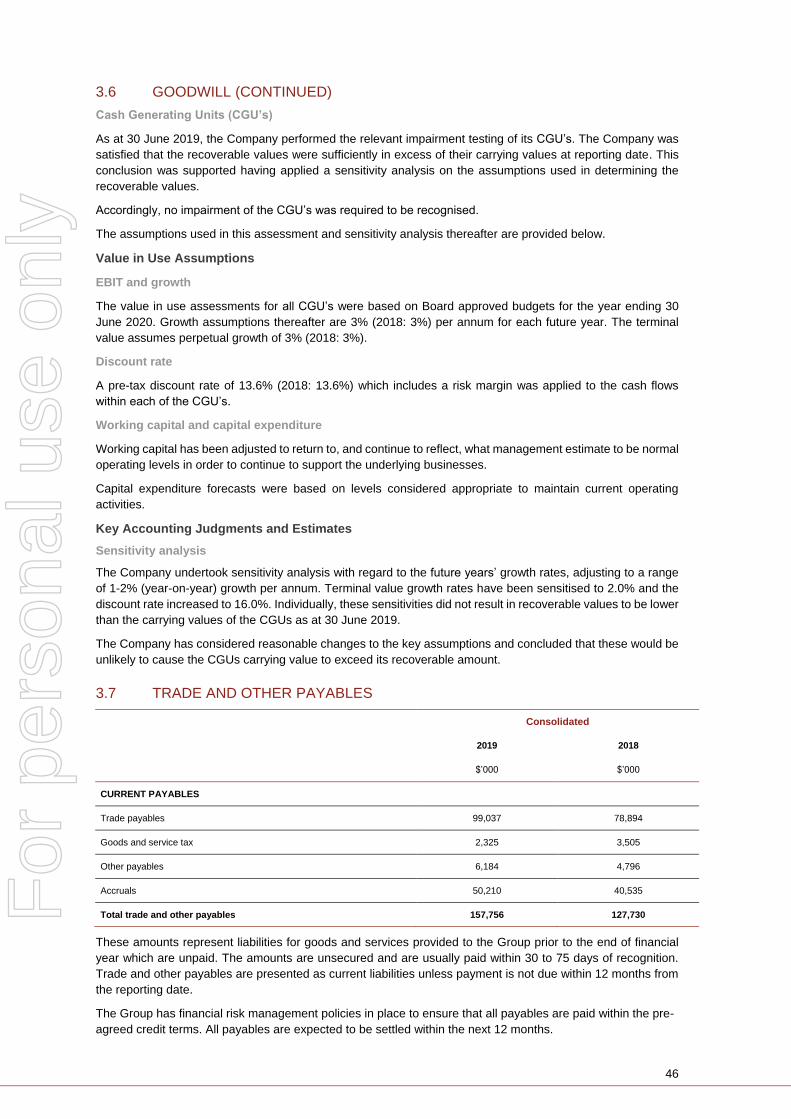
46
3.6 GOODWILL (CONTINUED)
Cash Generating Units (CGU’s)
As at 30 June 2019, the Company performed the relevant impairment testing of its CGU’s. The Company was
satisfied that the recoverable values were sufficiently in excess of their carrying values at reporting date. This
conclusion was supported having applied a sensitivity analysis on the assumptions used in determining the
recoverable values.
Accordingly, no impairment of the CGU’s was required to be recognised.
The assumptions used in this assessment and sensitivity analysis thereafter are provided below.
Value in Use Assumptions
EBIT and growth
The value in use assessments for all CGU’s were based on Board approved budgets for the year ending 30
June 2020. Growth assumptions thereafter are 3% (2018: 3%) per annum for each future year. The terminal
value assumes perpetual growth of 3% (2018: 3%).
Discount rate
A pre-tax discount rate of 13.6% (2018: 13.6%) which includes a risk margin was applied to the cash flows
within each of the CGU’s.
Working capital and capital expenditure
Working capital has been adjusted to return to, and continue to reflect, what management estimate to be normal
operating levels in order to continue to support the underlying businesses.
Capital expenditure forecasts were based on levels considered appropriate to maintain current operating
activities.
Key Accounting Judgments and Estimates
Sensitivity analysis
The Company undertook sensitivity analysis with regard to the future years’ growth rates, adjusting to a range
of 1-2% (year-on-year) growth per annum. Terminal value growth rates have been sensitised to 2.0% and the
discount rate increased to 16.0%. Individually, these sensitivities did not result in recoverable values to be lower
than the carrying values of the CGUs as at 30 June 2019.
The Company has considered reasonable changes to the key assumptions and concluded that these would be
unlikely to cause the CGUs carrying value to exceed its recoverable amount.
3.7 TRADE AND OTHER PAYABLES
Consolidated
2019 2018
$’000 $’000
CURRENT PAYABLES
Trade payables 99,037 78,894
Goods and service tax 2,325 3,505
Other payables 6,184 4,796
Accruals 50,210 40,535
Total trade and other payables 157,756 127,730
These amounts represent liabilities for goods and services provided to the Group prior to the end of financial
year which are unpaid. The amounts are unsecured and are usually paid within 30 to 75 days of recognition.
Trade and other payables are presented as current liabilities unless payment is not due within 12 months from
the reporting date.
The Group has financial risk management policies in place to ensure that all payables are paid within the pre-
agreed credit terms. All payables are expected to be settled within the next 12 months.
For
per
sona
l use
onl
y
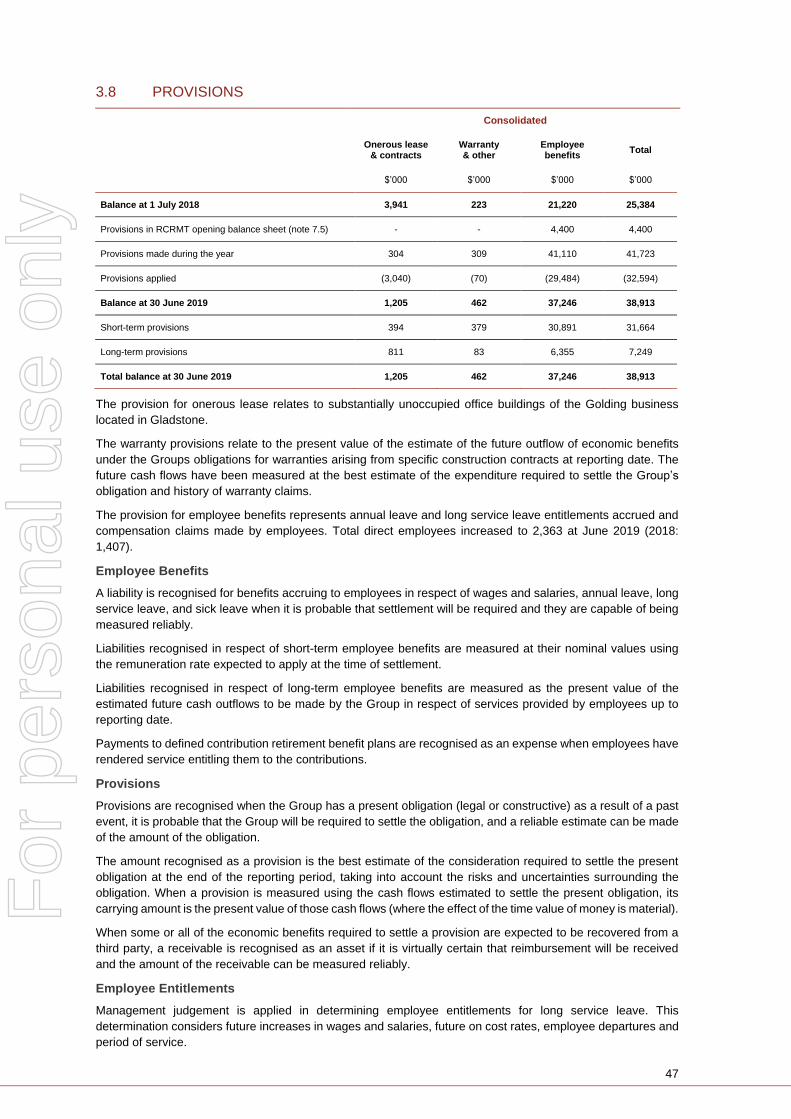
47
3.8 PROVISIONS
Consolidated
Onerous lease
& contracts Warranty & other
Employee benefits
Total
$’000 $’000 $’000 $’000
Balance at 1 July 2018 3,941 223 21,220 25,384
Provisions in RCRMT opening balance sheet (note 7.5) - - 4,400 4,400
Provisions made during the year 304 309 41,110 41,723
Provisions applied (3,040) (70) (29,484) (32,594)
Balance at 30 June 2019 1,205 462 37,246 38,913
Short-term provisions 394 379 30,891 31,664
Long-term provisions 811 83 6,355 7,249
Total balance at 30 June 2019 1,205 462 37,246 38,913
The provision for onerous lease relates to substantially unoccupied office buildings of the Golding business
located in Gladstone.
The warranty provisions relate to the present value of the estimate of the future outflow of economic benefits
under the Groups obligations for warranties arising from specific construction contracts at reporting date. The
future cash flows have been measured at the best estimate of the expenditure required to settle the Group’s
obligation and history of warranty claims.
The provision for employee benefits represents annual leave and long service leave entitlements accrued and
compensation claims made by employees. Total direct employees increased to 2,363 at June 2019 (2018:
1,407).
Employee Benefits
A liability is recognised for benefits accruing to employees in respect of wages and salaries, annual leave, long
service leave, and sick leave when it is probable that settlement will be required and they are capable of being
measured reliably.
Liabilities recognised in respect of short-term employee benefits are measured at their nominal values using
the remuneration rate expected to apply at the time of settlement.
Liabilities recognised in respect of long-term employee benefits are measured as the present value of the
estimated future cash outflows to be made by the Group in respect of services provided by employees up to
reporting date.
Payments to defined contribution retirement benefit plans are recognised as an expense when employees have
rendered service entitling them to the contributions.
Provisions
Provisions are recognised when the Group has a present obligation (legal or constructive) as a result of a past
event, it is probable that the Group will be required to settle the obligation, and a reliable estimate can be made
of the amount of the obligation.
The amount recognised as a provision is the best estimate of the consideration required to settle the present
obligation at the end of the reporting period, taking into account the risks and uncertainties surrounding the
obligation. When a provision is measured using the cash flows estimated to settle the present obligation, its
carrying amount is the present value of those cash flows (where the effect of the time value of money is material).
When some or all of the economic benefits required to settle a provision are expected to be recovered from a
third party, a receivable is recognised as an asset if it is virtually certain that reimbursement will be received
and the amount of the receivable can be measured reliably.
Employee Entitlements
Management judgement is applied in determining employee entitlements for long service leave. This
determination considers future increases in wages and salaries, future on cost rates, employee departures and
period of service.
For
per
sona
l use
onl
y

48
4. CAPITAL STRUCTURE
The Group manages its capital structure to ensure that entities in the Group will be able to continue as a going
concern while maximising returns to shareholders.
Gearing Ratio
The Board meets regularly to determine the level of borrowings and shareholder funding required to
appropriately support business operations. The gearing ratio is a function of the capital structure, dividends and
movements in debt. The gearing ratio was calculated at 30 June 2019 as:
Consolidated
2019 2018
$’000 $’000
Cash 65,031 58,846
Borrowings (note 5.3) (100,459) (93,212)
Net Debt (35,428) (34,366)
Total equity 291,448 272,643
Net Debt to Equity Ratio 12.2% 12.6%
4.1 FINANCIAL INSTRUMENTS
Financial Risk Management
The Group’s overall financial risk strategy seeks to ensure appropriate funding levels, approved treasury
directives to meet ongoing project needs and to allow flexibility for growth. The Board has ultimate responsibility
for the Group’s policy of risk management. The risk policies and procedures are reviewed periodically. In
addition, the going concern basis is reviewed throughout the year, ensuring adequate working capital
is available.
The financial instruments in the Group primarily consist of interest bearing debt, cash, trade receivables and
payables. The Group has minimal foreign currency risks, although its presence in Guinea West Africa remains,
including some assets that are strategically held there for new opportunities. No cash is held other than to meet
the day to day running costs.
Capital Risk Management
The capital structure of the Group comprises of debt (borrowings), cash and cash equivalents, and equity. A
significant portion of the debt funding was established with NRW’s lead banking partner, Bankwest, through a
loan facility drawn in December 2018 used to redeem the Corporate Notes (issued on 19 December 2016 to
acquire assets utilised in the operations of Civil, Mining and Action Drill and Blast). In addition, a $48 million
Golding Debt Facility was established in August 2017 to partially fund the acquisition of the Golding Group (note
7.5).
The cash position is reviewed regularly and the Group had access to an interchangeable working capital facility
(overdraft) as at 30 June 2019, as disclosed at note 5.3.
Interest Rate Risk Management
Principal and interest payments under the Bankwest loan facilities are made quarterly. The term of the Bankwest
loans are to expire in December 2020 and the Golding Debt Facility in February 2021. The Board continues to
review its risk associated with any covenants and borrowing conditions on a regular basis.
The Bankwest loans are at variable interest rates. All other debt facilities are provided on fixed interest terms.
The Board considers the exposure to market rate volatility as low. If the Group were to consider a movement of
100 basis points in interest rates or cost of funds, there would be no material impact to the cost of capital.
For
per
sona
l use
onl
y
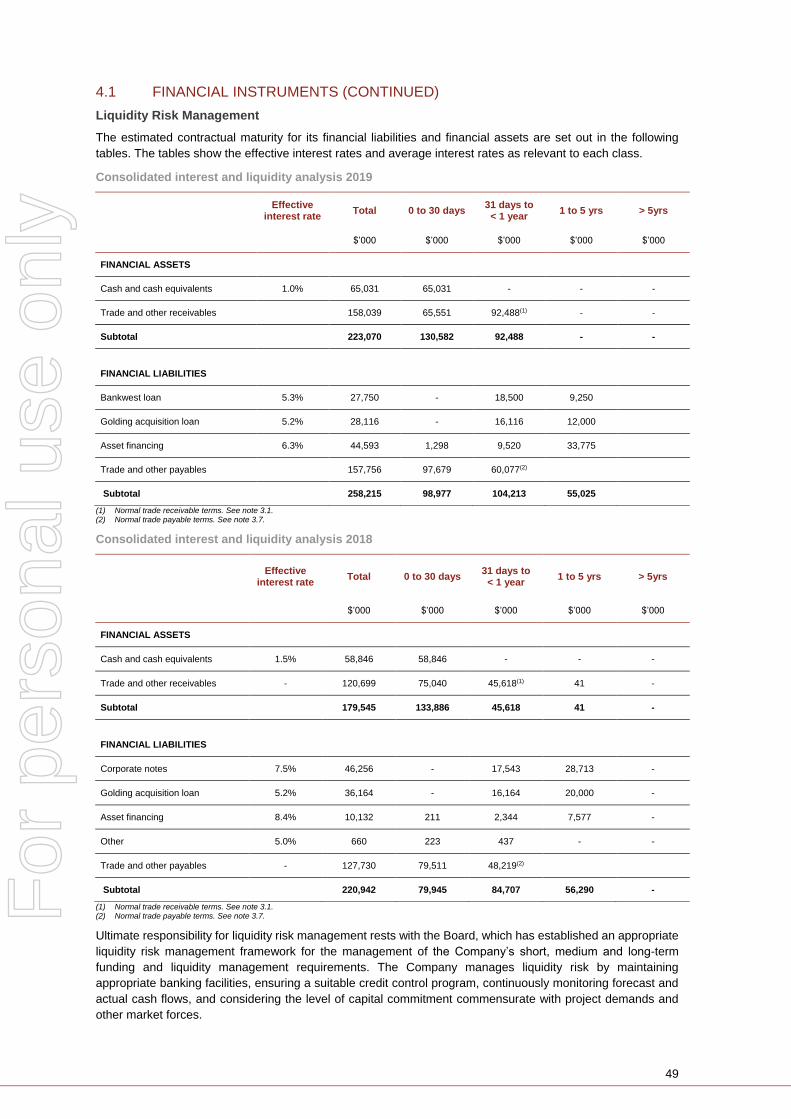
49
4.1 FINANCIAL INSTRUMENTS (CONTINUED)
Liquidity Risk Management
The estimated contractual maturity for its financial liabilities and financial assets are set out in the following
tables. The tables show the effective interest rates and average interest rates as relevant to each class.
Consolidated interest and liquidity analysis 2019
Effective
interest rate Total 0 to 30 days
31 days to < 1 year
1 to 5 yrs > 5yrs
$’000 $’000 $’000 $’000 $’000
FINANCIAL ASSETS
Cash and cash equivalents 1.0% 65,031 65,031 - - -
Trade and other receivables 158,039 65,551 92,488(1) - -
Subtotal 223,070 130,582 92,488 - -
FINANCIAL LIABILITIES
Bankwest loan 5.3% 27,750 - 18,500 9,250
Golding acquisition loan 5.2% 28,116 - 16,116 12,000
Asset financing 6.3% 44,593 1,298 9,520 33,775
Trade and other payables 157,756 97,679 60,077(2)
Subtotal 258,215 98,977 104,213 55,025
(1) Normal trade receivable terms. See note 3.1. (2) Normal trade payable terms. See note 3.7.
Consolidated interest and liquidity analysis 2018
Effective
interest rate Total 0 to 30 days
31 days to < 1 year
1 to 5 yrs > 5yrs
$’000 $’000 $’000 $’000 $’000
FINANCIAL ASSETS
Cash and cash equivalents 1.5% 58,846 58,846 - - -
Trade and other receivables - 120,699 75,040 45,618(1) 41 -
Subtotal 179,545 133,886 45,618 41 -
FINANCIAL LIABILITIES
Corporate notes 7.5% 46,256 - 17,543 28,713 -
Golding acquisition loan 5.2% 36,164 - 16,164 20,000 -
Asset financing 8.4% 10,132 211 2,344 7,577 -
Other 5.0% 660 223 437 - -
Trade and other payables - 127,730 79,511 48,219(2)
Subtotal 220,942 79,945 84,707 56,290 -
(1) Normal trade receivable terms. See note 3.1. (2) Normal trade payable terms. See note 3.7.
Ultimate responsibility for liquidity risk management rests with the Board, which has established an appropriate
liquidity risk management framework for the management of the Company’s short, medium and long-term
funding and liquidity management requirements. The Company manages liquidity risk by maintaining
appropriate banking facilities, ensuring a suitable credit control program, continuously monitoring forecast and
actual cash flows, and considering the level of capital commitment commensurate with project demands and
other market forces.
For
per
sona
l use
onl
y
50
4.1 FINANCIAL INSTRUMENTS (CONTINUED)
Foreign Exchange and Currency Exposure
The Group reports its functional currency in Australian dollars (AUD). The Board considers that movements in
foreign currency will have virtually no impact on operating profits, given that most projects are agreed and billed
in Australian dollars and cash holdings in other currencies other than AUD are negligible. Should foreign
operations expand then suitable risk measures would be put in place accordingly. Any new developments which
the Group considers or bids for are considered as part of the risk management reviews held by the Board. Other
than specific transactions or purchases negotiated with the supplier, transactions dealing in foreign currency
are dealt with at spot rates.
Credit Risk
The primary credit risk faced by the Group is the failure of customers to pay their obligations as and when they
fall due. Trade and other receivables payment terms are primarily 30 to 75 days. Cash retentions are low as
clients require bonds and bank guarantees.
The carrying amount of financial assets recorded in the financial statements net of any allowance for losses,
represents the Group’s maximum exposure to credit risk without taking into account the value of any collateral.
Bank guarantees at 30 June 2019 total $6.0 million (2018: $4.9 million) and contract guarantees provided by
the insurance market total $69.0 million (2018: $29.8 million).
Impairment of financial assets
In relation to the impairment of financial assets, AASB 9 requires an expected credit loss model as opposed to
an incurred credit loss model under AASB 139. The expected credit loss model requires the Group to account
for expected credit losses at each reporting date to reflect changes in credit risk since initial recognition of the
financial assets. In particular, AASB 9 requires the Group to measure the loss allowance for a financial
instrument at an amount equal to the lifetime expected credit losses (ECL) if the credit risk of that financial
instrument has increased significantly since initial recognition, or if the financial instrument is a purchased or
originated credit-impaired financial asset. However, if the credit risk on a financial instrument has not increased
significantly since initial recognition (except for a purchased or originated credit-impaired financial asset), the
Group is required to measure the loss allowance for that financial instrument at an amount equal to 12-months
ECL. AASB 9 also requires a simplified approach for measuring the loss allowance at an amount equal to
lifetime ECL for trade receivables, contract assets and lease receivables in certain circumstances. The Group
has elected to apply this simplified approach, applying the accounting policy set out in Note 7.8.
The Group recognises a loss allowance for expected credit losses on investments in debt instruments that are
measured at amortised cost, lease receivables, amounts due from customers, as well as on loan commitments
and financial guarantee contracts. The amount of expected credit losses is updated at each reporting date to
reflect changes in credit risk since initial recognition of the respective financial instrument.
Measuring movements in credit risk
The Company considers the probability of default upon initial recognition of the asset and whether there has
been a significant increase in credit risk on an ongoing basis throughout each reporting period. To assess
whether there is a significant increase in credit risk the Company compares the risk of a default occurring on
the asset as at the reporting date with the risk of default as at the date of initial recognition. In making this
assessment, the Group considers both quantitative and qualitative information that is reasonable and
supportable, including historical experience and forward-looking information that is available without undue cost
or effort. Forward‑looking information considered includes the future prospects of the industries in which the
Group’s debtors operate, obtained from economic expert reports, financial analysts, governmental bodies,
relevant think‑tanks and other similar organisations, as well as consideration of various external sources of
actual and forecast economic information that relate to the Group’s core operations.
In particular, the following information is taken into account when assessing whether credit risk has increased
significantly since initial recognition:
An actual or expected significant deterioration in the financial instrument’s external (if available) or
internal credit rating;
For
per
sona
l use
onl
y
51
4.1 FINANCIAL INSTRUMENTS (CONTINUED)
Significant deterioration in external market indicators of credit risk for a particular financial instrument,
e.g. a significant increase in the credit spread, the credit default swap prices for the debtor, or the
length of time or the extent to which the fair value of a financial asset has been less than its amortised
cost;
Existing or forecast adverse changes in business, financial or economic conditions that are expected
to cause a significant decrease in the debtor’s ability to meet its debt obligations;
An actual or expected significant deterioration in the operating results of the debtor;
Significant increases in credit risk on other financial instruments of the same debtor; and
An actual or expected significant adverse change in the regulatory, economic, or technological
environment of the debtor that results in a significant decrease in the debtor’s ability to meet its debt
obligations.
Irrespective of the outcome of the above assessment, the Group presumes that the credit risk on a financial
asset has increased significantly since initial recognition when contractual payments are more than 30 days
past due, unless the Group has reasonable and supportable information that demonstrates otherwise.
Despite the foregoing, the Group assumes that the credit risk on a financial instrument has not increased
significantly since initial recognition if the financial instrument is determined to have low credit risk at the
reporting date. A financial instrument is determined to have low credit risk if:
The financial instrument has a low risk of default;
The debtor has a strong capacity to meet its contractual cash flow obligations in the near term; and
Adverse changes in economic and business conditions in the longer term may, but will not necessarily,
reduce the ability of the borrower to fulfil its contractual cash flow obligations.
The Group considers a financial asset to have low credit risk when the asset has external credit rating of
‘investment grade’ in accordance with the globally understood definition or if an external rating is not available,
the asset has an internal rating of ‘performing’. Performing means that the counterparty has a strong financial
position and there is no past due amounts.
The Group regularly monitors the effectiveness of the criteria used to identify whether there has been a
significant increase in credit risk and revises them as appropriate to ensure that the criteria are capable of
identifying significant increase in credit risk before the amount becomes past due.
Definition of default
The Group considers the following as constituting an event of default for internal credit risk management
purposes as historical experience indicates that receivables that meet either of the following criteria are
generally not recoverable:
If there is a material breach of financial covenants by the counterparty and this is not expected to be
remedied in the foreseeable future; or
Information developed internally or obtained from external sources indicates that the debtor is unlikely
to pay its creditors, including the Group, in full (without taking into account any collaterals held by the
Group).
Irrespective of the above analysis, the Group considers that default has occurred when a financial asset is
significantly past due unless the Group has reasonable and supportable information to demonstrate that a more
lagging default criterion is more appropriate.
Credit-impaired financial assets
A financial asset is credit-impaired when one or more events that have a detrimental impact on the estimated
future cash flows of that financial asset have occurred. Evidence that a financial asset is credit-impaired includes
observable data about the following events:
Significant financial difficulty of the issuer or the borrower;
A breach of contract, such as a default or past due event;
The lender(s) of the borrower, for economic or contractual reasons relating to the borrower’s financial
difficulty, having granted to the borrower a concession(s) that the lender(s) would not otherwise
consider;
It is becoming probable that the borrower will enter bankruptcy or other financial reorganisation; or
The disappearance of an active market for that financial asset because of financial difficulties.
For
per
sona
l use
onl
y
52
4.1 FINANCIAL INSTRUMENTS (CONTINUED)
Write-off policy
The Group writes off a financial asset when there is information indicating that the counterparty is in severe
financial difficulty and there is no realistic prospect of recovery, e.g. when the counterparty has been placed
under liquidation or entered into bankruptcy proceedings. Financial assets written off may still be subject to
enforcement activities under the Group’s recovery procedures, taking into account legal advice where
appropriate. Any recoveries made are recognised in profit or loss.
Measurement and recognition of expected credit losses
In determining expected credit losses, the Directors of the Company have taken into account the historical
default experience, the financial position of the counterparties, as well as the future prospects of the industries
in which they operate.
The loss allowance recognised during the period is $29.2 million (2018: nil) and is comprised entirely of
Gascoyne Resources related balances:
Trade Receivables $19.2 million
Secured Loans $10.0 million
The Group is still entitled to the gross value of the financial assets.
Other than in respect of Gascoyne Resources the Group did not obtain financial or non-financial assets as
collateral during the period.
Investments in financial assets
During the year the Group acquired listed equity shares of Gascoyne Resources Limited for the consideration of $4.3 million. Following their entry into voluntary administration in June 2019, the Company has impaired the shares held by $4.3 million to a fair value of nil.
No investments in financial assets were held at 30 June 2018.
For
per
sona
l use
onl
y
53
4.2 ISSUED CAPITAL
Fully Paid Ordinary Shares
Consolidated
2019 2018
$’000 $’000
ORDINARY SHARES
375,880,733 fully paid ordinary shares (2018: 370,618,080)
206,126 206,126
All issued shares are fully paid and rank equally. Fully paid ordinary shares carry one vote per share and
carry a right to dividends.
Consolidated
2019 2019 2018 2018
# No. ‘000 $‘000 # No. ‘000 $‘000
FULLY PAID ORDINARY SHARES
Balance at the beginning of the financial year 370,617 206,126 321,776 176,901
Capital raising at $0.69 share - - 36,800 25,024
Share issue under share purchase plan at $0.68 share - - 7,353 5,000
Share issue costs net of tax - - - (1,142)
Income tax related to share issue costs - - - 343
Issue of shares to executives 5,263 - 4,689 -
Balance at the end of the period 375,880 206,126 370,618 206,126
The Company has on issue a total of 375,880,733 (2018: 370,618,080) ordinary shares, of which 10,792
(2018: 10,792) shares are held by subsidiaries of the Company and eliminated on consolidation.
4.3 RESERVES
Consolidated
2019 2018
$’000 $’000
Share based payment reserve 7,032 5,549
Foreign currency reserve (208) (208)
Total reserves 6,824 5,341
Share Based Payment Reserve
Consolidated
2019 2018
$’000 $’000
Balance at the beginning of the financial year 5,549 3,370
Share based payments 1,483 2,179
Balance at the end of the financial year 7,032 5,549
Information relating to performance rights, including details of issued, exercised and lapsed during the financial
year and outstanding at the end of the financial year, is set out in the Remuneration Report and at note 4.7.
For
per
sona
l use
onl
y
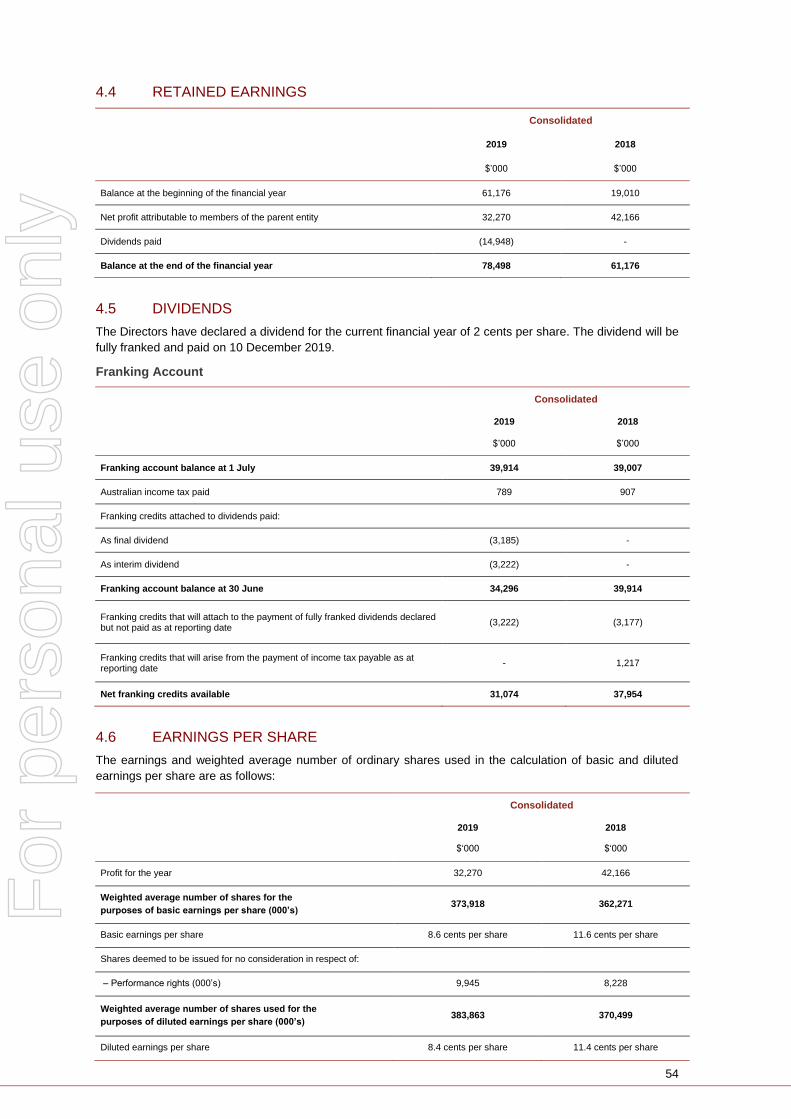
54
4.4 RETAINED EARNINGS
Consolidated
2019 2018
$’000 $’000
Balance at the beginning of the financial year 61,176 19,010
Net profit attributable to members of the parent entity 32,270 42,166
Dividends paid (14,948) -
Balance at the end of the financial year 78,498 61,176
4.5 DIVIDENDS
The Directors have declared a dividend for the current financial year of 2 cents per share. The dividend will be
fully franked and paid on 10 December 2019.
Franking Account
Consolidated
2019 2018
$’000 $’000
Franking account balance at 1 July 39,914 39,007
Australian income tax paid 789 907
Franking credits attached to dividends paid:
As final dividend (3,185) -
As interim dividend (3,222) -
Franking account balance at 30 June 34,296 39,914
Franking credits that will attach to the payment of fully franked dividends declared but not paid as at reporting date
(3,222) (3,177)
Franking credits that will arise from the payment of income tax payable as at reporting date
- 1,217
Net franking credits available 31,074 37,954
4.6 EARNINGS PER SHARE
The earnings and weighted average number of ordinary shares used in the calculation of basic and diluted
earnings per share are as follows:
Consolidated
2019 2018
$‘000 $‘000
Profit for the year 32,270 42,166
Weighted average number of shares for the
purposes of basic earnings per share (000’s) 373,918 362,271
Basic earnings per share 8.6 cents per share 11.6 cents per share
Shares deemed to be issued for no consideration in respect of:
– Performance rights (000’s) 9,945 8,228
Weighted average number of shares used for the
purposes of diluted earnings per share (000’s) 383,863 370,499
Diluted earnings per share 8.4 cents per share 11.4 cents per share
For
per
sona
l use
onl
y
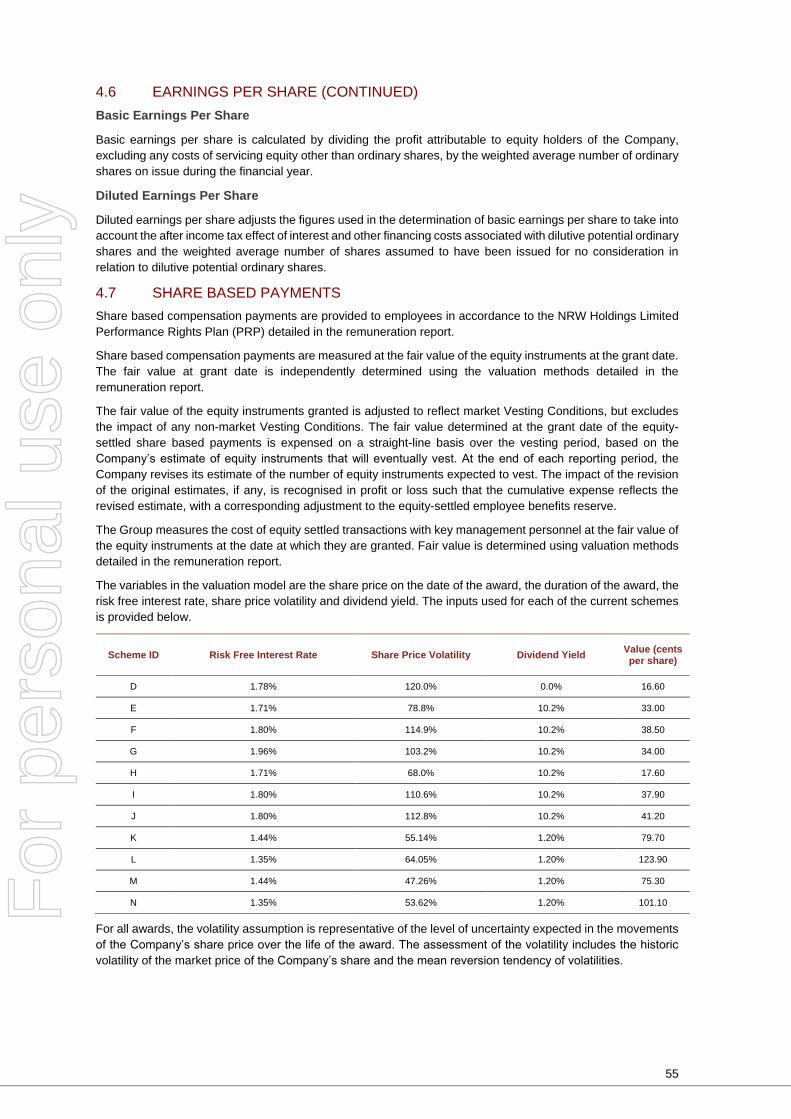
55
4.6 EARNINGS PER SHARE (CONTINUED)
Basic Earnings Per Share
Basic earnings per share is calculated by dividing the profit attributable to equity holders of the Company,
excluding any costs of servicing equity other than ordinary shares, by the weighted average number of ordinary
shares on issue during the financial year.
Diluted Earnings Per Share
Diluted earnings per share adjusts the figures used in the determination of basic earnings per share to take into
account the after income tax effect of interest and other financing costs associated with dilutive potential ordinary
shares and the weighted average number of shares assumed to have been issued for no consideration in
relation to dilutive potential ordinary shares.
4.7 SHARE BASED PAYMENTS
Share based compensation payments are provided to employees in accordance to the NRW Holdings Limited
Performance Rights Plan (PRP) detailed in the remuneration report.
Share based compensation payments are measured at the fair value of the equity instruments at the grant date.
The fair value at grant date is independently determined using the valuation methods detailed in the
remuneration report.
The fair value of the equity instruments granted is adjusted to reflect market Vesting Conditions, but excludes
the impact of any non-market Vesting Conditions. The fair value determined at the grant date of the equity-
settled share based payments is expensed on a straight-line basis over the vesting period, based on the
Company’s estimate of equity instruments that will eventually vest. At the end of each reporting period, the
Company revises its estimate of the number of equity instruments expected to vest. The impact of the revision
of the original estimates, if any, is recognised in profit or loss such that the cumulative expense reflects the
revised estimate, with a corresponding adjustment to the equity-settled employee benefits reserve.
The Group measures the cost of equity settled transactions with key management personnel at the fair value of
the equity instruments at the date at which they are granted. Fair value is determined using valuation methods
detailed in the remuneration report.
The variables in the valuation model are the share price on the date of the award, the duration of the award, the
risk free interest rate, share price volatility and dividend yield. The inputs used for each of the current schemes
is provided below.
Scheme ID Risk Free Interest Rate Share Price Volatility Dividend Yield Value (cents per share)
D 1.78% 120.0% 0.0% 16.60
E 1.71% 78.8% 10.2% 33.00
F 1.80% 114.9% 10.2% 38.50
G 1.96% 103.2% 10.2% 34.00
H 1.71% 68.0% 10.2% 17.60
I 1.80% 110.6% 10.2% 37.90
J 1.80% 112.8% 10.2% 41.20
K 1.44% 55.14% 1.20% 79.70
L 1.35% 64.05% 1.20% 123.90
M 1.44% 47.26% 1.20% 75.30
N 1.35% 53.62% 1.20% 101.10
For all awards, the volatility assumption is representative of the level of uncertainty expected in the movements
of the Company’s share price over the life of the award. The assessment of the volatility includes the historic
volatility of the market price of the Company’s share and the mean reversion tendency of volatilities.
For
per
sona
l use
onl
y
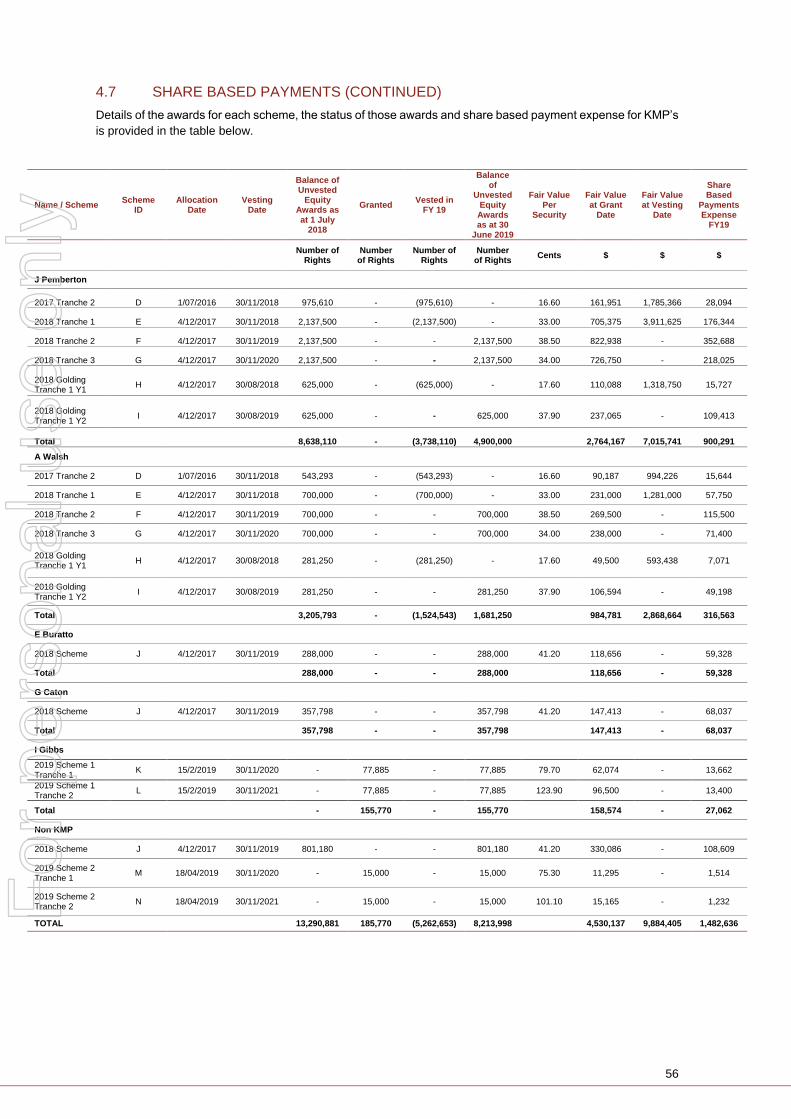
56
4.7 SHARE BASED PAYMENTS (CONTINUED)
Details of the awards for each scheme, the status of those awards and share based payment expense for KMP’s
is provided in the table below.
Name / Scheme Scheme
ID Allocation
Date Vesting
Date
Balance of Unvested
Equity Awards as at 1 July
2018
Granted Vested in
FY 19
Balance of
Unvested Equity Awards as at 30
June 2019
Fair Value Per
Security
Fair Value at Grant
Date
Fair Value at Vesting
Date
Share Based
Payments Expense
FY19
Number of Rights
Number of Rights
Number of Rights
Number of Rights
Cents $ $ $
J Pemberton
2017 Tranche 2 D 1/07/2016 30/11/2018 975,610 - (975,610) - 16.60 161,951 1,785,366 28,094
2018 Tranche 1 E 4/12/2017 30/11/2018 2,137,500 - (2,137,500) - 33.00 705,375 3,911,625 176,344
2018 Tranche 2 F 4/12/2017 30/11/2019 2,137,500 - - 2,137,500 38.50 822,938 - 352,688
2018 Tranche 3 G 4/12/2017 30/11/2020 2,137,500 - - 2,137,500 34.00 726,750 - 218,025
2018 Golding Tranche 1 Y1
H 4/12/2017 30/08/2018 625,000 - (625,000) - 17.60 110,088 1,318,750 15,727
2018 Golding Tranche 1 Y2
I 4/12/2017 30/08/2019 625,000 - - 625,000 37.90 237,065 - 109,413
Total 8,638,110 - (3,738,110) 4,900,000 2,764,167 7,015,741 900,291
A Walsh
2017 Tranche 2 D 1/07/2016 30/11/2018 543,293 - (543,293) - 16.60 90,187 994,226 15,644
2018 Tranche 1 E 4/12/2017 30/11/2018 700,000 - (700,000) - 33.00 231,000 1,281,000 57,750
2018 Tranche 2 F 4/12/2017 30/11/2019 700,000 - - 700,000 38.50 269,500 - 115,500
2018 Tranche 3 G 4/12/2017 30/11/2020 700,000 - - 700,000 34.00 238,000 - 71,400
2018 Golding Tranche 1 Y1
H 4/12/2017 30/08/2018 281,250 - (281,250) - 17.60 49,500 593,438 7,071
2018 Golding Tranche 1 Y2
I 4/12/2017 30/08/2019 281,250 - - 281,250 37.90 106,594 - 49,198
Total 3,205,793 - (1,524,543) 1,681,250 984,781 2,868,664 316,563
E Buratto
2018 Scheme J 4/12/2017 30/11/2019 288,000 - - 288,000 41.20 118,656 - 59,328
Total 288,000 - - 288,000 118,656 - 59,328
G Caton
2018 Scheme J 4/12/2017 30/11/2019 357,798 - - 357,798 41.20 147,413 - 68,037
Total 357,798 - - 357,798 147,413 - 68,037
I Gibbs
2019 Scheme 1 Tranche 1
K 15/2/2019 30/11/2020 - 77,885 - 77,885 79.70 62,074 - 13,662
2019 Scheme 1 Tranche 2
L 15/2/2019 30/11/2021 - 77,885 - 77,885 123.90 96,500 - 13,400
Total - 155,770 - 155,770 158,574 - 27,062
Non KMP
2018 Scheme J 4/12/2017 30/11/2019 801,180 - - 801,180 41.20 330,086 - 108,609
2019 Scheme 2 Tranche 1
M 18/04/2019 30/11/2020 - 15,000 - 15,000 75.30 11,295 - 1,514
2019 Scheme 2 Tranche 2
N 18/04/2019 30/11/2021 - 15,000 - 15,000 101.10 15,165 - 1,232
TOTAL 13,290,881 185,770 (5,262,653) 8,213,998 4,530,137 9,884,405 1,482,636
For
per
sona
l use
onl
y
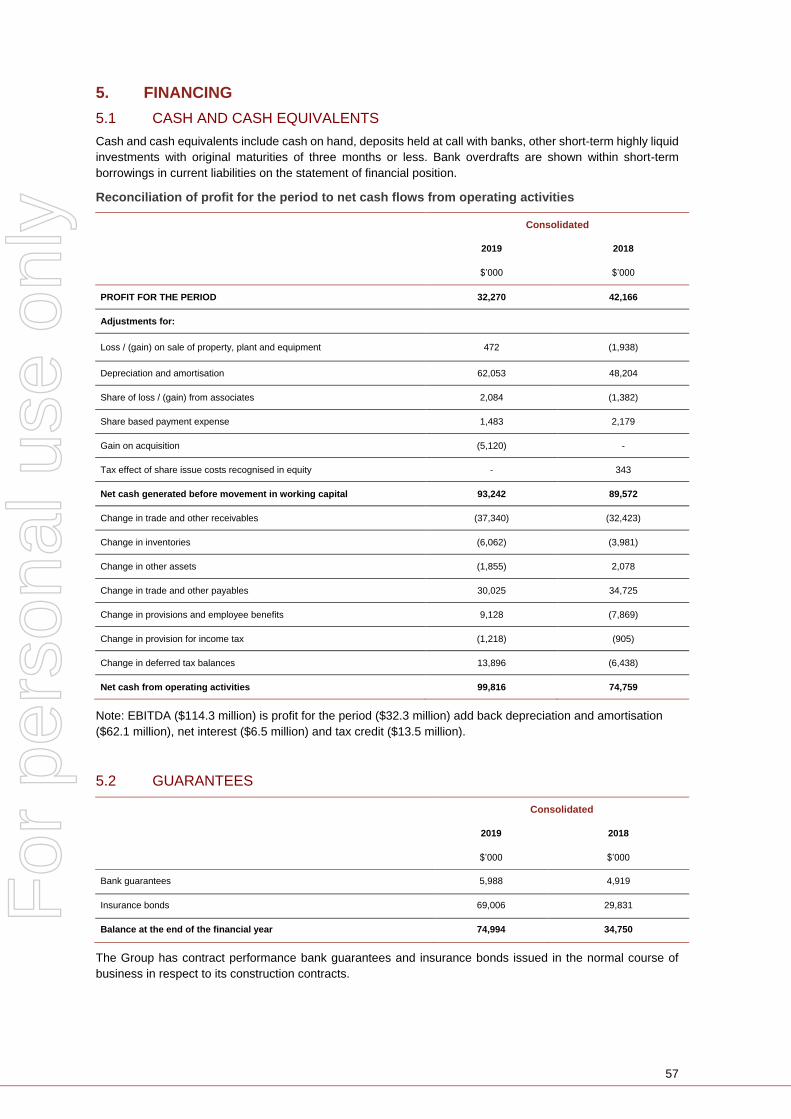
57
5. FINANCING
5.1 CASH AND CASH EQUIVALENTS
Cash and cash equivalents include cash on hand, deposits held at call with banks, other short-term highly liquid
investments with original maturities of three months or less. Bank overdrafts are shown within short-term
borrowings in current liabilities on the statement of financial position.
Reconciliation of profit for the period to net cash flows from operating activities
Consolidated
2019 2018
$’000 $’000
PROFIT FOR THE PERIOD 32,270 42,166
Adjustments for:
Loss / (gain) on sale of property, plant and equipment 472 (1,938)
Depreciation and amortisation 62,053 48,204
Share of loss / (gain) from associates 2,084 (1,382)
Share based payment expense 1,483 2,179
Gain on acquisition (5,120) -
Tax effect of share issue costs recognised in equity - 343
Net cash generated before movement in working capital 93,242 89,572
Change in trade and other receivables (37,340) (32,423)
Change in inventories (6,062) (3,981)
Change in other assets (1,855) 2,078
Change in trade and other payables 30,025 34,725
Change in provisions and employee benefits 9,128 (7,869)
Change in provision for income tax (1,218) (905)
Change in deferred tax balances 13,896 (6,438)
Net cash from operating activities 99,816 74,759
Note: EBITDA ($114.3 million) is profit for the period ($32.3 million) add back depreciation and amortisation
($62.1 million), net interest ($6.5 million) and tax credit ($13.5 million).
5.2 GUARANTEES
Consolidated
2019 2018
$’000 $’000
Bank guarantees 5,988 4,919
Insurance bonds 69,006 29,831
Balance at the end of the financial year 74,994 34,750
The Group has contract performance bank guarantees and insurance bonds issued in the normal course of
business in respect to its construction contracts.
For
per
sona
l use
onl
y
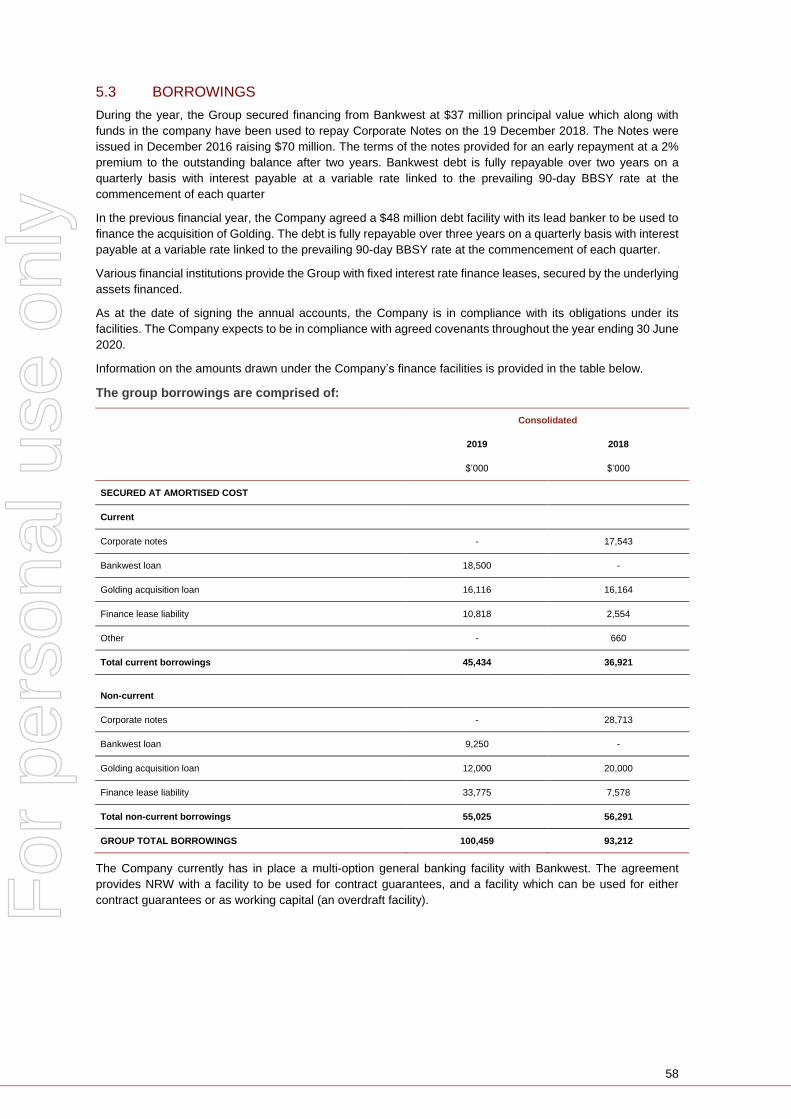
58
5.3 BORROWINGS
During the year, the Group secured financing from Bankwest at $37 million principal value which along with
funds in the company have been used to repay Corporate Notes on the 19 December 2018. The Notes were
issued in December 2016 raising $70 million. The terms of the notes provided for an early repayment at a 2%
premium to the outstanding balance after two years. Bankwest debt is fully repayable over two years on a
quarterly basis with interest payable at a variable rate linked to the prevailing 90-day BBSY rate at the
commencement of each quarter
In the previous financial year, the Company agreed a $48 million debt facility with its lead banker to be used to
finance the acquisition of Golding. The debt is fully repayable over three years on a quarterly basis with interest
payable at a variable rate linked to the prevailing 90-day BBSY rate at the commencement of each quarter.
Various financial institutions provide the Group with fixed interest rate finance leases, secured by the underlying
assets financed.
As at the date of signing the annual accounts, the Company is in compliance with its obligations under its
facilities. The Company expects to be in compliance with agreed covenants throughout the year ending 30 June
2020.
Information on the amounts drawn under the Company’s finance facilities is provided in the table below.
The group borrowings are comprised of:
Consolidated
2019 2018
$’000 $’000
SECURED AT AMORTISED COST
Current
Corporate notes - 17,543
Bankwest loan 18,500 -
Golding acquisition loan 16,116 16,164
Finance lease liability 10,818 2,554
Other - 660
Total current borrowings 45,434 36,921
Non-current
Corporate notes - 28,713
Bankwest loan 9,250 -
Golding acquisition loan 12,000 20,000
Finance lease liability 33,775 7,578
Total non-current borrowings 55,025 56,291
GROUP TOTAL BORROWINGS 100,459 93,212
The Company currently has in place a multi-option general banking facility with Bankwest. The agreement
provides NRW with a facility to be used for contract guarantees, and a facility which can be used for either
contract guarantees or as working capital (an overdraft facility).
For
per
sona
l use
onl
y

59
5.3 BORROWINGS (CONTINUED)
Borrowings Movement Reconciliation
Finance Description
Opening Balance 1 Jul 18
Proceeds from borrowings
Repayments of borrowings
Interest Accrued Closing balance
30 Jun 19
$’000 $’000 $’000 $’000 $’000
Corporate notes 46,256 - (46,256) - -
Bankwest loan - 37,000 (9,146) (104) 27,750
Golding acquisition
loan
36,164 8,000 (16,000) (48) 28,116
Asset financing 10,132 39,102 (4,793) 152 44,593
Other 660 4,500 (5,160) - -
Total 93,212 88,602 81,355 - 100,459
Finance Facilities
Consolidated finance facilities as at 30 June 2019
Finance Description Face Value (limit) Carrying Amount (utilised) Unutilised Amount
$’000 $’000 $’000
Bankwest loan 27,750 27,750 -
Golding acquisition loan 28,116 28,116 -
Asset financing(1) 44,593 44,593 -
Guarantees and insurance bonds(2) 155,000 74,994 80,006
(1) Terms range from one to five years. (2) $10.0 million of the overall limit is interchangeable as an overdraft facility.
Consolidated finance facilities as at 30 June 2018
Finance Description Face Value (limit) Carrying Amount (utilised) Unutilised Amount
$’000 $’000 $’000
Corporate notes 46,256 46,256 -
Golding acquisition loan 36,164 36,164 -
Asset financing(1) 10,132 10,132 -
Other 660 660 -
Guarantees and insurance bonds(2) 155,000 34,750 120,250
(1) Terms range from one to three years. (2) $10.0 million of the overall limit is interchangeable as an overdraft facility.
For
per
sona
l use
onl
y
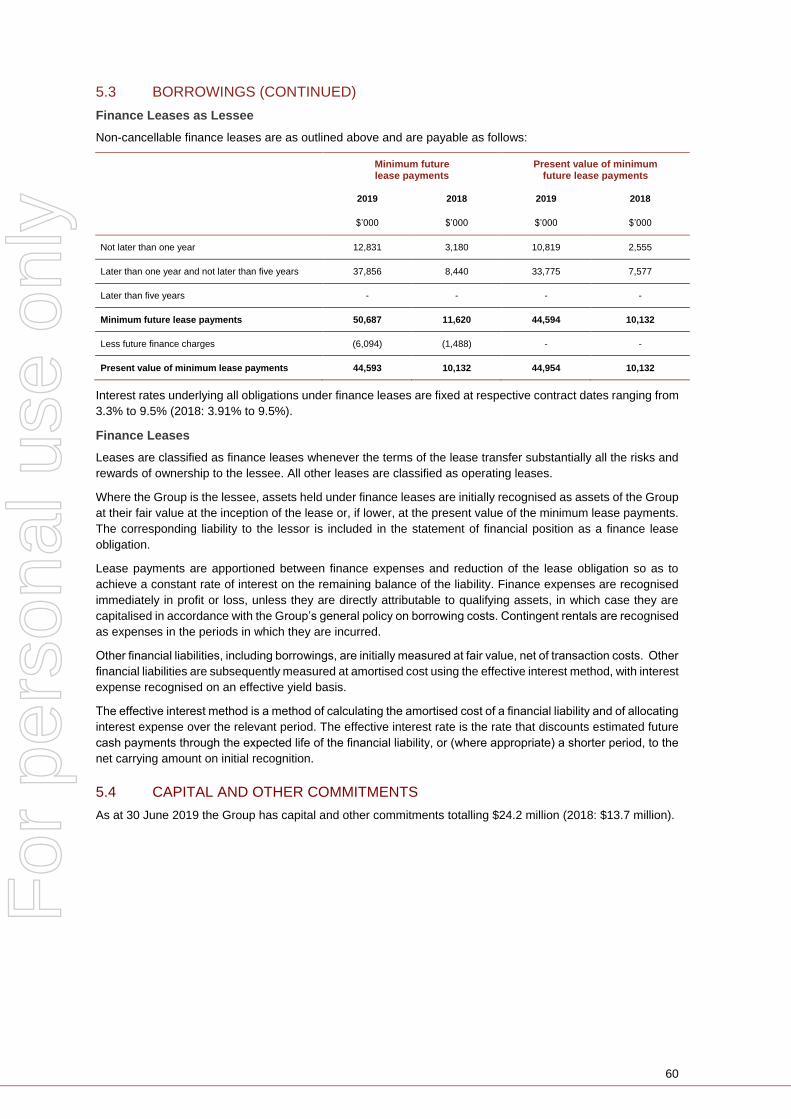
60
5.3 BORROWINGS (CONTINUED)
Finance Leases as Lessee
Non-cancellable finance leases are as outlined above and are payable as follows:
Minimum future lease payments
Present value of minimum future lease payments
2019 2018 2019 2018
$’000 $’000 $’000 $’000
Not later than one year 12,831 3,180 10,819 2,555
Later than one year and not later than five years 37,856 8,440 33,775 7,577
Later than five years - - - -
Minimum future lease payments 50,687 11,620 44,594 10,132
Less future finance charges (6,094) (1,488) - -
Present value of minimum lease payments 44,593 10,132 44,954 10,132
Interest rates underlying all obligations under finance leases are fixed at respective contract dates ranging from
3.3% to 9.5% (2018: 3.91% to 9.5%).
Finance Leases
Leases are classified as finance leases whenever the terms of the lease transfer substantially all the risks and
rewards of ownership to the lessee. All other leases are classified as operating leases.
Where the Group is the lessee, assets held under finance leases are initially recognised as assets of the Group
at their fair value at the inception of the lease or, if lower, at the present value of the minimum lease payments.
The corresponding liability to the lessor is included in the statement of financial position as a finance lease
obligation.
Lease payments are apportioned between finance expenses and reduction of the lease obligation so as to
achieve a constant rate of interest on the remaining balance of the liability. Finance expenses are recognised
immediately in profit or loss, unless they are directly attributable to qualifying assets, in which case they are
capitalised in accordance with the Group’s general policy on borrowing costs. Contingent rentals are recognised
as expenses in the periods in which they are incurred.
Other financial liabilities, including borrowings, are initially measured at fair value, net of transaction costs. Other
financial liabilities are subsequently measured at amortised cost using the effective interest method, with interest
expense recognised on an effective yield basis.
The effective interest method is a method of calculating the amortised cost of a financial liability and of allocating
interest expense over the relevant period. The effective interest rate is the rate that discounts estimated future
cash payments through the expected life of the financial liability, or (where appropriate) a shorter period, to the
net carrying amount on initial recognition.
5.4 CAPITAL AND OTHER COMMITMENTS
As at 30 June 2019 the Group has capital and other commitments totalling $24.2 million (2018: $13.7 million).
For
per
sona
l use
onl
y

61
5.5 OPERATING LEASES
Non-cancellable operating and property lease rentals are payable as follows:
Consolidated
2019 2018
$’000 $’000
Less than one year 21,578 15,386
Between one and five years 44,656 36,813
More than five years 16,441 4,266
Total operating and property leases 82,675 56,465
The majority of property leases relate to commercial property. The majority of these property leases contain
market or CPI review clauses during the term of the leases.
The Group does not have the option to purchase the leased assets at the end of the lease period.
Operating Leases
Operating lease payments are recognised as an expense on a straight-line basis over the lease term, except
where another systematic basis is more representative of the time pattern in which economic benefits from the
leased asset are consumed. Contingent rentals arising under operating leases are recognised as an expense
in the period in which they are incurred.
In the event that lease incentives are received to enter into operating leases, such incentives are recognised as
a liability. The aggregate benefit of incentives is recognised as a reduction of rental expense on a straight-line
basis, except where another systematic basis is more representative of the time pattern in which economic
benefits from the leased asset are consumed. Refer to note 7.8 for application of AASB 16.
For
per
sona
l use
onl
y
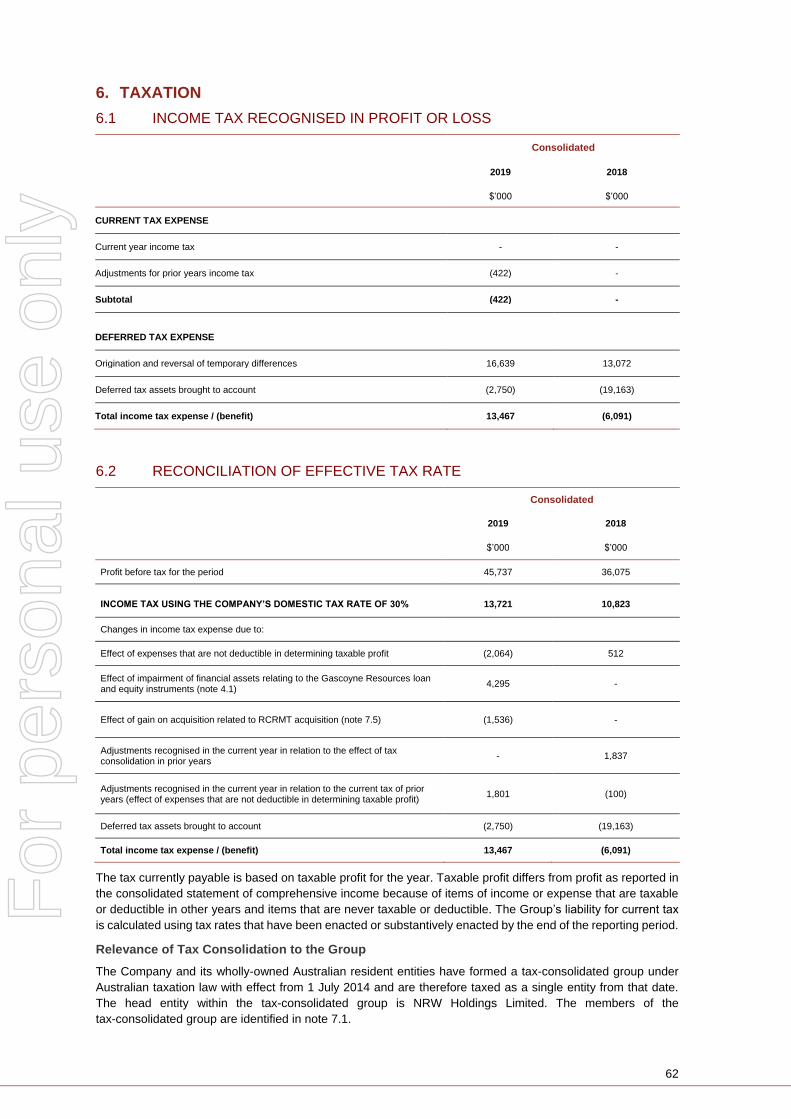
62
6. TAXATION
6.1 INCOME TAX RECOGNISED IN PROFIT OR LOSS
Consolidated
2019 2018
$’000 $’000
CURRENT TAX EXPENSE
Current year income tax - -
Adjustments for prior years income tax (422) -
Subtotal (422) -
DEFERRED TAX EXPENSE
Origination and reversal of temporary differences 16,639 13,072
Deferred tax assets brought to account (2,750) (19,163)
Total income tax expense / (benefit) 13,467 (6,091)
6.2 RECONCILIATION OF EFFECTIVE TAX RATE
Consolidated
2019 2018
$’000 $’000
Profit before tax for the period 45,737 36,075
INCOME TAX USING THE COMPANY’S DOMESTIC TAX RATE OF 30% 13,721 10,823
Changes in income tax expense due to:
Effect of expenses that are not deductible in determining taxable profit (2,064) 512
Effect of impairment of financial assets relating to the Gascoyne Resources loan and equity instruments (note 4.1)
4,295 -
Effect of gain on acquisition related to RCRMT acquisition (note 7.5) (1,536) -
Adjustments recognised in the current year in relation to the effect of tax consolidation in prior years
- 1,837
Adjustments recognised in the current year in relation to the current tax of prior years (effect of expenses that are not deductible in determining taxable profit)
1,801 (100)
Deferred tax assets brought to account (2,750) (19,163)
Total income tax expense / (benefit) 13,467 (6,091)
The tax currently payable is based on taxable profit for the year. Taxable profit differs from profit as reported in
the consolidated statement of comprehensive income because of items of income or expense that are taxable
or deductible in other years and items that are never taxable or deductible. The Group’s liability for current tax
is calculated using tax rates that have been enacted or substantively enacted by the end of the reporting period.
Relevance of Tax Consolidation to the Group
The Company and its wholly-owned Australian resident entities have formed a tax-consolidated group under
Australian taxation law with effect from 1 July 2014 and are therefore taxed as a single entity from that date.
The head entity within the tax-consolidated group is NRW Holdings Limited. The members of the
tax-consolidated group are identified in note 7.1.
For
per
sona
l use
onl
y
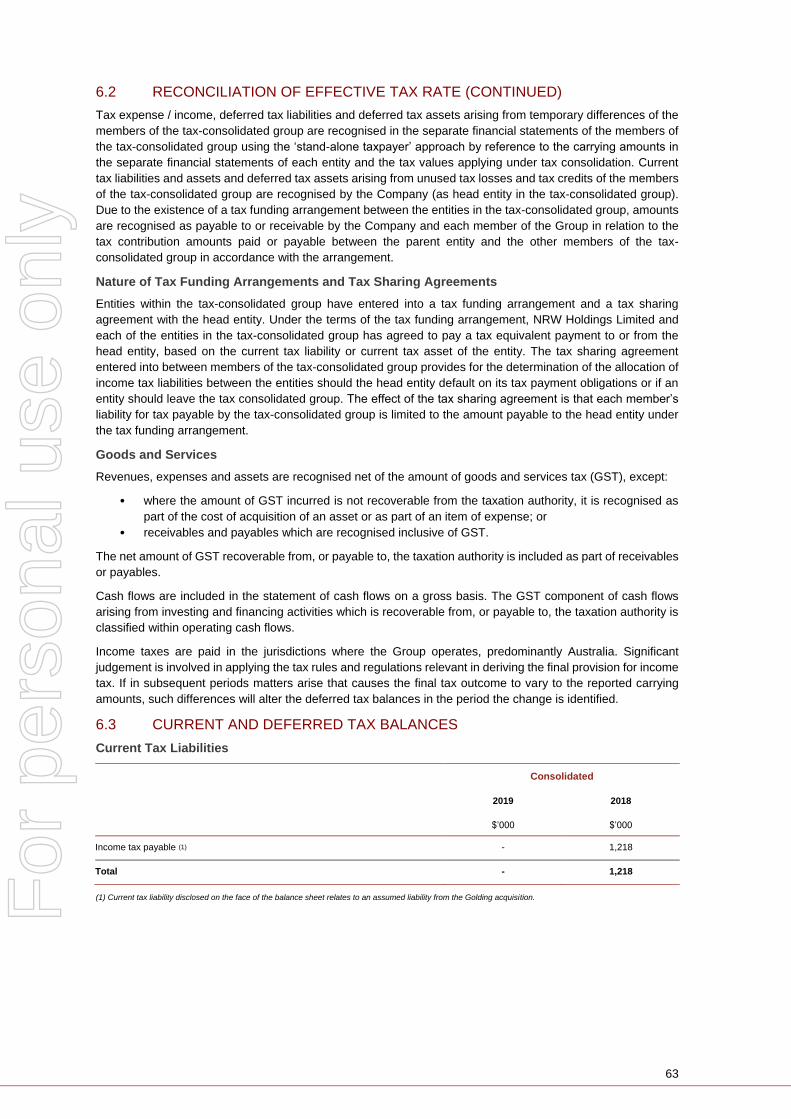
63
6.2 RECONCILIATION OF EFFECTIVE TAX RATE (CONTINUED)
Tax expense / income, deferred tax liabilities and deferred tax assets arising from temporary differences of the
members of the tax-consolidated group are recognised in the separate financial statements of the members of
the tax-consolidated group using the ‘stand-alone taxpayer’ approach by reference to the carrying amounts in
the separate financial statements of each entity and the tax values applying under tax consolidation. Current
tax liabilities and assets and deferred tax assets arising from unused tax losses and tax credits of the members
of the tax-consolidated group are recognised by the Company (as head entity in the tax-consolidated group).
Due to the existence of a tax funding arrangement between the entities in the tax-consolidated group, amounts
are recognised as payable to or receivable by the Company and each member of the Group in relation to the
tax contribution amounts paid or payable between the parent entity and the other members of the tax-
consolidated group in accordance with the arrangement.
Nature of Tax Funding Arrangements and Tax Sharing Agreements
Entities within the tax-consolidated group have entered into a tax funding arrangement and a tax sharing
agreement with the head entity. Under the terms of the tax funding arrangement, NRW Holdings Limited and
each of the entities in the tax-consolidated group has agreed to pay a tax equivalent payment to or from the
head entity, based on the current tax liability or current tax asset of the entity. The tax sharing agreement
entered into between members of the tax-consolidated group provides for the determination of the allocation of
income tax liabilities between the entities should the head entity default on its tax payment obligations or if an
entity should leave the tax consolidated group. The effect of the tax sharing agreement is that each member’s
liability for tax payable by the tax-consolidated group is limited to the amount payable to the head entity under
the tax funding arrangement.
Goods and Services
Revenues, expenses and assets are recognised net of the amount of goods and services tax (GST), except:
• where the amount of GST incurred is not recoverable from the taxation authority, it is recognised as
part of the cost of acquisition of an asset or as part of an item of expense; or
• receivables and payables which are recognised inclusive of GST.
The net amount of GST recoverable from, or payable to, the taxation authority is included as part of receivables
or payables.
Cash flows are included in the statement of cash flows on a gross basis. The GST component of cash flows
arising from investing and financing activities which is recoverable from, or payable to, the taxation authority is
classified within operating cash flows.
Income taxes are paid in the jurisdictions where the Group operates, predominantly Australia. Significant
judgement is involved in applying the tax rules and regulations relevant in deriving the final provision for income
tax. If in subsequent periods matters arise that causes the final tax outcome to vary to the reported carrying
amounts, such differences will alter the deferred tax balances in the period the change is identified.
6.3 CURRENT AND DEFERRED TAX BALANCES
Current Tax Liabilities
Consolidated
2019 2018
$’000 $’000
Income tax payable (1) - 1,218
Total - 1,218
(1) Current tax liability disclosed on the face of the balance sheet relates to an assumed liability from the Golding acquisition.
For
per
sona
l use
onl
y
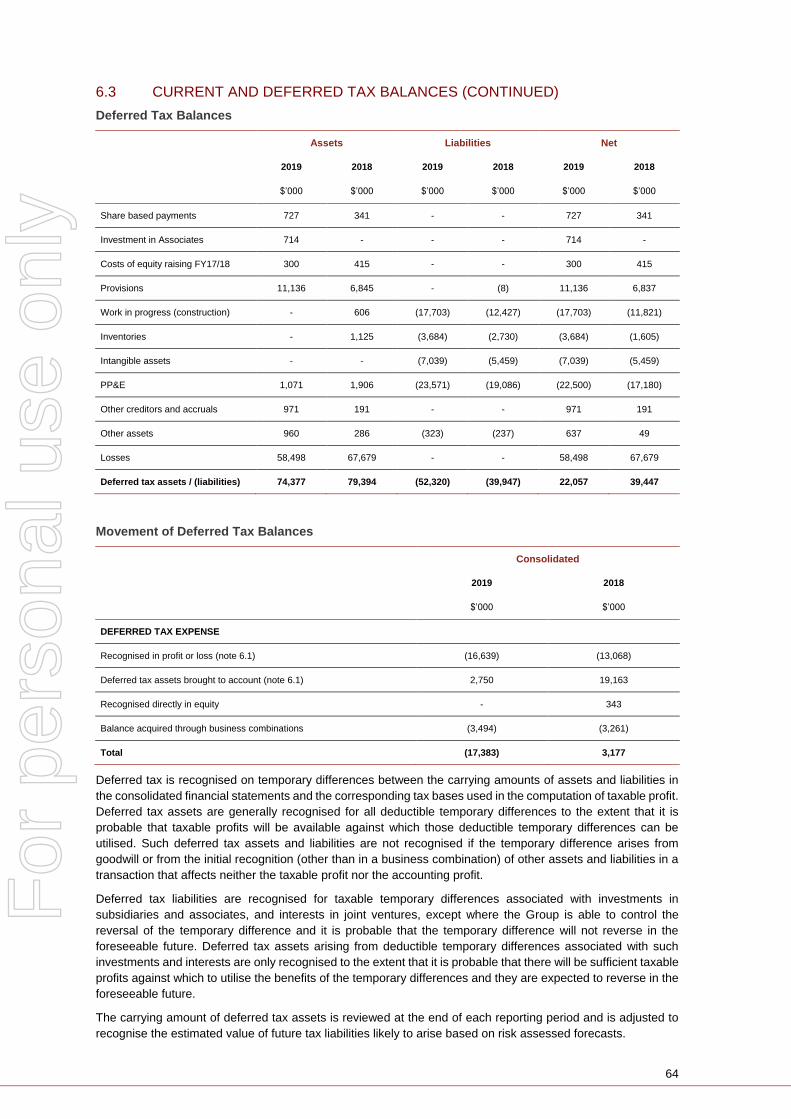
64
6.3 CURRENT AND DEFERRED TAX BALANCES (CONTINUED)
Deferred Tax Balances
Assets Liabilities Net
2019 2018 2019 2018 2019 2018
$’000 $’000 $’000 $’000 $’000 $’000
Share based payments 727 341 - - 727 341
Investment in Associates 714 - - - 714 -
Costs of equity raising FY17/18 300 415 - - 300 415
Provisions 11,136 6,845 - (8) 11,136 6,837
Work in progress (construction) - 606 (17,703) (12,427) (17,703) (11,821)
Inventories - 1,125 (3,684) (2,730) (3,684) (1,605)
Intangible assets - - (7,039) (5,459) (7,039) (5,459)
PP&E 1,071 1,906 (23,571) (19,086) (22,500) (17,180)
Other creditors and accruals 971 191 - - 971 191
Other assets 960 286 (323) (237) 637 49
Losses 58,498 67,679 - - 58,498 67,679
Deferred tax assets / (liabilities) 74,377 79,394 (52,320) (39,947) 22,057 39,447
Movement of Deferred Tax Balances
Consolidated
2019 2018
$’000 $’000
DEFERRED TAX EXPENSE
Recognised in profit or loss (note 6.1) (16,639) (13,068)
Deferred tax assets brought to account (note 6.1) 2,750 19,163
Recognised directly in equity - 343
Balance acquired through business combinations (3,494) (3,261)
Total (17,383) 3,177
Deferred tax is recognised on temporary differences between the carrying amounts of assets and liabilities in
the consolidated financial statements and the corresponding tax bases used in the computation of taxable profit.
Deferred tax assets are generally recognised for all deductible temporary differences to the extent that it is
probable that taxable profits will be available against which those deductible temporary differences can be
utilised. Such deferred tax assets and liabilities are not recognised if the temporary difference arises from
goodwill or from the initial recognition (other than in a business combination) of other assets and liabilities in a
transaction that affects neither the taxable profit nor the accounting profit.
Deferred tax liabilities are recognised for taxable temporary differences associated with investments in
subsidiaries and associates, and interests in joint ventures, except where the Group is able to control the
reversal of the temporary difference and it is probable that the temporary difference will not reverse in the
foreseeable future. Deferred tax assets arising from deductible temporary differences associated with such
investments and interests are only recognised to the extent that it is probable that there will be sufficient taxable
profits against which to utilise the benefits of the temporary differences and they are expected to reverse in the
foreseeable future.
The carrying amount of deferred tax assets is reviewed at the end of each reporting period and is adjusted to
recognise the estimated value of future tax liabilities likely to arise based on risk assessed forecasts.
For
per
sona
l use
onl
y

65
6.3 CURRENT AND DEFERRED TAX BALANCES (CONTINUED)
Deferred tax assets and liabilities are measured at the tax rates that are expected to apply in the period in which
the liability is settled or the asset realised, based on tax rates (and tax laws) that have been enacted or
substantively enacted by the end of the reporting period. The measurement of deferred tax liabilities and assets
reflects the tax consequences that would follow from the manner in which the Group expects, at the end of the
reporting period, to recover or settle the carrying amount of its assets and liabilities.
Deferred tax assets and liabilities are offset when there is a legally enforceable right to set off current tax assets
against current tax liabilities and when they relate to income taxes levied by the same taxation authority and the
Group intends to settle its current tax assets and liabilities on a net basis.
Unrecognised Deferred Tax Balances
Deductible temporary differences, unused tax losses and unused tax credits for which no deferred tax assets
have been recognised are attributable to the following:
Consolidated
2019 2018
$’000 $’000
Tax losses (revenue in nature) - 2,750
For
per
sona
l use
onl
y
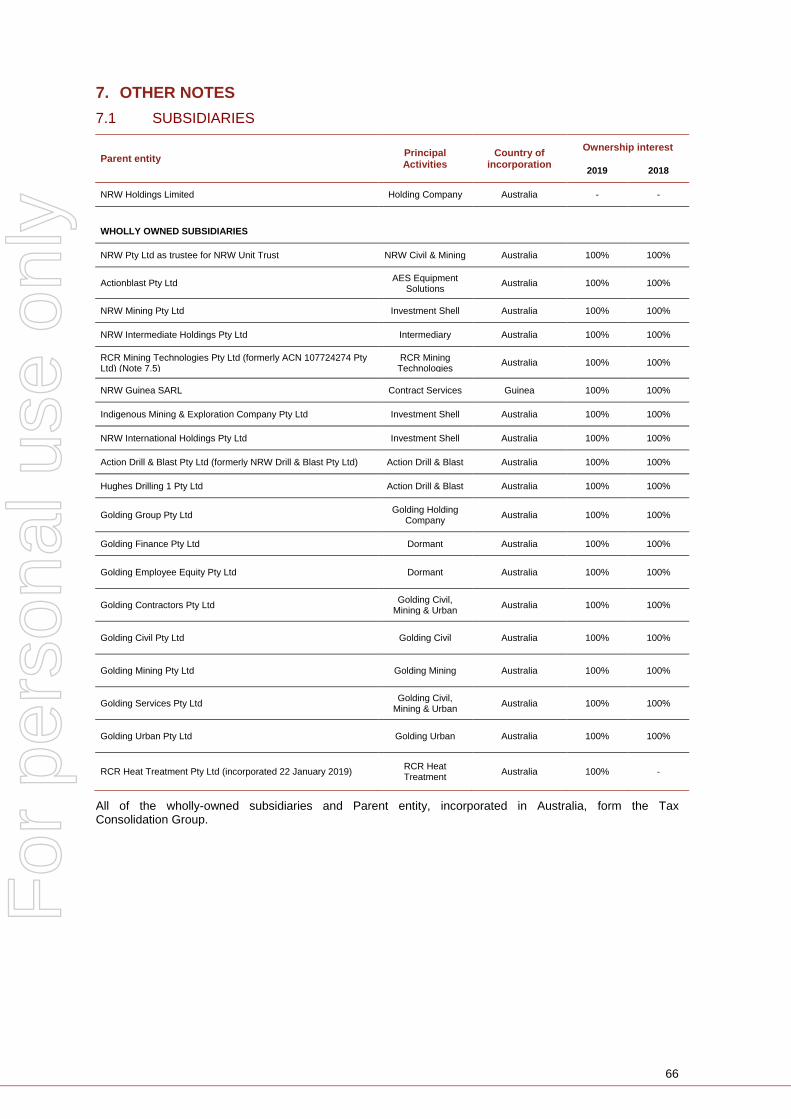
66
7. OTHER NOTES
7.1 SUBSIDIARIES
Parent entity Principal Activities
Country of incorporation
Ownership interest
2019 2018
NRW Holdings Limited Holding Company Australia - -
WHOLLY OWNED SUBSIDIARIES
NRW Pty Ltd as trustee for NRW Unit Trust NRW Civil & Mining Australia 100% 100%
Actionblast Pty Ltd AES Equipment
Solutions Australia 100% 100%
NRW Mining Pty Ltd Investment Shell Australia 100% 100%
NRW Intermediate Holdings Pty Ltd Intermediary Australia 100% 100%
RCR Mining Technologies Pty Ltd (formerly ACN 107724274 Pty Ltd) (Note 7.5)
RCR Mining Technologies
Australia 100% 100%
NRW Guinea SARL Contract Services Guinea 100% 100%
Indigenous Mining & Exploration Company Pty Ltd Investment Shell Australia 100% 100%
NRW International Holdings Pty Ltd Investment Shell Australia 100% 100%
Action Drill & Blast Pty Ltd (formerly NRW Drill & Blast Pty Ltd) Action Drill & Blast Australia 100% 100%
Hughes Drilling 1 Pty Ltd Action Drill & Blast Australia 100% 100%
Golding Group Pty Ltd Golding Holding
Company Australia 100% 100%
Golding Finance Pty Ltd Dormant Australia 100% 100%
Golding Employee Equity Pty Ltd Dormant Australia 100% 100%
Golding Contractors Pty Ltd Golding Civil,
Mining & Urban Australia 100% 100%
Golding Civil Pty Ltd Golding Civil Australia 100% 100%
Golding Mining Pty Ltd Golding Mining Australia 100% 100%
Golding Services Pty Ltd Golding Civil,
Mining & Urban Australia 100% 100%
Golding Urban Pty Ltd Golding Urban Australia 100% 100%
RCR Heat Treatment Pty Ltd (incorporated 22 January 2019) RCR Heat Treatment
Australia 100% -
All of the wholly-owned subsidiaries and Parent entity, incorporated in Australia, form the Tax Consolidation Group.
For
per
sona
l use
onl
y
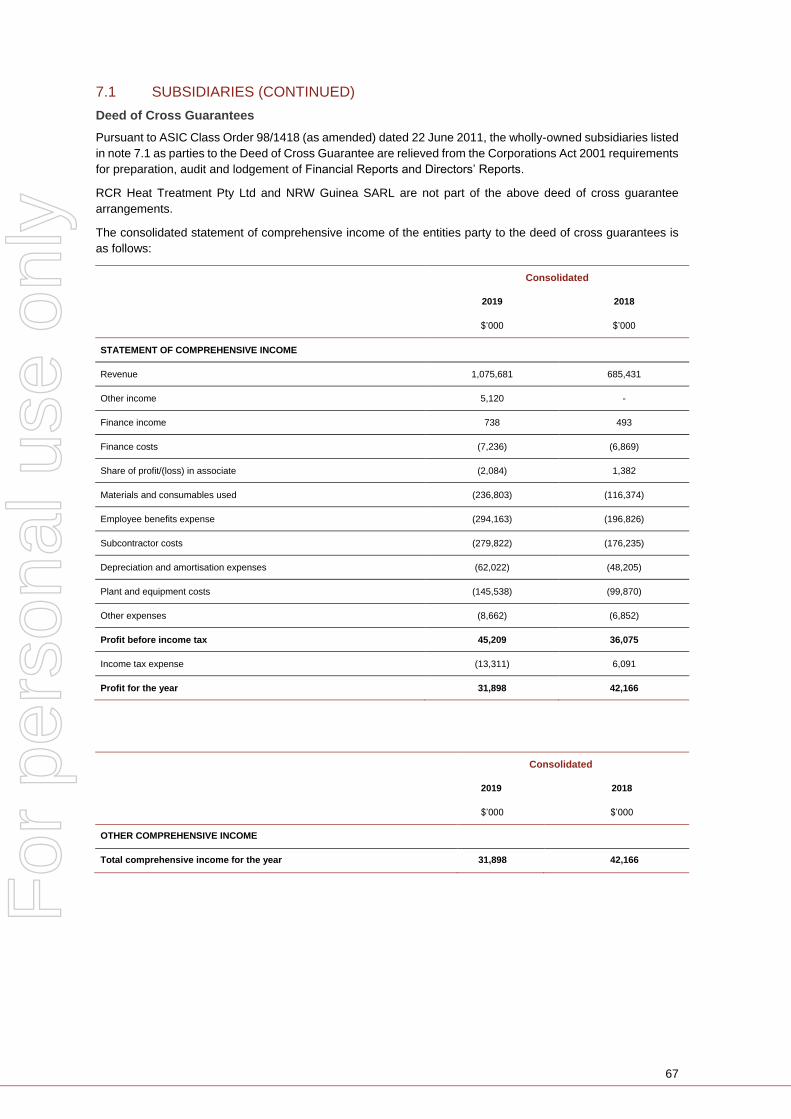
67
7.1 SUBSIDIARIES (CONTINUED)
Deed of Cross Guarantees
Pursuant to ASIC Class Order 98/1418 (as amended) dated 22 June 2011, the wholly-owned subsidiaries listed
in note 7.1 as parties to the Deed of Cross Guarantee are relieved from the Corporations Act 2001 requirements
for preparation, audit and lodgement of Financial Reports and Directors’ Reports.
RCR Heat Treatment Pty Ltd and NRW Guinea SARL are not part of the above deed of cross guarantee
arrangements.
The consolidated statement of comprehensive income of the entities party to the deed of cross guarantees is
as follows:
Consolidated
2019 2018
$’000 $’000
STATEMENT OF COMPREHENSIVE INCOME
Revenue 1,075,681 685,431
Other income 5,120 -
Finance income 738 493
Finance costs (7,236) (6,869)
Share of profit/(loss) in associate (2,084) 1,382
Materials and consumables used (236,803) (116,374)
Employee benefits expense (294,163) (196,826)
Subcontractor costs (279,822) (176,235)
Depreciation and amortisation expenses (62,022) (48,205)
Plant and equipment costs (145,538) (99,870)
Other expenses (8,662) (6,852)
Profit before income tax 45,209 36,075
Income tax expense (13,311) 6,091
Profit for the year 31,898 42,166
Consolidated
2019 2018
$’000 $’000
OTHER COMPREHENSIVE INCOME
Total comprehensive income for the year 31,898 42,166
For
per
sona
l use
onl
y
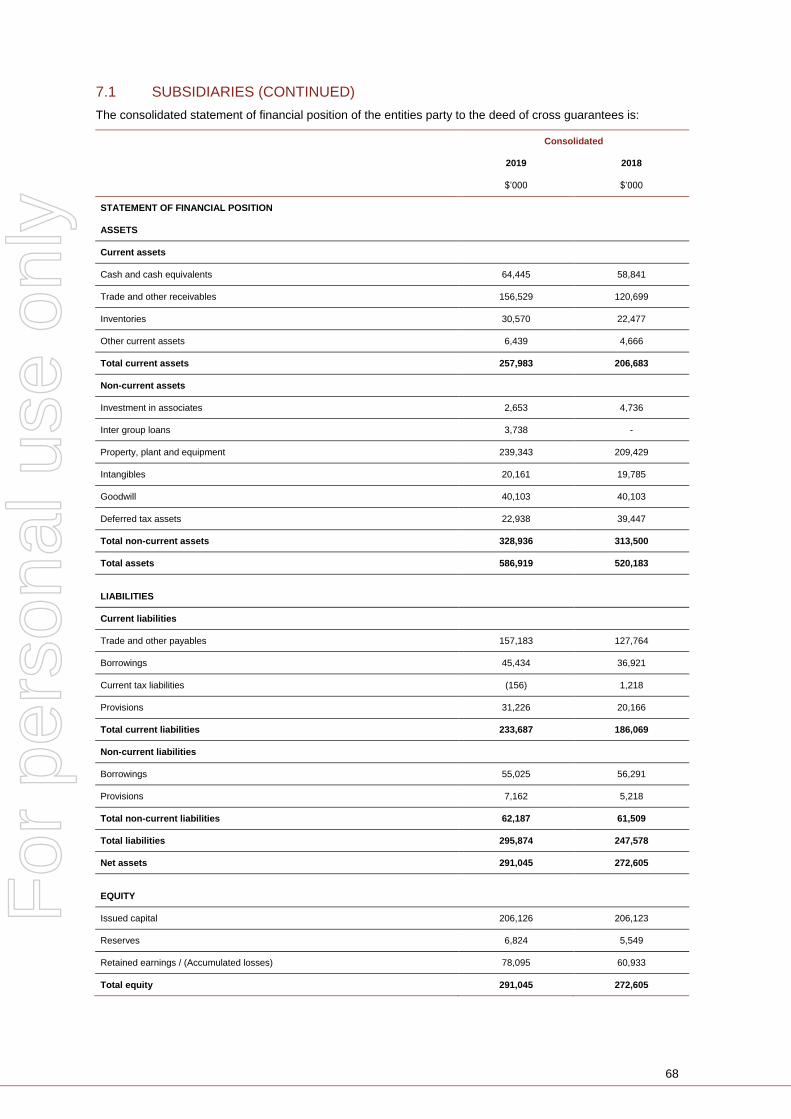
68
7.1 SUBSIDIARIES (CONTINUED)
The consolidated statement of financial position of the entities party to the deed of cross guarantees is:
Consolidated
2019 2018
$’000 $’000
STATEMENT OF FINANCIAL POSITION
ASSETS
Current assets
Cash and cash equivalents 64,445 58,841
Trade and other receivables 156,529 120,699
Inventories 30,570 22,477
Other current assets 6,439 4,666
Total current assets 257,983 206,683
Non-current assets
Investment in associates 2,653 4,736
Inter group loans 3,738 -
Property, plant and equipment 239,343 209,429
Intangibles 20,161 19,785
Goodwill 40,103 40,103
Deferred tax assets 22,938 39,447
Total non-current assets 328,936 313,500
Total assets 586,919 520,183
LIABILITIES
Current liabilities
Trade and other payables 157,183 127,764
Borrowings 45,434 36,921
Current tax liabilities (156) 1,218
Provisions 31,226 20,166
Total current liabilities 233,687 186,069
Non-current liabilities
Borrowings 55,025 56,291
Provisions 7,162 5,218
Total non-current liabilities 62,187 61,509
Total liabilities 295,874 247,578
Net assets 291,045 272,605
EQUITY
Issued capital 206,126 206,123
Reserves 6,824 5,549
Retained earnings / (Accumulated losses) 78,095 60,933
Total equity 291,045 272,605
For
per
sona
l use
onl
y

69
7.1 SUBSIDIARIES (CONTINUED)
Changes in the Group’s Ownership Interests in Existing Subsidiaries
Changes in the Group’s ownership interests in subsidiaries that do not result in the Group losing control over
the subsidiaries are accounted for as equity transactions. The carrying amounts of the Group’s interests and
the non-controlling interests are adjusted to reflect the changes in their relative interests in the subsidiaries.
When the Group loses control of a subsidiary, a gain or loss is recognised in profit or loss and is calculated as
the difference between (i) the aggregate of the fair value of the consideration received and the fair value of any
retained interest and (ii) the previous carrying amount of the assets (including goodwill), and liabilities of the
subsidiary and any non-controlling interests. All amounts previously recognised in other comprehensive income
in relation to that subsidiary are accounted for as if the Group had directly disposed of the related assets or
liabilities of the subsidiary (i.e. reclassified to profit or loss or transferred to another category of equity as
specified/permitted by applicable AASBs). The fair value of any investment retained in the former subsidiary at
the date when control is lost is regarded as the fair value on initial recognition for subsequent accounting under
AASB 139, when applicable, the cost on initial recognition of an investment in an associate or a joint venture.
7.2 UNINCORPORATED JOINT OPERATIONS
The Group has significant interests in the following jointly controlled operations:
Name of Operation Principal Activity Group Interest
2019 2018
NRW-NYFL Joint Venture Bulk Earthworks construction - Nammuldi Waste Fines Tails Dam wall - completed
85% 85%
NRW-Eastern Guruma Joint Venture Construction of the HME Overpass and the Silvergrass Access Roads - completed
50% 50%
City East Alliance Upgrade of Great Eastern Highway – completed 15% 15%
NRW Njamal ICRG Joint Venture Bulk Earthworks and services for the Iron Bridge (North Star Magnetite Project) - completed
50% 50%
NRW Eastern Guruma Wirlu-Murra Enterprises Joint Venture
Construction of a tailings dam - completed 50% 50%
The following amounts are included in the Group’s consolidated financial statements as a result of the
proportionate consolidation of the above interests in joint operations.
Financial Information
Consolidated
2019 2018
$’000 $’000
STATEMENT OF FINANCIAL PERFORMANCE
Income 55 15,988
Expenses 538 (16,586)
STATEMENT OF FINANCIAL POSITION
Current assets 94 1,451
Current liabilities 33 1,461
For
per
sona
l use
onl
y
70
7.2 UNINCORPORATED JOINT OPERATIONS (CONTINUED)
A joint operation is a joint arrangement whereby the parties that have joint control of the arrangement have
rights to the assets, and obligations for the liabilities, relating to the arrangement. Joint control is the
contractually agreed sharing of control of an arrangement, which exists only when decisions about the relevant
activities require unanimous consent of the parties sharing control.
When a group entity undertakes its activities under joint operations, the Group as a joint operator recognises in
relation to its interest in a joint operation:
• Its assets, including its share of any assets held jointly;
• Its liabilities, including its share of any liabilities incurred jointly;
• Its revenue from the sale of its share of the output arising from the joint operation;
• Its share of the revenue from the sale of the output by the joint operation; and
• Its expenses, including its share of any expenses incurred jointly.
The Group accounts for the assets, liabilities, revenues and expenses relating to its interest in a joint operation
in accordance with the AASBs applicable to the particular assets, liabilities, revenues and expenses.
When a group entity transacts with a joint operation in which a group entity is a joint operator (such as a sale or
contribution of assets), the Group is considered to be conducting the transaction with the other parties to the
joint operation, and gains and losses resulting from the transactions are recognised in the Group’s consolidated
financial statements only to the extent of other parties’ interests in the joint operation.
When a group entity transacts with a joint operation in which a group entity is a joint operator (such as a
purchase of assets), the Group does not recognise its share of the gains and losses until it resells those assets
to a third party.
7.3 RELATED PARTIES
The ultimate parent entity within the Group is NRW Holdings Limited. The interests in subsidiaries are set out
in note 7.1.
Trading Summary
There are no sales of goods or services to, or purchases from, related parties at reporting date.
Related Party Outstanding Balances
There are no amounts receivable from or payable to related parties at reporting date or at the end of the prior
reporting period
For
per
sona
l use
onl
y
71
7.4 PARENT ENTITY INFORMATION
As at, and throughout, the financial year ended 30 June 2019 the parent company of the Group was NRW
Holdings Limited.
The accounting policies of the parent entity, which have been applied in determining the financial information
shown below, are the same as those applied in the consolidated financial statements.
Financial Position
Parent
2019 2018
$’000 $’000
ASSETS
Current assets 169,609 182,487
Non-current assets 81,481 94,420
Total assets 251,090 276,907
LIABILITIES
Current liabilities 17,731 18,127
Non-current liabilities 9,250 28,713
Total liabilities 26,981 46,840
EQUITY
Contributed equity 206,149 206,149
Retained earnings 11,205 18,646
RESERVES
Share based payment reserve 6,755 5,272
Total equity 224,109 230,067
Financial Performance
Parent
2019 2018
$’000 $’000
Profit for the year 7,508 50,098
Total comprehensive income 7,508 50,098
Guarantees Entered into by the Parent in Relation to the Debts of its Subsidiaries
Parent
2019 2018
$’000 $’000
Asset finance 54,726 10,132
Total 54,726 10,132
NRW Holdings Limited has entered into a Deed of Cross Guarantee as disclosed in note 7.1.
For
per
sona
l use
onl
y
72
7.5 BUSINESS COMBINATIONS
Acquisitions of businesses are accounted for using the acquisition method. The consideration transferred in a
business combination is measured at fair value, which is calculated as the sum of the acquisition-date fair values
of the assets transferred by the Company, liabilities incurred by the Company to the former owners of the
acquiree and the equity interests issued by the Company in exchange for control of the acquiree. Acquisition-
related costs are recognised in profit or loss as incurred.
At the acquisition date, the identifiable assets acquired and the liabilities assumed are recognised at their fair
value, except that:
• Deferred tax assets or liabilities, and assets or liabilities related to employee benefit arrangements are
recognised and measured in accordance with AASB 112 ‘Income Taxes’ and AASB 119 ‘Employee
Benefits’ respectively;
• Liabilities or equity instruments related to share-based payment arrangements of the acquiree or
share-based payment arrangements of the Company entered into to replace share-based payment
arrangements of the acquiree are measured in accordance with AASB 2 ‘Share Based Payment’ at
the acquisition date; and
• Assets (or disposal groups) that are classified as held for sale in accordance with AASB 5 ‘Noncurrent
Assets Held for Sale and Discontinued Operations’ are measured in accordance with that Standard.
Goodwill is measured as the excess of the sum of the consideration transferred, the amount of any non-
controlling interests in the acquiree, and the fair value of the acquirer's previously held equity interest in the
acquiree (if any) over the net of the acquisition-date amounts of the identifiable assets acquired and the liabilities
assumed. If, after reassessment, the net of the acquisition-date amounts of the identifiable assets acquired and
liabilities assumed exceeds the sum of the consideration transferred, the amount of any non-controlling interests
in the acquiree and the fair value of the acquirer's previously held interest in the acquiree (if any), the excess is
recognised immediately in profit or loss as a gain on acquisition.
When the consideration transferred by the Company in a business combination includes assets or liabilities
resulting from a contingent consideration arrangement, the contingent consideration is measured at its
acquisition-date fair value and included as part of the consideration transferred in a business combination.
Changes in the fair value of the contingent consideration that qualify as measurement period adjustments are
adjusted retrospectively, with corresponding adjustments against goodwill. Measurement period adjustments
are adjustments that arise from additional information obtained during the ‘measurement period’ (which cannot
exceed one year from the acquisition date) about facts and circumstances that existed at the acquisition date.
The subsequent accounting for changes in the fair value of the contingent consideration that do not qualify as
measurement period adjustments depends on how the contingent consideration is classified. Contingent
consideration that is classified as equity is not remeasured at subsequent reporting dates and its subsequent
settlement is accounted for within equity. Contingent consideration that is classified as an asset or a liability is
remeasured at subsequent reporting dates in accordance with AASB 139, or AASB 137 ‘Provisions, Contingent
Liabilities and Contingent Assets’, as appropriate, with the corresponding gain or loss being recognised in profit
or loss.
If the initial accounting for a business combination is incomplete by the end of the reporting period in which the
combination occurs, the Group reports provisional amounts for the items for which the accounting is incomplete.
Those provisional amounts are adjusted during the measurement period (see above), or additional assets or
liabilities are recognised, to reflect new information obtained about facts and circumstances that existed at the
acquisition date that, if known, would have affected the amounts recognised at that date.
RCR Mining Technologies
On 31 January 2019, the Company entered into an agreement with the Administrators’ of RCR Tomlinson
Limited to acquire the assets of RCRMT.
The business acquisition was completed on 15 February 2019 for a total purchase consideration of $10 million,
which was funded from the Group’s existing cash reserves.
The Group assumed various property leases, together with the requisite property, plant and equipment,
inventories, and intangible assets in order to continue to run the RCRMT businesses. Intangible assets include
intellectual property across a range of products and processes, patents, customer contracts, licences and the
RCR brand. The Group also assumed the relevant RCRMT workforce and their current employment
entitlements.
For
per
sona
l use
onl
y
73
7.5 BUSINESS COMBINATIONS (CONTINUED)
a) Fair value of Assets Acquired and Liabilities Assumed at the Date of Acquisition
2019
$’000
CURRENT ASSETS
Inventories 2,042
Total current assets 2,042
NON-CURRENT ASSETS
Property, plant and equipment 4,925
Intangibles 16,047
Total non-current assets 20,972
Total assets 23,014
CURRENT LIABILITIES
Provisions 3,563
Total current liabilities 3,563
NON-CURRENT LIABILITIES
Provisions 837
Deferred tax liability 3,494
Total non-current liabilities 4,331
Total liabilities 7,894
NET ASSETS ACQUIRED 15,120
b) Gain on Acquisition
$000's
Consideration paid in cash 10,000
Less fair value of identifiable net assets acquired (15,120)
Gain on acquisition (5,120)
RCRMT business combination resulted in a gain on acquisition transaction because the fair value of assets
acquired and liabilities assumed exceeded the total of the fair value of consideration paid.
The gain on acquisition amount has been recorded within “Other revenue” in the consolidated statement of
income for the year ended 30 June 2019.
An independent assessment has determined the carrying value of the intangibles relating to “customer contracts
and relationships”, brand and intellectual property as part of the acquisition. Customer contracts and
relationships and intellectual property are being amortised in line with the valuation assessment. Brand name
has an indefinite useful life and is therefore not amortised but is tested for impairment at least annually.
c) Impact of Acquisition on the Results of the Group
RCRMT has generated revenue of $30.9 million since the acquisition, contributing $5.5 million profit before tax
including $0.4 million operating profit before tax and $5.1 million gain on acquisition.
Due to the abnormal nature of operating activities throughout the Voluntary Administration period pre-
acquisition, it is impractical to determine what contribution to revenue and profit for the Group would have been,
had the acquisition occurred on 1 July 2018.
Acquisition related costs amounting to $1.2 million have been excluded from the consideration transferred
and have been recognised as an expense in the consolidated statement of profit or loss for the year ended
30 June 2019.
For
per
sona
l use
onl
y
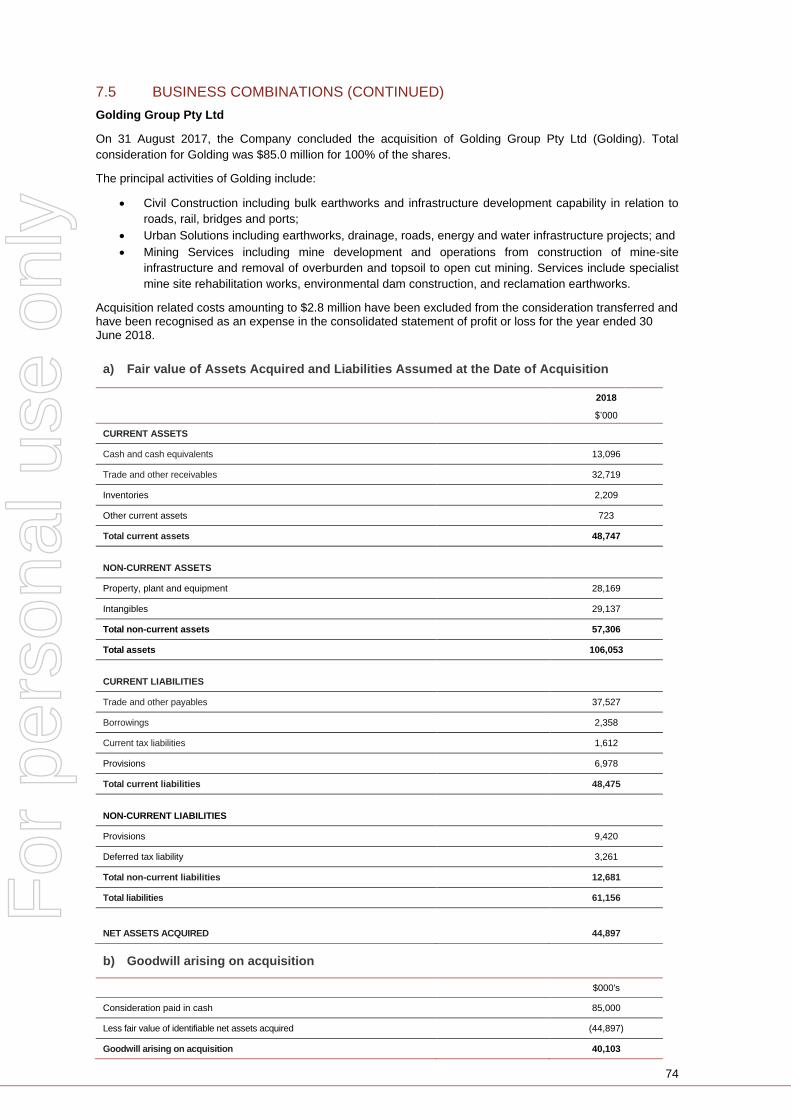
74
7.5 BUSINESS COMBINATIONS (CONTINUED)
Golding Group Pty Ltd
On 31 August 2017, the Company concluded the acquisition of Golding Group Pty Ltd (Golding). Total
consideration for Golding was $85.0 million for 100% of the shares.
The principal activities of Golding include:
Civil Construction including bulk earthworks and infrastructure development capability in relation to
roads, rail, bridges and ports;
Urban Solutions including earthworks, drainage, roads, energy and water infrastructure projects; and
Mining Services including mine development and operations from construction of mine-site
infrastructure and removal of overburden and topsoil to open cut mining. Services include specialist
mine site rehabilitation works, environmental dam construction, and reclamation earthworks.
Acquisition related costs amounting to $2.8 million have been excluded from the consideration transferred and have been recognised as an expense in the consolidated statement of profit or loss for the year ended 30 June 2018.
a) Fair value of Assets Acquired and Liabilities Assumed at the Date of Acquisition
2018
$’000
CURRENT ASSETS
Cash and cash equivalents 13,096
Trade and other receivables 32,719
Inventories 2,209
Other current assets 723
Total current assets 48,747
NON-CURRENT ASSETS
Property, plant and equipment 28,169
Intangibles 29,137
Total non-current assets 57,306
Total assets 106,053
CURRENT LIABILITIES
Trade and other payables 37,527
Borrowings 2,358
Current tax liabilities 1,612
Provisions 6,978
Total current liabilities 48,475
NON-CURRENT LIABILITIES
Provisions 9,420
Deferred tax liability 3,261
Total non-current liabilities 12,681
Total liabilities 61,156
NET ASSETS ACQUIRED 44,897
b) Goodwill arising on acquisition
$000's
Consideration paid in cash 85,000
Less fair value of identifiable net assets acquired (44,897)
Goodwill arising on acquisition 40,103
For
per
sona
l use
onl
y
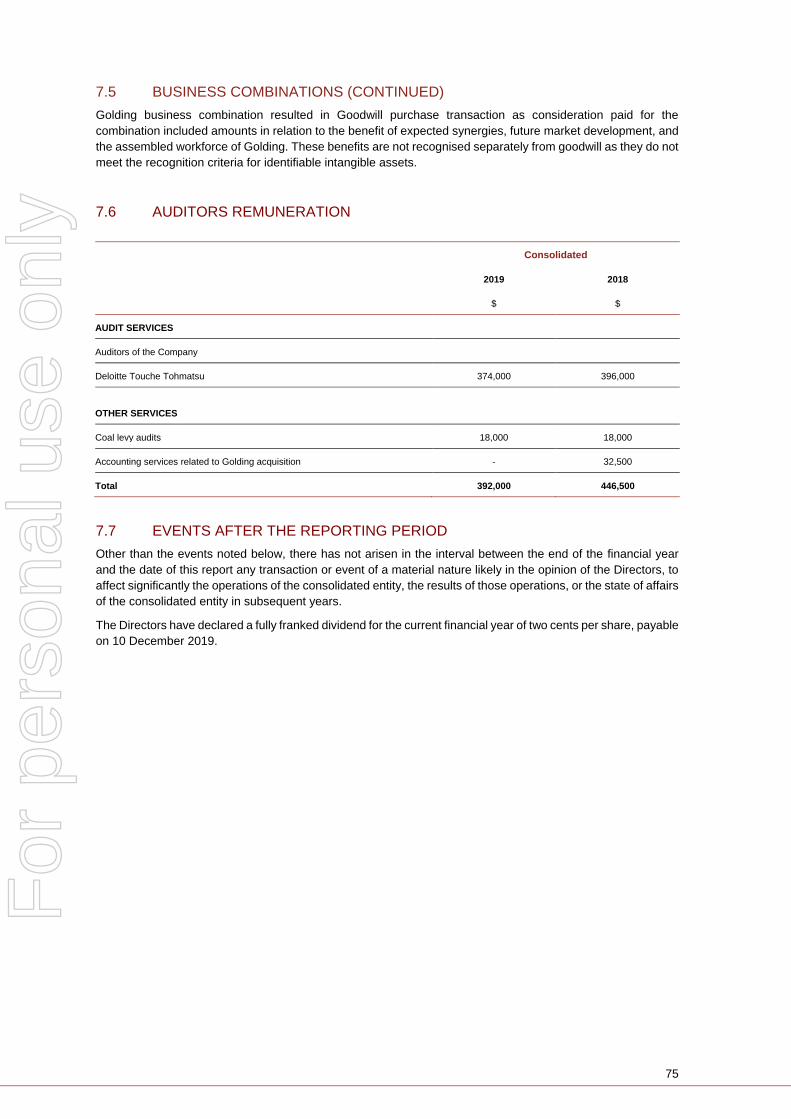
75
7.5 BUSINESS COMBINATIONS (CONTINUED)
Golding business combination resulted in Goodwill purchase transaction as consideration paid for the
combination included amounts in relation to the benefit of expected synergies, future market development, and
the assembled workforce of Golding. These benefits are not recognised separately from goodwill as they do not
meet the recognition criteria for identifiable intangible assets.
7.6 AUDITORS REMUNERATION
Consolidated
2019 2018
$ $
AUDIT SERVICES
Auditors of the Company
Deloitte Touche Tohmatsu 374,000 396,000
OTHER SERVICES
Coal levy audits 18,000 18,000
Accounting services related to Golding acquisition - 32,500
Total 392,000 446,500
7.7 EVENTS AFTER THE REPORTING PERIOD
Other than the events noted below, there has not arisen in the interval between the end of the financial year
and the date of this report any transaction or event of a material nature likely in the opinion of the Directors, to
affect significantly the operations of the consolidated entity, the results of those operations, or the state of affairs
of the consolidated entity in subsequent years.
The Directors have declared a fully franked dividend for the current financial year of two cents per share, payable
on 10 December 2019.
For
per
sona
l use
onl
y

76
7.8 CHANGES TO ACCOUNTING POLICIES
Adoption of New and Revised Accounting Standards and Interpretations
The Group has adopted all of the new and revised Standards and Interpretations issued by the Australian
Accounting Standards Board (the AASB) that are relevant to their operations and effective for the current
financial year.
New and revised Standards and amendments thereof effective for the current financial year that are relevant to
the Group include:
Standard/Interpretation
AASB 15 Revenue from Contracts with Customers
AASB 9 Financial Instruments
AASB 15 Revenue from Contracts with Customers
The new standard has been applied from 1 July 2018 replacing AASB 118 Revenue and AASB 111 Construction
Contracts and establishes a comprehensive framework for determining the timing and quantum of revenue
recognised. The main premise of the new standard is that an entity shall recognise revenue when control of a
good or service transfers to a customer. Under AASB 15, the transaction price is required to be allocated to
each performance obligation and recognised as revenue as the performance obligations are satisfied, which
can be at a point in time, or over time.
As stated in the Group’s 2018 annual financial report, the group commenced a coordinated review of the
potential impacts of the new standard on the Group’s results and disclosures. The Groups conclusions at that
time, summarised here, was that the implementation of AASB 15 would not have a material impact on revenue.
The Group has elected to implement AASB 15 using the cumulative effect method, with the effect of applying
this standard recognised at the date of initial application (i.e. 1 July 2018). A coordinated review of the potential
impacts of the new standard was carried out which concluded that no adjustments to the opening balance of
the Group’s equity were required. The implementation of AASB 15 has not had a material impact on the Group’s
revenue recognition. The comparative information for FY18 has been accounted for in accordance with the
Group’s previous accounting policies outlined in the Group’s 2018 annual financial report.
Revenue recognition
Revenue is recognised when control of a good or service transfers to a customer. Allocation of the transaction
price is made proportionately based on stand-alone selling prices of the performance obligations to each of the
separately identified performance obligations under the contract. The amount allocated to the performance
obligation is recognised as revenue at a point in time, or over time, depending on the various service offerings
described below.
Where certain contractual items include additional services, these are considered as distinct performance
obligations, for example, post-completion maintenance services or provisional sums. Revenue is recognised on
these additional services when approved by the customer and all relevant conditions have been met.
The Group’s contracts with customers usually specify the price of each contractual item (detailed in the
contract), which is typically representative of the price at which the Group will sell that individual good or service
to a customer.
Further information on the application of AASB 15 on the three major activities of the group, “Construction
contracts”, “Mining services and drill & blast services”, and “Services” is provided below.
Construction contracts
The Group derives revenue from the construction and delivery of resource projects and public sector
infrastructure projects across Australia. The performance obligation is usually the entire project, as provided for
in the contract, given that the different services are highly interdependent and integrated and are aimed at
transferring the project to the customer as a whole, representing the combined output for which the customer
has contracted.
Revenue is recognised over time as an asset is created by the group that the customer controls. In cases where
the Group does not create an asset with an alternative use other than sale to the customer, and where the
Group has the right to collect the consideration for the services over the contract term.
For
per
sona
l use
onl
y

77
7.8 CHANGES TO ACCOUNTING POLICIES (CONTINUED)
Revenue is calculated based on the proportion of contract costs incurred for work performed to date relative to
the estimated total contract costs. The Group considers that this input method (e.g. costs incurred) is an
appropriate measure of the progress towards completion of the contractual performance obligations under
AASB 15.
Mining services and drill and blast services contracts
The Group generates revenue from the provision of mining services, including mine development, contract
mining, waste stripping, ore haulage and rehabilitation and drilling and blasting services to the mining and civil
infrastructure sectors.
Revenue from mining services contracts and drill and blast services contracts is predominantly recognised on
the basis of the value of work completed. Customer contracts are generally based on schedule of rates for each
of the activities performed which identify value for the work performed and hence the value of revenue to be
recognised.
Services revenue
The Group performs maintenance and other services for a variety of different industries. Contracts entered into
can cover servicing of related assets which may involve various different services. Each service is deemed to
be a separate performance obligation. The transaction price is allocated to each performance obligation based
on contracted prices. Revenue from services contracts is predominantly recognised on the basis of the value of
work completed.
Transaction price and contract modifications
The transaction price is the amount of consideration to which the company expects to be entitled to under the
customer contract and which is used to value total revenue and is allocated to each performance obligation.
The determination of this amount includes both “fixed consideration”, (for example the agreed lump sum,
aggregated schedule of rates or pricing for services) and “variable consideration”.
The main variable consideration elements are claims (contract modifications) and consideration for optional
works and provisional sums each of which need to be assessed. Contract modifications are changes to the
contract approved by the parties to the contract. When determining whether approval has been granted by the
parties to the contract, the Group takes into consideration factors including, but are not limited to, contract terms,
customary business practices, the status of the negotiation process, the ability to enforce the other party and
expert legal opinion.
A contract modification may exist even though the parties to the contract may not have finalised the scope or
price (or both) of the modification. Contract modifications may include a claim, which is an amount that the
contractor seeks to collect as reimbursement for costs incurred (and/or to be incurred) due to reasons or events
that could not be foreseen and are not attributable to the contractor, for more work performed (and/or to be
performed) or variations that were not formalised in the contract scope.
The right to the consideration shall be provided for contractually generating an enforceable right. Once the
enforceable right has been identified, the Group applies the guidance given in AASB 15 in relation to variable
consideration. This requires an assessment that it is highly probable that there will not be a significant reversal
of revenue in the future.
The measurement of the additional consideration arising from claims is subject to a high level of uncertainty,
both in terms of the amounts that the customer will pay and the collection times, which usually depend on the
outcome of negotiations between the parties or decisions taken by judicial/arbitration bodies. The Group
considers all the relevant aspects and circumstances such as the contract terms, business and negotiating
practices of the sector, the Group’s historical experiences with similar contracts and consideration of those
factors that affect the variable consideration that are out of the control of the Group or other supporting evidence
when making the above decision.
Costs to obtain and fulfil a contract
Costs incurred prior to the commencement of a contract which may include incremental tender costs for example
and are expected to be recovered over the duration of the contract are capitalised and amortised over the
course of the contract consistent with the transfer of service to the customer.
For
per
sona
l use
onl
y
78
7.8 CHANGES TO ACCOUNTING POLICIES (CONTINUED)
Financing components
The Group does not expect to have any contracts where the period between the transfer of the promised goods
or services to the customer represents a financing component. As a consequence, the Group does not adjust
any of the transaction prices for the time value of money.
Warranties
Generally, construction and services contracts include defect and warranty periods following completion of the
project. These obligations are not deemed to be separate performance obligations and therefore estimated and
included in the total costs of the contracts. Where required, amounts are recognised accordingly in line with
AASB 137: Provisions, Contingent Liabilities and Contingent Assets. Refer to note 3.8 for further details.
Loss making contracts
A provision is made for the difference between the expected cost of fulfilling a contract and the expected
unearned portion of the transaction price where the forecast costs are greater than the forecast revenue. The
provision is recognised in full in the period in which loss making contracts are identified under AASB 137.
Equity-accounted joint ventures
The Salini Impregilo NRW Joint Venture (SI-NRW JV) is accounted for as an equity method joint venture. The
book carrying value of the Group’s investment in SI-NRW JV reflects the Group’s share of SI-NRW JV’s net
profit, including SI-NRW JV’s recognition of revenue. SI-NRW JV adopted AASB 15 for the reporting period
beginning 1 January 2018. NRW’s share of profits from SI-NRW JV represents NRW management’s best
measurement of profit recognised post adoption of AASB15. In determining the level of profit to recognise on
the project NRW also refers to an agreement with Salini Impregilo which caps the total amount of profit that
NRW can recognise on the project (being $19 million) and the maximum loss which NRW can sustain on the
project (being $8 million). NRW does not expect either cap to apply.
AASB 9 Financial Instruments
This standard has been applied from 1 July 2018 and replaces AASB 139 Financial Instruments: Recognition
and Measurement. AASB 9 includes revised guidance on the classification and measurement of financial
instruments, including a new expected credit loss model for calculation of impairment on financial assets, and
new general hedge accounting requirements. It also carries forward guidance on recognition and derecognition
of financial instruments from AASB 139.
Details of these new requirements as well as their impact on the Group’s consolidated financial statements are
described below.
Non-derivative financial assets
i. Classification
From 1 July 2018, the Group classifies its financial assets in the following measurement categories:
• Those to be measured subsequently at fair value (either through other comprehensive income, or
through profit or loss); and
• Those to be measured at amortised cost.
The classification depends on the Group’s business model for managing financial assets and the contractual
terms of the cash flows. For assets measured at fair value, gains and losses will either be recorded in profit or
loss or other comprehensive income. For investments in trade and other financial assets, this will depend on
the business model in which the investment is held. For investments in equity instruments that are not held for
trading, this will depend on whether the Group has made an irrevocable election at the time of initial recognition
to account for the equity investment at fair value through other comprehensive income.
ii. Measurement
At initial recognition, the Group measures a financial asset at its fair value plus, in the case of a financial asset
not at fair value through profit or loss, transaction costs that are directly attributable to the acquisition of the
financial asset. Transaction costs of financial assets carried at fair value through profit or loss are expensed in
profit or loss. Measurement of cash and cash equivalents and trade and other receivables remains at amortised
cost consistent with the comparative period.
For
per
sona
l use
onl
y
79
7.8 CHANGES TO ACCOUNTING POLICIES (CONTINUED)
Cash and cash equivalents
Cash and cash equivalents include cash on hand, cash at bank and call deposits. For the purposes of the
statement of cash flows, net cash includes cash on hand, at bank and short term deposits at call, net of bank
overdrafts where there is an ability to offset and an intention to settle.
Debt instruments
Subsequent measurement of debt instruments depends on the Group’s business model for managing the asset
and the cash flow characteristics of the asset. There are three measurement categories into which the Group
classifies its debt instruments:
• Amortised cost: Assets that are held for collection of contractual cash flows where those cash flows
represent solely payments of principal and interest are measured at amortised cost. A gain or loss on
trade and other financial assets that is subsequently measured at amortised cost is recognised in profit
or loss when the asset is derecognised or impaired. Interest income from these financial assets is
included in finance income using the effective interest rate method.
• Fair value through other comprehensive income (FVOCI): Assets that are held for collecting
contractual cash flows and through sale on specified dates. A gain or loss on a debt investment that is
subsequently measured at FVOCI is recognised in other comprehensive income.
• Fair value through profit or loss (FVPL): Assets that do not meet the criteria for amortised cost or
FVOCI are measured at FVPL. A gain or loss on a debt investment that is subsequently measured at
FVPL and is not part of a hedging relationship is recognised in profit or loss and presented net in the
statement of profit or loss within other gains/(losses) in the period in which it arises. None are currently
held by the Group or at any point during the year.
Equity instruments
The Group subsequently measures all equity investments at fair value. Where the Group’s management has
elected to present fair value gains and losses on equity investments in other comprehensive income, there is
no subsequent reclassification of fair value gains and losses to profit or loss following the derecognition of the
investment. Dividends from such investments continue to be recognised in profit or loss as other income when
the Group’s right to receive payments is established. Impairment losses (and reversal of impairment losses) on
equity investments measured at FVOCI are not reported separately from other changes in fair value. Changes
in the fair value of financial assets at FVPL are recognised in other expenses in the statement of profit or loss
as applicable.
iii. Impairment
The Group assesses on a forward looking basis the expected credit losses associated with its trade and other
financial assets carried at amortised cost and FVOCI. The impairment methodology applied depends on
whether there has been a significant increase in credit risk.
For trade receivables, contract debtors and lease receivables, the Group applies the simplified approach
permitted by AASB 9, which requires expected lifetime losses to be recognised from initial recognition of the
receivables.
Non-derivative financial liabilities
Interest bearing liabilities
All loans and borrowings are initially recognised at fair value, being the amount received less attributable
transaction costs. After initial recognition, interest bearing liabilities are stated at amortised cost with any
difference between cost and redemption value being recognised in the statement of profit or loss over the period
of the borrowings on an effective interest basis.
Trade and other payables
Liabilities are recognised for amounts to be paid for goods or services received. Trade payables are settled on
normal commercial terms.
For
per
sona
l use
onl
y
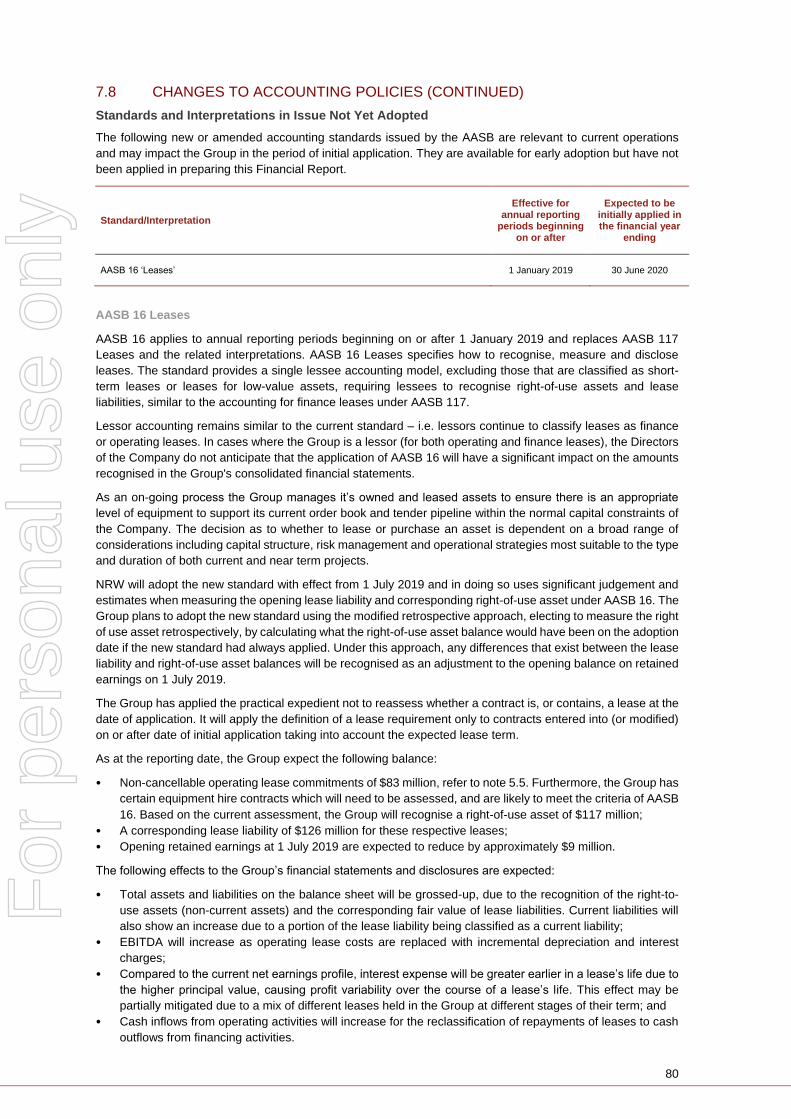
80
7.8 CHANGES TO ACCOUNTING POLICIES (CONTINUED)
Standards and Interpretations in Issue Not Yet Adopted
The following new or amended accounting standards issued by the AASB are relevant to current operations
and may impact the Group in the period of initial application. They are available for early adoption but have not
been applied in preparing this Financial Report.
Standard/Interpretation
Effective for annual reporting
periods beginning on or after
Expected to be initially applied in the financial year
ending
AASB 16 ‘Leases’ 1 January 2019 30 June 2020
AASB 16 Leases
AASB 16 applies to annual reporting periods beginning on or after 1 January 2019 and replaces AASB 117
Leases and the related interpretations. AASB 16 Leases specifies how to recognise, measure and disclose
leases. The standard provides a single lessee accounting model, excluding those that are classified as short-
term leases or leases for low-value assets, requiring lessees to recognise right-of-use assets and lease
liabilities, similar to the accounting for finance leases under AASB 117.
Lessor accounting remains similar to the current standard – i.e. lessors continue to classify leases as finance
or operating leases. In cases where the Group is a lessor (for both operating and finance leases), the Directors
of the Company do not anticipate that the application of AASB 16 will have a significant impact on the amounts
recognised in the Group's consolidated financial statements.
As an on-going process the Group manages it’s owned and leased assets to ensure there is an appropriate
level of equipment to support its current order book and tender pipeline within the normal capital constraints of
the Company. The decision as to whether to lease or purchase an asset is dependent on a broad range of
considerations including capital structure, risk management and operational strategies most suitable to the type
and duration of both current and near term projects.
NRW will adopt the new standard with effect from 1 July 2019 and in doing so uses significant judgement and
estimates when measuring the opening lease liability and corresponding right-of-use asset under AASB 16. The
Group plans to adopt the new standard using the modified retrospective approach, electing to measure the right
of use asset retrospectively, by calculating what the right-of-use asset balance would have been on the adoption
date if the new standard had always applied. Under this approach, any differences that exist between the lease
liability and right-of-use asset balances will be recognised as an adjustment to the opening balance on retained
earnings on 1 July 2019.
The Group has applied the practical expedient not to reassess whether a contract is, or contains, a lease at the
date of application. It will apply the definition of a lease requirement only to contracts entered into (or modified)
on or after date of initial application taking into account the expected lease term.
As at the reporting date, the Group expect the following balance:
• Non-cancellable operating lease commitments of $83 million, refer to note 5.5. Furthermore, the Group has
certain equipment hire contracts which will need to be assessed, and are likely to meet the criteria of AASB
16. Based on the current assessment, the Group will recognise a right-of-use asset of $117 million;
• A corresponding lease liability of $126 million for these respective leases;
• Opening retained earnings at 1 July 2019 are expected to reduce by approximately $9 million.
The following effects to the Group’s financial statements and disclosures are expected:
• Total assets and liabilities on the balance sheet will be grossed-up, due to the recognition of the right-to-
use assets (non-current assets) and the corresponding fair value of lease liabilities. Current liabilities will
also show an increase due to a portion of the lease liability being classified as a current liability;
• EBITDA will increase as operating lease costs are replaced with incremental depreciation and interest
charges;
• Compared to the current net earnings profile, interest expense will be greater earlier in a lease’s life due to
the higher principal value, causing profit variability over the course of a lease’s life. This effect may be
partially mitigated due to a mix of different leases held in the Group at different stages of their term; and
• Cash inflows from operating activities will increase for the reclassification of repayments of leases to cash
outflows from financing activities.
For
per
sona
l use
onl
y

81
7.8 CHANGES TO ACCOUNTING POLICIES (CONTINUED)
Other new accounting standards
The following new or amended standards are not expected to have a significant impact on the Group’s
consolidated financial statements:
• AASB 2016-5 Amendments to Australian Accounting Standards – Classification and Measurement of
Share-based Payment Transactions;
• AASB 2017-5 Amendment to Australian Accounting Standards – Effective Date of Amendments to AASB
10 and AASB 128 and Editorial Corrections; and
• Interpretation 22 Foreign Currency Transactions and Advance Consideration.
For
per
sona
l use
onl
y
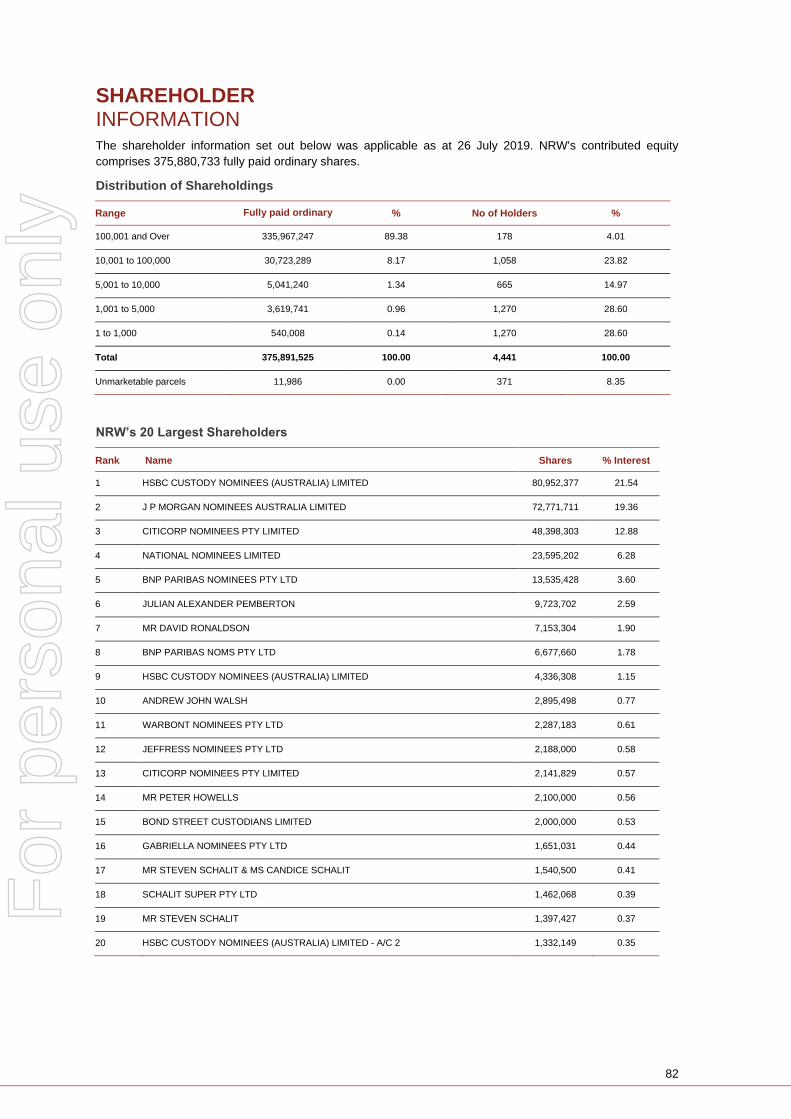
82
SHAREHOLDER INFORMATION The shareholder information set out below was applicable as at 26 July 2019. NRW's contributed equity
comprises 375,880,733 fully paid ordinary shares.
Distribution of Shareholdings
Range Fully paid ordinary shares
% No of Holders %
100,001 and Over 335,967,247 89.38 178 4.01
10,001 to 100,000 30,723,289 8.17 1,058 23.82
5,001 to 10,000 5,041,240 1.34 665 14.97
1,001 to 5,000 3,619,741 0.96 1,270 28.60
1 to 1,000 540,008 0.14 1,270 28.60
Total 375,891,525 100.00 4,441 100.00
Unmarketable parcels 11,986 0.00 371 8.35
NRW’s 20 Largest Shareholders
Rank Name Shares % Interest
1 HSBC CUSTODY NOMINEES (AUSTRALIA) LIMITED 80,952,377 21.54
2 J P MORGAN NOMINEES AUSTRALIA LIMITED 72,771,711 19.36
3 CITICORP NOMINEES PTY LIMITED 48,398,303 12.88
4 NATIONAL NOMINEES LIMITED 23,595,202 6.28
5 BNP PARIBAS NOMINEES PTY LTD 13,535,428 3.60
6 JULIAN ALEXANDER PEMBERTON 9,723,702 2.59
7 MR DAVID RONALDSON 7,153,304 1.90
8 BNP PARIBAS NOMS PTY LTD 6,677,660 1.78
9 HSBC CUSTODY NOMINEES (AUSTRALIA) LIMITED 4,336,308 1.15
10 ANDREW JOHN WALSH 2,895,498 0.77
11 WARBONT NOMINEES PTY LTD 2,287,183 0.61
12 JEFFRESS NOMINEES PTY LTD 2,188,000 0.58
13 CITICORP NOMINEES PTY LIMITED 2,141,829 0.57
14 MR PETER HOWELLS 2,100,000 0.56
15 BOND STREET CUSTODIANS LIMITED 2,000,000 0.53
16 GABRIELLA NOMINEES PTY LTD 1,651,031 0.44
17 MR STEVEN SCHALIT & MS CANDICE SCHALIT 1,540,500 0.41
18 SCHALIT SUPER PTY LTD 1,462,068 0.39
19 MR STEVEN SCHALIT 1,397,427 0.37
20 HSBC CUSTODY NOMINEES (AUSTRALIA) LIMITED - A/C 2 1,332,149 0.35
For
per
sona
l use
onl
y
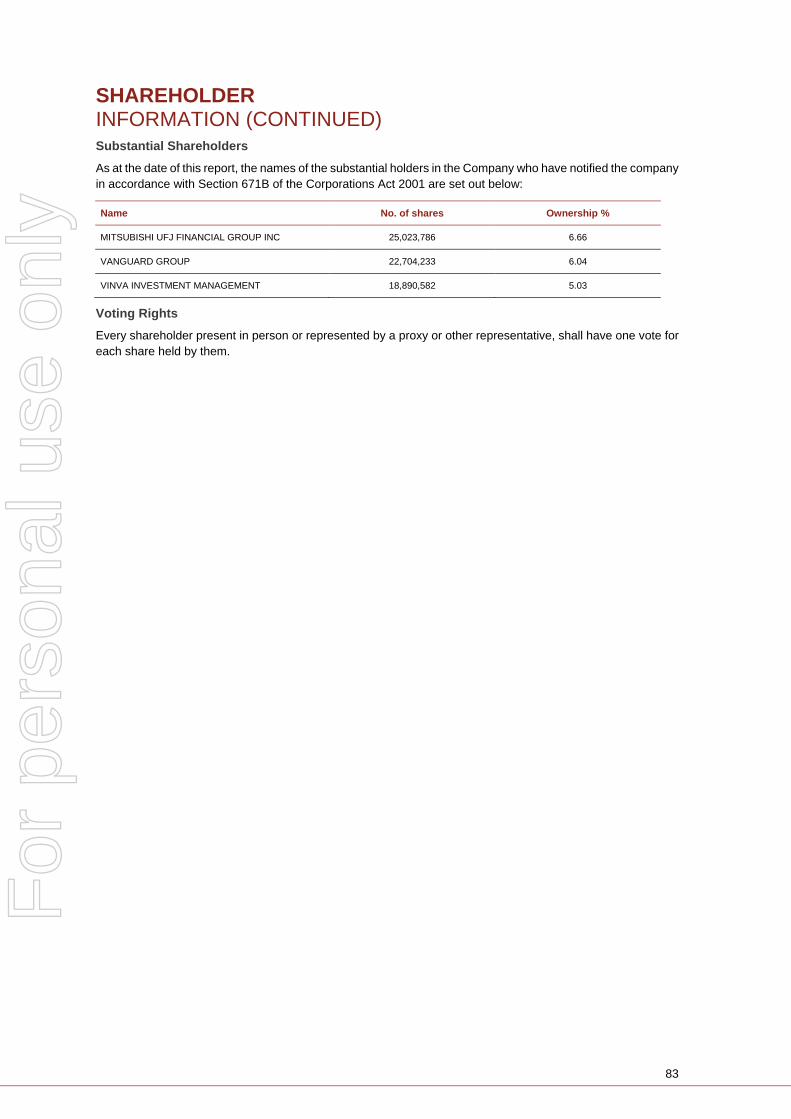
83
SHAREHOLDER INFORMATION (CONTINUED) Substantial Shareholders
As at the date of this report, the names of the substantial holders in the Company who have notified the company
in accordance with Section 671B of the Corporations Act 2001 are set out below:
Name No. of shares Ownership %
MITSUBISHI UFJ FINANCIAL GROUP INC 25,023,786 6.66
VANGUARD GROUP 22,704,233 6.04
VINVA INVESTMENT MANAGEMENT 18,890,582 5.03
Voting Rights
Every shareholder present in person or represented by a proxy or other representative, shall have one vote for
each share held by them.
For
per
sona
l use
onl
y

84
INDEPENDENT AUDITOR’S REPORT
For
per
sona
l use
onl
y
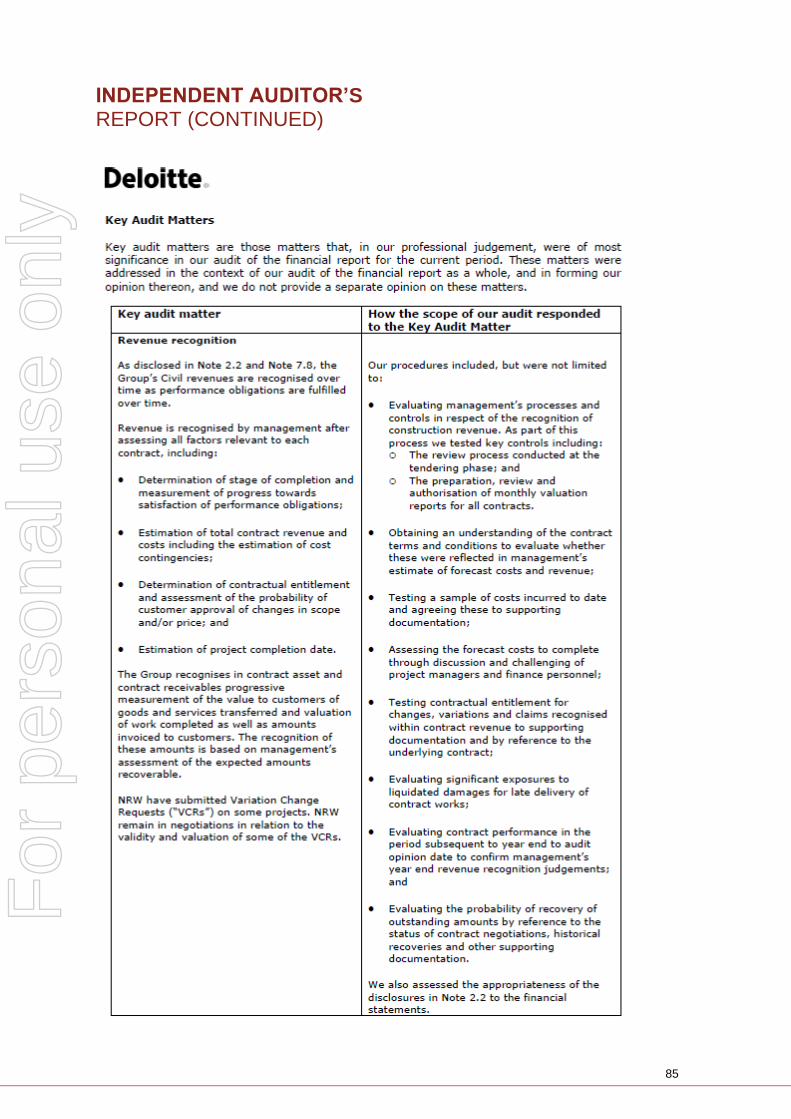
85
INDEPENDENT AUDITOR’S REPORT (CONTINUED)
For
per
sona
l use
onl
y

86
INDEPENDENT AUDITOR’S REPORT (CONTINUED)
For
per
sona
l use
onl
y

87
INDEPENDENT AUDITOR’S REPORT (CONTINUED)
For
per
sona
l use
onl
y

88
INDEPENDENT AUDITOR’S REPORT (CONTINUED)
For
per
sona
l use
onl
y

89
GLOSSARY
Term Description
FY18 The financial year ended 30 June 2018
FY19 The financial year ended 30 June 2019
FY20 The financial year ending 30 June 2020
$ Australian dollars, unless otherwise stated
AASB Australian Accounting Standards Board
AGM Annual General Meeting of NRW’s shareholders
Amortisation of Acquisition Intangibles Amortisation of Golding and RCRMT acquisition intangibles
ASIC Australian Securities and Investments Commission
ASX ASX Limited
Board Board of Directors of NRW
CEO Chief Executive Officer
CFO Chief Financial Officer
Comparative result The result, the calculation of which is shown and which generally excludes nonrecurring items which is most appropriate to compare to prior comparative periods.
Corporations Act Corporations Act 2001 (Cth)
EBIT Earnings before interest, tax, transaction costs Gascoyne impairment and RCRMT gain on acquisition.
EBITDA Earnings before interest, tax, depreciation, amortisation, transaction costs, Gascoyne impairment and RCRMT gain on acquisition.
ECI Early contract involvement
ECL Expected credit loss
EGM Executive General Manager
EPS Earnings per share
FAL Forrestfield-Airport Link
Gascoyne Gascoyne Resources Limited ASX (GCY) and its subsidiaries
Gascoyne Impairment Relates to the pre-administration carrying value of certain accounts on the Dalgaranga contract and agreements with Gascoyne Resources and its subsidiary GNT impairment of all of which have been expensed.
KMP Key Management Personnel as defined in AASB 124 Related Party Disclosure
LTIP Long-term incentive plan
NPAT Net profit after Tax
Non-Executive Director Non-Executive Director of NRW
PBT Profit before tax
PCP Prior comparative period
Performance Right An entitlement to a Share subject to satisfaction of applicable conditions (including performance based vesting conditions)
For
per
sona
l use
onl
y
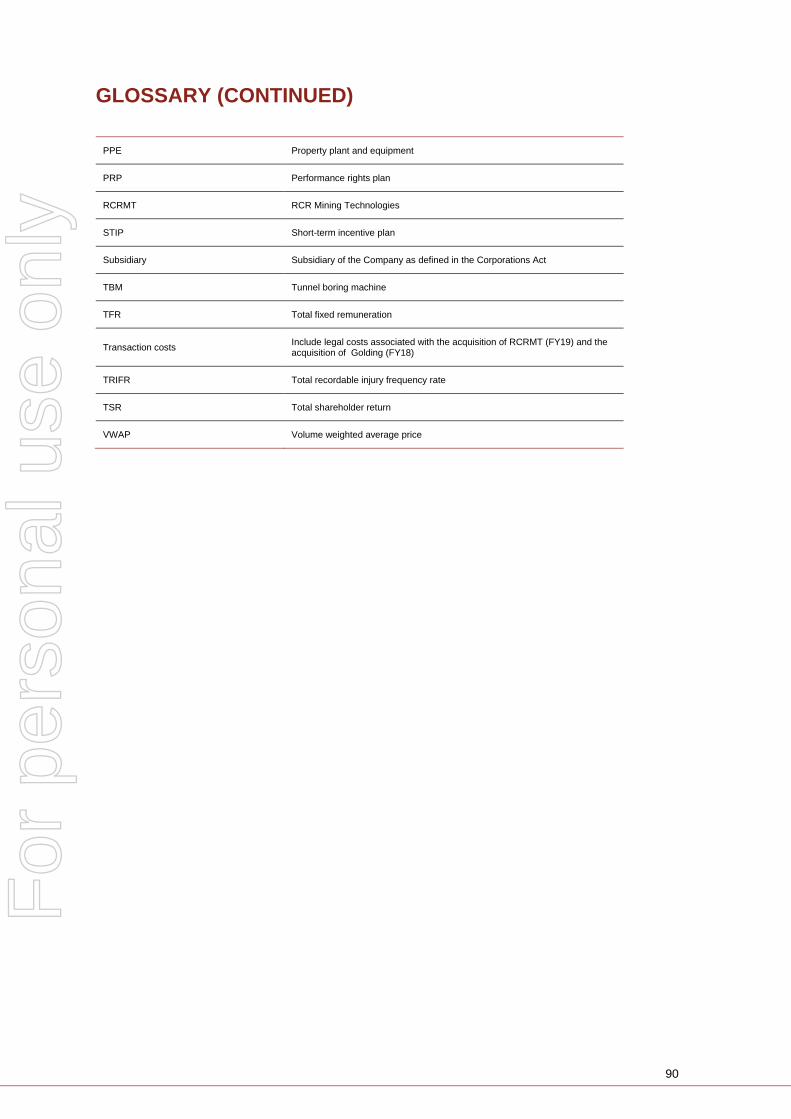
90
GLOSSARY (CONTINUED)
PPE Property plant and equipment
PRP Performance rights plan
RCRMT RCR Mining Technologies
STIP Short-term incentive plan
Subsidiary Subsidiary of the Company as defined in the Corporations Act
TBM Tunnel boring machine
TFR Total fixed remuneration
Transaction costs Include legal costs associated with the acquisition of RCRMT (FY19) and the acquisition of Golding (FY18)
TRIFR Total recordable injury frequency rate
TSR Total shareholder return
VWAP Volume weighted average price
For
per
sona
l use
onl
y
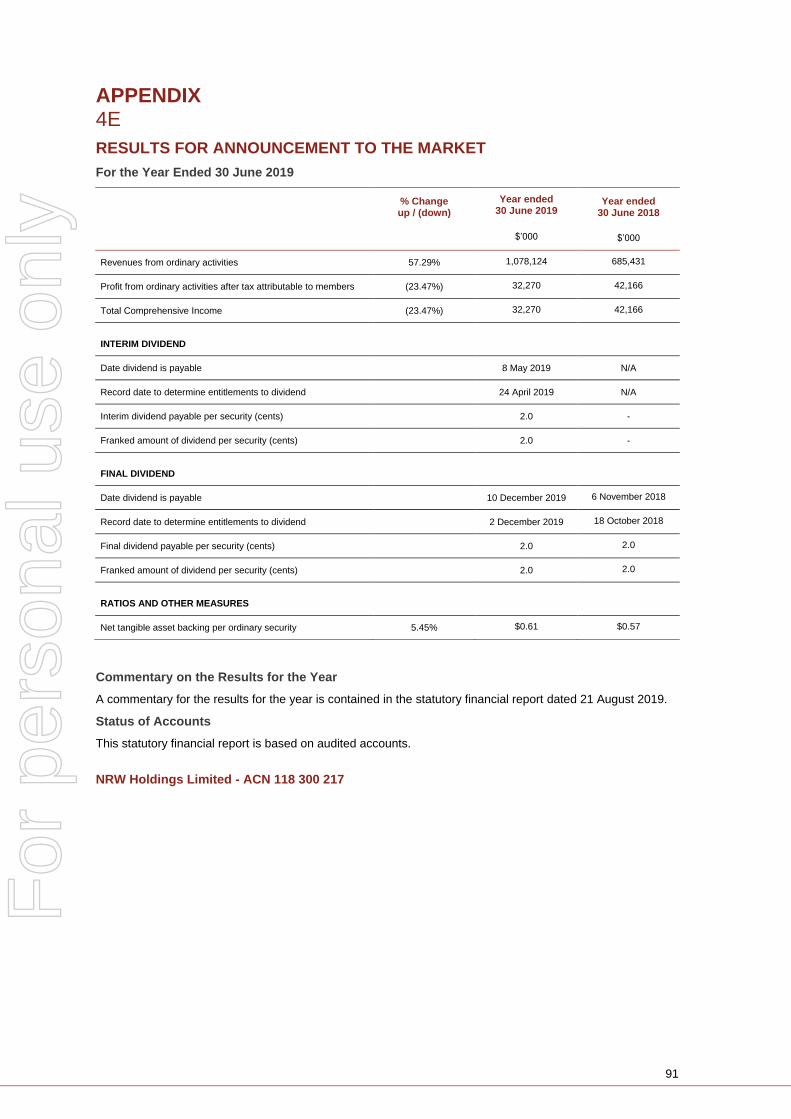
91
APPENDIX 4E
RESULTS FOR ANNOUNCEMENT TO THE MARKET
For the Year Ended 30 June 2019
% Change up / (down)
Year ended 30 June 2019
Year ended 30 June 2018
$’000 $’000
Revenues from ordinary activities 57.29% 1,078,124 685,431
Profit from ordinary activities after tax attributable to members (23.47%) 32,270 42,166
Total Comprehensive Income (23.47%) 32,270 42,166
INTERIM DIVIDEND
Date dividend is payable 8 May 2019 N/A
Record date to determine entitlements to dividend 24 April 2019 N/A
Interim dividend payable per security (cents) 2.0 -
Franked amount of dividend per security (cents) 2.0 -
FINAL DIVIDEND
Date dividend is payable 10 December 2019 6 November 2018
Record date to determine entitlements to dividend 2 December 2019 18 October 2018
Final dividend payable per security (cents) 2.0 2.0
Franked amount of dividend per security (cents) 2.0 2.0
RATIOS AND OTHER MEASURES
Net tangible asset backing per ordinary security 5.45% $0.61 $0.57
Commentary on the Results for the Year
A commentary for the results for the year is contained in the statutory financial report dated 21 August 2019.
Status of Accounts
This statutory financial report is based on audited accounts.
NRW Holdings Limited - ACN 118 300 217
For
per
sona
l use
onl
y