For personal use only - ASX · MDS Financial Group Limited - Annual Report 2015 MDS Financial Group...
77
29 September 2015 Media Release MDS Financial Group Limited ACN 091 744 884 Level 8 25 Bligh Street Sydney NSW 2000 T: +61 2 8114 2222 F: +61 2 8114 2200 [email protected] www.mdsfinancial.com.au ASX Code: MWS ANNUAL REPORT FOR THE YEAR ENDED 30 JUNE 2015 MDS Financial Group Ltd (the “Company”) is pleased to submit its full year audited results for the 2015 financial year. The Company wishes to advise that there were no material adjustments to the Preliminary Final Report (Appendix 4E) issued on 30 August 2015. A copy of the full report is attached and can be downloaded from the Company’s website at www.mdsfinancial.com.au Andrew Phillips Company Secretary – Ends – For further information please contact: Andrew Phillips, MDS Company Secretary +61 2 81142222 For media enquiries please contact: Adam Jarvis, Six Degrees Investor Relations +61 424 297 736 ABOUT MDS FINANCIAL GROUP ASX-listed MDS Financial Group Limited (ASX: MWS) is an integrated financial services company providing products and services to self-directed retail and wholesale clients and those of third party professional service firms. It provides: Investment and superannuation products; Wealth management and advisory services; Corporate advisory and capital markets expertise; Retail, wholesale and institutional trading platforms; and Market data and financial news services. MDS operates various AFS Licenses and its subsidiary D2MX is an ASX Market Participant. For personal use only
Transcript of For personal use only - ASX · MDS Financial Group Limited - Annual Report 2015 MDS Financial Group...
29 September 2015
Media Release
MDS Financial Group Limited
ACN 091 744 884
Level 8
25 Bligh Street
Sydney NSW 2000
T: +61 2 8114 2222
F: +61 2 8114 2200
www.mdsfinancial.com.au
ASX Code: MWS
ANNUAL REPORT FOR THE YEAR ENDED 30 JUNE 2015
MDS Financial Group Ltd (the “Company”) is pleased to submit its full year audited results for the 2015 financial year.
The Company wishes to advise that there were no material adjustments to the Preliminary Final Report (Appendix 4E) issued on 30 August 2015.
A copy of the full report is attached and can be downloaded from the Company’s website at www.mdsfinancial.com.au
Andrew Phillips Company Secretary
– Ends –
For further information please contact:
Andrew Phillips, MDS Company Secretary +61 2 81142222
For media enquiries please contact: Adam Jarvis, Six Degrees Investor Relations +61 424 297 736
ABOUT MDS FINANCIAL GROUP
ASX-listed MDS Financial Group Limited (ASX: MWS) is an integrated financial services company providing products and services to self-directed retail and wholesale clients and those of third party professional service firms.
It provides:
Investment and superannuation products;
Wealth management and advisory services;
Corporate advisory and capital markets expertise;
Retail, wholesale and institutional trading platforms; and
Market data and financial news services.
MDS operates various AFS Licenses and its subsidiary D2MX is an ASX Market Participant.
For
per
sona
l use
onl
y

MDS Financial Group Limited
Annual Report 2015
For
per
sona
l use
onl
y
MDS Financial Group Limited - Annual Report 2015
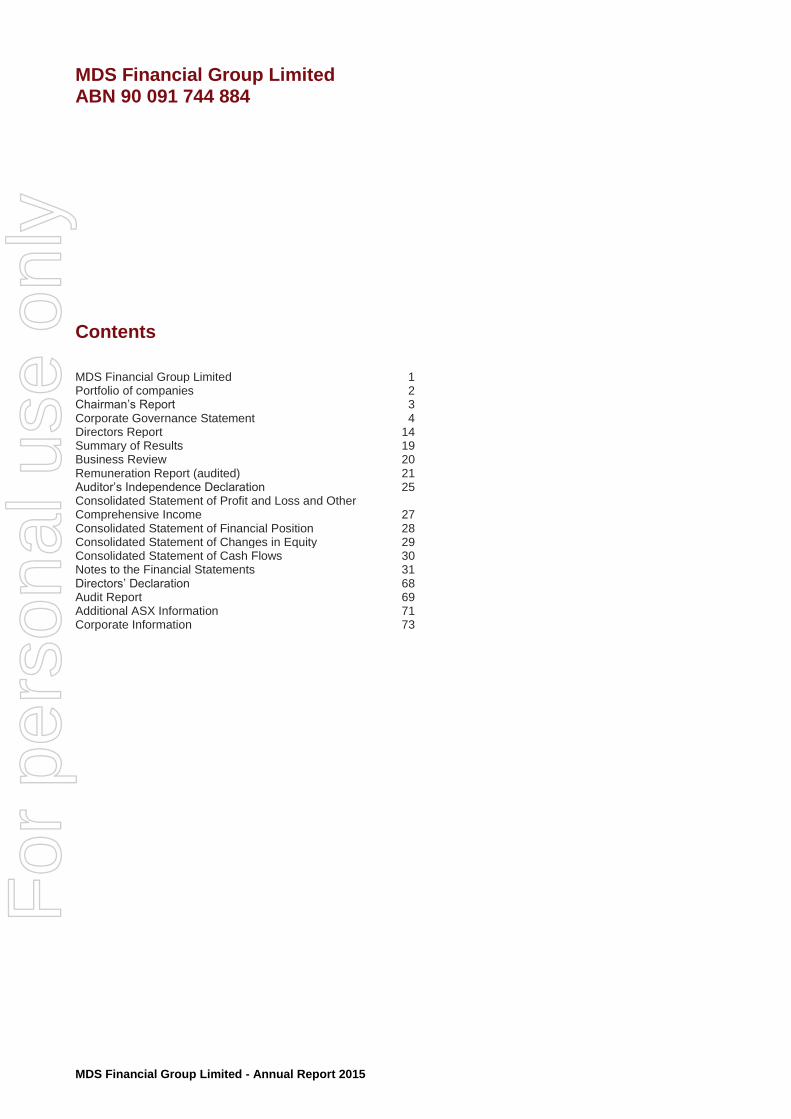
MDS Financial Group Limited ABN 90 091 744 884 Contents
MDS Financial Group Limited 1 Portfolio of companies 2 Chairman’s Report 3 Corporate Governance Statement 4 Directors Report 14 Summary of Results 19 Business Review 20 Remuneration Report (audited) 21 Auditor’s Independence Declaration 25 Consolidated Statement of Profit and Loss and Other Comprehensive Income
27
Consolidated Statement of Financial Position 28 Consolidated Statement of Changes in Equity 29 Consolidated Statement of Cash Flows 30 Notes to the Financial Statements 31 Directors’ Declaration 68 Audit Report 69 Additional ASX Information 71 Corporate Information 73
For
per
sona
l use
onl
y
MDS Financial Group Limited - Annual Report 2015 1
MDS Financial Group Limited ABN 90 091 744 884
MDS Financial Group Ltd (MDS) is an integrated financial services company that provides products and services to self-directed retail and wholesale clients and those of third party professional service firms. Through the acquisition and integration of the Sequoia Financial Group Ltd (Sequoia) completed during financial year 2015, MDS now offers a comprehensive range of products and services including:
Investment and superannuation products
Wealth management and advisory services
Corporate advisory and capital markets expertise
Retail, wholesale and institutional trading platforms
Market data and financial news services
MDS operates various Australian Financial Services (AFS) Licenses and its subsidiary D2MX is an Australian Securities Exchange (ASX) market participant.
For
per
sona
l use
onl
y
MDS Financial Group Limited - Annual Report 2015 2
Portfolio of Companies
D2MX Pty Ltd is an ASX market participant
providing advisory and trade execution services to retail investors, institutional and wholesale broker dealer groups. Services include:
General Advice
Corporate Advisory
Institutional Equity Sales
Wholesale Broking
Trader Dealer Online Pty Ltd is an online trading
company providing execution-only trading and software solutions for clients investing in ASX equities, options and warrants. Proprietary software platforms include d2mxIRESS and Market Analyser.
Bourse Data Pty Ltd is a software technology
company that develops, sells and supports The Bourse market data platform.
Sequoia Specialist Investments is a leading issuer
of bespoke investment products to retail investors, sophisticated and wholesale investors. SSI has established a suite of products providing investors with exposure to unique investment themes.
Sequoia Asset Management is an
investment services firm and holder of an Australian Financial Services License. Our team of experts provide advice on portfolio management, SMSFs, direct shares, superannuation, structured products, option trading, personal insurance, margin lending and cash solutions.
Sequoia Superannuation provides a complete
solution to the SMSF market, designed specifically for anyone that has or wants a SMSF. Sequoia Superannuation also provides SMSF solutions to Financial Planners, Stock Brokers, Mortgage Brokers and Accountants Australia wide.
For
per
sona
l use
onl
y
MDS Financial Group Limited - Annual Report 2015 3
Chairman’s Report
Dear Shareholders,
I am pleased to report that MDS Financial Group (MDS) has made significant progress in 2014/2015 which been a transformational year for the Company. The integration of Sequoia Financial Group (Sequoia) following the completion of its acquisition in January 2015 has been an important achievement. MDS now has a broader range of product and service offerings across the wealth management and financial services sectors. It is well placed to further leverage opportunities for growth in catering to the needs of self directed investors and their trusted professional service providers. A major highlight since the acquisition of Sequoia has been strengthening revenues, streamlining of operations and improving efficiencies. Unfortunately integration costs together with a number of staffing changes and redundancies during the period have resulted in an operating loss. After adding back impairments, the overall result for the period was a net loss before tax of $1,260,059. This result takes into account a number of one off expenses associated with the Sequoia acquisition, redundancies and other cleansing items which have been necessary to allow the combined entity to prosper in the future. Pleasingly, revenue has grown 9.7% year on year, primarily as a result of increasing interest in the invigorated group from its expanded customer base. The Company has also considerably strengthened its Board and Management, most notably with the appointment of Sequoia founder Scott Beeton as Managing Director and CEO together with a number of key management appointments. These appointments are reflective of the focus on our key business divisions that will our drive growth and revenue streams in the year ahead. While the Company acknowledges that there is still much work to do, I would draw special attention to the fact that further profit improvement is expected in the year ahead given the benefit of a full year contribution of the combined MDS and Sequoia businesses. I am also encouraged by the considerable growth that has already been achieved throughout the second half of the year by our Self-Managed Superannuation Fund Administration division and in the D2MX business which has on-boarded a significant number of new wholesale clients and also trading accounts in the fourth quarter. I take this opportunity to acknowledge Richard Symon, who took the decision to step down from his role of Executive Chairman in August 2015. Along with the Board I thank him for his 8 year involvement with MDS, his support with the restructuring and contribution to strategic partnership opportunities. I would also like to especially thank all of our staff for their hard work, efforts and commitment throughout the year. Finally, thank you to our shareholders for your past and ongoing support. Whilst the transformation in 2014/2015 has been challenging the Board and Management, MDS Financial Group are confident that further growth and value can be realised in the year ahead.
Michael Carter Chairman, MDS Financial Group Ltd
For
per
sona
l use
onl
y

MDS Financial Group Limited - Annual Report 2015 4
Corporate Governance Statement The Board of Directors (“the Board”) of MDS Financial Group Limited (“the company”) is responsible for the corporate governance of the consolidated entity. The Board guides and monitors the business and affairs of the company on behalf of the shareholders by whom they are elected and to whom they are accountable. The corporate governance statement has been reported as at 29 September 2015. The table below summarises the company’s compliance with the ASX Corporate Governance Council’s Revised Principles and Recommendations.
Principles and Recommendations Compliance Comply
Principle 1 – Lay solid foundations for management and oversight
1.1 Establish the functions reserved to the Board and those delegated to manage and disclose those functions.
The Board is responsible for the overall corporate governance of the company.
The Board has adopted a Board charter that formalises its roles and responsibilities and defines the matters that are reserved for the Board and specific matters that are delegated to management.
The Board has adopted a Delegations of Authority that sets limits of authority for senior executives.
On appointment of a director, the company issues a letter of appointment setting out the terms and conditions of appointment to the Board.
Complies.
1.2 Disclose the process for evaluating the performance of senior executives.
Senior executives prepare strategic objectives that are reviewed and signed off by the Board. These objectives must then be met by senior executives as part of their key performance targets. The chief executive officer (CEO) then reviews the performance of the senior executives against those objectives. The Board reviews the CEO’s compliance against his and the company’s objectives. These reviews occur annually or more frequently as required.
Does not comply due to the number of executive staff. The CEO has an active day to day role.
1.3 Provide the information indicated in Guide to reporting on Principle 1.
A Board charter has been disclosed on the Company’s website and is summarised in this Corporate Governance Statement.
Complies.
A performance evaluation process is included in the Board Charter, which has been disclosed on the company’s website and is summarised in this Corporate Governance Statement.
The Board conducted a performance evaluation for senior executives in the financial year in accordance with the process above.
Complies.
Complies.
For
per
sona
l use
onl
y

MDS Financial Group Limited - Annual Report 2015 5
Corporate Governance Statement
Principles and Recommendations Compliance Comply
Principle 2 – Structure the Board to add value
2.1 A majority of the Board should be independent directors
The majority of the Board’s directors are not independent as a majority of the Board are either a substantial shareholder or are executive directors of the company.
Mr Michael Carter is engaged in the capacity of Non–Executive Director and Chairman.
Mr Scott Lionel Beeton is the Managing Director, Chief Executive Officer and a substantial shareholder.
Mr Marcel John Collignon is an Executive Director and a substantial shareholder.
Mr Delan Pagliaccio is an Executive Director.
Does not comply however the skills and experience of the Board composition allows the Board to act in the best interests of shareholders. The Board is currently in the process of recruiting a suitably skilled Independent Director to join the Board.
2.2 The chair should be an independent director.
Mr Michael Carter is the Chairman and Non-Executive Director.
Does not comply as Michael Carter was previously an Executive Director of the group.
2.3 The roles of the chair and chief executive officer should not be exercised by the same individual.
Michael Carter is the Chairman and Mr Scott Lionel Beeton is an Executive Director and acting Chief Executive Officer.
Complies.
2.4 The Board should establish a Nomination and Remuneration Committee.
The Company has established a separate Nomination and Remuneration Committees.
The Board has undertaken a review of the mix of skills and experience on the Board in light of the company’s principal activities and direction, and has considered diversity in succession planning. The Board considers the current mix of skills and experience of the members of the Board and its senior management is sufficient to meet the requirements of the company.
The Board supports the nomination and re-election of the directors at the company’s forthcoming Annual General Meeting, should these directors wish to continue on the Board.
Complies.
2.5 Disclose the process for evaluating the performance of the Board, its committees and individual directors.
The company conducts the process for evaluating the performance of the Board, its committees and individual directors as outlined in the Board Charter which is available on the company’s website.
The Board’s induction program provides incoming directors with information that will enable them to carry out their duties in the best interests of the company. This includes supporting ongoing education of directors for the benefit of the company.
Complies.
For
per
sona
l use
onl
y
MDS Financial Group Limited - Annual Report 2015 6
Corporate Governance Statement
Principles and Recommendations Compliance Comply
2.6 Provide the information indicated in the Guide to reporting on Principle 2.
This information has been disclosed (where applicable) in the directors’ report attached to this Corporate Governance Statement.
Complies.
Michael Carter, Non-Executive Director and Chairman was appointed in this capacity on the 10 August 2015, he previously held the position of Executive Director. The initial Board appointment was made on the 10 March 2015.
Scott Beeton, Managing Director and Chief Executive Officer was appointed to the Board on the 24 December 2014 following the successful transaction with Sequoia Financial Group Ltd.
Marcel Collignon, Executive Director was appointed to the Board on the 24 December 2014 following the successful Sequoia Financial Group Ltd transaction.
Delan Pagliaccio was appointed to the Board in the capacity of Executive Director on the 10 August 2015.
The company has established separate Nominations and Remuneration Committees.
The Board has undertaken a review of the mix of skills and experience on the Board in light of the company’s principal activities and direction, and has considered diversity in succession planning.
The Board considers the current mix of skills and experience of members of the Board and its senior management is sufficient to meet the requirements of the company.
In accordance with the information suggested in Guide to Reporting on Principle 2, the company has disclosed full details of its directors in the director’s report attached to this Corporate Governance Statement. Other disclosure material on the Structure of the Board has been made available on the company’s website.
The Nomination and Remuneration Committees operate under respective separate charters.
The Board does not consist of a majority of independent directors however the skills and experience of executive directors allows the Board to act in the best interests of shareholders.
For
per
sona
l use
onl
y
MDS Financial Group Limited - Annual Report 2015 7
Corporate Governance Statement
Principles and Recommendations Compliance Comply
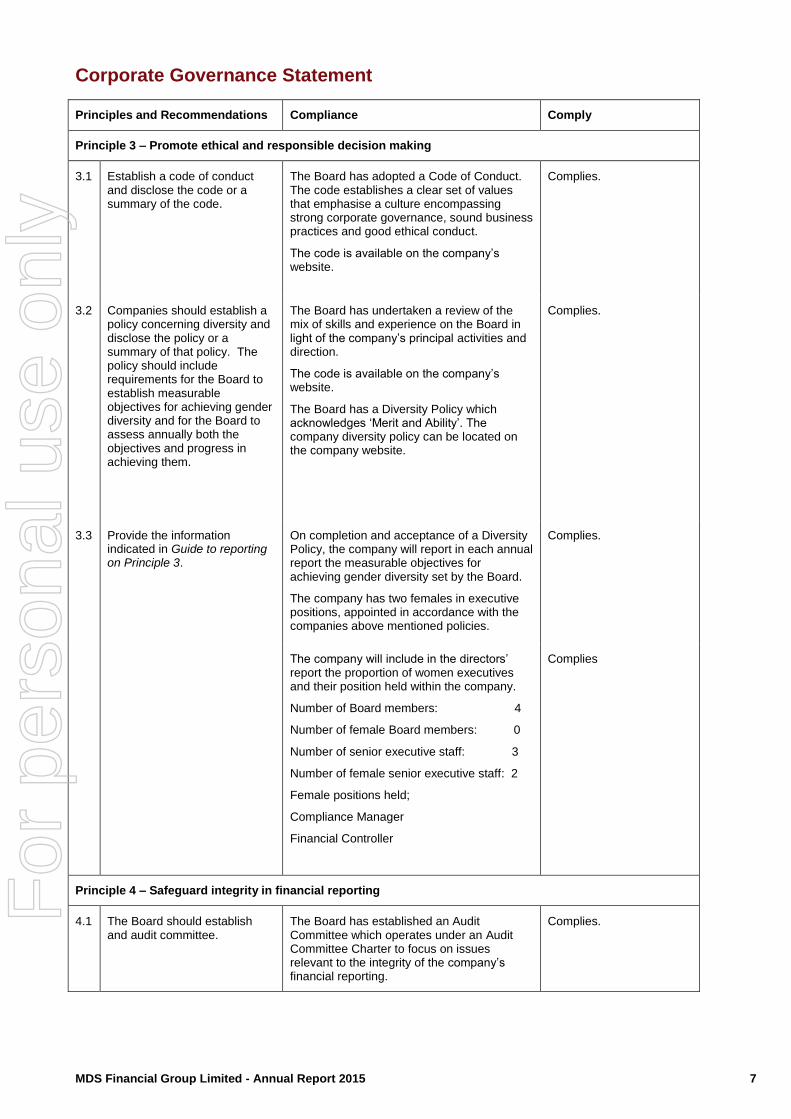
Principle 3 – Promote ethical and responsible decision making
3.1 Establish a code of conduct and disclose the code or a summary of the code.
The Board has adopted a Code of Conduct. The code establishes a clear set of values that emphasise a culture encompassing strong corporate governance, sound business practices and good ethical conduct.
The code is available on the company’s website.
Complies.
3.2 Companies should establish a policy concerning diversity and disclose the policy or a summary of that policy. The policy should include requirements for the Board to establish measurable objectives for achieving gender diversity and for the Board to assess annually both the objectives and progress in achieving them.
The Board has undertaken a review of the mix of skills and experience on the Board in light of the company’s principal activities and direction.
The code is available on the company’s website.
The Board has a Diversity Policy which acknowledges ‘Merit and Ability’. The company diversity policy can be located on the company website.
Complies.
3.3 Provide the information indicated in Guide to reporting on Principle 3.
On completion and acceptance of a Diversity Policy, the company will report in each annual report the measurable objectives for achieving gender diversity set by the Board.
The company has two females in executive positions, appointed in accordance with the companies above mentioned policies.
Complies.
The company will include in the directors’ report the proportion of women executives and their position held within the company.
Number of Board members: 4
Number of female Board members: 0
Number of senior executive staff: 3
Number of female senior executive staff: 2
Female positions held;
Compliance Manager
Financial Controller
Complies
Principle 4 – Safeguard integrity in financial reporting
4.1 The Board should establish and audit committee.
The Board has established an Audit Committee which operates under an Audit Committee Charter to focus on issues relevant to the integrity of the company’s financial reporting.
Complies.
For
per
sona
l use
onl
y
MDS Financial Group Limited - Annual Report 2015 8
Corporate Governance Statement
Principles and Recommendations Compliance Comply
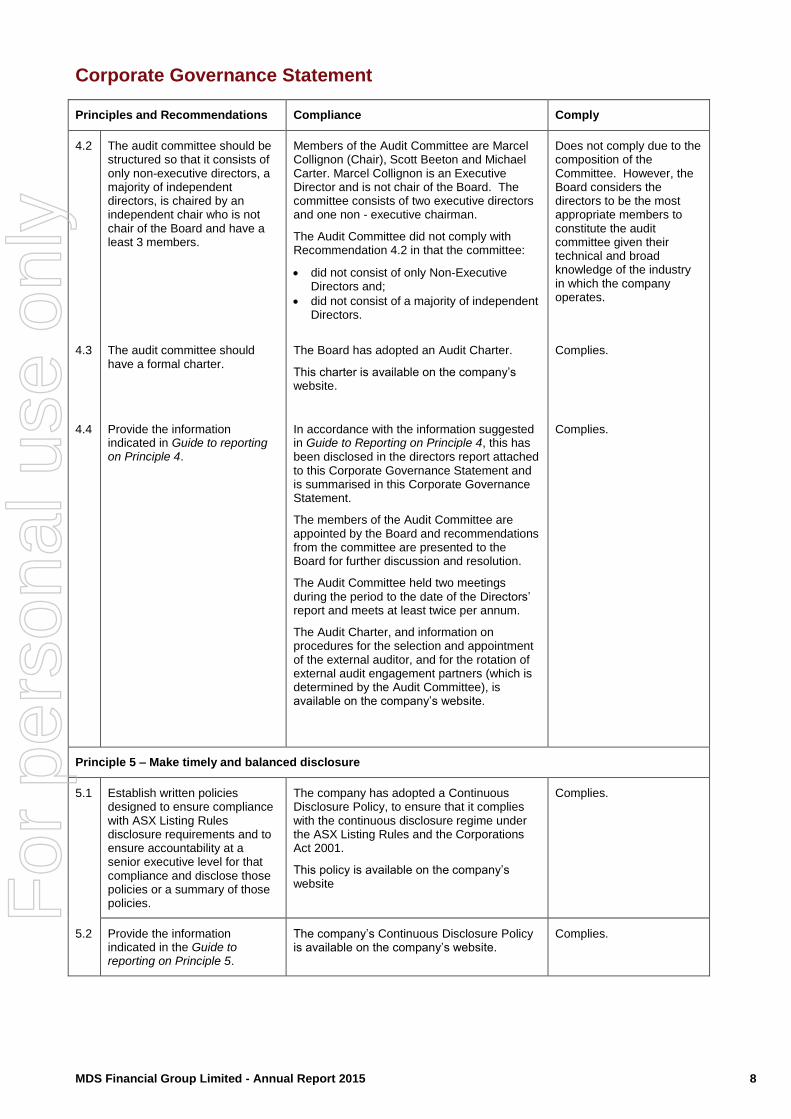
4.2 The audit committee should be structured so that it consists of only non-executive directors, a majority of independent directors, is chaired by an independent chair who is not chair of the Board and have a least 3 members.
Members of the Audit Committee are Marcel Collignon (Chair), Scott Beeton and Michael Carter. Marcel Collignon is an Executive Director and is not chair of the Board. The committee consists of two executive directors and one non - executive chairman.
The Audit Committee did not comply with Recommendation 4.2 in that the committee:
did not consist of only Non-Executive Directors and;
did not consist of a majority of independent Directors.
Does not comply due to the composition of the Committee. However, the Board considers the directors to be the most appropriate members to constitute the audit committee given their technical and broad knowledge of the industry in which the company operates.
4.3 The audit committee should have a formal charter.
The Board has adopted an Audit Charter.
This charter is available on the company’s website.
Complies.
4.4 Provide the information indicated in Guide to reporting on Principle 4.
In accordance with the information suggested in Guide to Reporting on Principle 4, this has been disclosed in the directors report attached to this Corporate Governance Statement and is summarised in this Corporate Governance Statement.
The members of the Audit Committee are appointed by the Board and recommendations from the committee are presented to the Board for further discussion and resolution.
The Audit Committee held two meetings during the period to the date of the Directors’ report and meets at least twice per annum.
The Audit Charter, and information on procedures for the selection and appointment of the external auditor, and for the rotation of external audit engagement partners (which is determined by the Audit Committee), is available on the company’s website.
Complies.
Principle 5 – Make timely and balanced disclosure
5.1 Establish written policies designed to ensure compliance with ASX Listing Rules disclosure requirements and to ensure accountability at a senior executive level for that compliance and disclose those policies or a summary of those policies.
The company has adopted a Continuous Disclosure Policy, to ensure that it complies with the continuous disclosure regime under the ASX Listing Rules and the Corporations Act 2001.
This policy is available on the company’s website
Complies.
5.2 Provide the information indicated in the Guide to reporting on Principle 5.
The company’s Continuous Disclosure Policy is available on the company’s website.
Complies.
For
per
sona
l use
onl
y

MDS Financial Group Limited - Annual Report 2015 9
Corporate Governance Statement
Principles and Recommendations Compliance Comply
Principle 6 – Respect the rights of shareholders
6.1 Design a communications policy for promoting effective communication with shareholders and encouraging their participation at general meetings and disclose that policy or a summary of that policy.
The company has adopted a Shareholder Communications Policy. The company uses its website (www.mdsfinancial.com.au), annual report, market announcements and media disclosures to communicate with its shareholders, as well as encourages participation at general meetings.
This policy is available on the company’s website.
Complies.
6.2 Provide the information indicated in the Guide to reporting on Principle 6.
The company’s shareholder communications policy is available on the company’s website.
Complies.
Principle 7 – Recognise and manage risk
7.1 Establish policies for the oversight and management of material business risks and disclose a summary of these policies.
The company has adopted a Risk Management Statement within the Audit and Risk Committee Charter. The Audit and Risk Committees are responsible for managing risk; however, ultimate responsibility for risk oversight and risk management rests with the Board.
The Audit and Risk Charter is available on the company’s website and is summarised in this Corporate Governance Statement.
Complies.
7.2 The Board should require management to design and implement the risk management and internal control system to manage the company’s material business risks and report to it on whether those risks are being managed effectively. The Board should disclose that management has reported to it as to the effectiveness of the company’s management of its material business risks.
The company has identified key risks within the business. In the ordinary course of business, management monitor and manage these risks.
Key operational and financial risks are presented to and reviewed by the Board at each Board meeting.
Complies.
7.3 The Board should disclose whether it has received assurance from the chief executive officer and chief financial officer that the declaration provided in accordance with section 295A of the Corporations Act is founded on a sound system of risk management and internal control and that the system is operating efficiently in all material respects in relation to the financial reporting risks
The Board has received a statement from the Chief Executive Officer and Chief Financial Officer that the declaration provided in accordance with section 295A of the Corporations Act 2001 is founded on a sound system of risk management and internal control and that they system is operating efficiently and effectively in all material respects in relation to the financial reporting risks.
Complies.
For
per
sona
l use
onl
y

MDS Financial Group Limited - Annual Report 2015 10
Corporate Governance Statement
Principles and Recommendations Compliance Comply
7.4 Provide the information indicated in the Guide to reporting on Principle 7.
The Board has adopted an Audit and Risk Charter which includes a statement of the company’s risk policies.
This charter is available on the company’s website and is summarised in this Corporate Governance Statement.
The company has identified key risks within the business and has received a statement of assurance from the Chief Executive Officer and Chief Financial Officer.
Complies.
Principle 8 – Remunerate fairly and responsibly
8.1 The Board should establish a remuneration committee
The Board has established a Nomination and Remuneration Committee and has adopted a remuneration charter.
Complies.
8.2 The remuneration committee should be structured
The Nomination and Remuneration Committee:
consist of a majority of independent Directors;
are chaired by an independent Director; and;
has three members.
Does not comply due to the composition of the Committee. However the Board considers the members of the committee to be appropriate.
8.3 Clearly distinguish the structure of Non-Executive Directors’ remuneration from that of Executive Directors and senior executives.
The company complies with the guidelines for executive remuneration packages and non-executive director remuneration.
No senior executive is involved directly in deciding their own remuneration.
Complies.
8.4 Provide the information indicated in Guide to reporting on Principle 8.
The Board has adopted a Nomination and Remuneration Committee Charter.
The company does not have any schemes for retirement benefits.
Complies.
MDS Financial Group Limited’s corporate governance practices were in place for the financial year ended 30 June 2015 and to the date of signing the directors’ report. Various corporate governance practices are discussed within this statement. For further information on corporate governance policies adopted by MDS Financial Group Limited, refer to our website: www.mdsfinancial.com.au. As required by the ASX Listing Rules, this statement sets out the extent to which the Company has followed the ASX Corporate Governance Council’s Corporate Governance Principles and Recommendations (“Recommendations”) during the year to 30 June 2015. The Company considers that its governance practices are generally consistent, where possible, with the Recommendations except where stated.
For
per
sona
l use
onl
y
MDS Financial Group Limited - Annual Report 2015 11
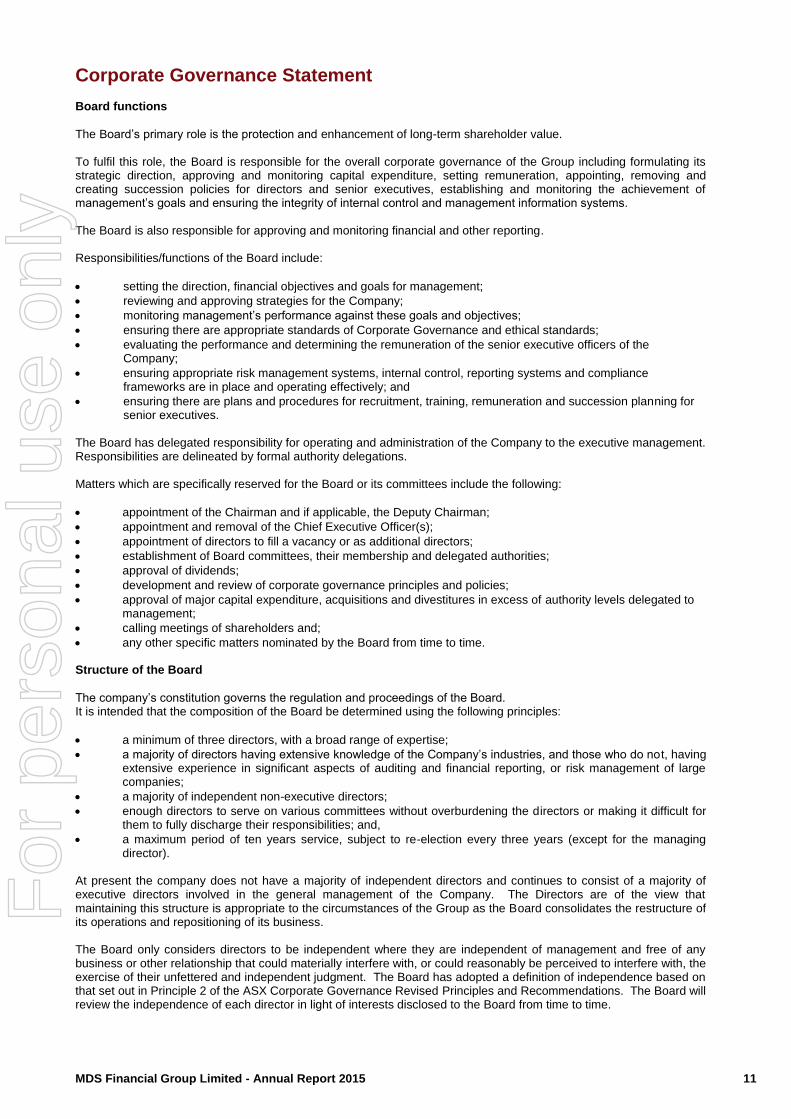
Corporate Governance Statement Board functions
The Board’s primary role is the protection and enhancement of long-term shareholder value. To fulfil this role, the Board is responsible for the overall corporate governance of the Group including formulating its strategic direction, approving and monitoring capital expenditure, setting remuneration, appointing, removing and creating succession policies for directors and senior executives, establishing and monitoring the achievement of management’s goals and ensuring the integrity of internal control and management information systems. The Board is also responsible for approving and monitoring financial and other reporting.
Responsibilities/functions of the Board include:
setting the direction, financial objectives and goals for management;
reviewing and approving strategies for the Company;
monitoring management’s performance against these goals and objectives;
ensuring there are appropriate standards of Corporate Governance and ethical standards;
evaluating the performance and determining the remuneration of the senior executive officers of the Company;
ensuring appropriate risk management systems, internal control, reporting systems and compliance frameworks are in place and operating effectively; and
ensuring there are plans and procedures for recruitment, training, remuneration and succession planning for senior executives.
The Board has delegated responsibility for operating and administration of the Company to the executive management. Responsibilities are delineated by formal authority delegations. Matters which are specifically reserved for the Board or its committees include the following:
appointment of the Chairman and if applicable, the Deputy Chairman;
appointment and removal of the Chief Executive Officer(s);
appointment of directors to fill a vacancy or as additional directors;
establishment of Board committees, their membership and delegated authorities;
approval of dividends;
development and review of corporate governance principles and policies;
approval of major capital expenditure, acquisitions and divestitures in excess of authority levels delegated to management;
calling meetings of shareholders and;
any other specific matters nominated by the Board from time to time. Structure of the Board
The company’s constitution governs the regulation and proceedings of the Board. It is intended that the composition of the Board be determined using the following principles:
a minimum of three directors, with a broad range of expertise;
a majority of directors having extensive knowledge of the Company’s industries, and those who do not, having extensive experience in significant aspects of auditing and financial reporting, or risk management of large companies;
a majority of independent non-executive directors;
enough directors to serve on various committees without overburdening the directors or making it difficult for them to fully discharge their responsibilities; and,
a maximum period of ten years service, subject to re-election every three years (except for the managing director).
At present the company does not have a majority of independent directors and continues to consist of a majority of executive directors involved in the general management of the Company. The Directors are of the view that maintaining this structure is appropriate to the circumstances of the Group as the Board consolidates the restructure of its operations and repositioning of its business. The Board only considers directors to be independent where they are independent of management and free of any business or other relationship that could materially interfere with, or could reasonably be perceived to interfere with, the exercise of their unfettered and independent judgment. The Board has adopted a definition of independence based on that set out in Principle 2 of the ASX Corporate Governance Revised Principles and Recommendations. The Board will review the independence of each director in light of interests disclosed to the Board from time to time.
For
per
sona
l use
onl
y

MDS Financial Group Limited - Annual Report 2015 12
Corporate Governance Statement Below is a summary of directors at MDS Financial Group Limited. There are procedures in place, agreed by the Board, to enable directors in furtherance of their duties to seek independent professional advice at the company’s expense. The appointment date of each director in office at the date of this report is as follows: Name
Michael Carter * Michael Carter was appointed Executive Director on 10 March 2015
Position
Non-Executive Chairman
Appointment Date
10 August 2015
Scott Lionel Beeton Executive Director 24 December 2014 Marcel John Collignon Delan Pasquale Pagliaccio
Executive Director Executive Director
24 December 2014 10 August 2015
Further details on each director can be found in the directors’ report attached to this Corporate Governance Statement. The Board is actively seeking a suitable appointment for a appropriate independent Non – Executive Director/s. Securities trading policy
The company has adopted a Share Trading Policy which complies with the requirements of ASX Listing Rules. Under the company’s Share Trading Policy, directors, officers and employees of the company are prohibited from dealing in the company’s securities at any time that they may be in possession of unpublished price-sensitive information concerning the company. In addition, there are specified closed periods during which dealing in the company’s securities is prohibited except under very exceptional circumstances. A closed period is the period commencing from the end of a reporting period and concluding on the business day following the announcement to the market of the company’s full year results or half-year results (as the case may be). Directors, officers and employees can only deal in the company’s securities after having first obtained clearance from the Chairman or his delegate and must notify the Company Secretary when a trade has occurred. As required by the ASX Listing Rules, the company notifies the ASX of any transaction conducted by directors in the securities of the company within five days of the transaction taking place. The Share Trading Policy has been issued to ASX and can be found on the company’s website.
Audit committee
The Board has established an Audit Committee which operates under a Charter approved by the Board. It is the Board’s responsibility to ensure that an effective internal control framework exists within the entity. This includes internal controls to deal with both the effectiveness and efficiency of significant business processes, the safeguarding of assets, the maintenance of proper accounting records, the reliability of financial information as well as non-financial considerations such as the benchmarking of operational key performance indicators. The Board has delegated responsibility for establishing and maintaining a framework of internal control and ethical standards to the Audit Committee. The Committee also provides the Board with additional assurance regarding the reliability of financial information for inclusion in the financial reports. The members of the Audit Committee during the year were: Jamie Khoo (Independent Non-Executive Director, resigned 13 January 2015) Richard Symon (Executive Director, resigned 10 August 2015) Scott Beeton (Executive Director, appointed 24 December 2014) Marcel Collignon (Executive Director, appointed 24 December 2014) Michael Carter (Non–Executive Chairman appointed 10 August 2015, previously appointed on 10 March 2015 as Executive Director) The external auditors and the executive management are invited to audit committee meetings at the discretion of the committee. For details on the number of meetings of the Audit and Risk Committee held during the year and the attendees at those meetings, refer to the directors’ report.
For
per
sona
l use
onl
y
MDS Financial Group Limited - Annual Report 2015 13
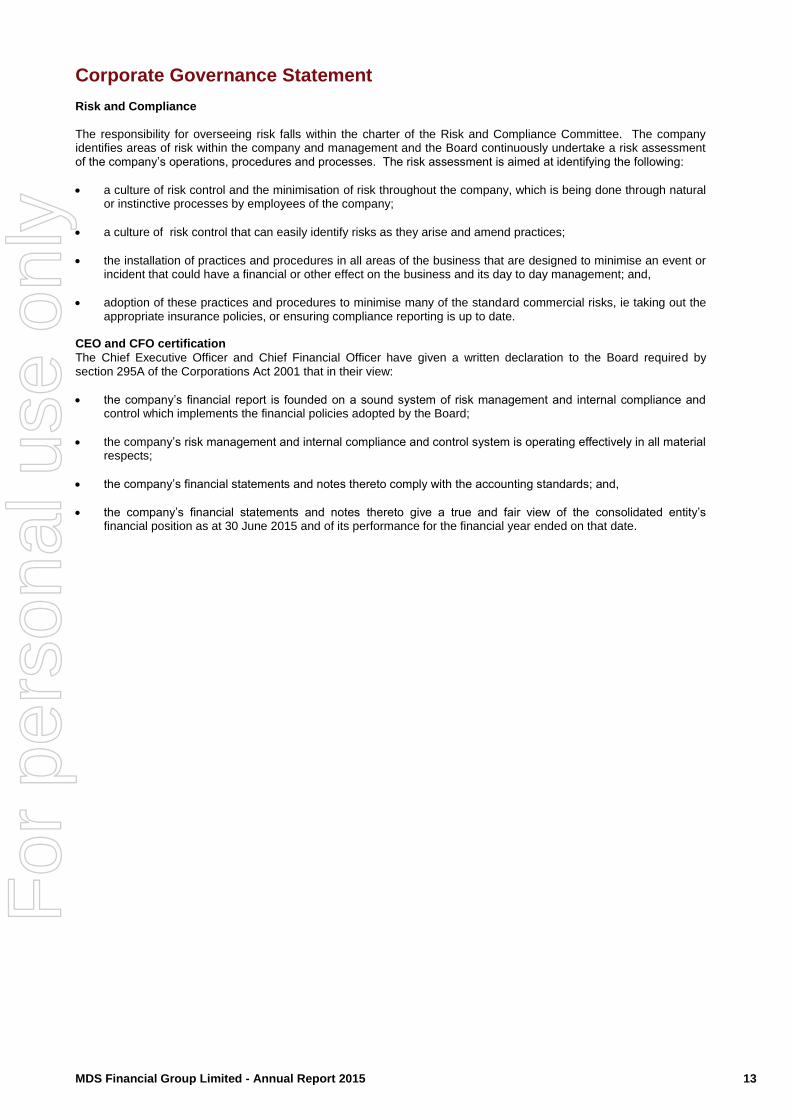
Corporate Governance Statement Risk and Compliance
The responsibility for overseeing risk falls within the charter of the Risk and Compliance Committee. The company identifies areas of risk within the company and management and the Board continuously undertake a risk assessment of the company’s operations, procedures and processes. The risk assessment is aimed at identifying the following:
a culture of risk control and the minimisation of risk throughout the company, which is being done through natural or instinctive processes by employees of the company;
a culture of risk control that can easily identify risks as they arise and amend practices;
the installation of practices and procedures in all areas of the business that are designed to minimise an event or incident that could have a financial or other effect on the business and its day to day management; and,
adoption of these practices and procedures to minimise many of the standard commercial risks, ie taking out the appropriate insurance policies, or ensuring compliance reporting is up to date.
CEO and CFO certification
The Chief Executive Officer and Chief Financial Officer have given a written declaration to the Board required by section 295A of the Corporations Act 2001 that in their view:
the company’s financial report is founded on a sound system of risk management and internal compliance and control which implements the financial policies adopted by the Board;
the company’s risk management and internal compliance and control system is operating effectively in all material respects;
the company’s financial statements and notes thereto comply with the accounting standards; and,
the company’s financial statements and notes thereto give a true and fair view of the consolidated entity’s financial position as at 30 June 2015 and of its performance for the financial year ended on that date.
For
per
sona
l use
onl
y

MDS Financial Group Limited - Annual Report 2015 14
Directors’ Report The directors of MDS Financial Group Limited (“the Company”) present the annual financial report for the Group, being parent entity and its subsidiaries, for the year ended 30 June 2015. In order to comply with the provisions of the Corporations Act 2001, the directors report as follows: The names and particulars of the directors of the Company during or since the beginning of the year are:
Michael Carter
Non–Executive Director and Chairman (initially appointed 10 March 2015 as Executive Director, appointed Non–Executive Chairman 10 August 2015). Michael Carter has over 25 years experience in financial services with previous executive roles at companies such as Macquarie Bank (now Macquarie Group), NRMA Insurance Group (now IAG) and Bridges Financial Services / IOOF Holdings. Michael was Managing Director at Bridges Financial Services, Executive Wealth Management and associated entities until April 2014 and was part of the Leadership Group at IOOF Holdings. Bridges was a Market Participant and a major financial planning organisation. Michael has a Bachelor of Engineering (Mining) from the University of New South Wales and Diploma of Financial Services. He is a member of the Australian Institute of Company Directors. Scott Beeton
Executive Director and Managing Director (appointed 24 December 2014). Scott Beeton has 17 years experience in the finance industry working in a variety of roles across Superannuation, funds management, investment management, stockbroking, AFSL dealer services & advice. Scott was appointed Managing Director of MDS in December 2014, following the approval for MDS to acquire Sequoia Financial Group and became CEO for the newly formed group. Scott is co-founder of Sequoia and has developed the capabilities of the various Sequoia businesses.
Scott has a Bachelor of Business from Newcastle University.
Marcel Collignon
Executive Director (appointed 24 December 2014).
Marcel Collignon was appointed as Executive Director in December 2014. Marcel is Founder and Managing Director of Sequoia Specialist Investments and is head of Investment Solutions at Sequoia. For 15 years Marcel, has worked in financial markets developing extensive experience in equities and derivatives, trading, portfolio management, superannuation and financial planning. Marcel holds a Bachelor of Commerce from the Australian National University, a Diploma of Financial Planning and ASX derivative accreditations. Delan Pagliaccio
Executive Director (appointed 10 August 2015). . Delan Pagliaccio brings considerable experience to MDS with over 15 years’ from the finance industry, specialising in stockbroking activities. He has previously held Directorships and Responsible Manager positions with a number of Australian stockbroking firms. Delan was previously head of derivatives trading operations at E*Trade Australia Securities Pty Ltd for almost 10 years and was responsible for managing one of the largest retail derivative books in Australia, managing order execution, real time risk, and margin calculations. Delan is a member of the Stockbrokers Association of Australia and the Australian Institute of Company Directors. Ms Jamie Gee Choo Khoo
Non-Executive Director (appointed 28 February 2012, resigned 13 January 2015). Mr Peter John Stirling
Non-Executive Director and Chairman (appointed 24 June 2013, appointed Chairman 21 January 2014, resigned 26 February 2015). Mr Bruce Richard Sydney Symon
Executive Director and Chairman (appointed 27 November 2008, appointment Executive Chairman 26 February 2015, resigned 10 August 2015).
For
per
sona
l use
onl
y
MDS Financial Group Limited - Annual Report 2015 15
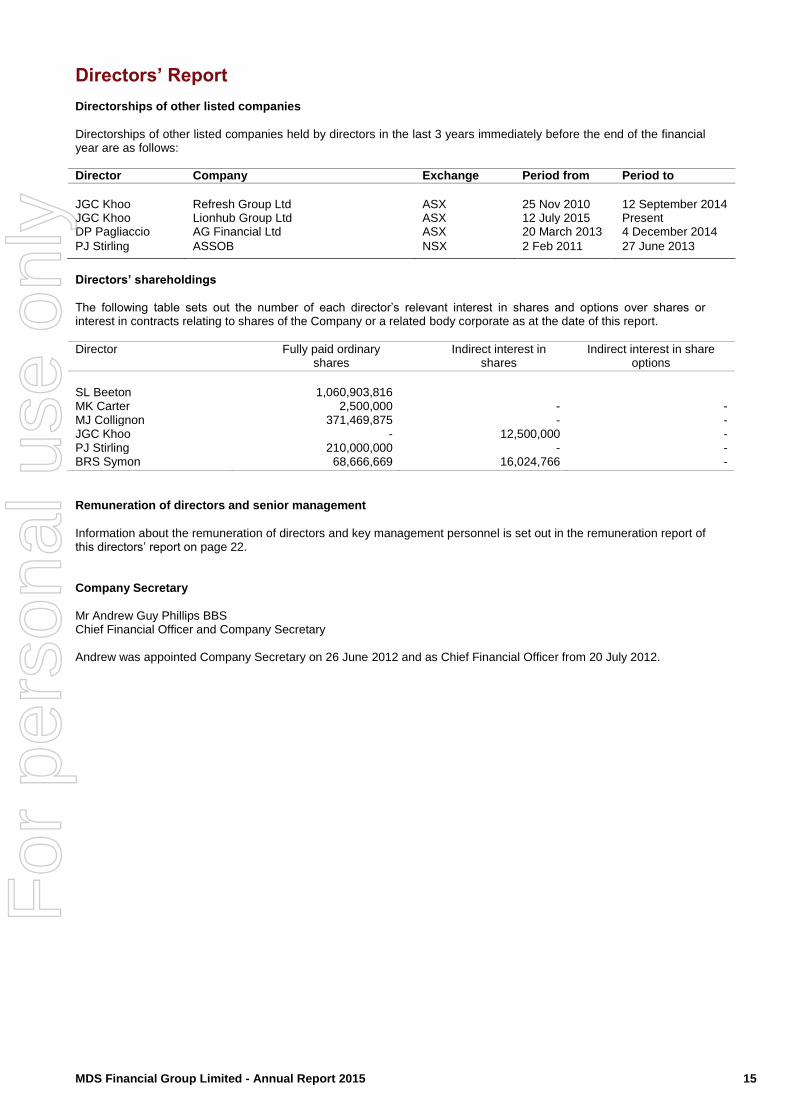
Directors’ Report Directorships of other listed companies
Directorships of other listed companies held by directors in the last 3 years immediately before the end of the financial year are as follows: Director Company Exchange Period from Period to
JGC Khoo JGC Khoo
Refresh Group Ltd Lionhub Group Ltd
ASX ASX
25 Nov 2010 12 July 2015
12 September 2014 Present
DP Pagliaccio AG Financial Ltd ASX 20 March 2013 4 December 2014
PJ Stirling ASSOB NSX 2 Feb 2011 27 June 2013
Directors’ shareholdings
The following table sets out the number of each director’s relevant interest in shares and options over shares or interest in contracts relating to shares of the Company or a related body corporate as at the date of this report.
Director Fully paid ordinary shares
Indirect interest in shares
Indirect interest in share options
SL Beeton 1,060,903,816 MK Carter 2,500,000 - - MJ Collignon 371,469,875 - - JGC Khoo - 12,500,000 - PJ Stirling 210,000,000 - - BRS Symon 68,666,669 16,024,766 -
Remuneration of directors and senior management
Information about the remuneration of directors and key management personnel is set out in the remuneration report of this directors’ report on page 22. Company Secretary
Mr Andrew Guy Phillips BBS Chief Financial Officer and Company Secretary Andrew was appointed Company Secretary on 26 June 2012 and as Chief Financial Officer from 20 July 2012.
For
per
sona
l use
onl
y

MDS Financial Group Limited - Annual Report 2015 16
Directors’ Report Principal Activities
On the 1 January 2015, the Group undertook a transaction which has resulted in a significant change to the company structure. The Group’s principal activities now offer diversified financial products, including but not limited to investment and superannuation produces, wealth management services and retail, wholesale and institutional trading platforms. Review of Operations
The consolidated operating net loss after income tax attributable to members is $17,974,212 (2014 profit: $345,892). The net loss result is largely attributed to the acquisition and cleansing process that followed the acquisition. On 4 February 2015, MDS Financial Group Limited announced to the market its intentions to acquire Sequoia Wealth Group Pty Ltd. As at the date of this directors’ report, the group still intends to acquire Sequoia Wealth Group Pty Ltd. The proposed transaction is currently under review by the appropriate Directors and Management. Furthermore, as it currently stands there is a security interest charge held over the company although the liability has been paid in full as at April 2015. The group is waiting on the security interest charge to be released. Change in the state of affairs
During the year the Group undertook a transaction which resulted in the reverse takeover by Sequoia Financial Group Ltd of MDS Financial Group Limited. Subsequent events
There have not been any matters or circumstance occurring subsequent to the end of the financial year that has significantly affected the operations of the Group, the results of those operations, or the state of affairs of the Group in future financial years. Future Developments
Disclosure of information regarding likely developments in the operations of the Group in future financial years and the expected results of those operations is likely to result in unreasonable prejudice to the Group. Accordingly, this information has not been disclosed in this report. Environmental regulation and performance
The Group’s operations are not involved in any activities that have a marked influence on the environment. As such, the directors are not aware of any material issues affecting the Group or its compliance with the relevant environment agencies or regulatory authorities. Dividends
There have been no dividends paid or provided for (2014: nil). Share options
As at the date of this report, there are nil (2014: nil) unissued ordinary shares of MDS Financial Group Limited under options. Indemnification and insurance of officers and auditors
During the financial year, the Company paid premiums based on normal commercial terms and conditions to insure all directors, officers and employees of the Group against the costs and expenses in defending claims brought against the individual while performing services for the Group. The premium paid has not been disclosed as it is subject to the confidentiality provisions of the insurance policy. The Company has not otherwise, during or since the financial year, except to the extent permitted by law, indemnified or agreed to indemnify an officer or auditor of the Company or of any related body corporate against a liability incurred as such an officer or auditor. The Company has previously entered into a Deed of Indemnity, Insurance and Access with each of its current directors; Mr Delan Pagliaccio, Mr Scott Beeton, Mr Michael Carter, Mr Marcel Collignon, and the following former directors; Mr Richard Symon, Ms Jamie Khoo, Mr Peter Stirling, Mr Jamie Schwartz, Mr Wayne Johnson, Mr Sean Rothsey, Mr Damian Isbister, Mr David Whitfield, Mr Allan Shek, Mr Alun Stevens, Mr Leon Hinde and Mr Barry Littler. The purpose of the Deed is to:
Confirm the indemnity provided by the Company in favour of Directors under the Company’s Constitution;
Include an obligation upon the Company to maintain adequate Directors and Officers liability insurance; and
Confirm the right of access to certain documents under the Corporations Act
For
per
sona
l use
onl
y
MDS Financial Group Limited - Annual Report 2015 17
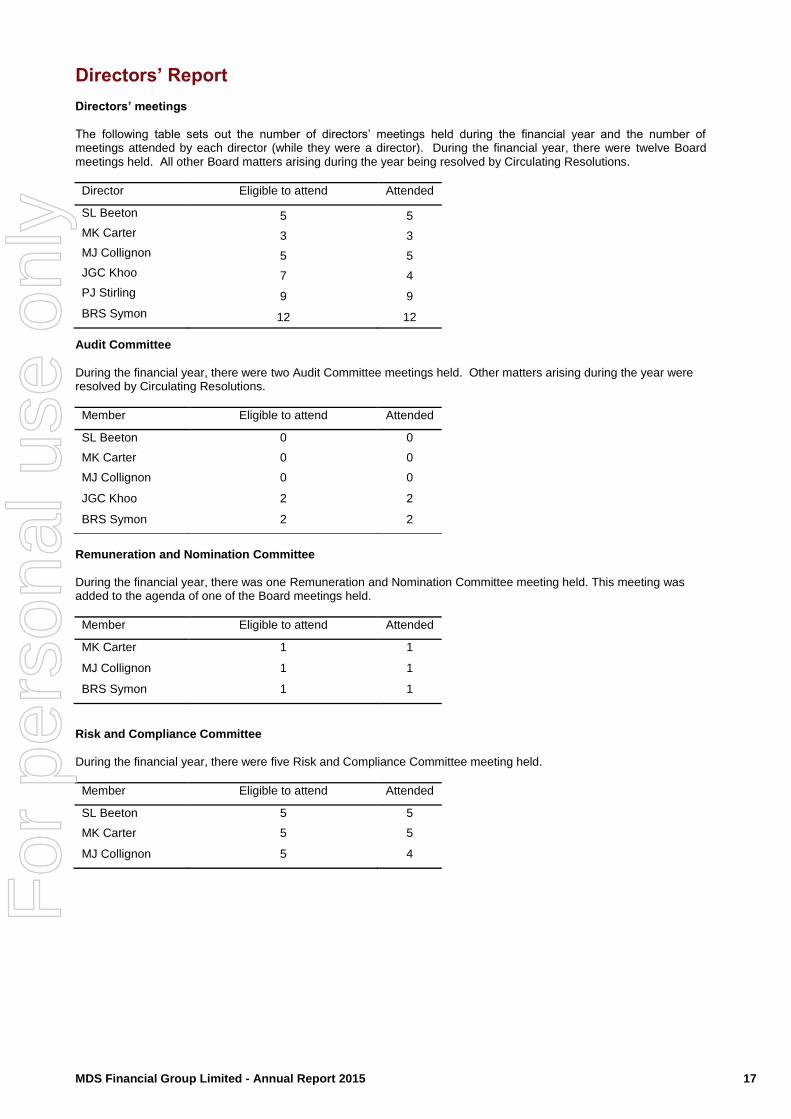
Directors’ Report Directors’ meetings
The following table sets out the number of directors’ meetings held during the financial year and the number of meetings attended by each director (while they were a director). During the financial year, there were twelve Board meetings held. All other Board matters arising during the year being resolved by Circulating Resolutions.
Director Eligible to attend Attended
SL Beeton 5 5
MK Carter 3 3
MJ Collignon 5 5
JGC Khoo 7 4
PJ Stirling 9 9
BRS Symon 12 12
Audit Committee
During the financial year, there were two Audit Committee meetings held. Other matters arising during the year were resolved by Circulating Resolutions.
Member Eligible to attend Attended
SL Beeton 0 0
MK Carter 0 0
MJ Collignon 0 0
JGC Khoo 2 2
BRS Symon 2 2
Remuneration and Nomination Committee
During the financial year, there was one Remuneration and Nomination Committee meeting held. This meeting was added to the agenda of one of the Board meetings held.
Member Eligible to attend Attended
MK Carter 1 1
MJ Collignon 1 1
BRS Symon 1 1
Risk and Compliance Committee
During the financial year, there were five Risk and Compliance Committee meeting held.
Member Eligible to attend Attended
SL Beeton 5 5
MK Carter 5 5
MJ Collignon 5 4
F
or p
erso
nal u
se o
nly

MDS Financial Group Limited - Annual Report 2015 18
Directors’ Report Non-audit services
Details of amounts paid or payable to the auditor for non-audit services provided during the year by the auditor are outlined in note 22 to the financial statements. Engagement services include the review of financial reports for the Group consolidated accounts, the review of three of the subsidiaries licences and corresponding financial reports and for tax related services for all entities within the Group. The financial costs for the year ended June 2015 for all auditor engaged services are as follows; Audit services Audit or review of the financial report, including licences 86,000
Other services
Tax services 20,000
106,000
The directors are satisfied that the provision of non-audit services in the form of tax compliance services, during the year, by the auditor (or another person or firm on the auditors’ behalf) is compatible with the general standard of independence for auditors imposed by the Corporations Act 2001. The directors are of the opinion that the services as disclosed in note 22 to the financial statements do not compromise the external auditor’s independence, based on advice received from the audit committee, for the following reasons:
all non-audit services have been reviewed and approved to ensure that they do not impact the integrity and objectivity of the auditor; and,
none of the services undermine the general principles relating to auditor independence as set out in Code of Conduct APES 110 Code of Ethics for Professional Accountants issued by the Accounting Professional & Ethical Standards Board, including reviewing or auditing the auditors own work, acting in a management or decision making capacity for the company, acting as advocate for the company or jointly sharing economic risks and rewards.
Officers of the company who are former audit partners of Hall Chadwick
There are no officers of the company who are former audit partners of Hall Chadwick. Auditor’s independence declaration
The auditor’s independence declaration is included on page 25 of the financial report and forms part of the Directors’ Report for the year ended 30 June 2015.
For
per
sona
l use
onl
y

MDS Financial Group Limited - Annual Report 2015 19
Directors’ Report Summary of Results Operating Performance
The net loss result is largely attributed to the acquisition and cleansing process that followed the acquisition. Cash Flow
Financial Position
Year ended 30 June 2015 $’000
Restated 2014 * $’000
Operating cash flow (1,762) 219
Investing cash flow (287) (1,497)
Financing cash flow 865 302
Net decrease in cash (1,183) (976)
Opening cash 1,459 -
Cash received on acquisition 337 2,435
Closing cash 614 1,459
As at 30 June 2015 $’000
Restated 2014 * $’000
Total current assets 18,427 18,597
Total non-current assets 16,069 25,902 Total assets 34,496 44,499
Total current liabilities 20,459 18,305
Total non-current liabilities 7,381 10,424 Total liabilities 27,841 28,729
Net assets 6,655 15,770
The Company recorded a statutory loss of $17.9 million for the 2015 financial year. However, this result was largely due to one-off write downs of goodwill associated with the vend in of Sequoia to MDS. Through the acquisition of Sequoia, the Company has greatly enhanced and broadened its revenue streams, with six distinct product offerings being, trading and execution services, software subscription services, capital markets advisory, self managed super funds administration services, wealth advisory and investment solutions. Due to the enhanced product offing the combined group has increased year on year revenue by 9.7%. While operating expenses for the 2015 financial year increased compared to the previous period, this is primarily a reflection of the newly combined entity and the breadth of its operations. The significant increase in staffing costs is a result of one off costs associated with a comprehensive redundancy program that was finalised during the period, while the increase in administrative expenses is largely associated with the Sequoia acquisition.
The consolidated entity incurred an operating outflow of $1,761,525 for the year ended 30 June 2015 (2014: $218,587).
Restatement of prior year results
All revenue and expenditure in relation to financial product including interest income and option premium are
recognised in the income statement over the expected life of the instrument, which was a restatement to prior
treatment. The main restated items for the prior period are as follows; deferred costs, intangible assets, deferred
revenue, deferred tax assets, deferred tax liabilities and accumulated profit and loss.
* Refer to note 1(v)(i)
Year ended 30 June 2015 $’000
Restated 2014 * $’000
Revenue 21,406 19,509 Expenses (39,728) (18,988) (Loss) / Profit before tax (18,322) 520
Tax expense 347 (174)
(Loss) / Profit after tax (17,974) 346
For
per
sona
l use
onl
y
MDS Financial Group Limited - Annual Report 2015 20
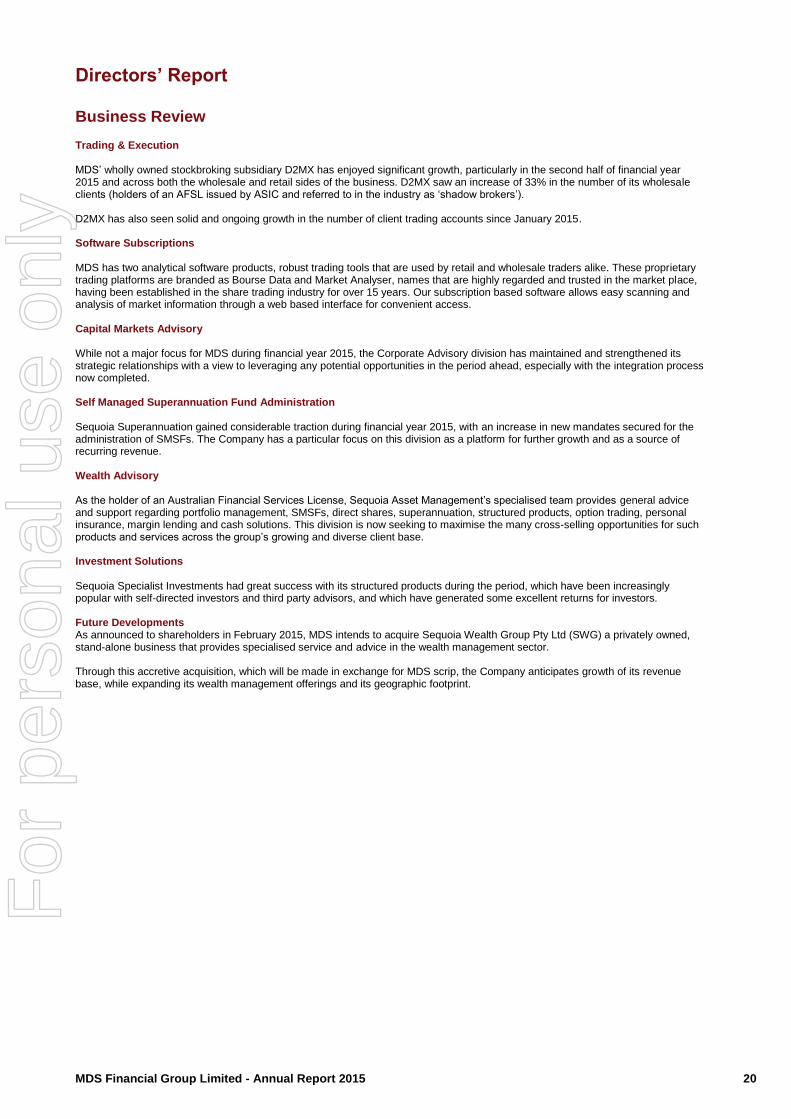
Directors’ Report Business Review Trading & Execution MDS’ wholly owned stockbroking subsidiary D2MX has enjoyed significant growth, particularly in the second half of financial year 2015 and across both the wholesale and retail sides of the business. D2MX saw an increase of 33% in the number of its wholesale clients (holders of an AFSL issued by ASIC and referred to in the industry as ‘shadow brokers’). D2MX has also seen solid and ongoing growth in the number of client trading accounts since January 2015. Software Subscriptions MDS has two analytical software products, robust trading tools that are used by retail and wholesale traders alike. These proprietary trading platforms are branded as Bourse Data and Market Analyser, names that are highly regarded and trusted in the market place, having been established in the share trading industry for over 15 years. Our subscription based software allows easy scanning and analysis of market information through a web based interface for convenient access. Capital Markets Advisory While not a major focus for MDS during financial year 2015, the Corporate Advisory division has maintained and strengthened its strategic relationships with a view to leveraging any potential opportunities in the period ahead, especially with the integration process now completed. Self Managed Superannuation Fund Administration Sequoia Superannuation gained considerable traction during financial year 2015, with an increase in new mandates secured for the administration of SMSFs. The Company has a particular focus on this division as a platform for further growth and as a source of recurring revenue. Wealth Advisory As the holder of an Australian Financial Services License, Sequoia Asset Management’s specialised team provides general advice and support regarding portfolio management, SMSFs, direct shares, superannuation, structured products, option trading, personal insurance, margin lending and cash solutions. This division is now seeking to maximise the many cross-selling opportunities for such products and services across the group’s growing and diverse client base. Investment Solutions Sequoia Specialist Investments had great success with its structured products during the period, which have been increasingly popular with self-directed investors and third party advisors, and which have generated some excellent returns for investors. Future Developments As announced to shareholders in February 2015, MDS intends to acquire Sequoia Wealth Group Pty Ltd (SWG) a privately owned, stand-alone business that provides specialised service and advice in the wealth management sector. Through this accretive acquisition, which will be made in exchange for MDS scrip, the Company anticipates growth of its revenue base, while expanding its wealth management offerings and its geographic footprint.
For
per
sona
l use
onl
y

MDS Financial Group Limited - Annual Report 2015 21
Directors’ Report MDS Financial Group Limited ABN 90 091 744 884 Remuneration Report (audited) The remuneration report, which has been audited, outlines the director and executive remuneration arrangements for the consolidated entity and the company, in accordance with the requirements of the Corporations Act 2001 and its Regulations. The remuneration report is set out under the following main headings:
A. Director and senior management details B. Remuneration policies C. Remuneration of directors and senior management D. Additional information
A. Director and senior management details
Mr Scott Lionel Beeton Managing Executive Director, appointed 24 December 2014
Mr Michael Kenneth Carter Executive Director, appointed 10 March 2015, appointed Non-Executive Chairman 10 August 2015
Ms Jamie Gee Choo Khoo Independent Non-Executive Director, resigned 13 January 2015
Mr Marcel John Collignon Executive Director, appointed 24 December 2014
Mr Peter John Stirling Non-Executive Director and Chairman, resigned 26 February 2015
Mr Bruce Richard Sydney Symon Executive Director, resigned 10 August 2015
In addition to the directors noted above, the following persons represent the senior management of the Group during the year:
B. Remuneration policies
The performance of the Group depends upon the quality of its directors and executives. The Group recognises the need to attract, motivate and retain highly skilled directors and executives. The Board of Directors, through its Remuneration Committee, accepts responsibility for determining and reviewing remuneration arrangements for the directors and the senior management team. The Remuneration Committee assesses the appropriateness of the nature and amount of remuneration of directors and senior managers on a periodic basis by reference to relevant employment market conditions, giving due consideration to the overall profitability and financial resources of the Group, with the objective of ensuring maximum stakeholder benefit from the retention of a high quality Board and executive team. The Board proposes to review reward structures and the remuneration arrangements for Directors and executives in conjunction with a return to profitability. Non-executive director remuneration Fees and payments to non-executive directors reflect the demands which are made of the directors in fulfilling their responsibilities. Non-executive director fees are reviewed annually by the Board. The constitution of the Company provides that the non-executive directors of the company are entitled to such remuneration, as determined by the Board, which must not exceed in aggregate the maximum amount determined by the Company in general meeting. The most recent determination was at the Annual General Meeting held on 15 December 2006 where the shareholders approved an aggregate remuneration of $200,000. Senior management and executive director remuneration Executive remuneration comprises:
Fixed remuneration component
Variable remuneration component including short-term incentive (STI) and long-term incentive (LTI). Fixed remuneration
Fixed remuneration consists of base remuneration as well as employer contributions to superannuation. Remuneration levels are reviewed annually through a process that considers individual performance and that of the overall Group.
Mr Craig Bradley Foley Chief Information Officer
Mr Andrew Guy Phillips Chief Financial Officer and Company Secretary
For
per
sona
l use
onl
y
MDS Financial Group Limited - Annual Report 2015 22
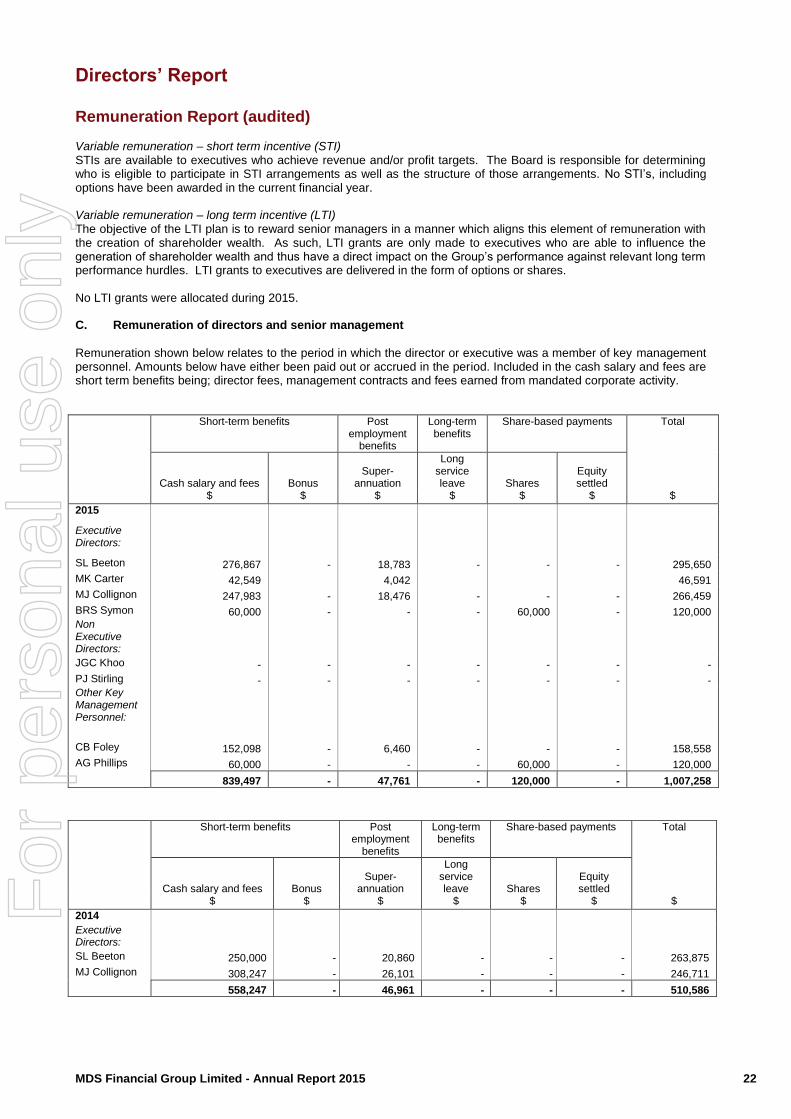
Directors’ Report Remuneration Report (audited) Variable remuneration – short term incentive (STI) STIs are available to executives who achieve revenue and/or profit targets. The Board is responsible for determining who is eligible to participate in STI arrangements as well as the structure of those arrangements. No STI’s, including options have been awarded in the current financial year. Variable remuneration – long term incentive (LTI) The objective of the LTI plan is to reward senior managers in a manner which aligns this element of remuneration with the creation of shareholder wealth. As such, LTI grants are only made to executives who are able to influence the generation of shareholder wealth and thus have a direct impact on the Group’s performance against relevant long term performance hurdles. LTI grants to executives are delivered in the form of options or shares. No LTI grants were allocated during 2015. C. Remuneration of directors and senior management
Remuneration shown below relates to the period in which the director or executive was a member of key management personnel. Amounts below have either been paid out or accrued in the period. Included in the cash salary and fees are short term benefits being; director fees, management contracts and fees earned from mandated corporate activity.
Short-term benefits Post employment
benefits
Long-term benefits
Share-based payments Total
Cash salary and fees Bonus Super-
annuation
Long service leave Shares
Equity settled
$ $ $ $ $ $ $
2015
Executive Directors:
SL Beeton 276,867 - 18,783 - - - 295,650
MK Carter 42,549 4,042 46,591
MJ Collignon 247,983 - 18,476 - - - 266,459
BRS Symon 60,000 - - - 60,000 - 120,000 Non Executive Directors:
JGC Khoo - - - - - - -
PJ Stirling - - - - - - - Other Key Management Personnel:
CB Foley 152,098 - 6,460 - - - 158,558
AG Phillips 60,000 - - - 60,000 - 120,000
839,497 - 47,761 - 120,000 - 1,007,258
Short-term benefits Post employment
benefits
Long-term benefits
Share-based payments Total
Cash salary and fees Bonus Super-
annuation
Long service leave Shares
Equity settled
$ $ $ $ $ $ $
2014
Executive Directors:
SL Beeton 250,000 - 20,860 - - - 263,875
MJ Collignon 308,247 - 26,101 - - - 246,711
558,247 - 46,961 - - - 510,586
For
per
sona
l use
onl
y

MDS Financial Group Limited - Annual Report 2015 23
Directors’ Report
Remuneration Report (audited) The proportion of remuneration linked to performance and the fixed proportion are as follows:
Fixed remuneration
At risk - STI
At risk - LTI
Name 2015 2014 2015 2014 2015 2014 $ $ $ $ $ $
Executive Directors:
SL Beeton 100% 100% -% -% -% -%
MK Carter 100% -% -% -% -% -%
MJ Collignon 100% 100% -% -% -% -%
BRS Symon 100% -% -% -% -% -%
Non-Executive Directors:
JGC Choo 100% -% -% -% -% -%
PJ Stirling 100% -% -% -% -% -%
Other Key Management Personal
CB Foley 100% -% -% -% -% -%
AG Phillips 100% -% -% -% -% -%
There is no link between remuneration and the market price of the Company’s shares. Shareholding The number of shares in the parent entity held during the financial year by each director and other members of key management personnel of the consolidated entity, including their personally related parties is set out below; 30 June 2015 Balance at the
start of the year
Received as part of remuneration
Additions Disposals/ other
Balance at the end of the year
S Beeton 143,569,687 - 937,403,467 20,069,338 1,060,903,816 M Carter - - 2,500,000 - 2,500,000 M Collignon 15,099,451 - 356,370,424 - 371,469,875 J Khoo - - 12,500,000 - 12,500,000 R Symon 68,666,669 8,571,429 7,453,337 - 84,691,435 P Stirling 210,000,000 - - - 210,000,000 C Foley 114,242 - - - 114,242 A Phillips 60,000 8,571,429 23,494,000 - 32,071,429
473,510,049 17,142,858 1,303,727,228 20,069,338 1,774,310,797
30 June 2014 Balance at the start of the year
Received as part of remuneration
Additions Disposals/ other
Balance at the end of the year
S Beeton - - 143,569,687 - 143,569,687 M Collignon - - 15,099,451 - 15,099,451
- - 158,669,138 - 158,669,138
Option holding The number of options over ordinary shares in the parent entity held during the financial year by each director and other members of key management personnel of the consolidated entity. There were no options granted in the current financial or the corresponding prior year. Key terms of employment contracts Where contracts have been established, employment terms and conditions of key management personnel and Group executives are formalised in standard contracts of employment. All contracts are for no fixed term with 1 to 3 months notice required for termination by either party. Currently not all key management personal have formal contracts, however this will be put into place.
For
per
sona
l use
onl
y
MDS Financial Group Limited - Annual Report 2015 24
Directors’ Report
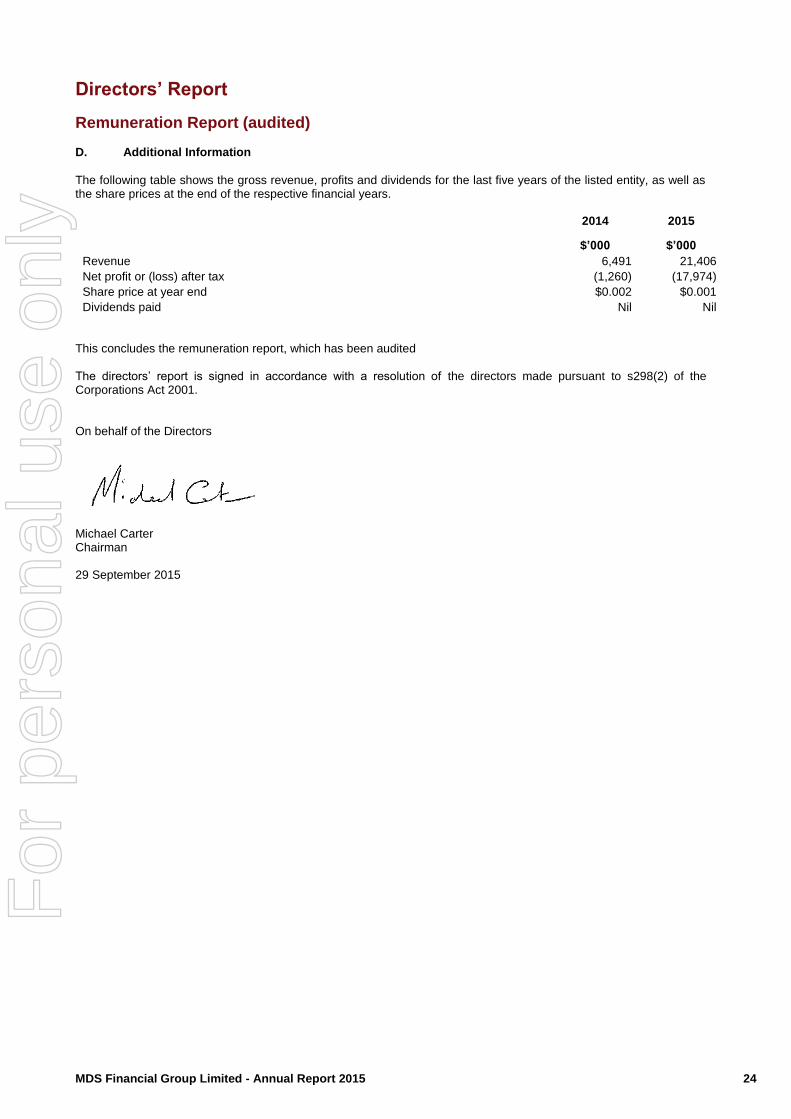
Remuneration Report (audited) D. Additional Information
The following table shows the gross revenue, profits and dividends for the last five years of the listed entity, as well as the share prices at the end of the respective financial years.
2014 2015
$’000 $’000
Revenue 6,491 21,406
Net profit or (loss) after tax (1,260) (17,974)
Share price at year end $0.002 $0.001
Dividends paid Nil Nil
This concludes the remuneration report, which has been audited The directors’ report is signed in accordance with a resolution of the directors made pursuant to s298(2) of the Corporations Act 2001. On behalf of the Directors
Michael Carter Chairman 29 September 2015
For
per
sona
l use
onl
y
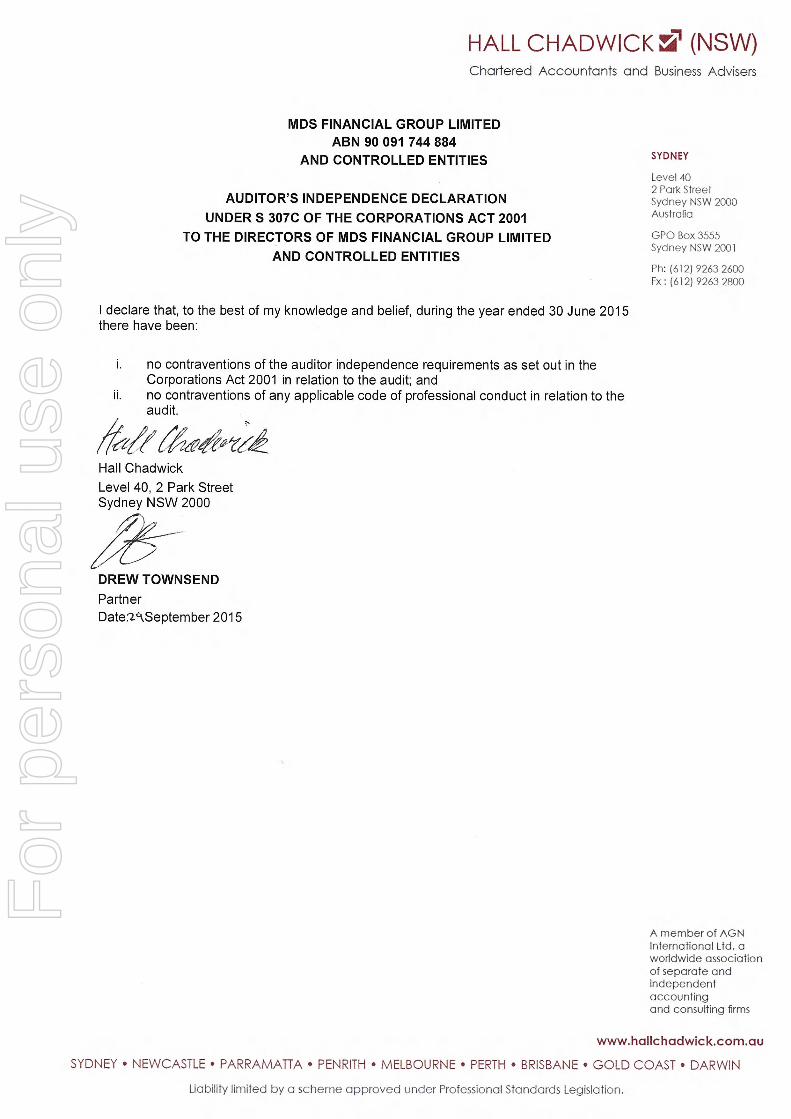
HALL CHADWICK a (NSW) Chartered Accountants and Business Advisers
MDS FINANCIAL GROUP LIMITED ABN 90 091 744 884
AND CONTROLLED ENTITIES
AUDITOR'S INDEPENDENCE DECLARATION UNDER S 307C OF THE CORPORATIONS ACT 2001
TO THE DIRECTORS OF MDS FINANCIAL GROUP LIMITED AND CONTROLLED ENTITIES
I declare that, to the best of my knowledge and belief, during the year ended 30 June 2015 there have been:
SYDNEY
Level 40 2 Park Street Sydney NSW 2000 Australia
GPO Box 3555 Sydney NSW 2001
Ph: (612) 9263 2600 Fx : (612) 9263 2800
i. no contraventions of the auditor independence requirements as set out in the Corporations Act 2001 in relation to the audit; and
ii. no contraventions of any applicable code of professional conduct in relation to the audit.
gerelealr4 Hall Chadwick
Level 40, 2 Park Street Sydney NSW 2000
DREW TOWNSEND Partner Date:VkSeptember 2015
A member of AGN International Ltd, a worldwide association of separate and independent accounting and consulting firms
www.hallchadwick.com.au
SYDNEY • NEWCASTLE • PARRAMATTA • PENRITH • MELBOURNE • PERTH • BRISBANE • GOLD COAST • DARWIN
Liability limited by a scheme approved under Professional Standards Legislation.
For
per
sona
l use
onl
y
MDS Financial Group Limited - Annual Report 2015 26
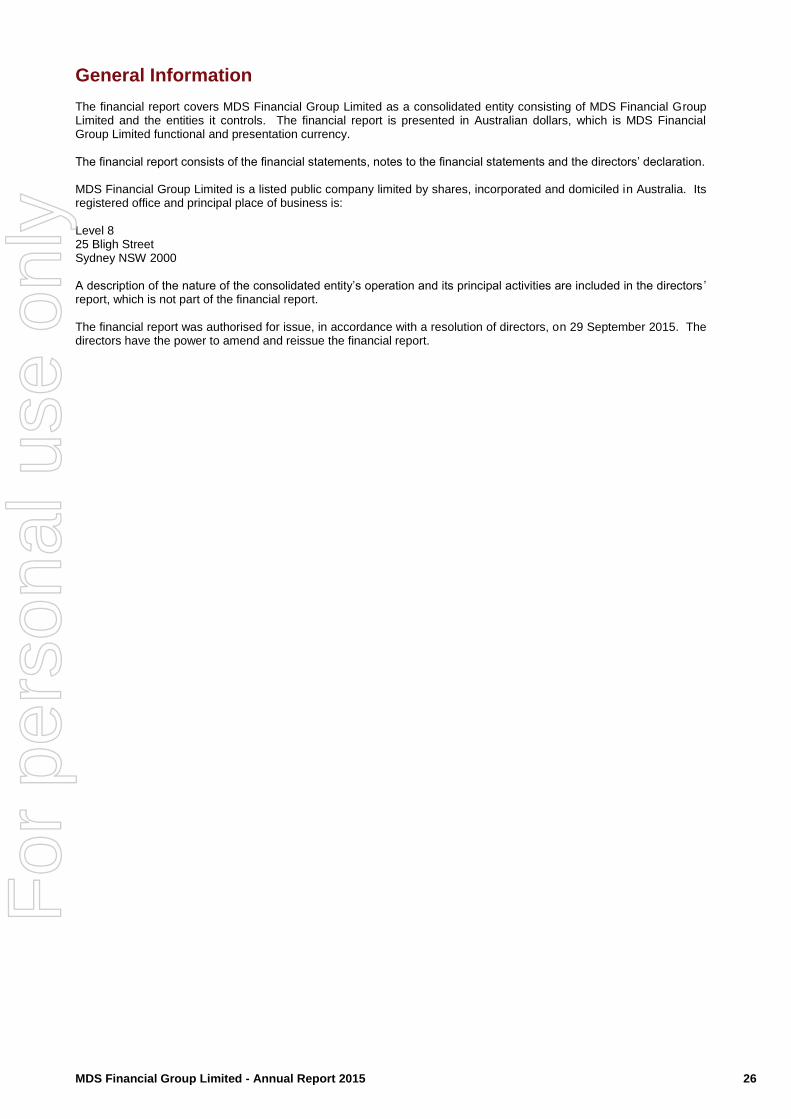
General Information The financial report covers MDS Financial Group Limited as a consolidated entity consisting of MDS Financial Group Limited and the entities it controls. The financial report is presented in Australian dollars, which is MDS Financial Group Limited functional and presentation currency. The financial report consists of the financial statements, notes to the financial statements and the directors’ declaration. MDS Financial Group Limited is a listed public company limited by shares, incorporated and domiciled in Australia. Its registered office and principal place of business is: Level 8 25 Bligh Street Sydney NSW 2000 A description of the nature of the consolidated entity’s operation and its principal activities are included in the directors ’ report, which is not part of the financial report. The financial report was authorised for issue, in accordance with a resolution of directors, on 29 September 2015. The directors have the power to amend and reissue the financial report.
For
per
sona
l use
onl
y

MDS Financial Group Limited - Annual Report 2015 27
Consolidated Statement of Profit or Loss and Other Comprehensive Income For the year ended 30 June 2015 Note Consolidated
2015 Restated 2014 *
$ $
Revenue 4 21,406,293 19,509,124
Expenses
Data fees (575,189) -
Dealing and settlement (2,098,539) -
Payments to investors (9,690,353) (12,223,777)
Commission and hedging (4,773,828) (3,212,728)
Employee benefits 5a (2,814,908) (1,122,704)
Occupancy (307,135) -
Telecommunications (135,299) -
Marketing (245,994) -
Depreciation 5b (69,071) (16,257)
Impairment 5d (17,061,524) (73,252)
Other expenses (1,956,036) (2,339,635)
(Loss) / Profit before income tax from continuing operations (18,321,583) 520,771
Income tax benefit/(expense) 6a 347,371 (174,879)
(Loss) / Profit from continuing operations Other comprehensive income
(17,974,212) 345,892
Fair value gains on available-for-sale financial assets, net of tax - (482,765)
Total other comprehensive income (17,974,212) (136,873)
Total comprehensive income for the year
Net (Loss) / Profit attributable to parent entity (17,974,212) 345,892
Total comprehensive income attributable to parent entity (17,974,212) (136,873)
Cents Cents
Earnings per share for loss attributable to the owners of MDS Financial Group Limited
Basic earnings per share 30 (40.00) 2.16
Diluted earnings per share 30 (40.00) 2.16
All potential ordinary shares, being options to acquire ordinary shares are not considered dilutive, as the exercise of the options would decrease the basic loss per share. * Refer to note 1(v)(i)
The above statement of comprehensive income should be read in conjunction with the accompanying notes.
For
per
sona
l use
onl
y

MDS Financial Group Limited - Annual Report 2015 28
Consolidated Statement of Financial Position As at 30 June 2015 Note Consolidated
2015 Restated 2014 *
$ $
Assets
Cash and cash equivalents 7 613,527 1,459,019
Trade and other receivables 8 2,582,290 3,796,227
Financial assets at fair value through profit or loss 9 10,890,326 13,172,281
Income tax receivable 6b 10,529 -
Other assets 10 152,805 104,600
Deferred Costs 11 4,177,366 64,657
Total current assets 18,426,843 18,596,784
Financial assets 12 1,213,248 1,211,844
Plant and equipment 13 30,349 45,263
Intangible assets 14 7,655,166 15,035,881
Deferred tax assets 6 3,321,786 2,672,325
Other assets 10 1,088,507 -
Deferred costs 11 2,759,619 6,936,985
Total non-current assets 16,068,675 25,902,298
Total assets 34,495,518 44,499,082
Trade and other payables 15 4,181,572 4,309,117
Financial liabilities 9 10,890,326 13,172,281
Provision for income tax 6b - 735,035
Employee benefits 18 267,721 50,477
Deferred revenue 17 5,119,825 37,825
Total current liabilities 20,459,444 18,304,735
Borrowings 16 1,860,000 -
Employee benefits 18 13,107 39,163
Deferred tax liability 6 2,204,782 2,100,493
Deferred revenue 17 3,303,385 8,284,604
Total non-current liabilities 7,381,274 10,424,260
Total liabilities 27,840,718 28,728,995
Net assets 6,654,800 15,770,087
Equity
Contributed equity 19 24,765,885 15,906,960
Reserves 19 (482,765) (482,765)
Accumulated losses (17,628,320) 345,892
Total equity 6,654,800 15,770,087
* Refer to note 1(v)(i)
The above statement of financial position should be read in conjunction with the accompanying notes.
For
per
sona
l use
onl
y
MDS Financial Group Limited - Annual Report 2015 29
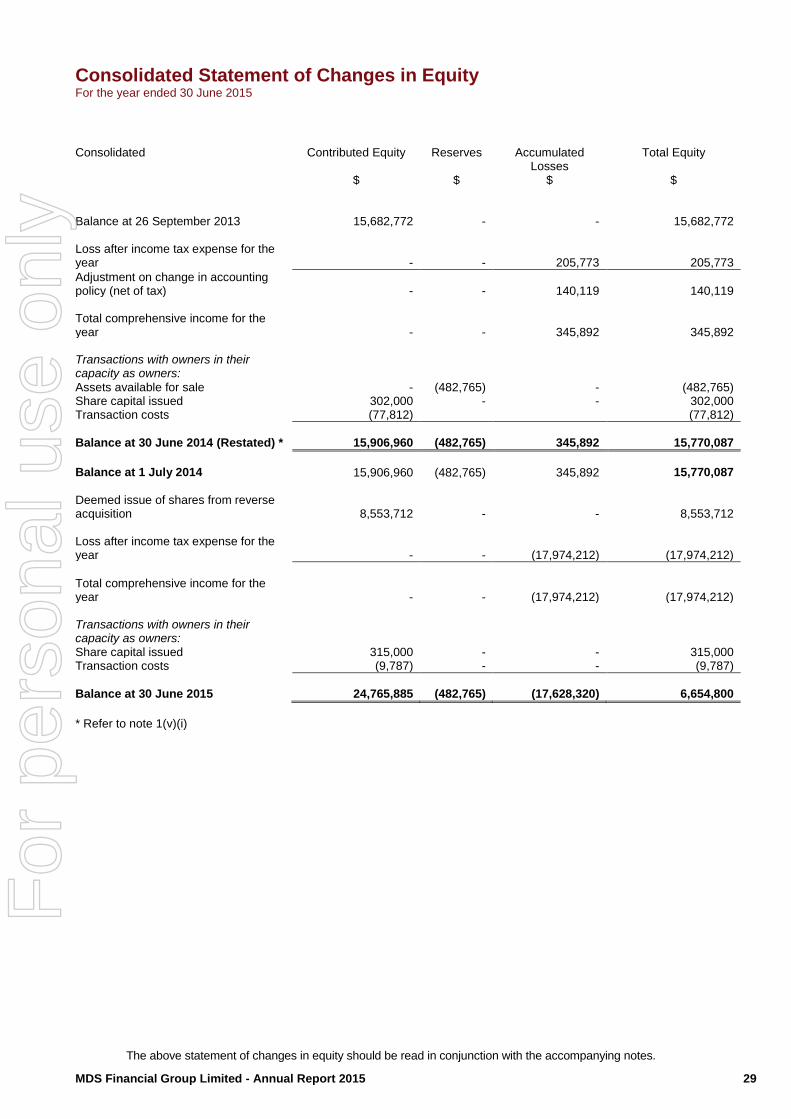
Consolidated Statement of Changes in Equity For the year ended 30 June 2015
Consolidated Contributed Equity Reserves Accumulated
Losses Total Equity
$
$ $ $
Balance at 26 September 2013 15,682,772 - - 15,682,772 Loss after income tax expense for the year - - 205,773 205,773
Adjustment on change in accounting policy (net of tax) - - 140,119 140,119 Total comprehensive income for the year - - 345,892 345,892 Transactions with owners in their capacity as owners: Assets available for sale - (482,765) - (482,765) Share capital issued 302,000 - - 302,000 Transaction costs (77,812) (77,812)
Balance at 30 June 2014 (Restated) * 15,906,960 (482,765) 345,892 15,770,087
Balance at 1 July 2014 15,906,960 (482,765) 345,892 15,770,087
Deemed issue of shares from reverse acquisition 8,553,712 - - 8,553,712 Loss after income tax expense for the year - - (17,974,212) (17,974,212)
Total comprehensive income for the year - - (17,974,212) (17,974,212) Transactions with owners in their capacity as owners: Share capital issued 315,000 - - 315,000 Transaction costs (9,787) - - (9,787)
Balance at 30 June 2015 24,765,885 (482,765) (17,628,320) 6,654,800
* Refer to note 1(v)(i)
The above statement of changes in equity should be read in conjunction with the accompanying notes.
For
per
sona
l use
onl
y

MDS Financial Group Limited - Annual Report 2015 30
Consolidated Statement of Cash Flows For the year ended 30 June 2015
Note Consolidated
2015 2014
$ $
Cash flows from operating activities
Cash receipts from customers 22,876,588 14,619,993 Cash paid to suppliers and employers (23,588,375) (14,308,387) Interest received 13,493 16,331 Interest paid (119,866) (392) Income tax paid (943,365) (108,958)
Net Cash used in operating activities 29 (1,761,525) 218,587
Cash flows from investing activities Purchase of available for sale assets (150,000) - Payment for other assets (136,633) (1,496,573)
Net cash received from investing activities (286,633) (1,496,573)
Cash flows from financing activities Proceeds from borrowings 560,000 - Proceeds from issue of securities net of costs 305,212 302,000
Net cash provided by financing activities 865,212 302,000
Net decrease in cash and cash equivalents (1,182,946) (975,896) Cash acquired from subsidiary on acquisition 337,454 2,435,005 Cash and cash equivalents at 1 July 1,459,019 -
Cash and cash equivalents at 30 June 613,527 1,459,019
* Refer to note 1(v)(i)
The above statement of cash flows should be read in conjunction with the accompanying notes.
For
per
sona
l use
onl
y

MDS Financial Group Limited - Annual Report 2015 31
Notes to the Financial Statements Note 1. Summary of Significant Accounting Policies
The principal accounting policies adopted in the preparation of the financial statements have been consistently applied to all the years presented. The financial statements are those of the consolidated entity consisting of MDS Financial Group Limited and its controlled entities. Separate financial statements of MDS Financial Group Limited as an individual entity are no longer presented as a consequence of a change to the Corporations Act 2001, however limited financial information on MDS Financial Group Limited as an individual entity is included in note 27.
a) Basis of Preparation
The financial statements are general purpose financial statements that have been prepared in accordance with Australian Accounting Standards, Australian Accounting Interpretations, other authoritative pronouncements of the Australian Accounting Standards Board and the Corporations Act 2001. The Group is a for-profit entity for financial reporting purposes under Australian Accounting Standards. Australian Accounting Standards set out accounting policies that the Australian Accounting Standards Board has concluded would result in financial statements containing relevant and reliable information about transactions, events and conditions. Compliance with Australian Accounting Standards ensures that the financial statements and notes also comply with International Financial Reporting Standards as issued by the IASB. Material accounting policies adopted in the preparation of these financial statements are presented below and have been consistently applied unless stated otherwise. Except for cash flow information, the financial statements have been prepared on an accruals basis and are based on historical costs, modified, where applicable, by the measurement at fair value of selected non-current assets, financial assets and financial liabilities. Historical cost convention The financial statements have been prepared under the historical cost convention, except for, where applicable, the revaluation of available-for-sale financial assets, financial assets and liabilities at fair value through profit or loss, certain classes of property, plant and equipment and derivative financial instruments. Critical accounting estimates The preparation of the financial statements requires the use of certain critical accounting estimates. It also requires management to exercise its judgement in the process of applying the consolidated entity’s accounting policies. The areas involving a higher degree of judgement or complexity, or areas where assumptions and estimates are significant to the financial statements, are disclosed in note 1 (v)(i).
b) Going concern
The financial report shows that for year ended 30 June 2015 the consolidated entity has a loss attributable to members of $17,974,212 and a negative cash flow from operating cash flows of $1,761,525. The loss was due to a combination of the impairment of goodwill on acquisition as well as further impairments as part of a cleansing process.
At balance date the consolidated entity has a current asset deficiency of $2,032,601and a net tangible asset deficiency of $2,117,370. These conditions indicate a material uncertainty that may cast significant doubt about the consolidated entity’s ability to continue as a going concern (However improvement in business performance is reducing this uncertainty).
The ability of the consolidated entity to continue as a going concern is dependent upon a number of critical factors, one being the continuation and availability of funds. To this end the consolidated entity is expecting to fund its obligations beyond the reported working capital position as follows:
Stemming from the acquisition the Group has additional revenue channels and business units.
The consolidated entity is managing its outstanding creditors. At the date of signing the financial report payments are being made to creditors as funds become available. A number of the creditor payment arrangements are expected to be finalised in the early half of the 2016 financial year. The Company has performed significant cost saving measures during the year, including redundancy payments to long serving staff members.
New revenue generating wholesale arrangements have been established in June 2015, the positive impact of these relationships have been seen in the June and July 2015 revenue numbers, with continued performance expected for the 2016 financial year. The company has significantly increased the bond deposit held with our third party clearer to $1,000,000. The increased bond deposit relates to increased trading volumes from these new wholesale groups.
For
per
sona
l use
onl
y

MDS Financial Group Limited - Annual Report 2015 32
Notes to the Financial Statements
Note 1. Summary of Significant Accounting Policies (continued)
The Company owns 11.56% of Finance News Network. The Company carries this asset at minimal value on the balance sheet; however internal valuations conducted suggest that this asset has a significantly greater value which may be realised in the future. The company further holds 1,320,167 shares in NobleOak Life Ltd which have been valued at cost.
New shares amounting to $124,316 have been issued in the month of August 2015; these shares have converted old liabilities and have increased current strategic share holdings in privately owned companies.
Cash flow forecasts prepared by management demonstrate the consolidated entity has sufficient cash flows to meet its commitments over the next 12 months based on the above factors. For that reason the financial statements have been prepared on the basis that the consolidated entity is a going concern, which contemplates the continuity of normal business activity, realisation of assets and settlement of liabilities in the normal course of business. c) Principles of Consolidation
The consolidated financial statements incorporate all of the assets, liabilities and results of the parent MDS Financial Group Limited and all of the subsidiaries (including any structured entities). Subsidiaries are entities the parent controls. The parent controls an entity when it is exposed to, or has rights to, variable returns from its involvement with the entity and has the ability to affect those returns through its power over the entity. A list of the subsidiaries is provided in Note 28. The assets, liabilities and results of all subsidiaries are fully consolidated into the financial statements of the Group from the date on which control is obtained by the Group. The consolidation of a subsidiary is discontinued from the date that control ceases. Intercompany transactions, balances and unrealised gains or losses on transactions between group entities are fully eliminated on consolidation. Accounting policies of subsidiaries have been changed and adjustments made where necessary to ensure uniformity of the accounting policies adopted by the Group.
Equity interests in a subsidiary not attributable, directly or indirectly, to the Group are presented as “non-controlling interests”. The Group initially recognises non-controlling interests that are present ownership interests in subsidiaries and are entitled to a proportionate share of the subsidiary’s net assets on liquidation at either fair value or at the non-controlling interests’ proportionate share of the subsidiary’s net assets. Subsequent to initial recognition, non-controlling interests are attributed their share of profit or loss and each component of other comprehensive income. Non-controlling interests are shown separately within the equity section of the statement of financial position and statement of comprehensive income.
For
per
sona
l use
onl
y
MDS Financial Group Limited - Annual Report 2015 33
Notes to the Financial Statements Note 1. Summary of Significant Accounting Policies (continued)
The consolidated financial statements have been prepared using reverse acquisition accounting. In reverse acquisition accounting, the cost of business combination is deemed to have been incurred by the legal subsidiary Sequoia Financial Group Limited (the acquirer for accounting purposes) in the form of equity instruments issued to the owners of the legal parent, MDS Financial Group Limited (the acquiree for accounting purposes). d) Foreign currency translation
The financial report is presented in Australian dollars, which is MDS Financial Group Limited’s functional and presentation currency. e) Business combinations
Business combinations occur where an acquirer obtains control over one or more businesses. A business combination is accounted for by applying the acquisition method, unless it is a combination involving entities or businesses under common control. The business combination will be accounted for from the date that control is attained, whereby the fair value of the identifiable assets acquired and liabilities (including contingent liabilities) assumed is recognised (subject to certain limited exemptions). When measuring the consideration transferred in the business combination, any asset or liability resulting from a contingent consideration arrangement is also included. Subsequent to initial recognition, contingent consideration classified as equity is not remeasured and its subsequent settlement is accounted for within equity. Contingent consideration classified as an asset or liability is remeasured in each reporting period to fair value, recognising any change to fair value in profit or loss, unless the change in value can be identified as existing at acquisition date. All transaction costs incurred in relation to business combinations, other than those associated with the issue of a financial instrument, are recognised as expenses in profit or loss when incurred. The acquisition of a business may result in the recognition of goodwill or a gain from a bargain purchase. f) Income Tax
The income tax expense or benefit for the period is the tax payable on that period’s taxable income based on the applicable income tax rate for each jurisdiction adjusted by changes in deferred tax assets and liabilities attributable to temporary differences and unused tax losses and under and over provisions in prior periods, where applicable. Deferred tax assets and liabilities are recognised for temporary differences at the tax rates expected to apply when the assets are recovered or liabilities are settled, based on those tax rates that are enacted or substantively enacted except for:
When the deferred income tax asset or liability arises from the initial recognition of goodwill or an asset or liability in a transaction that is not a business combination and that, at the time of the transaction, affects neither the accounting nor taxable profits; or
When the taxable temporary difference is associated with investments in subsidiaries, associates or interests in joint ventures, and the timing of the reversal can be controlled and it is probable that the temporary difference will not reverse in the foreseeable future.
Deferred tax assets are recognised for deductible temporary differences and unused tax losses only if it is probable that future taxable amounts will be available to utilise those temporary differences and losses. The carrying amount of recognised and unrecognised deferred tax assets are reviewed each reporting date. Deferred tax assets recognised are reduced to the extent that it is no longer probable that future taxable profits will be available for the carrying amount to be recovered. Previously unrecognised deferred tax assets are recognised to the extent that it is probable that there are future taxable profits available to recover the asset. Deferred tax assets and liabilities are offset only where there is a legally enforceable right to offset current tax assets against current tax liabilities and deferred tax assets against deferred tax liabilities; and they relate to the same taxable authority on either the same taxable entity or different taxable entity’s which intent to settle simultaneously. MDS Financial Group Limited (the ‘head entity’) and its wholly-owned Australian controlled entities have formed an income tax consolidated group under the tax consolidation regime. The head entity and the controlled entities in the tax consolidated group continue to account for their own current and deferred tax amounts. The tax consolidated group has applied the group allocation approach in determining the appropriate amount of taxes to allocate to member of the tax consolidated group. In addition to its own current and deferred tax amounts, the head entity also recognises the current tax liabilities (or assets) and the deferred tax assets arising from unused tax losses and unused tax credits assumed from controlled entities in the tax consolidated group. Assets or liabilities arising under tax funding agreements with the tax consolidated entities are recognised as amounts receivable from or payable to other entities in the tax consolidated group. The tax funding arrangement ensures that the intercompany charge equals the current tax liability or benefit of each tax consolidated group member, resulting in neither a contribution by the head entity to the subsidiaries nor a distribution by the subsidiaries to the head entity.
For
per
sona
l use
onl
y

MDS Financial Group Limited - Annual Report 2015 34
Notes to the Financial Statements Note 1. Summary of Significant Accounting Policies (continued) g) Fair Value of Assets and Liabilities
The Group measures some of its assets and liabilities at fair value on either a recurring or non-recurring basis, depending on the requirements of the applicable Accounting Standard. Fair value is the price the Group would receive to sell an asset or would have to pay to transfer a liability in an orderly (ie unforced) transaction between independent, knowledgeable and willing market participants at the measurement date. As fair value is a market-based measure, the closest equivalent observable market pricing information is used to determine fair value. Adjustments to market values may be made having regard to the characteristics of the specific asset or liability. The fair values of assets and liabilities that are not traded in an active market are determined using one or more valuation techniques. These valuation techniques maximise, to the extent possible, the use of observable market data. To the extent possible, market information is extracted from either the principal market for the asset or liability (ie the market with the greatest volume and level of activity for the asset or liability) or, in the absence of such a market, the most advantageous market available to the entity at the end of the reporting period (ie the market that maximises the receipts from the sale of the asset or minimises the payments made to transfer the liability, after taking into account transaction costs and transport costs). For non-financial assets, the fair value measurement also takes into account a market participant’s ability to use the asset in its highest and best use or to sell it to another market participant that would use the asset in its highest and best use. The fair value of liabilities and the entity’s own equity instruments (excluding those related to share-based payment arrangements) may be valued, where there is no observable market price in relation to the transfer of such financial instrument, by reference to observable market information where such instruments are held as assets. Where this information is not available, other valuation techniques are adopted and, where significant, are detailed in the respective note to the financial statements. h) Plant and equipment
Plant and equipment and leasehold improvements are stated at cost less accumulated depreciation and impairment. Cost includes expenditure that is directly attributable to the acquisition of the item. In the event that settlement of all or part of the purchase consideration is deferred, cost is determined by discounting the amounts payable in the future to their present value as at the date of acquisition. Depreciation is provided on plant and equipment. Depreciation is calculated on a straight line basis so as to write off the net cost or other revalued amount of each asset over its expected useful life to its estimated residual value. The estimated useful lives, residual values and depreciation method are reviewed at the end of each annual reporting period. The depreciable amounts of all fixed assets are depreciated on a reducing balance basis over their estimated useful lives commencing from the time the asset is held ready for use.
2015 2014
Plant and equipment: 11.3% to 50% 11.3% to 50% Leasehold improvements are depreciated over the period of the lease or estimated useful life, whichever is the shorter, using the straight line method. I) Financial Instruments (i) Recognition and initial measurement
Financial assets and financial liabilities are recognised when the entity becomes a party to the contractual provisions to the instrument. For financial assets, this is equivalent to the date that the company commits itself to either the purchase or sale of the asset (ie trade date accounting is adopted). Financial instruments are initially measured at fair value plus transaction costs, except where the instrument is classified “at fair value through profit or loss”, in which case transaction costs are expensed to profit or loss immediately. (ii) Classification and subsequent measurement
Financial instruments are subsequently measured at fair value, amortised cost using the effective interest method, or cost. Amortised cost is calculated as the amount at which the financial asset or financial liability is measured at initial recognition less principal repayments and any reduction for impairment, and adjusted for any cumulative amortisation of the difference between that initial amount and the maturity amount calculated using the effective interest method.
For
per
sona
l use
onl
y
MDS Financial Group Limited - Annual Report 2015 35
Notes to the Financial Statements Note 1. Summary of Significant Accounting Policies (continued)
Fair value is determined based on current bid prices for all quoted investments. Valuation techniques are applied to determine the fair value for all unlisted securities, including recent arm’s length transactions, reference to similar instruments and option pricing models. The effective interest method is used to allocate interest income or interest expense over the relevant period and is equivalent to the rate that discounts estimated future cash payments or receipts (including fees, transaction costs and other premiums or discounts) over the expected life (or when this cannot be reliably predicted, the contractual term) of the financial instrument to the net carrying amount of the financial asset or financial liability. Revisions to expected future net cash flows will necessitate an adjustment to the carrying amount with a consequential recognition of an income or expense item in profit or loss. Financial assets at fair value through profit or loss Financial assets are classified at “fair value through profit or loss” when they are held for trading for the purpose of short-term profit taking, derivatives not held for hedging purposes, or when they are designated as such to avoid an accounting mismatch or to enable performance evaluation where a Group of financial assets is managed by key management personnel on a fair value basis in accordance with a documented risk management or investment strategy. Such assets are subsequently measured at fair value with changes in carrying amount being included in profit or loss. Loans and receivables Loans and receivables are non-derivative financial assets with fixed or determinable payments that are not quoted in an active market and are subsequently measured at amortised cost. Gains or losses are recognised in profit or loss through the amortisation process and when the financial asset is derecognised. Held-to-maturity investments Held-to-maturity investments are non-derivative financial assets that have fixed maturities and fixed or determinable payments, and it is the Group’s intention to hold these investments to maturity. They are subsequently measured at amortised cost. Gains or losses are recognised in profit or loss through the amortisation process and when the financial asset is derecognised. Available-for-sale investments
Available-for-sale investments are non-derivative financial assets that are either not capable of being classified into other categories of financial assets due to their nature or they are designated as such by management. They comprise investments in the equity of other entities where there is neither a fixed maturity nor fixed or determinable payments. They are subsequently measured at fair value with any remeasurements other than impairment losses and foreign exchange gains and losses recognised in other comprehensive income. When the financial asset is derecognised, the cumulative gain or loss pertaining to that asset previously recognised in other comprehensive income is reclassified into profit or loss. Available-for-sale financial assets are classified as non-current assets when they are expected to be sold after 12 months from the end of the reporting period. All other available-for-sale financial assets are classified as current assets. j) Impairment
At the end of each reporting period, the Group assesses whether there is objective evidence that a financial asset has been impaired. A financial asset (or a group of financial assets) is deemed to be impaired if, and only if, there is objective evidence of impairment as a result of one or more events (a “loss event”) having occurred, which has an impact on the estimated future cash flows of the financial asset(s). In the case of available-for-sale financial assets, a significant or prolonged decline in the market value of the instrument is considered to constitute a loss event. Impairment losses are recognised in profit or loss immediately. Also, any cumulative decline in fair value previously recognised in other comprehensive income is reclassified to profit or loss at this point. In the case of financial assets carried at amortised cost, loss events may include: indications that the debtors or a group of debtors are experiencing significant financial difficulty, default or delinquency in interest or principal payments; indications that they will enter bankruptcy or other financial reorganisation; and changes in arrears or economic conditions that correlate with defaults. For financial assets carried at amortised cost (including loans and receivables), a separate allowance account is used to reduce the carrying amount of financial assets impaired by credit losses. After having taken all possible measures of recovery, if management establishes that the carrying amount cannot be recovered by any means, at that point the written-off amounts are charged to the allowance account or the carrying amount of impaired financial assets is reduced directly if no impairment amount was previously recognised in the allowance account. When the terms of financial assets that would otherwise have been past due or impaired have been renegotiated, the Group recognises the impairment for such financial assets by taking into account the original terms as if the terms have not been renegotiated so that the loss events that have occurred are duly considered.
For
per
sona
l use
onl
y
MDS Financial Group Limited - Annual Report 2015 36
Notes to the Financial Statements Note 1. Summary of Significant Accounting Policies (continued) k) Intangible assets
Intangible assets acquired as part of a business combination, other than goodwill, are initially measured at their fair value at the date of the acquisition. Intangible assets acquired separately are initially recognised at cost. Intangible assets are subsequently measured at cost less amortisation and any impairment. The gains or losses recognised in profit or loss arising from the derecognition of intangible assets are measured as the difference between net disposal proceeds and the carrying amount of the intangible asset. The method and useful lives of finite life intangibles are reviewed annually. Changes in the expected pattern of consumption or useful life are accounted for prospectively by changing the amortisation method or period. Goodwill
Where an entity or operation is acquired in a business combination, the identifiable net assets acquired are measured at fair value. The excess of the fair value of the cost of acquisition over the fair value of the identifiable net assets acquired is brought to account as goodwill. Goodwill is not amortised. Instead, goodwill is tested annually for impairment, or more frequently if events or changes in circumstances indicate that it might be impaired, and is carried at cost less accumulated impairment losses. Impairment losses on goodwill are taken to profit or loss and are not subsequently reversed. Australian Securities Exchange licence
The licence relating to participant status of the Australian Securities Exchange is being amortised on a straight-line basis over a period of 5 years commencing 1 July 2011. Impairment of non-financial assets
Goodwill and other intangible assets that have an indefinite useful life are not subject to amortisation and are tested annually for impairment, or more frequently if events or changes in circumstances indicate that they might be impaired. Other non-financial assets are reviewed for impairment whenever events or changes in circumstances indicate that the carrying amount may not be recoverable. An impairment loss is recognised for the amount by which the asset’s carrying amount exceeds its recoverable amount. Recoverable amount is the higher of an asset’s fair value less costs to sell and value-in-use. The value-in-use is the present value of the estimated future cash flows relating to the asset using a pre-tax discount rate specific to the asset or cash-generating unit to which the asset belongs. Assets that do not have independent cash flows are grouped together to form a cash-generating unit.
l) Functional and presentation currency
The functional currency of each of the Group’s entities is measured using the currency of the primary economic environment in which that entity operates. The consolidated financial statements are presented in Australian dollars, which is the parent entity’s functional currency. m) Employee benefits Wages and salaries and annual leave Provision is made for the Group’s obligation for short-term employee benefits. Short-term employee benefits are benefits (other than termination benefits) that are expected to be settled wholly before 12 months after the end of the annual reporting period in which the employees render the related service, including wages, salaries and sick leave. Short-term employee benefits are measured at the (undiscounted) amounts expected to be paid when the obligation is settled. The Group’s obligations for short-term employee benefits such as wages, salaries and sick leave are recognised as a part of current trade and other payables in the statement of financial position. The Group’s obligations for employees’ annual leave and long service leave entitlements are recognised as provisions in the statement of financial position. Long service leave Provision is made for employees’ long service leave and annual leave entitlements not expected to be settled wholly within 12 months after the end of the annual reporting period in which the employees render the related service. Other long-term employee benefits are measured at the present value of the expected future payments to be made to employees. Expected future payments incorporate anticipated future wage and salary levels, durations of service and employee departures and are discounted at rates determined by reference to market yields at the end of the reporting period on government bonds that have maturity dates that approximate the terms of the obligations. Any remeasurements for changes in assumptions of obligations for other long-term employee benefits are recognised in profit or loss in the periods in which the changes occur. The Group’s obligations for long-term employee benefits are presented as non-current provisions in its statement of financial position, except where the Group does not have an unconditional right to defer settlement for at least 12 months after the end of the reporting period, in which case the obligations are presented as current provisions Defined contribution superannuation expense Contributions to defined contribution superannuation plans are expensed in the period in which they are incurred.
For
per
sona
l use
onl
y

MDS Financial Group Limited - Annual Report 2015 37
Notes to the Financial Statements Note 1. Summary of Significant Accounting Policies (continued) Share-based payments Equity-settled and cash-settled share-based remuneration benefits are provided to employees. Equity-settled transactions are awards of shares, or options over shares that are provided to employees in exchange for the rendering of services. Cash-settled transactions are awards of cash for the exchange of services, where the amount of cash is determined by reference to the share price. The costs of equity-settled transactions are measured at fair value on grant date. Fair value is independently determined using either the Binomial or Black-Scholes option pricing model that takes into account the exercise price, the term of the option, the impact of dilution, the share price at grant date and expected price volatility of the underlying share, the expected dividend yield and the risk free interest rate for the term of the option, together with non-vesting conditions that do not determine whether the consolidated entity receives the services that entitle the employees to receive payment. No account is taken of any other vesting conditions. The costs of equity-settled transactions are recognised as an expense with a corresponding increase in equity over the vesting period. The cumulative charge to profit or loss is calculated based on the grant date fair value of the award, the best estimate of the number of awards that are likely to vest and the expired portion of the vesting period. The amount recognised in profit or loss for the period is the cumulative amount calculated at each reporting date less amounts already recognised in previous periods. The cost of cash-settled transactions is initially, and at each reporting date until vested, determined by applying either the Binomial or Black-Scholes option pricing model, taking into consideration the terms and conditions on which the award was granted. The cumulative charge to profit or loss until settlement of the liability is calculated as follows:
during the vesting period, the liability at each reporting date is the fair value of the award at that date multiplied by the expired portion of the vesting period.
from the end of the reporting period until settlement of the award, the liability is the full fair value of the liability at the reporting date.
All changes in the liability are recognised in profit or loss. The ultimate cost of cash-settled transaction is the cash paid to settle the liability. Market conditions are taken into consideration in determining fair value. Therefore any awards subject to market conditions are considered to vest irrespective of whether or not that market condition has been met, provided all other conditions are satisfied. If equity-settled awards are modified, as a minimum an expense is recognised as if the modification has not been made. An additional expense is recognised, over the remaining vesting period, for any modification that increases the total fair value of the share-based remuneration benefit as at the date of modification. If the non-vesting condition is within the control of the consolidated entity or employee, the failure to satisfy the conditions is treated as a cancellation. If the condition is not within the control of the consolidated entity or employee and is not satisfied during the vesting period, any remaining expense for the award is recognised over the remaining vesting period, unless the award is forfeited. If equity-settled awards are cancelled, it is treated as if it has vested on the date of cancellation, and any remaining expense is recognised immediately. If a new replacement award is substituted for the cancelled award, the cancelled and new award is treated as if they were a modification. n) Provisions
Provisions are recognised when the consolidated entity has a present (legal or constructive) obligation as a result of a past event, it is probable that the consolidated entity will be required to settle the obligation, and a reliable estimate can be made of the amount of the obligation. The amount recognised as a provision is the best estimate of the consideration required to settle the present obligation at the reporting date, taking into account the risks and uncertainties surrounding the obligation. If the time value of money is material, provisions are discounted using a current pre-tax rate specific to the liability. The increase in the provision resulting from the passage of time is recognised as a finance cost. o) Cash and cash equivalents
Cash and cash equivalents includes cash on hand, deposits held at call with financial institutions, other short-term highly liquid investments with original maturities of three months or less that are readily convertible to known amounts of cash and which are subject to an insignificant risk of changes in value. p) Revenue and other income
Revenue is recognised when it is probable that the economic benefit will flow to the consolidated entity and the revenue can be reliably measured. Revenue is measured at the fair value of the consideration received or receivable.
For
per
sona
l use
onl
y
MDS Financial Group Limited - Annual Report 2015 38
Notes to the Financial Statements Note 1. Summary of Significant Accounting Policies (continued) Sale of goods Revenue from the sale of goods is recognised when the consolidated entity has transferred to the buyer the significant risks and rewards of ownership of the goods. Rendering of services Revenue from the provision of services to customers is recognised upon delivery of the service to the customer. Revenue received that relates to the provision for future services is accounted for as deferred income. Interest revenue Interest revenue is recognised on a time proportionate basis that takes into account the effective yield on the financial asset. Commissions When the consolidated entity acts in the capacity of an agent rather than as the principal in a transaction, the revenue recognised is the net amount of commission made by the consolidated entity. Other revenue Other revenue is recognised when it is received or when the right to receive payment is established. All revenue is stated net of the amount of goods and services tax (GST). q) Trade Receivables
Trade receivables are initially recognised at fair value and subsequently measured at amortised cost using the effective interest method, less any provision for impairment. Trade receivables are generally due for settlement within 30 days. Collectability of trade receivables is reviewed on an ongoing basis. Debts which are known to be uncollectable are written off by reducing the carrying amount directly. A provision for impairment of trade receivables is raised when there is objective evidence that the consolidated entity will not be able to collect all amounts due according to the original terms of the receivables. Significant financial difficulties of the debtor, probability that the debtor will enter bankruptcy or financial reorganisation and default are considered indicators that the trade receivable may be impaired. The amount of the impairment allowance is the difference between the asset’s carrying amount and the present value of estimated future cash flows, discounted at the original effective interest rate. Cash flows relating to short-term receivables are not discounted if the effect of discounting immaterial. Other receivables are recognised at amortised cost, less any provision for impairment. r) Trade and other payables
These amounts represent liabilities for goods and services provided to the consolidated entity prior to the end of the financial year and which are unpaid. Due to their short-term nature they are measured at amortised cost and not discounted. s) Loans and Borrowings
Loans and borrowings are initially recognised at the fair value of the consideration received, net of transaction costs. They are subsequently measured at amortised cost using the effective interest method. Where there is an unconditional right to defer settlement of the liability for at least 12 months after the reporting date, the loans or borrowings are classified as non-current. t) Goods and Services Tax (‘GST’) and other similar taxes
Revenues, expenses and assets are recognised net of the amount of associated GST, unless the GST incurred is not recoverable from, or payable to, the tax authority. In this case it is recognised as part of the cost of the acquisition of the asset or as part of the expense. Receivables and payables are stated inclusive of the amount of GST receivable or payable. The net amount of GST recoverable from, or payable to the tax authority is included in other receivables or other payables in the statement of financial position. Cash flows are presented on a gross basis. The GST components of cash flows arising from investing or financing activities which are recoverable from, or payable to the tax authority, are presented as operating cash flows. Commitments and contingencies are disclosed net of the amount of GST recoverable from, or payable to, the tax authority. u) Comparative Figures
When required by Accounting Standards, comparative figures have been adjusted to conform to changes in presentation for the current financial year.
Where the Group has retrospectively applied an accounting policy, made a retrospective restatement or reclassified items in its financial statements, an additional statement of financial position as at the beginning of the earliest comparative period will be disclosed.
For
per
sona
l use
onl
y

MDS Financial Group Limited - Annual Report 2015 39
Notes to the Financial Statements Note 1. Summary of Significant Accounting Policies (continued) V) Critical accounting judgements, estimates and assumptions
The preparation of the financial statements requires management to make judgements, estimates and assumption that affect the reported amounts in the financial statements. Management continually evaluates its judgements and estimates in relation to assets, liabilities, contingent liabilities, revenue and expenses. Management bases its judgements, estimates and assumptions on historical experience and on other various factors, including expectations of future events, management believes to be reasonable under the circumstances, the resulting accounting judgements and estimates will seldom equal the related actual results. The judgements, estimates and assumptions that have a significant risk of causing a material adjustment to the carrying amounts of assets and liabilities within the next financial year are discussed below. (i)Change in the revenue recognition policy Commencing 26 September 2013 (date of incorporation), all revenue and expenditure in relation to financial product including prepaid interest income and option premium are recognised in the income statement over the expected life of the instrument. Previously part of the income and expenditure was recognised upfront. Reflecting the revenue and expenditure over the life of the instrument more accurately reflects the nature of this type of business, where on most occasions the expected life of product exceeds 12 months. The restated prior period balances are as follows:
30 June 2014 Increase/(Decrease)
$ 30 June 2014 (Restated) $
Consolidated Statement of financial position (extract)
Deferred costs - 7,001,642 7,001,642 Intangible assets 13,971,211 1,064,670 15,035,881 Deferred revenue - (8,322,429) (8,322,429) Deferred tax assets 175,596 2,496,729 2,672,325 Deferred tax liability - (2,100,493) (2,100,493) Accumulated profit/(loss) 205,773 140,119 345,892
30 June 2014 Increase/(Decrease) $
30 June 2014 (Restated) $
Consolidated statement of profit or loss and other comprehensive income (extract)
Revenue 17,848,737 1,660,387 19,509,124 Commission and hedging (1,795,672) (1,417,056) (3,212,728)
Profit/(Loss) before income tax 320,601 200,170 520,771 Income tax benefit/(expense) (114,828) (60,051) (174,879)
Loss for the period 205,773 140,119 345,892
For
per
sona
l use
onl
y
MDS Financial Group Limited - Annual Report 2015 40
Notes to the Financial Statements Note 1. Summary of Significant Accounting Policies (continued)
(ii)Share-based payment transactions The consolidated entity measures the cost of equity-settled transactions with employees by reference to the fair value of the equity instruments at the date at which they are granted. The fair value is determined by using either the Binomial or Black-Scholes model taking into account the terms and conditions upon which the instruments were granted. The accounting estimates and assumptions relating to equity-settled share-based payments would have no impact on the carrying amounts of assets and liabilities within the next annual reporting period but may impact profit or loss and equity. (iii) Provision for impairment of receivables The provision for impairment of receivables assessment requires a degree of estimation and judgement. The level of provision is assessed by taking into account the recent sales experience, the ageing of receivables, historical collection rates and specific knowledge of the individual debtor’s financial position. (iv) Fair value and hierarchy of financial instruments
The consolidated entity is required to classify financial instruments, measured at fair value, using a three level hierarchy, being Level 1: Quoted prices (unadjusted) in active markets for identical assets or liabilities; Level 2: Inputs other than quoted prices included within level 1 that are observable for the asset or liability, either directly (as prices) or indirectly (derived from prices); and Level 3: Inputs for the asset or liability that are not based on observable market data (unobservable inputs). An instrument is required to be classified in its entirety on the basis of the lowest level of valuation inputs that is significant to fair value. Considerable judgement is required to determine what is significant to fair value and therefore which category the financial instrument is placed in can be subjective. The fair value of financial instruments classified as level 3 is determined by the use of valuation models. These include discounted cash flow analysis or the use of observable inputs that require significant adjustments based on unobservable inputs. (v) Estimation of the useful life of assets The consolidated entity determines the estimated useful lives and related depreciation and amortisation charges for its property, plant and equipment and definite life intangible assets. The useful lives could change significantly as a result of technical innovations or some other event. The depreciation and amortisation charge will increase where the useful lives are less than previously estimated lives, or technically obsolete or non-strategic assets that have been abandoned or sold will be written off or written down. (vi) Goodwill and other indefinite life intangible assets The consolidated entity tests annually, or more frequently if events or changes in circumstances indicate impairment, whether goodwill and other indefinite life intangible assets have suffered any impairment, in accordance with the accounting policy stated in note 1. The recoverable amounts of cash-generating units have been determined based on value-in-use calculations. These calculations require the use of assumptions, including estimated discount rates based on the current cost of capital and growth rates of the estimated future cash flows. (vii) Impairment of non-financial assets other than goodwill and other indefinite life intangible assets The consolidated entity assesses impairment of non-financial assets other than goodwill and other indefinite life intangible assets at each reporting date by evaluating condition specific to the consolidated entity and to the particular asset that may lead to impairment. If an impairment trigger exists, the recoverable amount of the asset is determined. This involves fair value less costs to sell or value-in-use calculations, which incorporate a number of key estimates and assumptions. (viii) Income tax The consolidated entity is subject to income taxes in the jurisdictions in which it operates. Significant judgment is required in determining the provision for income tax. There are many transactions and calculations undertaken during the ordinary course of business for which the ultimate tax determination is uncertain. The consolidated entity recognises liabilities for anticipated tax audit issues based on the consolidated entity’s current understanding of the tax law. Where the final tax outcome of these matters is different from the carrying amounts, such differences will impact the current and deferred tax provisions in the period in which such determination is made.
(ix) Recovery of deferred tax assets Deferred tax assets are recognised for deductible temporary differences only if the consolidated entity considers it is probable that future taxable amounts will be available to utilise those temporary differences and losses. (x) Long service leave provision As discussed in note 1, the liability for long service leave is recognised and measured at the present value of the estimated future cash flows to be made in respect of all employees at the reporting date. In determining the present value of the liability, estimates of attrition rates and pay increased through promotion and inflation have been taken into account.
For
per
sona
l use
onl
y

MDS Financial Group Limited - Annual Report 2015 41
Notes to the Financial Statements 1. Summary of Significant Accounting Policies (continued) w) Contributed equity Ordinary shares are classified as equity. Incremental costs directly attributable to the issue of new shares or options are shown in equity as a deduction, net of tax, from the proceeds. x) Dividends Dividends are recognised when declared during the financial year and no longer at the discretion of the consolidated entity. y) Earnings per share Basic earnings per share
Basic earnings per share is calculated by dividing the profit attributable to the owners of MDS Financial Group Limited, excluding any costs of servicing equity other than ordinary shares, by weighted average number of ordinary shares outstanding during the financial year, adjusted for bonus elements in ordinary shares issued during the financial year. Diluted earnings per share Diluted earnings per share adjusts the figures used in the determination of basic earnings per share to take into account the after income tax effect of interest and other financing costs associated with dilutive potential ordinary shares and the weighted average number of shares assumed to have been issued for no consideration in relation to dilutive potential ordinary shares. z) Financial liabilities Non-derivative financial liabilities other than financial guarantees are subsequently measured at amortised cost. Gains or losses are recognised in profit or loss through the amortisation process and when the financial liability is derecognised. Note 2. New Accounting Standards for Application in Future Periods
Accounting Standards and Interpretations issued by the AASB that are not yet mandatorily applicable to the Group, together with an assessment of the potential impact of such pronouncements on the Group when adopted in future
periods, are discussed below:
- AASB 9: Financial Instruments and associated Amending Standards (applicable to annual reporting periods
beginning on or after 1 January 2018). The Standard will be applicable retrospectively (subject to the provisions on hedge accounting outlined below) and includes revised requirements for the classification and measurement of financial instruments, revised recognition and derecognition requirements for financial instruments and simplified requirements for hedge accounting. The key changes that may affect the Group on initial application include certain simplifications to the classification of financial assets, simplifications to the accounting of embedded derivatives, upfront accounting for expected credit loss, and the irrevocable election to recognise gains and losses on investments in equity instruments that are not held for trading in other comprehensive income. AASB 9 also introduces a new model for hedge accounting that will allow greater flexibility in the ability to hedge risk, particularly with respect to hedges of non-financial items. Should the entity elect to change its hedge policies in line with the new hedge accounting requirements of the Standard, the application of such accounting would be largely prospective. Although the directors anticipate that the adoption of AASB 9 may have an impact on the Group’s financial instruments, including hedging activity, it is impracticable at this stage to provide a reasonable estimate of such impact.
- AASB 15: Revenue from Contracts with Customers (applicable to annual reporting periods commencing on or
after 1 January 2017). When effective, this Standard will replace the current accounting requirements applicable to revenue with a single, principles-based model. Except for a limited number of exceptions, including leases, the new revenue model in AASB 15 will apply to all contracts with customers as well as non-monetary exchanges between entities in the same line of business to facilitate sales to customers and potential customers.
For
per
sona
l use
onl
y
MDS Financial Group Limited - Annual Report 2015 42
Notes to the Financial Statements Note 2. New Accounting Standards for Application in Future Periods (continued)
The core principle of the Standard is that an entity will recognise revenue to depict the transfer of promised goods or
services to customers in an amount that reflects the consideration to which the entity expects to be entitled in exchange
for the goods or services. To achieve this objective, AASB 15 provides the following five-step process:
- identify the contract(s) with a customer;
- identify the performance obligations in the contract(s);
- determine the transaction price;
- allocate the transaction price to the performance obligations in the contract(s); and
- recognise revenue when (or as) the performance obligations are satisfied.
This Standard will require retrospective restatement, as well as enhanced disclosures regarding revenue.
Although the directors anticipate that the adoption of AASB 15 may have an impact on the Group’s financial statements,
it is impracticable at this stage to provide a reasonable estimate of such impact.
Note 3. Operating Segments
Identification of reportable operating segments
The consolidated entity is organised into three operating segments: data subscriptions, broking and corporate advisory. These operating segments are based on the internal reports that are reviewed and used by the Board of Directors (who are identified as the Chief Operating Decision Makers (‘CODM’)) in assessing performance and in determining the allocation of resources. There is no aggregation of operating segments. The information reported to the CODM is on a least a monthly basis. Types of products and services
The principal products and services of each of these operating segments are as follows:
Trading and Execution Provision of execution only, online trading services Software Subscriptions Provision of financial market data and analysis tools for sophisticated investors Capital Markets Advisory Provision of capital markets advice and related services SMSF Administration Provision of complete market solutions for SMSF Wealth Advisory Provision of client advisory services Investment Solutions Provision of bespoke investment products
All products and services are provided predominantly to customers in Australia. Intersegment transactions Intersegment transactions were made at cost. Intersegment transactions are eliminated on consolidation. Intersegment receivables, payables and loans Intersegment loans are initially recognised at the consideration received. Intersegment loans receivable and loans payable that earn or incur non-market interest are not adjusted to fair value based on market interest rates. Intersegment loans are eliminated on consolidation.
For
per
sona
l use
onl
y
MDS Financial Group Limited - Annual Report 2015 43
Notes to the Financial Statements
Note 3. Operating Segments (continued)
Trading and
Execution Software
Subscriptions Capital Markets Advisory
SMSF Administration
2015 $ $ $ $
Revenue 1,855,709 684,662 (281,873) 1,765,133
Segment result before impairment expense and revaluation increments to fair value
134,550
56,741
(401,873)
190,939
Impairment - further detail note 14
(530,000)
Segment result 134,550 (473,259) (401,873) 190,939 Assets
Segment assets 2,658,567 662,293 37,121 2,069,492
Liabilities Segment liabilities 784,495 980,432 - 94,798
Wealth Advisory
Investment Solutions
Unallocated Total
2015 $ $ $ $
Revenue 1,400,547 16,345,507 (363,392) 21,406,293
Segment result before impairment expense and revaluation increments to fair value
(431,937) 1,299,799 (1,869,571) (1,021,352)
Impairment – further detail note 14 (5,883,397) (2,000,000) (8,539,463) (16,952,860)
Segment result (6,315,334) (700,201) (10,409,034) (17,974,212) Assets
Segment assets 1,904,340 27,163,703 - 34,495,518
Liabilities
Segment liabilities 1,993,939 23,987,054 - 27,840,718
SMSF Administration
Wealth Advisory
Investment Solutions
Unallocated Total
Restated 2014 * $ $ $ $ $
Revenue 1,208,550 1,331,870 16,968,704 - 19,509,124 Segment result before impairment expense and revaluation increments to fair value 249,219 349,095 762,537 (1,014,958) 345,892
Segment result 249,219 349,095 762,537 (1,014,958) 345,892 Assets Segment assets 436,584 2,103,677 30,315,431 - 44,499,082
Liabilities Segment liabilities 386,828 1,721,700 16,246,764 - 28,728,995
* Refer to note 1(v)(i)
For
per
sona
l use
onl
y

MDS Financial Group Limited - Annual Report 2015 44
Notes to the Financial Statements Note 4. Revenue Consolidated
2015 Restated 2014 *
$ $
Data subscriptions fees 679,238 -
Brokerage and commissions revenue 1,809,753 1,324,973 Superannuation product revenue 1,760,350 1,181,719
Structured product revenue 16,341,608 16,959,270
Corporate advisory fees 34,000 -
Other Income - -
Total operating income 20,624,949 19,465,962
Other revenue
Interest 13,493 16,331
Other 767,851 26,831
Total other revenue 781,344 43,162
Total revenue
21,406,293 19,509,124
* Refer to note 1(v)(i) Note 5. Expenses
Loss before income tax includes the following specific expenses:
* Refer to note 1(v)(i)
Consolidated
a) Employee benefits expense 2015 Restated 2014 *
$ $
Wages and salaries 2,297,737 1,122,704 Other employment costs 517,171 -
2,814,908 1,122,704
b) Depreciation Plant and equipment 50,271 16,257 Leasehold improvements 18,800 -
69,071 16,257
c) Amortisation Websites and Blackhole 8,264 - ASX membership 15,000 - Client list 85,400 73,252
108,664 73,252
d) Impairment of goodwill 16,952,860 -
16,952,860 -
Total depreciation, amortisation and impairment 17,130,595 89,509
For
per
sona
l use
onl
y
MDS Financial Group Limited - Annual Report 2015 45
Notes to the Financial Statements
Note 6. Income Tax Expense
Consolidated
2015 Restated 2014 *
a) Income tax expense $ $
Income tax expense
Current tax - 208,021 Under provision in respect of prior year 111,571 54,164 Deferred tax (458,942) (87,306)
(347,371) 174,879
Numerical reconciliation of income tax expense to prima facie income tax payable
Loss before income tax (18,321,583) 520,771
Tax at the Australian rate of 30% 5,496,475 (156,231) Tax effect amounts which are not deductible/(taxable) in calculating taxable income:
- Impairment of goodwill (5,085,858) - - Accounting for reverse acquisition 418,698 -
- Losses not previously recognised 43,890 - - Under provision in respect of prior year (80,323) -
- Impact of tax cost base resetting from acquisition of Sequoia assets
(201,077) -
- Other non-allowable items (244,434) (18,648)
Income tax expense 347,371 (174,879)
b) Deferred tax Deferred tax asset Deferred tax liability
$ $
Consolidated
Balance at 30 June 2014 (restated)* 2,672,325 2,100,493 Changes in the period 649,461 -104,289
Balance at 30 June 2015 3,321,786 2,204,782
* Refer to note 1(v)(i)
For
per
sona
l use
onl
y

MDS Financial Group Limited - Annual Report 2015 46
Notes to the Financial Statements Note 7. Cash and Cash Equivalents
Note Consolidated
2015 Restated 2014 *
$ $
Current
Cash at bank and on hand 613,527 1,459,019
Reconciliation to cash and cash equivalents at the end of the financial year
The above figures are reconciled to cash and cash equivalents at the end of the financial year as shown in the statement of cash flows as follows:
Balance as per statement of cash flows 613,527 1,459,019
Note 8. Trade and Other Receivables
Current
Trade receivables 1,672,519 3,772,629 Related party trade receivables 836,016 23,598 Allowance for doubtful debts (3,909) -
2,504,626 3,796,227 Other receivables 77,664 -
2,582,290 3,796,227
Impairment of receivables The company has recognised an additional impairment to receivables in 2015 of $3,909 (2014: nil). The ageing of the impaired receivables recognised above are as follows: Consolidated
2015 Restated 2014 *
$ $
1 to 30 days overdue - - 31 to 60 days overdue - - Over 60 days overdue 3,909 -
3,909 -
* Refer to note 1(v)(i)
For
per
sona
l use
onl
y

MDS Financial Group Limited - Annual Report 2015 47
Notes to the Financial Statements Note 8. Trade and Other Receivables (continued)
Movements in the provision for impairment of receivables are as follows: Consolidated
2015 Restated 2014 *
$ $
Opening balance - - Additional provisions recognised 3,909 -
Closing balance 3,909 -
Past due but not impaired Customers with balances past due but without provision for impairment of receivables amount to $189,459 as at 30 June 2015 (2014: $nil). The consolidated entity did not consider a credit risk on the aggregate balances after reviewing agency credit information and credit terms of customers based on recent collection practices. The related party receivables relates to Sequoia Wealth Group Pty Ltd which the company is looking at acquiring as per market announcement made on the 4 February 2015. The aging of the past due but not impaired receivables are as follows: Consolidated
2015 Restated 2014 *
$ $
External receivables
1 to 30 days overdue 1,226,563 3,680,271 31 to 60 days overdue 61,482 91,161 Over 60 days overdue 189,458 1,197
1,477,503 3,772,629
Related party receivables 1 to 30 days overdue 117,491 - 31 to 60 days overdue 177,996 - Over 60 days overdue 809,300 23,598
1,104,787 23,598
Total trade and other receivables 2,582,290 3,796,227
Note 9. Financial assets at fair value through profit or loss
Consolidated
2015 Restated 2014 *
$ $
Current
Derivative assets 10,890,326 13,172,281
The group is party to derivative financial instruments in the normal course of business in order to hedge exposure to fluctuations in the value of its investment products issued to the group’s investors in accordance with the group’s financial risk management policies (refer to note 20). Hedged Securities – fair value hedges The group enters into hedging instruments with financial institutions to hedge its exposure to fluctuations in the value of its investment and loan products. The hedging instruments are fair valued by financial institutions to reflect the market value of the hedged instruments. The hedge assets are selected so that the fair value of the hedged liabilities equates to the fair value of the hedged assets and loans (Note 9). In this way the liabilities and assets are hedged and the risk associated with changes in market conditions has been neutralised. Information about the group's exposure to market risk, liquidity risk, and credit risk is disclosed in note 20. The maximum exposure to credit risk at the end of the reporting period is the carrying amount of each class of derivative financial assets outlined above. * Refer to note 1(v)(i)
For
per
sona
l use
onl
y
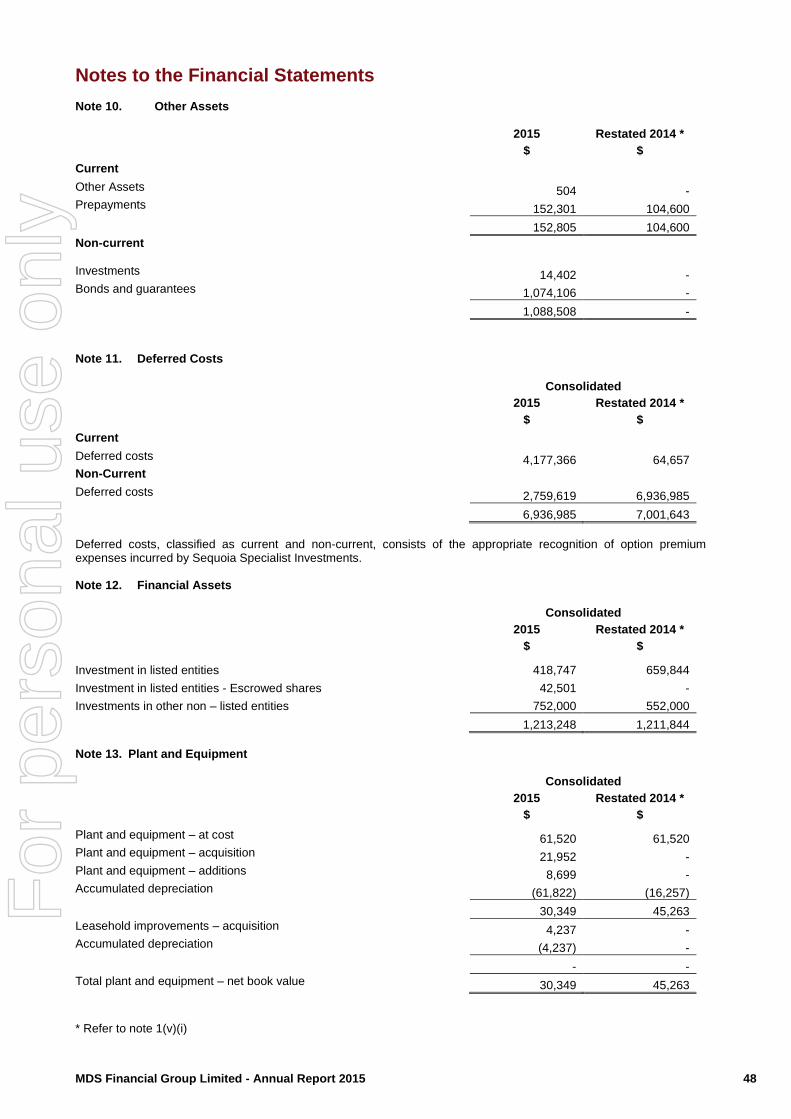
MDS Financial Group Limited - Annual Report 2015 48
Notes to the Financial Statements Note 10. Other Assets 2015 Restated 2014 *
$ $
Current
Other Assets 504 - Prepayments 152,301 104,600
152,805 104,600
Non-current
Investments 14,402 - Bonds and guarantees 1,074,106 -
1,088,508 -
Note 11. Deferred Costs Consolidated
2015 Restated 2014 *
$ $
Current
Deferred costs 4,177,366 64,657 Non-Current Deferred costs 2,759,619 6,936,985
6,936,985 7,001,643
Deferred costs, classified as current and non-current, consists of the appropriate recognition of option premium expenses incurred by Sequoia Specialist Investments.
Note 12. Financial Assets Consolidated
2015 Restated 2014 *
$ $
Investment in listed entities 418,747 659,844
Investment in listed entities - Escrowed shares 42,501 -
Investments in other non – listed entities 752,000 552,000
1,213,248 1,211,844
Note 13. Plant and Equipment Consolidated
2015 Restated 2014 *
$ $
Plant and equipment – at cost 61,520 61,520 Plant and equipment – acquisition 21,952 - Plant and equipment – additions 8,699 - Accumulated depreciation (61,822) (16,257)
30,349 45,263
Leasehold improvements – acquisition 4,237 - Accumulated depreciation (4,237) -
- -
Total plant and equipment – net book value 30,349 45,263
* Refer to note 1(v)(i)
For
per
sona
l use
onl
y
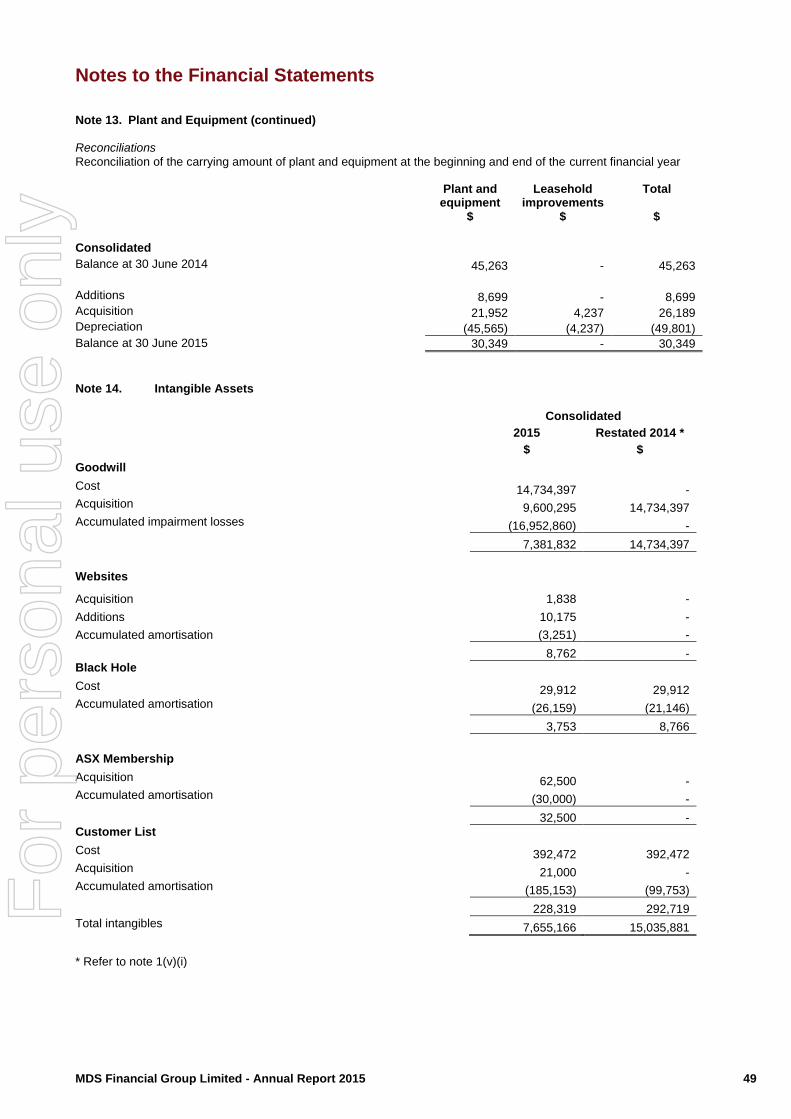
MDS Financial Group Limited - Annual Report 2015 49
Notes to the Financial Statements Note 13. Plant and Equipment (continued) Reconciliations
Reconciliation of the carrying amount of plant and equipment at the beginning and end of the current financial year Plant and
equipment Leasehold
improvements Total
$ $ $
Consolidated
Balance at 30 June 2014 45,263 - 45,263 Additions 8,699 - 8,699 Acquisition 21,952 4,237 26,189 Depreciation (45,565) (4,237) (49,801)
Balance at 30 June 2015 30,349 - 30,349
Note 14. Intangible Assets Consolidated
2015 Restated 2014 *
$ $
Goodwill
Cost 14,734,397 - Acquisition 9,600,295 14,734,397 Accumulated impairment losses (16,952,860) -
7,381,832 14,734,397
Websites
Acquisition 1,838 -
Additions 10,175 -
Accumulated amortisation (3,251) -
8,762 -
Black Hole Cost 29,912 29,912 Accumulated amortisation (26,159) (21,146)
3,753 8,766
ASX Membership Acquisition 62,500 - Accumulated amortisation (30,000) -
32,500 -
Customer List Cost 392,472 392,472 Acquisition 21,000 - Accumulated amortisation (185,153) (99,753)
228,319 292,719
Total intangibles 7,655,166 15,035,881
* Refer to note 1(v)(i)
For
per
sona
l use
onl
y
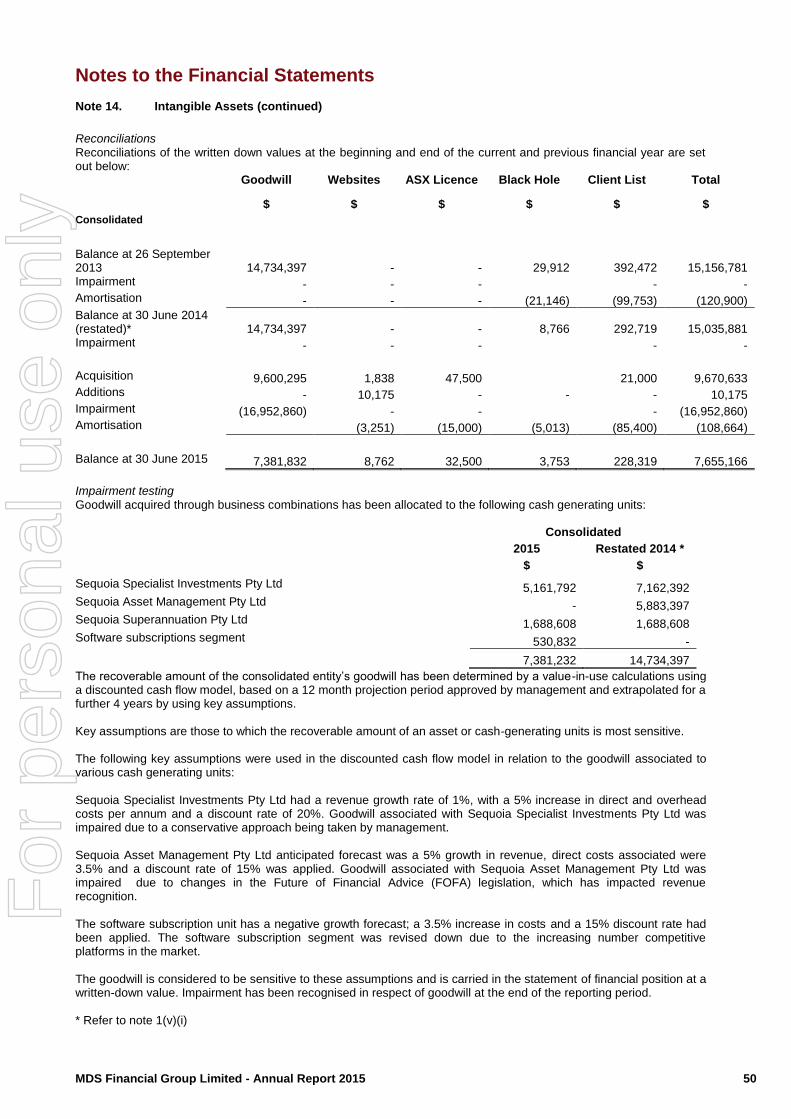
MDS Financial Group Limited - Annual Report 2015 50
Notes to the Financial Statements Note 14. Intangible Assets (continued)
Reconciliations Reconciliations of the written down values at the beginning and end of the current and previous financial year are set out below: Goodwill Websites ASX Licence Black Hole Client List Total
$ $ $ $ $ $
Consolidated
Balance at 26 September 2013 14,734,397 - - 29,912 392,472 15,156,781 Impairment - - - - - Amortisation - - - (21,146) (99,753) (120,900)
Balance at 30 June 2014 (restated)* 14,734,397 - - 8,766 292,719 15,035,881 Impairment - - - - - Acquisition 9,600,295 1,838 47,500 21,000 9,670,633 Additions - 10,175 - - - 10,175 Impairment (16,952,860) - - - (16,952,860) Amortisation (3,251) (15,000) (5,013) (85,400) (108,664)
Balance at 30 June 2015 7,381,832 8,762 32,500 3,753 228,319 7,655,166
Impairment testing Goodwill acquired through business combinations has been allocated to the following cash generating units: Consolidated
2015 Restated 2014 *
$ $
Sequoia Specialist Investments Pty Ltd 5,161,792 7,162,392 Sequoia Asset Management Pty Ltd - 5,883,397 Sequoia Superannuation Pty Ltd 1,688,608 1,688,608 Software subscriptions segment 530,832 -
7,381,232 14,734,397
The recoverable amount of the consolidated entity’s goodwill has been determined by a value-in-use calculations using a discounted cash flow model, based on a 12 month projection period approved by management and extrapolated for a further 4 years by using key assumptions. Key assumptions are those to which the recoverable amount of an asset or cash-generating units is most sensitive. The following key assumptions were used in the discounted cash flow model in relation to the goodwill associated to various cash generating units: Sequoia Specialist Investments Pty Ltd had a revenue growth rate of 1%, with a 5% increase in direct and overhead costs per annum and a discount rate of 20%. Goodwill associated with Sequoia Specialist Investments Pty Ltd was impaired due to a conservative approach being taken by management. Sequoia Asset Management Pty Ltd anticipated forecast was a 5% growth in revenue, direct costs associated were 3.5% and a discount rate of 15% was applied. Goodwill associated with Sequoia Asset Management Pty Ltd was impaired due to changes in the Future of Financial Advice (FOFA) legislation, which has impacted revenue recognition. The software subscription unit has a negative growth forecast; a 3.5% increase in costs and a 15% discount rate had been applied. The software subscription segment was revised down due to the increasing number competitive platforms in the market. The goodwill is considered to be sensitive to these assumptions and is carried in the statement of financial position at a written-down value. Impairment has been recognised in respect of goodwill at the end of the reporting period. * Refer to note 1(v)(i)
For
per
sona
l use
onl
y

MDS Financial Group Limited - Annual Report 2015 51
Notes to the Financial Statements Note 14. Intangible assets (continued)
Websites Websites are amortised on a straight-line basis over a period of two to five years. ASX membership The cost of acquiring D2MX Pty Ltd’s market participant status of the Australian Securities Exchange is being amortised over a period of five years commencing from the time that the Group’s existing third-party execution facilities were transferred to D2MX Pty Ltd in August 2011. Black hole expenditure Sequoia Asset Management Pty Ltd has got black hole expenditure relating to the Australian Financial Services Licence (AFSL) application. Client list Sequoia Financial Group Pty Ltd has a customer list in Sequoia Asset Management Pty Ltd; this was acquired from BSSJMJ Pty Ltd. The MDS Financial Group Ltd client list was acquired from the MINC and transferred by the group to Trader Dealer Pty Ltd. The client list has a finite life considered to be five years, amortised on a straight-line basis. Note 15. Trade and Other Payables Consolidated
2015 Restated 2014 *
$ $
Current
Trade payables 3,297,713 4,150,111
Other payables 262,580 115,645
Accruals 621,279 43,361
4,181,572 4,309,117
Note 16. Borrowings
Convertible notes 1,860,000 -
1,860,000 -
Loans comprised of a number of convertible loans to the value of $1,860,000. Interest is payable at a rate of 12.0 percent per annum. The convertible notes remains outstanding and repayable at the end of the 2017 calendar year. Further information about this loan is included as part of Note 20 – Financial Instruments.
* Refer to note 1(v)(i)
For
per
sona
l use
onl
y

MDS Financial Group Limited - Annual Report 2015 52
Notes to the Financial Statements Note 17. Deferred Revenue Consolidated
2015 Restated 2014 *
$ $
Current
Deferred revenue 5,119,825 37,825 Non-Current Deferred revenue 3,303,385 8,284,604
8,423,210 8,322,429
Deferred revenue, classified as current and non-current, consists of fees paid in advance for customer subscriptions and investment solutions. Note 18. Employee Benefits Consolidated
2015 Restated 2014 *
$ $
Current
Liability for annual leave 118,776 - Liability for long service leave 148,945 50,477
267,721 50,477
Non-current Liability for long service leave 13,107 39,163
13,107 39,163
Note 19. Equity - contributed
101,209,873 (2014: 15,984,773) Fully Paid Ordinary shares
24,853,485 15,984,773
Transaction Costs (87,600) (77,813)
24,765,885 15,906,960
Movements in ordinary share capital Details Date No of shares Issue price $
Opening balance 30 Jun 2014 15,984,772
1.00 15,984,772
Deemed issue on reverse acquisition 02 Jan 2015 7,248,909
1.18 8,553,713
Share issue 02 Jan 2015 17,142,858
0.07 120,000
Placement 02 Jan 2015 12,500,000
0.04 50,000
Placement 18 Mar 2015 48,333,333
0.03 145,000
101,209,873
24,853,485
* Refer to note 1(v)(i)
For
per
sona
l use
onl
y

MDS Financial Group Limited - Annual Report 2015 53
Notes to the Financial Statements Note 19. Equity – contributed (continued)
Ordinary shares Ordinary shares have the right to receive dividends as declared, and, in the event of winding up the company, to participate in the proceeds from the sale of all surplus assets in proportion to the number of and amounts paid up on shares held. Ordinary shares entitle their holder to one vote, either in person or by proxy, at a meeting of the company. The shares have no par value. Capital risk management The consolidated entity’s objectives when managing capital are to safeguard its ability to continue as a going concern, so that it can provide returns to shareholders and benefits for other stakeholders and to maintain an optimum capital structure to reduce the cost of capital. In order to maintain or adjust the capital structure, the consolidated entity may adjust the amount of dividends paid to shareholders, return capital to shareholders, issue new shares or sell assets to reduce debt. The consolidated entity would look to raise capital when an opportunity to invest in a business or company was seen as value adding relative to the current parent entity’s share price at the time of the investment. The consolidated entity is not actively pursuing additional investments in the short term as it continues to integrate and grow its existing business in order to maximise synergies. The consolidated entity is subject to certain financing arrangements covenants and meeting these are given priority in all capital risk management decisions. There have been no events of default on the financing arrangements during the financial year. Note 19. Equity – reserves Consolidated
2015 Restated 2014 *
$ $
Available for sale reserves 482,765 482,765
The fair value adjustment was made through the profit and loss in the period.
Consolidated
2015 Restated 2014 *
Note 19. Equity – accumulated losses
Accumulated losses at the beginning of the financial year
$
345,892
$
-
Loss after income tax expense for the year (17,974,212) 345,892
Accumulated losses at the end of the financial year (17,628,320) 345,892
Note 19. Equity – dividends Consolidated
2015 Restated 2014 *
$ $
Dividends
No dividends have been paid or declared during 2015 (2014: Nil)
Franking credits
Franking credits available at the reporting date based on a tax rate of 30%
2,985,198
1,530,541
* Refer to note 1(v)(i)
For
per
sona
l use
onl
y
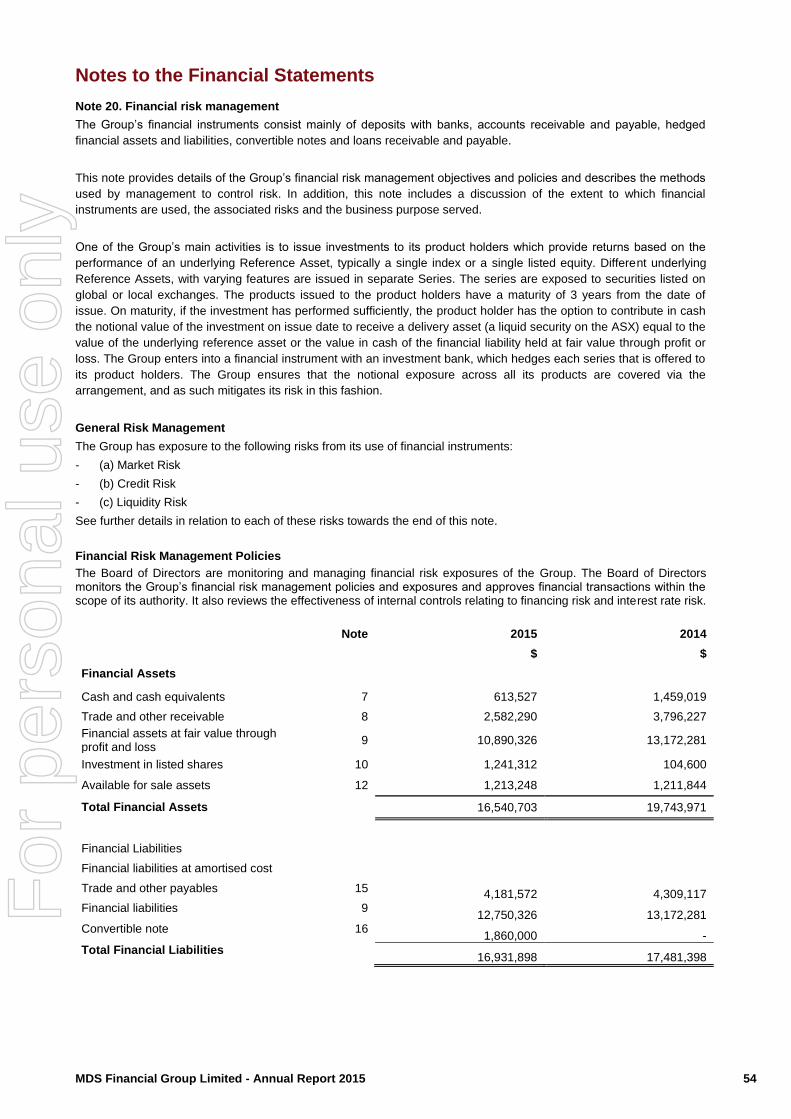
MDS Financial Group Limited - Annual Report 2015 54
Notes to the Financial Statements Note 20. Financial risk management
The Group’s financial instruments consist mainly of deposits with banks, accounts receivable and payable, hedged
financial assets and liabilities, convertible notes and loans receivable and payable.
This note provides details of the Group’s financial risk management objectives and policies and describes the methods
used by management to control risk. In addition, this note includes a discussion of the extent to which financial
instruments are used, the associated risks and the business purpose served.
One of the Group’s main activities is to issue investments to its product holders which provide returns based on the
performance of an underlying Reference Asset, typically a single index or a single listed equity. Different underlying
Reference Assets, with varying features are issued in separate Series. The series are exposed to securities listed on
global or local exchanges. The products issued to the product holders have a maturity of 3 years from the date of
issue. On maturity, if the investment has performed sufficiently, the product holder has the option to contribute in cash
the notional value of the investment on issue date to receive a delivery asset (a liquid security on the ASX) equal to the
value of the underlying reference asset or the value in cash of the financial liability held at fair value through profit or
loss. The Group enters into a financial instrument with an investment bank, which hedges each series that is offered to
its product holders. The Group ensures that the notional exposure across all its products are covered via the
arrangement, and as such mitigates its risk in this fashion.
General Risk Management
The Group has exposure to the following risks from its use of financial instruments:
- (a) Market Risk
- (b) Credit Risk
- (c) Liquidity Risk
See further details in relation to each of these risks towards the end of this note.
Financial Risk Management Policies
The Board of Directors are monitoring and managing financial risk exposures of the Group. The Board of Directors monitors the Group’s financial risk management policies and exposures and approves financial transactions within the scope of its authority. It also reviews the effectiveness of internal controls relating to financing risk and interest rate risk.
Note 2015 2014
$ $
Financial Assets
Cash and cash equivalents 7 613,527 1,459,019
Trade and other receivable 8 2,582,290 3,796,227
Financial assets at fair value through profit and loss
9 10,890,326 13,172,281
Investment in listed shares 10 1,241,312 104,600
Available for sale assets 12 1,213,248 1,211,844
Total Financial Assets
16,540,703 19,743,971
Financial Liabilities
Financial liabilities at amortised cost
Trade and other payables 15 4,181,572 4,309,117
Financial liabilities 9 12,750,326 13,172,281
Convertible note 16 1,860,000 -
Total Financial Liabilities 16,931,898 17,481,398
For
per
sona
l use
onl
y

MDS Financial Group Limited - Annual Report 2015 55
Notes to the Financial Statements Note 20. Financial Risk Management (continued)
Specific Financial Risk Exposures and Management
The main risks the Group are exposed to through its financial instruments are market risk, credit risk and liquidity risk.
a. Market risk
Market risk is the risk that changes in market prices, such as interest rates and foreign exchange rates will
affect the Group’s income or value of its holdings of financial instruments. The objective of market risk
management is to manage and control market risk exposures within acceptable parameters, while optimising
the return on risk.
The Group issues a structures product to the product holder that is hedged with the financial instrument that it purchases from an investment bank. The details of the financial instruments are such that the future cash flows from the financial assets offset the cash flows needed to settle the financial liabilities. The Group uses this arrangement to mitigate the Market risks below, except for credit risk.
(i) Foreign exchange risk
The Group holds no cash or cash equivalents in currencies other than Australian dollars. Some of the financial
instruments are exposed to changes in fluctuating currencies, however, their exposure is mitigated entirely by
the fact that changes in the financial asset are offset by changes in the financial liability. The Directors of the
Group manage the financial instruments to ensure that the Group has no exposure to foreign exchange risk.
(ii) Interest rate risk
Interest rate risk is the risk that the value of the Group’s financial instruments will fluctuate due to changes in
market interest rates.
The Group’s cash and cash equivalents are exposed to Interest rate risk. Interest rate risk in the financial
instruments offset with one another, and the Directors of the Group manage the instruments to ensure that
this remains the case.
Financial Assets 2015 Floating
Interest Rate Non - Interest
Bearing Fixed Rate
12% Total
Cash and cash equivalents 613,527 - - 613,527
Trade and other receivables - 2,582,290 - 2,582,290
Financial Liabilities
Trade and other payables - (4,181,572) - (4,181,572)
Convertible Notes
(1,860,000) (1,860,000)
Net Exposure
613,527
(1,599,282)
(1,860,000)
(2,845,755)
Financial Assets 2014
Floating Interest Rate
Non - Interest Bearing Fixed Rate Total
Cash and cash equivalents
1,459,019 - - 1,459,019
Trade and other receivables - 3,796,227 - 3,796,227
Financial Liabilities
Trade and other payables - (4,309,117) - (4,309,117)
Net Exposure
1,459,019
(512,890)
-
946,129
The Group is not exposed to interest rate risk on the financial assets and liabilities held through the profit and loss as
the financial asset offsets and hedges the risk of changes in interest rate for the financial liability.
The table below illustrates the sensitivity attributable to profit or loss for the year for reasonably possible changes in
interest rates:
2015 Net Exposure +1% (Op Profit) -1% (Op Profit)
Cash Flow interest rate risk 613,527 6,135 (6,135)
2014 Net Exposure +1% (Op Profit) -1% (Op Profit)
Cash Flow interest rate risk 1,459,019 14,590 (14,590)
For
per
sona
l use
onl
y

MDS Financial Group Limited - Annual Report 2015 56
Notes to the Financial Statements Note 20. Financial Risk Management (continued)
(iii) Price risk
Price risk arises from changes in underlying investments designated in the financial instruments held by the Group for
which values in the future are uncertain.
The Group mitigates the above price risk to ensure that price risk in the financial instruments are offset with one
another. The difference in fair value between the financial asset and liability held through profit and loss is as a result of
the premium associated with the financial liability arising from being issued in the retail market. The Group does not
monitor the price risk associated with the premium, as this would only result if the Group were to transfer the liability,
and since the Group has no intention of transferring the financial liability, no disclosures regarding the sensitivity to the
risk has been disclosed.
b. Credit risk
The maximum exposure to credit risk, excluding the value of any collateral or other security, at balance date to
recognised financial assets, is the carrying amount, net of any provisions for impairment of those assets, as disclosed
in the statement of financial position and notes to the financial statements.
Credit risk is managed through the maintenance of procedures (such procedures include the utilisation of systems for
the approval, granting and renewal of credit limits, regular monitoring of exposures against such limits and monitoring
of the financial stability of significant customers and counterparties), ensuring to the extent possible, that customers
and counterparties to transactions are of sound credit worthiness. Such monitoring is used in assessing receivables for
impairment.
Risk is also minimised through investing surplus funds in financial institutions that maintain a high credit rating, or in
entities that the Board of Directors has otherwise cleared as being financially sound. Where the Group is unable to
ascertain a satisfactory credit risk profile in relation to a customer or counterparty, the risk may be further managed
through title retention clauses over goods or obtaining security by way of personal or commercial guarantees over
assets of sufficient value which can be claimed against in the event of any default.
The financial products issued by Sequoia Specialist Investments Pty Limited (Issuer) are secured obligations of the
Issuer. The Issuer may not be able to meet its obligations but has granted Investors a charge which is held on trust by
the Security Trustee (Australian Equity Trustee). If the Issuer fails to (i) make a payment or delivery on its due date; or
(ii) meet any other obligation and in the Security Trustee's opinion the failure is materially adverse to the investors and
cannot be remedied (or has not been remedied within 5 business days of written notice), the Security Trustee may
enforce the charge. In this case the investors are unsecured creditors of the provider of the Hedge assets. Investors'
rights of recourse against the Issuer on a default are limited to the assets subject to the charge. This structure has the
effect of passing through the credit rating of the provider of the hedge asset and protecting different financial product
series from cross-liability issues (other than on an insolvency of either the Issuer or the provider of the hedge asset).
The Issuer will only deal with investment-grade or better bank or a subsidiary of an investment-grade or better bank.
The following table details the Group’s potential exposure, should the counterparties be unable to meet their obligations:
Fair Value at
30 June 2015 Notional Value
Financial liabilities at fair value through profit or loss 10,890,326 94,871,141
c. Liquidity risk
Liquidity risk arises from the possibility that the Group might encounter difficulty in settling its debts or otherwise meeting its obligations related to financial liabilities. The consolidated group manages liquidity risk by monitoring forecast cash flows and ensuring that adequate unutilised borrowing facilities are maintained
The tables below reflect an undiscounted contractual maturity analysis for financial liabilities. Bank overdrafts have been deducted in the analysis as management does not consider that there is any material risk that the bank will terminate such facilities.
Cash flows realised from financial assets reflect management’s expectation as to the timing of realisation. Actual timing
may therefore differ from that disclosed. The timing of cash flows presented in the table to settle financial liabilities
reflects the earliest contractual settlement dates and does not reflect management’s expectations that banking facilities
will be rolled forward.
For
per
sona
l use
onl
y
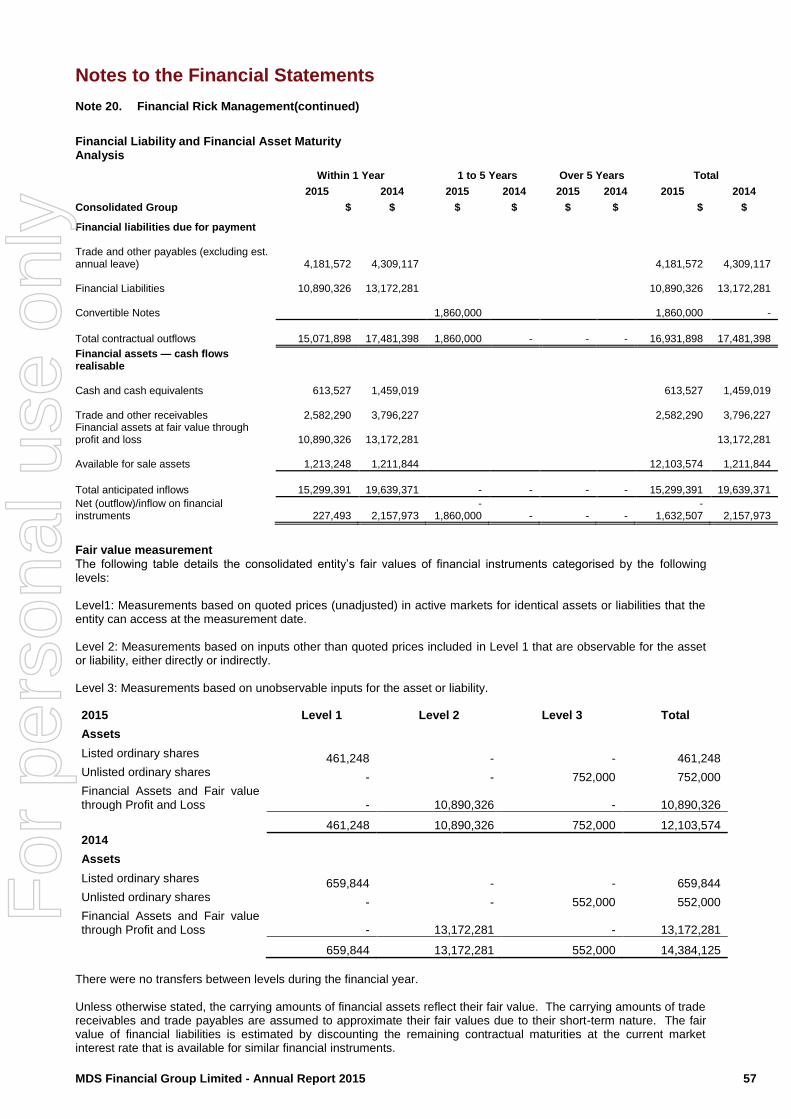
MDS Financial Group Limited - Annual Report 2015 57
Notes to the Financial Statements Note 20. Financial Rick Management(continued)
Financial Liability and Financial Asset Maturity Analysis
Within 1 Year 1 to 5 Years Over 5 Years Total 2015 2014 2015 2014 2015 2014 2015 2014
Consolidated Group $ $ $ $ $ $ $ $
Financial liabilities due for payment
Trade and other payables (excluding est. annual leave) 4,181,572
4,309,117
4,181,572
4,309,117
Financial Liabilities
10,890,326
13,172,281
10,890,326
13,172,281
Convertible Notes
1,860,000
1,860,000
-
Total contractual outflows
15,071,898
17,481,398
1,860,000
-
-
-
16,931,898
17,481,398
Financial assets — cash flows realisable
Cash and cash equivalents
613,527
1,459,019
613,527
1,459,019
Trade and other receivables
2,582,290
3,796,227
2,582,290
3,796,227
Financial assets at fair value through profit and loss 10,890,326 13,172,281
13,172,281
Available for sale assets 1,213,248
1,211,844
12,103,574
1,211,844
Total anticipated inflows
15,299,391
19,639,371
-
-
-
-
15,299,391
19,639,371
Net (outflow)/inflow on financial instruments
227,493
2,157,973
- 1,860,000
-
-
-
- 1,632,507
2,157,973
Fair value measurement
The following table details the consolidated entity’s fair values of financial instruments categorised by the following levels: Level1: Measurements based on quoted prices (unadjusted) in active markets for identical assets or liabilities that the entity can access at the measurement date. Level 2: Measurements based on inputs other than quoted prices included in Level 1 that are observable for the asset or liability, either directly or indirectly. Level 3: Measurements based on unobservable inputs for the asset or liability. 2015 Level 1 Level 2 Level 3 Total
Assets
Listed ordinary shares 461,248 - - 461,248 Unlisted ordinary shares - - 752,000 752,000 Financial Assets and Fair value through Profit and Loss - 10,890,326 - 10,890,326
461,248 10,890,326 752,000 12,103,574
2014
Assets
Listed ordinary shares 659,844 - - 659,844 Unlisted ordinary shares - - 552,000 552,000 Financial Assets and Fair value through Profit and Loss - 13,172,281 - 13,172,281
659,844 13,172,281 552,000 14,384,125
There were no transfers between levels during the financial year. Unless otherwise stated, the carrying amounts of financial assets reflect their fair value. The carrying amounts of trade receivables and trade payables are assumed to approximate their fair values due to their short-term nature. The fair value of financial liabilities is estimated by discounting the remaining contractual maturities at the current market interest rate that is available for similar financial instruments.
For
per
sona
l use
onl
y
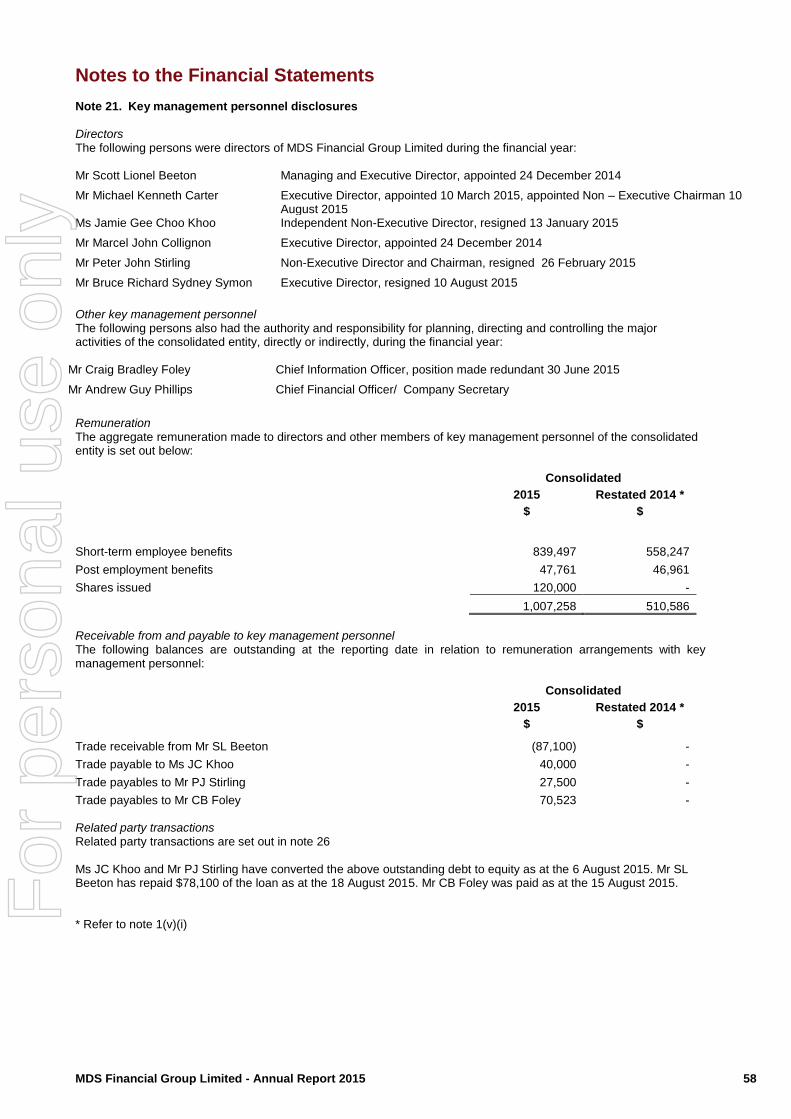
MDS Financial Group Limited - Annual Report 2015 58
Notes to the Financial Statements Note 21. Key management personnel disclosures Directors The following persons were directors of MDS Financial Group Limited during the financial year: Mr Scott Lionel Beeton Managing and Executive Director, appointed 24 December 2014
Mr Michael Kenneth Carter Executive Director, appointed 10 March 2015, appointed Non – Executive Chairman 10 August 2015
Ms Jamie Gee Choo Khoo Independent Non-Executive Director, resigned 13 January 2015
Mr Marcel John Collignon Executive Director, appointed 24 December 2014
Mr Peter John Stirling Non-Executive Director and Chairman, resigned 26 February 2015
Mr Bruce Richard Sydney Symon
Executive Director, resigned 10 August 2015
Other key management personnel The following persons also had the authority and responsibility for planning, directing and controlling the major activities of the consolidated entity, directly or indirectly, during the financial year:
Mr Craig Bradley Foley Chief Information Officer, position made redundant 30 June 2015
Mr Andrew Guy Phillips Chief Financial Officer/ Company Secretary
Remuneration The aggregate remuneration made to directors and other members of key management personnel of the consolidated entity is set out below: Consolidated
2015 Restated 2014 *
$ $
Short-term employee benefits 839,497 558,247
Post employment benefits 47,761 46,961
Shares issued 120,000 -
1,007,258 510,586
Receivable from and payable to key management personnel The following balances are outstanding at the reporting date in relation to remuneration arrangements with key management personnel: Consolidated
2015 Restated 2014 *
$ $
Trade receivable from Mr SL Beeton (87,100) -
Trade payable to Ms JC Khoo 40,000 -
Trade payables to Mr PJ Stirling 27,500 -
Trade payables to Mr CB Foley 70,523 - Related party transactions Related party transactions are set out in note 26 Ms JC Khoo and Mr PJ Stirling have converted the above outstanding debt to equity as at the 6 August 2015. Mr SL Beeton has repaid $78,100 of the loan as at the 18 August 2015. Mr CB Foley was paid as at the 15 August 2015. * Refer to note 1(v)(i)
For
per
sona
l use
onl
y
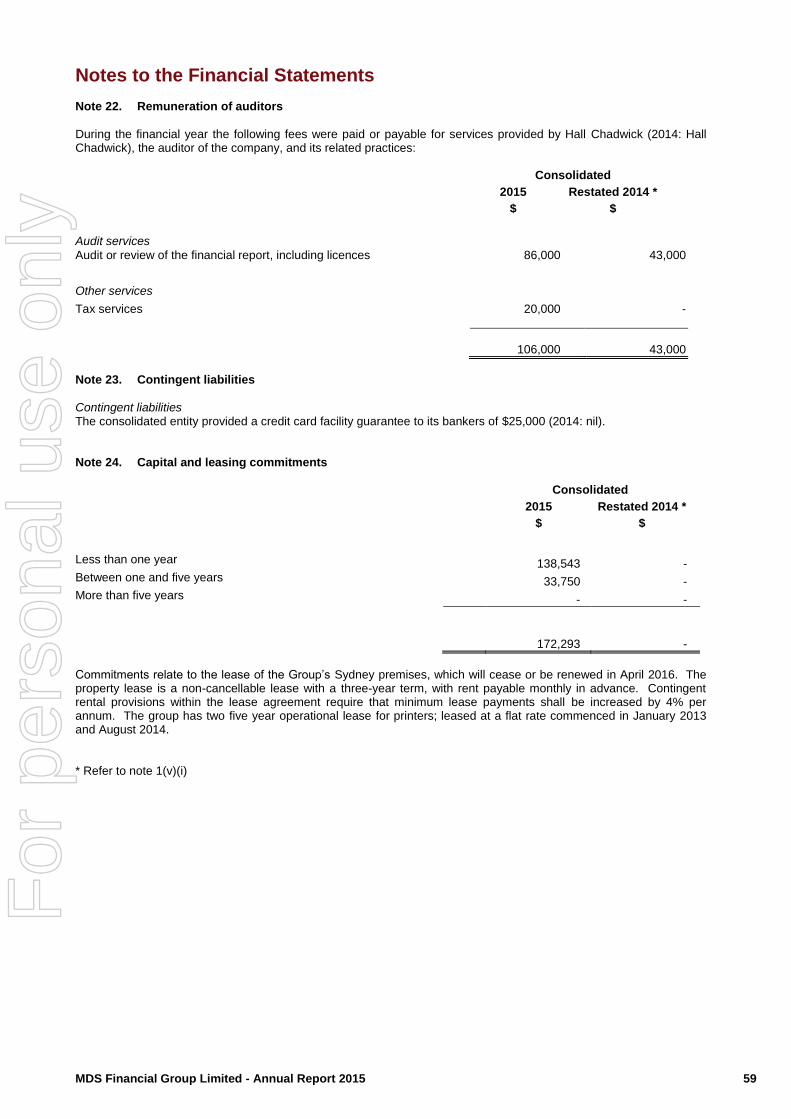
MDS Financial Group Limited - Annual Report 2015 59
Notes to the Financial Statements Note 22. Remuneration of auditors
During the financial year the following fees were paid or payable for services provided by Hall Chadwick (2014: Hall Chadwick), the auditor of the company, and its related practices: Consolidated
2015 Restated 2014 *
$ $
Audit services
Audit or review of the financial report, including licences 86,000 43,000
Other services
Tax services 20,000 -
106,000
43,000
Note 23. Contingent liabilities
Contingent liabilities The consolidated entity provided a credit card facility guarantee to its bankers of $25,000 (2014: nil).
Note 24. Capital and leasing commitments Consolidated
2015 Restated 2014 *
$ $
Less than one year 138,543 - Between one and five years 33,750 - More than five years - -
172,293 -
Commitments relate to the lease of the Group’s Sydney premises, which will cease or be renewed in April 2016. The property lease is a non-cancellable lease with a three-year term, with rent payable monthly in advance. Contingent rental provisions within the lease agreement require that minimum lease payments shall be increased by 4% per annum. The group has two five year operational lease for printers; leased at a flat rate commenced in January 2013 and August 2014.
* Refer to note 1(v)(i)
For
per
sona
l use
onl
y

MDS Financial Group Limited - Annual Report 2015 60
Notes to the Financial Statements
Note 25. Related Party Transactions
Parent entity Sequoia Financial Group Limited is the parent entity and ultimate controlling entity. Subsidiaries Interests in subsidiaries are set out in note 28. Key management personnel
Disclosures relating to key management personnel are set out in note 21 and the remuneration report in the directors’ report. Transactions with related parties
The following transactions occurred with related parties: Consolidated
2015 2014
Services payable to related parties $ $
Payment of services to Symon Financial Services Pty Ltd (director related entity of Richard Symon), paid in full
60,000 -
Payment of services to Sarah Guy Pty Ltd (key person related entity of Andrew Phillips), paid in full
60,000 -
Accounts receivable from related parties
Trade receivable from Sequoia Wealth Management Pty Ltd 231 -
Loans to or from related parties
Trade receivable from Mr SL Beeton 87,100 - Terms and conditions All transactions were made on normal commercial terms and conditions and at market rates
For
per
sona
l use
onl
y

MDS Financial Group Limited - Annual Report 2015 61
Notes to the Financial Statements Note 25. Related Party Transactions – Related Company Transactions (continued)
Transactions between related parties are on normal commercial terms and conditions no more favourable than those available to other parties unless otherwise stated. The following transactions occurred with related parties:
Services provided between TDO and other entities of the group:
Revenue:
Revenue - Equities Brokerage - Wholesale 31,723
Revenue - Equities Brokerage - Online 151,767
Costs:
Direct Cost - Execution & Clearing - Equities - Wholesale (7,943)
Direct Cost - Execution & Clearing - Options - Online (22,575)
Services provided between D2MX and other entities of the group:
Revenue:
Revenue - Options Brokerage - Wholesale 7,783
Revenue - Options Brokerage - Online 111,929
Revenue - Subscription - Trading Software Fees 81,106
Costs:
Direct Cost - Other Broking Related Costs (3,045)
Direct Cost - Rebate - Wholesale (526,649)
Services provided between SAM and other entities of the group:
Revenue:
Revenue - Commission - D2MX 175,904
For
per
sona
l use
onl
y
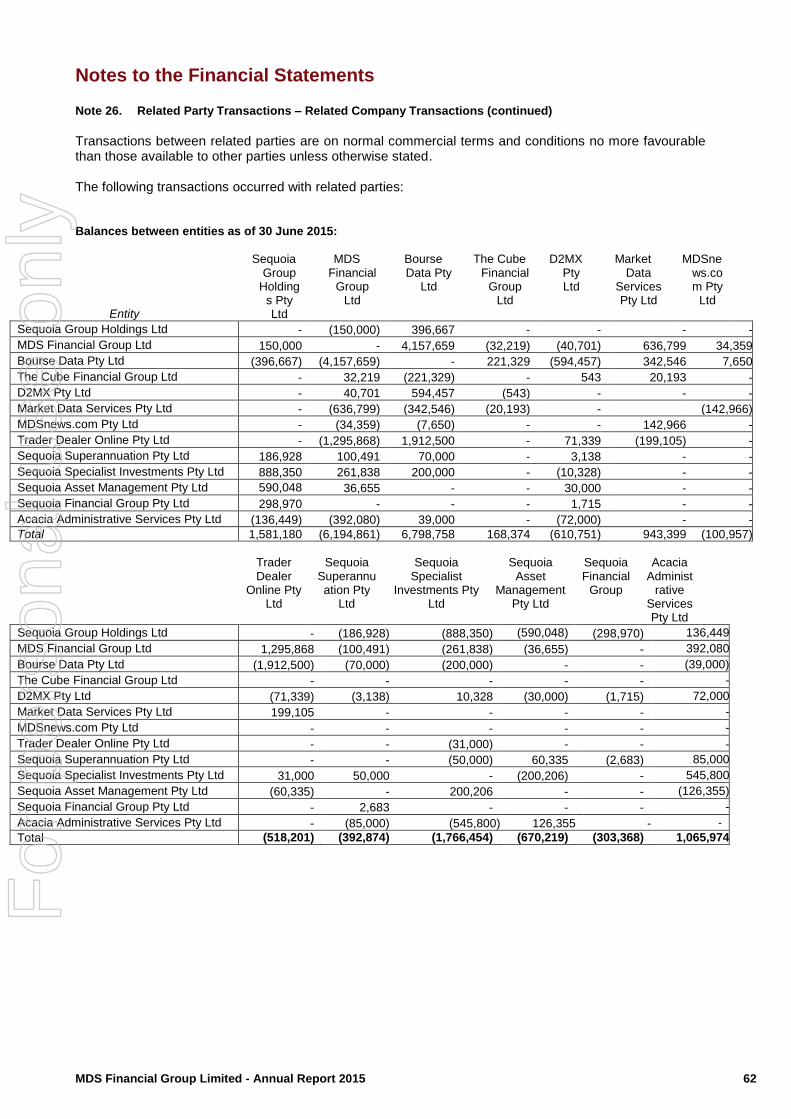
MDS Financial Group Limited - Annual Report 2015 62
Notes to the Financial Statements Note 26. Related Party Transactions – Related Company Transactions (continued)
Transactions between related parties are on normal commercial terms and conditions no more favourable than those available to other parties unless otherwise stated. The following transactions occurred with related parties:
Balances between entities as of 30 June 2015:
Entity
Sequoia Group
Holdings Pty Ltd
MDS Financial
Group Ltd
Bourse Data Pty
Ltd
The Cube Financial
Group Ltd
D2MX Pty Ltd
Market Data
Services Pty Ltd
MDSnews.com Pty
Ltd
Sequoia Group Holdings Ltd - (150,000) 396,667 - - - -
MDS Financial Group Ltd 150,000 - 4,157,659 (32,219) (40,701) 636,799 34,359
Bourse Data Pty Ltd (396,667) (4,157,659) - 221,329 (594,457) 342,546 7,650
The Cube Financial Group Ltd - 32,219 (221,329) - 543 20,193 -
D2MX Pty Ltd - 40,701 594,457 (543) - - -
Market Data Services Pty Ltd - (636,799) (342,546) (20,193) - (142,966)
MDSnews.com Pty Ltd - (34,359) (7,650) - - 142,966 -
Trader Dealer Online Pty Ltd - (1,295,868) 1,912,500 - 71,339 (199,105) -
Sequoia Superannuation Pty Ltd 186,928 100,491 70,000 - 3,138 - -
Sequoia Specialist Investments Pty Ltd 888,350 261,838 200,000 - (10,328) - -
Sequoia Asset Management Pty Ltd 590,048 36,655 - - 30,000 - -
Sequoia Financial Group Pty Ltd 298,970 - - - 1,715 - -
Acacia Administrative Services Pty Ltd (136,449) (392,080) 39,000 - (72,000) - -
Total 1,581,180 (6,194,861) 6,798,758 168,374 (610,751) 943,399 (100,957)
Trader Dealer
Online Pty Ltd
Sequoia Superannuation Pty
Ltd
Sequoia Specialist
Investments Pty Ltd
Sequoia Asset
Management Pty Ltd
Sequoia Financial
Group
Acacia Administ
rative Services Pty Ltd
Sequoia Group Holdings Ltd - (186,928) (888,350) (590,048) (298,970) 136,449
MDS Financial Group Ltd 1,295,868 (100,491) (261,838) (36,655) - 392,080
Bourse Data Pty Ltd (1,912,500) (70,000) (200,000) - - (39,000)
The Cube Financial Group Ltd - - - - - -
D2MX Pty Ltd (71,339) (3,138) 10,328 (30,000) (1,715) 72,000
Market Data Services Pty Ltd 199,105 - - - - -
MDSnews.com Pty Ltd - - - - - -
Trader Dealer Online Pty Ltd - - (31,000) - - -
Sequoia Superannuation Pty Ltd - - (50,000) 60,335 (2,683) 85,000
Sequoia Specialist Investments Pty Ltd 31,000 50,000 - (200,206) - 545,800
Sequoia Asset Management Pty Ltd (60,335) - 200,206 - - (126,355)
Sequoia Financial Group Pty Ltd - 2,683 - - - -
Acacia Administrative Services Pty Ltd - (85,000) (545,800) 126,355 - -
Total (518,201) (392,874) (1,766,454) (670,219) (303,368) 1,065,974
For
per
sona
l use
onl
y
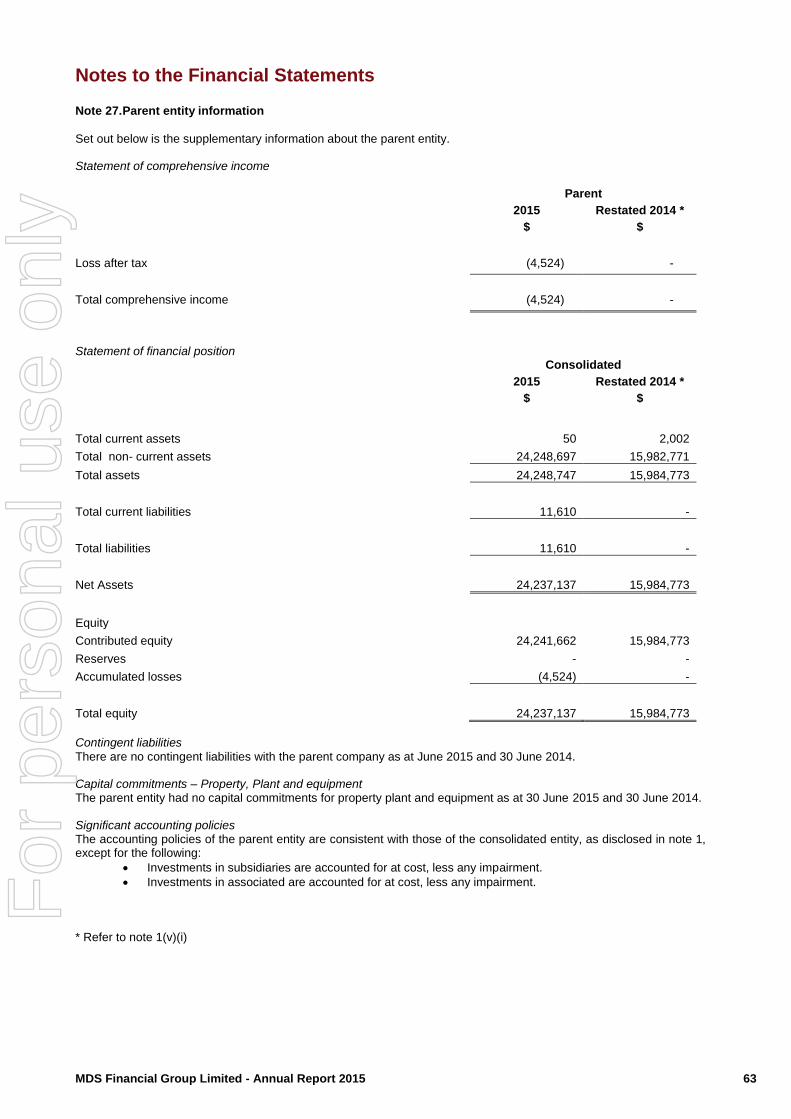
MDS Financial Group Limited - Annual Report 2015 63
Notes to the Financial Statements Note 27. Parent entity information
Set out below is the supplementary information about the parent entity. Statement of comprehensive income
Parent
2015 Restated 2014 *
$ $
Loss after tax (4,524) -
Total comprehensive income (4,524) -
Statement of financial position Consolidated
2015 Restated 2014 *
$ $
Total current assets 50 2,002
Total non- current assets 24,248,697 15,982,771
Total assets 24,248,747 15,984,773
Total current liabilities 11,610 -
Total liabilities 11,610 -
Net Assets 24,237,137 15,984,773
Equity
Contributed equity 24,241,662 15,984,773
Reserves - -
Accumulated losses (4,524) -
Total equity 24,237,137 15,984,773
Contingent liabilities
There are no contingent liabilities with the parent company as at June 2015 and 30 June 2014. Capital commitments – Property, Plant and equipment The parent entity had no capital commitments for property plant and equipment as at 30 June 2015 and 30 June 2014. Significant accounting policies The accounting policies of the parent entity are consistent with those of the consolidated entity, as disclosed in note 1, except for the following:
Investments in subsidiaries are accounted for at cost, less any impairment.
Investments in associated are accounted for at cost, less any impairment. * Refer to note 1(v)(i)
For
per
sona
l use
onl
y

MDS Financial Group Limited - Annual Report 2015 64
Notes to the Financial Statements
Note 28. Subsidiaries
The consolidated financial statements incorporate the assets, liabilities and results of the following subsidiaries in accordance with the accounting policy described in note 1: Name of entity
Country of Incorporation
Percentage Owned (%)
2015 2014
Subsidiaries of Sequoia Financial Group Limited
MDS Financial Group Limited (A) Australia 100 -
Sequoia Group Holdings Pty Ltd (B) Australia 100 100
(A) Subsidiaries of MDS Financial Group Limited Australia 100 -
Bourse Data Pty Ltd Australia 100 -
The Cube Financial Group Limited Australia 100 -
D2MX Pty Ltd Australia 100 -
Market Data Services Pty Ltd Australia 100 -
MDSnews.com Pty Ltd (A1) Australia 100 -
Trader Dealer Online Pty Ltd Australia 100 -
(A1) Subsidiaries of MDSnews.com Pty Ltd
Trader Dealer Online Pty Ltd Australia 100 -
(B) Subsidiaries of Sequoia Group Holdings Pty Ltd
Sequoia Superannuation Pty Ltd (B1) Australia 100 100
Sequoia Specialist Investments Pty Ltd (B2) Australia 100 100
Sequoia Asset Management Pty Ltd (B3) Australia 100 100
Sequoia Lending Pty Ltd Australia 100 100
(B1) Subsidiaries of Sequoia Superannuation Pty Ltd
Sequoia Brisbane Pty Ltd Australia 100 100
(B2) Subsidiaries of Sequoia Specialist Investments Pty Ltd
Sequoia Nominees No 1 Pty Ltd Australia 100 100
(B3) Subsidiaries of Sequoia Asset Management Pty Ltd
Acacia Administrative Services Pty Ltd* Australia 100 100
* Acacia Administrative Services Pty Ltd acts as a service entity for the group with all employees sitting under this
entity.
Note 29. Events occurring after the reporting date
There have not been any matters or circumstance occurring subsequent to the end of the financial year that has significantly affected the operations of the Group, the results of those operations, or the state of affairs of the Group in future financial years.
For
per
sona
l use
onl
y

MDS Financial Group Limited - Annual Report 2015 65
Notes to the Financial Statements
Note 30. Reconciliation of loss after income tax to net cash from operating activities Consolidated
2015 Restated 2014 *
$ $
(a) Reconciliation of loss for the year to net cash flow used in operating activities:
(Loss) / Profit for the year (17,974,212) 345,892 Non-cash flows in operating loss: Depreciation, amortisation and impairment 17,130,595 89,509 Fair value adjustment on investments 361,536 (1,064,670) Other 98,488 - Changes in working capital and provisions: (Increase)/decrease in trade and other receivables 1,562,757 (3,698,527) (Increase)/decrease in other assets (234,479) 426,621 (Increase)/decrease in deferred costs 64,657 (7,001,642) (Increase)/decrease in Deferred Tax Assets
(649,461) (2,618,617)
(Increase)/decrease in Financial Assets - 3,603,051 Increase/(Decrease) in deferred tax liability 104,289 2,100,493 Increase/(decrease) in trade and other creditors (1,487,929) 3,304,596 Increase/(Decrease) in deferred income (78,969) 8,322,429 Increase/(Decrease) in provision for income tax (745,564) 65,314 Increase/(decrease) in Financial Liabilities - (3,603,051) Increase/(decrease) in employee entitlements 86,767 (52,811)
Net cash used in operating activities (1,761,525) 218,587
Acquisition of Entities
During the year a further 100% ownership interest in MDS Financial Group Ltd was acquired. Details of this transaction are:
Purchase consideration
Consisting of:
Share issue (8,553,731) (15,682,772) Assets and liabilities held at acquisition date: Cash 337,454 2,435,005 Receivables 645,380 114,628 Property, plant and equipment 26,188 55,681 Financial assets 17,054,629 Intangible assets 1,131,170 378,832 Other assets 818,613 566,894 Deferred tax asset 2,496,729 Deferred costs 8,418,698 Financial liabilities (16,775,332) Payables (2,944,537) (1,757,241) Deferred tax liability (2,100,493) Deferred revenue (9,939,655) Goodwill on consolidation 8,539,463 14,734,397
The goodwill is attributable to the high profitability of the acquired business and the significant synergies expected to arise after the Group’s reverse acquisition of MDS Financial Group Ltd. * Refer to note 1(v)(i)
For
per
sona
l use
onl
y
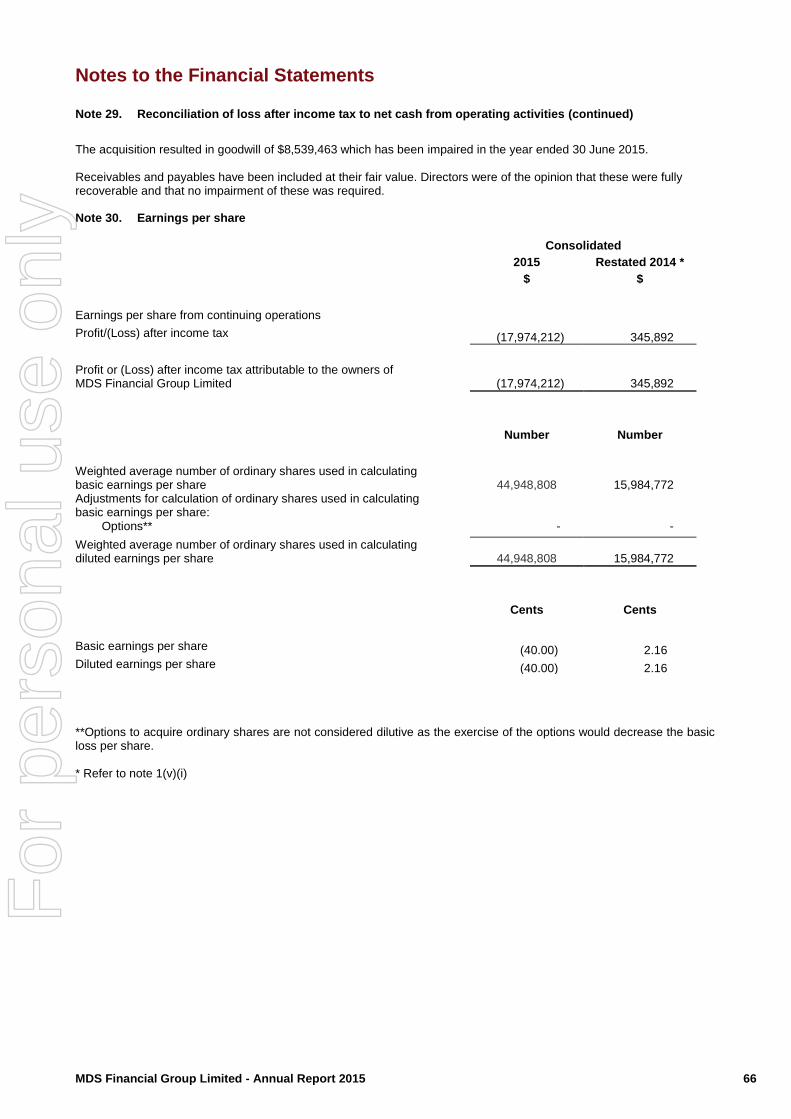
MDS Financial Group Limited - Annual Report 2015 66
Notes to the Financial Statements Note 29. Reconciliation of loss after income tax to net cash from operating activities (continued)
The acquisition resulted in goodwill of $8,539,463 which has been impaired in the year ended 30 June 2015. Receivables and payables have been included at their fair value. Directors were of the opinion that these were fully recoverable and that no impairment of these was required. Note 30. Earnings per share Consolidated
2015 Restated 2014 *
$ $
Earnings per share from continuing operations
Profit/(Loss) after income tax (17,974,212) 345,892
Profit or (Loss) after income tax attributable to the owners of MDS Financial Group Limited
(17,974,212)
345,892
Number Number
Weighted average number of ordinary shares used in calculating basic earnings per share
44,948,808
15,984,772
Adjustments for calculation of ordinary shares used in calculating basic earnings per share:
Options** - -
Weighted average number of ordinary shares used in calculating diluted earnings per share
44,948,808
15,984,772
Cents Cents
Basic earnings per share (40.00) 2.16 Diluted earnings per share (40.00) 2.16
**Options to acquire ordinary shares are not considered dilutive as the exercise of the options would decrease the basic loss per share. * Refer to note 1(v)(i)
For
per
sona
l use
onl
y
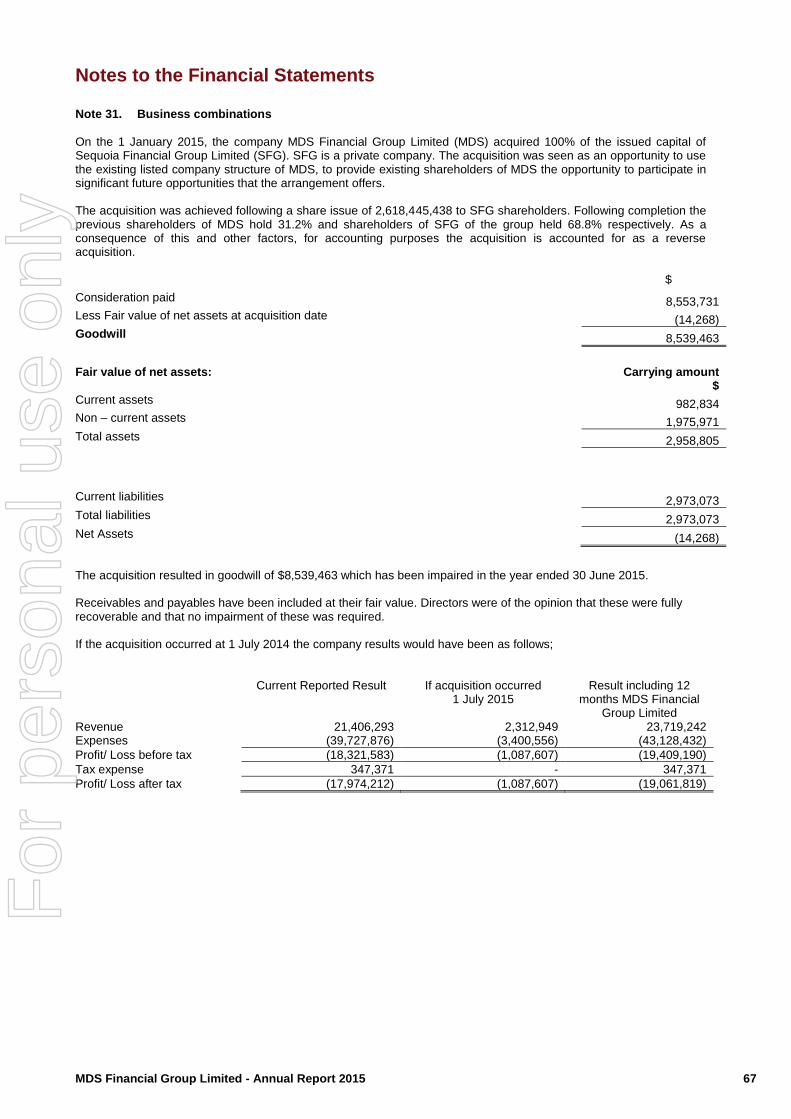
MDS Financial Group Limited - Annual Report 2015 67
Notes to the Financial Statements Note 31. Business combinations
On the 1 January 2015, the company MDS Financial Group Limited (MDS) acquired 100% of the issued capital of Sequoia Financial Group Limited (SFG). SFG is a private company. The acquisition was seen as an opportunity to use the existing listed company structure of MDS, to provide existing shareholders of MDS the opportunity to participate in significant future opportunities that the arrangement offers. The acquisition was achieved following a share issue of 2,618,445,438 to SFG shareholders. Following completion the previous shareholders of MDS hold 31.2% and shareholders of SFG of the group held 68.8% respectively. As a consequence of this and other factors, for accounting purposes the acquisition is accounted for as a reverse acquisition. $
Consideration paid 8,553,731 Less Fair value of net assets at acquisition date (14,268)
Goodwill 8,539,463
Fair value of net assets: Carrying amount $
Current assets 982,834 Non – current assets 1,975,971
Total assets 2,958,805
Current liabilities 2,973,073 Total liabilities 2,973,073 Net Assets (14,268)
The acquisition resulted in goodwill of $8,539,463 which has been impaired in the year ended 30 June 2015. Receivables and payables have been included at their fair value. Directors were of the opinion that these were fully recoverable and that no impairment of these was required. If the acquisition occurred at 1 July 2014 the company results would have been as follows; Current Reported Result If acquisition occurred
1 July 2015 Result including 12
months MDS Financial Group Limited
Revenue 21,406,293 2,312,949 23,719,242 Expenses (39,727,876) (3,400,556) (43,128,432)
Profit/ Loss before tax (18,321,583) (1,087,607) (19,409,190)
Tax expense 347,371 - 347,371
Profit/ Loss after tax (17,974,212) (1,087,607) (19,061,819)
For
per
sona
l use
onl
y
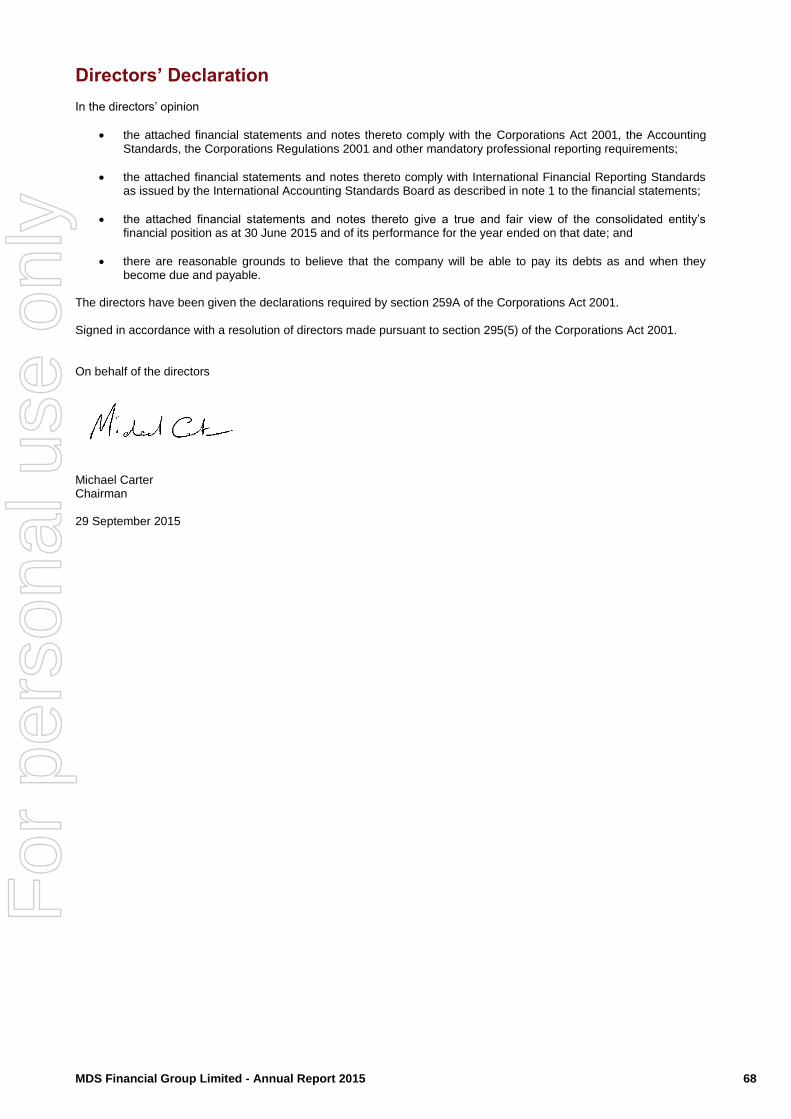
MDS Financial Group Limited - Annual Report 2015 68
Directors’ Declaration
In the directors’ opinion
the attached financial statements and notes thereto comply with the Corporations Act 2001, the Accounting Standards, the Corporations Regulations 2001 and other mandatory professional reporting requirements;
the attached financial statements and notes thereto comply with International Financial Reporting Standards as issued by the International Accounting Standards Board as described in note 1 to the financial statements;
the attached financial statements and notes thereto give a true and fair view of the consolidated entity’s financial position as at 30 June 2015 and of its performance for the year ended on that date; and
there are reasonable grounds to believe that the company will be able to pay its debts as and when they become due and payable.
The directors have been given the declarations required by section 259A of the Corporations Act 2001. Signed in accordance with a resolution of directors made pursuant to section 295(5) of the Corporations Act 2001. On behalf of the directors
Michael Carter Chairman 29 September 2015
For
per
sona
l use
onl
y

HALL CHADWICK a (NSW) Chartered Accountants and Business Advisers
MDS FINANCIAL GROUP LIMITED ABN 90 091 744 884
AND CONTROLLED ENTITIES
INDEPENDENT AUDITOR'S REPORT TO THE MEMBERS OF MDS FINANCIAL GROUP LIMITED
Report on the Financial Report We have audited the accompanying financial report of MDS Financial Group Limited which comprises the consolidated statement of financial position as at 30 June 2015, the consolidated statement of profit or loss and other comprehensive income, the consolidated statement of changes in equity and the consolidated statement of cash flows for the year then ended, notes comprising a summary of significant accounting policies and other explanatory information and the directors' declaration of the consolidated entity comprising the company and the entities it controlled at the year's end or from time to time during the financial year.
Directors' Responsibility for the Financial Report
The directors of the company are responsible for the preparation of the financial report that gives a true and fair view in accordance with Australian Accounting Standards and the Corporations Act 2001 and for such internal control as the directors determine is necessary to enable the preparation of the financial report that is free from material misstatement, whether due to fraud or error. In Note 1, the directors also state, in accordance with Accounting Standard AASB 101: Presentation of Financial Statements that the financial statements comply with International Financial Reporting Standards (IFRS).
Auditor's Responsibility
Our responsibility is to express an opinion on the financial report based on our audit. We conducted our audit in accordance with Australian Auditing Standards. Those standards require that we comply with relevant ethical requirements relating to audit engagements and plan and perform the audit to obtain reasonable assurance whether the financial report is free from material misstatement.
An audit involves performing procedures to obtain audit evidence about the amounts and disclosures in the financial report. The procedures selected depend on the auditor's judgment, including the assessment of the risks of material misstatement of the financial report, whether due to fraud or error. In making those risk assessments, the auditor considers internal control relevant to the company's preparation of the financial report in order to design audit procedures that are appropriate in the circumstances, but not for the purpose of expressing an opinion on the effectiveness of the entity's internal control. An audit also includes evaluating the appropriateness of accounting policies used and the reasonableness of accounting estimates made by the directors, as well as evaluating the overall presentation of the financial report.
We believe that the audit evidence we have obtained is sufficient and appropriate to provide a basis for our audit opinion.
Independence
In conducting our audit, we have complied with the independence requirements of the Corporations Act 2001.
SYDNEY
Level 40 2 Park Street Sydney NSW 2000 Australia
GPO Box 3555 Sydney NSW 2001
Ph: (612) 9263 2600 Fx : (612) 9263 2800
A member of AGN International Ltd. a worldwide association of separate and independent accounting and consulting firms
www.hallchadwick.com.au
SYDNEY • NEWCASTLE • PARRAMATTA • PENRITH • MELBOURNE • PERTH • BRISBANE • GOLD COAST • DARWIN
Liability limited by a scheme approved under Professional Standards Legislation.
For
per
sona
l use
onl
y

HALL CHADWICK a (NSW)
Auditor's Opinion
In our opinion:
a. the financial report of MDS Financial Group Limited is in accordance with the Corporations Act 2001, including:
i. giving a true and fair view of the consolidated entity's financial position as at 30 June 2015 and of its performance for the year ended on that date; and
ii. complying with Australian Accounting Standards and the Corporations Regulations 2001;and
b. the financial report also complies with International Financial Reporting Standards as disclosed in Note 1.
Emphasis of matter
Without modifying our opinion, we draw attention to Note 1 "Going Concern" in the financial report which indicates that the consolidated entity incurred a net loss of $17,974,212 and a negative cash flow from operating activities of $1,761,525 during the year ended 30 June 2015, and as of that date, the company's current liabilities exceeded its current assets by $2,032,601. These conditions, along with other matters as set forth in Note 1 "Going Concern" indicate the existence of a material uncertainty which may cast significant doubt about the consolidated entity's ability to continue as a going concern and therefore the consolidated entity may be unable to realise its assets and discharge its liabilities in the normal course of business and at the amounts stated in the financial report.
Report on the Remuneration Report
We have audited the remuneration report included in pages 21 to 24 of the directors' report for the year ended 30 June 2015. The directors of the company are responsible for the preparation and presentation of the remuneration report in accordance with Section 300A of the Corporations Act 2001. Our responsibility is to express an opinion on the remuneration report, based on our audit conducted in accordance with Australian Auditing Standards.
Auditor's Opinion
In our opinion the remuneration report of MDS Financial Group Limited for the year ended 30 June 2015 complies with Section 300A of the Corporations Act 2001.
Hall Chadwick Level 40, 2 Park Street Sydney NSW 2000
DREW TOWNSEND
Partner Date:/°\ September 2015 F
or p
erso
nal u
se o
nly
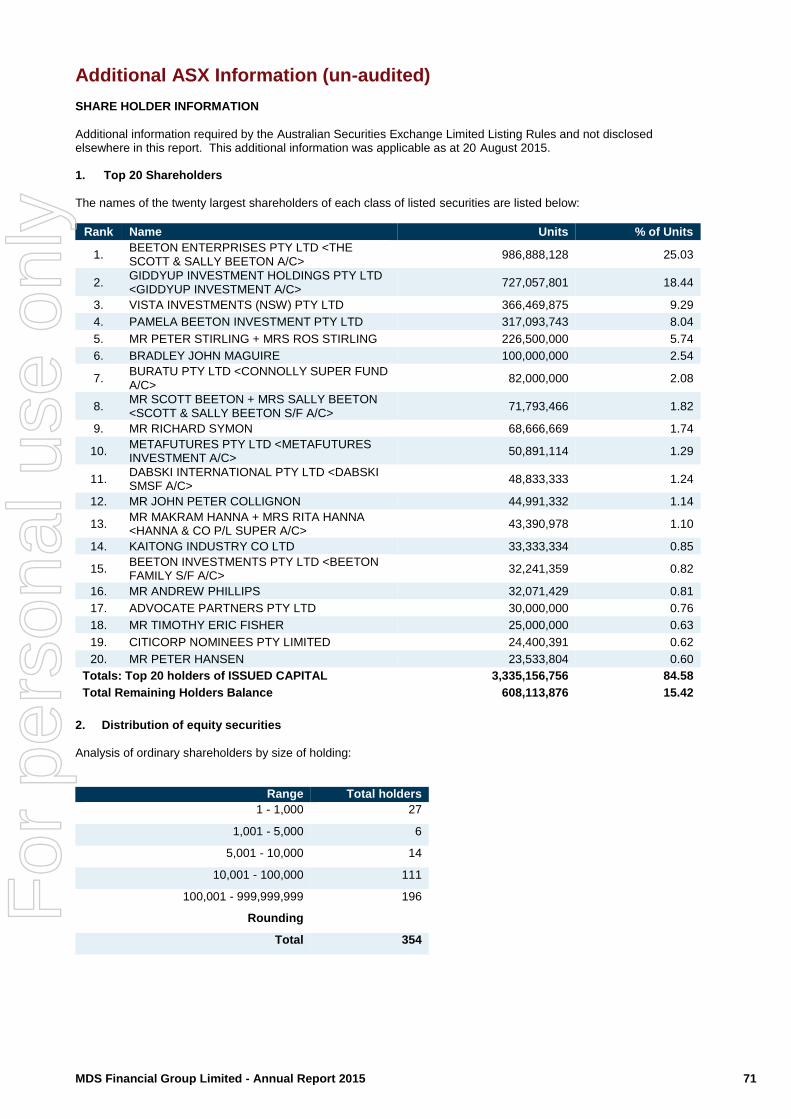
MDS Financial Group Limited - Annual Report 2015 71
Additional ASX Information (un-audited) SHARE HOLDER INFORMATION
Additional information required by the Australian Securities Exchange Limited Listing Rules and not disclosed elsewhere in this report. This additional information was applicable as at 20 August 2015. 1. Top 20 Shareholders
The names of the twenty largest shareholders of each class of listed securities are listed below:
Rank Name Units % of Units
1. BEETON ENTERPRISES PTY LTD <THE SCOTT & SALLY BEETON A/C>
986,888,128 25.03
2. GIDDYUP INVESTMENT HOLDINGS PTY LTD <GIDDYUP INVESTMENT A/C>
727,057,801 18.44
3. VISTA INVESTMENTS (NSW) PTY LTD 366,469,875 9.29
4. PAMELA BEETON INVESTMENT PTY LTD 317,093,743 8.04
5. MR PETER STIRLING + MRS ROS STIRLING 226,500,000 5.74
6. BRADLEY JOHN MAGUIRE 100,000,000 2.54
7. BURATU PTY LTD <CONNOLLY SUPER FUND A/C>
82,000,000 2.08
8. MR SCOTT BEETON + MRS SALLY BEETON <SCOTT & SALLY BEETON S/F A/C>
71,793,466 1.82
9. MR RICHARD SYMON 68,666,669 1.74
10. METAFUTURES PTY LTD <METAFUTURES INVESTMENT A/C>
50,891,114 1.29
11. DABSKI INTERNATIONAL PTY LTD <DABSKI SMSF A/C>
48,833,333 1.24
12. MR JOHN PETER COLLIGNON 44,991,332 1.14
13. MR MAKRAM HANNA + MRS RITA HANNA <HANNA & CO P/L SUPER A/C>
43,390,978 1.10
14. KAITONG INDUSTRY CO LTD 33,333,334 0.85
15. BEETON INVESTMENTS PTY LTD <BEETON FAMILY S/F A/C>
32,241,359 0.82
16. MR ANDREW PHILLIPS 32,071,429 0.81
17. ADVOCATE PARTNERS PTY LTD 30,000,000 0.76
18. MR TIMOTHY ERIC FISHER 25,000,000 0.63
19. CITICORP NOMINEES PTY LIMITED 24,400,391 0.62
20. MR PETER HANSEN 23,533,804 0.60
Totals: Top 20 holders of ISSUED CAPITAL 3,335,156,756 84.58
Total Remaining Holders Balance 608,113,876 15.42
2. Distribution of equity securities
Analysis of ordinary shareholders by size of holding:
Range Total holders
1 - 1,000 27
1,001 - 5,000 6
5,001 - 10,000 14
10,001 - 100,000 111
100,001 - 999,999,999 196
Rounding
Total 354
For
per
sona
l use
onl
y
MDS Financial Group Limited - Annual Report 2015 72
Additional ASX Information (un-audited) 3. Restricted Securities
There are no restricted securities on issue. 4. Voting Rights
The voting rights attaching to ordinary shares, set out in the Company’s Constitution are:
(a) at meetings of members, each member is entitled to vote in person or by proxy, attorney or representative; and,
(b) on a show of hands, every person present who is a member has one vote, and on a poll every member
present has a vote for each fully paid share owned. There are no voting rights attached to un-listed ordinary shares or unlisted options, voting rights will be attached to un-listed ordinary shares once issued and to options upon exercise. 5. On-market Buy Back
There is no current on-market buy back. 6. Review of Operations
A review of operations for the Group is set out on pages 5 to 8 of this annual report, commencing with the Chairman’s Report.
For
per
sona
l use
onl
y

MDS Financial Group Limited - Annual Report 2015 73
Directory
Company Directors
Mr Scott Lionel Beeton Mr Michael Kenneth Carter
Managing Director Non-Executive Chairman
Mr Marcel John Collignon Mr Delan Pasquale Pagliaccio
Executive Director Executive Director
Company Secretary
Mr Andrew Guy Phillips Registered Office
Level 8 25 Bligh Street Sydney NSW 2000 Telephone: + 61 2 8114 2222 Facsimile: + 61 2 8114 2200
Share Registry
Computershare Limited Yarra Falls 452 Johnston Street Abbotsford VIC 3067
Bankers
National Australia Bank 330 Collins Street Melbourne VIC 3000 Westpac Australia Bank 275 George Street Sydney NSW 2000
Auditor
Hall Chadwick Level 40, 2 Park Street Sydney NSW 2000
Securities Exchange The company’s securities are quoted on the official list of the
Australian Securities Exchange Limited, the home branch being Melbourne.
ASX Code
MWS MDS Financial Group Limited is a public company limited by shares incorporated and domiciled in Australia
For
per
sona
l use
onl
y

For
per
sona
l use
onl
y