For personal use only · Madagascar has a proven record with mining project development. Large...
51
BLACKEARTH MINERALS NL ABN 66 610 168 191 FINANCIAL REPORT FOR THE YEAR ENDED 30 JUNE 2018 For personal use only
Transcript of For personal use only · Madagascar has a proven record with mining project development. Large...
BLACKEARTH MINERALS NL
ABN 66 610 168 191
FINANCIAL REPORT
FOR THE YEAR ENDED 30 JUNE 2018
For
per
sona
l use
onl
y
CONTENTS PAGE
CORPORATE DIRECTORY ....................................................................................... 1
CHAIRMAN’S LETTER ............................................................................................ 2
DIRECTORS’ REPORT ............................................................................................. 2
AUDITORS INDEPENDENCE DECLARATION ..................................................... 18
CONSOLIDATED STATEMENT OF PROFIT OR LOSS AND OTHER
COMPREHENSIVE INCOME ................................................................................. 19
CONSOLIDATED STATEMENT OF FINANCIAL POSITION ..................................... 20
CONSOLIDATED STATEMENT OF CHANGES IN EQUITY ...................................... 21
CONSOLIDATED STATEMENT OF CASH FLOWS .................................................. 22
NOTES TO THE CONSOLIDATED FINANCIAL STATEMENTS ............................. 23
DIRECTORS’ DECLARATION ................................................................................. 41
INDEPENDENT AUDITOR’S REPORT .................................................................... 42
ADDITIONAL ASX INFORMATION ....................................................................... 47
For
per
sona
l use
onl
y
Page 1
CORPORATE DIRECTORY
DIRECTORS
Thomas Revy Managing Director Phillip Hearse Chairman George Bauk Non-Executive Director
COMPANY SECRETARY Barry Woodhouse
REGISTERED OFFICE Level 1 675 Murray Street West Perth WA 6005 T: +61 8 6145 0289 F: +61 8 9475 0847 E: [email protected] W: www.blackearthminerals.com.au
AUDITORS Bentley’s Audit & Corporate (WA) Pty Ltd Level 3 216 St Georges Terrace Perth WA 6000
SHARE REGISTRY Automic Registry Services Level 2 267 St Georges Terrace Perth WA 6000 T: +61 8 9324 2099 F: +61 2 8583 3040
For
per
sona
l use
onl
y
Page 2
CHAIRMAN’S LETTER Dear Shareholder BlackEarth Minerals NL has kicked off to a great start as an ASX listed company. We have drilled over 6000 m of diamond core at the Maniry prospect in Madagascar to establish a quality and sizeable MRE within eight months of listing. This is a remarkable achievement and is a sound indicator that BEM will continue to meet the projections made in its Prospectus. BEM has commenced a Scoping Study and a program of metallurgical testwork aimed at providing process design data and at providing concentrate samples for marketing purposes. We plan to commence a Feasibility Study in early 2019 and, subject to funding, to complete that Feasibility Study by the end of that calendar year as part of our “fast track to cash flow” strategy. Madagascar has a proven record with mining project development. Large mining investments in the country include the multi-billion dollar Ambatovy nickel-cobalt project near the east coast of Madagascar and Rio Tinto’s Fort Dauphin mineral sands project in Madagascar’s south east. A recent report by the World Bank not only confirms the trends of positive economic growth over the past 5 years, but also provides a positive macroeconomic outlook over the medium term. BEM continues to have confidence in Madagascar as a country in which to operate. The year gone has been generally a trying year for graphite explorers with the investment community waiting to see the success of Syrah in Mozambique, and regulatory disruption in Tanzania. However, Chinese production has decreased with increased environmental constraints, and demand for graphite continues to grow in line with Li-ion battery growth and with increasing demand for expandable graphite and graphite foils in mobile phones and computers. High quality graphite concentrate such as that from the Maniry prospect is expected to be in demand to meet the growing graphite markets. As outlined earlier, our aim is to maintain the momentum we have generated to date by completing a Definitive Feasibility Study by the end of 2019. In hand with rapid advancement of the Maniry Project, prudent financial management of BEM is seen as paramount by your Board for the successful delivery of value to shareholders. Consequently the Board, at the appropriate time, will look at raising further funds as part of its “fast track to cash flow” strategy”. Finally, I want to thank you, our Shareholders, for your support over the inaugural six months of BEM’s development. The support of our Shareholders is key to our company’s success. I also want to thank our management team and support personnel both in Perth and in Madagascar, consultants and contractors, and the Board for its dedication to BEM during its initial listing and exploration activities.
Phillip Hearse Chairman
DIRECTORS’ REPORT The Directors present their report on BlackEarth Minerals NL (“BEM” or the “Company”) and its controlled entity (the “Consolidated entity”) for the period from 01 July 2017 to 30 June 2018.
BOARD OF DIRECTORS The names and details of the Consolidated entity’s directors in office during the financial period and until the date of this report are as follows. Directors were in office for this entire period unless otherwise stated. Phillip Hearse Non-Executive Chairman Thomas Revy Managing Director George Bauk Non-Executive Director
For
per
sona
l use
onl
y
DIRECTORS’ REPORT (Continued)
Page 3
INFORMATION ON DIRECTORS
Phillip Hearse Non-Executive Chairman
Qualifications
MBA, BSc (Metallurgy), FAusIMM
Experience
Mr Hearse is one of Australia’s most respected mining professionals with 40 years’ experience in diverse and challenging projects around the world. His extensive career has taken him from operational and technical support roles at Broken Hill, Bougainville Copper, Queensland Nickel (QNI) and Gove Alumina to senior executive and managerial positions. Phil founded and managed Normet Pty Ltd, one of Australia’s major metallurgical and risk assessment companies for 18 years. He also held the key role of Director Advisory with GRD Minproc Ltd (now Amec Foster Wheeler) from 2001 to 2005. Over the last 10 years, he has held significant roles in the development of a number of projects globally including numerous graphite projects located in both Australia and East Africa. Other current directorships in listed entities
None
Thomas Revy Managing Director
Qualifications
BAppSc (Metallurgy), GradDipBus, MAusIMM
Experience
With more than 30 years’ experience within the resources industry Mr Revy is considered a corporate and project development specialist, with an extensive international network in the mining sector. Holding senior operational and corporate positions within reputable organisations including GRD Minproc, WorleyParsons and Ferrum Crescent, Mr Revy was most recently appointed as Managing Director of BlackEarth Minerals NL overseeing the development and listing of BEM on the Australian Securities Exchange. Other current directorships in listed entities
Chairman – Empire Resources Limited (resigned 23 April 2018)
George Bauk Non-Executive Director
Qualifications MBA, BBus, GAICD, FCPA
Experience
Mr Bauk has more than 28 years’ mining industry experience including particular expertise in critical metals. Regarded for his strategic management, business planning, establishment of high-performing teams and capital-raising skills, he has held senior operational and corporate positions with WMC Resources, Arafura Resources and Indago Resources (formerly Western Metals). Since 2010, Mr Bauk has also been Managing Director and CEO of Northern Minerals Limited, overseeing that company’s heavy rare earth project moving to production in northern Australia. Other current directorships in listed entities
Chairman – Lithium Australia NL Managing Director – Northern Minerals Limited
For
per
sona
l use
onl
y
DIRECTORS’ REPORT (Continued)
Page 4
COMPANY SECRETARY
Barry Woodhouse Qualifications BCom, BLaws, CPA, FCIS, FGIA
Experience
Mr Woodhouse is a CPA and a Fellow of Governance Institute of Australia and has almost 30 years’ experience in the junior mineral exploration, mineral production, mining services and manufacturing sectors in both private and public companies in Australian and foreign jurisdictions. Mr Woodhouse has held roles including CFO, Company Secretary, Director and Chairman.
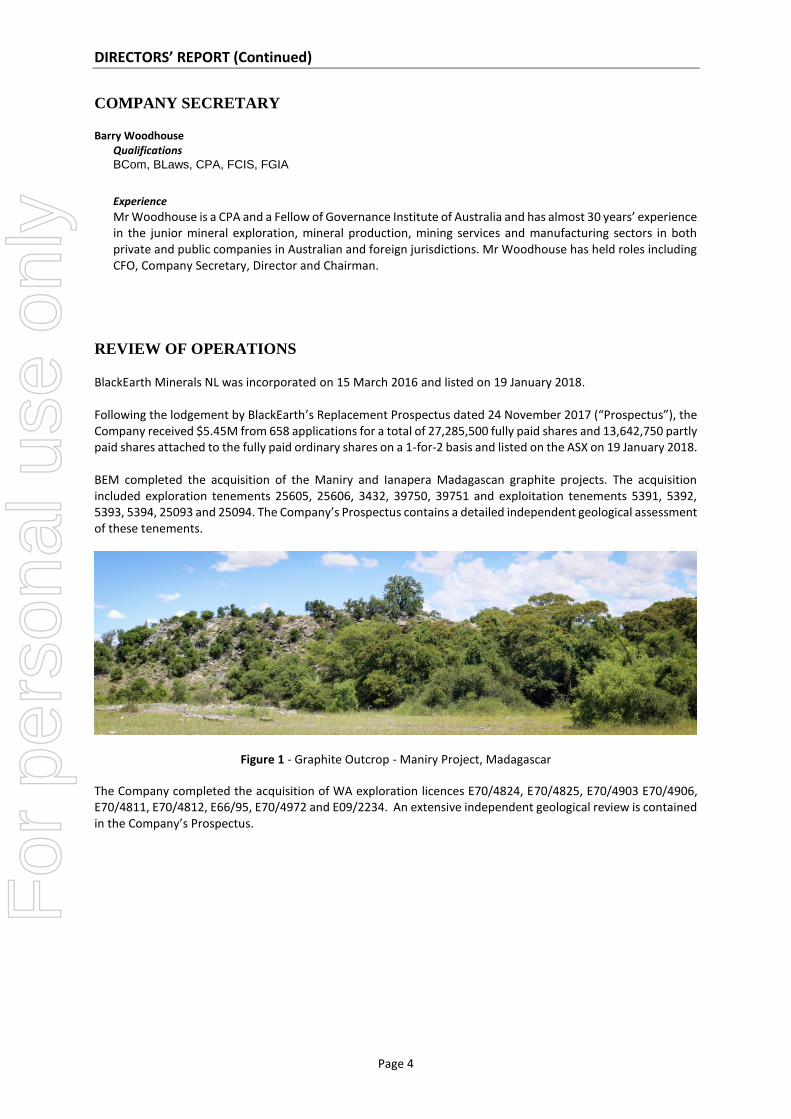
REVIEW OF OPERATIONS BlackEarth Minerals NL was incorporated on 15 March 2016 and listed on 19 January 2018. Following the lodgement by BlackEarth’s Replacement Prospectus dated 24 November 2017 (“Prospectus”), the Company received $5.45M from 658 applications for a total of 27,285,500 fully paid shares and 13,642,750 partly paid shares attached to the fully paid ordinary shares on a 1-for-2 basis and listed on the ASX on 19 January 2018. BEM completed the acquisition of the Maniry and Ianapera Madagascan graphite projects. The acquisition included exploration tenements 25605, 25606, 3432, 39750, 39751 and exploitation tenements 5391, 5392, 5393, 5394, 25093 and 25094. The Company’s Prospectus contains a detailed independent geological assessment of these tenements.
Figure 1 - Graphite Outcrop - Maniry Project, Madagascar
The Company completed the acquisition of WA exploration licences E70/4824, E70/4825, E70/4903 E70/4906, E70/4811, E70/4812, E66/95, E70/4972 and E09/2234. An extensive independent geological review is contained in the Company’s Prospectus.
For
per
sona
l use
onl
y
DIRECTORS’ REPORT (Continued)
Page 5
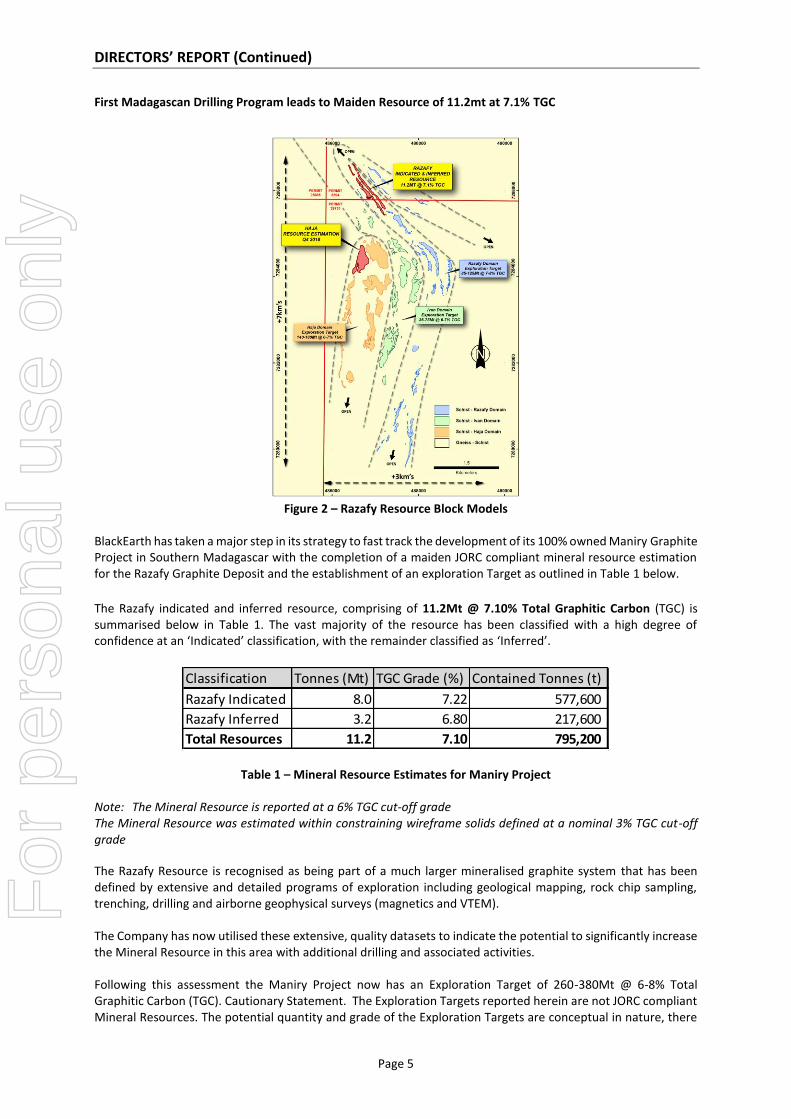
First Madagascan Drilling Program leads to Maiden Resource of 11.2mt at 7.1% TGC
Figure 2 – Razafy Resource Block Models
BlackEarth has taken a major step in its strategy to fast track the development of its 100% owned Maniry Graphite Project in Southern Madagascar with the completion of a maiden JORC compliant mineral resource estimation for the Razafy Graphite Deposit and the establishment of an exploration Target as outlined in Table 1 below.
The Razafy indicated and inferred resource, comprising of 11.2Mt @ 7.10% Total Graphitic Carbon (TGC) is summarised below in Table 1. The vast majority of the resource has been classified with a high degree of confidence at an ‘Indicated’ classification, with the remainder classified as ‘Inferred’.
Table 1 – Mineral Resource Estimates for Maniry Project Note: The Mineral Resource is reported at a 6% TGC cut-off grade The Mineral Resource was estimated within constraining wireframe solids defined at a nominal 3% TGC cut-off grade
The Razafy Resource is recognised as being part of a much larger mineralised graphite system that has been defined by extensive and detailed programs of exploration including geological mapping, rock chip sampling, trenching, drilling and airborne geophysical surveys (magnetics and VTEM). The Company has now utilised these extensive, quality datasets to indicate the potential to significantly increase the Mineral Resource in this area with additional drilling and associated activities. Following this assessment the Maniry Project now has an Exploration Target of 260-380Mt @ 6-8% Total Graphitic Carbon (TGC). Cautionary Statement. The Exploration Targets reported herein are not JORC compliant Mineral Resources. The potential quantity and grade of the Exploration Targets are conceptual in nature, there
Classification Tonnes (Mt) TGC Grade (%) Contained Tonnes (t)
Razafy Indicated 8.0 7.22 577,600
Razafy Inferred 3.2 6.80 217,600
Total Resources 11.2 7.10 795,200
For
per
sona
l use
onl
y
DIRECTORS’ REPORT (Continued)
Page 6
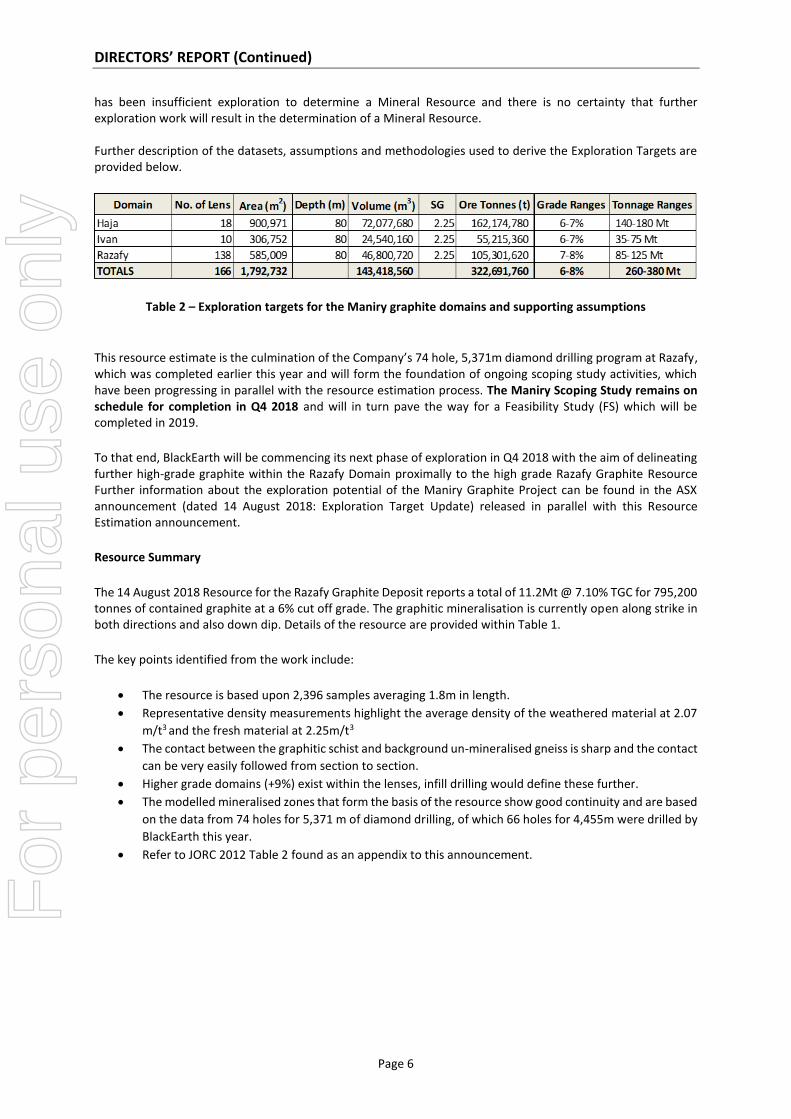
has been insufficient exploration to determine a Mineral Resource and there is no certainty that further exploration work will result in the determination of a Mineral Resource. Further description of the datasets, assumptions and methodologies used to derive the Exploration Targets are provided below.
Table 2 – Exploration targets for the Maniry graphite domains and supporting assumptions
This resource estimate is the culmination of the Company’s 74 hole, 5,371m diamond drilling program at Razafy, which was completed earlier this year and will form the foundation of ongoing scoping study activities, which have been progressing in parallel with the resource estimation process. The Maniry Scoping Study remains on schedule for completion in Q4 2018 and will in turn pave the way for a Feasibility Study (FS) which will be completed in 2019.
To that end, BlackEarth will be commencing its next phase of exploration in Q4 2018 with the aim of delineating further high-grade graphite within the Razafy Domain proximally to the high grade Razafy Graphite Resource Further information about the exploration potential of the Maniry Graphite Project can be found in the ASX announcement (dated 14 August 2018: Exploration Target Update) released in parallel with this Resource Estimation announcement.
Resource Summary
The 14 August 2018 Resource for the Razafy Graphite Deposit reports a total of 11.2Mt @ 7.10% TGC for 795,200 tonnes of contained graphite at a 6% cut off grade. The graphitic mineralisation is currently open along strike in both directions and also down dip. Details of the resource are provided within Table 1.
The key points identified from the work include:
• The resource is based upon 2,396 samples averaging 1.8m in length.
• Representative density measurements highlight the average density of the weathered material at 2.07
m/t3 and the fresh material at 2.25m/t3
• The contact between the graphitic schist and background un-mineralised gneiss is sharp and the contact
can be very easily followed from section to section.
• Higher grade domains (+9%) exist within the lenses, infill drilling would define these further.
• The modelled mineralised zones that form the basis of the resource show good continuity and are based
on the data from 74 holes for 5,371 m of diamond drilling, of which 66 holes for 4,455m were drilled by
BlackEarth this year.
• Refer to JORC 2012 Table 2 found as an appendix to this announcement.
For
per
sona
l use
onl
y
DIRECTORS’ REPORT (Continued)
Page 7
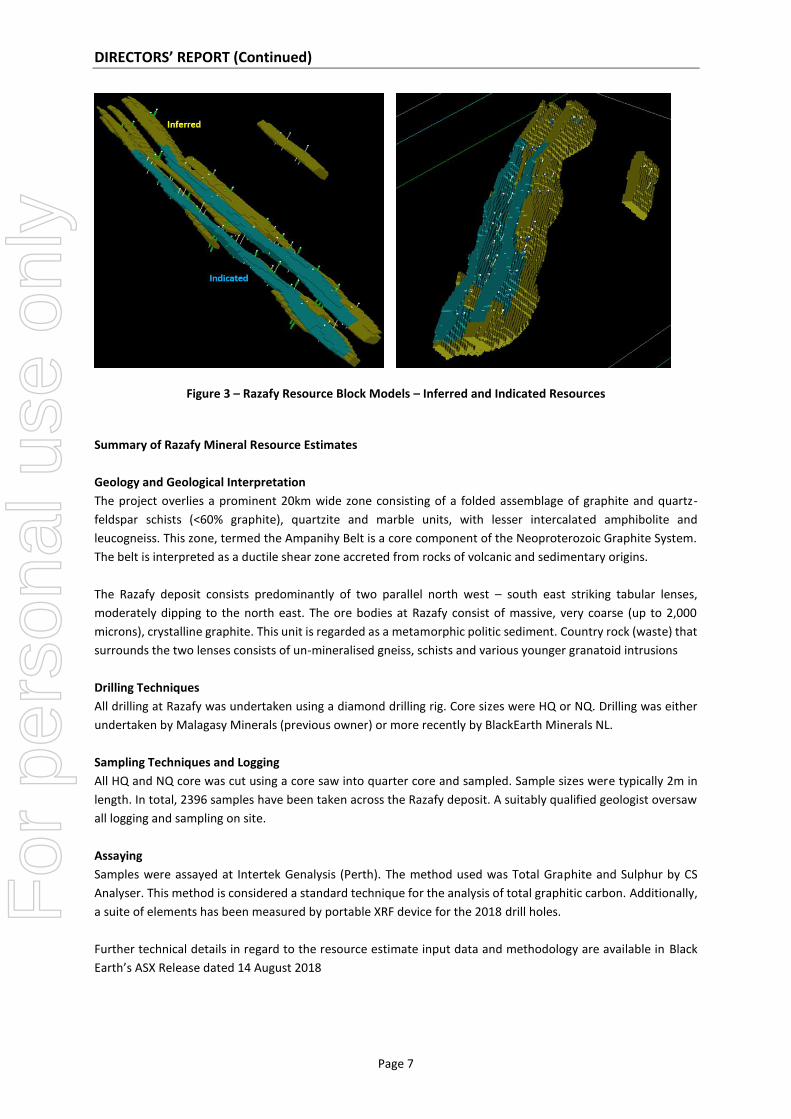
Figure 3 – Razafy Resource Block Models – Inferred and Indicated Resources
Summary of Razafy Mineral Resource Estimates
Geology and Geological Interpretation
The project overlies a prominent 20km wide zone consisting of a folded assemblage of graphite and quartz-
feldspar schists (<60% graphite), quartzite and marble units, with lesser intercalated amphibolite and
leucogneiss. This zone, termed the Ampanihy Belt is a core component of the Neoproterozoic Graphite System.
The belt is interpreted as a ductile shear zone accreted from rocks of volcanic and sedimentary origins.
The Razafy deposit consists predominantly of two parallel north west – south east striking tabular lenses,
moderately dipping to the north east. The ore bodies at Razafy consist of massive, very coarse (up to 2,000
microns), crystalline graphite. This unit is regarded as a metamorphic politic sediment. Country rock (waste) that
surrounds the two lenses consists of un-mineralised gneiss, schists and various younger granatoid intrusions
Drilling Techniques
All drilling at Razafy was undertaken using a diamond drilling rig. Core sizes were HQ or NQ. Drilling was either
undertaken by Malagasy Minerals (previous owner) or more recently by BlackEarth Minerals NL.
Sampling Techniques and Logging
All HQ and NQ core was cut using a core saw into quarter core and sampled. Sample sizes were typically 2m in
length. In total, 2396 samples have been taken across the Razafy deposit. A suitably qualified geologist oversaw
all logging and sampling on site.
Assaying
Samples were assayed at Intertek Genalysis (Perth). The method used was Total Graphite and Sulphur by CS
Analyser. This method is considered a standard technique for the analysis of total graphitic carbon. Additionally,
a suite of elements has been measured by portable XRF device for the 2018 drill holes.
Further technical details in regard to the resource estimate input data and methodology are available in Black
Earth’s ASX Release dated 14 August 2018
For
per
sona
l use
onl
y
DIRECTORS’ REPORT (Continued)
Page 8
Maniry Project Exploration Targets There is currently a high-grade resource reported for the Razafy Prospect of 11.2 million tonnes @ 7.1% TGC for 795,200 tonnes of contained graphite (see ASX release dated 9 August 2018: Razafy Maiden Resource Estimation). The Razafy Resource is recognised as being part of a much larger mineralised graphite system that has been defined by extensive and detailed programs of exploration including geological mapping, rock chip sampling, trenching, drilling and airborne geophysical surveys (magnetics and VTEM). The Company has now utilised these extensive, quality datasets to indicate the potential to significantly increase the Mineral Resource in this area with additional drilling and associated activities. Following this assessment, the Maniry Project now has an Exploration Target of 260-380Mt @ 6-8% Total Graphitic Carbon (TGC). Cautionary Statement. The Exploration Targets reported herein are not JORC compliant Mineral Resources. The potential quantity and grade of the Exploration Targets are conceptual in nature, there has been insufficient exploration to determine a Mineral Resource and there is no certainty that further exploration work will result in the determination of a Mineral Resource. The description of the datasets, assumptions and methodologies used to derive the Exploration Targets are provided below. Drilling and Assay Data
• Drilling was undertaken at four separate Prospects and was completed either by Malagasy Minerals
Limited in February 2015 or BlackEarth in 2018 (See Table 1a and 1b and Appendix A for details).
• All drilling is NQ diamond.
• The drilling has been fully verified as to its locational accuracy, sampling protocols and analytical quality
control procedures.
• A Certified Australian Laboratory completed all assaying.
Geological Mapping and Rock Chip Sampling
• Malagasy Minerals Limited completed extensive programs of detailed geological mapping and
associated rock chip sampling in September 2012 (See Table 2 and Appendix A for details).
• This work identified that the geology in the Maniry area was up to 80% outcropping and that the
graphite mineralisation was highly visual in nature (Figures 1-3).
• The graphite mineralisation is hosted within a highly deformed sequence of felsic gneissic rocks (ex-
sediments).
• Higher-grade zones have been interpreted to be associated locally with parasitic folds and more
regionally with major fold closures.
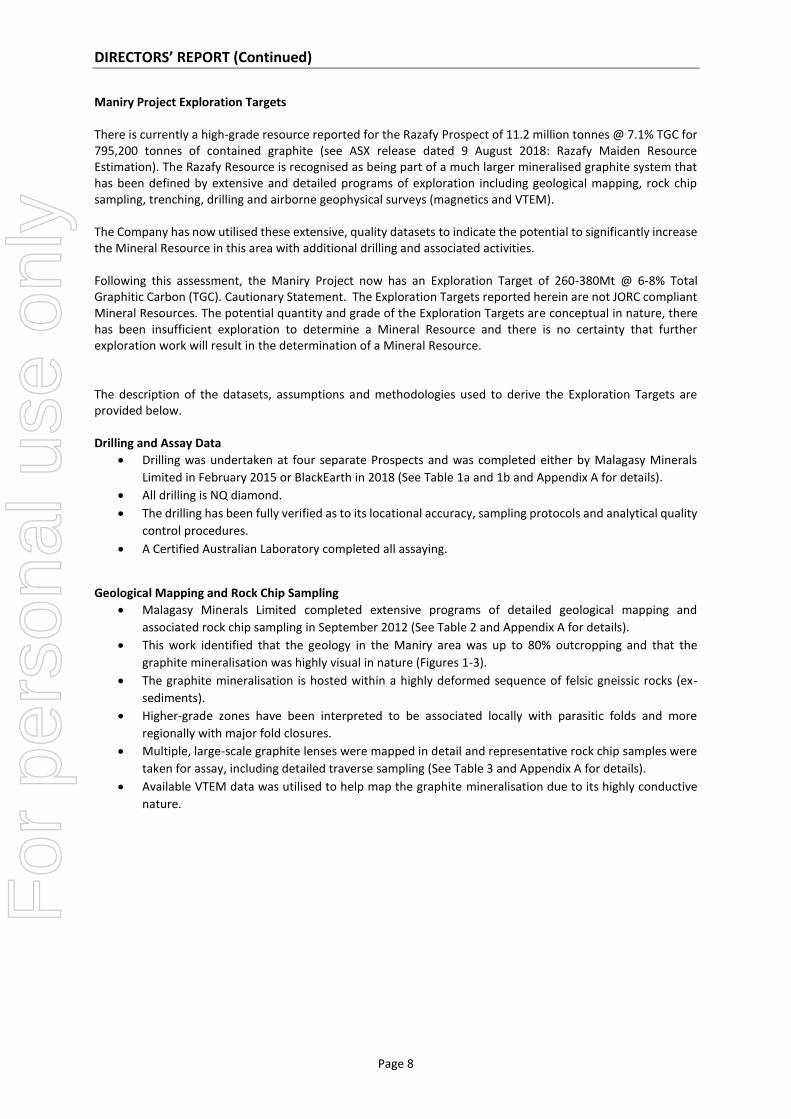
• Multiple, large-scale graphite lenses were mapped in detail and representative rock chip samples were
taken for assay, including detailed traverse sampling (See Table 3 and Appendix A for details).
• Available VTEM data was utilised to help map the graphite mineralisation due to its highly conductive
nature.
For
per
sona
l use
onl
y
DIRECTORS’ REPORT (Continued)
Page 9
Figure 4: Maniry Summary Plan
Figure 5: Regional Rock-chip Samples Over VTEM Data
Figure 6: Traverse Sampling Locations and Results
Trenching
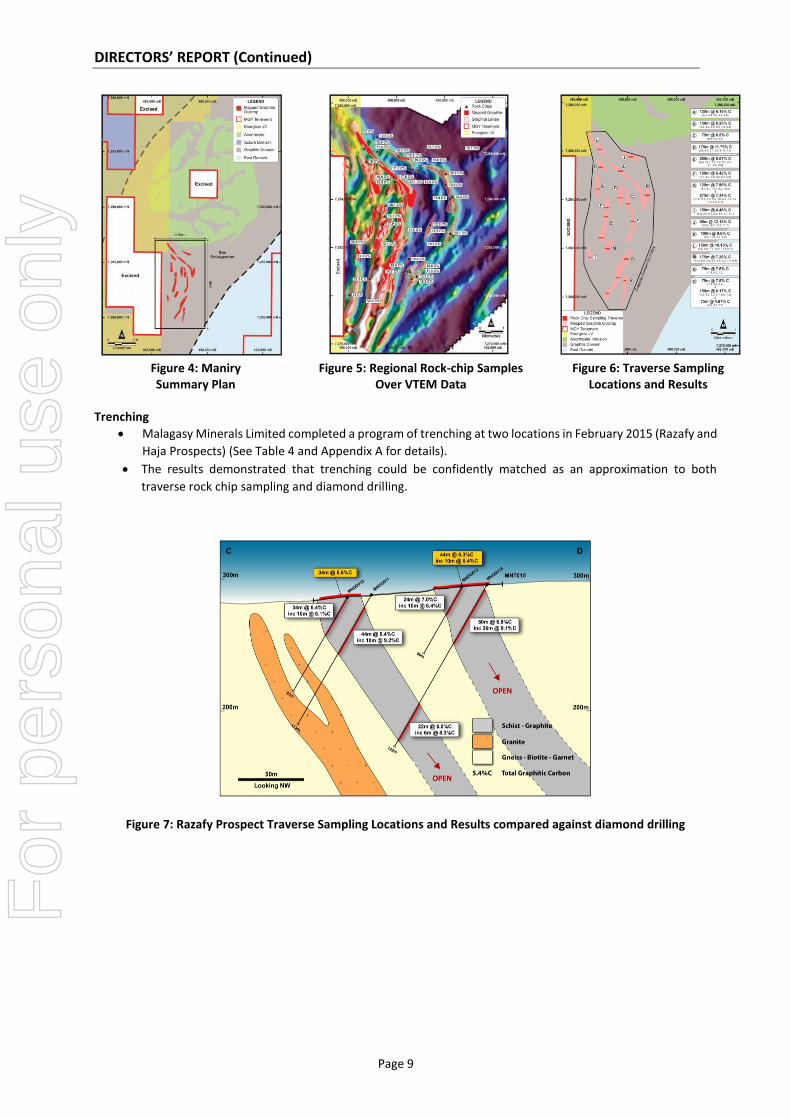
• Malagasy Minerals Limited completed a program of trenching at two locations in February 2015 (Razafy and
Haja Prospects) (See Table 4 and Appendix A for details).
• The results demonstrated that trenching could be confidently matched as an approximation to both
traverse rock chip sampling and diamond drilling.
Figure 7: Razafy Prospect Traverse Sampling Locations and Results compared against diamond drilling
For
per
sona
l use
onl
y
DIRECTORS’ REPORT (Continued)
Page 10
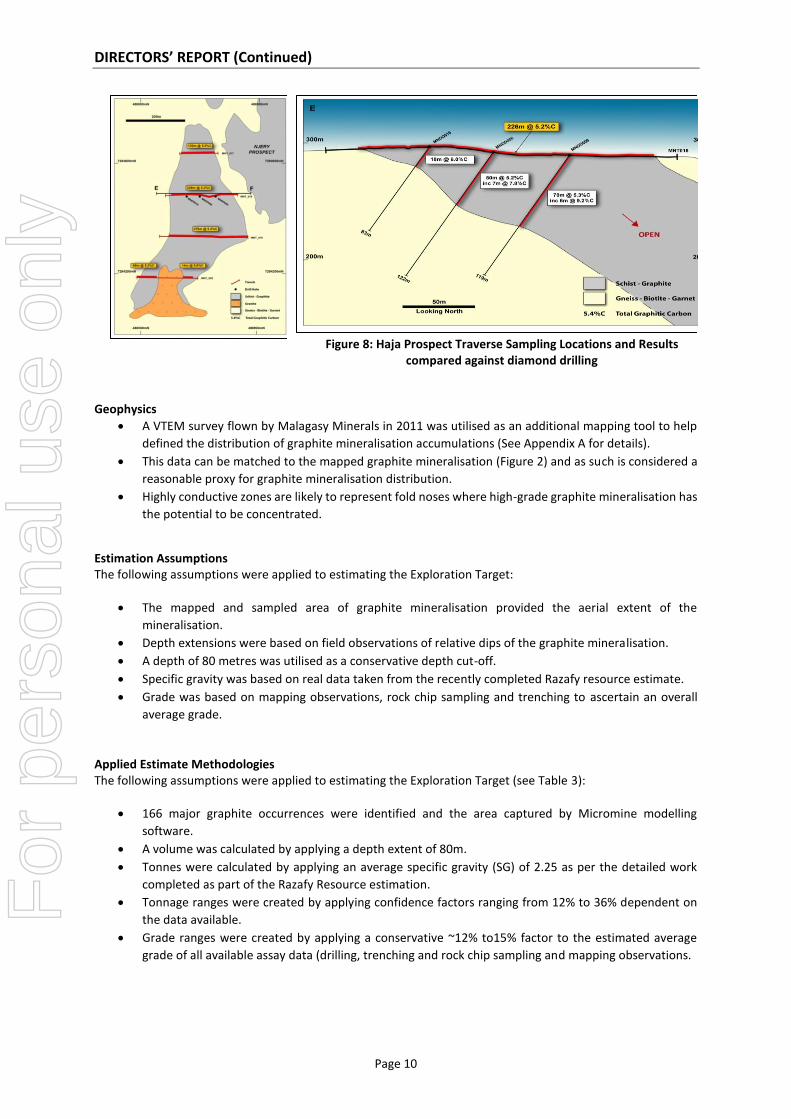
Figure 8: Haja Prospect Traverse Sampling Locations and Results
compared against diamond drilling
Geophysics
• A VTEM survey flown by Malagasy Minerals in 2011 was utilised as an additional mapping tool to help
defined the distribution of graphite mineralisation accumulations (See Appendix A for details).
• This data can be matched to the mapped graphite mineralisation (Figure 2) and as such is considered a
reasonable proxy for graphite mineralisation distribution.
• Highly conductive zones are likely to represent fold noses where high-grade graphite mineralisation has
the potential to be concentrated.
Estimation Assumptions The following assumptions were applied to estimating the Exploration Target:
• The mapped and sampled area of graphite mineralisation provided the aerial extent of the
mineralisation.
• Depth extensions were based on field observations of relative dips of the graphite mineralisation.
• A depth of 80 metres was utilised as a conservative depth cut-off.
• Specific gravity was based on real data taken from the recently completed Razafy resource estimate.
• Grade was based on mapping observations, rock chip sampling and trenching to ascertain an overall
average grade.
Applied Estimate Methodologies The following assumptions were applied to estimating the Exploration Target (see Table 3):
• 166 major graphite occurrences were identified and the area captured by Micromine modelling
software.
• A volume was calculated by applying a depth extent of 80m.
• Tonnes were calculated by applying an average specific gravity (SG) of 2.25 as per the detailed work
completed as part of the Razafy Resource estimation.
• Tonnage ranges were created by applying confidence factors ranging from 12% to 36% dependent on
the data available.
• Grade ranges were created by applying a conservative ~12% to15% factor to the estimated average
grade of all available assay data (drilling, trenching and rock chip sampling and mapping observations.
For
per
sona
l use
onl
y
DIRECTORS’ REPORT (Continued)
Page 11
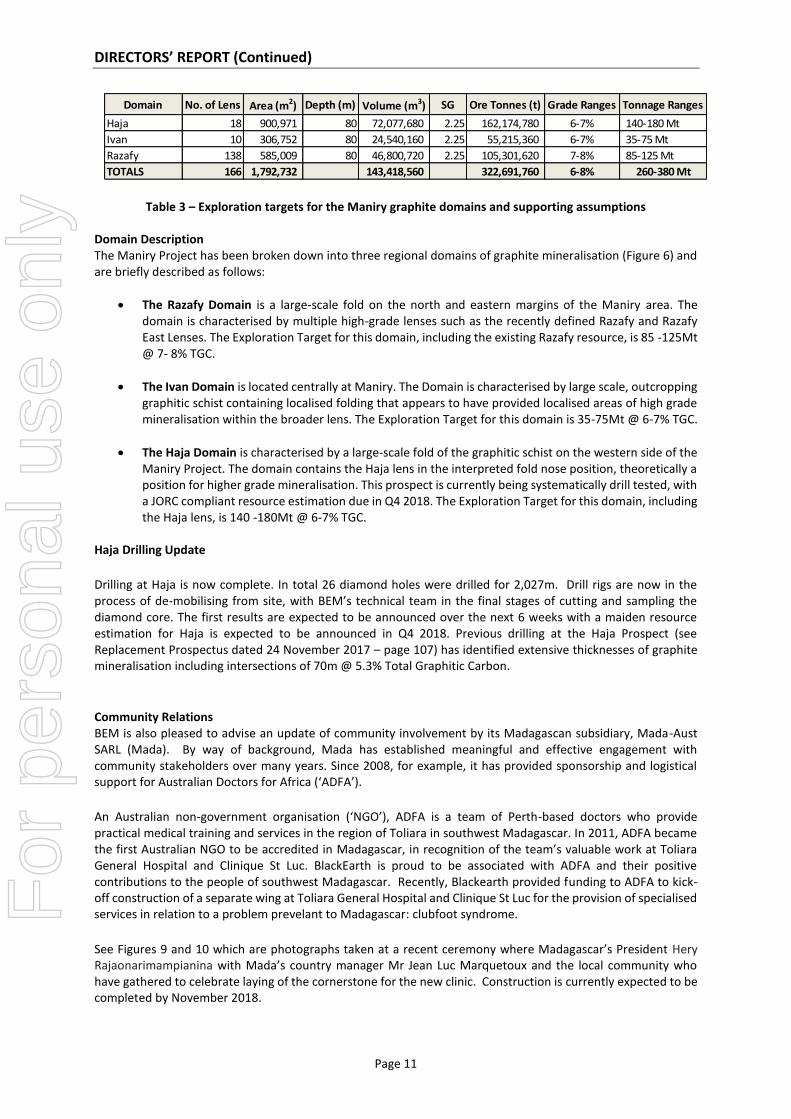
Table 3 – Exploration targets for the Maniry graphite domains and supporting assumptions Domain Description The Maniry Project has been broken down into three regional domains of graphite mineralisation (Figure 6) and are briefly described as follows:
• The Razafy Domain is a large-scale fold on the north and eastern margins of the Maniry area. The domain is characterised by multiple high-grade lenses such as the recently defined Razafy and Razafy East Lenses. The Exploration Target for this domain, including the existing Razafy resource, is 85 -125Mt @ 7- 8% TGC.
• The Ivan Domain is located centrally at Maniry. The Domain is characterised by large scale, outcropping graphitic schist containing localised folding that appears to have provided localised areas of high grade mineralisation within the broader lens. The Exploration Target for this domain is 35-75Mt @ 6-7% TGC.
• The Haja Domain is characterised by a large-scale fold of the graphitic schist on the western side of the Maniry Project. The domain contains the Haja lens in the interpreted fold nose position, theoretically a position for higher grade mineralisation. This prospect is currently being systematically drill tested, with a JORC compliant resource estimation due in Q4 2018. The Exploration Target for this domain, including the Haja lens, is 140 -180Mt @ 6-7% TGC.
Haja Drilling Update
Drilling at Haja is now complete. In total 26 diamond holes were drilled for 2,027m. Drill rigs are now in the process of de-mobilising from site, with BEM’s technical team in the final stages of cutting and sampling the diamond core. The first results are expected to be announced over the next 6 weeks with a maiden resource estimation for Haja is expected to be announced in Q4 2018. Previous drilling at the Haja Prospect (see Replacement Prospectus dated 24 November 2017 – page 107) has identified extensive thicknesses of graphite mineralisation including intersections of 70m @ 5.3% Total Graphitic Carbon.
Community Relations BEM is also pleased to advise an update of community involvement by its Madagascan subsidiary, Mada-Aust SARL (Mada). By way of background, Mada has established meaningful and effective engagement with community stakeholders over many years. Since 2008, for example, it has provided sponsorship and logistical support for Australian Doctors for Africa (‘ADFA’).
An Australian non-government organisation (‘NGO’), ADFA is a team of Perth-based doctors who provide practical medical training and services in the region of Toliara in southwest Madagascar. In 2011, ADFA became the first Australian NGO to be accredited in Madagascar, in recognition of the team’s valuable work at Toliara General Hospital and Clinique St Luc. BlackEarth is proud to be associated with ADFA and their positive contributions to the people of southwest Madagascar. Recently, Blackearth provided funding to ADFA to kick-off construction of a separate wing at Toliara General Hospital and Clinique St Luc for the provision of specialised services in relation to a problem prevelant to Madagascar: clubfoot syndrome.
See Figures 9 and 10 which are photographs taken at a recent ceremony where Madagascar’s President Hery Rajaonarimampianina with Mada’s country manager Mr Jean Luc Marquetoux and the local community who have gathered to celebrate laying of the cornerstone for the new clinic. Construction is currently expected to be completed by November 2018.
Domain No. of Lens Area (m2) Depth (m) Volume (m3) SG Ore Tonnes (t) Grade Ranges Tonnage Ranges
Haja 18 900,971 80 72,077,680 2.25 162,174,780 6-7% 140-180 Mt
Ivan 10 306,752 80 24,540,160 2.25 55,215,360 6-7% 35-75 Mt
Razafy 138 585,009 80 46,800,720 2.25 105,301,620 7-8% 85-125 Mt
TOTALS 166 1,792,732 143,418,560 322,691,760 6-8% 260-380 Mt
For
per
sona
l use
onl
y

DIRECTORS’ REPORT (Continued)
Page 12
Figure 9 - Madagascar's President Hery Rajaonarimampianina lays the cornerstone
Figure 10 - Completion of ceremony laying the cornerstones
BlackEarth will continue its partnerships with the local communities in which it operates, to ensure positive and enduring impacts well into the future.
Western Australia At 30 June 2018, BlackEarth had the following assets in Western Australia: Donnelly River – 2 granted exploration licences in close proximity to historic graphite workings from the early 1900’s. Greenhills - 4 granted exploration licences. Northern Gully – 1 granted exploration licence with known graphite occurrences, associated with the Lady Sampson Mine. Yalbra – 1 granted exploration licence These projects were reviewed during the period in order to compile exploration plans.
For
per
sona
l use
onl
y
DIRECTORS’ REPORT (Continued)
Page 13
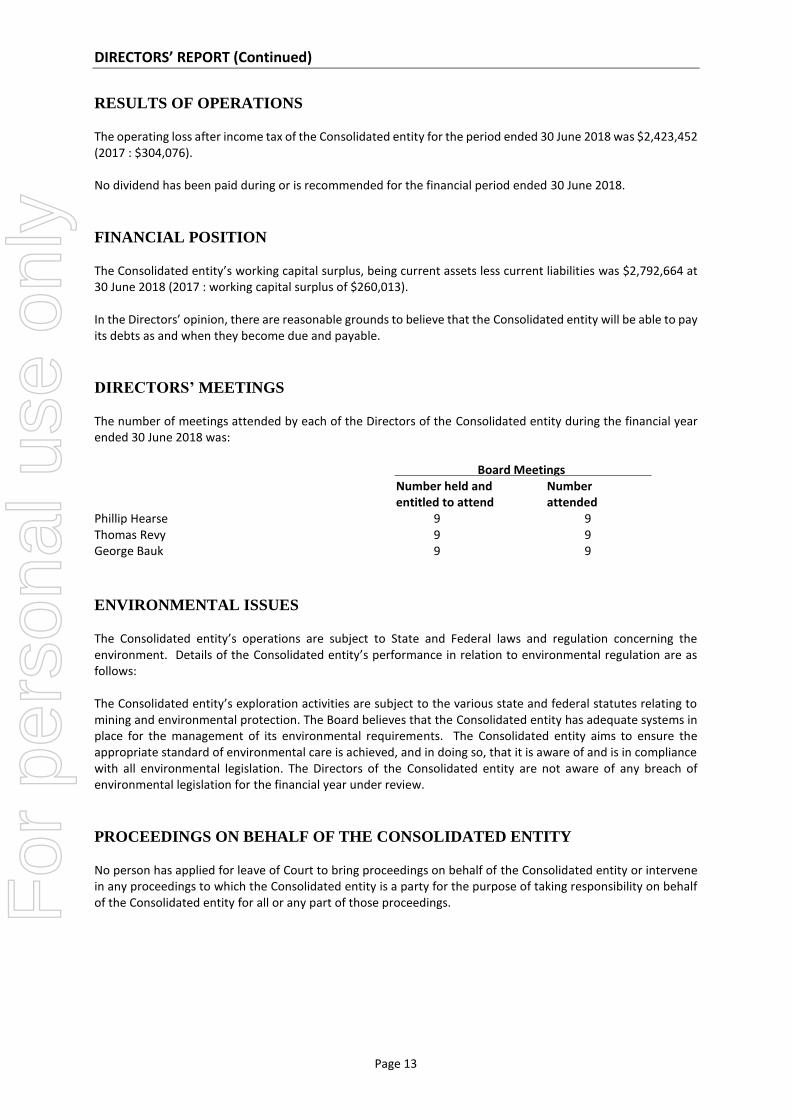
RESULTS OF OPERATIONS The operating loss after income tax of the Consolidated entity for the period ended 30 June 2018 was $2,423,452 (2017 : $304,076). No dividend has been paid during or is recommended for the financial period ended 30 June 2018.
FINANCIAL POSITION The Consolidated entity’s working capital surplus, being current assets less current liabilities was $2,792,664 at 30 June 2018 (2017 : working capital surplus of $260,013). In the Directors’ opinion, there are reasonable grounds to believe that the Consolidated entity will be able to pay its debts as and when they become due and payable.
DIRECTORS’ MEETINGS The number of meetings attended by each of the Directors of the Consolidated entity during the financial year ended 30 June 2018 was: Board Meetings Number held and Number entitled to attend attended Phillip Hearse 9 9 Thomas Revy 9 9 George Bauk 9 9
ENVIRONMENTAL ISSUES The Consolidated entity’s operations are subject to State and Federal laws and regulation concerning the environment. Details of the Consolidated entity’s performance in relation to environmental regulation are as follows: The Consolidated entity’s exploration activities are subject to the various state and federal statutes relating to mining and environmental protection. The Board believes that the Consolidated entity has adequate systems in place for the management of its environmental requirements. The Consolidated entity aims to ensure the appropriate standard of environmental care is achieved, and in doing so, that it is aware of and is in compliance with all environmental legislation. The Directors of the Consolidated entity are not aware of any breach of environmental legislation for the financial year under review.
PROCEEDINGS ON BEHALF OF THE CONSOLIDATED ENTITY No person has applied for leave of Court to bring proceedings on behalf of the Consolidated entity or intervene in any proceedings to which the Consolidated entity is a party for the purpose of taking responsibility on behalf of the Consolidated entity for all or any part of those proceedings.
For
per
sona
l use
onl
y
DIRECTORS’ REPORT (Continued)
Page 14
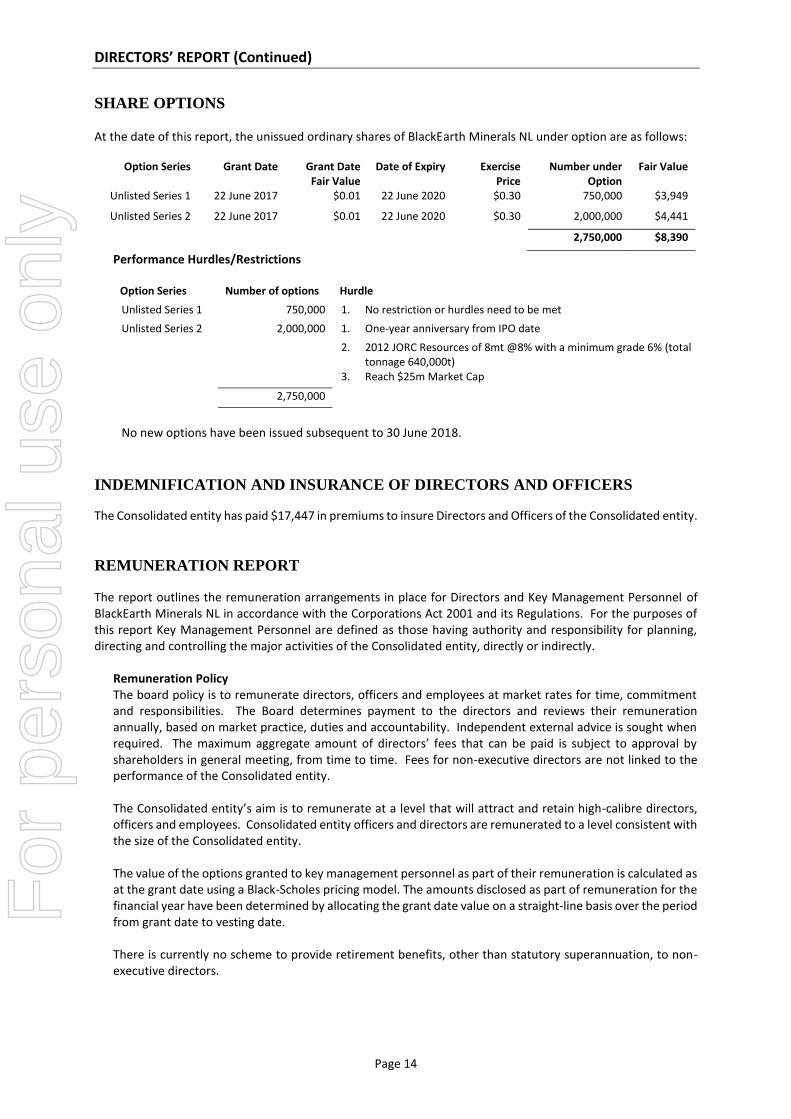
SHARE OPTIONS At the date of this report, the unissued ordinary shares of BlackEarth Minerals NL under option are as follows:
Option Series Grant Date Grant Date Fair Value
Date of Expiry Exercise Price
Number under Option
Fair Value
Unlisted Series 1 22 June 2017 $0.01 22 June 2020 $0.30 750,000 $3,949
Unlisted Series 2 22 June 2017 $0.01 22 June 2020 $0.30 2,000,000 $4,441
2,750,000 $8,390
Performance Hurdles/Restrictions
Option Series Number of options Hurdle
Unlisted Series 1 750,000 1. No restriction or hurdles need to be met
Unlisted Series 2 2,000,000 1. One-year anniversary from IPO date
2. 2012 JORC Resources of 8mt @8% with a minimum grade 6% (total tonnage 640,000t)
3. Reach $25m Market Cap
2,750,000
No new options have been issued subsequent to 30 June 2018.
INDEMNIFICATION AND INSURANCE OF DIRECTORS AND OFFICERS
The Consolidated entity has paid $17,447 in premiums to insure Directors and Officers of the Consolidated entity.
REMUNERATION REPORT
The report outlines the remuneration arrangements in place for Directors and Key Management Personnel of BlackEarth Minerals NL in accordance with the Corporations Act 2001 and its Regulations. For the purposes of this report Key Management Personnel are defined as those having authority and responsibility for planning, directing and controlling the major activities of the Consolidated entity, directly or indirectly.
Remuneration Policy The board policy is to remunerate directors, officers and employees at market rates for time, commitment and responsibilities. The Board determines payment to the directors and reviews their remuneration annually, based on market practice, duties and accountability. Independent external advice is sought when required. The maximum aggregate amount of directors’ fees that can be paid is subject to approval by shareholders in general meeting, from time to time. Fees for non-executive directors are not linked to the performance of the Consolidated entity. The Consolidated entity’s aim is to remunerate at a level that will attract and retain high-calibre directors, officers and employees. Consolidated entity officers and directors are remunerated to a level consistent with the size of the Consolidated entity. The value of the options granted to key management personnel as part of their remuneration is calculated as at the grant date using a Black-Scholes pricing model. The amounts disclosed as part of remuneration for the financial year have been determined by allocating the grant date value on a straight-line basis over the period from grant date to vesting date. There is currently no scheme to provide retirement benefits, other than statutory superannuation, to non-executive directors.
For
per
sona
l use
onl
y
DIRECTORS’ REPORT (Continued)
Page 15
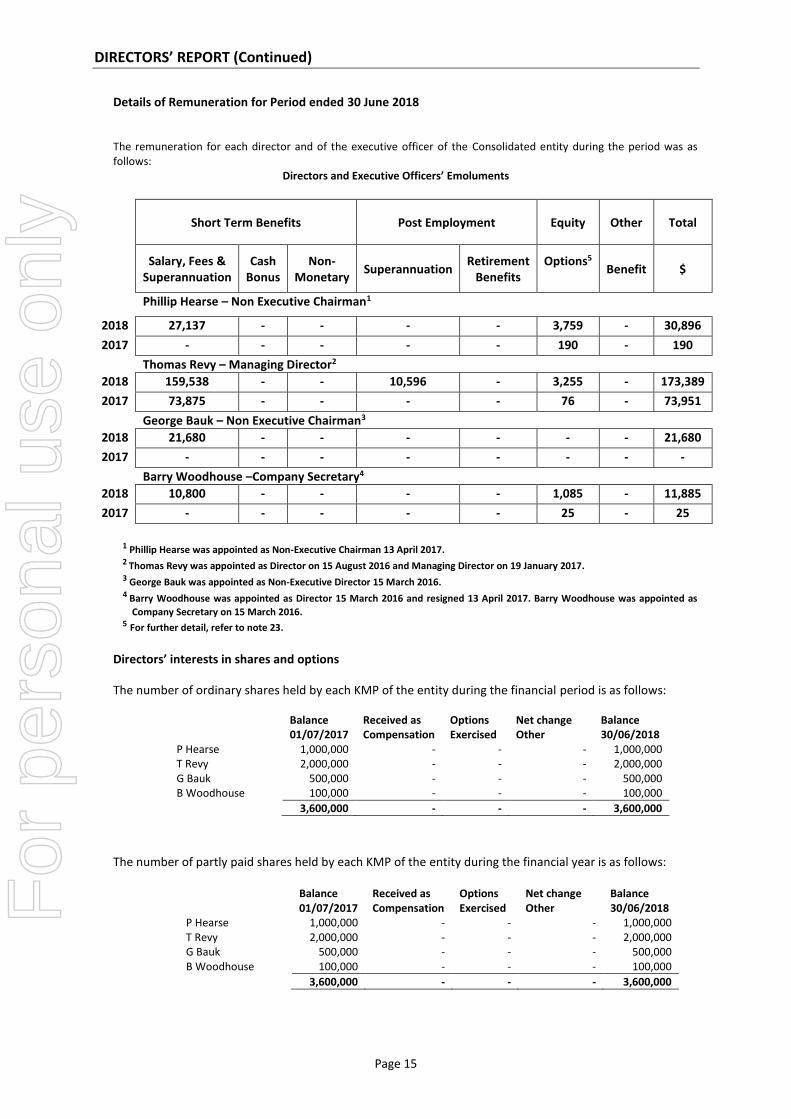
Details of Remuneration for Period ended 30 June 2018 The remuneration for each director and of the executive officer of the Consolidated entity during the period was as follows:
Directors and Executive Officers’ Emoluments
Short Term Benefits Post Employment Equity Other Total
Salary, Fees &
Superannuation Cash
Bonus Non-
Monetary Superannuation
Retirement Benefits
Options5
Benefit $
Phillip Hearse – Non Executive Chairman1
2018 27,137 - - - - 3,759 - 30,896
2017 - - - - - 190 - 190
Thomas Revy – Managing Director2
2018 159,538 - - 10,596 - 3,255 - 173,389
2017 73,875 - - - - 76 - 73,951
George Bauk – Non Executive Chairman3
2018 21,680 - - - - - - 21,680
2017 - - - - - - - -
Barry Woodhouse –Company Secretary4
2018 10,800 - - - - 1,085 - 11,885
2017 - - - - - 25 - 25
1 Phillip Hearse was appointed as Non-Executive Chairman 13 April 2017. 2 Thomas Revy was appointed as Director on 15 August 2016 and Managing Director on 19 January 2017. 3 George Bauk was appointed as Non-Executive Director 15 March 2016. 4 Barry Woodhouse was appointed as Director 15 March 2016 and resigned 13 April 2017. Barry Woodhouse was appointed as
Company Secretary on 15 March 2016. 5 For further detail, refer to note 23.
Directors’ interests in shares and options
The number of ordinary shares held by each KMP of the entity during the financial period is as follows:
Balance 01/07/2017
Received as Compensation
Options Exercised
Net change Other
Balance 30/06/2018
P Hearse 1,000,000 - - - 1,000,000 T Revy 2,000,000 - - - 2,000,000 G Bauk 500,000 - - - 500,000 B Woodhouse 100,000 - - - 100,000
3,600,000 - - - 3,600,000
The number of partly paid shares held by each KMP of the entity during the financial year is as follows:
Balance 01/07/2017
Received as Compensation
Options Exercised
Net change Other
Balance 30/06/2018
P Hearse 1,000,000 - - - 1,000,000 T Revy 2,000,000 - - - 2,000,000 G Bauk 500,000 - - - 500,000 B Woodhouse 100,000 - - - 100,000
3,600,000 - - - 3,600,000
For
per
sona
l use
onl
y
DIRECTORS’ REPORT (Continued)
Page 16
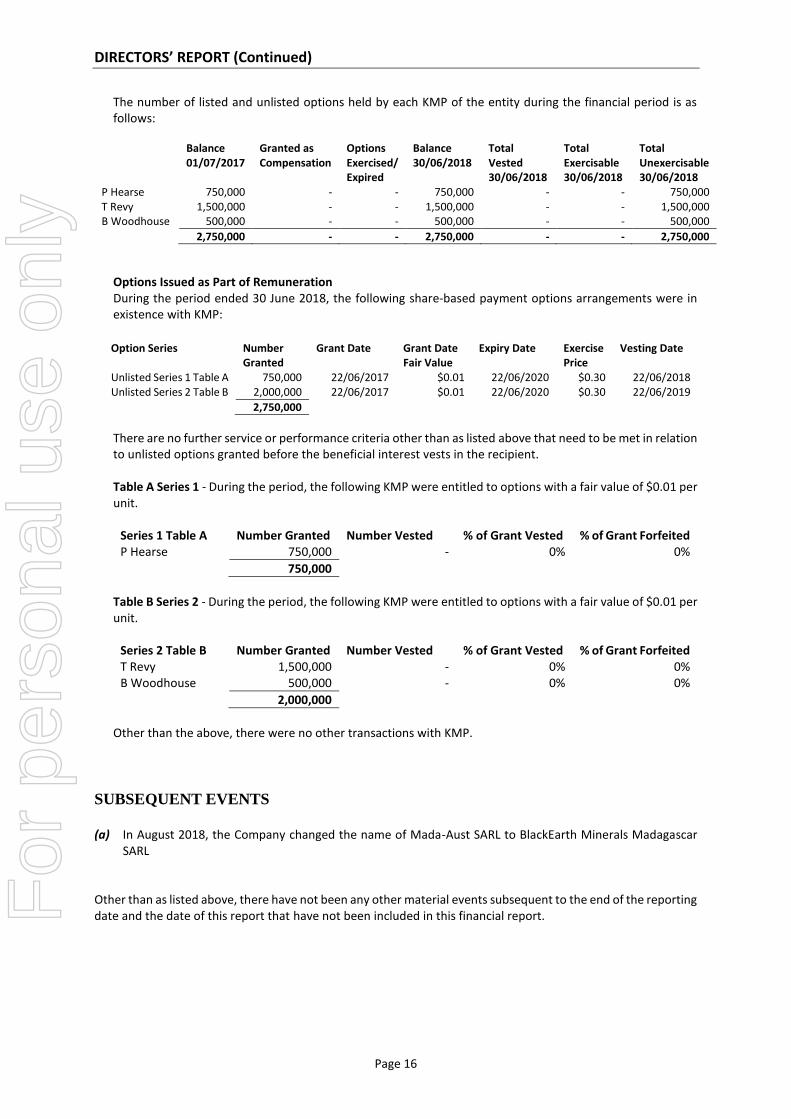
The number of listed and unlisted options held by each KMP of the entity during the financial period is as follows:
Balance
01/07/2017 Granted as Compensation
Options Exercised/Expired
Balance 30/06/2018
Total Vested 30/06/2018
Total Exercisable 30/06/2018
Total Unexercisable 30/06/2018
P Hearse 750,000 - - 750,000 - - 750,000 T Revy 1,500,000 - - 1,500,000 - - 1,500,000 B Woodhouse 500,000 - - 500,000 - - 500,000
2,750,000 - - 2,750,000 - - 2,750,000
Options Issued as Part of Remuneration During the period ended 30 June 2018, the following share-based payment options arrangements were in existence with KMP:
Option Series Number
Granted Grant Date Grant Date
Fair Value Expiry Date Exercise
Price Vesting Date
Unlisted Series 1 Table A 750,000 22/06/2017 $0.01 22/06/2020 $0.30 22/06/2018 Unlisted Series 2 Table B 2,000,000 22/06/2017 $0.01 22/06/2020 $0.30 22/06/2019
2,750,000
There are no further service or performance criteria other than as listed above that need to be met in relation to unlisted options granted before the beneficial interest vests in the recipient. Table A Series 1 - During the period, the following KMP were entitled to options with a fair value of $0.01 per unit.
Series 1 Table A Number Granted Number Vested % of Grant Vested % of Grant Forfeited P Hearse 750,000 - 0% 0%
750,000
Table B Series 2 - During the period, the following KMP were entitled to options with a fair value of $0.01 per unit.
Series 2 Table B Number Granted Number Vested % of Grant Vested % of Grant Forfeited T Revy 1,500,000 - 0% 0% B Woodhouse 500,000 - 0% 0%
2,000,000
Other than the above, there were no other transactions with KMP.
SUBSEQUENT EVENTS
(a) In August 2018, the Company changed the name of Mada-Aust SARL to BlackEarth Minerals Madagascar
SARL
Other than as listed above, there have not been any other material events subsequent to the end of the reporting date and the date of this report that have not been included in this financial report.
For
per
sona
l use
onl
y
DIRECTORS’ REPORT (Continued)
Page 17
AUDITOR’S INDEPENDENCE DECLARATION Section 307C of the Corporations Act 2001 requires our auditors, Bentley’s Audit and Corporate (WA) Pty Ltd, to provide the directors of the Consolidated entity with an Independence Declaration in relation to the audit of the financial report. This Independence Declaration is set out on page 17 and forms part of this directors’ report for the period ended 30 June 2018. This report has been made in accordance with a resolution of the Board of Directors. Thomas Revy Managing Director Dated at Perth this 26th September 2018 Competent Person’s Statement The information contained in this report that relates to Exploration Results and Mineral Resources is based on information compiled by Mr. Peter Langworthy, a member of The Australasian Institute of Mining and Metallurgy. Mr. Langworthy has sufficient experience that is relevant to the style of mineralisation and type of deposit under consideration and to the activity that he is undertaking to qualify as a Competent Person as defined in the 2012 edition of the “Australasian Code for Reporting of Exploration Results, Mineral Resources and Ore Reserves.” Mr. Langworthy consents to the inclusion in this report of the matters based on the information in the form and context in which it appears. The information in this report that relates to the Exploration Target for the Maniry Graphite Project is extracted from the report entitled “Exploration Target Update” dated 14 August 2018 and is available to view on the Company’s website (www.blackearthminerals.com.au). The Company confirms that it is not aware of any new information or data that materially affects the information included in the original market announcement and that all material assumptions and technical parameters underpinning the estimates in the relevant market announcement continue to apply and have not materially changed. The Company confirms that the form and context in which the Competent Person’s findings are presented have not been materially modified from the original market announcement. The information in this report that relates to the Maiden Resource Estimation for Razafy at the Maniry Graphite Project is extracted from the report entitled “Update – Maiden Resource Estimation for Razafy at the Maniry Graphite Project” dated 14 August 2018 and is available to view on the Company’s website (www.blackearthminerals.com.au). The Company confirms that it is not aware of any new information or data that materially affects the information included in the original market announcement and that all material assumptions and technical parameters underpinning the estimates in the relevant market announcement continue to apply and have not materially changed. The Company confirms that the form and context in which the Competent Person’s findings are presented have not been materially modified from the original market announcement.
For
per
sona
l use
onl
y
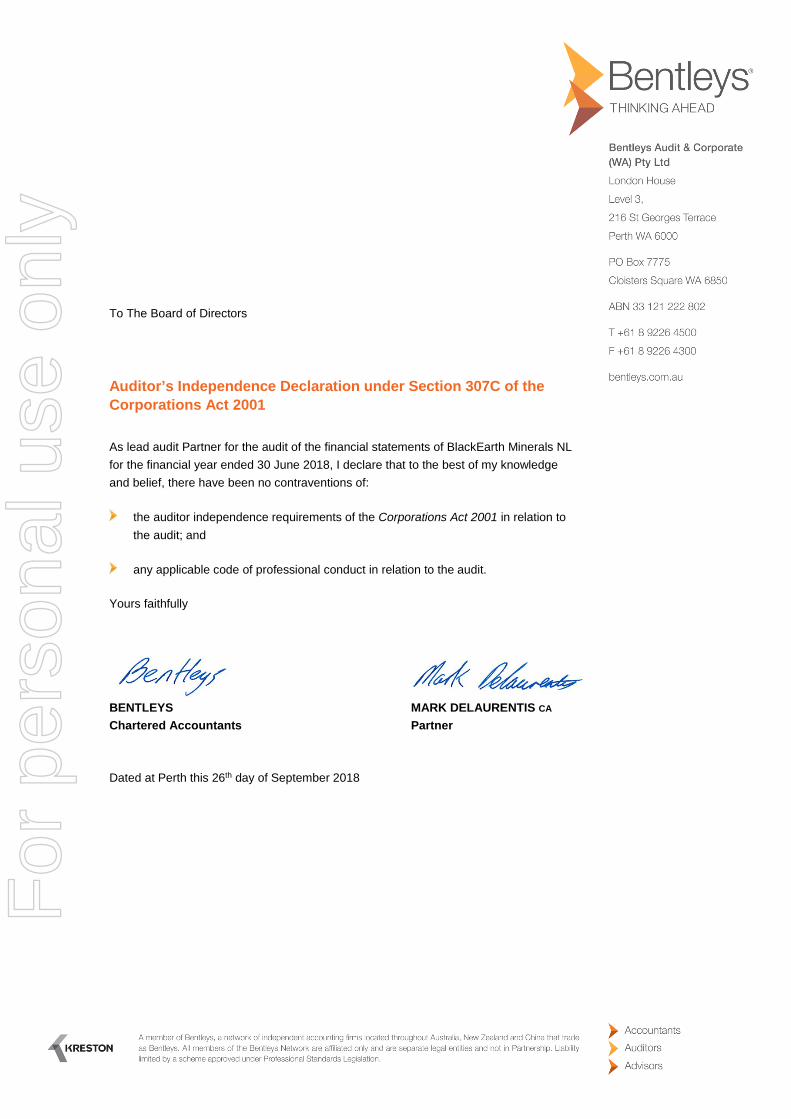
To The Board of Directors
Auditor’s Independence Declaration under Section 307C of the
Corporations Act 2001
As lead audit Partner for the audit of the financial statements of BlackEarth Minerals NL
for the financial year ended 30 June 2018, I declare that to the best of my knowledge
and belief, there have been no contraventions of:
the auditor independence requirements of the Corporations Act 2001 in relation to
the audit; and
any applicable code of professional conduct in relation to the audit.
Yours faithfully
BENTLEYS MARK DELAURENTIS CA
Chartered Accountants Partner
Dated at Perth this 26th day of September 2018
For
per
sona
l use
onl
y
Page 19
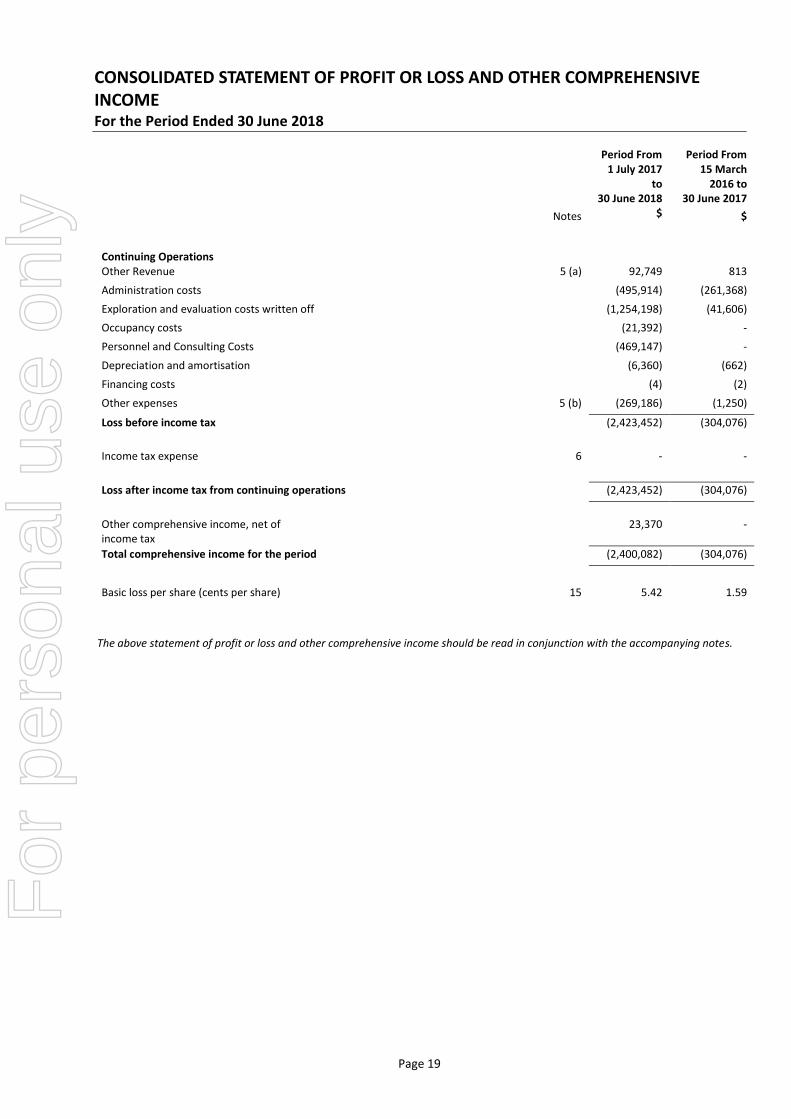
CONSOLIDATED STATEMENT OF PROFIT OR LOSS AND OTHER COMPREHENSIVE INCOME For the Period Ended 30 June 2018
Period From 1 July 2017
to 30 June 2018
Period From 15 March
2016 to 30 June 2017
Notes $ $
Continuing Operations
Other Revenue 5 (a) 92,749 813
Administration costs (495,914) (261,368)
Exploration and evaluation costs written off (1,254,198) (41,606)
Occupancy costs (21,392) -
Personnel and Consulting Costs (469,147) -
Depreciation and amortisation (6,360) (662)
Financing costs (4) (2)
Other expenses 5 (b) (269,186) (1,250)
Loss before income tax (2,423,452) (304,076)
Income tax expense 6 - -
Loss after income tax from continuing operations (2,423,452) (304,076)
Other comprehensive income, net of income tax
23,370 -
Total comprehensive income for the period (2,400,082) (304,076)
Basic loss per share (cents per share) 15 5.42 1.59
The above statement of profit or loss and other comprehensive income should be read in conjunction with the accompanying notes.
For
per
sona
l use
onl
y
Page 20
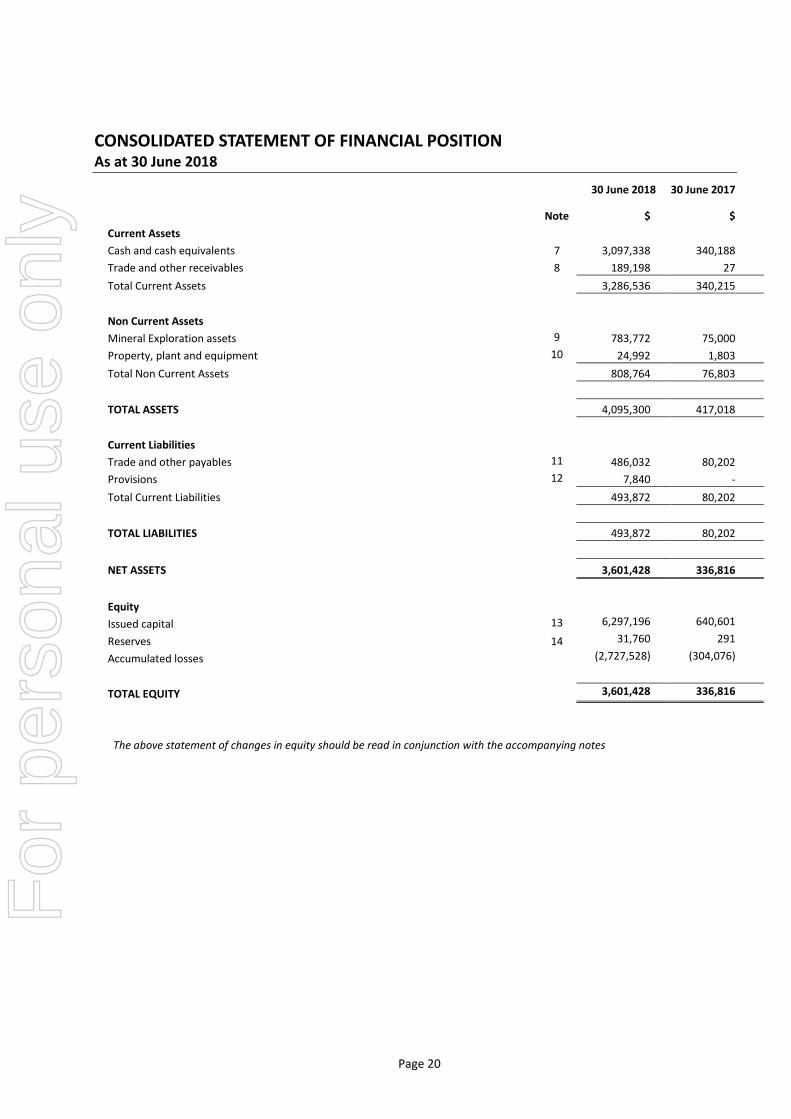
CONSOLIDATED STATEMENT OF FINANCIAL POSITION As at 30 June 2018
30 June 2018 30 June 2017
Note $ $
Current Assets
Cash and cash equivalents 7 3,097,338 340,188
Trade and other receivables 8 189,198 27
Total Current Assets 3,286,536 340,215
Non Current Assets
Mineral Exploration assets 9 783,772 75,000
Property, plant and equipment 10 24,992 1,803
Total Non Current Assets 808,764 76,803
TOTAL ASSETS 4,095,300 417,018
Current Liabilities
Trade and other payables 11 486,032 80,202
Provisions 12 7,840 -
Total Current Liabilities 493,872 80,202
TOTAL LIABILITIES 493,872 80,202
NET ASSETS 3,601,428 336,816
Equity
Issued capital 13 6,297,196 640,601
Reserves 14 31,760 291
Accumulated losses (2,727,528) (304,076)
TOTAL EQUITY 3,601,428 336,816
The above statement of changes in equity should be read in conjunction with the accompanying notes
For
per
sona
l use
onl
y
Page 21
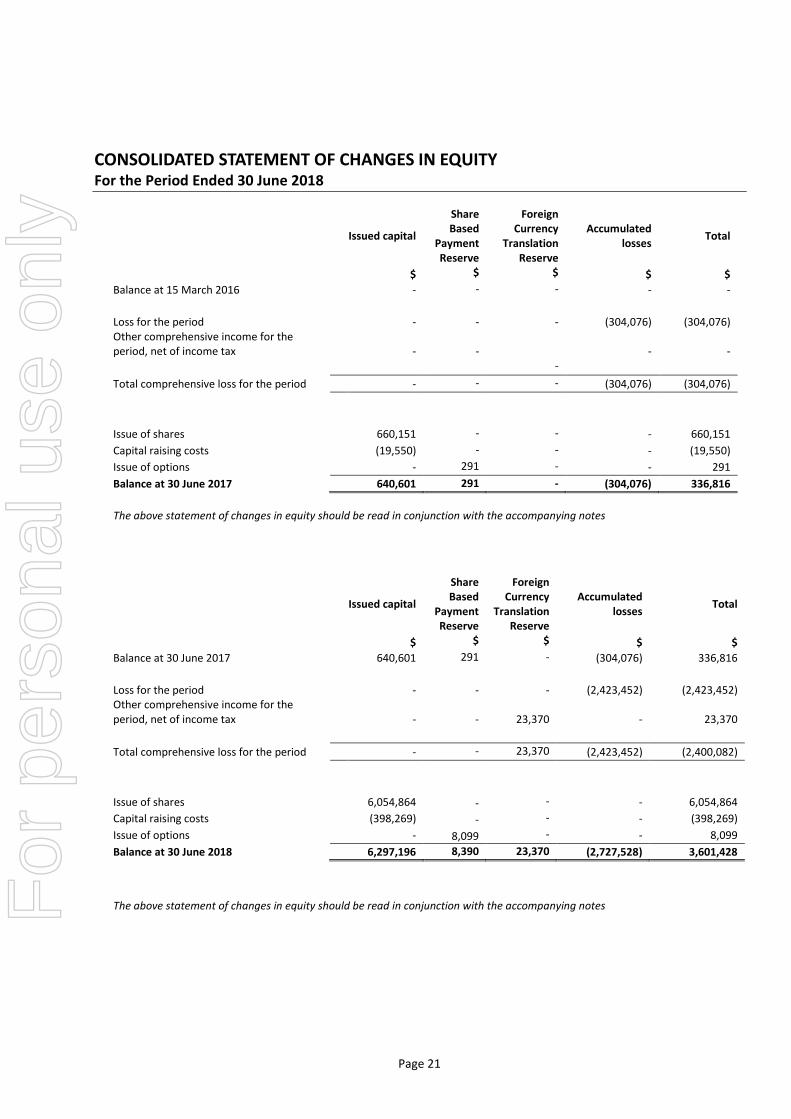
CONSOLIDATED STATEMENT OF CHANGES IN EQUITY For the Period Ended 30 June 2018
Issued capital
Share Based
Payment Reserve
Foreign Currency
Translation Reserve
Accumulated losses
Total
$ $ $ $ $
Balance at 15 March 2016 - - - - -
Loss for the period Other comprehensive income for the period, net of income tax
- - - (304,076) (304,076)
- -
- -
-
Total comprehensive loss for the period - - - (304,076) (304,076)
Issue of shares 660,151 - - - 660,151
Capital raising costs (19,550) - - - (19,550)
Issue of options - 291 - - 291
Balance at 30 June 2017 640,601 291 - (304,076) 336,816
The above statement of changes in equity should be read in conjunction with the accompanying notes
Issued capital
Share Based
Payment Reserve
Foreign Currency
Translation Reserve
Accumulated losses
Total
$ $ $ $ $
Balance at 30 June 2017 640,601 291 - (304,076) 336,816
Loss for the period Other comprehensive income for the period, net of income tax
- - - (2,423,452) (2,423,452)
- - 23,370 - 23,370
Total comprehensive loss for the period - - 23,370 (2,423,452) (2,400,082)
Issue of shares 6,054,864 - - - 6,054,864
Capital raising costs (398,269) - - - (398,269)
Issue of options - 8,099 - - 8,099
Balance at 30 June 2018 6,297,196 8,390 23,370 (2,727,528) 3,601,428
The above statement of changes in equity should be read in conjunction with the accompanying notes
For
per
sona
l use
onl
y
Page 22
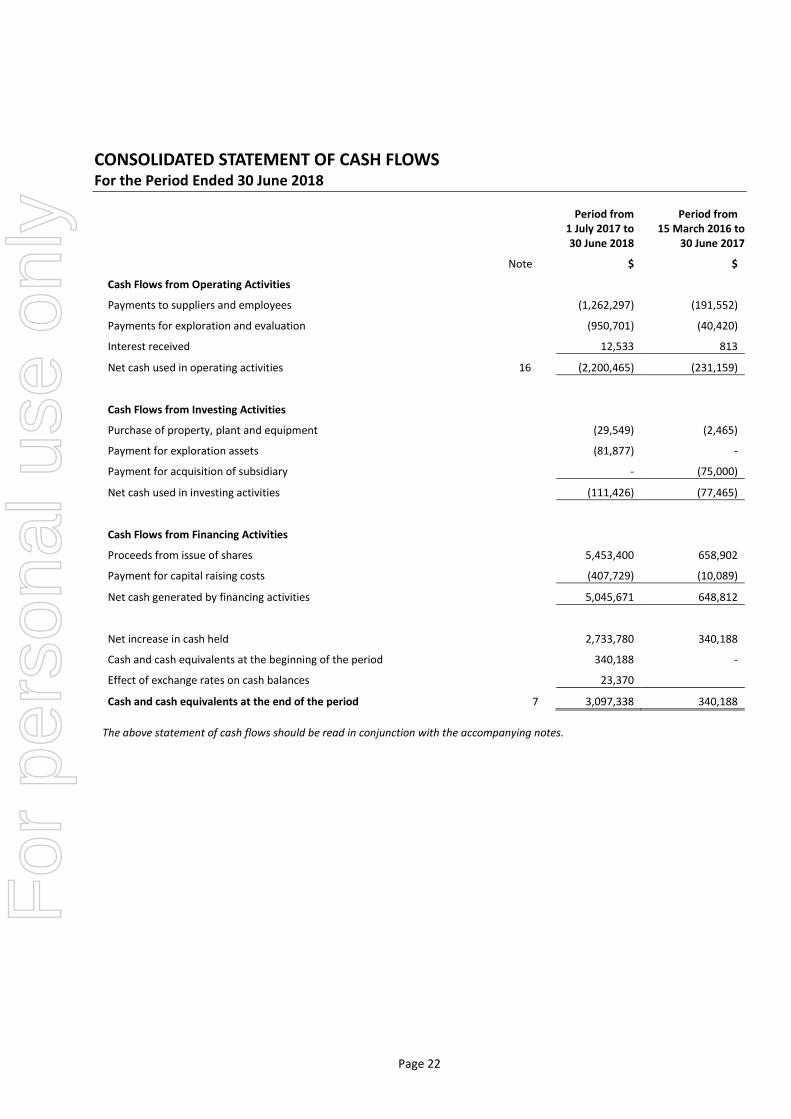
CONSOLIDATED STATEMENT OF CASH FLOWS For the Period Ended 30 June 2018
Period from 1 July 2017 to
30 June 2018
Period from 15 March 2016 to
30 June 2017
Note $ $
Cash Flows from Operating Activities
Payments to suppliers and employees (1,262,297) (191,552)
Payments for exploration and evaluation (950,701) (40,420)
Interest received 12,533 813
Net cash used in operating activities 16 (2,200,465) (231,159)
Cash Flows from Investing Activities
Purchase of property, plant and equipment (29,549) (2,465)
Payment for exploration assets (81,877) -
Payment for acquisition of subsidiary - (75,000)
Net cash used in investing activities (111,426) (77,465)
Cash Flows from Financing Activities
Proceeds from issue of shares 5,453,400 658,902
Payment for capital raising costs (407,729) (10,089)
Net cash generated by financing activities 5,045,671 648,812
Net increase in cash held 2,733,780 340,188
Cash and cash equivalents at the beginning of the period 340,188 -
Effect of exchange rates on cash balances 23,370
Cash and cash equivalents at the end of the period 7 3,097,338 340,188
The above statement of cash flows should be read in conjunction with the accompanying notes.
For
per
sona
l use
onl
y
Page 23
NOTES TO THE CONSOLIDATED FINANCIAL STATEMENTS For the period ended 30 June 2018
These consolidated financial statements and notes represent those of BlackEarth Minerals NL and its controlled entity (the “Consolidated entity”). BlackEarth Minerals NL is a no liability company, incorporated and domiciled in Australia.
The Consolidated entity is a for-profit entity for financial reporting purposes under Australian Accounting Standards. The financial statements for the period ended 30 June 2018 were approved and authorised for issue by the Board of Directors on 26 September 2018.
1. STATEMENT OF SIGNIFICANT ACCOUNTING POLICIES
The following is a summary of the material accounting policies adopted by the Consolidated entity in the preparation of thefinancial report. The accounting policies have been consistently applied, unless otherwise stated.
(a) Basis of Preparation
The financial report is a general purpose financial report that has been prepared in accordance with Australian Accounting Standards including Australian Accounting Interpretations, other authoritative pronouncements of the Australian Accounting Standards Board and the Corporations Act 2001.
Compliance with Australian Accounting Standards ensures that the financial statements and notes also comply with International Financial Reporting Standards (“IFRS”) as issued by the International Accounting Standards Board (“IASB”).
The financial report has been prepared on an accruals basis and is based on historical cost and does not take into account changing money values or, except where stated, current valuations of non-current assets. Cost is based on the fair values of the consideration given in exchange for assets.
(i) Going Concern
The financial report has been prepared on the going concern basis, which assumes continuity of normal business activities and realisation of assets and settlement of liabilities in the ordinary course of business.
As at 30 June 2018, the Consolidated entity had cash assets of $3,097,338 (2017: $340,188) and working capital surplus of $2,792,664 (2017: $260,013.)
The Directors have prepared a cash flow forecast, which indicates that the Group will have sufficient cash to meet all commitments and working capital requirements for the 12-month period from the date of signing this financial report.
Based on these factors, the directors are satisfied that the going concern basis of preparation is appropriate. The financial report has therefore been prepared on a going concern basis, which assumes continuity of normal business activities and realisation of assets and settlement of liabilities in the ordinary course of business.
(ii) New Accounting Standards for Application in Future Periods
Application of new and revised Accounting Standards New, revised or amending Accounting Standards and Interpretations adopted The Consolidated entity has adopted all of the new, revised or amending Accounting Standards and Interpretations issued by the Australian Accounting Standards Board ('AASB') that are mandatory for the current reporting period. The adoption of these Accounting Standards and Interpretations did not have any significant impact on the financial performance or position of the Consolidated entity during the financial period.
Any new, revised or amending Accounting Standards or Interpretations that are not yet mandatory have not been early adopted.
New Accounting Standards and Interpretations not yet mandatory or early adopted Australian Accounting Standards and Interpretations that have recently been issued or amended but are not yet mandatory, have not been early adopted by the Consolidated entity for the reporting period ended 30 June 2017. The Consolidated entity's assessment of the impact of these new or amended Accounting Standards and Interpretations, most relevant to the Consolidated entity, are set out below.
For
per
sona
l use
onl
y
NOTES TO THE CONSOLIDATED FINANCIAL STATEMENTS For the period ended 30 June 2018 (continued)
Page 24
STATEMENT OF SIGNIFICANT ACCOUNTING POLICIES (Continued)
AASB 9 Financial Instruments This standard is applicable to annual reporting periods beginning on or after 1 January 2018. The standard replaces all previous versions of AASB 9 and completes the project to replace IAS 39 'Financial Instruments: Recognition and Measurement'. AASB 9 introduces new classification and measurement models for financial assets. A financial asset shall be measured at amortised cost, if it is held within a business model whose objective is to hold assets in order to collect contractual cash flows, which arise on specified dates and solely principal and interest. All other financial instrument assets are to be classified and measured at fair value through profit or loss unless the entity makes an irrevocable election on initial recognition to present gains and losses on equity instruments (that are not held-for-trading) in other comprehensive income ('OCI'). For financial liabilities, the standard requires the portion of the change in fair value that relates to the entity's own credit risk to be presented in OCI (unless it would create an accounting mismatch). New simpler hedge accounting requirements are intended to more closely align the accounting treatment with the risk management activities of the entity. New impairment requirements will use an 'expected credit loss' ('ECL') model to recognise an allowance. Impairment will be measured under a 12-month ECL method unless the credit risk on a financial instrument has increased significantly since initial recognition in which case the lifetime ECL method is adopted. The standard introduces additional new disclosures. The Consolidated entity will adopt this standard from 1 July 2018 but the Consolidated entity does not anticipate a material impact on adoption. AASB 16 Leases This standard is applicable to annual reporting periods beginning on or after 1 January 2019. The standard replaces AASB 117 ‘Leases’ and for lessees will eliminate the classifications of operating leases and finance leases. Subject to exceptions, a ‘right-of-use’ asset will be capitalised in the statement of financial position, measured as the present value of the unavoidable future lease payments to be made over the lease term. The exceptions relate to short-term leases of 12 months or less and leases of low-value assets (such as personal computers and small office furniture) where an accounting policy choice exists whereby either a ‘right-of-use’ asset is recognised or lease payments are expensed to profit or loss as incurred. A liability corresponding to the capitalised lease will also be recognised, adjusted for lease prepayments, lease incentives received, initial direct costs incurred and an estimate of any future restoration, removal or dismantling costs. Straight-line operating lease expense recognition will be replaced with a depreciation charge for the leased asset (included in operating costs) and an interest expense on the recognised lease liability (included in finance costs). In the earlier periods of the lease, the expenses associated with the lease under AASB 16 will be higher when compared to lease expenses under AASB 117. However EBITDA (Earnings Before Interest, Tax, Depreciation and Amortisation) results will be improved as the operating expense is replaced by interest expense and depreciation in profit or loss under AASB 16. For classification within the statement of cash flows, the lease payments will be separated into both a principal (financing activities) and interest (either operating or financing activities) component. For lessor accounting, the standard does not substantially change how a lessor accounts for leases. The Consolidated entity will adopt this standard from 1 July 2019 but the Consolidated entity does not anticipate a material impact on adoption. AASB 15 Revenue from Contracts with Customers This standard is applicable to annual reporting periods beginning on or after 1 January 2018. When effective, this Standard will replace the current accounting requirements applicable to revenue with a single, principles-based model. Apart from a limited number of exceptions, including leases, the new revenue model in AASB 15 will apply to all contracts with customers as well as non-monetary exchanges between entities in the same line of business to facilitate sales to customers and potential customers. The core principle of the Standard is that an entity will recognise revenue to depict the transfer of promised goods or services to customers in an amount that reflects the consideration to which the entity expects to be entitled in exchange for the goods or services. To achieve this objective, AASB 15 provides the following five-step process:
• identify the contract(s) with a customer;
• identify the performance obligations in the contract(s);
• determine the transaction price;
• allocate the transaction price to the performance obligations in the contract(s); and recognise revenue when (or as) the performance obligations are satisfied. The transitional provisions of this Standard permit an entity to either: restate the contracts that existed in each prior period presented per AASB 108 : Accounting Policies, Changes in Accounting Estimates and Errors (subject to certain practical expedients in AASB 15 ); or recognise the cumulative effect of retrospective application to incomplete contracts on the date of initial application. There are also enhanced disclosure requirements regarding revenue. The Consolidated entity does not anticipate a material impact upon adoption of these changes.
For
per
sona
l use
onl
y
NOTES TO THE CONSOLIDATED FINANCIAL STATEMENTS For the period ended 30 June 2018 (continued)
Page 25
STATEMENT OF SIGNIFICANT ACCOUNTING POLICIES (Continued)
(b) Exploration, Evaluation and Development Expenditure
Exploration and evaluation costs are expensed in the period they are incurred apart from mineral acquisition costs, which are capitalised and carried forward where right to tenure of the area of interest is current and they are expected to be recouped through sale or successful development and exploitation of the area of interest, or where exploration and evaluation activities in the area of interest have not reached a stage that permits reasonable assessment of the existence of economically recoverable reserves. Where an area of interest is abandoned or the directors decide that it is not commercial, any accumulated mineral acquisition costs in respect of that area are written off in the financial period the decision is made. Each area of interest is also reviewed at the end of each accounting period and capitalised costs written off to the extent it is deemed that they will not be recoverable in the future. Amortisation is not charged on costs carried forward in respect of areas of interest in the development phase until production commences.
(c) Financial Instruments
Financial instruments in the scope of AASB 139 Financial Instruments: Recognition and Measurement are classified as either financial assets at fair value through profit or loss, loans and receivables, held-to-maturity investments, or available-for-sale investments, as appropriate. When financial instruments are recognised initially, they are measured at fair value, plus, in the case of investments not at fair value through profit or loss, directly attributable transactions costs. The Consolidated entity determines the classification of its financial instruments after initial recognition and, when allowed and appropriate, re-evaluates this designation at each financial year-end. All regular way purchases and sales of financial assets are recognised on the trade date i.e. the date that the consolidated entity commits to purchase the asset. Regular way purchases or sales are purchases or sales of financial assets under contracts that require delivery of the assets within the period established generally by regulation or convention in the marketplace.
(i) Financial assets at fair value through profit or loss
Financial assets classified as held for trading are included in the category ‘financial assets at fair value through profit or loss’. Financial assets are classified as held for trading if they are acquired for the purpose of selling in the near term. Derivatives are also classified as held for trading unless they are designated as effective hedging instruments. Gains or losses on investments held for trading are recognised in profit or loss.
(ii) Held-to-maturity investments Non-derivative financial assets with fixed or determinable payments and fixed maturity are classified as held-to-maturity when the Consolidated entity has the positive intention and ability to hold to maturity. Investments intended to be held for an undefined period are not included in this classification. Investments that are intended to be held-to-maturity, such as bonds, are subsequently measured at amortised cost. This cost is computed as the amount initially recognised minus principal repayments, plus or minus the cumulative amortisation using the effective interest method of any difference between the initially recognised amount and the maturity amount. This calculation includes all fees and points paid or received between parties to the contract that are an integral part of the effective interest rate, transaction costs and all other premiums and discounts. For investments carried at amortised cost, gains and losses are recognised in profit or loss when the investments are derecognised or impaired, as well as through the amortisation process.
(iii) Loans and receivables Loans and receivables are non-derivative financial assets with fixed or determinable payments that are not quoted in an active market. Such assets are carried at amortised cost using the effective interest method. Gains and losses are recognised in profit or loss when the loans and receivables are derecognised or impaired, as well as through the amortisation process.
(iv) Available-for-sale investments Available-for-sale investments are those non-derivative financial assets that are designated as available-for-sale or are not classified as any of the three preceding categories. After initial recognition, available-for sale investments are measured at fair value with gains or losses being recognised as a separate component of equity until the investment is derecognised or until the investment is determined to be impaired, at which time the cumulative gain or loss previously reported in equity is recognised in profit or loss.
For
per
sona
l use
onl
y
NOTES TO THE CONSOLIDATED FINANCIAL STATEMENTS For the period ended 30 June 2018 (continued)
Page 26
STATEMENT OF SIGNIFICANT ACCOUNTING POLICIES (Continued) The fair value of investments that are actively traded in organised financial markets is determined by reference to quoted market bid prices at the close of business on the balance sheet date. For investments with no active market, fair value is determined using valuation techniques. Such techniques include using recent arm’s length market transactions; reference to the current market value of another instrument that is substantially the same; discounted cash flow analysis and option pricing models.
(v) Financial Liabilities Non-derivative financial liabilities (excluding financial guarantees) are subsequently measured at amortised cost using the effective interest rate method.
Impairment At each reporting date, the Consolidated entity assesses whether there is objective evidence that a financial instrument has been impaired. In the case of available-for-sale financial instruments, a prolonged decline in the value of the instrument is considered to determine whether impairment has arisen. Impairment losses are recognised in the profit or loss.
Derecognition Financial assets are derecognised where the contractual rights to receipt of cash flows expires or the asset is transferred to another party whereby the entity no longer has any significant continuing involvement in the risks and benefits associated with the asset. Financial liabilities are derecognised where the related obligations are either discharged, cancelled or expired. The difference between the carrying value of the financial liability extinguished or transferred to another party and the fair value of consideration paid, including the transfer of non-cash assets or liabilities assumed, is recognised in profit or loss.
(d) Cash and Cash Equivalents
Cash and cash equivalents includes cash on hand, deposits held at call with banks, other short-term highly liquid investments with original maturities of three months or less, and bank overdrafts.
(e) Impairment of Assets
At each reporting date, the Consolidated entity reviews the carrying amounts of its tangible assets to determine whether there
is any indication that those assets have suffered an impairment loss. If any such indication exists, the recoverable amount of the
asset is estimated in order to determine the extent of the impairment loss (if any). Where the asset does not generate cash flows
that are independent from the other assets, the Consolidated entity estimates the recoverable amount of the cash-generating
unit to which the asset belongs.
Recoverable amount is the higher of fair value less costs to sell and value in use. In assessing value in use, the estimated future cash flows are discounted to their present value using a pre-tax discount rate that reflects current market assessments of the time value of money and the risks specific to the asset for which the estimates of future cash flows have not been adjusted. If the recoverable amount of an asset (or cash-generated unit) is estimated to be less than its carrying amount, the carrying amount of the asset (cash-generating unit) is reduced to its recoverable amount. An impairment loss is recognised in profit or loss immediately, unless the relevant asset is carried at fair value, in which case the impairment loss is treated as a revaluation decrease. Where an impairment loss subsequently reverses, the carrying amount of the asset (cash-generating unit) is increased to the revised estimate of its recoverable amount, but only to the extent that the increased carrying amount does not exceed the carrying amount that would have been determined had no impairment loss been recognised for the asset (cash-generating unit) in prior years. A reversal of an impairment loss is recognised in profit or loss immediately, unless the relevant asset is carried at fair value, in which case the impairment loss is treated as a revaluation increase.
For
per
sona
l use
onl
y
NOTES TO THE CONSOLIDATED FINANCIAL STATEMENTS For the period ended 30 June 2018 (continued)
Page 27
STATEMENT OF SIGNIFICANT ACCOUNTING POLICIES (Continued)
(f) Property, plant and equipment
IT equipment and other equipment IT equipment and other equipment (comprising fittings and furniture) are initially recognised at acquisition cost or manufacturing cost, including any costs directly attributable to bringing the assets to the location and condition necessary for it to be capable of operating in the manner intended by the Consolidated entity’s management. IT equipment and other equipment are subsequently measured using the cost model, cost less subsequent depreciation and impairment losses. Depreciation is recognised on a diminishing value basis to write down the cost less estimated residual value of IT equipment and other equipment. The following useful lives are applied:
• IT equipment: 2-5 years
• Other equipment: 3-12 years Material residual value estimates and estimates of useful life are updated as required, but at least annually. Gains or losses arising on the disposal of property, plant and equipment are determined as the difference between the disposal proceeds and the carrying amount of the assets and are recognised in profit or loss within other income or other expenses.
(g) Goods and Services Tax (GST)
Revenues, expenses and assets are recognised net of the amount of GST, except where the amount of GST incurred is not recoverable from the Australian Tax Office (“ATO”). In these circumstances, the GST is recognised as part of the cost of acquisition of the asset or as part of an item of the expense. Receivables and payables in the statement of financial position are shown inclusive of GST.
The net amount of GST recoverable from, or payable to, the ATO is included as a current asset or liability in the statement of financial position. Cash flows are included in the statement of cash flows on a gross basis. The GST components of cash flows arising from investing and financing activities which are recoverable from, or payable to, the ATO are classified as operating cash flows.
(h) Taxation
The Consolidated entity adopts the liability method of tax-effect accounting whereby the income tax expense is based on the profit/loss from ordinary activities adjusted for any non-assessable or disallowed items. Deferred tax is accounted for using the balance sheet liability method in respect of temporary differences arising between the tax bases of assets and liabilities and their carrying amounts in the financial statements. No deferred income tax will be recognised from the initial recognition of an asset or liability, excluding a business combination, where there is no effect on accounting or taxable profit or loss. Deferred tax is calculated at the tax rates that are expected to apply to the period when the asset is realised or liability is settled. Deferred tax is credited in the statement of comprehensive income except where it relates to items that may be credited directly to equity, in which case the deferred tax is adjusted directly against equity. Deferred income tax assets are recognised to the extent that it is probable that future tax profits will be available against which deductible temporary differences can be utilised.
The amount of benefits brought to account or which may be realised in the future is based on the assumption that no adverse
change will occur in income taxation legislation and the anticipation that the Consolidated entity will derive sufficient future
assessable income to enable the benefit to be realised and comply with the conditions of deductibility imposed by the law.
For
per
sona
l use
onl
y
NOTES TO THE CONSOLIDATED FINANCIAL STATEMENTS For the period ended 30 June 2018 (continued)
Page 28
STATEMENT OF SIGNIFICANT ACCOUNTING POLICIES (Continued) (i) Trade and Other Payables
Trade payables and other payables are carried at amortised cost and represent liabilities for goods and services provided to the Consolidated entity prior to the end of the financial year that are unpaid and arise when the Consolidated entity becomes obliged to make future payments in respect of the purchase of these goods and services.
(j) Issued Capital
Issued and paid up capital is recognised at the fair value of the consideration received by the Consolidated entity. Any transaction costs arising on the issue of ordinary shares are recognised directly in equity as a reduction of the share proceeds received.
(k) Critical Accounting Estimates and Judgments
The directors evaluate estimates and judgments incorporated into the financial report based on historical knowledge and best available current information. Estimates assume a reasonable expectation of future events and are based on current trends and economic data, obtained both externally and within the Consolidated entity. Key Estimates - Impairment
The Consolidated entity assesses impairment at the end of each reporting period by evaluating conditions and events specific to the Consolidated entity that may be indicative of impairment triggers. Recoverable amounts of relevant assets are reassessed using value-in-use calculations which incorporate various key assumptions. Key Estimates – Taxation
Balances disclosed in the financial statements and the notes thereto related to taxation are based on the best estimates of the directors. These estimates take into account both the financial performance and position of the Consolidated entity as they pertain to current income taxation legislation, and the directors’ understanding thereof. No adjustment has been made for pending or future taxation legislation. The current income tax position represents that directors’ best estimate, pending an assessment by the Australian Taxation Office.
Key Judgment – Environmental Issues Balances disclosed in the financial statements and notes thereto are not adjusted for any pending or enacted environmental legislation, and the directors’ understanding thereof. At the current stage of the Consolidated entity’s development and its current environmental impact the directors believe such treatment is reasonable and appropriate.
(l) Fair Value of Assets and Liabilities The Consolidated entity measures some of its assets and liabilities at fair value on either a recurring or non-recurring basis, depending on the requirements of the applicable Accounting Standard. Fair value is the price the Consolidated entity would receive to sell an asset or would have to pay to transfer a liability in an orderly (ie unforced) transaction between independent, knowledgeable and willing market participants at the measurement date. As fair value is a market-based measure, the closest equivalent observable market pricing information is used to determine fair value. Adjustments to market values may be made having regard to the characteristics of the specific asset or liability. The fair values of assets and liabilities that are not traded in an active market are determined using one or more valuation techniques. These valuation techniques maximise, to the extent possible, the use of observable market data. To the extent possible, market information is extracted from either the principal market for the asset or liability (ie the market with the greatest volume and level of activity for the asset or liability) or, in the absence of such a market, the most advantageous market available to the entity at the end of the reporting period (ie the market that maximises the receipts from the sale of the asset or minimises the payments made to transfer the liability, after taking into account transaction costs and transport costs).
For
per
sona
l use
onl
y
NOTES TO THE CONSOLIDATED FINANCIAL STATEMENTS For the period ended 30 June 2018 (continued)
Page 29
STATEMENT OF SIGNIFICANT ACCOUNTING POLICIES (Continued) For non-financial assets, the fair value measurement also takes into account a market participant's ability to use the asset in its highest and best use or to sell it to another market participant that would use the asset in its highest and best use. The fair value of liabilities and the entity's own equity instruments (excluding those related to share-based payment arrangements) may be valued, where there is no observable market price in relation to the transfer of such financial instruments, by reference to observable market information where such instruments are held as assets. Where this information is not available, other valuation techniques are adopted and, where significant, are detailed in the respective note to the financial statements.
Valuation techniques
In the absence of an active market for an identical asset or liability, the Consolidated entity selects and uses one or more valuation techniques to measure the fair value of the asset or liability, The Consolidated entity selects a valuation technique that is appropriate in the circumstances and for which sufficient data is available to measure fair value. The availability of sufficient and relevant data primarily depends on the specific characteristics of the asset or liability being measured. The valuation techniques selected by the Consolidated entity are consistent with one or more of the following valuation approaches:
Market approach: valuation techniques that use prices and other relevant information generated by market transactions for
identical or similar assets or liabilities.
Income approach: valuation techniques that convert estimated future cash flows or income and expenses into a single discounted present value.
Cost approach: valuation techniques that reflect the current replacement cost of an asset at its current service capacity. Each valuation technique requires inputs that reflect the assumptions that buyers and sellers would use when pricing the asset or liability, including assumptions about risks. When selecting a valuation technique, the Consolidated entity gives priority to those techniques that maximise the use of observable inputs and minimise the use of unobservable inputs. Inputs that are developed using market data (such as publicly available information on actual transactions) and reflect the assumptions that buyers and sellers would generally use when pricing the asset or liability are considered observable, whereas inputs for which market data is not available and therefore are developed using the best information available about such assumptions are considered unobservable. Fair value hierarchy
AASB 13 requires the disclosure of fair value information by level of the fair value hierarchy, which categorises fair value measurements into one of three possible levels based on the lowest level that an input that is significant to the measurement can be categorised into as follows: Level 1 Measurements based on quoted prices (unadjusted) in active markets for identical assets or liabilities that the entity can access at the measurement date. Measurements based on inputs other than quoted prices included in Level 1 that are observable for the asset or liability, either directly or indirectly. Level 2
Measurements based on inputs other than quoted prices included in Level 1 that are observable for the asset or liability, either directly or indirectly. Level 3 Measurements based on unobservable inputs for the asset or liability. The fair values of assets and liabilities that are not traded in an active market are determined using one or more valuation techniques. These valuation techniques maximise, to the extent possible, the use of observable market data. If all significant inputs required to measure fair value are observable, the asset or liability is included in Level 2. If one or more significant inputs are not based on observable market data, the asset or liability is included in Level 3.
The Consolidated entity would change the categorisation within the fair value hierarchy only in the following circumstances:
(i) if a market that was previously considered active (Level 1) became inactive (Level 2 or Level 3) or vice versa; or (ii) if significant inputs that were previously unobservable (Level 3) became observable (Level 2) or vice versa.
When a change in the categorisation occurs, the Consolidated entity recognises transfers between levels of the fair value hierarchy (i.e. transfers into and out of each level of the fair value hierarchy) on the date the event or change in circumstances occurred.
For
per
sona
l use
onl
y
NOTES TO THE CONSOLIDATED FINANCIAL STATEMENTS For the period ended 30 June 2018 (continued)
Page 30
2. RELATED PARTY TRANSACTIONS
Transactions between related parties are on commercial terms and conditions, no more favourable than those available to other parties unless otherwise stated. There were no related party transactions other than transactions disclosed in Note 4.
3. REMUNERATION OF AUDITORS 2018 2017
$ $
Audit of the financial statements (William Buck Audit (WA) Pty Ltd) 12,900 8,500
Investigating accountants report (William Buck Consulting Pty Ltd) 5,940 -
Audit of the financial statements (Bentley’s Audit & Corporate (WA) Pty Ltd) 13,000 -
31,840 8,500
The auditor of BlackEarth Minerals NL is Bentley’s Audit & Corporate (WA) Pty Ltd (2017: William Buck Audit (WA) Pty Ltd)
4. KEY MANAGEMENT PERSONNEL COMPENSATION
(a) Names and positions held of the Consolidated entity key management personnel in office at any time during the financial
period are:
Key Management Person Position Phillip Hearse Non-Executive Chairman Thomas Revy Managing Director George Bauk Non-Executive Director Barry Woodhouse Company Secretary
Key management personnel remuneration has been included in the Remuneration Report section of the Directors’
Report.
The totals of remuneration paid to Key Management Personnel of the Consolidated entity during the year is as
follows:
2018
$
2017
$
Short-term benefits 219,155 73,875
Share based payments 8,099 291
Post-employment benefits 10,596 -
237,850 74,166
5. LOSS FROM ORDINARY ACTIVITIES
2018
$ 2017
$
(a) Other revenue Interest received 12,533 813
Forgiveness of loan 28,072 -
Recovery of expenses 22,386 -
Royalties 29,758 -
Total other revenue from ordinary activities 92,749 813
For
per
sona
l use
onl
y
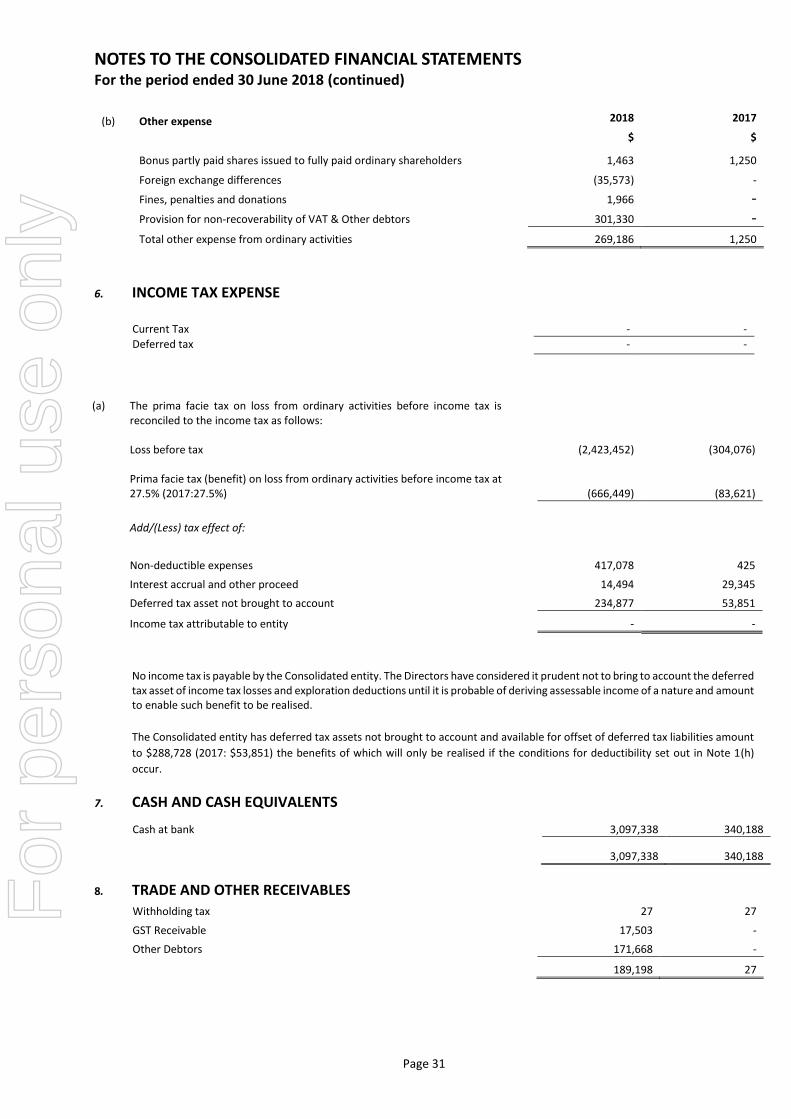
NOTES TO THE CONSOLIDATED FINANCIAL STATEMENTS For the period ended 30 June 2018 (continued)
Page 31
(b) Other expense 2018 2017
$ $
Bonus partly paid shares issued to fully paid ordinary shareholders 1,463 1,250
Foreign exchange differences (35,573) -
Fines, penalties and donations 1,966 -
Provision for non-recoverability of VAT & Other debtors 301,330 -
Total other expense from ordinary activities 269,186 1,250
6. INCOME TAX EXPENSE
Current Tax - -
Deferred tax - -
(a) The prima facie tax on loss from ordinary activities before income tax is reconciled to the income tax as follows: Loss before tax
(2,423,452) (304,076)
Prima facie tax (benefit) on loss from ordinary activities before income tax at 27.5% (2017:27.5%)
(666,449) (83,621)
Add/(Less) tax effect of:
Non-deductible expenses 417,078 425
Interest accrual and other proceed 14,494 29,345
Deferred tax asset not brought to account 234,877 53,851
Income tax attributable to entity - -
No income tax is payable by the Consolidated entity. The Directors have considered it prudent not to bring to account the deferred tax asset of income tax losses and exploration deductions until it is probable of deriving assessable income of a nature and amount to enable such benefit to be realised.
The Consolidated entity has deferred tax assets not brought to account and available for offset of deferred tax liabilities amount
to $288,728 (2017: $53,851) the benefits of which will only be realised if the conditions for deductibility set out in Note 1(h)
occur.
7. CASH AND CASH EQUIVALENTS
Cash at bank
3,097,338 340,188
3,097,338 340,188
8. TRADE AND OTHER RECEIVABLES
Withholding tax 27 27
GST Receivable 17,503 -
Other Debtors 171,668 -
189,198 27
For
per
sona
l use
onl
y
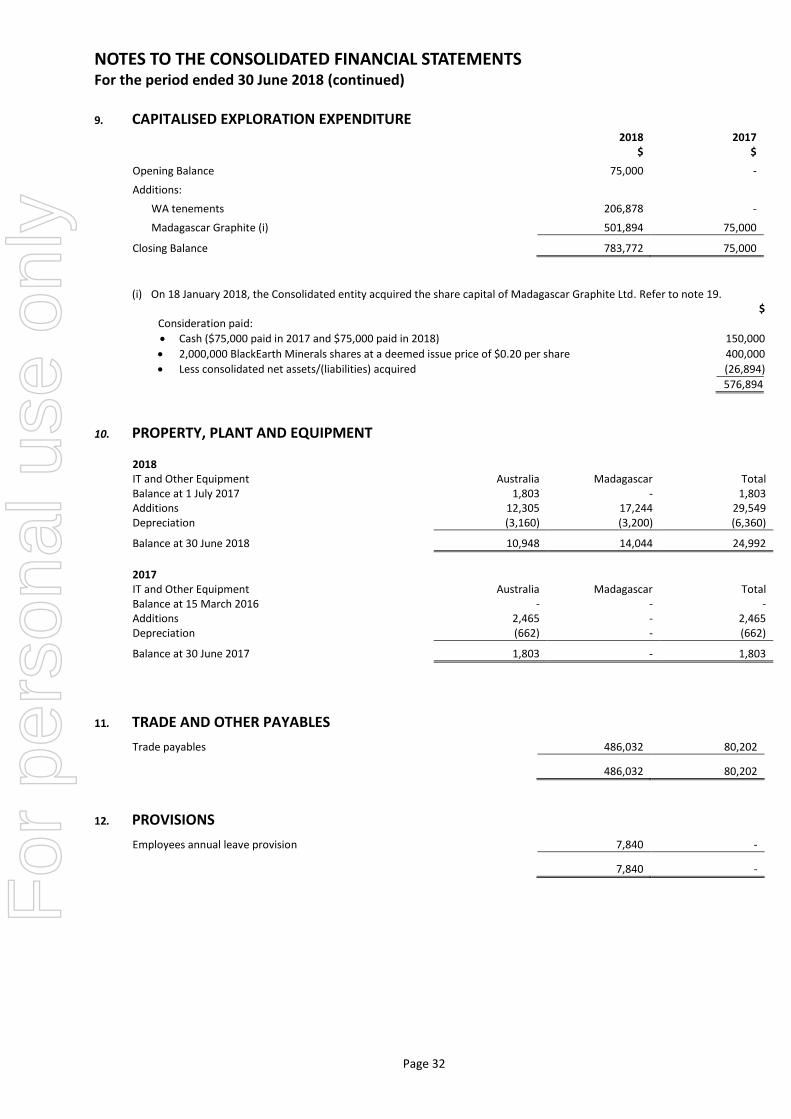
NOTES TO THE CONSOLIDATED FINANCIAL STATEMENTS For the period ended 30 June 2018 (continued)
Page 32
9. CAPITALISED EXPLORATION EXPENDITURE
2018 $
2017 $
Opening Balance 75,000 -
Additions:
WA tenements 206,878 -
Madagascar Graphite (i) 501,894 75,000
Closing Balance 783,772 75,000
(i) On 18 January 2018, the Consolidated entity acquired the share capital of Madagascar Graphite Ltd. Refer to note 19.
$ Consideration paid:
• Cash ($75,000 paid in 2017 and $75,000 paid in 2018) 150,000
• 2,000,000 BlackEarth Minerals shares at a deemed issue price of $0.20 per share 400,000
• Less consolidated net assets/(liabilities) acquired (26,894)
576,894
10. PROPERTY, PLANT AND EQUIPMENT
2018 IT and Other Equipment Balance at 1 July 2017 Additions Depreciation
Australia 1,803
12,305 (3,160)
Madagascar -
17,244 (3,200)
Total 1,803
29,549 (6,360)
Balance at 30 June 2018 10,948 14,044 24,992
2017 IT and Other Equipment Balance at 15 March 2016 Additions Depreciation
Australia -
2,465 (662)
Madagascar - - -
Total -
2,465 (662)
Balance at 30 June 2017 1,803 - 1,803
11. TRADE AND OTHER PAYABLES
Trade payables
486,032 80,202
486,032 80,202
12. PROVISIONS
Employees annual leave provision
7,840 -
7,840 -
For
per
sona
l use
onl
y
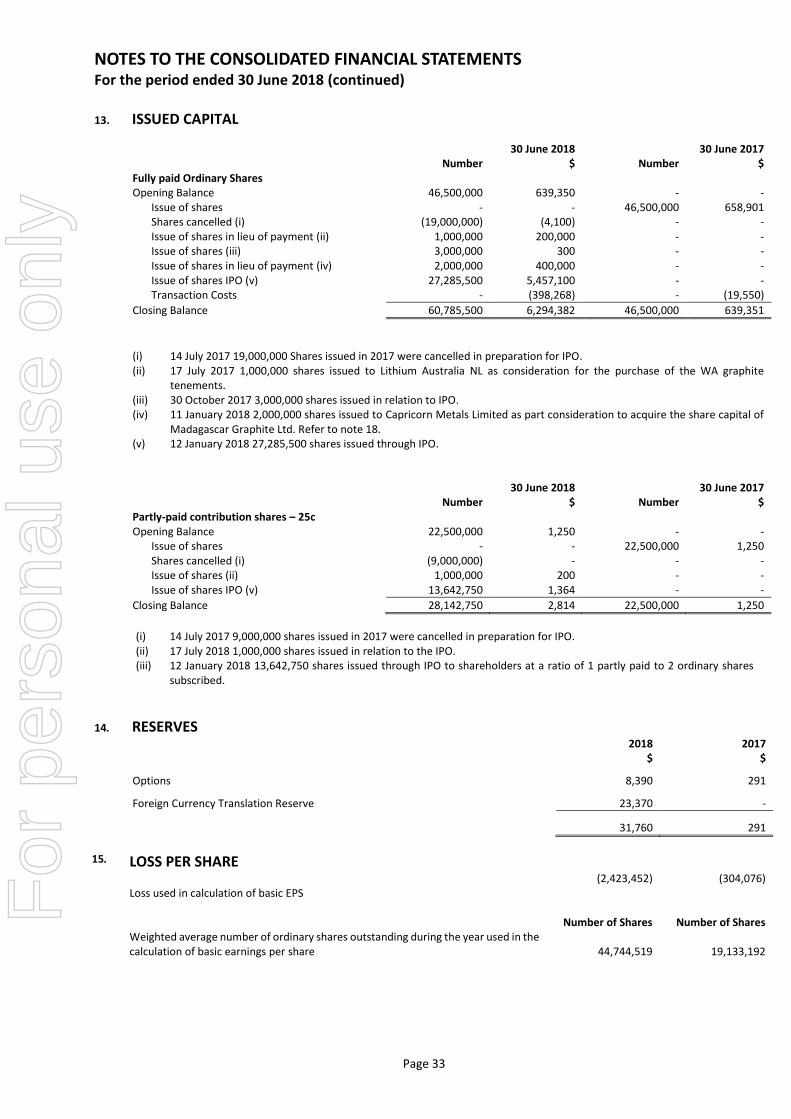
NOTES TO THE CONSOLIDATED FINANCIAL STATEMENTS For the period ended 30 June 2018 (continued)
Page 33
13. ISSUED CAPITAL
30 June 2018 30 June 2017 Number $ Number $
Fully paid Ordinary Shares Opening Balance 46,500,000 639,350 - -
Issue of shares - - 46,500,000 658,901 Shares cancelled (i) (19,000,000) (4,100) - - Issue of shares in lieu of payment (ii) 1,000,000 200,000 - - Issue of shares (iii) 3,000,000 300 - - Issue of shares in lieu of payment (iv) 2,000,000 400,000 - - Issue of shares IPO (v) 27,285,500 5,457,100 - - Transaction Costs - (398,268) - (19,550)
Closing Balance 60,785,500 6,294,382 46,500,000 639,351
(i) 14 July 2017 19,000,000 Shares issued in 2017 were cancelled in preparation for IPO. (ii) 17 July 2017 1,000,000 shares issued to Lithium Australia NL as consideration for the purchase of the WA graphite
tenements. (iii) 30 October 2017 3,000,000 shares issued in relation to IPO. (iv) 11 January 2018 2,000,000 shares issued to Capricorn Metals Limited as part consideration to acquire the share capital of
Madagascar Graphite Ltd. Refer to note 18. (v) 12 January 2018 27,285,500 shares issued through IPO.
30 June 2018 30 June 2017 Number $ Number $
Partly-paid contribution shares – 25c Opening Balance 22,500,000 1,250 - -
Issue of shares - - 22,500,000 1,250 Shares cancelled (i) (9,000,000) - - - Issue of shares (ii) 1,000,000 200 - - Issue of shares IPO (v) 13,642,750 1,364 - -
Closing Balance 28,142,750 2,814 22,500,000 1,250
(i) 14 July 2017 9,000,000 shares issued in 2017 were cancelled in preparation for IPO. (ii) 17 July 2018 1,000,000 shares issued in relation to the IPO. (iii) 12 January 2018 13,642,750 shares issued through IPO to shareholders at a ratio of 1 partly paid to 2 ordinary shares
subscribed.
14. RESERVES
2018 2017 $ $
Options
8,390 291
Foreign Currency Translation Reserve
23,370 -
31,760 291
15. LOSS PER SHARE
Loss used in calculation of basic EPS
(2,423,452) (304,076)
Number of Shares Number of Shares Weighted average number of ordinary shares outstanding during the year used in the
calculation of basic earnings per share 44,744,519 19,133,192
For
per
sona
l use
onl
y
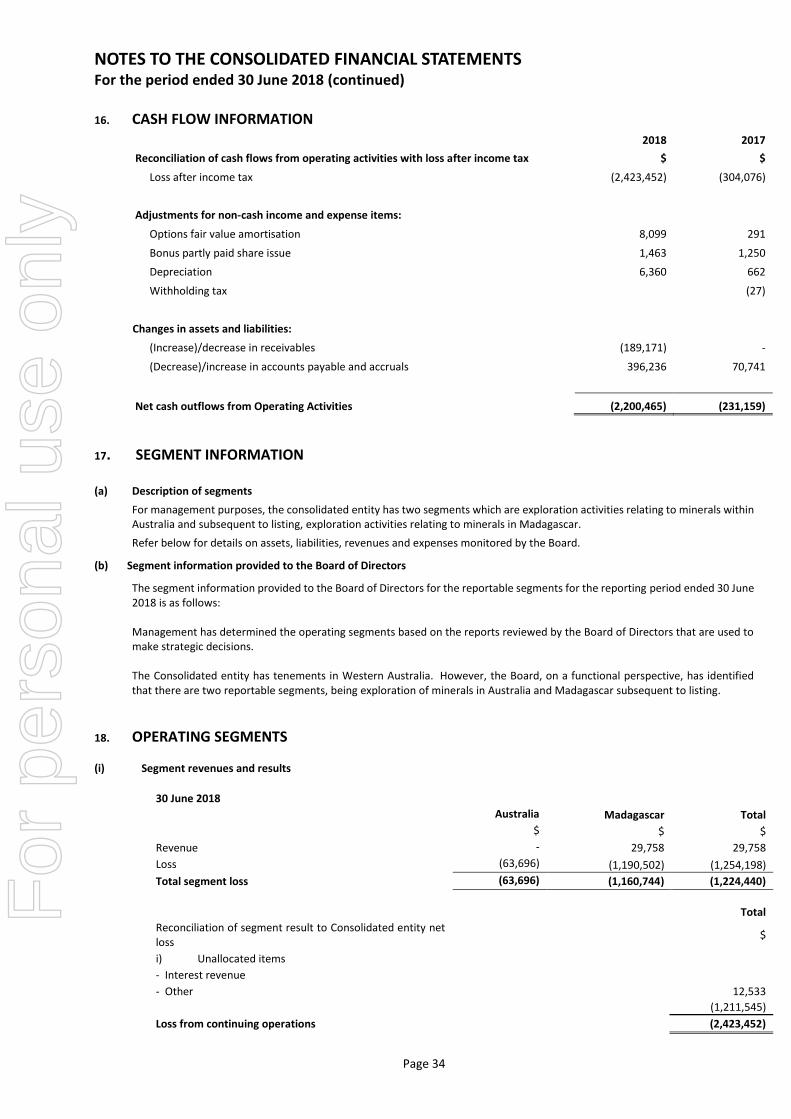
NOTES TO THE CONSOLIDATED FINANCIAL STATEMENTS For the period ended 30 June 2018 (continued)
Page 34
16. CASH FLOW INFORMATION
2018 2017
Reconciliation of cash flows from operating activities with loss after income tax $ $
Loss after income tax (2,423,452) (304,076)
Adjustments for non-cash income and expense items:
Options fair value amortisation 8,099 291
Bonus partly paid share issue 1,463 1,250
Depreciation 6,360 662
Withholding tax (27)
Changes in assets and liabilities:
(Increase)/decrease in receivables (189,171) -
(Decrease)/increase in accounts payable and accruals 396,236 70,741
Net cash outflows from Operating Activities (2,200,465) (231,159)
17. SEGMENT INFORMATION (a) Description of segments
For management purposes, the consolidated entity has two segments which are exploration activities relating to minerals within Australia and subsequent to listing, exploration activities relating to minerals in Madagascar.
Refer below for details on assets, liabilities, revenues and expenses monitored by the Board.
(b) Segment information provided to the Board of Directors
The segment information provided to the Board of Directors for the reportable segments for the reporting period ended 30 June 2018 is as follows: Management has determined the operating segments based on the reports reviewed by the Board of Directors that are used to make strategic decisions. The Consolidated entity has tenements in Western Australia. However, the Board, on a functional perspective, has identified that there are two reportable segments, being exploration of minerals in Australia and Madagascar subsequent to listing.
18. OPERATING SEGMENTS
(i) Segment revenues and results
30 June 2018
Australia Madagascar Total
$ $ $
Revenue - 29,758 29,758
Loss (63,696) (1,190,502) (1,254,198)
Total segment loss (63,696) (1,160,744) (1,224,440)
Total
Reconciliation of segment result to Consolidated entity net loss
$
i) Unallocated items
- Interest revenue
- Other 12,533
(1,211,545)
Loss from continuing operations (2,423,452)
For
per
sona
l use
onl
y
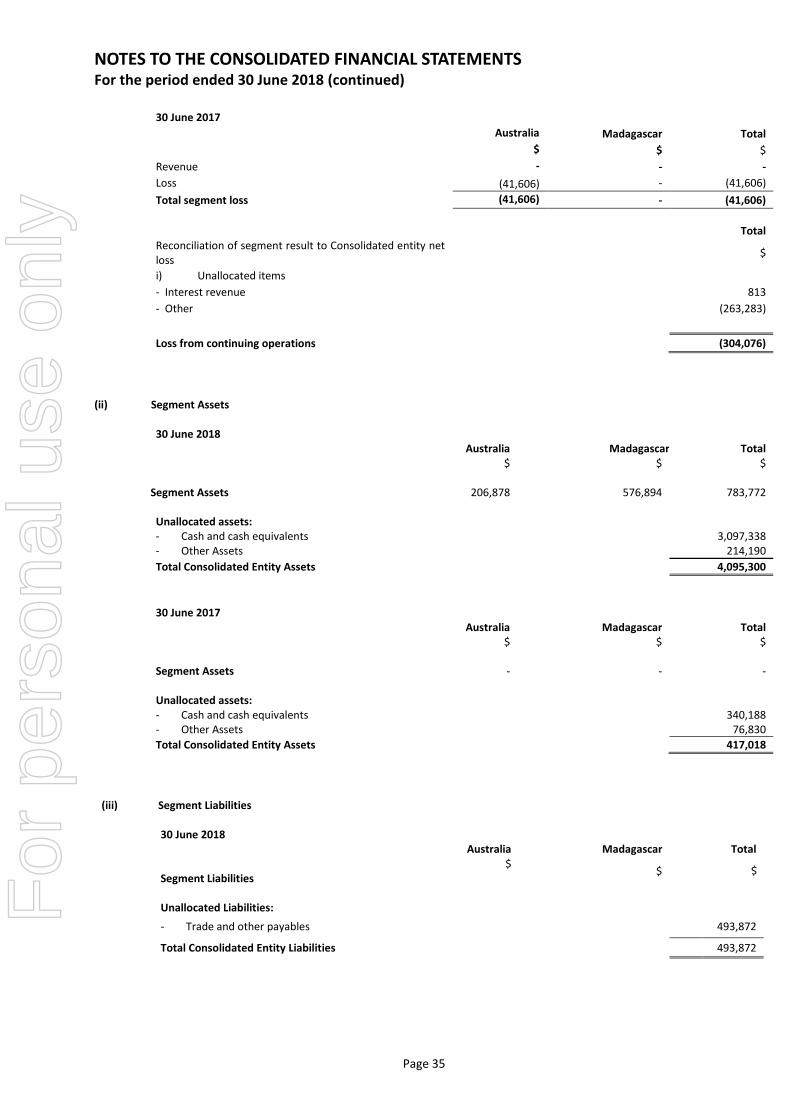
NOTES TO THE CONSOLIDATED FINANCIAL STATEMENTS For the period ended 30 June 2018 (continued)
Page 35
$
30 June 2017
Australia Madagascar Total
$ $ $
Revenue - - -
Loss (41,606) - (41,606)
Total segment loss (41,606) - (41,606)
Total Reconciliation of segment result to Consolidated entity net loss
$
i) Unallocated items
- Interest revenue 813
- Other (263,283)
Loss from continuing operations (304,076)
(ii) Segment Assets
30 June 2018 Australia Madagascar Total $ $ $
Segment Assets 206,878 576,894 783,772 Unallocated assets: - Cash and cash equivalents 3,097,338 - Other Assets 214,190
Total Consolidated Entity Assets 4,095,300
30 June 2017
Australia Madagascar Total $ $ $ Segment Assets - - - Unallocated assets: - Cash and cash equivalents 340,188 - Other Assets 76,830
Total Consolidated Entity Assets 417,018
(iii) Segment Liabilities
30 June 2018
Australia Madagascar Total Segment Liabilities
$ $ $
Unallocated Liabilities:
- Trade and other payables 493,872
Total Consolidated Entity Liabilities 493,872
For
per
sona
l use
onl
y
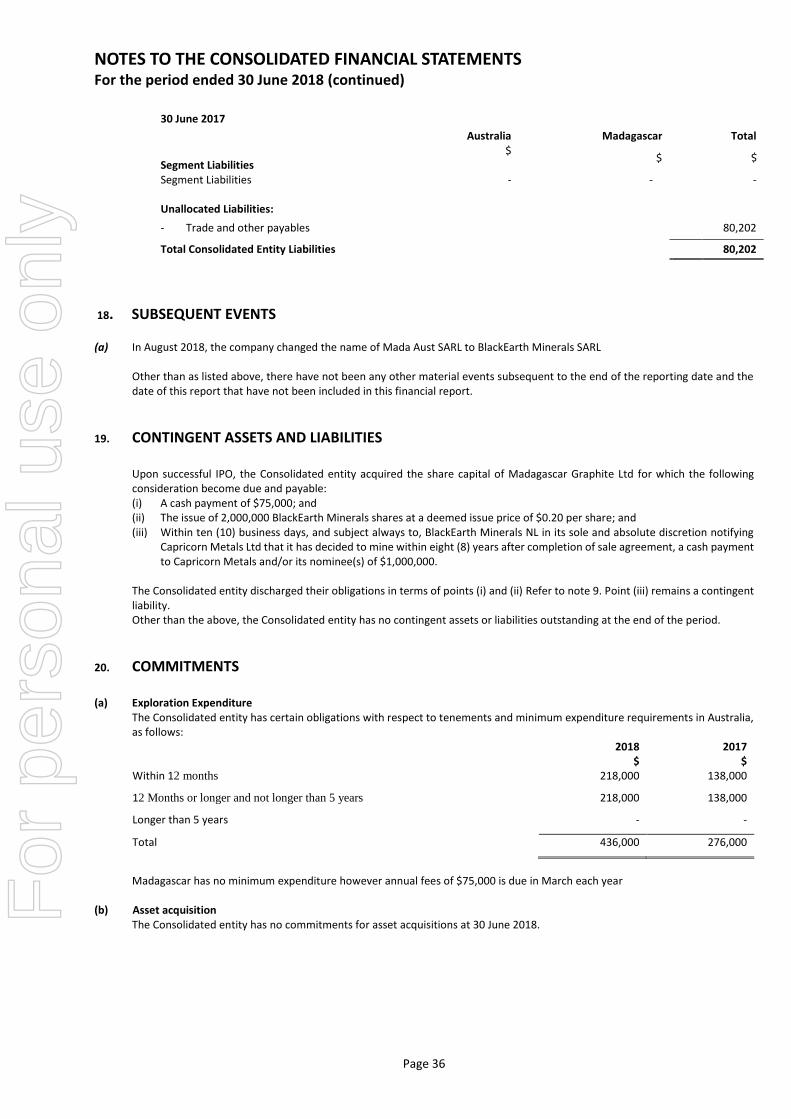
NOTES TO THE CONSOLIDATED FINANCIAL STATEMENTS For the period ended 30 June 2018 (continued)
Page 36
$
30 June 2017 Australia Madagascar Total
Segment Liabilities
$ $ $
Segment Liabilities - - - Unallocated Liabilities:
- Trade and other payables 80,202
Total Consolidated Entity Liabilities 80,202
18. SUBSEQUENT EVENTS
(a) In August 2018, the company changed the name of Mada Aust SARL to BlackEarth Minerals SARL
Other than as listed above, there have not been any other material events subsequent to the end of the reporting date and the date of this report that have not been included in this financial report.
19. CONTINGENT ASSETS AND LIABILITIES
Upon successful IPO, the Consolidated entity acquired the share capital of Madagascar Graphite Ltd for which the following consideration become due and payable: (i) A cash payment of $75,000; and (ii) The issue of 2,000,000 BlackEarth Minerals shares at a deemed issue price of $0.20 per share; and (iii) Within ten (10) business days, and subject always to, BlackEarth Minerals NL in its sole and absolute discretion notifying
Capricorn Metals Ltd that it has decided to mine within eight (8) years after completion of sale agreement, a cash payment to Capricorn Metals and/or its nominee(s) of $1,000,000.
The Consolidated entity discharged their obligations in terms of points (i) and (ii) Refer to note 9. Point (iii) remains a contingent liability. Other than the above, the Consolidated entity has no contingent assets or liabilities outstanding at the end of the period.
20. COMMITMENTS (a) Exploration Expenditure
The Consolidated entity has certain obligations with respect to tenements and minimum expenditure requirements in Australia, as follows:
2018 $
2017 $
Within 12 months 218,000 138,000
12 Months or longer and not longer than 5 years 218,000 138,000
Longer than 5 years - -
Total 436,000 276,000
Madagascar has no minimum expenditure however annual fees of $75,000 is due in March each year
(b) Asset acquisition The Consolidated entity has no commitments for asset acquisitions at 30 June 2018.
For
per
sona
l use
onl
y
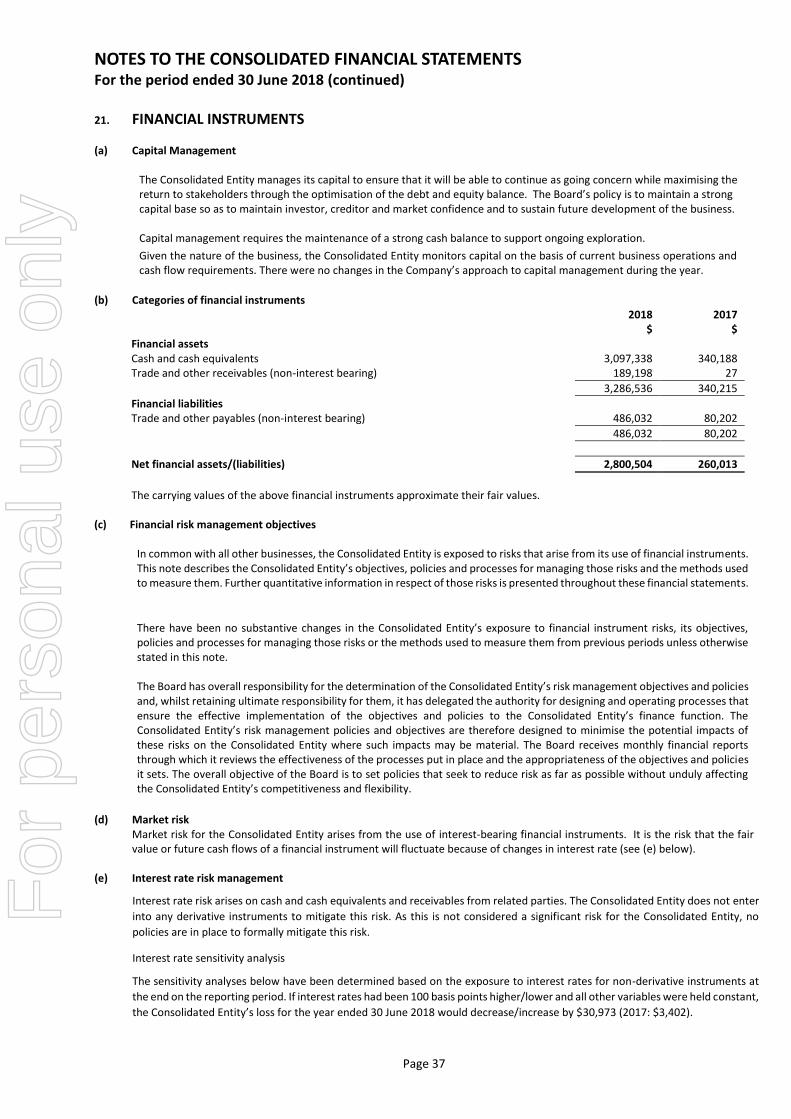
NOTES TO THE CONSOLIDATED FINANCIAL STATEMENTS For the period ended 30 June 2018 (continued)
Page 37
21. FINANCIAL INSTRUMENTS (a) Capital Management
The Consolidated Entity manages its capital to ensure that it will be able to continue as going concern while maximising the return to stakeholders through the optimisation of the debt and equity balance. The Board’s policy is to maintain a strong capital base so as to maintain investor, creditor and market confidence and to sustain future development of the business. Capital management requires the maintenance of a strong cash balance to support ongoing exploration.
Given the nature of the business, the Consolidated Entity monitors capital on the basis of current business operations and cash flow requirements. There were no changes in the Company’s approach to capital management during the year.
(b) Categories of financial instruments
2018 2017 $ $ Financial assets Cash and cash equivalents 3,097,338 340,188 Trade and other receivables (non-interest bearing) 189,198 27
3,286,536 340,215
Financial liabilities Trade and other payables (non-interest bearing) 486,032 80,202
486,032 80,202
Net financial assets/(liabilities) 2,800,504 260,013
The carrying values of the above financial instruments approximate their fair values.
(c) Financial risk management objectives
In common with all other businesses, the Consolidated Entity is exposed to risks that arise from its use of financial instruments. This note describes the Consolidated Entity’s objectives, policies and processes for managing those risks and the methods used to measure them. Further quantitative information in respect of those risks is presented throughout these financial statements.
There have been no substantive changes in the Consolidated Entity’s exposure to financial instrument risks, its objectives, policies and processes for managing those risks or the methods used to measure them from previous periods unless otherwise stated in this note. The Board has overall responsibility for the determination of the Consolidated Entity’s risk management objectives and policies and, whilst retaining ultimate responsibility for them, it has delegated the authority for designing and operating processes that ensure the effective implementation of the objectives and policies to the Consolidated Entity’s finance function. The Consolidated Entity’s risk management policies and objectives are therefore designed to minimise the potential impacts of these risks on the Consolidated Entity where such impacts may be material. The Board receives monthly financial reports through which it reviews the effectiveness of the processes put in place and the appropriateness of the objectives and policies it sets. The overall objective of the Board is to set policies that seek to reduce risk as far as possible without unduly affecting the Consolidated Entity’s competitiveness and flexibility.
(d) Market risk
Market risk for the Consolidated Entity arises from the use of interest-bearing financial instruments. It is the risk that the fair value or future cash flows of a financial instrument will fluctuate because of changes in interest rate (see (e) below).
(e) Interest rate risk management
Interest rate risk arises on cash and cash equivalents and receivables from related parties. The Consolidated Entity does not enter
into any derivative instruments to mitigate this risk. As this is not considered a significant risk for the Consolidated Entity, no
policies are in place to formally mitigate this risk.
Interest rate sensitivity analysis
The sensitivity analyses below have been determined based on the exposure to interest rates for non-derivative instruments at
the end on the reporting period. If interest rates had been 100 basis points higher/lower and all other variables were held constant,
the Consolidated Entity’s loss for the year ended 30 June 2018 would decrease/increase by $30,973 (2017: $3,402).
For
per
sona
l use
onl
y
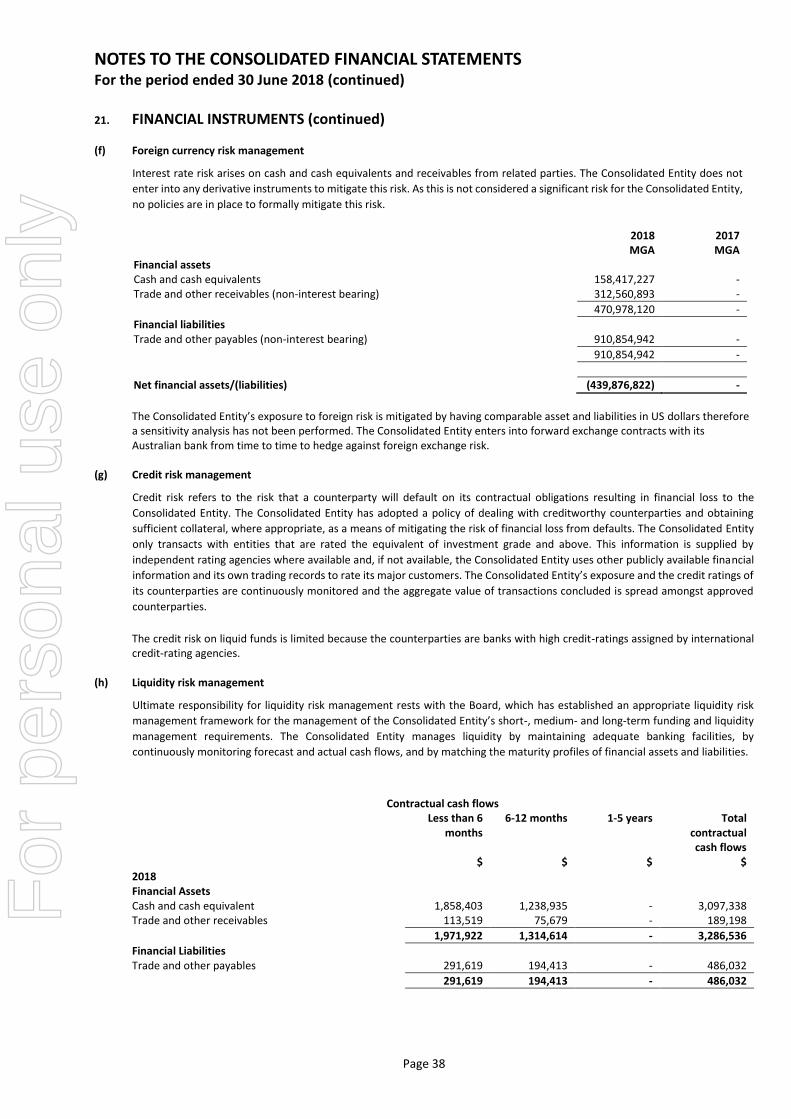
NOTES TO THE CONSOLIDATED FINANCIAL STATEMENTS For the period ended 30 June 2018 (continued)
Page 38
21. FINANCIAL INSTRUMENTS (continued) (f) Foreign currency risk management
Interest rate risk arises on cash and cash equivalents and receivables from related parties. The Consolidated Entity does not
enter into any derivative instruments to mitigate this risk. As this is not considered a significant risk for the Consolidated Entity,
no policies are in place to formally mitigate this risk.
2018 2017 MGA MGA Financial assets Cash and cash equivalents 158,417,227 - Trade and other receivables (non-interest bearing) 312,560,893 -
470,978,120 -
Financial liabilities Trade and other payables (non-interest bearing) 910,854,942 -
910,854,942 -
Net financial assets/(liabilities) (439,876,822) -
The Consolidated Entity’s exposure to foreign risk is mitigated by having comparable asset and liabilities in US dollars therefore a sensitivity analysis has not been performed. The Consolidated Entity enters into forward exchange contracts with its Australian bank from time to time to hedge against foreign exchange risk.
(g) Credit risk management
Credit risk refers to the risk that a counterparty will default on its contractual obligations resulting in financial loss to the
Consolidated Entity. The Consolidated Entity has adopted a policy of dealing with creditworthy counterparties and obtaining
sufficient collateral, where appropriate, as a means of mitigating the risk of financial loss from defaults. The Consolidated Entity
only transacts with entities that are rated the equivalent of investment grade and above. This information is supplied by
independent rating agencies where available and, if not available, the Consolidated Entity uses other publicly available financial
information and its own trading records to rate its major customers. The Consolidated Entity’s exposure and the credit ratings of
its counterparties are continuously monitored and the aggregate value of transactions concluded is spread amongst approved
counterparties.
The credit risk on liquid funds is limited because the counterparties are banks with high credit-ratings assigned by international credit-rating agencies.
(h) Liquidity risk management
Ultimate responsibility for liquidity risk management rests with the Board, which has established an appropriate liquidity risk
management framework for the management of the Consolidated Entity’s short-, medium- and long-term funding and liquidity
management requirements. The Consolidated Entity manages liquidity by maintaining adequate banking facilities, by
continuously monitoring forecast and actual cash flows, and by matching the maturity profiles of financial assets and liabilities.
Contractual cash flows
Less than 6 months
6-12 months 1-5 years Total contractual cash flows
$ $ $ $ 2018 Financial Assets Cash and cash equivalent 1,858,403 1,238,935 - 3,097,338 Trade and other receivables 113,519 75,679 - 189,198
1,971,922 1,314,614 - 3,286,536
Financial Liabilities Trade and other payables 291,619 194,413 - 486,032
291,619 194,413 - 486,032
For
per
sona
l use
onl
y
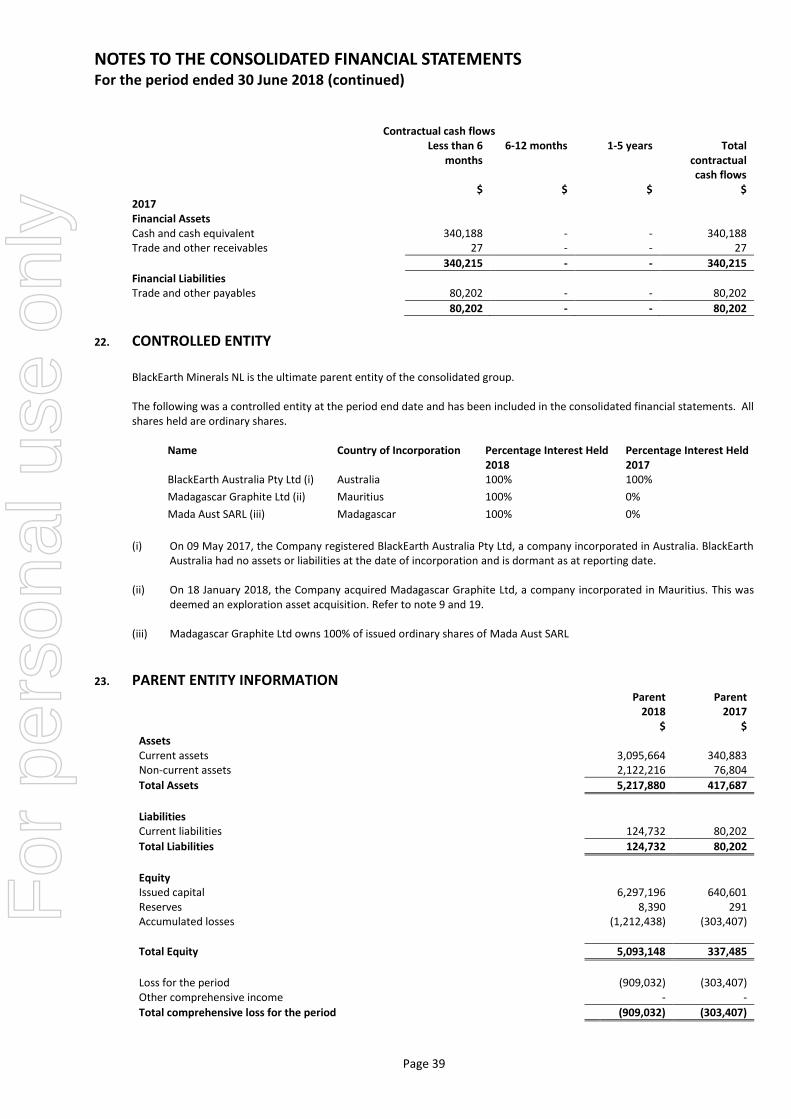
NOTES TO THE CONSOLIDATED FINANCIAL STATEMENTS For the period ended 30 June 2018 (continued)
Page 39
Contractual cash flows
Less than 6 months
6-12 months 1-5 years Total contractual cash flows
$ $ $ $ 2017 Financial Assets Cash and cash equivalent 340,188 - - 340,188 Trade and other receivables 27 - - 27
340,215 - - 340,215
Financial Liabilities Trade and other payables 80,202 - - 80,202
80,202 - - 80,202
22. CONTROLLED ENTITY
BlackEarth Minerals NL is the ultimate parent entity of the consolidated group. The following was a controlled entity at the period end date and has been included in the consolidated financial statements. All shares held are ordinary shares.
Name Country of Incorporation Percentage Interest Held 2018
Percentage Interest Held 2017
BlackEarth Australia Pty Ltd (i) Australia 100% 100%
Madagascar Graphite Ltd (ii) Mauritius 100% 0%
Mada Aust SARL (iii) Madagascar 100% 0%
(i) On 09 May 2017, the Company registered BlackEarth Australia Pty Ltd, a company incorporated in Australia. BlackEarth
Australia had no assets or liabilities at the date of incorporation and is dormant as at reporting date.
(ii) On 18 January 2018, the Company acquired Madagascar Graphite Ltd, a company incorporated in Mauritius. This was deemed an exploration asset acquisition. Refer to note 9 and 19.
(iii) Madagascar Graphite Ltd owns 100% of issued ordinary shares of Mada Aust SARL
23. PARENT ENTITY INFORMATION Parent Parent 2018 2017 $ $ Assets Current assets 3,095,664 340,883 Non-current assets 2,122,216 76,804
Total Assets 5,217,880 417,687
Liabilities Current liabilities 124,732 80,202
Total Liabilities 124,732 80,202
Equity Issued capital 6,297,196 640,601 Reserves 8,390 291 Accumulated losses (1,212,438) (303,407)
Total Equity 5,093,148 337,485
Loss for the period (909,032) (303,407) Other comprehensive income - -
Total comprehensive loss for the period (909,032) (303,407)
For
per
sona
l use
onl
y
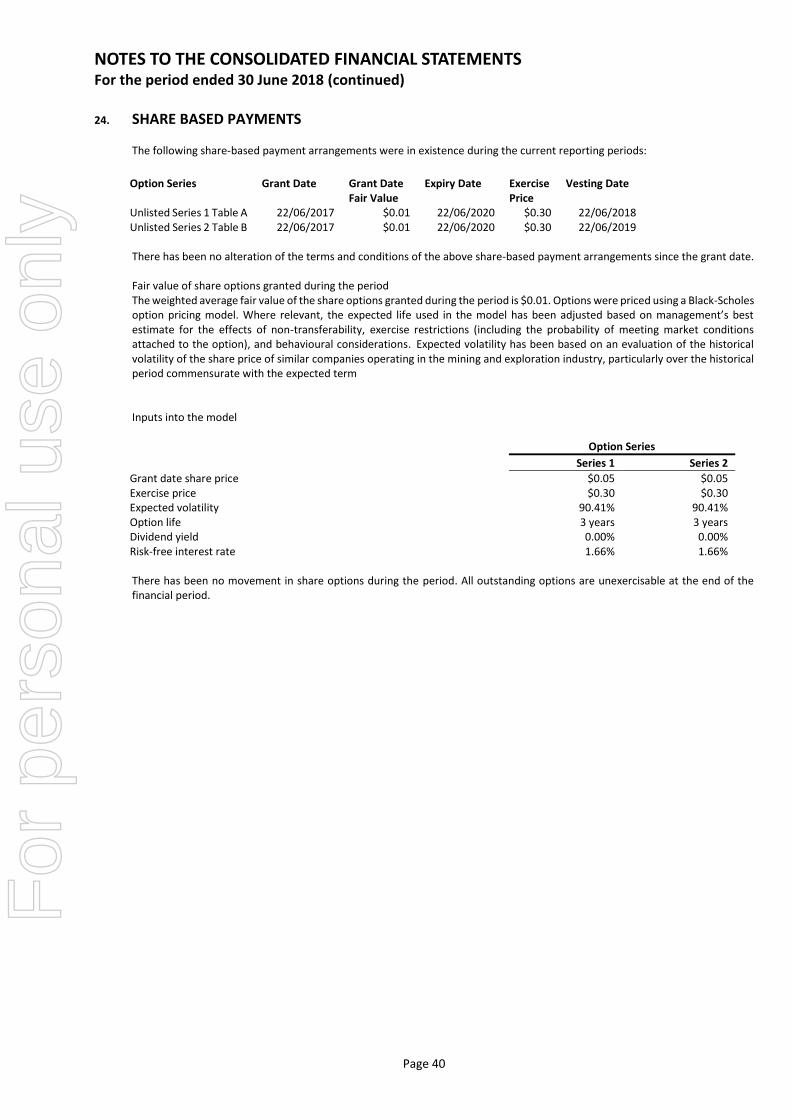
NOTES TO THE CONSOLIDATED FINANCIAL STATEMENTS For the period ended 30 June 2018 (continued)
Page 40
24. SHARE BASED PAYMENTS
The following share-based payment arrangements were in existence during the current reporting periods:
Option Series Grant Date Grant Date
Fair Value Expiry Date Exercise
Price Vesting Date
Unlisted Series 1 Table A 22/06/2017 $0.01 22/06/2020 $0.30 22/06/2018 Unlisted Series 2 Table B 22/06/2017 $0.01 22/06/2020 $0.30 22/06/2019 There has been no alteration of the terms and conditions of the above share-based payment arrangements since the grant date. Fair value of share options granted during the period The weighted average fair value of the share options granted during the period is $0.01. Options were priced using a Black-Scholes option pricing model. Where relevant, the expected life used in the model has been adjusted based on management’s best estimate for the effects of non-transferability, exercise restrictions (including the probability of meeting market conditions attached to the option), and behavioural considerations. Expected volatility has been based on an evaluation of the historical volatility of the share price of similar companies operating in the mining and exploration industry, particularly over the historical period commensurate with the expected term Inputs into the model Option Series
Series 1 Series 2
Grant date share price $0.05 $0.05 Exercise price $0.30 $0.30 Expected volatility 90.41% 90.41% Option life 3 years 3 years Dividend yield 0.00% 0.00% Risk-free interest rate 1.66% 1.66% There has been no movement in share options during the period. All outstanding options are unexercisable at the end of the financial period.
For
per
sona
l use
onl
y
Page 41
DIRECTORS’ DECLARATION
The directors of BlackEarth Minerals NL declare that:
1. The financial statements and notes are in accordance with the Corporations Act 2001 including compliance with accounting standards and:
(a) comply with International Financial Reporting Standards as disclosed in note1(a); and (b) give a true and fair view of the Consolidated entity’s financial position as at 30 June 2018 and of its performance as
represented by the results of its operations, changes in equity and its cash flows for the period ended on that date; and
2. At the date of this statement there are reasonable grounds to believe that the consolidated entity will be able to pay its debts as and when they become due and payable.
This declaration is made in accordance with a resolution of the Board of Directors made pursuant to S.295(5) of the Corporations Act 2001.
Thomas Revy Managing Director
Dated at Perth this 26th day of September 2018
For
per
sona
l use
onl
y
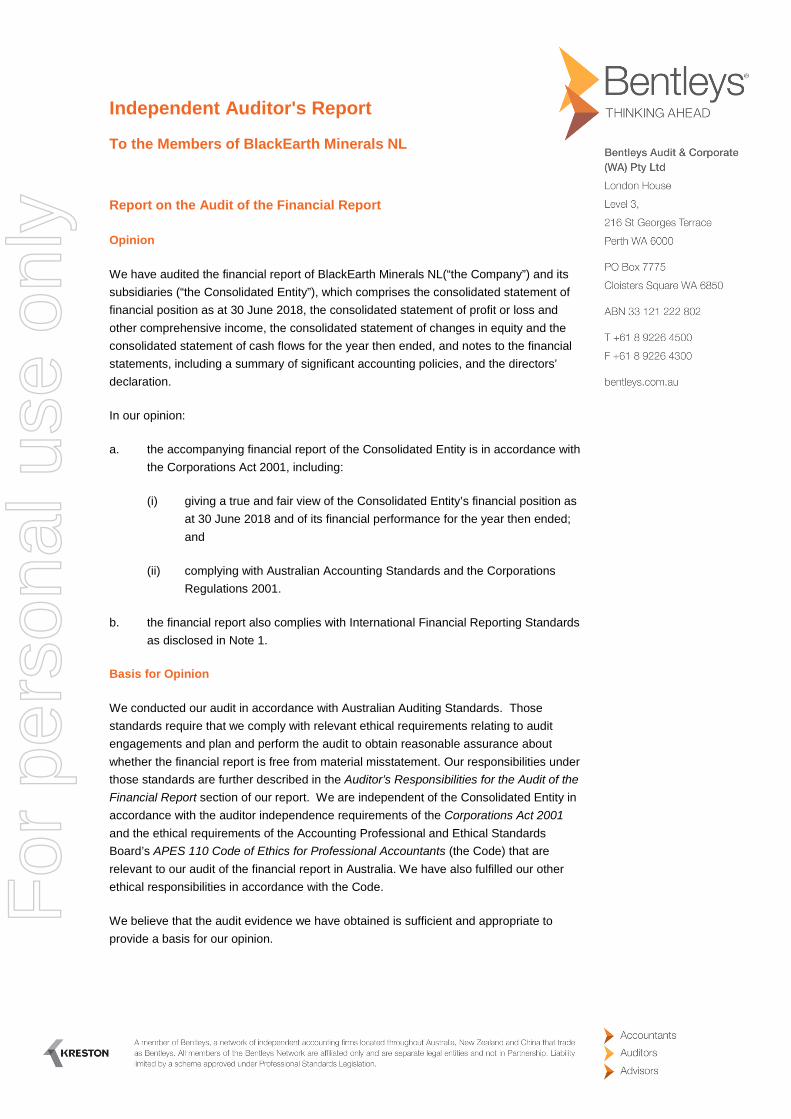
Independent Auditor's Report
To the Members of BlackEarth Minerals NL
Report on the Audit of the Financial Report
Opinion
We have audited the financial report of BlackEarth Minerals NL(“the Company”) and its
subsidiaries (“the Consolidated Entity”), which comprises the consolidated statement of
financial position as at 30 June 2018, the consolidated statement of profit or loss and
other comprehensive income, the consolidated statement of changes in equity and the
consolidated statement of cash flows for the year then ended, and notes to the financial
statements, including a summary of significant accounting policies, and the directors’
declaration.
In our opinion:
a. the accompanying financial report of the Consolidated Entity is in accordance with
the Corporations Act 2001, including:
(i) giving a true and fair view of the Consolidated Entity’s financial position as
at 30 June 2018 and of its financial performance for the year then ended;
and
(ii) complying with Australian Accounting Standards and the Corporations
Regulations 2001.
b. the financial report also complies with International Financial Reporting Standards
as disclosed in Note 1.
Basis for Opinion
We conducted our audit in accordance with Australian Auditing Standards. Those
standards require that we comply with relevant ethical requirements relating to audit
engagements and plan and perform the audit to obtain reasonable assurance about
whether the financial report is free from material misstatement. Our responsibilities under
those standards are further described in the Auditor’s Responsibilities for the Audit of the Financial Report section of our report. We are independent of the Consolidated Entity in
accordance with the auditor independence requirements of the Corporations Act 2001and the ethical requirements of the Accounting Professional and Ethical Standards
Board’s APES 110 Code of Ethics for Professional Accountants (the Code) that are
relevant to our audit of the financial report in Australia. We have also fulfilled our other
ethical responsibilities in accordance with the Code.
We believe that the audit evidence we have obtained is sufficient and appropriate to
provide a basis for our opinion.
For
per
sona
l use
onl
y
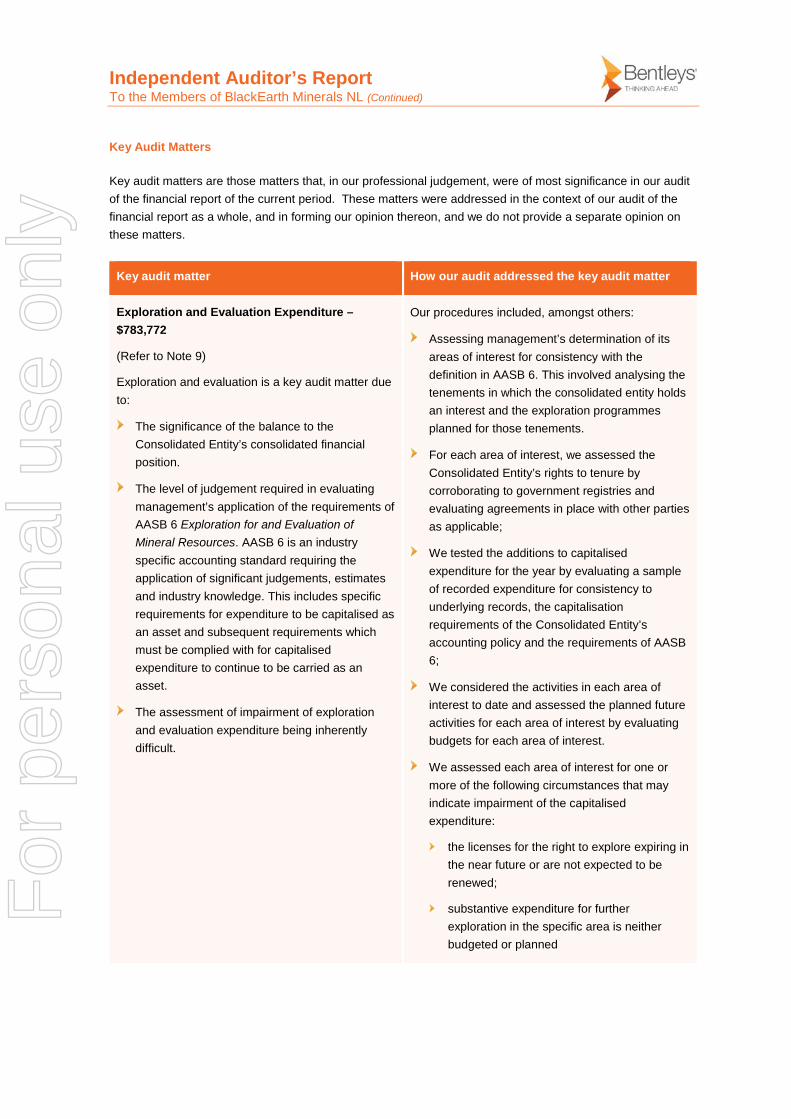
Independent Auditor’s Report To the Members of BlackEarth Minerals NL (Continued)
Key Audit Matters
Key audit matters are those matters that, in our professional judgement, were of most significance in our audit
of the financial report of the current period. These matters were addressed in the context of our audit of the
financial report as a whole, and in forming our opinion thereon, and we do not provide a separate opinion on
these matters.
Key audit matter How our audit addressed the key audit matter
Exploration and Evaluation Expenditure –
$783,772
(Refer to Note 9)
Exploration and evaluation is a key audit matter due
to:
The significance of the balance to the
Consolidated Entity’s consolidated financial
position.
The level of judgement required in evaluating
management’s application of the requirements of
AASB 6 Exploration for and Evaluation of Mineral Resources. AASB 6 is an industry
specific accounting standard requiring the
application of significant judgements, estimates
and industry knowledge. This includes specific
requirements for expenditure to be capitalised as
an asset and subsequent requirements which
must be complied with for capitalised
expenditure to continue to be carried as an
asset.
The assessment of impairment of exploration
and evaluation expenditure being inherently
difficult.
Our procedures included, amongst others:
Assessing management’s determination of its
areas of interest for consistency with the
definition in AASB 6. This involved analysing the
tenements in which the consolidated entity holds
an interest and the exploration programmes
planned for those tenements.
For each area of interest, we assessed the
Consolidated Entity’s rights to tenure by
corroborating to government registries and
evaluating agreements in place with other parties
as applicable;
We tested the additions to capitalised
expenditure for the year by evaluating a sample
of recorded expenditure for consistency to
underlying records, the capitalisation
requirements of the Consolidated Entity’s
accounting policy and the requirements of AASB
6;
We considered the activities in each area of
interest to date and assessed the planned future
activities for each area of interest by evaluating
budgets for each area of interest.
We assessed each area of interest for one or
more of the following circumstances that may
indicate impairment of the capitalised
expenditure:
the licenses for the right to explore expiring in
the near future or are not expected to be
renewed;
substantive expenditure for further
exploration in the specific area is neither
budgeted or planned
For
per
sona
l use
onl
y
Independent Auditor’s Report To the Members of BlackEarth Minerals NL (Continued)
Key audit matter How our audit addressed the key audit matter
decision or intent by the Consolidated Entity
to discontinue activities in the specific area of
interest due to lack of commercially viable
quantities of resources; and
data indicating that, although a development
in the specific area is likely to proceed, the
carrying amount of the exploration asset is
unlikely to be recovered in full from
successful development or sale.
We assessed the appropriateness of the
related disclosures in Note 9 to the financial
statements.
Other Information
The directors are responsible for the other information. The other information comprises the information
included in the Consolidated Entity’s annual report for the year ended 30 June 2018, but does not include the
financial report and our auditor’s report thereon.
Our opinion on the financial report does not cover the other information and accordingly we do not express any
form of assurance conclusion thereon.
In connection with our audit of the financial report, our responsibility is to read the other information and, in
doing so, consider whether the other information is materially inconsistent with the financial report or our
knowledge obtained in the audit or otherwise appears to be materially misstated.
If, based on the work we have performed, we conclude that there is a material misstatement of this other
information, we are required to report that fact. We have nothing to report in this regard.
Responsibilities of the Directors for the Financial Report
The directors of the Company are responsible for the preparation of the financial report that gives a true and
fair view in accordance with Australian Accounting Standards and the Corporations Act 2001 and for such
internal control as the directors determine is necessary to enable the preparation of the financial report that
gives a true and fair view and is free from material misstatement, whether due to fraud or error. In Note 1, the
directors also state in accordance with Australian Accounting Standard AASB 101 Presentation of Financial Statements, that the financial report complies with International Financial Reporting Standards.
In preparing the financial report, the directors are responsible for assessing the Consolidated Entity’s ability to
continue as a going concern, disclosing, as applicable, matters related to going concern and using the going
concern basis of accounting unless the directors either intend to liquidate the Consolidated Entity or to cease
operations, or has no realistic alternative but to do so.
For
per
sona
l use
onl
y
Independent Auditor’s Report To the Members of BlackEarth Minerals NL (Continued)
Auditor’s Responsibilities for the Audit of the Financial Report
Our responsibility is to express an opinion on the financial report based on our audit. Our objectives are to
obtain reasonable assurance about whether the financial report as a whole is free from material misstatement,
whether due to fraud or error, and to issue an auditor’s report that includes our opinion. Reasonable assurance
is a high level of assurance, but is not a guarantee that an audit conducted in accordance with the Australian
Auditing Standards will always detect a material misstatement when it exists. Misstatements can arise from
fraud or error and are considered material if, individually or in the aggregate, they could reasonably be
expected to influence the economic decisions of users taken on the basis of this financial report.
As part of an audit in accordance with the Australian Auditing Standards, we exercise professional judgement
and maintain professional scepticism throughout the audit. We also:
Identify and assess the risks of material misstatement of the financial report, whether due to fraud or
error, design and perform audit procedures responsive to those risks, and obtain audit evidence that is
sufficient and appropriate to provide a basis for our opinion. The risk of not detecting a material
misstatement resulting from fraud is higher than for one resulting from error, as fraud may involve
collusion, forgery, intentional omissions, misrepresentations, or the override of internal control.
Obtain an understanding of internal control relevant to the audit in order to design audit procedures that
are appropriate in the circumstances, but not for the purpose of expressing an opinion on the
effectiveness of the Consolidated Entity’s internal control.
Evaluate the appropriateness of accounting policies used and the reasonableness of accounting
estimates and related disclosures made by the directors.
Conclude on the appropriateness of the directors’ use of the going concern basis of accounting and,
based on the audit evidence obtained, whether a material uncertainty exists related to events or
conditions that may cast significant doubt on the Consolidated Entity’s ability to continue as a going
concern. If we conclude that a material uncertainty exists, we are required to draw attention in our
auditor’s report to the related disclosures in the financial report or, if such disclosures are inadequate, to
modify our opinion. Our conclusions are based on the audit evidence obtained up to the date of our
auditor’s report. However, future events or conditions may cause the Consolidated Entity to cease to
continue as a going concern.
Evaluate the overall presentation, structure and content of the financial report, including the disclosures,
and whether the financial report represents the underlying transactions and events in a manner that
achieves fair presentation.
Obtain sufficient appropriate audit evidence regarding the financial information of the entities or
business activities within the Consolidated Entity to express an opinion on the financial report. We are
responsible for the direction, supervision and performance of the Consolidated Entity audit. We remain
solely responsible for our audit opinion.
We communicate with the directors regarding, among other matters, the planned scope and timing of the audit
and significant audit findings, including any significant deficiencies in internal control that we identify during our
audit.
For
per
sona
l use
onl
y
Independent Auditor’s Report To the Members of BlackEarth Minerals NL (Continued)
We also provide the directors with a statement that we have complied with relevant ethical requirements
regarding independence, and to communicate with them all relationships and other matters that may
reasonably be thought to bear on our independence, and where applicable, related safeguards.
From the matters communicated with the directors, we determine those matters that were of most significance
in the audit of the financial report of the current period and are therefore the key audit matters. We describe
these matters in our auditor’s report unless law or regulation precludes public disclosure about the matter or
when, in extremely rare circumstances, we determine that a matter should not be communicated in our report
because the adverse consequences of doing so would reasonably be expected to outweigh the public interest
benefits of such communication.
Report on the Remuneration Report
We have audited the Remuneration Report included in the directors’ report for the year ended 30 June 2018.
The directors of the Company are responsible for the preparation and presentation of the remuneration report
in accordance with s 300A of the Corporations Act 2001. Our responsibility is to express an opinion on the
remuneration report, based on our audit conducted in accordance with Australian Auditing Standards.
Auditor’s Opinion
In our opinion, the Remuneration Report of the Company, for the year ended 30 June 2018, complies with
section 300A of the Corporations Act 2001.
BENTLEYS MARK DELAURENTIS CA
Chartered Accountants Partner
Dated at Perth this 26th day of September 2018
For
per
sona
l use
onl
y
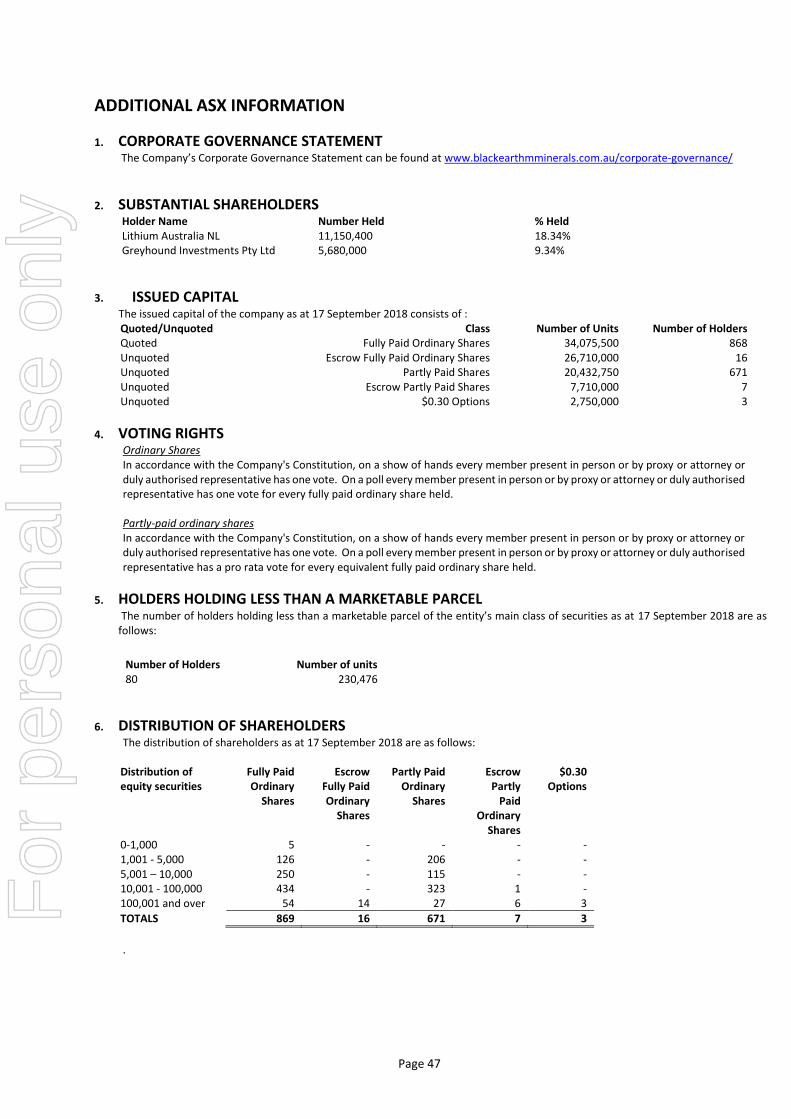
Page 47
ADDITIONAL ASX INFORMATION
1. CORPORATE GOVERNANCE STATEMENT The Company’s Corporate Governance Statement can be found at www.blackearthmminerals.com.au/corporate-governance/
2. SUBSTANTIAL SHAREHOLDERS Holder Name Number Held % Held Lithium Australia NL 11,150,400 18.34% Greyhound Investments Pty Ltd 5,680,000 9.34%
3. ISSUED CAPITAL The issued capital of the company as at 17 September 2018 consists of :
Quoted/Unquoted Class Number of Units Number of Holders Quoted Fully Paid Ordinary Shares 34,075,500 868 Unquoted Escrow Fully Paid Ordinary Shares 26,710,000 16 Unquoted Partly Paid Shares 20,432,750 671 Unquoted Escrow Partly Paid Shares 7,710,000 7 Unquoted $0.30 Options 2,750,000 3
4. VOTING RIGHTS Ordinary Shares In accordance with the Company's Constitution, on a show of hands every member present in person or by proxy or attorney or duly authorised representative has one vote. On a poll every member present in person or by proxy or attorney or duly authorised representative has one vote for every fully paid ordinary share held. Partly-paid ordinary shares In accordance with the Company's Constitution, on a show of hands every member present in person or by proxy or attorney or duly authorised representative has one vote. On a poll every member present in person or by proxy or attorney or duly authorised representative has a pro rata vote for every equivalent fully paid ordinary share held.
5. HOLDERS HOLDING LESS THAN A MARKETABLE PARCEL The number of holders holding less than a marketable parcel of the entity’s main class of securities as at 17 September 2018 are as follows:
Number of Holders Number of units 80 230,476
6. DISTRIBUTION OF SHAREHOLDERS The distribution of shareholders as at 17 September 2018 are as follows:
Distribution of equity securities
Fully Paid Ordinary
Shares
Escrow Fully Paid Ordinary
Shares
Partly Paid Ordinary
Shares
Escrow Partly
Paid Ordinary
Shares
$0.30 Options
0-1,000 5 - - - - 1,001 - 5,000 126 - 206 - - 5,001 – 10,000 250 - 115 - - 10,001 - 100,000 434 - 323 1 - 100,001 and over 54 14 27 6 3
TOTALS 869 16 671 7 3
.
For
per
sona
l use
onl
y
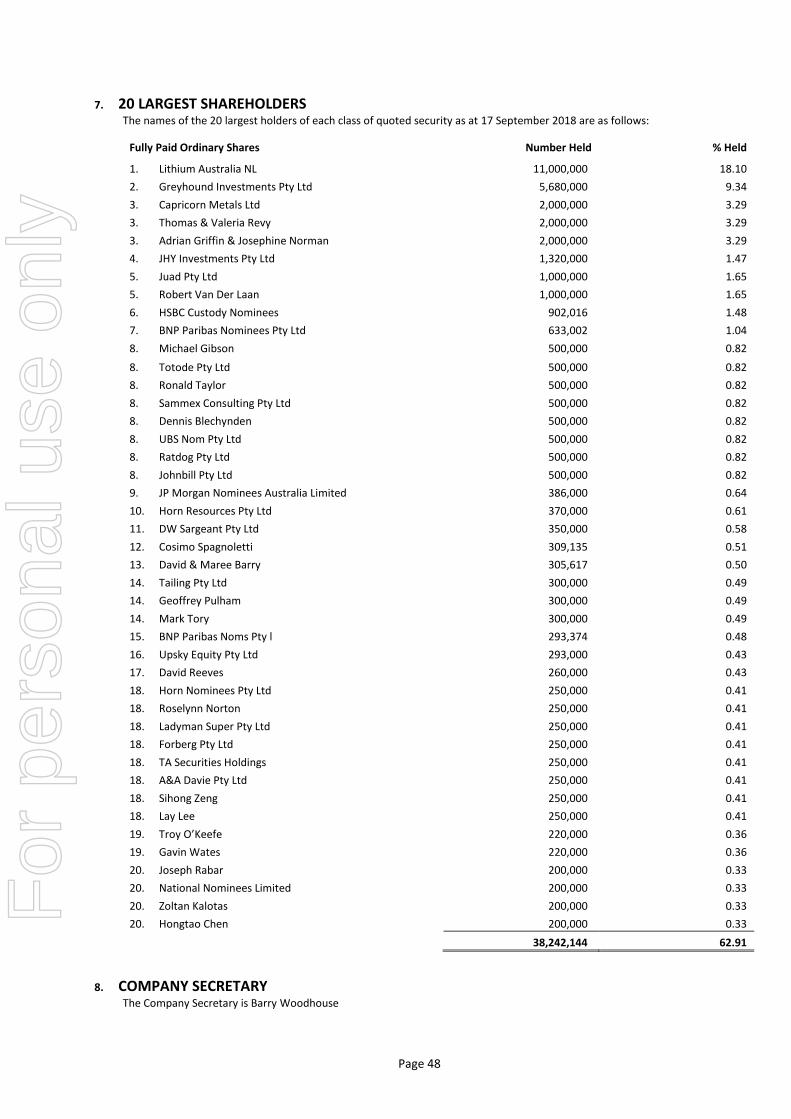
Page 48
7. 20 LARGEST SHAREHOLDERS The names of the 20 largest holders of each class of quoted security as at 17 September 2018 are as follows:
Fully Paid Ordinary Shares Number Held % Held
1. Lithium Australia NL 11,000,000 18.10
2. Greyhound Investments Pty Ltd 5,680,000 9.34
3. Capricorn Metals Ltd 2,000,000 3.29
3. Thomas & Valeria Revy 2,000,000 3.29
3. Adrian Griffin & Josephine Norman 2,000,000 3.29
4. JHY Investments Pty Ltd 1,320,000 1.47
5. Juad Pty Ltd 1,000,000 1.65
5. Robert Van Der Laan 1,000,000 1.65
6. HSBC Custody Nominees 902,016 1.48
7. BNP Paribas Nominees Pty Ltd 633,002 1.04
8. Michael Gibson 500,000 0.82
8. Totode Pty Ltd 500,000 0.82
8. Ronald Taylor 500,000 0.82
8. Sammex Consulting Pty Ltd 500,000 0.82
8. Dennis Blechynden 500,000 0.82
8. UBS Nom Pty Ltd 500,000 0.82
8. Ratdog Pty Ltd 500,000 0.82
8. Johnbill Pty Ltd 500,000 0.82
9. JP Morgan Nominees Australia Limited 386,000 0.64
10. Horn Resources Pty Ltd 370,000 0.61
11. DW Sargeant Pty Ltd 350,000 0.58
12. Cosimo Spagnoletti 309,135 0.51
13. David & Maree Barry 305,617 0.50
14. Tailing Pty Ltd 300,000 0.49
14. Geoffrey Pulham 300,000 0.49
14. Mark Tory 300,000 0.49
15. BNP Paribas Noms Pty l 293,374 0.48
16. Upsky Equity Pty Ltd 293,000 0.43
17. David Reeves 260,000 0.43
18. Horn Nominees Pty Ltd 250,000 0.41
18. Roselynn Norton 250,000 0.41
18. Ladyman Super Pty Ltd 250,000 0.41
18. Forberg Pty Ltd 250,000 0.41
18. TA Securities Holdings 250,000 0.41
18. A&A Davie Pty Ltd 250,000 0.41
18. Sihong Zeng 250,000 0.41
18. Lay Lee 250,000 0.41
19. Troy O’Keefe 220,000 0.36
19. Gavin Wates 220,000 0.36
20. Joseph Rabar 200,000 0.33
20. National Nominees Limited 200,000 0.33
20. Zoltan Kalotas 200,000 0.33
20. Hongtao Chen 200,000 0.33
38,242,144 62.91
8. COMPANY SECRETARY The Company Secretary is Barry Woodhouse
For
per
sona
l use
onl
y
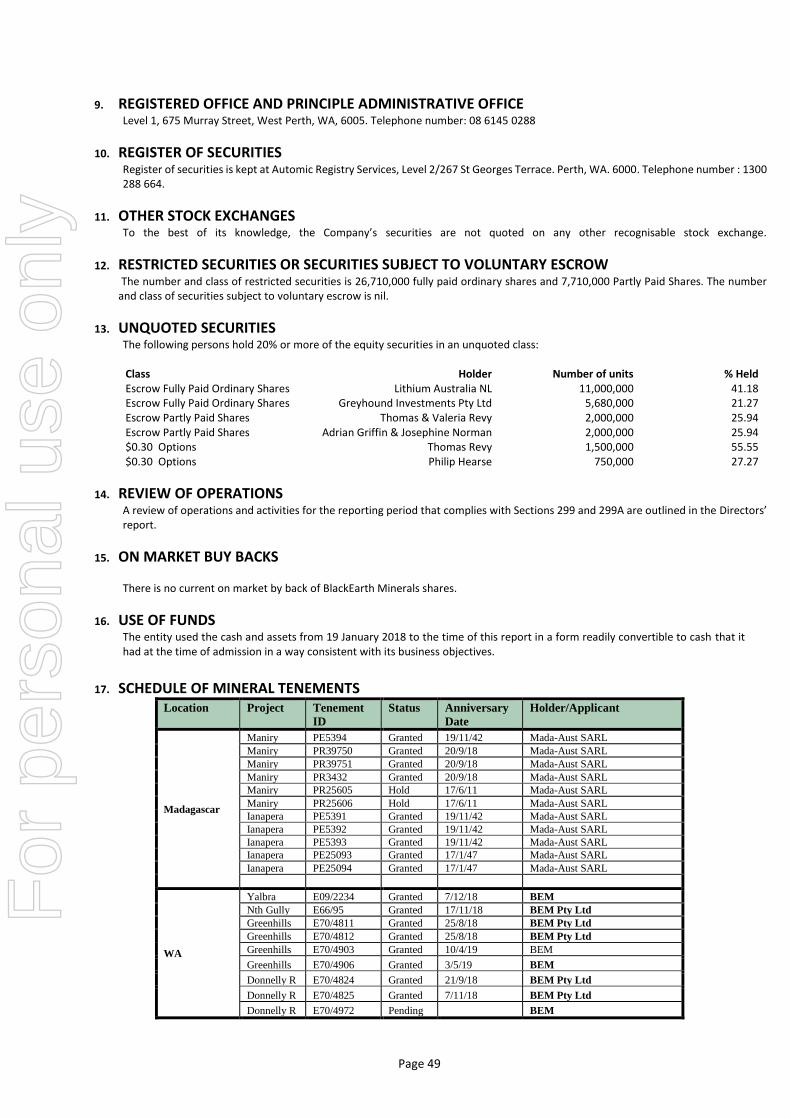
Page 49
9. REGISTERED OFFICE AND PRINCIPLE ADMINISTRATIVE OFFICELevel 1, 675 Murray Street, West Perth, WA, 6005. Telephone number: 08 6145 0288
10. REGISTER OF SECURITIESRegister of securities is kept at Automic Registry Services, Level 2/267 St Georges Terrace. Perth, WA. 6000. Telephone number : 1300 288 664.
11. OTHER STOCK EXCHANGESTo the best of its knowledge, the Company’s securities are not quoted on any other recognisable stock exchange.
12. RESTRICTED SECURITIES OR SECURITIES SUBJECT TO VOLUNTARY ESCROWThe number and class of restricted securities is 26,710,000 fully paid ordinary shares and 7,710,000 Partly Paid Shares. The number
and class of securities subject to voluntary escrow is nil.
13. UNQUOTED SECURITIESThe following persons hold 20% or more of the equity securities in an unquoted class:
Class Holder Number of units % Held Escrow Fully Paid Ordinary Shares Lithium Australia NL 11,000,000 41.18 Escrow Fully Paid Ordinary Shares Greyhound Investments Pty Ltd 5,680,000 21.27 Escrow Partly Paid Shares Thomas & Valeria Revy 2,000,000 25.94 Escrow Partly Paid Shares Adrian Griffin & Josephine Norman 2,000,000 25.94 $0.30 Options Thomas Revy 1,500,000 55.55 $0.30 Options Philip Hearse 750,000 27.27
14. REVIEW OF OPERATIONSA review of operations and activities for the reporting period that complies with Sections 299 and 299A are outlined in the Directors’ report.
15. ON MARKET BUY BACKS
There is no current on market by back of BlackEarth Minerals shares.
16. USE OF FUNDSThe entity used the cash and assets from 19 January 2018 to the time of this report in a form readily convertible to cash that it had at the time of admission in a way consistent with its business objectives.
17. SCHEDULE OF MINERAL TENEMENTSLocation Project Tenement
ID
Status Anniversary
Date
Holder/Applicant
Madagascar
Maniry PE5394 Granted 19/11/42 Mada-Aust SARL
Maniry PR39750 Granted 20/9/18 Mada-Aust SARL
Maniry PR39751 Granted 20/9/18 Mada-Aust SARL
Maniry PR3432 Granted 20/9/18 Mada-Aust SARL
Maniry PR25605 Hold 17/6/11 Mada-Aust SARL
Maniry PR25606 Hold 17/6/11 Mada-Aust SARL
Ianapera PE5391 Granted 19/11/42 Mada-Aust SARL
Ianapera PE5392 Granted 19/11/42 Mada-Aust SARL
Ianapera PE5393 Granted 19/11/42 Mada-Aust SARL
Ianapera PE25093 Granted 17/1/47 Mada-Aust SARL
Ianapera PE25094 Granted 17/1/47 Mada-Aust SARL
WA
Yalbra E09/2234 Granted 7/12/18 BEM
Nth Gully E66/95 Granted 17/11/18 BEM Pty Ltd
Greenhills E70/4811 Granted 25/8/18 BEM Pty Ltd
Greenhills E70/4812 Granted 25/8/18 BEM Pty Ltd
Greenhills E70/4903 Granted 10/4/19 BEM
Greenhills E70/4906 Granted 3/5/19 BEM
Donnelly R E70/4824 Granted 21/9/18 BEM Pty Ltd
Donnelly R E70/4825 Granted 7/11/18 BEM Pty Ltd
Donnelly R E70/4972 Pending BEM
For
per
sona
l use
onl
y