For personal use only…Financial data is provided on a pro forma basis except where explicitly...
40
Financial data is provided on a pro forma basis except where explicitly stated otherwise 27 August 2020 Damstra Technology FY20 Results Presentation For personal use only
Transcript of For personal use only…Financial data is provided on a pro forma basis except where explicitly...

Financial data is provided on a pro forma basis except where explicitly stated otherwise
27 August 2020
Damstra Technology
FY20 Results PresentationFor
per
sona
l use
onl
y

Important notice and disclaimer
This presentation includes general information about the activities of Damstra Holdings Pty Ltd ACN 610 571 607 (Damstra) and its affiliates and related bodies corporate (as defined in the
Corporations Act 2001 (Cth) (Corporations Act) (together, the Damstra Group). This presentation is current as at 27 August 2020 (unless otherwise stated herein). The information contained in
this presentation is for general information purposes only.
The information contained in this presentation does not constitute investment or financial product advice (nor taxation or legal advice) and is not intended to be used as the basis for making an
investment decision. It does not take into account the investment objectives, financial situation, taxation position or needs of any particular investor, which should be considered when deciding if
an investment is appropriate. You must consider your own investment objectives, financial situation and needs. You should conduct and solely rely upon your own independent investigations
and enquiries, including obtaining taxation, legal, financial or other professional advice in relation to the information contained in this presentation as appropriate to your jurisdiction.
This presentation should be read in conjunction with any reports, financial statements, appendices or other documents or information that accompanies this presentation or which is otherwise
announced or released by Damstra on or about the same time as this presentation. This presentation should also be read in conjunction with Damstra’s other periodic and continuous disclosure
announcements.
While care has been taken in preparing the information in this presentation, to the maximum extent permitted by law, no representation or warranty, express or implied, is made nor any duty
undertaken in favour of any person as to the currency, accuracy, reliability, completeness or fairness of the information, opinions and conclusions contained in this presentation. To the maximum
extent permitted by law, no member of the Damstra Group nor any of their respective directors, officers, employees, affiliates, partners, consultants, agents, representatives or advisers (each a
Damstra Party and together, the Damstra Parties) guarantees or makes any representations or warranties, express or implied, as to or takes responsibility for, the currency, accuracy, reliability,
completeness or fairness of this presentation nor the information, opinions and conclusions contained in this presentation. The Damstra Parties do not represent or warrant that this presentation
is necessarily complete or that it contains all material information about the Damstra Group which a current or prospective investor may require in evaluating a current or possible investment in
Damstra. To the maximum extent permitted by law, each Damstra Party expressly disclaims any and all liability (whether direct, indirect, consequential or contingent), including, without limitation,
any liability arising out of fault or negligence on the part of any person, for any loss, expenses, damages or costs arising from the use of information contained in this presentation or for
omissions from this presentation including, without limitation, any financial information, any estimates or projections and any other financial information derived therefrom. Whilst the Damstra
Group has prepared this presentation in good faith, the information appearing in this presentation has not been independently verified or audited and may be subject to change, including via
further market updates. Anyone proposing to use such information should independently verify and check the accuracy, completeness, reliability and suitability of the information and should
obtain their own independent and specific advice from appropriate professionals or experts.
None of the Damstra Parties act for, or are responsible as a fiduciary to, you or any other person. Any fiduciary relationship is expressly disclaimed.
This presentation contains certain forward-looking statements. Forward-looking statements can generally be identified by the use of forward-looking words such as "anticipate", "believe",
"expect", "project", "forecast", "estimate", "outlook", "upside", "likely", "intend", "should", "could", "may", "target", "plan" and other similar expressions. Forward-looking statements include
statements about Damstra’s expectations regarding the performance of the Damstra Group’s business and its plans, strategies, prospects and outlook. Indications of, and guidance on, future
earnings and financial position and performance are also forward-looking statements, as may be any other statements that are not based on historical or current facts. Forward-looking
statements are often based on: (1) assumptions regarding the Damstra Group’s financial position, business strategies, plans and objectives of management for future operations and
development and the environment in which the Damstra Group will operate; and (2) current views, expectations and beliefs as at the date they are expressed, and which are subject to various
risks and uncertainties.
None of Damstra, or any other Damstra Party, makes any representation or warranty as to the accuracy of any forward looking statements contained in this presentation. Such statements speak
only as of the date hereof. Except to the extent required by law, none of the Damstra Parties has any obligation to update or revise any such statements to reflect any change in events,
conditions or circumstances on which any such statement is based. Such forward-looking statements are not guarantees of future performance and involve known and unknown risks,
uncertainties and other factors, many of which are beyond the control of the Damstra Parties, which may cause actual results to differ materially from those expressed or implied in such
statements. For example, the factors that are likely to affect the results of the Damstra Group include (but are not limited to) general economic conditions in Australia and globally, exchange
rates, competition in the markets in which the Damstra Group does and will operate; weather and climate conditions; and the inherent regulatory risks in the businesses of the Damstra Group.
2
For
per
sona
l use
onl
y
Important notice and disclaimer cont’d
There can be no assurance that actual outcomes will not differ materially from the forward-looking statements. As such, readers are cautioned not to place undue reliance on these statements.
Any statements as to past performance do not represent, and are not an indication of, future performance and no representation or warranty is made by any person as to the likelihood of
achievement or reasonableness of any forward looking statements, forecast financial information or other forecast. Nothing contained in this presentation is, or shall be relied upon as, a
promise, representation, warranty or guarantee, whether as to the past, present or future. In addition, the Damstra Parties have not independently verified, and cannot give any assurance as to,
the accuracy and completeness of any market and industry data or other information contained in this presentation that has been extracted or derived from third party sources. Accordingly, the
accuracy and completeness of such information is not guaranteed and it is merely included in this presentation for what it is worth and without endorsement by the Damstra Parties.
This presentation is not, and does not constitute, an offer to sell, or the solicitation of an offer to buy, invitation or recommendation to purchase any securities or other investment products in any
jurisdiction, and neither this presentation nor any of the information contained herein, shall form the basis of any contract or commitment.
All financial amounts contained in this presentation are expressed in Australian dollars (unless otherwise stated). Any discrepancies between totals and sums of components in tables, figures
and body content contained in this presentation are due to rounding. Tables, figures and body content contained in this presentation have not been amended by Damstra to correct immaterial
summation differences that may arise from this rounding convention.
Damstra’s results are reported under IFRS. This presentation may nevertheless include non-IFRS information and other measures such as ratios. These other measures are used internally by
management to assess the performance of the business. Non-IFRS and other measures should not be considered as an indication of, or as an alternative to, an IFRS measure and accordingly
you are cautioned not to place undue emphasis on any such information or measures.
This presentation may contain trade marks and trade names of third parties, which are the property of their respective owners. Third party trademarks and trade names used in this presentation
belong to the relevant owners and use is not intended to represent sponsorship, approval or association by or with any of the Damstra Parties.
This presentation is made available to you on the condition that by receiving, viewing, downloading or otherwise accessing or utilising this presentation, you confirm that you understand and
agree to the contents of this important notice and that you are a person to whom this presentation may lawfully be made available in accordance with laws applicable to you, including those of
the jurisdiction in which you are located.
Vault Information and Combined Information
All information contained in this presentation regarding Vault Intelligence Intelligence Limited (ACN 145 040 857) (“Vault”) or any of its related bodies corporate or their respective businesses,
operations, assets or affairs has been sourced from Vault or from public sources (including the announcement in relation to the Acquisition made by Vault on 8 July 2020) (“Vault Information”).
The Vault Information includes all financial information relating to Vault and all Combined Information (as defined below) to the extent such information is based on Vault Information. The Vault
Information has not been independently verified by Damstra.
To the extent that this presentation contains financial and other information of the merged group (“Combined Information”), such information has been prepared on a pro forma basis assuming
the proposed acquisition of Vault by scheme of arrangement (“Acquisition”) was completed prior to 1 July 2020. Combined Information is provided for illustrative purposes only and is based on
Vault Information (see above). For example, the pro forma revenue of the merged group in FY21 is calculated by aggregating Damstra’s standalone revenue in FY21 (as projected by Damstra)
and Vault’s standalone revenue in FY21 (as projected by Vault). Combined Information does not constitute a forecast, estimate, guidance, projection, prediction or indication of future
performance, and should not be relied upon as such (or for any other purpose). It should also be noted that Damstra and Vault will continue to operate on a separate and independent basis until
the Acquisition is completed, which is scheduled for October 2020 (subject to the satisfaction of the conditions set out in the scheme implementation deed separately released to the market).
Therefore, if the Acquisition is completed, Damstra’s financial results for FY21 will only include for the part of FY21 following completion of the Acquisition where Vault is under Damstra’s
ownership.
To the maximum extent permitted by law, Damstra and each Damstra Party expressly disclaims any and all responsibility or liability for any Vault Information or any Combined Information (to the
extent such information is based on Vault Information), and none of them make or give any representation, warranty, assurance or guarantee, whether express or implied, in relation to any such
information (including in relation to the completeness, reliability or accuracy of any such information).
3
For
per
sona
l use
onl
y

Business update2
1 Results overview
3 FY20 financial informationAgenda
4 Vault acquisition
5 Summary and FY21 outlook
4
For
per
sona
l use
onl
y

Key financial and operating metrics for FY20
Strong business performance in FY20, demonstrating a fundamental step change in the business compared to FY19.This places
the business in a strong position for FY21, including the acquisition of Vault
$23.5mRevenue and other income
vs. $16.0m in FY19
46.6%Revenue and other income
growth
vs. 3-year CAGR 42.0%
90.7%Recurring revenue1
vs. 90.4% in FY19
<0.5%Client revenue churn2
vs. <1% in FY19
30%Increase in total3 R&D spend
Total R&D spend is 22.9% of FY20
revenue
$6.8mPro forma EBITDA4
$4.8m Underlying EBITDA5
vs. $1.8m6 in FY19
$14.2mCash and trade receivables
vs. $3.9m at Jun-19
279Clients
vs. 129 at Jun-19
404kUsers
vs. 320k at Jun-19
1. Relates to revenue that is earned over time
2. Calculated as prior year recurring revenue that was lost during FY20
3. Calculated as the sum of R&D expense per the pro forma income statement and capitalised development costs per the cash flow statement
4. Before IPO costs, share-based payments, income tax, finance expenses and acquisition costs
5. Pro forma EBITDA excluding one-off other income
6. FY19 underlying and pro forma EBITDA are equivalent
7. Excludes transaction costs related to business combinations 5
$5.2mPro forma7 operating cash
flow
vs. $0.3m+ in FY19
For
per
sona
l use
onl
y
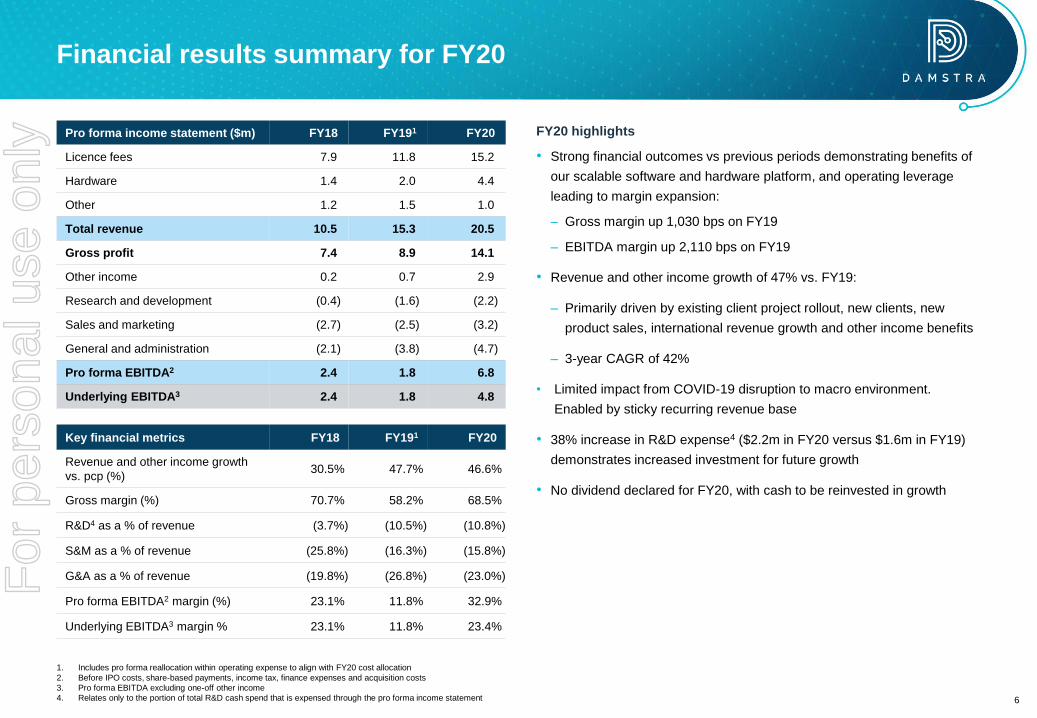
Financial results summary for FY20
Pro forma income statement ($m) FY18 FY191 FY20
Licence fees 7.9 11.8 15.2
Hardware 1.4 2.0 4.4
Other 1.2 1.5 1.0
Total revenue 10.5 15.3 20.5
Gross profit 7.4 8.9 14.1
Other income 0.2 0.7 2.9
Research and development (0.4) (1.6) (2.2)
Sales and marketing (2.7) (2.5) (3.2)
General and administration (2.1) (3.8) (4.7)
Pro forma EBITDA2 2.4 1.8 6.8
Underlying EBITDA3 2.4 1.8 4.8
FY20 highlights
• Strong financial outcomes vs previous periods demonstrating benefits of
our scalable software and hardware platform, and operating leverage
leading to margin expansion:
– Gross margin up 1,030 bps on FY19
– EBITDA margin up 2,110 bps on FY19
• Revenue and other income growth of 47% vs. FY19:
– Primarily driven by existing client project rollout, new clients, new
product sales, international revenue growth and other income benefits
– 3-year CAGR of 42%
• Limited impact from COVID-19 disruption to macro environment.
Enabled by sticky recurring revenue base
• 38% increase in R&D expense4 ($2.2m in FY20 versus $1.6m in FY19)
demonstrates increased investment for future growth
• No dividend declared for FY20, with cash to be reinvested in growth
Key financial metrics FY18 FY191 FY20
Revenue and other income growth
vs. pcp (%)30.5% 47.7% 46.6%
Gross margin (%) 70.7% 58.2% 68.5%
R&D4 as a % of revenue (3.7%) (10.5%) (10.8%)
S&M as a % of revenue (25.8%) (16.3%) (15.8%)
G&A as a % of revenue (19.8%) (26.8%) (23.0%)
Pro forma EBITDA2 margin (%) 23.1% 11.8% 32.9%
Underlying EBITDA3 margin % 23.1% 11.8% 23.4%
1. Includes pro forma reallocation within operating expense to align with FY20 cost allocation
2. Before IPO costs, share-based payments, income tax, finance expenses and acquisition costs
3. Pro forma EBITDA excluding one-off other income
4. Relates only to the portion of total R&D cash spend that is expensed through the pro forma income statement 6
For
per
sona
l use
onl
y

Business update2
1 Results overview
3 FY20 financial informationAgenda
4 Vault acquisition
5 Summary and FY21 outlook
7
For
per
sona
l use
onl
y
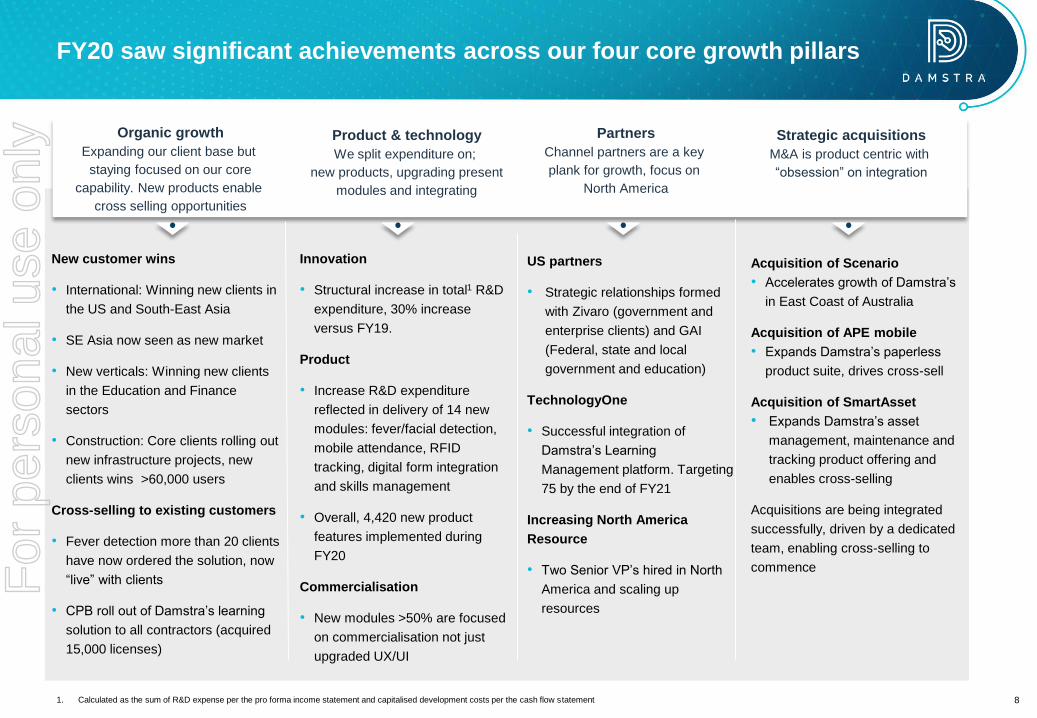
Organic growth
Expanding our client base but
staying focused on our core
capability. New products enable
cross selling opportunities
Product & technology
We split expenditure on;
new products, upgrading present
modules and integrating
Partners
Channel partners are a key
plank for growth, focus on
North America
Strategic acquisitions
M&A is product centric with
“obsession” on integration
New customer wins
• International: Winning new clients in
the US and South-East Asia
• SE Asia now seen as new market
• New verticals: Winning new clients
in the Education and Finance
sectors
• Construction: Core clients rolling out
new infrastructure projects, new
clients wins >60,000 users
Cross-selling to existing customers
• Fever detection more than 20 clients
have now ordered the solution, now
“live” with clients
• CPB roll out of Damstra’s learning
solution to all contractors (acquired
15,000 licenses)
US partners
• Strategic relationships formed
with Zivaro (government and
enterprise clients) and GAI
(Federal, state and local
government and education)
TechnologyOne
• Successful integration of
Damstra’s Learning
Management platform. Targeting
75 by the end of FY21
Increasing North America
Resource
• Two Senior VP’s hired in North
America and scaling up
resources
Acquisition of Scenario
• Accelerates growth of Damstra’s
in East Coast of Australia
Acquisition of APE mobile
• Expands Damstra’s paperless
product suite, drives cross-sell
Acquisition of SmartAsset
• Expands Damstra’s asset
management, maintenance and
tracking product offering and
enables cross-selling
Acquisitions are being integrated
successfully, driven by a dedicated
team, enabling cross-selling to
commence
FY20 saw significant achievements across our four core growth pillars
Innovation
• Structural increase in total1 R&D
expenditure, 30% increase
versus FY19.
Product
• Increase R&D expenditure
reflected in delivery of 14 new
modules: fever/facial detection,
mobile attendance, RFID
tracking, digital form integration
and skills management
• Overall, 4,420 new product
features implemented during
FY20
Commercialisation
• New modules >50% are focused
on commercialisation not just
upgraded UX/UI
1. Calculated as the sum of R&D expense per the pro forma income statement and capitalised development costs per the cash flow statement 8
For
per
sona
l use
onl
y

Industry Tailwinds – what has changed in a Damstra context
COVID-19 has accelerated some underlying industry trends around digitisation, but companies must operate in an
environment where every company say they have a “COVID” solution. There are some key long term underlying trends1
Impact for
Damstra
Structural change
Mobility
tracking
Fever
detection
Fear,
“keep me
safe”Manage
people’s
accesseLearning
Integrate
with
other
systems
Productivity
requirement
Move away
from point
solutions
Digitalisation
of site
operations
Australian
infrastructure
Increased
use of
analytics
Scalability
“Where do
you sit in my
tech stack?”
High
High
Low
Low
Damstra’s solutions are considered critical by many customers in ensuring the delivery of a safe work environment, as
well as to reduce the health and safety risks for employees on a site
Acceleration of digitalisation as a result of COVID-19
1. Based on Management observations and client survey feedback 9
For
per
sona
l use
onl
y

Continued investment in product and technology
During the FY20 period, Damstra has continued to invest in its product and infrastructure – with a focus on building
innovative, highly scalable products for our clients
4,420Feature releases
Product
enhancements and
deployments
Platform up-time
99.9%
Faster product
feature releases
83%
Increase in R&D
headcount
700mAPI calls
Increasing
usage of API
integrations
Better platform
performance
Scale on demand
Leveraged new software
tools, frameworks and
methodologies for faster
innovation
Infrastructure upgrades
for improved, faster and
more consistent
experience
Increased investment in
people to drive product
module roll out
Product
innovation
Expanding core platform,
scaling, functionality,
productivity and
performance
30%+
Increase in total1
R&D expenditure
Increased investment
in innovation to drive and
accelerate future growth
Future growth
1. Calculated as the sum of R&D expense per the pro forma income statement and capitalised development costs per the cash flow statement 10
For
per
sona
l use
onl
y

Learning
managementPlant management
Prestart and toolbox
talks
Equipment
management
Equipment calibration
Course editor
Deep integration with
Workforce
Expanded course
library
Skills matrix & training
needs analysis
Digital forms and
flows
Template form and
flow building
Workforce Access Control Assets Learning Health and Safety
Internally developed
Acquired & Integrated
Added in FY20:
Company
mobilisation
Employee
mobilisation
Verification
Time and attendance
Mobile login & logout
Tracing of workers
Deep integration with
digital forms
RFID solution
RFID solution
Fixed and mobile
access terminals
Drug & alcohol
testing
Facial recognitionAsset management
and maintenance
Deep integration with
digital forms
Visitor management
Evacuation
management
Temperature
detection
Expanded our platform in FY20 with new products and modules
14 products and modules
added in FY20
Grown from 14 product
modules to 28 since 2018
Proven capability to integrate
products/modules fast
Proven ability to cross-sell
products to existing clients
Insight from customers has
driven development of additional
modules and features
We have added 14 fully integrated products and modules to our world-leading platform, to assist organisations in
tracking, managing and protecting their workplaces
11
For
per
sona
l use
onl
y

Replaces manual and point solutions, and provides single source of truth information into upstream ERP systems
Our integrated platform replaces a range of standalone solutions
HSE
Spreadsheets and
HR filing systems
Standalone contractor
management platforms
Data entry into payroll,
scheduling and ERP systemsStandalone visitor
management systems
Standalone and greenfield
thermal reader solutions
Standalone access control
hardware systems
Greenfield asset
mobilisation implementation
Standalone asset
inspection products
Data entry into asset management
module of ERP systems
Standalone safety and
compliance LMS platformsVideo editing tools
Standalone health and safety
management platforms
Standalone digital form
and workflow products
12
For
per
sona
l use
onl
y

100%153%
311%
FY18 FY19 FY20 FY21
Revenue growth (indexed from FY18)
Pro forma1 FY18-FY20
1. Based on product invoice data
2. Digital forms is in pilot; lone worker is subject to the completion of the Vault transaction and successful pilot
3. FY21 is not a revenue forecast – provided for illustrative purposes only
Major construction client has expanded its site footprint and added products over time
Case study: revenue growth from cross-selling products
3
Product expansion
New developed and
acquired products taken up:
Velpic LMS, HSE toolbox
talks, fever detection and
mobile login
Base year
Base products: WFM
integrated with access
control; plant mobilisation
Site growth
Base products deployed
across increased number of
sites
Potential additions2
HSE digital forms, WFM
lone worker
13
For
per
sona
l use
onl
y

Introduction
• Facial scanning and temperature detection are key to safe re-opening of
schools in a COVID-19 world where restrictions are easing
• This Damstra solution supports organisations across all industries,
workplaces, hospitals, schools and universities
The solution
• An infrared sensor equipped with facial scanning technology scans a
persons face to verify their identity
• Once verified, the infrared sensor senses their temperature to permit
safe entry or deny access if temperature is elevated beyond safe limits
Flexible options
• Facial scanning and temperature detection integrated with Damstra
access control and workforce management is available as a complete
solution
• Temperature detection solution is also available standalone, i.e. without
facial recognition
• Can be sold as an add-on for customers with existing terminals
Damstra has partnered with a leading private school network in Colorado, USA to deliver this solution
Case study: fever detection integrated with facial recognition
14
For
per
sona
l use
onl
y

The challenge – Reduce paper-based administrative burden of
competency management
• To ensure safety and compliance, workers need to be assessed as
competent before accessing the site and operating certain equipment
• Each site completes about 50,000 competency assessments per month
– a total of over 1.3 million forms per month
The solution - Damstra’s fully integrated paperless form solution,
Samm (Site Assistant Manager on Mobile)
• Competency is automatically recorded against each worker’s safety
training record, ensuring 100% compliance
• Ensures only compliant workers can access and operate plant on site
The benefits – Increased safety and compliance, at a fraction of the
cost
• Company saves millions per year, by saving up to 5 minutes of manual
data entry per form
• Across 20+ sites, this also equates to a time saving of 200,000 hours
per year
Major Australian mining company increases compliance and safety with integrated paperless forms
Case study: smart paperless forms
15
For
per
sona
l use
onl
y
The challenge – Remove manual truck movement records
• Client manages over 400 daily truck movements via manual paperwork
handling
• Their need was to automate plant and driver entry and exit and
understand who’s onsite at any given time
The solution – Damstra’s RFID tracking solution
• Solution was rapidly implemented. Plant and drivers equipped with
active RFID tags combined with gate receivers
• Tags are checked against the driver and plant’s system access
privileges, automatically opening the boom gates at entry and exit points
The result – Increased compliance and accuracy
• Implementation of Damstra RFID tracking solution has enabled the client
to go from 100% manual transactions to less than 1%
• Significant improvements in truck processing times – saving an average
of 5 minutes to process the driver and plant each time equates to a 20
hours saved for 400 daily truck movements
• In addition to average monthly saving of ~$30,000, client benefits from
increased accuracy, compliance and productivity
Helped our client achieve significant compliance and productivity benefits by automating plant tracking
Personnel tag Plant tag
Case study: RFID plant tracking solution
16
For
per
sona
l use
onl
y

Expanding channel partners to drive future sales growth
TechnologyOne
• TechOne’s ERP platform has been integrated with
Damstra’s learning management platform
• A range of e-learning content packages and bundles
has been created by Damstra e-learning focusing on
health & safety, corporate policies and cyber security
• 9 clients already signed. 75 are targeted by the end
of FY21. Each client is expected to generate ~$10k
per annum. Each contractual arrangement is for
between 3 to 5 years
Energy Skills Queensland
• SkillPASS, an internationally recognised solutions for
individuals and organisations needing to ensure
safety and compliance standards
• It has been expanded to include all products and
modules of the Damstra workplace management
platform
Alcolizer
• Deep integration between Damstra’s workplace
management platform and Alcolizer’s alcohol and
drug testing products
• Deep integration delivers significant synergistic
benefits for clients
Zivaro
• Strategic alliance formed with Zivaro, Inc Brilliant IT
to enhance safety systems, products, platforms and
cloud capabilities
• Damstra’s workplace safety platform combines with
Zivaro’s cloud expertise to help customers
accelerate their digital transformation
• Alliance targeted toward government and enterprise
customers in highly regulated industries
• Alliance also positions Zivaro as a Damstra strategic
North American partner
GAI
• Reseller arrangement struck with Government
Acquisition, Inc
• Experienced, award-winning reseller
• GAI focus on Federal and SLED (state, local
government and education) sectors
• GAI offer one of the most diversified contract
portfolios in our industry
• Arrangement will expand Damstra’s sales reach in a
vertical which we normally have difficulty accessing
17
For
per
sona
l use
onl
y

Acquisitions completed during FY20
Since IPO, Damstra announced and completed three acquisitions:
• Dec 2019 acquired Scenario Advantage
o Small competitor, opportunistic
• Feb 2020 acquired APE Mobile
o Product focussed acquisition – paperless forms
• Jun 2020 acquired Smart Asset
o Product focussed acquisition – asset management
• Acquisition multiples ranged between 1x to 4.5x last twelve
months revenue
Selective M&A is a core strategy to generate value
2
We have a demonstrated track record of successful integration of acquisitions and delivering value for
shareholders. Our M&A strategy continues to evolve, and is much more than a simple “roll up” approach
What do we look for in an acquisition target?
We have three core principles to identify a suitable target
1) Product – enhance or accelerate
2) People – if you don’t retain the key staff you have no value
3) Commercialised – products must have been commercialised to
some degree, we do not chase “moon shot” product successes
Our secondary filters
• Provide entry into new markets, be it geography or new
verticals
• Establish new client and cross-selling opportunities → increased
network effect
• Accelerate convergence of technologies, that can scale
internationally
• Acquire organisational capability
• Damstra internal “bandwidth” to execute and integrate
1
We have created a specific approach, including a dedicated team, process on target selection, due diligence,
negotiation, and then implementation
18
For
per
sona
l use
onl
y

We have developed a four-step process for identifying, analysing and implementing M&A opportunities within Damstra
Target Identification Due Diligence Technology Delivering value
New customer wins
• We are scanning >200 companies
globally, this also assist in terms
of benchmarking our products
• Can acquire private or listed
businesses
• What client verticals are they in
• What is operating cash burn and
after acquisition can it marginally
costed
• What is vender motivation
Technical perspective
• Technical due diligence,
including code review and
independent penetration
testing
• How will the tech stack be
integrated
• Can we stand up the product
on Damstra infrastructure
• Ability to integrate seamlessly
into Damstra ERP system
Our M&A process explained
Key Risk items
• Intellectual property protection
• Client contracts, pricing logic
• Staff contracts
• Security and privacy review
• Understanding reoccurring
revenue vs one off
• Tax implications
• Enhance Damstra module
strategy
• The target can be leverage so
operational synergies can be
extracted
Generating “value”
• Cross sell targets identified,
and approach agree
• Target 100% client retention
• Define Branding strategy, so
customer is clear
Marginally costed
methodology
• Removing
duplicated/redundant systems
• Can’t be run as standalone
organisation
• Staff retention and integration
critical
19
For
per
sona
l use
onl
y

Achieved Outcomes
• All IP acquired and integrated into Damstra, with single sign on
implemented
• Now a core module offering that can be sold on a standalone
basis or as an integrated solution
• Staff reduced from 24 to 4, using our infrastructure and support
service functions
• Damstra LMS system was retired and associated R&D
redeployed
• Velpic brand retained
• Business was operating cash breakeven within 3 months
• Revenue has increased ~200% since the acquisition (at the end
of FY20)
~20% continual standalone clients win
~80% new revenue from cross sell to existing Damstra client
This simple case study demonstrates the approach Damstra takes
in regard to acquisition. In this case where the acquisition was
product driven our approach was to undertake operational
integration for the business, and then to cross-sell the product to
our existing client base.
Acquisition Case Study – Velpic, defines our approach
While every acquisition is different this case study demonstrates how Damstra extracts and delivers values
from M&A, it is not “land grab” approach
Our approach on accelerating overall Damstra growth once target
is acquired - Velpic Case Study
• Velpic was acquired in 2018 predominately for its superior learning
management system (LMS) product
• Velpic was listed on the ASX
At the time of acquisition, the Velpic business profile was as follows:
• Product launched with some commercial success, albeit sub scale
• Revenue was ~$750k per annum
• R&D spent developing the product was ~$10 m, product was first
launched in 2014
• Organisational size pre-acquisition was ~25 full time employees,
being listed on the ASX
• EBITDA and operating cash flow negative
20
For
per
sona
l use
onl
y

ScenarioCompleted December 2019
APE Mobile/SammCompleted February 2020
Smart AssetCompleted June 2020
Business
Clients lost 0 0 0
Staff retained Y Y Y
Accounting systems integrated Y Y Y
Staff organisationally integrated Y Y Y
R&D staff put into "pizza" teams Y Y Y
Branding Phase out FY21 Rebranded Retained
System/supplier rationalisation
completed16 27 7
Systems
One Infrastructure platform Y Y Y
Removal of redundant systems Y Y In progress
API integrations completed Y Y In progress
System integrated with Damstra Y Y Y
Single Sign On implemented Y Y In progress
Removal of legacy code base Phase out FY21 na na
Product
Can be sold as a standalone
productN Y Y
Integrated with Samm Y na Y
Integrated with Velpic Y Y Y
Integrated with Smart Asset In progress Y na
This table shows the key activities for the three acquisitions we have done during FY20 and status on each of those. We
have a dedicated team that drives these outcomes via a defined process
Acquisitions are being integrated successfully
21
For
per
sona
l use
onl
y

Business update2
1 Results overview
3 FY20 financial informationAgenda
4 Vault acquisition
5 Summary and FY21 outlook
22
For
per
sona
l use
onl
y
FY20 financial results
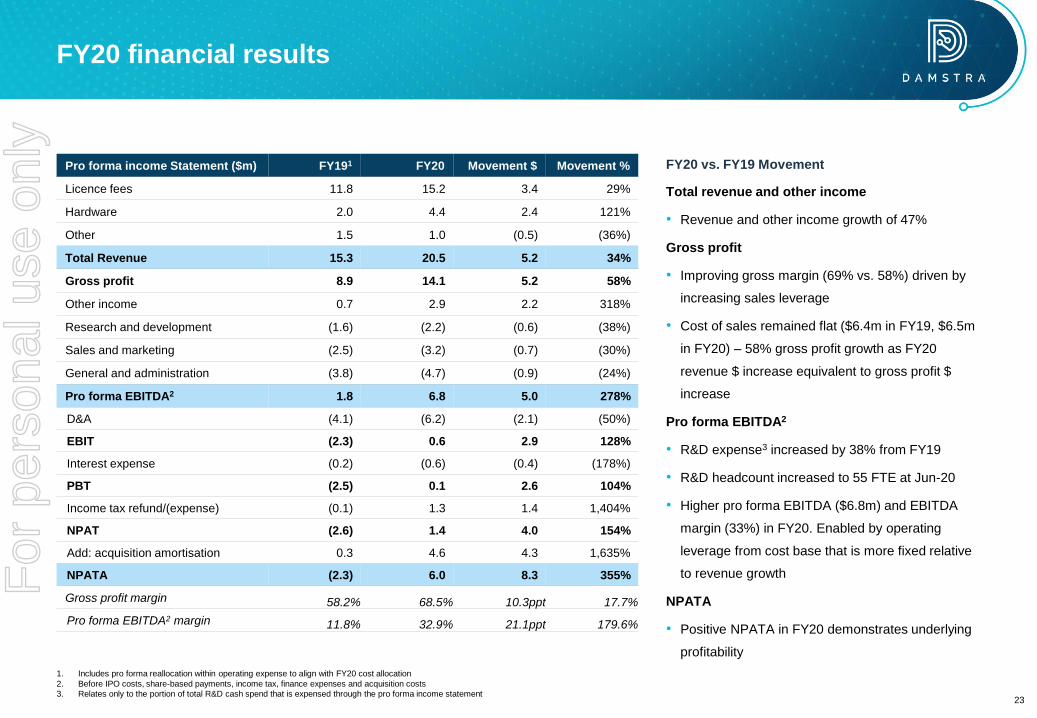
Pro forma income Statement ($m) FY191 FY20 Movement $ Movement %
Licence fees 11.8 15.2 3.4 29%
Hardware 2.0 4.4 2.4 121%
Other 1.5 1.0 (0.5) (36%)
Total Revenue 15.3 20.5 5.2 34%
Gross profit 8.9 14.1 5.2 58%
Other income 0.7 2.9 2.2 318%
Research and development (1.6) (2.2) (0.6) (38%)
Sales and marketing (2.5) (3.2) (0.7) (30%)
General and administration (3.8) (4.7) (0.9) (24%)
Pro forma EBITDA2 1.8 6.8 5.0 278%
D&A (4.1) (6.2) (2.1) (50%)
EBIT (2.3) 0.6 2.9 128%
Interest expense (0.2) (0.6) (0.4) (178%)
PBT (2.5) 0.1 2.6 104%
Income tax refund/(expense) (0.1) 1.3 1.4 1,404%
NPAT (2.6) 1.4 4.0 154%
Add: acquisition amortisation 0.3 4.6 4.3 1,635%
NPATA (2.3) 6.0 8.3 355%
Gross profit margin 58.2% 68.5% 10.3ppt 17.7%
Pro forma EBITDA2 margin 11.8% 32.9% 21.1ppt 179.6%
FY20 vs. FY19 Movement
Total revenue and other income
• Revenue and other income growth of 47%
Gross profit
• Improving gross margin (69% vs. 58%) driven by
increasing sales leverage
• Cost of sales remained flat ($6.4m in FY19, $6.5m
in FY20) – 58% gross profit growth as FY20
revenue $ increase equivalent to gross profit $
increase
Pro forma EBITDA2
• R&D expense3 increased by 38% from FY19
• R&D headcount increased to 55 FTE at Jun-20
• Higher pro forma EBITDA ($6.8m) and EBITDA
margin (33%) in FY20. Enabled by operating
leverage from cost base that is more fixed relative
to revenue growth
NPATA
• Positive NPATA in FY20 demonstrates underlying
profitability
1. Includes pro forma reallocation within operating expense to align with FY20 cost allocation
2. Before IPO costs, share-based payments, income tax, finance expenses and acquisition costs
3. Relates only to the portion of total R&D cash spend that is expensed through the pro forma income statement23
For
per
sona
l use
onl
y

7.4
8.9
14.1
FY18 FY19 FY20
Improving gross margin
Gross Margin ($m)
Pro Forma FY18 – FY20
Our FY20 gross margin improved significantly over FY19 as a result of previous investments in growth and impact of
hardware deployments over the past 24 months
• Significant increase in gross margin in FY20 relative to recent years
($14.1m in FY20).
• Gross margin at 68.5% vs corresponding period FY19 of 58.2%.
Increase of 10.3ppt or 1,030bps
• Strong margin on revenue driven by SaaS licence fees and recurring
client leasing fees on capitalised hardware.
• Benefits of sales leverage coming through – margin returning to FY18
levels.
• Investments ahead of growth (in personnel, software licensing and
hosting costs) made to prepare for scale now showing benefits
• Revenue growth outpacing growth in a relatively fixed cost base.
messages (more detail)
% Margin 70.7% 58.2% 68.5%
24
For
per
sona
l use
onl
y

Operating expenses being managed to enable revenue growth
0.4
1.6
2.2
FY18 FY19 FY20
R&D1 ($m)
Pro Forma FY18 – FY20
S&M ($m)
Pro Forma FY18 – FY20
G&A ($m)
Pro Forma FY18 – FY20
2.72.5
3.2
FY18 FY19 FY20
2.1
3.8
4.7
FY18 FY19 FY20
% of Revenue 3.7% 10.5% 10.8% 25.8% 16.3% 15.8% 19.8% 24.8% 23.0%
• Research and development expense increased 38% from FY19. Reflects investment in innovation to maintain competitive advantage and
capture new product opportunities
• Sales and marketing expense increased 30% from FY19. Reflects investment in sales capability to drive sales opportunities and revenue
growth
• General and administrative expense continued to increased year on year, increasing 24% in FY20 relative to FY19. FY19-FY20 increases in
spend reflects investments in positioning the company for scale and addition of public company listing costs
messages (more detail)1. Relates only to the portion of total R&D cash spend that is expensed through the pro forma income statement
2. Includes pro forma reallocation within operating expense to align with FY20 cost allocation
2 2 2
25
For
per
sona
l use
onl
y

Increasing operating leverage
Revenue vs. Costs and Expenses ($m)
Pro Forma FY17 – FY20
Significant growth in revenue has been achieved on a reasonably fixed cost base, resulting in significant operating
leverage at the EBITDA level
Revenue
• Revenue has increased by $12.3m between FY17 and FY20. From
$8.2m in FY17 to $20.5m in FY20.
• Revenue increase represents a 3-year average annual growth rate of
36%
Cost of sales
• Marginal increase in cost of sales in FY20 ($0.1m increase over FY19):
reflects the scalability and efficiency gains from utilising global support
teams and cloud-based platform architecture.
Operating expenses
• Improvement in operating expenses - sales & marketing and general &
administration expenses both fell as a % of Revenue (from 16.3% in
FY19 to 15.8% in FY20 and 24.8% to 23.0, respectively).
• Improvement in operating cost margins reflects the ability of the
established cost base to generate incremental revenue.
• 38% increase in research & development P&L expense2 (from 1.6m in
FY19 to $2.2m in FY20) reflects increased investment in product
innovation.
messages (more detail)
8.2
10.5
15.3
20.5
1.8
3.1
6.4 6.5
0.4 0.4 1.6
2.2
1.2
2.7 2.5 3.2
1.8 2.1
3.8 4.7
FY17 FY18 FY19 FY20
Revenue Cost of sales R&D S&M G&A
1. Includes pro forma reallocation within operating expense to align with FY20 cost allocation
2. Relates only to the portion of total R&D cash spend that is expensed through the pro forma income statement
1
26
For
per
sona
l use
onl
y

Increasing investment in research and development
Significant investment continues to be made to drive future growth
Total1 R&D spend
Pro Forma FY18 – FY20
Increasing investment in innovation
• Increasing investment being made in R&D – to maintain innovation
leadership
• Period of investment has resulted in Jun-20 R&D headcount increasing
to 55. An increase of 83% from Jun-19
• 30% increase in total1 R&D spend ($4.7m in FY20 versus $3.6m in
FY19)
• The enlarged team has enabled rapid development of COVID-19-
influenced products (including fever detection and mobile time and
attendance) in response to client need
• 4,420 new product feature releases in FY20. Continuing focus on
maintaining competitive advantage
• R&D capability has been further strengthened by acquisitions made
during the year
• Acquired talent has enabled strong progress in integrating the new
paperless and asset management products into the singe platform.
1. Calculated as the sum of R&D expense per the pro forma income statement and capitalised development costs per the cash flow statement
2. Includes pro forma reallocation within operating expense to align with FY20 cost allocation
0.4
1.6
2.2
0.8
2.0
2.5
1.2
3.6
4.7
FY18 FY19 FY20
Expensed Capitalised
% of Revenue 11.0% 23.5% 22.9%
27
2
For
per
sona
l use
onl
y

1.5
0.3
5.2
FY18 FY19 FY20
Positive cash flow
Operating cash flow and IPO proceeds supporting growth investments
Pro forma operating cash flow, FY18 to FY20 ($m)
• Record operating cash flow generated in FY20
• Strong FY20 operating cash flow driven by significant new client wins,
partner channel development and new product contributions.
• Positive operating leverage being experienced in FY20 - benefiting from
the growth investments in people and infrastructure that were made
during FY18 and FY19.
FY20 statutory cash flow bridge ($m)
• Total customer receipts of $20.8m in the financial year
• $5.2m pro forma1 operating cash flow generated
• Pro forma operating cash flow represents 77% conversion of FY20 pro
forma EBITDA
• Cash balance increase from $0.3m to $9.4m, driven by customer
receipts and IPO proceeds. Funds being used to drive organic and
inorganic growth and reduce debt burden.
• Liquidity position further strengthened by $4.8m in trade and other
receivables at 30 June 2020, with minimal credit losses expected (<3%
of trade and other receivables balance provided for)
0.3
9.4
20.8
20.8 0.4
(16.1)
(9.7)
(7.3)
CashBalance30/6/19
Customerreceipts
Net financing Otheroperating
Supplierpayments
Acquisitionpayments
Tangible &intangible
assets
CashBalance30/6/20
28
1. Excludes transaction costs related to business combinations
1
For
per
sona
l use
onl
y
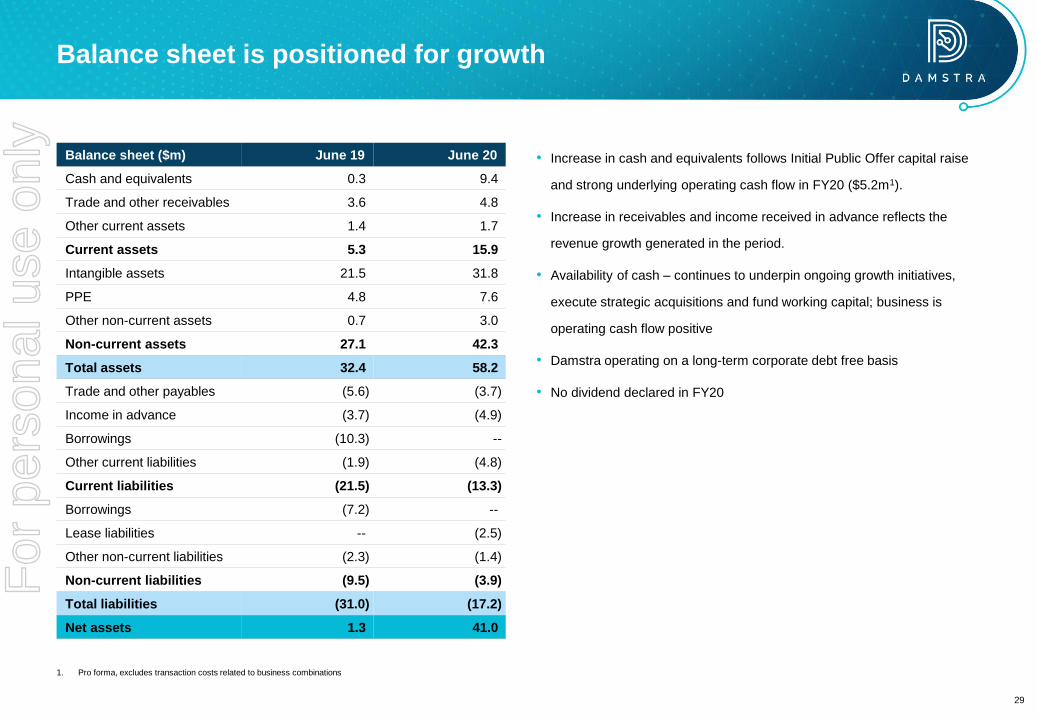
Balance sheet is positioned for growth
• Increase in cash and equivalents follows Initial Public Offer capital raise
and strong underlying operating cash flow in FY20 ($5.2m1).
• Increase in receivables and income received in advance reflects the
revenue growth generated in the period.
• Availability of cash – continues to underpin ongoing growth initiatives,
execute strategic acquisitions and fund working capital; business is
operating cash flow positive
• Damstra operating on a long-term corporate debt free basis
• No dividend declared in FY20
Balance sheet ($m) June 19 June 20
Cash and equivalents 0.3 9.4
Trade and other receivables 3.6 4.8
Other current assets 1.4 1.7
Current assets 5.3 15.9
Intangible assets 21.5 31.8
PPE 4.8 7.6
Other non-current assets 0.7 3.0
Non-current assets 27.1 42.3
Total assets 32.4 58.2
Trade and other payables (5.6) (3.7)
Income in advance (3.7) (4.9)
Borrowings (10.3) --
Other current liabilities (1.9) (4.8)
Current liabilities (21.5) (13.3)
Borrowings (7.2) --
Lease liabilities -- (2.5)
Other non-current liabilities (2.3) (1.4)
Non-current liabilities (9.5) (3.9)
Total liabilities (31.0) (17.2)
Net assets 1.3 41.0
29
1. Pro forma, excludes transaction costs related to business combinations
For
per
sona
l use
onl
y
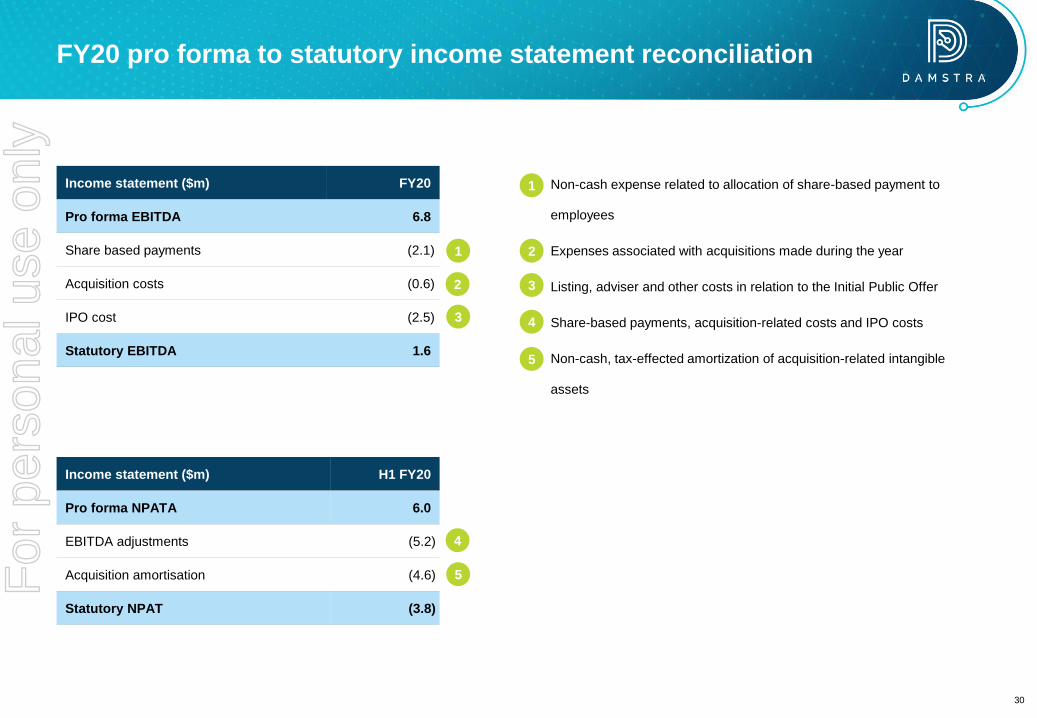
FY20 pro forma to statutory income statement reconciliation
Income statement ($m) FY20
Pro forma EBITDA 6.8
Share based payments (2.1)
Acquisition costs (0.6)
IPO cost (2.5)
Statutory EBITDA 1.6
Income statement ($m) H1 FY20
Pro forma NPATA 6.0
EBITDA adjustments (5.2)
Acquisition amortisation (4.6)
Statutory NPAT (3.8)
• Non-cash expense related to allocation of share-based payment to
employees
• Expenses associated with acquisitions made during the year
• Listing, adviser and other costs in relation to the Initial Public Offer
• Share-based payments, acquisition-related costs and IPO costs
• Non-cash, tax-effected amortization of acquisition-related intangible
assets
1
3
4
5
1
2
3
4
2
5
30
For
per
sona
l use
onl
y

Business update2
1 Results overview
3 FY20 financial informationAgenda
4 Vault acquisition
5 Summary and FY21 outlook
31
For
per
sona
l use
onl
y
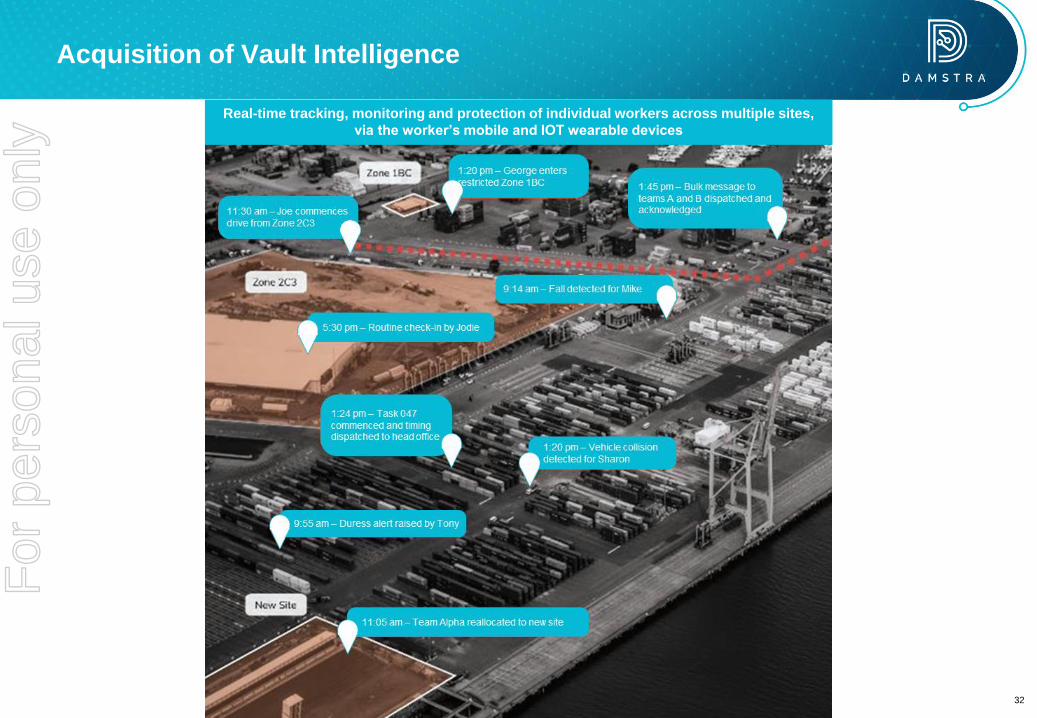
Acquisition of Vault Intelligence
Real-time tracking, monitoring and protection of individual workers across multiple sites,
via the worker’s mobile and IOT wearable devices
32
For
per
sona
l use
onl
y
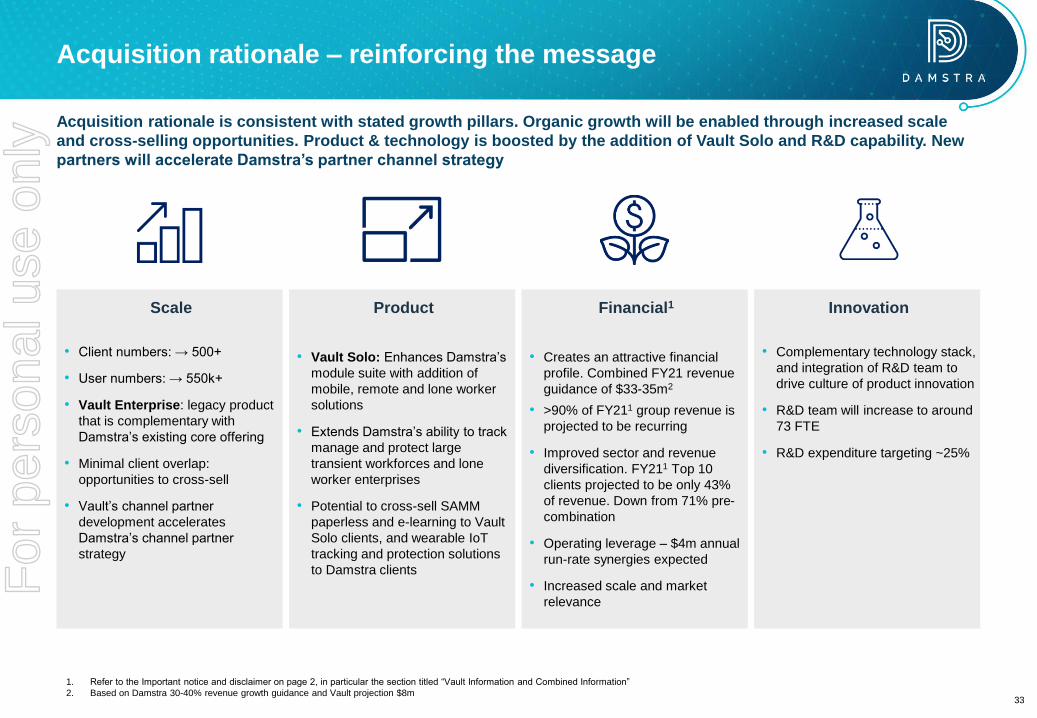
Acquisition rationale – reinforcing the message
Scale
• Client numbers: → 500+
• User numbers: → 550k+
• Vault Enterprise: legacy product
that is complementary with
Damstra’s existing core offering
• Minimal client overlap:
opportunities to cross-sell
• Vault’s channel partner
development accelerates
Damstra’s channel partner
strategy
Product
• Vault Solo: Enhances Damstra’s
module suite with addition of
mobile, remote and lone worker
solutions
• Extends Damstra’s ability to track
manage and protect large
transient workforces and lone
worker enterprises
• Potential to cross-sell SAMM
paperless and e-learning to Vault
Solo clients, and wearable IoT
tracking and protection solutions
to Damstra clients
Financial1
• Creates an attractive financial
profile. Combined FY21 revenue
guidance of $33-35m2
• >90% of FY211 group revenue is
projected to be recurring
• Improved sector and revenue
diversification. FY211 Top 10
clients projected to be only 43%
of revenue. Down from 71% pre-
combination
• Operating leverage – $4m annual
run-rate synergies expected
• Increased scale and market
relevance
Innovation
• Complementary technology stack,
and integration of R&D team to
drive culture of product innovation
• R&D team will increase to around
73 FTE
• R&D expenditure targeting ~25%
1. Refer to the Important notice and disclaimer on page 2, in particular the section titled “Vault Information and Combined Information”
2. Based on Damstra 30-40% revenue growth guidance and Vault projection $8m
Acquisition rationale is consistent with stated growth pillars. Organic growth will be enabled through increased scale
and cross-selling opportunities. Product & technology is boosted by the addition of Vault Solo and R&D capability. New
partners will accelerate Damstra’s partner channel strategy
33
For
per
sona
l use
onl
y
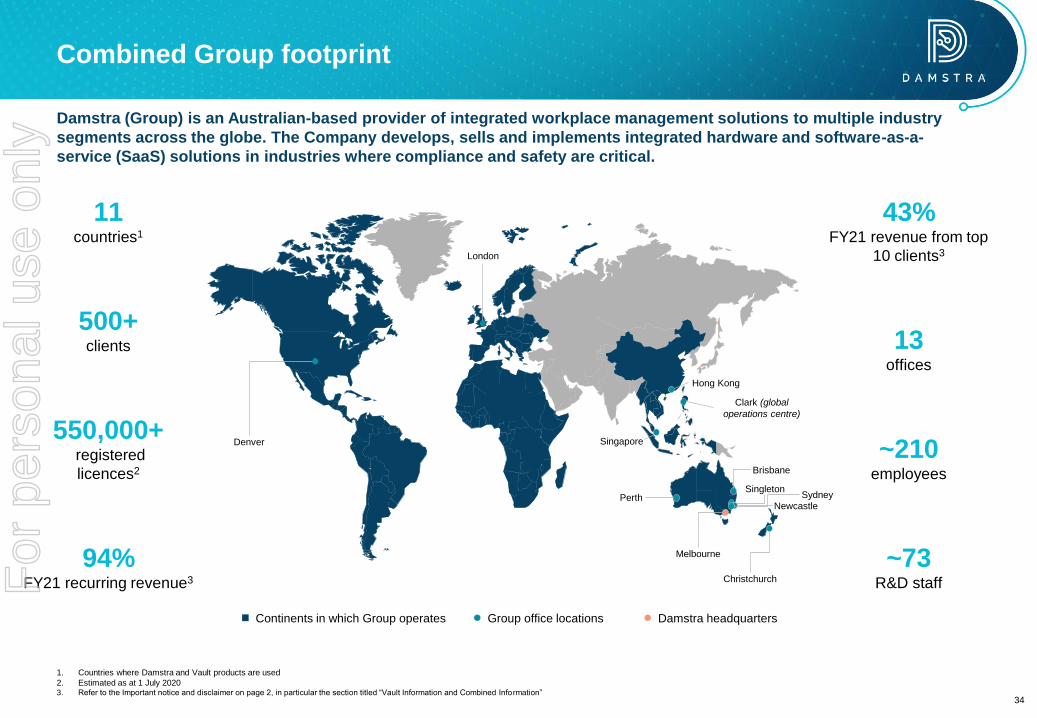
Combined Group footprint
Damstra (Group) is an Australian-based provider of integrated workplace management solutions to multiple industry
segments across the globe. The Company develops, sells and implements integrated hardware and software-as-a-
service (SaaS) solutions in industries where compliance and safety are critical.
Group office locations Damstra headquartersContinents in which Group operates
500+clients
11countries1
550,000+registered
licences2
13offices
~210employees
Denver
London
Singleton
Christchurch
Melbourne
Perth
Clark (global
operations centre)
Newcastle
Brisbane
1. Countries where Damstra and Vault products are used
2. Estimated as at 1 July 20203. Refer to the Important notice and disclaimer on page 2, in particular the section titled “Vault Information and Combined Information”
~73R&D staff
94%FY21 recurring revenue3
43%FY21 revenue from top
10 clients3
Hong Kong
Singapore
Sydney
34
For
per
sona
l use
onl
y
Business update2
1 Results overview
3 FY20 financial informationAgenda
4 Vault acquisition
5 Summary and FY21 outlook
35
For
per
sona
l use
onl
y

FY20 Summary: Delivering on the strategy
Record result
• 47% growth in revenue and other
income
• Pro forma EBITDA $6.8m
• Underlying EBITDA $4.8m
• Pro forma operating cash flow $5.2m
Growing clients and users
• 279 clients (from 129 at Jun-19)
• 404k users (from 320k at Jun-19)
New product innovation
• 14 new modules delivered
• 4,420 new features implemented
• Key products: fever detection, digital
forms, RFID tracking
Increased investment in R&D
• 30% increase in total cash spend
• 83% increase in headcount
Strategic acquisitions
• Scenario Advantage - scale
• APE Mobile – product
• Smart Asset Software – product
Positioned for US growth
• Zivaro and GAI strategic
partnerships signed
• Two Senior VP hires and scaling
resources
36
For
per
sona
l use
onl
y

Organic growth
International growth, accelerate
commericalisation of new
modules, and accelerate cross
sell
Product & technology
Increased R&D expenditure,
Accelerate the deliver of the
product pipeline, “obsession on
integration”
Partners
Channel partners are a key
plank for growth, focus on
North America
Strategic acquisitions &
North America
Integrate acquisitions
International
• North America is the priority
• Commercial success in the UK
• SE Asia now seen as new market
ANZ
• Capture opportunities on back of
project infrastructure investment by
state and federal governments
Cross-selling focus in 4 areas
• Fever detection / facial recognitions
• Solo mobility
• HSE Paperless
• Learning
Channel Partners
• North America. Strategic
relationships formed with Zivaro
(government and enterprise
clients) and GAI (Federal, state
and local government and
education)
• Expand Channel partner
footprint in North America and
ANZ
• Potential for Global
relationships
Vault
• Complete transaction in October,
implementation well underway
• Deliver the synergies
Acquisitions
• Complete integration of past
acquisitions
North America
• Increase team and resources in
North America
• Significant pipeline of qualified
lead
• Damstra positioned as
“business continuity via
employee digitization” focusing
on heavily regulated and
compliance driven sectors
FY21 Management Priorities
R&D
• Target R&D expenditure of
~25% of revenue. 70+ FTE
Product Pipeline
• Deliver to market the product
pipeline and drive deeper client
solutions
• New UX/UI for core platform
• Launch Damstra “swift”
• New evolution of integrated
hardware solutions
• Focus on mobility products
integrated into the base platform
• Complete full integration of
acquisitions and clients to have
a seamless view of all products
37
For
per
sona
l use
onl
y

Key Drivers
• Increase in users' numbers
• Continued client wins in North America
• Contribution from Channel Partners in
ANZ and North America
• Full Year impact of FY20 acquisitions
FY21 Revenue
$33 - $35m
• Based on Damstra 30-40% revenue
growth guidance and Vault FY20
projection $8m
• July-20 vs pcp:
o Revenue +35%
o Cash receipts +27%
• Recurring revenue of >90%
• Revenue Churn <1%
• Contract with large clients 3-5 years
• No exposure to hard hit industries e.g.
Hospitality, Tourism
Underlying Business
FY21 Guidance1
• Fever detection more than 20 clients,
continue momentum
• Broad adoption of paperless solutions
• Learning solution to continue growth
Product & Cross Drivers
• Completing Vault in October
• Federal & State Governments commit to
infrastructure investment
• UK & South East Asia revenue
assumptions are conservative
Key assumptions
1. Refer to the Important notice and disclaimer on page 2 for information relevant to your assessment of this slide38
For
per
sona
l use
onl
y

Q&A
39
For
per
sona
l use
onl
y

For
per
sona
l use
onl
y