For personal use only - Australian Securities Exchange · One-Stop Shop GraysMINING provides ......
70
Annual Report 2015 For personal use only
Transcript of For personal use only - Australian Securities Exchange · One-Stop Shop GraysMINING provides ......
Annual Report 2015
For
per
sona
l use
onl
y

Grays eCommerce Group (ASX:GEG) is Australia's largest listed eCommerce group. Grays eCommerce Group is well positioned to be the leading online international auctioneer and Australasian retail destination.
ABN 94 125 736 914
1 About Grays eCommerce Group2 Business Overview3 Chairman & CEO's Report5 Board of Directors7 Directors' Report23 Auditor's Independence Declaration24 Statement of Profit or Loss and Other Comprehensive Income25 Statement of Financial Position26 Statement of Changes in Equity27 Statement of Cash Flows28 Notes to the Financial Statements62 Directors' Declaration63 Independent Auditor’s Report65 Shareholder Information67 Corporate Directory
Contents
Grays eCommerce Group Limited
Grays eCommerce Group LimitedGrays eCommerce Group LimitedF
or p
erso
nal u
se o
nly

About Grays eCommerce Group
1Annual Report 2015
Australia's Leading Online Auctioneer
GraysOnline offers over 80 categories in consumer, industrial & commercial goods direct from the manufacturer and distributors. A collection of brand new, refurbished, end-of-line and excess stock are available. Most auctions start from $9 where customers can enjoy big savings of up to 80% off RRP.
Online Home & Lifestyle Department Store
OO delivers a joyful shopping experience. It is a destination that offers styling inspiration and tips, extensive range & quality products for the home at exceptional prices.
Asset Management Solution
Asset Management Solution provides equipment valuation & commercial advice to financiers, insolvency companies as well as government departments and multinational companies.
Online Superstore & Winners of the Canstar Customer Service Award 3 Years Running
DealsDirect is an online superstore that offers a large range of over 10,000 products in 20 categories including electronics, appliances, furniture, homewares, rugs, pet accessories, garden supplies plus more.
Mining Assets One-Stop Shop
GraysMINING provides extensive experience in all mining sectors. It offers a wide range of disposal options plus a strategic partnership with Iron Planet which enables Australia & NZ sellers to reach a larger buyer base internationally.
Leading Daily Deal Site
TopBuy.com.au is a leading 'deal of the day' online retail store, specialising in electronics, fashion, novelty and gadgets, offering savvy shoppers big brands at low prices.F
or p
erso
nal u
se o
nly

Business Overview
Grays eCommerce Group: Australia’s largest listed eCommerce Group.
~7 million customer profiles
~3.6 million email subscribers
Market leading auction business
Market leading wine business
~880,000 active customers
Strong cross-selling upside
Excellent supplier & merchant network
Highly efficient distribution centre & logistics network
Overall scale delivering favourable freight rates
Selling ~230,000 items per month
High level of brand awareness
Proven monthly customer growth
Grays eCommerce Group Limited2F
or p
erso
nal u
se o
nly
On behalf of the Board we are pleased to report a period of significant progress for Grays eCommerce Group (“GEG”). It has been a period of consolidation, rationalisation and growth and we are well positioned to unlock the value of the underlying businesses of the Group going forward.
Dear Shareholders,Following approval by the shareholders of both Mnemon Limited (“MNZ”) and Grays (Aust) Holdings Pty Limited (“Grays”) the merger of these two businesses occurred on 7 November 2014. Under this merger, MNZ issued 638 new MNZ shares for each Grays share held and the listed company name was changed to Grays eCommerce Group Limited. For reporting purposes, this merger was treated as a “reverse acquisition” whereby Grays is deemed to be the accounting acquirer of the Consolidated Group.
Following completion of the merger the Board implemented a strategy underpinned by a Vision and Values framework. The major themes of this strategy were to:
— Optimise the business through operational efficiencies and the integration of the businesses of MNZ and Grays;
— Expand the business utilising our core strengths especially in our Industrial B2B business;
— Grow the business into natural adjacent market segments; and
— Turnaround the poorer performing categories and invest in growing categories such as wine.
This strategy has been successful since merger with the full financial effect expected to occur in the upcoming year and beyond. Major strategic initiatives implemented to date include:
— The successful integration of the operating platforms, supply chain, merchandising, warehouse and office facilities of the businesses of MNZ and Grays;
— The offshoring of Consumer B2C customer service to a specialist call centre operator;
— The rollout of a wine specific website, grayswine.com.au to showcase and grow our wine auction and fixed price retail category;
— Focus on, and investment in, key growth sectors of mining, construction and transportation in a co-ordinated Australia wide programme to grow the Industrial B2B business segment;
— Significant headway in leveraging our expertise and experience in the Industrial B2B market segment into the South East Asian region;
— The acquisition of DMS Davlan, a specialist Australian auction agribusiness and Bryan Andrews Auctioneers in New Zealand; and
— The establishment of a “People and Culture” function and a "Vision and Values" framework that has been instrumental in communicating, informing, and implementing a clear unified vision, strategy and set of values across the business.
Financial performanceOverall the business has met the expectations of Directors in its initial 8 months as a merged entity. The Industrial B2B segment has exceeded expectations, partially offset by a weaker than expected result in the fixed Price Retail component of the Consumer B2C business. Consumer auction remains challenging, being heavily supported by the wine category.
A review of the Group’s performance is included in the Operating and Financial Review in the Directors' Report set out on pages 7 to 22. A summary follows:
— Sales# up 36% to $509m — Revenue up 31% to $193m — Operating EBITDA* up 87%
to $6.9m
During the year, GEG incurred transaction and merger integration costs of $6.5m, of which $3.0m of transaction costs were reported and incurred in the first half. The second half costs of $3.5m related to the integration of the MNZ business into Grays, and the costs associated with the outsourcing of customer service. This level of cost compares with the $1.8m incurred in the previous corresponding period that largely related to the integration of the smaller OO.com.au.
Chairman & CEO's ReportJONATHAN PINSHAW AND MARK BAYLISS
# Sales is a non statutory measure that is reported to provide greater understanding of the performance of the underlying business. The measure represents the gross sale value of consignment assets auctioned, plus sales of owned inventory.
* Operating EBITDA is a non statutory measure being reported earnings before interest, tax, depreciation and amortisation and before acquisition and merger related costs.
3Annual Report 2015F
or p
erso
nal u
se o
nly

OutlookWe are confident that the strategic initiatives and actions implemented in the first 8 months will lead to improved profitability in FY16. The Industrial B2B business segment holds a market leading position in its market segments and has a unique opportunity to leverage its expertise and market position to grow into new geographies and adjacent market segments.
The Consumer B2C segment operates in a difficult and competitive market. We will continue to improve efficiencies and concentrate on the most profitable consumer categories, notably wine.
This is an exciting time and we have a full agenda of initiatives underway to grow our business.
Finally, we would like to thank all of our shareholders, staff, customers and suppliers for their ongoing loyalty and support. We look forward to reporting on our progress in the year ahead.
Jonathan PinshawChairman
Mark BaylissCEO
Chairman & CEO's Report continuedJONATHAN PINSHAW AND MARK BAYLISS
Grays eCommerce Group Limited4F
or p
erso
nal u
se o
nly

Jonathan PinshawIndependent Non-Executive ChairmanBachelor of Business Science (Hons) from the University of Cape Town and a Bachelor of Commerce (Hons) from the University of South Africa
Jonathan is an experienced board director and business leader. He has held non-executive director roles in a number of public companies including Just Group (Chairman), Australian Consolidated Investments (Chairman), Fairfax Media (Deputy Chairman), James Hardie and Country Road. He has also chaired a number of private equity owned companies. Previous executive roles include Managing Director of public companies OPSM Group and Freedom Furniture, as well as Chief Executive Officer roles with Gestetner Asia-Pacific and Brierley Investments Australia.
Mark BaylissExecutive Director and Chief Executive OfficerBachelor of Science (Econ) from the London School of Economics and member of the Institute of Chartered Accountants in England and Wales
Mark is a senior executive with over 25 years' experience in international and publicly listed companies, including leveraged buy-outs, private equity turn-arounds and all aspects of strategic, operational and financial management. His previous positions include Group Chief Executive at Quick Service Restaurants, Partner at Anchorage Capital Partners, Executive Chairman at Antares Restaurant Group and Chief Financial Officer at Fairfax media.
Naseema SparksIndependent Non-Executive DirectorBachelor of Pharmacy; Master of Pharmacy (Pharmacol); Marketing Research and Strategy, Swinburne University; MBA, Melbourne Business School; Fellow of the Australian Institute of Company Directors
Naseema is an experienced director with strong experience in technology driven businesses disrupting traditional sectors. Her expertise is future focused and includes business strategy, marketing, media – traditional and digital, e-commerce and mobile payments platforms. She was previously the Australian Managing Director and a global partner of communications agency M&C Saatchi.
Will Vicars Non-Executive DirectorBachelor of Arts, majoring in Economics, from the University of Sydney
Will is Chief Investment Officer at Caledonia (Private) Investments Pty Limited and sits on the board of directors of Caledonia, DFO Investments and The Caledonia Foundation. He is Vice-Chairman and a Non-Executive director of St Luke's Hospital Foundation, a Non-Executive director of Oroton Group and Oneview. Prior to Caledonia, he worked as a Senior Portfolio Manager at NRMA investments and at Bankers Trust.
Bernie CampbellIndependent Non-Executive DirectorMaster of Applied Finance from Macquarie University and completed Advanced Management Program at INSEAD
Bernie has more than 35 years' experience in the finance industry. He is the Managing Director, Asset Finance at Pepper Group Limited, a diversified finance group with offices in Australia, UK, Ireland Spain, Hong Kong, China and Korea. He was previously Managing Director, Asset Finance at St George Bank, one of Australia’s leading retail and business banking brands following the bank’s acquisition of Capital Finance in 2013. Bernie was Managing Director of Capital Finance Australia, a financier of vehicles and heavy commercial equipment from 2008 to 2013, after initially joining the Group in 1995.
Board of DirectorsPROFILES
5Annual Report 2015F
or p
erso
nal u
se o
nly

The Directors present their report together with the consolidated financial report of the Group, being Grays eCommerce Group Limited (the “parent entity” or “Company”) and its controlled entities, for the financial year ended 30 June 2015, and the independent auditor’s report thereon.
Financial Report
7 Directors' Report23 Auditor's Independence Declaration24 Statement of Profit or Loss and Other Comprehensive Income25 Statement of Financial Position26 Statement of Changes in Equity27 Statement of Cash Flows28 Notes to the Financial Statements62 Directors' Declaration63 Independent Auditor’s Report65 Shareholder Information67 Corporate Directory
Contents
FOR THE YEAR ENDED 30 JUNE 2015
Grays eCommerce Group Limited6F
or p
erso
nal u
se o
nly
The directors present their report, together with the financial statements, on the consolidated entity (referred to hereafter as the ‘Group’) consisting of Grays eCommerce Group Limited (referred to hereafter as the ‘Company’ or ‘parent entity’) and the entities it controlled at the end of, or during, the year ended 30 June 2015. Grays eCommerce Group Limited was formerly known as Mnemon Limited (“MNZ”).
DirectorsThe following persons were directors of Grays eCommerce Group Limited during the whole of the financial year and up to the date of this report, unless otherwise stated:
Jonathan Pinshaw – Chairman (appointed 7 November 2014)
Mark Bayliss (appointed 7 November 2014)
Naseema Sparks
Will Vicars (appointed 7 November 2014)
Bernie Campbell (appointed 9 March 2015)
Bernard Stanton – Alternate Director (appointed 17 November 2014)
David Leslie (resigned 7 November 2014)
Elliot Kaplan (resigned 7 November 2014)
Principal activitiesUp until the acquisition of Grays (Aust) Holdings Pty Limited (see Significant changes in the state of affairs), the Group’s principal activities were that of an online retail department store. These activities changed significantly during the year following the legal acquisition of Grays (Aust) Holdings Pty Limited. The acquisition resulted in the legal Group becoming Australia’s largest listed eCommerce business with the primary businesses being the provision of online auctioneering and valuation services in the Industrial B2B sector together with online auctioneering and online retail services in the Consumer B2C market.
Significant changes in the state of affairs
Acquisition of Grays (Aust) Holdings Pty Limited - reverse acquisitionOn 7 November 2014, the Company completed its legal acquisition of 100% of the shares in Grays (Aust) Holdings Pty Limited (“Grays”). Under this acquisition, the Company (formerly known as Mnemon Limited) issued 638 new Mnemon shares for each Grays share held and the listed company name was changed to Grays eCommerce Group Limited. For reporting purposes, this merger was treated as a “reverse acquisition” whereby Grays is deemed to be the accounting acquirer of the consolidated Group.
The merger has created Australia’s largest listed ‘pure-play’ e-commerce group, bringing together four of Australia’s best known online brands, GraysOnline, OO.com.au, DealsDirect and TopBuy.
The Company issued a total of 73,244,952 ordinary shares to the vendors of Grays (Aust) Holdings Pty Limited. In addition, vendors who, on 7 November 2015, hold no less than 75% of the number of shares issued as part of the merger, will be issued one additional ‘bonus’ ordinary share for every two ordinary shares held.
The acquisition has been treated as a reverse acquisition in accordance with AASB 3 ‘Business Combinations’. Within the financial statements, the comparatives for the year ended 30 June 2014 represent those of Grays (Aust) Holdings Pty Limited and its subsidiaries. For the year ended 30 June 2015, the financial statements present the activities of Grays (Aust) Holdings Pty Limited and its subsidiaries up to the acquisition date, 7 November 2014, and that of the merged group thereafter.
The Group’s integration of the businesses was substantially completed as at the reporting date.
Change of nameOn 7 November 2014, the Company changed its name from Mnemon Limited (ASX: MNZ) to Grays eCommerce Group Limited (ASX: GEG).
There were no other significant changes in the state of affairs of the Group during the financial year.
DividendsNo dividends have been paid during the year to the shareholders of Grays eCommerce Group Limited (formerly Mnemon Limited). However, prior to the reverse acquisition transaction that occurred on 7 November 2014, Grays (Aust) Holdings Pty Limited, which is the accounting acquirer of the Group, paid a fully franked special dividend totalling $3,594,000 on 22 September 2014 relating to a buy-back of that company’s share capital.
There were no other dividends paid, recommended or declared during the current or previous financial year.
Review of operationsThe loss for the Group after providing for income tax amounted to $1,205,000 (30 June 2014 loss: $4,027,000).
Directors' ReportFOR THE YEAR ENDED 30 JUNE 2015
7Annual Report 2015F
or p
erso
nal u
se o
nly

CONTINUED
Directors' Report
Operating and financial reviewThe Group’s primary business is that of an online auctioneer and retailer with diversified sales operations in the online Industrial B2B market segment and the Consumer auction and fixed price retail B2C market segment. In FY2015 the Group processed sales through its various websites in excess of $500m and earned revenues of $193m. The Group operates 4 websites being: graysonline.com; dealsdirect.com.au; oo.com.au and topbuy.com.au with graysonline.com being the flagship website. Grays operates in every state in mainland Australia, in the Northern Territory and New Zealand. It has at its disposal approximately 80,000 sq. metres of warehousing facilities.
The two operating segments are:
— Industrial B2B: This is predominantly an auction site catering to business customers, working closely with corporates, banks and insolvency practitioners to auction fixed and mobile plant and equipment through its website graysonline.com. This division also provides valuation and workplace health and safety consulting services to business customers; and
— Consumer B2C: This comprises both auction and fixed price retailing of wine, homewares, electronics, jewellery, brown goods, white goods and toys through the websites graysonline.com, dealsdirect.com,au, oo.com.au and topbuy.com.au. Subsequent to year end a wine specific website, grayswine.com.au was launched by the Group.
Management assesses business performance on the basis of earnings before interest, tax, depreciation, amortisation and significant costs which are incurred beyond the ordinary course of business. Significant costs incurred in FY2015 include the following acquisition and merger integration related expenses:
— transaction associated costs of the legal acquisition of Grays (Aust) Holdings Pty Limited; and — integration and consolidation costs of distribution facilities, back office and support functions.
Significant costs in FY2014 include a charge for the impairment of assets and acquisition and merger integration costs associated with the acquisition of the OO.com.au business.
To assist the interpretation of the underlying performance of the group, a pro forma income statement is presented below:
Consolidated2015
$’0002014
$’000
Revenues (excluding interest income) 192,453 146,305
Operating expenses (185,581) (142,635)
EBITDA* before acquisition and merger integration costs 6,872 3,670
Depreciation and amortisation (2,632) (3,712)
Impairment of assets – (2,995)
Interest income 477 445
Interest and financing costs (88) (224)
Acquisition and merger integration costs (6,491) (1,766)
Income tax benefit 657 555
Profit/(loss) after income tax (1,205) (4,027)
* EBITDA is a non-IFRS measure and represents earnings from continuing operations before interest, tax, depreciation, amortisation, impairment of assets and significant items in the form of acquisition and merger integration costs.
FY2015 EBITDA* has grown by 87% to $6.87m after an exceptionally strong performance by the Industrial B2B division. Industrial B2B is the largest commercial and industrial online auction and valuation business in Australia in its selected categories. The Group has invested in both premises and personnel and this has contributed favourably to the FY2015 EBITDA* contribution of $13m (up from $7.4m in FY2014). Industrial B2B has seen significant activity in the civil, mining and construction industry segments in response to the macroeconomic adjustments faced by those sectors and was well positioned to maximise its participation in large event auctions. Industrial B2B has adjacent, horizontal and vertical growth opportunities.
Grays eCommerce Group Limited8F
or p
erso
nal u
se o
nly
The Consumer B2C division has had a challenging year in a very competitive consumer retail macro environment. Consumer B2C incurred a loss of $1.65m in FY2015, compared to loss of $0.5m in FY2014. This result is despite a strong contribution from the wine category. Offsetting the strong wine contribution was a weaker performance from the fixed price retail websites. The cost synergies from the merger have been attained with the benefits set to flow into FY2016. Good progress has been made on delivering the revenue synergies from cross sell opportunities across the various customer databases.
Corporate costs comprise costs associated with the group board, legal, secretarial and senior executive team which cannot be easily allocated to the business segments of B2B and B2C.These have risen in FY2015 to $4.4m (FY2014: $3.3m) primarily due to the costs associated with being a publicly listed entity.
Group strategyThe Board has developed a strategic direction around a Vision and Values framework, the major themes of which are to:
— Optimise the business through operational efficiencies and the integration of the merged Group;
— Expand the business utilising our core strengths especially in our Industrial B2B division;
— Grow into natural adjacent market segments of the Industrial B2B division; and
— Invest in the wine category and turnaround the underperforming consumer categories.
This strategic framework underpins the executional plans of the business on an ongoing basis.
Material business risksThe group faces various potential risks that have the potential to materially affect the performance of the consolidated entity. These are listed below.
— Market and competitor riskThe Group has an exposure to market and competitor forces. The risk may be changes in macro drivers of the Industrial B2B and Consumer B2C sectors or exposure to the activities of existing or new market participants. The Group actively monitors its performance in each of the segments that it operates in. This monitoring ensures the Group is well positioned to understand market changes and to develop appropriate responses to those changes.
Whilst the actions of competitors are an uncontrollable risk, the Group mitigates this risk by ensuring that the delivery of its products and services are performed in the most efficient and cost effective manner available while also providing a level of customer service expected by the Group’s customers.
— IT infrastructure and systems riskAs a predominantly online eCommerce business, the performance of our online and operating system platforms and the availability of the internet underpin the Group’s ability to transact on a daily basis. To manage this risk, the group deploys a variety of physical and virtual redundancies across both the infrastructure and operating networks of the business. Ongoing management of the environment is the responsibility of a direct report of the CEO, the Executive General Manager – IT.
— Loss of key management personnelThe loss of key management personnel could have a negative impact on the ability of the Group to deliver on its executional and strategic plans with a consequential risk on the financial performance of the business. The risk is mitigated through a combination of preventative and responsive measures. As a preventative measure, the remuneration packages of key management personnel have been developed with the support of external remuneration consultants. These package structures incorporate a combination of base remuneration together with short and long term incentive plans. These are in place and are subject to regular review to ensure they remain market competitive. As a responsive measure, succession plans for key risk roles are in place to minimise the disruption associated with staff departures.
— Supply of saleable productsThe auction sales channel within Industrial B2B and Consumer B2C relies upon suitable product being available for auction. It is a supply driven business. To reduce this risk the Group has a wide variety of vendors and an appropriately remunerated group of business development managers that source the products. The Group also supplements this supply of consignment products by purchasing certain category ranges required by its customers, thereby reducing this specific risk.
9Annual Report 2015F
or p
erso
nal u
se o
nly

CONTINUED
Directors' Report
Matters subsequent to the end of the financial year
Acquisition of DMS Davlan Pty Limited’s business assetsOn 3 July 2015, the Group acquired the business assets of DMS Davlan Pty Limited (‘DMS Davlan’) for an initial consideration of $3,200,000 through a combination of cash and equity. Additionally, earn-out provisions linked to EBITDA contributions by DMS Davlan for the years ending 30 June 2016 and 30 June 2017 are in place. DMS Davlan is a leader in the sale by auction of agricultural machinery and brings recognised expertise in the transport and civil construction industries. DMS Davlan operates through a national network with 15 branches throughout Australia including 7 key regional locations. It is expected that the acquisition will strongly complement the existing Industrial B2B business. The fair values of the assets acquired and the liabilities assumed have yet to be determined.
No other matter or circumstance has arisen since 30 June 2015 that has significantly affected, or may significantly affect the Group’s operations, the results of those operations, or the Group’s state of affairs in future financial years.
Likely developments and expected results of operationsIndustrial B2B has had an exceptional year and the Directors are confident that the strategic initiatives that have been put in place will continue to drive growth through this segment. The Directors expect growth through the existing categories of transportation, mining and construction and through the expansion into the South East Asian region from the deployment of our experience in auctions, plant appraisals, valuations and project management. The acquisition of DMS Davlan will provide additional expertise in the agribusiness sector that will benefit and grow from cross-fertilisation of clients, operating platforms, digital marketing and practices employed by GEG.
The Consumer B2C business will continue to grow its wine category through its new website, grayswine.com.au and continue its success in its expanding reverse logistics business. The fixed price retail websites oo.com.au, dealsdirect.com.au and topbuy.com.au will benefit from the cost synergies that have been implemented over the past 6 months and the revenue cross sell synergies that are steadily growing.
Overall, FY2016 should show significant growth over the FY2015 result and the Directors are confident that the initiatives which have been put in place will drive that growth.
Environmental regulationThe Group is not subject to any significant environmental regulation under Australian Commonwealth or State law.
Information on directors
Name: Jonathan Pinshaw (appointed 7 November 2014)
Title: Independent Non-Executive Chairman
Qualifications: Bachelor of Business Science (Hons) from the University of Cape Town and a Bachelor of Commerce (Hons) from the University of South Africa
Experience and expertise: Jonathan is an experienced board director and business leader. He has held non-executive director roles in a number of public companies including Just Group (Chairman), Australia Consolidated Investments (Chairman), Fairfax Media (Deputy Chairman), James Hardie and Country Road. He has also chaired a number of private equity owned companies. Previous executive roles include Managing Director of public companies OPSM Group and Freedom Furniture, as well as Chief Executive Officer roles with Gestetner Asia-Pacific and Brierley Investments Australia.
Other current directorships: None
Former directorships (last 3 years): None
Special responsibilities: Member of Audit and Risk Committee and member of Remuneration and Nomination Committee
Interests in shares: 545,490 ordinary shares
Interests in options: None
Contractual rights to shares: None
Grays eCommerce Group Limited10F
or p
erso
nal u
se o
nly

Name: Mark Bayliss (appointed 7 November 2014)
Title: Executive Director and Chief Executive Officer
Qualifications: Bachelor of Science (Econ) from the London School of Economics and member of the Institute of Chartered Accountants in England and Wales.
Experience and expertise: Mark is a senior executive with over 25 years of experience in international and publicly listed companies, including leveraged buy-outs, private equity turn-arounds and all aspects of strategic, operational and financial management. His previous positions include Group Chief Executive at Quick Service Restaurants, Partner at Anchorage Capital Partners, Executive Chairman at Antares Restaurant Group and Chief Financial Officer of Fairfax Media.
Other current directorships: None
Former directorships (last 3 years): None
Special responsibilities: None
Interests in shares: 3,119,182 ordinary shares
Interests in options: 1,117,318 performance rights over ordinary shares
Contractual rights to shares: None
Name: Naseema Sparks
Title: Independent Non-Executive Director
Qualifications: Bachelor of Pharmacy; Master of Pharmacy (Pharmacol); Marketing Research and Strategy, Swinburne Institute; MBA, Melbourne Business School; Fellow of the Australian Institute of Company Directors.
Experience and expertise: Naseema is an experienced director with strong experience in technology driven businesses disrupting traditional sectors. Her expertise is future focused and includes business strategy, marketing, media – traditional and digital, e-commerce and mobile payments platforms. She was previously the Australian Managing Director and a global partner of communications agency M&C Saatchi.
Other current directorships: Melbourne IT Ltd, PMP Ltd, Australian Vintage Ltd, Ingogo and AIG Australia. She is also Deputy Chairman of Racing NSW and a Trustee of Sydney Living Museums
Former directorships (last 3 years): Shadforth Financial Group (SFG Ltd)
Special responsibilities: Chairman, Remuneration and Nominations Committee, Member, Audit and Risk Committee
Interests in shares: 4,604 ordinary shares
Interests in options: None
Contractual rights to shares: None
11Annual Report 2015F
or p
erso
nal u
se o
nly
CONTINUED
Directors' Report
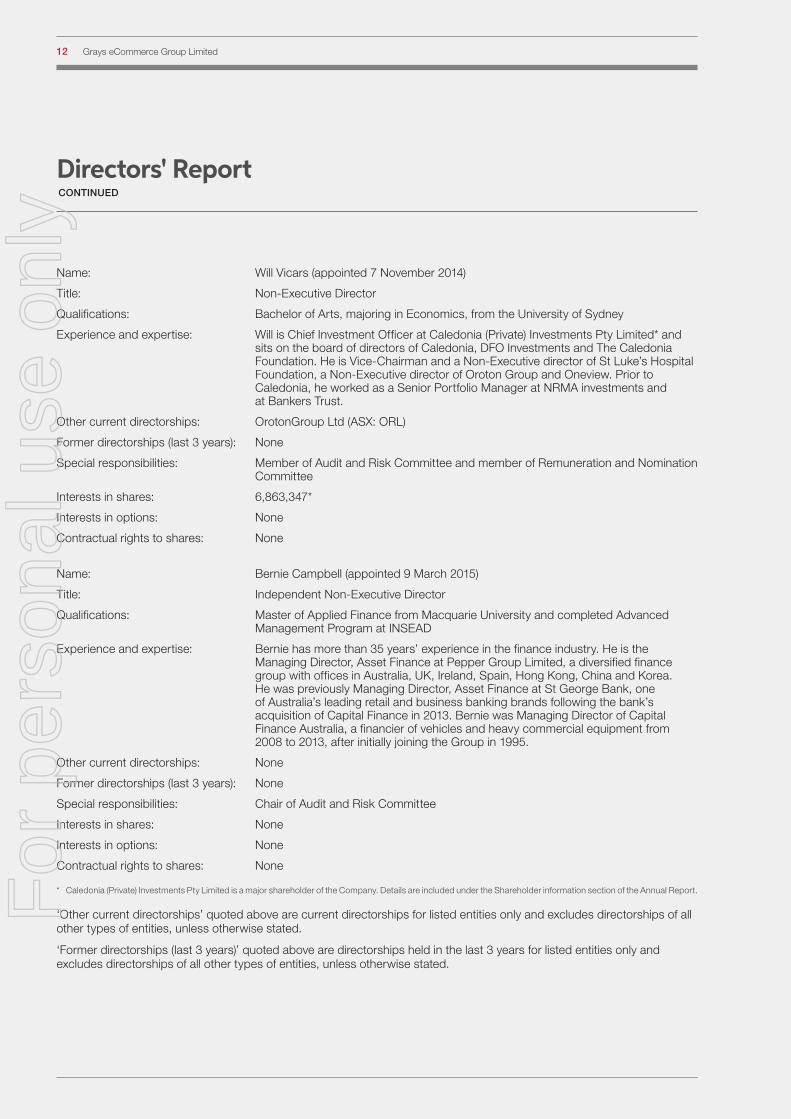
Name: Will Vicars (appointed 7 November 2014)
Title: Non-Executive Director
Qualifications: Bachelor of Arts, majoring in Economics, from the University of Sydney
Experience and expertise: Will is Chief Investment Officer at Caledonia (Private) Investments Pty Limited* and sits on the board of directors of Caledonia, DFO Investments and The Caledonia Foundation. He is Vice-Chairman and a Non-Executive director of St Luke’s Hospital Foundation, a Non-Executive director of Oroton Group and Oneview. Prior to Caledonia, he worked as a Senior Portfolio Manager at NRMA investments and at Bankers Trust.
Other current directorships: OrotonGroup Ltd (ASX: ORL)
Former directorships (last 3 years): None
Special responsibilities: Member of Audit and Risk Committee and member of Remuneration and Nomination Committee
Interests in shares: 6,863,347*
Interests in options: None
Contractual rights to shares: None
Name: Bernie Campbell (appointed 9 March 2015)
Title: Independent Non-Executive Director
Qualifications: Master of Applied Finance from Macquarie University and completed Advanced Management Program at INSEAD
Experience and expertise: Bernie has more than 35 years’ experience in the finance industry. He is the Managing Director, Asset Finance at Pepper Group Limited, a diversified finance group with offices in Australia, UK, Ireland, Spain, Hong Kong, China and Korea. He was previously Managing Director, Asset Finance at St George Bank, one of Australia’s leading retail and business banking brands following the bank’s acquisition of Capital Finance in 2013. Bernie was Managing Director of Capital Finance Australia, a financier of vehicles and heavy commercial equipment from 2008 to 2013, after initially joining the Group in 1995.
Other current directorships: None
Former directorships (last 3 years): None
Special responsibilities: Chair of Audit and Risk Committee
Interests in shares: None
Interests in options: None
Contractual rights to shares: None
* Caledonia (Private) Investments Pty Limited is a major shareholder of the Company. Details are included under the Shareholder information section of the Annual Report.
‘Other current directorships’ quoted above are current directorships for listed entities only and excludes directorships of all other types of entities, unless otherwise stated.
‘Former directorships (last 3 years)’ quoted above are directorships held in the last 3 years for listed entities only and excludes directorships of all other types of entities, unless otherwise stated.
Grays eCommerce Group Limited12F
or p
erso
nal u
se o
nly

Company secretaryMs Leanne Ralph (Bachelor of Business, Certified Practising Accountant (CPA)) is a member of the Governance Institute of Australia and the Australian Institute of Company Directors. She is a principal of Boardworx Australia Pty Limited which supplies outsourced company secretarial services to a number of listed and unlisted companies.
Meetings of directorsThe number of meetings of the Company’s Board of Directors (‘the Board’) and of each Board committee held during the year ended 30 June 2015, and the number of meetings attended by each director were:
Full Board Audit and Risk CommitteeNomination and
Remuneration CommitteeAttended Held Attended Held Attended Held
Jonathan Pinshaw 7 7 2 2 3 3
Mark Bayliss 7 7 – – – –
Naseema Sparks 15 15 2 4 4 4
Will Vicars 6 7 1 2 2 3
Bernie Campbell 3 3 1 1 1 1
Bernard Stanton 1 1 1 1 1 1
David Leslie 7 8 2 2 1 1
Elliot Kaplan 8 8 2 2 1 1
Held: represents the number of meetings held during the time the director held office or was a member of the relevant committee.
Remuneration report (audited)The remuneration report details the key management personnel (‘KMP’) remuneration arrangements for the Group, in accordance with the requirements of the Corporations Act 2001 and its Regulations. This information has been audited, pursuant to section 308(3c) of the Corporations Act 2001.
KMP are those persons having authority and responsibility for planning, directing and controlling the activities of the Group, directly or indirectly, including the non-executive directors and the executive director (who is also the chief executive officer (‘CEO’)).
As detailed in Note 2 to the financial statements, AASB 3 ‘Business Combinations’ requires that consolidated financial statements prepared following a reverse acquisition shall be issued under the name of the legal parent entity of the Company, Grays eCommerce Group Limited (formerly Mnemon Limited) (the ‘Company’), but be a continuation of the financial statements of the legal subsidiary or deemed acquirer for accounting purposes Grays (Aust) Holdings Pty Limited. This remuneration report is consistent with the accounting and includes additional information relating to the Company, as required.
The remuneration report is set out under the following main headings:
— Remuneration governance and principles used to determine the nature and amount of remuneration — Details of remuneration — Executive contracts — Share-based compensation — Additional disclosures relating to KMP
13Annual Report 2015F
or p
erso
nal u
se o
nly

CONTINUED
Directors' Report
Remuneration governance and principles used to determine the nature and amount of remunerationThe objective of the Group’s executive reward framework is to ensure reward for performance is competitive and appropriate for the results delivered. The framework aligns executive reward with the achievement of strategic objectives and the creation of value for shareholders, and conforms to the market best practice for the delivery of reward. The Board of Directors (‘the Board’) ensures that executive reward satisfies the following key criteria for good reward governance practices:
— competitiveness and reasonableness; — acceptability to shareholders; — performance linkage/alignment of executive
compensation; — transparency; — capital management; and — has achievement of economic profit as a core
consideration.
Nomination and Remuneration Committee (‘NRC’)The NRC is a Board committee comprising all four non-executive directors and is Chaired by Naseema Sparks. The NRC is responsible for making recommendations to the Board on remuneration arrangements for its directors and executives, the remuneration framework, and the operation of any incentive plan. Specifically, the Board approves the remuneration arrangements of the CEO and other executives and all awards made under incentive plans, following recommendations from the NRC. The Board also sets the maximum aggregate remuneration of all non-executive directors, which is then subject to shareholder approval, and their fee levels. The NRC approves, having regard to the recommendations made by the CEO, the level of the Group’s short-term incentive pool.
The NRC meets regularly throughout the financial year. The CEO attends NRC meetings by invitation and provides management input. The CEO is not present during any discussions related to his own remuneration arrangements.
Principles and strategyThe performance of the Group depends on the quality of its directors and executives. The remuneration philosophy is to attract, motivate and retain high performance and high quality personnel.
In consultation with external remuneration consultants (refer to the section ‘Use of remuneration consultants’ below), the NRC has structured an executive remuneration framework that is market competitive and complementary to the reward strategy of the Group.
In following these principles, the Remuneration Committee strives to align to both shareholder and participant interests as follows:
Alignment to shareholders’ interests:
— via underlying earnings as a core component of any plan design;
— focuses on sustained growth in shareholder wealth; and — attracts and retains high calibre executives.
Alignment to program participants’ interests:
— rewards capability and experience; — reflects competitive reward for contribution to growth in
shareholder wealth; and — provides a clear structure for earning rewards.
In accordance with best practice corporate governance, the structure of non-executive directors and executive remunerations are separate.
Non-executive directors remunerationFees and payments to non-executive directors reflect the demands and responsibilities of their role. Non-executive directors’ fees and payments are reviewed annually by the NRC which makes a recommendation to the Board. The NRC may, from time to time, receive advice from independent remuneration consultants to ensure non-executive directors’ fees and payments are appropriate and in line with the market. The chairman’s fees are determined independently to the fees of other non-executive directors based on comparative roles in the external market. The chairman is not present at any discussions relating to the determination of his own remuneration. Non-executive directors do not receive share options or other incentives.
In particular, the non-executive directors:
— remuneration is in the form of a base fee, which is inclusive of statutory superannuation;
— do not have any remuneration at risk; — do not participate in any employee incentive schemes; — do not participate in performance-based remuneration; — may be allowed to receive their fees in the form of
Grays eCommerce Group Limited shares, subject to shareholder approval under, and/or any necessary waiver of, the ASX Listing Rules; and
— are entitled to be reimbursed for all reasonable out of pocket expenses incurred in connection with the performance of their duties as a director of the Company.
ASX listing rules require the aggregate non-executive directors remuneration be determined periodically by a general meeting. The most recent determination was at the Annual General Meeting held on 27 November 2014, where the shareholders approved a maximum aggregate remuneration pool of $600,000 per annum.
Grays eCommerce Group Limited14F
or p
erso
nal u
se o
nly

Executive remunerationThe Group aims to reward executives with a level and mix of remuneration based on their position and responsibility, which has both fixed and variable components.
The executive remuneration and reward framework has four components:
— base pay and non-monetary benefits; — short-term performance incentives; — share-based payments; and — other remuneration such as superannuation and long
service leave.
The combination of these comprises the executive’s total remuneration.
The remuneration of executives includes a fixed component comprising base salary and employer superannuation contributions. The CEO’s fixed remuneration is reviewed annually by the NRC relative to his individual performance and the relative comparative compensation in the market, for which independent advice is sought.
The CEO reviews at least annually the individual performance of all other KMP and makes recommendations to the NRC in relation to their fixed remuneration.
Executives may receive their fixed remuneration in the form of cash or other fringe benefits (for example motor vehicle benefits) where it does not create any additional costs to the Group and provides additional value to the executive.
The short-term incentive (‘STI’) program is designed to align the targets of the business units with the targets of those executives responsible for meeting those targets. STI payments are granted to executives based on specific annual targets and key performance indicators (‘KPI’s’) being achieved.
For the financial year ended 30 June 2015, no STI payments were made, with the exception of discretionary cash bonuses to Adam Scharer and John Martin for exceptional contributions to the Group, as detailed in the remuneration tables below.
The NRC has established a STI program for the year ending 30 June 2016 (‘FY2016’) in which participants are eligible to receive an annual cash bonus if pre-determined operational, safety, strategic and individual performance targets are met. Personal KPI’s are as agreed between the CEO and the Board (for the CEO) and the CEO and other executives (for other executives). Specific measures include earnings before interest depreciation and amortisation (‘EBITDA’) and total recordable injury frequency rate (‘TRIFR’), as follows:
Criteria Bonus
allocation
Group EBITDA before acquisitions equal or exceed 95% of FY16 budgeted EBITDA* 70%
10% reduction in TRIFR 15%
Personal KPI’s 15%
* The EBITDA element of the STI operates on a variable basis. Where EBITDA is below 95%, no STI is payable. The maximum STI payable is capped when EBITDA reaches 110% of budget.
The long-term incentive (‘LTI’) comprises a share-based performance rights plan. Performance rights may be awarded to executives under the employee incentive scheme known as the Grays eCommerce Group Limited Performance Rights Plan (‘PRP’). The PRP rules were posted on the ASX on 12 December 2014, with the first grant of performance rights made on 7 March 2015.
The PRP provides eligible personnel (including executive directors and eligible employees) with an opportunity to share in the growth in value of the Group and to encourage them to improve the long-term performance of the Group and its returns to shareholders. The PRP is also intended to attract and retain skilled and experienced senior employees and provide them with an incentive to have a greater involvement with and focus on the long-term goals of the Group.
There is no ability for the Company to provide any cash equivalent on vesting of the performance rights. Eligibility to participate in the PRP and the number of performance rights offered to each individual participant is at the discretion of the Board.
Performance conditions must be satisfied in order for the performance rights to vest. Vesting occurs over a 3 year period subject to two performance hurdles – total shareholder return (‘TSR’) and earnings per share (‘EPS’) – which are independently tested annually. These two measures have been adopted to link remuneration to the growth in shareholder wealth and performance against objective benchmarks. Vesting of the performance rights are also subject to continued service by the relevant executive over the relevant performance period or, upon cessation of employment, the vesting of performance rights may be determined at the absolute discretion of the Board.
TSR is a measure of the return on investment in a Company’s shares, including dividends and all other returns to shareholders notionally invested over the relevant performance period. The Group’s TSR over the performance period is assessed against companies within the ASX300 (excluding metals, mining and energy companies and property trusts) at the start of the financial year in which the performance rights are awarded.
15Annual Report 2015F
or p
erso
nal u
se o
nly

CONTINUED
Directors' Report
Upon the satisfaction of the vesting conditions, each performance right will convert to a number of shares based on the terms of issue. Performance rights granted to employees, including executive directors, will typically convert on a one-for-one basis.
The percentage of performance rights that vest, if any, will be determined by reference to the TSR and EPS vesting schedules, summarised as follows:
TSR performance relative to ASX300 % of TSR performance rights that become exercisable
Less than the 51st percentile Nil
Greater than 51st percentile but less than 75th percentile Straight-line pro-rata vesting between 50% and 100%
Greater than or equal to 75th percentile 100%
CAGR of EPS over the performance year % of EPS options that become exercisable
Less than 12% Nil
Between 12% and 18% Straight-line pro-rata vesting between 50% and 100%
Above 18% 100%
Group performance and link to remunerationFY2016 remuneration for certain individuals is directly linked to the performance of the Group. A portion of cash bonus and incentive payments are dependent on defined targets being met, as detailed above. The remaining portion of the cash bonus and incentive payments are at the discretion of the NRC. FY2015 remuneration is not directly linked to the performance of the Group and is at the discretion of the NRC.
Use of remuneration consultantsDuring FY2015, the NRC sought independent external remuneration advice from Egan Associates. This advice was used to inform the committee when making remuneration decisions. Egan Associates was paid $33,220 for these services.
The advice specially sought and obtained from Egan Associates related to:
— the appropriate comparator groups for remuneration benchmarking; — the appropriate remuneration mix for the CEO; — a review of remuneration for other KMPs; and — a review of incentive plans that may be appropriate for the Group.
The NRC is satisfied that the advice received from Egan Associates was free from undue influence from the CEO and other KMPs to whom the remuneration advice applied. Egan Associates were engaged by, and reported directly to, the Chair of the NRC. Egan Associates also confirmed in writing to the Chair that the remuneration recommendations were made free from undue influence by the Group’s KMP.
Voting and comments made at the Company’s 2014 Annual General Meeting (‘AGM’)At the 27 November 2014 AGM, 98% of the votes received supported the adoption of the remuneration report for the year ended 30 June 2014. The Company did not receive any specific feedback at the AGM regarding its remuneration practices.
Details of remuneration
Amounts of remunerationThe remuneration disclosures for the KMP contained in the following remuneration tables are as follows:
— The 2015 disclosures represents 8 months (the period from 7 November 2014 to 30 June 2015) of the Group and 4 months (the period from 1 July 2014 to 7 November 2014) of the KMP of Grays (Aust) Holdings Pty Limited.
— The 2014 disclosures represents 12 months of the KMP of Grays (Aust) Holdings Pty Limited.
Grays eCommerce Group Limited16F
or p
erso
nal u
se o
nly
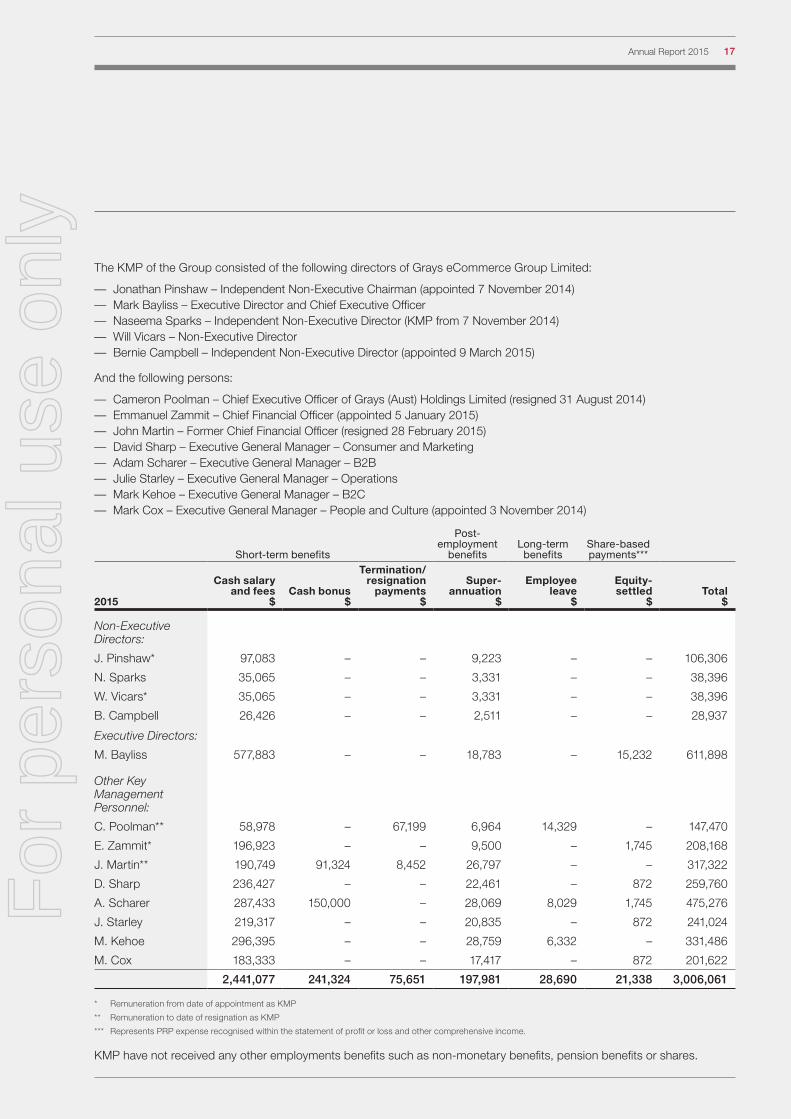
The KMP of the Group consisted of the following directors of Grays eCommerce Group Limited:
— Jonathan Pinshaw – Independent Non-Executive Chairman (appointed 7 November 2014) — Mark Bayliss – Executive Director and Chief Executive Officer — Naseema Sparks – Independent Non-Executive Director (KMP from 7 November 2014) — Will Vicars – Non-Executive Director — Bernie Campbell – Independent Non-Executive Director (appointed 9 March 2015)
And the following persons:
— Cameron Poolman – Chief Executive Officer of Grays (Aust) Holdings Limited (resigned 31 August 2014) — Emmanuel Zammit – Chief Financial Officer (appointed 5 January 2015) — John Martin – Former Chief Financial Officer (resigned 28 February 2015) — David Sharp – Executive General Manager – Consumer and Marketing — Adam Scharer – Executive General Manager – B2B — Julie Starley – Executive General Manager – Operations — Mark Kehoe – Executive General Manager – B2C — Mark Cox – Executive General Manager – People and Culture (appointed 3 November 2014)
Short-term benefits
Post-employment
benefitsLong-term
benefitsShare-based payments***
2015
Cash salary
and fees $
Cash bonus
$
Termination/resignation
payments $
Super-
annuation $
Employee
leave $
Equity-settled
$Total
$
Non-Executive Directors:
J. Pinshaw* 97,083 – – 9,223 – – 106,306
N. Sparks 35,065 – – 3,331 – – 38,396
W. Vicars* 35,065 – – 3,331 – – 38,396
B. Campbell 26,426 – – 2,511 – – 28,937
Executive Directors:
M. Bayliss 577,883 – – 18,783 – 15,232 611,898
Other Key Management Personnel:
C. Poolman** 58,978 – 67,199 6,964 14,329 – 147,470
E. Zammit* 196,923 – – 9,500 – 1,745 208,168
J. Martin** 190,749 91,324 8,452 26,797 – – 317,322
D. Sharp 236,427 – – 22,461 – 872 259,760
A. Scharer 287,433 150,000 – 28,069 8,029 1,745 475,276
J. Starley 219,317 – – 20,835 – 872 241,024
M. Kehoe 296,395 – – 28,759 6,332 – 331,486
M. Cox 183,333 – – 17,417 – 872 201,622
2,441,077 241,324 75,651 197,981 28,690 21,338 3,006,061
* Remuneration from date of appointment as KMP
** Remuneration to date of resignation as KMP
*** Represents PRP expense recognised within the statement of profit or loss and other comprehensive income.
KMP have not received any other employments benefits such as non-monetary benefits, pension benefits or shares.
17Annual Report 2015F
or p
erso
nal u
se o
nly

CONTINUED
Directors' Report
Short-term benefits
Post-employment
benefitsLong-term
benefitsShare-based payments**
2014
Cash salary and fees
$Cash bonus
$
Termination/resignation
payments $
Super-annuation
$
Employee leave
$
Equity-settled
$Total
$
Executive Directors:
M. Bayliss* 52,493 – – 2,507 – – 55,000
C. Poolman 421,214 – – 40,685 18,628 – 480,527
A. Scharer 291,452 – – 27,238 3,011 – 321,701
M. Kehoe 291,119 – – 28,002 11,608 – 330,729
Other Key Management Personnel:
J. Martin 268,827 – – 24,867 – – 293,694
D. Sharp 226,270 – – 20,930 – – 247,200
J. Starley 218,500 – – 20,211 – – 238,711
1,769,875 – – 164,440 33,247 – 1,967,562
* Represents remuneration from date of appointment.
** Represents PRP expense recognised within the statement of profit or loss and other comprehensive income.
KMP have not received any other employments benefits such as non-monetary benefits, pension benefits or shares.
In addition to the above two tables, the Corporations Act 2001 requires the remuneration of the directors and other KMP of the Company, prior to the combination with Grays (Aust) Holdings Pty Limited to be disclosed. Mnemon Limited paid remuneration for the period 1 July 2014 to 7 November 2014 (2014: year to 30 June 2014), which is as follows:
2015: 1 July 2014 to 6 November 2014 2014: year to 30 June 2014
Naseema Sparks:
Salary and fees of $19,011 and superannuation of $1,806, total of $20,817
Salary and fees of $48,020 and superannuation of $4,442, total of $52,462
David Leslie:
Salary and fees of $7,921, superannuation of $711, total of $8,632
Salary and fees of $7,787 and superannuation of $720, total of $8,507
Elliott Kaplan:
Salary and fees of $8,654 and superannuation of $nil, total of $8,654
Salary and fees of $15,200 and superannuation of $nil, total of $15,200
Michael Rosenbaum:
Salary and fees of $83,612, superannuation of $7,204, total of $90,816
Salary and fees of $215,694, bonus of $12,500, superannuation of $20,327, long service leave of $12,500, total of $261,021
Mark Tayler:
Salary and fees of $66,890, superannuation of $6,355, total of $73,244
Salary and fees of $173,963, bonus of $12,500, superannuation of $17,248, total of $203,711
Grays eCommerce Group Limited18F
or p
erso
nal u
se o
nly

Non-executive directors’ salaries are 100% fixed. The fixed proportion and the proportion of remuneration linked to performance of executive directors and other KMP are as follows:
Fixed remuneration At risk - STI At risk - LTI
Name2015
%2014
%2015
%2014
%2015
%2014
%
Executive Directors:
M. Bayliss 97 100 – – 3 –
Other Key Management Personnel:
C. Poolman 100 100 – – – –
E. Zammit 99 – – – 1 –
J. Martin 71 100 29 – – –
D. Sharp 100 100 – – – –
A. Scharer 68 100 32 – – –
J. Starley 100 100 – – – –
M. Kehoe 100 100 – – – –
M. Cox 100 – – – – –
Executive contractsRemuneration and other terms of employment for KMP are formalised in executive service agreements. Details of these agreements are as follows:
Name: Mark Bayliss
Title: Executive Director and Chief Executive Officer
Term of agreement: On going
Details: Mark receives a base salary including superannuation of $700,000 (effective 7 November 2014) and is eligible for a maximum STI opportunity for FY2016 of $260,000 and is eligible to participate in the PRP. Mark may terminate his employment contract by giving six months’ notice in writing. The Company may terminate the contract by giving six months’ notice in writing or by making a payment in lieu of notice. In the event of serious misconduct or other specific circumstances warranting summary dismissal, the Company may terminate his employment contract immediately by notice in writing and without payment in lieu of notice. Upon the termination of the employment contract, Mark is subject to a restraint of trade equal to his notice period. On termination as a “good leaver” (as defined in the PRP), LTI vested rights may be exercised during the 30 day period following the date of cessation of employment, after which those vested rights will automatically lapse. The treatment of unvested rights will be at Board discretion. In all other cases, all rights will lapse unless the Board determines otherwise. STI payments will not normally be paid on termination unless the Board determines otherwise.
All other KMP have entered into ongoing employment contracts with the Group. These contain all remuneration, performance and confidentially obligations on the part of the employer and employee.
These contracts stipulate a range of one to three month resignation periods. The Group may terminate an employment contract without cause by providing written notice or making payment in lieu of notice, based on the individual’s annual salary component together with a redundancy payment of the individual’s fixed salary component calculated based on service in accordance with legislation. Termination payments are generally not payable on resignation or dismissal for serious misconduct. In the instance of serious misconduct the Group can terminate employment at any time. Non-compete restrictions apply in the event of a termination. On termination as a “good leaver” (as defined in the PRP), LTI vested rights may be exercised during the 30 day period following the date of cessation of employment, after which those vested rights will automatically lapse. The treatment of unvested rights will be at Board discretion. In all other cases, all rights will lapse unless the Board determines otherwise. STI payments will not normally be paid on termination unless the Board determines otherwise.
19Annual Report 2015F
or p
erso
nal u
se o
nly

CONTINUED
Directors' Report
Share-based compensation
Issue of sharesThere were no shares issued to directors and other KMP as part of compensation during the year ended 30 June 2015.
Performance rightsThe terms and conditions of each grant of performance rights over ordinary shares affecting remuneration of directors and other KMP in this financial year or future reporting years are as follows:
Grant dateVesting date and
expiry date
Fair value per right at grant date
7 March 2015 30 June 2017 $0.110
7 March 2015 30 June 2017 $0.360
7 March 2015 30 June 2018 $0.170
7 March 2015 30 June 2018 $0.400
7 March 2015 30 June 2019 $0.230
7 March 2015 30 June 2019 $0.440
1 June 2015 30 June 2017 $0.090
1 June 2015 30 June 2017 $0.340
1 June 2015 30 June 2018 $0.150
1 June 2015 30 June 2018 $0.380
1 June 2015 30 June 2019 $0.210
1 June 2015 30 June 2019 $0.420
Performance rights granted carry no dividend or voting rights.
The number of performance rights over ordinary shares granted to and vested by directors and other KMP as part of compensation during the year ended 30 June 2015 are set out below:
Name
Number of rights granted
during the year 2015
Number of rights granted
during the year 2014
Number of rights vested
during the year 2015
Number of rights vested
during the year 2014
M. Bayliss 1,117,318 – – –
E. Zammit 446,928 – – –
D. Sharp 223,464 – – –
A. Scharer 446,928 – – –
J. Starley 223,464 – – –
M. Cox 223,464 – – –
Additional disclosures relating to KMPIn accordance with Class Order 14/632 issued by the Australia Securities and Investments Commission relating to ‘Key management personnel equity instrument disclosures’, the following disclosure relate only to equity instruments in the Company or its subsidiaries.
Grays eCommerce Group Limited20F
or p
erso
nal u
se o
nly

ShareholdingThe number of shares in the Company held during the financial year by each director and other members of KMP of the Group, including their personally related parties, is set out below:
Balance at the start of
the year
Received as part of
remuneration AdditionsDisposals/
other
Balance at the end of
the year
Ordinary shares
J. Pinshaw – – 545,490 – 545,490
N. Sparks 4,604 – – – 4,604
W. Vicars – – 6,863,347 – 6,863,347
M. Bayliss – – 3,119,182 – 3,119,182
J. Martin – – 319,000 (159,500) 159,500
A. Scharer – – 7,017,362 (1,750,000) 5,267,362
J. Starley – – 82,940 – 82,940
M. Kehoe – – 4,090,856 (841,626) 3,249,230
4,604 – 22,038,177 (2,751,126) 19,291,655
Performance rights holdingThe number of performance rights over ordinary shares in the Company held during the financial year by each director and other members of key management personnel of the Group, including their personally related parties, is set out below:
Balance at the start of
the year Granted Vested
Expired/forfeited/
other
Balance at the end of
the year
Performance rights over ordinary shares
M. Bayliss – 1,117,318 – – 1,117,318
E. Zammit – 446,928 – – 446,928
D. Sharp – 223,464 – – 223,464
A. Scharer – 446,928 – – 446,928
J. Starley – 223,464 – – 223,464
M. Cox – 223,464 – – 223,464
– 2,681,566 – – 2,681,566
This concludes the remuneration report, which has been audited.
Shares under performance rightsThere were no unissued ordinary shares of Grays eCommerce Group Limited under performance rights outstanding at the date of this report.
Shares issued on the exercise of performance rightsThere were no ordinary shares of Grays eCommerce Group Limited issued on the exercise of performance rights during the year ended 30 June 2015 and up to the date of this report.
Indemnity and insurance of officersThe Company has indemnified the directors and executives of the Company for costs incurred, in their capacity as a director or executive, for which they may be held personally liable, except where there is a lack of good faith.
During the financial year, the Company paid a premium in respect of a contract to insure the directors and executives of the Company against a liability to the extent permitted by the Corporations Act 2001. The contract of insurance prohibits disclosure of the nature of the liability and the amount of the premium.
21Annual Report 2015F
or p
erso
nal u
se o
nly

CONTINUED
Directors' Report
Indemnity and insurance of auditorTo the extent permitted by law, the Company has agreed to indemnify its auditors, Ernst & Young, as part of the terms of its audit engagement agreement against claims by third parties arising from the audit (for an unspecified amount). No payment has been made to indemnify Ernst & Young during or since the financial year.
Proceedings on behalf of the CompanyNo person has applied to the Court under section 237 of the Corporations Act 2001 for leave to bring proceedings on behalf of the Company, or to intervene in any proceedings to which the Company is a party for the purpose of taking responsibility on behalf of the Company for all or part of those proceedings.
Non-audit servicesDetails of the amounts paid or payable to the auditor for non-audit services provided during the financial year by the auditor are outlined in Note 28 to the financial statements.
The directors are satisfied that the provision of non-audit services during the financial year, by the auditor (or by another person or firm on the auditor’s behalf), is compatible with the general standard of independence for auditors imposed by the Corporations Act 2001.
The directors are of the opinion that the services as disclosed in Note 28 to the financial statements do not compromise the external auditor’s independence requirements of the Corporations Act 2001 for the following reasons:
— all non-audit services have been reviewed and approved to ensure that they do not impact the integrity and objectivity of the auditor; and
— none of the services undermine the general principles relating to auditor independence as set out in APES 110 Code of Ethics for Professional Accountants issued by the Accounting Professional and Ethical Standards Board, including reviewing or auditing the auditor’s own work, acting in a management or decision-making capacity for the Company, acting as advocate for the Company or jointly sharing economic risks and rewards.
Officers of the Company who are former partners of Ernst & YoungThere are no officers of the Company who are former partners of Ernst & Young.
Rounding of amountsThe Company is of a kind referred to in Class Order 98/100, issued by the Australian Securities and Investments Commission, relating to ‘rounding-off’. Amounts in this report have been rounded off in accordance with that Class Order to the nearest thousand dollars, or in certain cases, the nearest dollar.
Auditor’s independence declarationA copy of the auditor’s independence declaration as required under section 307C of the Corporations Act 2001 follows this report.
AuditorErnst & Young continues in office in accordance with section 327 of the Corporations Act 2001.
This report is made in accordance with a resolution of directors, pursuant to section 298(2)(a) of the Corporations Act 2001.
On behalf of the directors
Jonathan PinshawChairman
24 August 2015 Sydney
Grays eCommerce Group Limited22F
or p
erso
nal u
se o
nly

Auditor's Independence Declaration
23Annual Report 2015F
or p
erso
nal u
se o
nly

FOR THE YEAR ENDED 30 JUNE 2015
Consolidated
Note2015
$'0002014
$'000
Revenue 5 192,930 146,750
Expenses
Changes in inventory and finished goods (71,032) (47,087)
Freight and transport (22,314) (17,565)
Marketing and advertising (10,512) (8,124)
Occupancy costs 6 (11,747) (10,442)
Employment related costs 6 (53,227) (44,300)
Finance and borrowing costs 6 (88) (224)
Merchant fees and bank charges (3,558) (3,667)
Acquisition and merger integration costs 33 (6,491) (1,766)
Impairment of assets 6 – (2,995)
Other expenses (15,823) (15,162)
Loss before income tax benefit (1,862) (4,582)
Income tax benefit 7 657 555
Loss after income tax benefit for the year attributable to the owners of Grays eCommerce Group Limited 23 (1,205) (4,027)
Other comprehensive income
Items that may be reclassified subsequently to profit or loss
Foreign currency translation (1) 23
Other comprehensive income for the year, net of tax (1) 23
Total comprehensive income for the year attributable to the owners of Grays eCommerce Group Limited (1,206) (4,004)
Cents Cents
Basic earnings per share 38 (1.57) (7.42)
Diluted earnings per share 38 (1.57) (7.42)
Statement of Profit or Loss and Other Comprehensive Income
The above statement of profit or loss and other comprehensive income should be read in conjunction with the accompanying notes.
Grays eCommerce Group Limited24F
or p
erso
nal u
se o
nly

AS AT 30 JUNE 2015
Statement of Financial Position
Consolidated
Note2015
$'0002014
$'000
Assets
Current assets
Cash and cash equivalents 8 6,989 1,488
Trade and other receivables 9 7,472 7,307
Inventories 10 15,288 9,708
Prepayments 2,549 1,033
Total current assets 32,298 19,536
Non-current assets
Property, plant and equipment 11 3,542 3,382
Intangibles 12 30,471 6,875
Other financial assets 13 – 5,456
Deferred tax 14 6,285 2,904
Total non-current assets 40,298 18,617
Total assets 72,596 38,153
Liabilities
Current liabilities
Trade and other payables 15 25,054 19,999
Income tax 16 1,107 –
Provisions 17 6,243 4,092
Interest bearing loans and borrowings 18 – 4,500
Total current liabilities 32,404 28,591
Non-current liabilities
Provisions 20 1,163 1,090
Total non-current liabilities 1,163 1,090
Total liabilities 33,567 29,681
Net assets 39,029 8,472
Equity
Issued capital 21 44,627 9,292
Reserves 22 (7,124) (7,145)
Retained profits 23 1,526 6,325
Total equity 39,029 8,472
The above statement of financial position should be read in conjunction with the accompanying notes.
25Annual Report 2015F
or p
erso
nal u
se o
nly

FOR THE YEAR ENDED 30 JUNE 2015
Statement of Changes in Equity
Consolidated
Issued capital
$’000Reserves
$’000
Retained profits
$’000Total equity
$’000
Balance at 1 July 2013 5,984 (7,168) 10,352 9,168
Loss after income tax benefit for the year – – (4,027) (4,027)
Other comprehensive income for the year, net of tax – 23 – 23
Total comprehensive income for the year – 23 (4,027) (4,004)
Transactions with owners in their capacity as owners:
Contributions of equity, net of transaction costs (Note 21) 3,308 – – 3,308
Balance at 30 June 2014 9,292 (7,145) 6,325 8,472
Consolidated
Issued capital
$’000Reserves
$’000
Retained profits
$’000Total equity
$’000
Balance at 1 July 2014 9,292 (7,145) 6,325 8,472
Loss after income tax benefit for the year – – (1,205) (1,205)
Other comprehensive income for the year, net of tax – (1) – (1)
Total comprehensive income for the year – (1) (1,205) (1,206)
Transactions with owners in their capacity as owners:
Contributions of equity, net of transaction costs (Note 21) 35,335 – – 35,335
Share-based payments (Note 39) – 22 – 22
Dividends paid (Note 24) – – (3,594) (3,594)
Balance at 30 June 2015 44,627 (7,124) 1,526 39,029
The above statement of changes in equity should be read in conjunction with the accompanying notes.
Grays eCommerce Group Limited26F
or p
erso
nal u
se o
nly

FOR THE YEAR ENDED 30 JUNE 2015
Statement of Cash Flows
Consolidated
Note2015
$'0002014
$'000
Cash flows from operating activities
Receipts from customers (inclusive of GST) 212,061 190,272
Payments to suppliers (inclusive of GST) (214,022) (184,193)
(1,961) 6,079
Interest received 477 444
Interest and other finance costs paid (88) (224)
Income taxes refunded/(paid) (664) (131)
Net cash from/(used in) operating activities 37 (2,236) 6,168
Cash flows from investing activities
Net cash received from purchase of subsidiary 33 5,867 –
Payments for acquisition and merger integration costs (6,491) (1,766)
Payments for property, plant and equipment 11 (1,206) (2,160)
Payments for intangibles 12 (1,385) (864)
Proceeds from disposal of property, plant and equipment 46 28
Proceeds from disposal of intangibles 4 –
Net cash used in investing activities (3,165) (4,762)
Cash flows from financing activities
Proceeds from issue of shares* 21 17,006 3,308
Buy back of shares* 21 (3,466) –
Repayment of bank borrowings* (4,500) (1,500)
Loans repaid from/(made to) shareholders* 5,456 (3,938)
Dividends paid to shareholders* 24 (3,594) –
Net cash from/(used in) financing activities 10,902 (2,130)
Net increase/(decrease) in cash and cash equivalents 5,501 (724)
Cash and cash equivalents at the beginning of the financial year 1,488 2,212
Cash and cash equivalents at the end of the financial year 8 6,989 1,488
*All cash flows from financing activities relate to pre-merger Grays (Aust) Holdings Pty Limited.
The above statement of cash flows should be read in conjunction with the accompanying notes.
27Annual Report 2015F
or p
erso
nal u
se o
nly
FOR THE YEAR ENDED 30 JUNE 2015
Notes to the Financial Statements
Note 1. General informationThe financial statements cover Grays eCommerce Group Limited as a Group consisting of Grays eCommerce Group Limited and the entities it controlled at the end of, or during, the year. The financial statements are presented in Australian dollars, which is Grays eCommerce Group Limited’s functional and presentation currency.
Grays eCommerce Group Limited is a listed public company limited by shares, incorporated and domiciled in Australia. Its registered office and principal place of business is:
Homebush Corporate Park 29-33 Carter Street Lidcombe NSW 2141
A description of the nature of the Group’s operations and its principal activities are included in the directors’ report, which is not part of the financial statements.
The financial statements were authorised for issue, in accordance with a resolution of directors, on 24 August 2015. The directors have the power to amend and reissue the financial statements.
Reverse acquisitionOn 7 November 2014, Grays eCommerce Group Limited (formerly Mnemon Limited), acquired 100% of the issued securities of Grays (Aust) Holdings Pty Limited and its controlled entities (‘GAH’). For accounting purposes, the business combination was treated as a reverse acquisition, representing the continuation of the existing group previously controlled by GAH. Refer to the ‘business combinations’ accounting policy in Note 2 for further details.
Note 2. Significant accounting policiesThe principal accounting policies adopted in the preparation of the financial statements are set out below. These policies have been consistently applied to all the years presented, unless otherwise stated.
New, revised or amending Accounting Standards and Interpretations adoptedThe Group has adopted all of the new, revised or amending Accounting Standards and Interpretations issued by the Australian Accounting Standards Board (‘AASB’) that are mandatory for the current reporting period.
Any new, revised or amending Accounting Standards or Interpretations that are not yet mandatory have not been early adopted.
The adoption of these Accounting Standards and Interpretations, as listed below, did not have any significant impact on the financial performance or position of the Group.
— AASB 2012-3 Amendments to Australian Accounting Standards - Offsetting Financial Assets and Financial Liabilities;
— AASB 2013-3 Amendments to AASB 136 - Recoverable Amount Disclosures for Non-Financial Assets;
— AASB 2013-4 Amendments to Australian Accounting Standards - Novation of Derivatives and Continuation of Hedge Accounting;
— AASB 2013-5 Amendments to Australian Accounting Standards - Investment Entities;
— AASB 2014-1 Amendments to Australian Accounting Standards (Parts A to C); and
— Interpretation 21 Levies.
Basis of preparationThese general purpose financial statements have been prepared in accordance with Australian Accounting Standards and Interpretations issued by the Australian Accounting Standards Board (‘AASB’) and the Corporations Act 2001, as appropriate for for-profit oriented entities. These financial statements also comply with International Financial Reporting Standards (‘IFRSs’) as issued by the International Accounting Standards Board (‘IASB’).
Historical cost conventionThe financial statements have been prepared under the historical cost convention.
Critical accounting estimatesThe preparation of the financial statements requires the use of certain critical accounting estimates. It also requires management to exercise its judgement in the process of applying the Group’s accounting policies. The areas involving a higher degree of judgement or complexity, or areas where assumptions and estimates are significant to the financial statements, are disclosed in Note 3.
Parent entity informationIn accordance with the Corporations Act 2001, these financial statements present the results of the Group only. Supplementary information about the parent entity is disclosed in Note 32.
Principles of consolidationThe consolidated financial statements incorporate the assets and liabilities of all subsidiaries of Grays eCommerce Group Limited (‘Company’ or ‘parent entity’) as at 30 June 2015 and the results of all subsidiaries for the year then ended. Grays eCommerce Group Limited and its subsidiaries together are referred to in these financial statements as the ‘Group’.
Grays eCommerce Group Limited28F
or p
erso
nal u
se o
nly

Subsidiaries are all those entities over which the Group has control. The Group controls an entity when the Group is exposed to, or has rights to, variable returns from its involvement with the entity and has the ability to affect those returns through its power to direct the activities of the entity. Subsidiaries are fully consolidated from the date on which control is transferred to the Group. They are de-consolidated from the date that control ceases.
Intercompany transactions, balances and unrealised gains on transactions between entities in the Group are eliminated. Unrealised losses are also eliminated unless the transaction provides evidence of the impairment of the asset transferred. Accounting policies of subsidiaries have been changed where necessary to ensure consistency with the policies adopted by the Group.
The acquisition of subsidiaries is accounted for using the acquisition method of accounting. A change in ownership interest, without the loss of control, is accounted for as an equity transaction, where the difference between the consideration transferred and the book value of the share of the non-controlling interest acquired is recognised directly in equity attributable to the parent.
Where the Group loses control over a subsidiary, it derecognises the assets including goodwill, liabilities and non-controlling interest in the subsidiary together with any cumulative translation differences recognised in equity. The Group recognises the fair value of the consideration received and the fair value of any investment retained together with any gain or loss in profit or loss.
Operating segmentsOperating segments are presented using the ‘management approach’, where the information presented is on the same basis as the internal reports provided to the Chief Operating Decision Makers (‘CODM’). The CODM is responsible for the allocation of resources to operating segments and assessing their performance.
Foreign currency translationThe financial statements are presented in Australian dollars, which is Grays eCommerce Group Limited’s functional and presentation currency.
Foreign currency transactionsForeign currency transactions are translated into Australian dollars using the exchange rates prevailing at the dates of the transactions. Foreign exchange gains and losses resulting from the settlement of such transactions and from the translation at financial year-end exchange rates of monetary assets and liabilities denominated in foreign currencies are recognised in profit or loss.
Foreign operationsThe assets and liabilities of foreign operations are translated into Australian dollars using the exchange rates at the reporting date. The revenues and expenses of foreign operations are translated into Australian dollars using the average exchange rates, which approximate the rates at the dates of the transactions, for the period. All resulting foreign exchange differences are recognised in other comprehensive income through the foreign currency reserve in equity.
The foreign currency reserve is recognised in profit or loss when the foreign operation or net investment is disposed of.
Revenue recognitionRevenue is recognised when it is probable that the economic benefit will flow to the Group and the revenue can be reliably measured. Revenue is measured at the fair value of the consideration received or receivable.
Sale of goodsSale of goods revenue is recognised when there is persuasive evidence that the goods have passed to the customer. Evidence is usually in the form of a delivery docket issued at the time of delivery of the goods to the customer. The delivery of goods docket indicate that there has been a transfer of the risks and rewards of ownership. Amounts disclosed as revenue are net of sales returns and trade discounts.
Commissions Commissions including handling, buyers’ premiums and valuation fees are brought into accounts once the auction or valuation has been completed.
InterestInterest revenue is recognised as interest accrues using the effective interest method. This is a method of calculating the amortised cost of a financial asset and allocating the interest income over the relevant period using the effective interest rate, which is the rate that exactly discounts estimated future cash receipts through the expected life of the financial asset to the net carrying amount of the financial asset.
29Annual Report 2015F
or p
erso
nal u
se o
nly
CONTINUED
Notes to the Financial Statements
Note 2. Significant accounting policies (continued)
Recovery of expensesRecovery of expenses are brought into accounts, to the extent that they are recoverable once the auction or valuation has been completed.
Other revenueOther revenue is recognised when it is received or when the right to receive payment is established.
Income taxThe income tax expense or benefit for the period is the tax payable on that period’s taxable income based on the applicable income tax rate for each jurisdiction, adjusted by the changes in deferred tax assets and liabilities attributable to temporary differences, unused tax losses and the adjustment recognised for prior periods, where applicable.
Deferred tax assets and liabilities are recognised for temporary differences at the tax rates expected to be applied when the assets are recovered or liabilities are settled, based on those tax rates that are enacted or substantively enacted, except for:
— When the deferred income tax asset or liability arises from the initial recognition of goodwill or an asset or liability in a transaction that is not a business combination and that, at the time of the transaction, affects neither the accounting nor taxable profits; or
— When the taxable temporary difference is associated with interests in subsidiaries, associates or joint ventures, and the timing of the reversal can be controlled and it is probable that the temporary difference will not reverse in the foreseeable future.
Deferred tax assets are recognised for deductible temporary differences and unused tax losses only if it is probable that future taxable amounts will be available to utilise those temporary differences and losses.
The carrying amount of recognised and unrecognised deferred tax assets are reviewed at each reporting date. Deferred tax assets recognised are reduced to the extent that it is no longer probable that future taxable profits will be available for the carrying amount to be recovered. Previously unrecognised deferred tax assets are recognised to the extent that it is probable that there are future taxable profits available to recover the asset.
Deferred tax assets and liabilities are offset only where there is a legally enforceable right to offset current tax assets against current tax liabilities and deferred tax assets against deferred tax liabilities; and they relate to
the same taxable authority on either the same taxable entity or different taxable entities which intend to settle simultaneously.
Grays eCommerce Group Limited (the ‘head entity’) and its wholly-owned Australian subsidiaries have formed an income tax consolidated group under the tax consolidation regime, effective 7 November 2014. The head entity and each subsidiary in the tax consolidated group continue to account for their own current and deferred tax amounts. The tax consolidated group has applied the ‘separate taxpayer within group’ approach in determining the appropriate amount of taxes to allocate to members of the tax consolidated group.
In addition to its own current and deferred tax amounts, the head entity also recognises the current tax liabilities (or assets) and the deferred tax assets arising from unused tax losses and unused tax credits assumed from each subsidiary in the tax consolidated group.
Assets or liabilities arising under tax funding agreements with the tax consolidated entities are recognised as amounts receivable from or payable to other entities in the tax consolidated group. The tax funding arrangement ensures that the intercompany charge equals the current tax liability or benefit of each tax consolidated group member, resulting in neither a contribution by the head entity to the subsidiaries nor a distribution by the subsidiaries to the head entity.
Current and non-current classificationAssets and liabilities are presented in the statement of financial position based on current and non-current classification.
An asset is classified as current when: it is either expected to be realised or intended to be sold or consumed in normal operating cycle; it is held primarily for the purpose of trading; it is expected to be realised within 12 months after the reporting period; or the asset is cash or cash equivalent unless restricted from being exchanged or used to settle a liability for at least 12 months after the reporting period. All other assets are classified as non-current.
A liability is classified as current when: it is either expected to be settled in normal operating cycle; it is held primarily for the purpose of trading; it is due to be settled within 12 months after the reporting period; or there is no unconditional right to defer the settlement of the liability for at least 12 months after the reporting period. All other liabilities are classified as non-current.
Deferred tax assets and liabilities are always classified as non-current.
Grays eCommerce Group Limited30F
or p
erso
nal u
se o
nly

Cash and cash equivalentsCash and cash equivalents includes cash on hand, deposits held at call with financial institutions, other short-term, highly liquid investments with original maturities of three months or less that are readily convertible to known amounts of cash and which are subject to an insignificant risk of changes in value.
Trade and other receivablesTrade receivables are initially recognised at fair value and subsequently measured at amortised cost using the effective interest method, less any provision for impairment. Trade receivables are generally due for settlement within 30 days.
Collectability of trade receivables is reviewed on an ongoing basis. Debts which are known to be uncollectable are written off by reducing the carrying amount directly. A provision for impairment of trade receivables is raised when there is objective evidence that the Group will not be able to collect all amounts due according to the original terms of the receivables. Significant financial difficulties of the debtor, probability that the debtor will enter bankruptcy or financial reorganisation and default or delinquency in payments (more than 180 days overdue) are considered indicators that the trade receivable may be impaired. The amount of the impairment allowance is the difference between the asset’s carrying amount and the present value of estimated future cash flows, discounted at the original effective interest rate. Cash flows relating to short-term receivables are not discounted if the effect of discounting is immaterial.
Other receivables are recognised at amortised cost, less any provision for impairment.
InventoriesFinished goods are stated at the lower of cost and net realisable value on a ‘first in first out’ basis. Cost comprises of purchase and delivery costs, net of rebates and discounts received or receivable.
Net realisable value is the estimated selling price in the ordinary course of business less the estimated costs of completion and the estimated costs necessary to make the sale.
Investments and other financial assetsInvestments and other financial assets are initially measured at fair value. Transaction costs are included as part of the initial measurement, except for financial assets at fair value through profit or loss. They are subsequently measured at either amortised cost or fair value depending on their classification. Classification is determined based on the purpose of the acquisition and subsequent reclassification to other categories is restricted.
Financial assets are derecognised when the rights to receive cash flows from the financial assets have expired or have been transferred and the Group has transferred substantially all the risks and rewards of ownership.
Loans and receivablesLoans and receivables are non-derivative financial assets with fixed or determinable payments that are not quoted in an active market. They are carried at amortised cost using the effective interest rate method. Gains and losses are recognised in profit or loss when the asset is derecognised or impaired.
Property, plant and equipmentPlant and equipment is stated at historical cost less accumulated depreciation and impairment. Historical cost includes expenditure that is directly attributable to the acquisition of the items.
Depreciation is calculated on a straight-line basis to write off the net cost of each item of property, plant and equipment over their expected useful lives as follows:
Leasehold improvements over the lease termPlant and office equipment three to five yearsFurniture and fittings three to five years
Motor vehicles five yearsElectronic equipment three to five years
The residual values, useful lives and depreciation methods are reviewed, and adjusted if appropriate, at each reporting date.
Leasehold improvements and plant and equipment under lease are depreciated over the unexpired period of the lease or the estimated useful life of the assets, whichever is shorter.
An item of property, plant and equipment is derecognised upon disposal or when there is no future economic benefit to the Group. Gains and losses between the carrying amount and the disposal proceeds are taken to profit or loss.
31Annual Report 2015F
or p
erso
nal u
se o
nly

CONTINUED
Notes to the Financial Statements
Note 2. Significant accounting policies (continued)
LeasesThe determination of whether an arrangement is or contains a lease is based on the substance of the arrangement and requires an assessment of whether the fulfilment of the arrangement is dependent on the use of a specific asset or assets and the arrangement conveys a right to use the asset.
A distinction is made between finance leases, which effectively transfer from the lessor to the lessee substantially all the risks and benefits incidental to the ownership of leased assets, and operating leases, under which the lessor effectively retains substantially all such risks and benefits.
Finance leases are capitalised. A lease asset and liability are established at the fair value of the leased assets, or if lower, the present value of minimum lease payments. Lease payments are allocated between the principal component of the lease liability and the finance costs, so as to achieve a constant rate of interest on the remaining balance of the liability.
Leased assets acquired under a finance lease are depreciated over the asset’s useful life or over the shorter of the asset’s useful life and the lease term if there is no reasonable certainty that the Group will obtain ownership at the end of the lease term.
Operating lease payments, net of any incentives received from the lessor, are charged to profit or loss on a straight-line basis over the term of the lease.
Intangible assetsIntangible assets acquired as part of a business combination, other than goodwill, are initially measured at their fair value at the date of the acquisition. Intangible assets acquired separately are initially recognised at cost. Indefinite life intangible assets are not amortised and are subsequently measured at cost less any impairment. Finite life intangible assets are subsequently measured at cost less amortisation and any impairment. The gains or losses recognised in profit or loss arising from the derecognition of intangible assets are measured as the difference between net disposal proceeds and the carrying amount of the intangible asset. The method and useful lives of finite life intangible assets are reviewed annually. Changes in the expected pattern of consumption or useful life are accounted for prospectively by changing the amortisation method or period.
GoodwillGoodwill arises on the acquisition of a business. Goodwill is not amortised. Instead, goodwill is tested annually for impairment, or more frequently if events or changes in circumstances indicate that it might be impaired, and is carried at cost less accumulated impairment losses. Impairment losses on goodwill are taken to profit or loss and are not subsequently reversed.
Website developmentSignificant costs associated with the development of the revenue generating aspects of the website, including the capacity of placing orders, are deferred and amortised on a straight-line basis over the period of their expected benefit, being their finite life of ten years.
SoftwareSignificant costs associated with software are deferred and amortised on a straight-line basis over the period of their expected benefit, being their finite life of between three and five years.
Other intangible assetsOther intangible assets comprise of customer contracts and brand names acquired in a business combination and are amortised on a straight-line basis over the period of their expected benefit, being their finite life of between three and five years.
Impairment of non-financial assetsGoodwill and other intangible assets that have an indefinite useful life are not subject to amortisation and are tested annually for impairment, or more frequently if events or changes in circumstances indicate that they might be impaired. Other non-financial assets are reviewed for impairment whenever events or changes in circumstances indicate that the carrying amount may not be recoverable. An impairment loss is recognised for the amount by which the asset’s carrying amount exceeds its recoverable amount.
Recoverable amount is the higher of an asset’s fair value less costs of disposal and value-in-use. The value-in-use is the present value of the estimated future cash flows relating to the asset using a pre-tax discount rate specific to the asset or cash-generating unit to which the asset belongs. Assets that do not have independent cash flows are grouped together to form a cash-generating unit.
Trade and other payablesThese amounts represent liabilities for goods and services provided to the Group prior to the end of the financial year and which are unpaid. Due to their short-term nature they are measured at amortised cost and are not discounted. The amounts are unsecured and are usually paid within 30 days of recognition.
Grays eCommerce Group Limited32F
or p
erso
nal u
se o
nly
BorrowingsLoans and borrowings are initially recognised at the fair value of the consideration received, net of transaction costs. They are subsequently measured at amortised cost using the effective interest method.
Finance costsFinance costs attributable to qualifying assets are capitalised as part of the asset. All other finance costs are expensed in the period in which they are incurred.
ProvisionsProvisions are recognised when the Group has a present (legal or constructive) obligation as a result of a past event, it is probable the Group will be required to settle the obligation, and a reliable estimate can be made of the amount of the obligation. The amount recognised as a provision is the best estimate of the consideration required to settle the present obligation at the reporting date, taking into account the risks and uncertainties surrounding the obligation. If the time value of money is material, provisions are discounted using a current pre-tax rate specific to the liability. The increase in the provision resulting from the passage of time is recognised as a finance cost.
Employee benefits
Short-term employee benefitsLiabilities for wages and salaries, including non-monetary benefits, annual leave and long service leave expected to be settled within 12 months of the reporting date are measured at the amounts expected to be paid when the liabilities are settled.
Other long-term employee benefitsThe liability for annual leave and long service leave not expected to be settled within 12 months of the reporting date are measured as the present value of expected future payments to be made in respect of services provided by employees up to the reporting date using the projected unit credit method. Consideration is given to expected future wage and salary levels, experience of employee departures and periods of service. Expected future payments are discounted using market yields at the reporting date on corporate bonds with terms to maturity and currency that match, as closely as possible, the estimated future cash outflows.
Defined contribution superannuation expenseContributions to defined contribution superannuation plans are expensed in the period in which they are incurred.
Share-based paymentsEquity-settled share-based compensation benefits are provided to employees.
Equity-settled transactions are awards of performance rights, that are provided to employees in exchange for the rendering of services.
The cost of equity-settled transactions are measured at fair value on grant date. Fair value is independently determined using either the Binomial or Black-Scholes option pricing model that takes into account the exercise price, the term of the option, the impact of dilution, the share price at grant date and expected price volatility of the underlying share, the expected dividend yield and the risk free interest rate for the term of the option, together with non-vesting conditions that do not determine whether the Group receives the services that entitles the employees to receive payment. No account is taken of any other vesting conditions.
The cost of equity-settled transactions are recognised as an expense with a corresponding increase in equity over the vesting period. The cumulative charge to profit or loss is calculated based on the grant date fair value of the award, the best estimate of the number of awards that are likely to vest and the expired portion of the vesting period. The amount recognised in profit or loss for the period is the cumulative amount calculated at each reporting date less amounts already recognised in previous periods.
Market conditions are taken into consideration in determining fair value. Therefore any awards subject to market conditions are considered to vest irrespective of whether or not that market condition has been met, provided all other conditions are satisfied.
If equity-settled awards are modified, as a minimum, an expense is recognised as if the modification has not been made. An additional expense is recognised, over the remaining vesting period, for any modification that increases the total fair value of the share-based compensation benefit as at the date of modification.
If the non-vesting condition is within the control of the Group or employee, the failure to satisfy the condition is treated as a cancellation. If the condition is not within the control of the Group or employee and is not satisfied during the vesting period, any remaining expense for the award is recognised over the remaining vesting period, unless the award is forfeited.
If equity-settled awards are cancelled, it is treated as if it has vested on the date of cancellation, and any remaining expense is recognised immediately. If a new replacement award is substituted for the cancelled award, the cancelled and new award is treated as if they were a modification.
33Annual Report 2015F
or p
erso
nal u
se o
nly

CONTINUED
Notes to the Financial Statements
Note 2. Significant accounting policies (continued)
Fair value measurementWhen an asset or liability, financial or non-financial, is measured at fair value for recognition or disclosure purposes, the fair value is based on the price that would be received to sell an asset or paid to transfer a liability in an orderly transaction between market participants at the measurement date and assumes that the transaction will take place either in the principal market or in the absence of a principal market, in the most advantageous market.
Fair value is measured using the assumptions that market participants would use when pricing the asset or liability, assuming they act in their economic best interests. For non-financial assets, the fair value measurement is based on its highest and best use. Valuation techniques that are appropriate in the circumstances and for which sufficient data are available to measure fair value, are used, maximising the use of relevant observable inputs and minimising the use of unobservable inputs.
Issued capitalOrdinary shares are classified as equity.
Incremental costs directly attributable to the issue of new shares or options are shown in equity as a deduction, net of tax, from the proceeds.
DividendsDividends are recognised when declared during the financial year and no longer at the discretion of the Company.
Business combinationsThe acquisition method of accounting is used to account for business combinations regardless of whether equity instruments or other assets are acquired.
The consideration transferred is the sum of the acquisition-date fair values of the assets transferred, equity instruments issued or liabilities incurred by the acquirer to former owners of the acquiree and the amount of any non-controlling interest in the acquiree. For each business combination, the non-controlling interest in the acquiree is measured at either fair value or at the proportionate share of the acquiree’s identifiable net assets. All acquisition costs are expensed as incurred to profit or loss.
On the acquisition of a business, the Group assesses the financial assets acquired and liabilities assumed for appropriate classification and designation in accordance with the contractual terms, economic conditions, the Group’s operating or accounting policies and other pertinent conditions in existence at the acquisition-date.
Where the business combination is achieved in stages, the Group remeasures its previously held equity interest in the acquiree at the acquisition-date fair value and the difference between the fair value and the previous carrying amount is recognised in profit or loss.
Contingent consideration to be transferred by the acquirer is recognised at the acquisition-date fair value. Subsequent changes in the fair value of the contingent consideration classified as an asset or liability is recognised in profit or loss. Contingent consideration classified as equity is not remeasured and its subsequent settlement is accounted for within equity.
The difference between the acquisition-date fair value of assets acquired, liabilities assumed and any non-controlling interest in the acquiree and the fair value of the consideration transferred and the fair value of any pre-existing investment in the acquiree is recognised as goodwill. If the consideration transferred and the pre-existing fair value is less than the fair value of the identifiable net assets acquired, being a bargain purchase to the acquirer, the difference is recognised as a gain directly in profit or loss by the acquirer on the acquisition-date, but only after a reassessment of the identification and measurement of the net assets acquired, the non-controlling interest in the acquiree, if any, the consideration transferred and the acquirer’s previously held equity interest in the acquirer.
Business combinations are initially accounted for on a provisional basis. The acquirer retrospectively adjusts the provisional amounts recognised and also recognises additional assets or liabilities during the measurement period, based on new information obtained about the facts and circumstances that existed at the acquisition-date. The measurement period ends on either the earlier of (i) 12 months from the date of the acquisition or (ii) when the acquirer receives all the information possible to determine fair value.
Reverse acquisition - Grays eCommerce Group Limited & Grays (Aust) Holdings Pty LimitedOn 7 November 2014, Grays eCommerce Group Limited (formerly Mnemon Limited), acquired 100% of the issued securities of Grays (Aust) Holdings Pty Limited and its controlled entities (‘GAH’).
Grays eCommerce Group Limited34F
or p
erso
nal u
se o
nly

Under the principles of AASB 3 ‘Business Combinations’, GAH is the accounting acquirer in the business combination and therefore, the transaction has been accounted for as a reverse acquisition. Accordingly the financial statements are a continuation of GAH and as such:
— The assets and liabilities recognised and measured in the consolidated financial statements are at the carrying amounts of GAH rather than their fair value;
— The retained earnings and other equity balances recognised in the consolidated financial statements represent the retained earnings and other equity balances of GAH;
— The amount recognised for issued share capital includes the value of shares issued to the vendors of GAH. Such shares were measured at the fair value of the share capital of Grays eCommerce Group Limited on issue immediately prior to the reverse acquisition; and
— The comparatives presented are that of GAH.
Refer to Note 33 for further details of the business combinations effected during the current financial year.
Earnings per share
Basic earnings per shareBasic earnings per share is calculated by dividing the profit attributable to the owners of Grays eCommerce Group Limited, excluding any costs of servicing equity other than ordinary shares, by the weighted average number of ordinary shares outstanding during the financial year, adjusted for bonus elements in ordinary shares issued during the financial year.
Diluted earnings per shareDiluted earnings per share adjusts the figures used in the determination of basic earnings per share to take into account the after income tax effect of interest and other financing costs associated with dilutive potential ordinary shares and the weighted average number of shares assumed to have been issued for no consideration in relation to dilutive potential ordinary shares.
Goods and Services Tax (‘GST’) and other similar taxesRevenues, expenses and assets are recognised net of the amount of associated GST, unless the GST incurred is not recoverable from the tax authority. In this case it is recognised as part of the cost of the acquisition of the asset or as part of the expense.
Receivables and payables are stated inclusive of the amount of GST receivable or payable. The net amount of GST recoverable from, or payable to, the tax authority is included in other receivables or other payables in the statement of financial position.
Cash flows are presented on a gross basis. The GST components of cash flows arising from investing or financing activities which are recoverable from, or payable to the tax authority, are presented as operating cash flows.
Commitments and contingencies are disclosed net of the amount of GST recoverable from, or payable to, the tax authority.
Rounding of amountsThe Company is of a kind referred to in Class Order 98/100, issued by the Australian Securities and Investments Commission, relating to ‘rounding-off’. Amounts in this report have been rounded off in accordance with that Class Order to the nearest thousand dollars, or in certain cases, the nearest dollar.
New Accounting Standards and Interpretations not yet mandatory or early adoptedAustralian Accounting Standards and Interpretations that have recently been issued or amended but are not yet mandatory, have not been early adopted by the Group for the annual reporting period ended 30 June 2015. The Group’s assessment of the impact of these new or amended Accounting Standards and Interpretations, most relevant to the Group, are set out below.
AASB 9 Financial InstrumentsThis standard is applicable to annual reporting periods beginning on or after 1 January 2018. The standard replaces all previous versions of AASB 9 and completes the project to replace IAS 39 ‘Financial Instruments: Recognition and Measurement’. AASB 9 introduces new classification and measurement models for financial assets. New simpler hedge accounting requirements are intended to more closely align the accounting treatment with the risk management activities of the entity. New impairment requirements will use an ‘expected credit loss’ model to recognise an allowance. The Group entity will adopt this standard from 1 July 2018 but the impact of its adoption is yet to be assessed.
AASB 15 Revenue from Contracts with CustomersThis standard is currently applicable to annual reporting periods beginning on or after 1 January 2017. Exposure Draft (ED 263) ‘Effective Date of AASB 15’ proposes to defer the application date by one year to 1 January 2018. The standard provides a single standard for revenue recognition. The core principle of the standard is that an entity will recognise revenue to depict the transfer of promised goods or services to customers in an amount that reflects the consideration to which the entity expects to be entitled in exchange for those goods or services. The Group expects to adopt this standard from 1 July 2018 but the impact of its adoption is yet to be assessed.
35Annual Report 2015F
or p
erso
nal u
se o
nly

CONTINUED
Notes to the Financial Statements
Note 2. Significant accounting policies (continued)Other accounting standards issued are not considered to have a significant impact on the financial statements of the Group. These standards (and their operative dates) include:
— AASB 2014-1 Amendments to Australian Accounting Standards (Part D from 1 January 2016 and Part E from 1 January 2018);
— AASB 2014-4 Amendments to Australian Accounting Standards – Clarification of Acceptable Methods of Depreciation and Amortisation (from 1 January 2016);
— AASB 2014-5 Amendments to Australian Accounting Standards arising from AASB 15 (from 1 January 2017);
— AASB 2014-7 Amendments to Australian Accounting Standards arising from AASB 9 (December 2014) (from 1 January 2018);
— AASB 2014-8 Amendments to Australian Accounting Standards arising from AASB 9 (December 2014) – Application of AASB 9 (December 2009) and AASB 9 (December 2010) (from 1 January 2015);
— AASB 2014-9 Amendments to Australian Accounting Standards – Equity Method in Separate Financial Statements (from 1 January 2016);
— AASB 2015-1 Amendments to Australian Accounting Standards – Annual Improvements to Australian Accounting Standards 2012–2014 Cycle (from 1 January 2016);
— AASB 2015-2 Amendments to Australian Accounting Standards – Disclosure Initiative: Amendments to AASB 101 (from 1 January 2016); and
— AASB 2015-3 Amendments to Australian Accounting Standards arising from the Withdrawal of AASB 1031 Materiality (from 1 July 2015).
Note 3. Critical accounting judgements, estimates and assumptionsThe preparation of the financial statements requires management to make judgements, estimates and assumptions that affect the reported amounts in the financial statements. Management continually evaluates its judgements and estimates in relation to assets, liabilities, contingent liabilities, revenue and expenses. Management bases its judgements, estimates and assumptions on historical experience and on other various factors, including expectations of future events, management believes to be reasonable under the circumstances. The resulting accounting judgements and estimates will seldom equal the related actual results. The judgements, estimates and assumptions that have a significant risk of causing a material adjustment to the carrying amounts of assets and liabilities (refer to the respective notes) within the next financial year are discussed below.
Provision for impairment of inventoriesThe provision for impairment of inventories assessment requires a degree of estimation and judgement. The level of the provision is assessed by taking into account the recent sales experience, the ageing of inventories and other factors that affect inventory obsolescence.
Estimation of useful lives of assetsThe Group determines the estimated useful lives and related depreciation and amortisation charges for its property, plant and equipment and finite life intangible assets. The useful lives could change significantly as a result of technical innovations or some other event. The depreciation and amortisation charge will increase where the useful lives are less than previously estimated lives, or technically obsolete or non-strategic assets that have been abandoned or sold will be written off or written down.
Goodwill and other indefinite life intangible assetsThe Group tests annually, or more frequently if events or changes in circumstances indicate impairment, whether goodwill and other indefinite life intangible assets have suffered any impairment, in accordance with the accounting policy stated in Note 2. The recoverable amounts of cash-generating units have been determined based on value-in-use calculations. These calculations require the use of assumptions, including estimated discount rates based on the current cost of capital and growth rates of the estimated future cash flows.
Grays eCommerce Group Limited36F
or p
erso
nal u
se o
nly

Impairment of non-financial assets other than goodwill and other indefinite life intangible assetsThe Group assesses impairment of non-financial assets other than goodwill and other indefinite life intangible assets at each reporting date by evaluating conditions specific to the Group and to the particular asset that may lead to impairment. If an impairment trigger exists, the recoverable amount of the asset is determined. This involves fair value less costs of disposal or value-in-use calculations, which incorporate a number of key estimates and assumptions.
Income taxThe Group is subject to income taxes in the jurisdictions in which it operates. Significant judgement is required in determining the provision for income tax. There are many transactions and calculations undertaken during the ordinary course of business for which the ultimate tax determination is uncertain. The Group recognises liabilities for anticipated tax audit issues based on the Group’s current understanding of the tax law. Where the final tax outcome of these matters is different from the carrying amounts, such differences will impact the current and deferred tax provisions in the period in which such determination is made.
Recovery of deferred tax assetsDeferred tax assets are recognised for deductible temporary differences only if the Group considers it is probable that future taxable amounts will be available to utilise those temporary differences and losses.
Employee benefits provisionAs discussed in Note 2, the liability for employee benefits expected to be settled more than 12 months from the reporting date are recognised and measured at the present value of the estimated future cash flows to be made in respect of all employees at the reporting date. In determining the present value of the liability, estimates of attrition rates and pay increases through promotion and inflation have been taken into account.
Business combinationsAs discussed in Note 2, business combinations are initially accounted for on a provisional basis. The fair value of assets acquired, liabilities and contingent liabilities assumed are initially estimated by the Group taking into consideration all available information at the reporting date. Fair value adjustments on the finalisation of the business combination accounting is retrospective, where applicable, to the period the combination occurred and may have an impact on the assets and liabilities, depreciation and amortisation reported.
37Annual Report 2015F
or p
erso
nal u
se o
nly

CONTINUED
Notes to the Financial Statements
Note 4. Operating segments
Identification of reportable operating segmentsThe Group is organised into two operating segments:
— Business to business (‘B2B’); and — Business to consumer (‘B2C’).
These operating segments are based on the internal reports that are reviewed and used by the Board of Directors (who are identified as the Chief Operating Decision Makers (‘CODM’)) in assessing performance and in determining the allocation of resources. There is no aggregation of operating segments.
The CODM reviews EBITDA (earnings before interest, tax, depreciation, amortisation and other items which are determined to be outside of the control of the respective segments). The accounting policies adopted for internal reporting to the CODM are consistent with those adopted in the financial statements.
The information reported to the CODM is on at least a monthly basis.
Major customersNo single customer contributed 10% or more to the Group’s external revenue during the financial years ended 30 June 2015 and 30 June 2014.
Operating segment information
Consolidated - 2015
B2B $’000
B2C $’000
Intersegment eliminations/
unallocated $’000
Total $’000
Revenue
Revenue from external customers 56,162 136,060 231 192,453
Interest revenue 158 46 273 477
Total revenue 56,320 136,106 504 192,930
Adjusted earnings before interest, tax, depreciation and amortisation 12,958 (1,655) (4,431) 6,872
Depreciation and amortisation (2,632)
Interest revenue 477
Finance costs (88)
Acquisition and merger integration costs (6,491)
Loss before income tax benefit (1,862)
Income tax benefit 657
Loss after income tax benefit (1,205)
Grays eCommerce Group Limited38F
or p
erso
nal u
se o
nly

Consolidated - 2014
B2B $’000
B2C $’000
Intersegment eliminations/
unallocated $’000
Total $’000
Revenue
Revenue from external customers 42,322 103,780 203 146,305
Interest revenue 143 7 295 445
Total revenue 42,465 103,787 498 146,750
Adjusted earnings before interest, tax, depreciation and amortisation 7,422 (471) (3,281) 3,670
Depreciation and amortisation (3,712)
Impairment of assets (2,995)
Interest revenue 445
Finance costs (224)
Acquisition costs (1,766)
Loss before income tax benefit (4,582)
Income tax benefit 555
Loss after income tax benefit (4,027)
All assets and liabilities, including taxes are not allocated to the operating segments as they are managed on an overall group basis.
Note 5. RevenueConsolidated2015
$’0002014
$’000
Sales revenue
Sale of goods 97,440 63,497
Commissions 56,418 47,939
153,858 111,436
Other revenue
Interest 477 445
Recovery of expenses 32,836 30,459
Other revenue 5,759 4,410
39,072 35,314
Revenue 192,930 146,750
39Annual Report 2015F
or p
erso
nal u
se o
nly
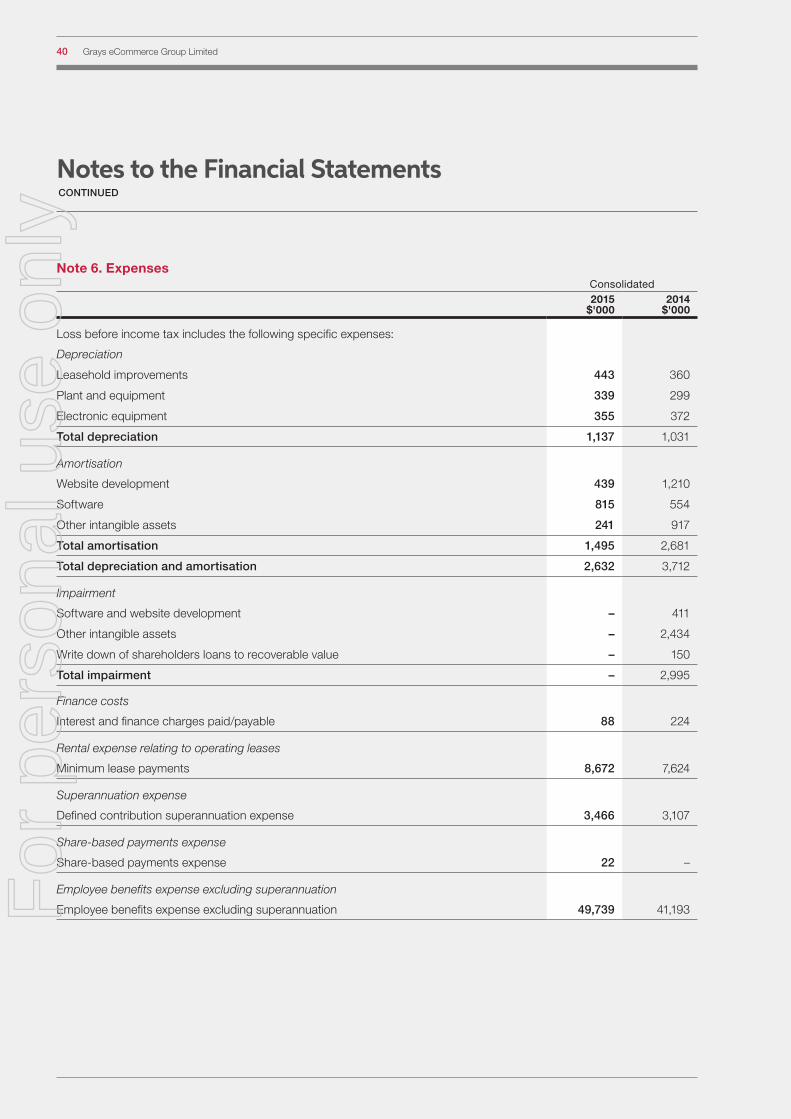
Note 6. ExpensesConsolidated2015
$'0002014
$'000
Loss before income tax includes the following specific expenses:
Depreciation
Leasehold improvements 443 360
Plant and equipment 339 299
Electronic equipment 355 372
Total depreciation 1,137 1,031
Amortisation
Website development 439 1,210
Software 815 554
Other intangible assets 241 917
Total amortisation 1,495 2,681
Total depreciation and amortisation 2,632 3,712
Impairment
Software and website development – 411
Other intangible assets – 2,434
Write down of shareholders loans to recoverable value – 150
Total impairment – 2,995
Finance costs
Interest and finance charges paid/payable 88 224
Rental expense relating to operating leases
Minimum lease payments 8,672 7,624
Superannuation expense
Defined contribution superannuation expense 3,466 3,107
Share-based payments expense
Share-based payments expense 22 –
Employee benefits expense excluding superannuation
Employee benefits expense excluding superannuation 49,739 41,193
CONTINUED
Notes to the Financial Statements
Grays eCommerce Group Limited40F
or p
erso
nal u
se o
nly
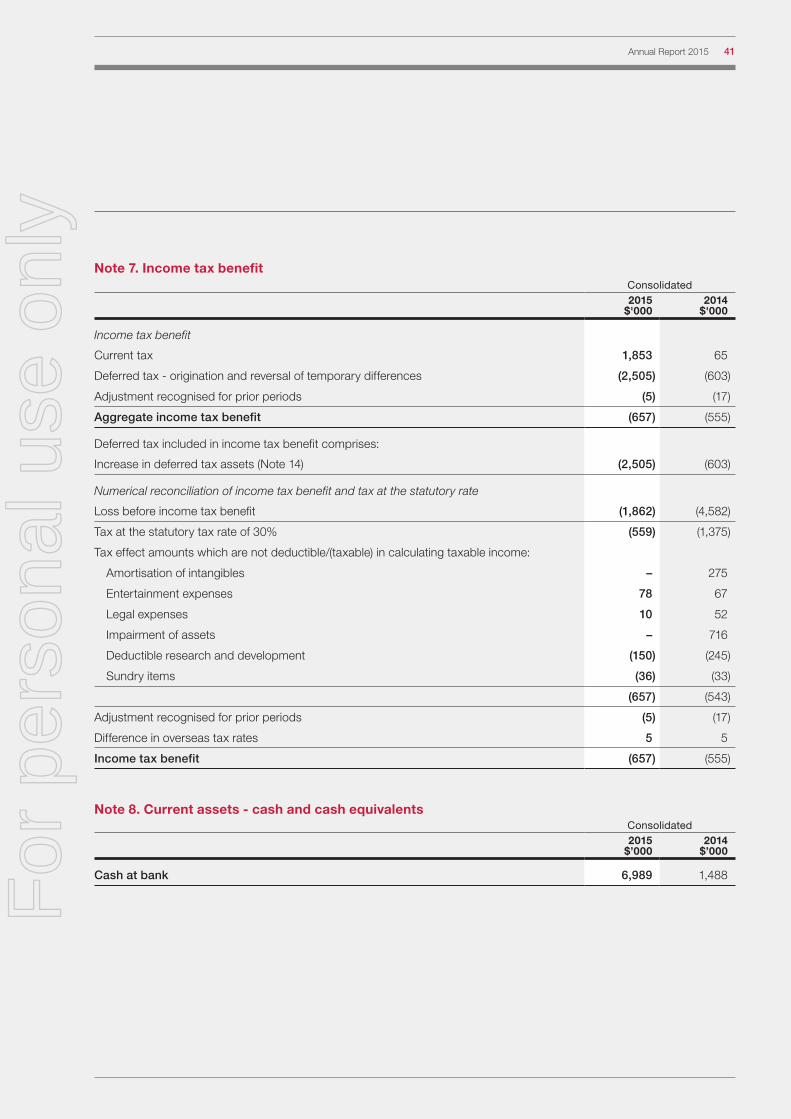
Note 7. Income tax benefitConsolidated2015
$'0002014
$'000
Income tax benefit
Current tax 1,853 65
Deferred tax - origination and reversal of temporary differences (2,505) (603)
Adjustment recognised for prior periods (5) (17)
Aggregate income tax benefit (657) (555)
Deferred tax included in income tax benefit comprises:
Increase in deferred tax assets (Note 14) (2,505) (603)
Numerical reconciliation of income tax benefit and tax at the statutory rate
Loss before income tax benefit (1,862) (4,582)
Tax at the statutory tax rate of 30% (559) (1,375)
Tax effect amounts which are not deductible/(taxable) in calculating taxable income:
Amortisation of intangibles – 275
Entertainment expenses 78 67
Legal expenses 10 52
Impairment of assets – 716
Deductible research and development (150) (245)
Sundry items (36) (33)
(657) (543)
Adjustment recognised for prior periods (5) (17)
Difference in overseas tax rates 5 5
Income tax benefit (657) (555)
Note 8. Current assets - cash and cash equivalentsConsolidated2015
$’0002014
$’000
Cash at bank 6,989 1,488
41Annual Report 2015F
or p
erso
nal u
se o
nly
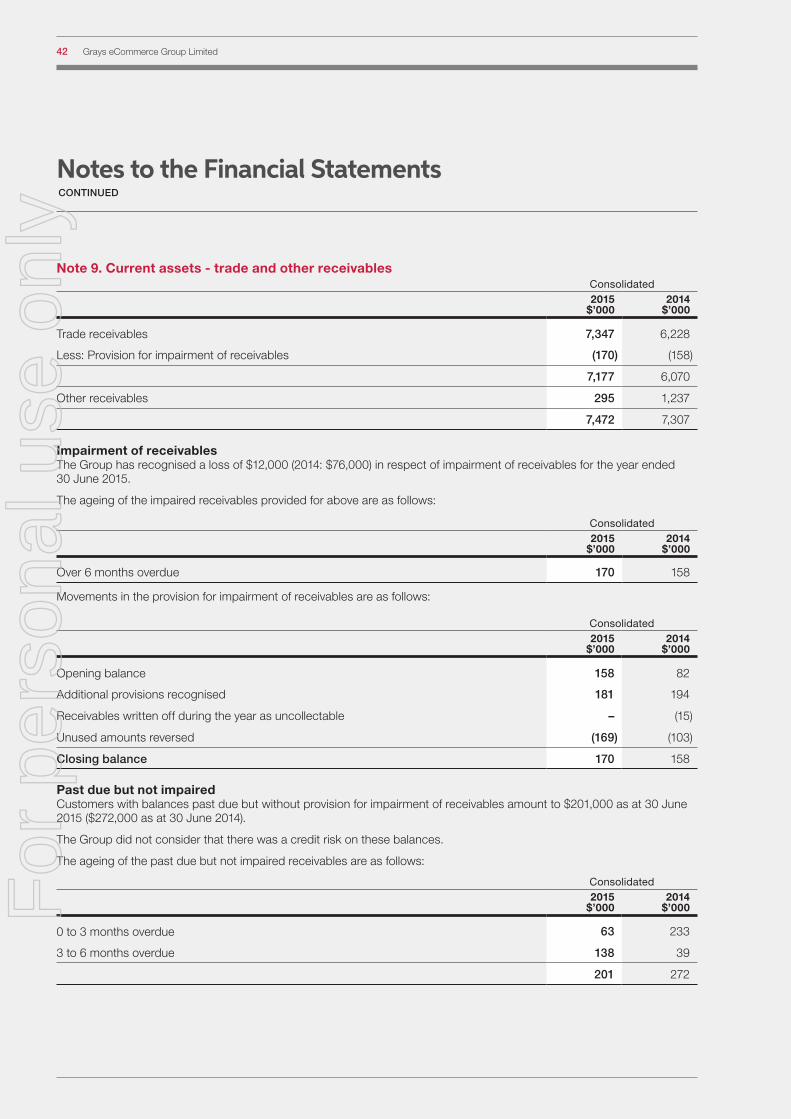
Note 9. Current assets - trade and other receivablesConsolidated2015
$’0002014
$’000
Trade receivables 7,347 6,228
Less: Provision for impairment of receivables (170) (158)
7,177 6,070
Other receivables 295 1,237
7,472 7,307
Impairment of receivablesThe Group has recognised a loss of $12,000 (2014: $76,000) in respect of impairment of receivables for the year ended 30 June 2015.
The ageing of the impaired receivables provided for above are as follows:
Consolidated2015
$’0002014
$’000
Over 6 months overdue 170 158
Movements in the provision for impairment of receivables are as follows:
Consolidated2015
$’0002014
$’000
Opening balance 158 82
Additional provisions recognised 181 194
Receivables written off during the year as uncollectable – (15)
Unused amounts reversed (169) (103)
Closing balance 170 158
Past due but not impairedCustomers with balances past due but without provision for impairment of receivables amount to $201,000 as at 30 June 2015 ($272,000 as at 30 June 2014).
The Group did not consider that there was a credit risk on these balances.
The ageing of the past due but not impaired receivables are as follows:
Consolidated2015
$’0002014
$’000
0 to 3 months overdue 63 233
3 to 6 months overdue 138 39
201 272
CONTINUED
Notes to the Financial Statements
Grays eCommerce Group Limited42F
or p
erso
nal u
se o
nly
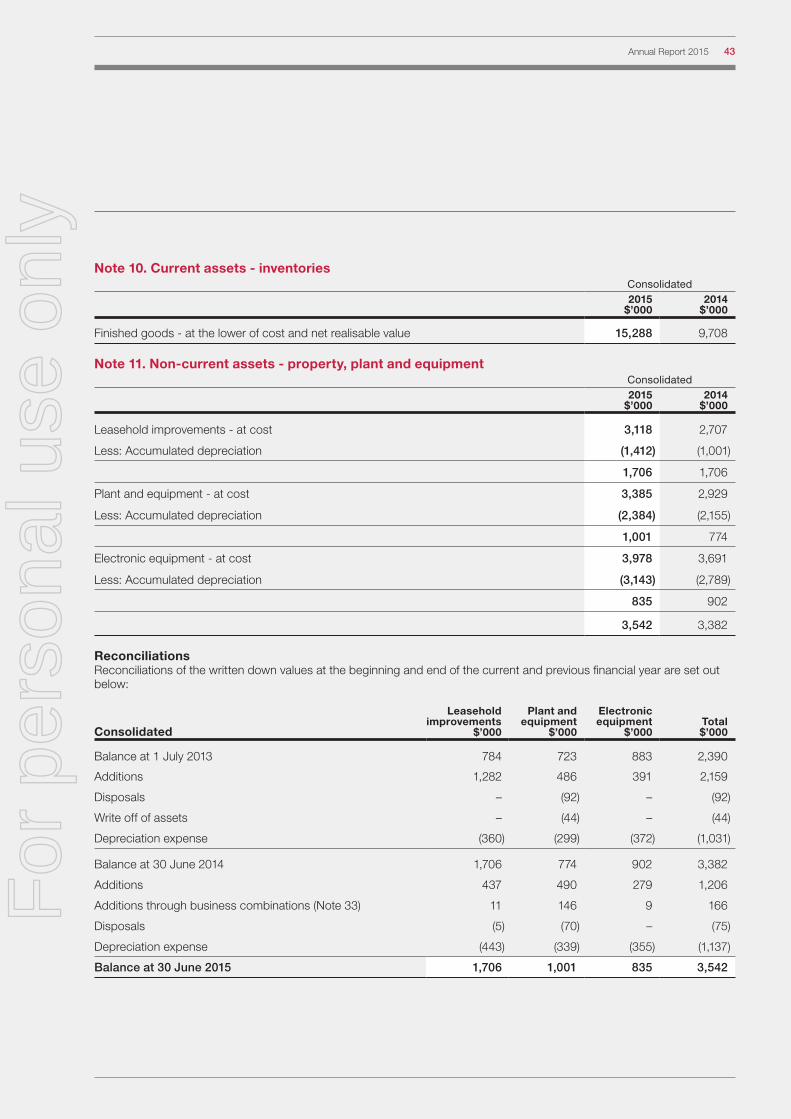
Note 10. Current assets - inventoriesConsolidated2015
$’0002014
$’000
Finished goods - at the lower of cost and net realisable value 15,288 9,708
Note 11. Non-current assets - property, plant and equipmentConsolidated2015
$’0002014
$’000
Leasehold improvements - at cost 3,118 2,707
Less: Accumulated depreciation (1,412) (1,001)
1,706 1,706
Plant and equipment - at cost 3,385 2,929
Less: Accumulated depreciation (2,384) (2,155)
1,001 774
Electronic equipment - at cost 3,978 3,691
Less: Accumulated depreciation (3,143) (2,789)
835 902
3,542 3,382
ReconciliationsReconciliations of the written down values at the beginning and end of the current and previous financial year are set out below:
Consolidated
Leasehold improvements
$’000
Plant and equipment
$’000
Electronic equipment
$’000Total $’000
Balance at 1 July 2013 784 723 883 2,390
Additions 1,282 486 391 2,159
Disposals – (92) – (92)
Write off of assets – (44) – (44)
Depreciation expense (360) (299) (372) (1,031)
Balance at 30 June 2014 1,706 774 902 3,382
Additions 437 490 279 1,206
Additions through business combinations (Note 33) 11 146 9 166
Disposals (5) (70) – (75)
Depreciation expense (443) (339) (355) (1,137)
Balance at 30 June 2015 1,706 1,001 835 3,542
43Annual Report 2015F
or p
erso
nal u
se o
nly

Note 12. Non-current assets - intangiblesConsolidated2015
$’0002014
$’000
Goodwill - at cost 26,891 4,995
Website development - at cost 5,683 5,270
Less: Accumulated amortisation (4,905) (4,466)
778 804
Software - at cost 4,750 3,712
Less: Accumulated amortisation (3,566) (2,751)
1,184 961
Other intangible assets - at cost 1,864 120
Less: Accumulated amortisation (246) (5)
1,618 115
30,471 6,875
ReconciliationsReconciliations of the written down values at the beginning and end of the current and previous financial year are set out below:
ConsolidatedGoodwill
$’000
Website development
$’000Software
$’000
Other intangible
assets $’000
Total $’000
Balance at 1 July 2013 4,995 2,265 811 3,332 11,403
Additions – 160 704 134 998
Impairment of assets – (411) – (2,434) (2,845)
Amortisation expense – (1,210) (554) (917) (2,681)
Balance at 30 June 2014 4,995 804 961 115 6,875
Additions – 413 818 154 1,385
Additions through business combinations (Note 33) 21,896 – 220 1,594 23,710
Disposals – – – (4) (4)
Amortisation expense – (439) (815) (241) (1,495)
Balance at 30 June 2015 26,891 778 1,184 1,618 30,471
CONTINUED
Notes to the Financial Statements
Grays eCommerce Group Limited44F
or p
erso
nal u
se o
nly

Impairment testingFor the purpose of impairment testing, goodwill is allocated to the Group’s cash generating units (‘CGUs’) that are expected to benefit from the synergies of the business combination. A CGU level summary of goodwill allocation is as follows:
Consolidated2015
$’0002014
$’000
B2B 4,995 4,995
B2C 21,896 –
26,891 4,995
Key assumptions used for value-in-use calculations:The Group tests whether goodwill has suffered any impairment on at least an annual basis. The recoverable amount of a CGU is determined based on value-in-use calculations which require the use of assumptions. The calculations use cash flow projections based on financial budgets approved by the Board of Directors covering a one year period. Estimated growth rates and other reasonable assumptions are utilised to further calculate cash flows out to five years from balance date. Cash flows beyond the five year period are extrapolated into perpetuity using estimated terminal growth rates shown below. The B2B CGU terminal growth rate is approximately in line with historical Australian inflationary rates. The B2C CGU terminal growth rate does not exceed the long term average growth rate for the industries in which it operates.
The following table sets out the key assumptions used for value-in-use calculations:
Long term growth rate B2B - 3% (2014: 3%) B2C - 3% (2014: N/A)
Pre-tax discount rate B2B - 15.0% (2014: 15.0%) B2C - 14.3% (2014: N/A)
Post-tax discount rate B2B - 11.3% (2014: 11.3%) B2C - 11.3% (2014: N/A)
Post-tax discount rates used in performing the value-in-use calculations for each CGU are disclosed above. The discount rates reflect specific risks relating to the CGU’s and the industries in which they operate.
No impairment charge:Based on the value-in-use calculation methodology and assumptions stated above, the carrying amount of each CGU at balance date does not exceed its recoverable amount.
Impact of possible changes in assumptions:A reasonable possible change in the key assumptions above would not cause the carrying amount of either CGU to exceed its recoverable amount.
Note 13. Non-current assets - other financial assetsConsolidated2015
$’0002014
$’000
Shareholders loans – 5,606
Less: Provision for impairment – (150)
– 5,456
Shareholder loans related to the shareholders of Grays (Aust) Holdings Pty Limited and were repaid prior to the reverse acquisition of Grays eCommerce Group Limited (formerly Mnemon Ltd) on 7 November 2014.
45Annual Report 2015F
or p
erso
nal u
se o
nly

Note 14. Non-current assets - deferred taxConsolidated2015
$’0002014
$’000
Deferred tax asset comprises temporary differences attributable to:
Amounts recognised in profit or loss:
Tax losses 1,481 103
Impairment of receivables 50 48
Property, plant and equipment 225 136
Employee benefits 1,486 1,165
Stock revaluation 1,011 –
Intangible assets – customer database and software (464) –
Accrued expenses 231 257
Other provisions 1,130 1,100
Acquisition and merger integration costs 1,135 95
Deferred tax asset 6,285 2,904
Movements:
Opening balance 2,904 2,301
Credited to profit or loss (Note 7) 2,505 603
Additions through business combinations (Note 33) 876 –
Closing balance 6,285 2,904
Note 15. Current liabilities - trade and other payablesConsolidated2015
$’0002014
$’000
Trade payables 12,922 11,499
Other payables and accruals 12,132 8,500
25,054 19,999
Refer to Note 25 for further information on financial instruments.
Note 16. Current liabilities - income taxConsolidated2015
$’0002014
$’000
Provision for income tax 1,107 – Note 17. Current liabilities - provisions
Consolidated2015
$’0002014
$’000
Employee benefits 6,243 4,092
CONTINUED
Notes to the Financial Statements
Grays eCommerce Group Limited46F
or p
erso
nal u
se o
nly

Note 18. Current liabilities - interest bearing loans and borrowingsConsolidated2015
$’0002014
$’000
Bank loans – 4,500
Refer to Note 19 for further information on assets pledged as security and financing arrangements.
Refer to Note 25 for further information on financial instruments.
Note 19. Non-current liabilities - borrowings
Total secured liabilitiesThe total secured liabilities (current and non-current) are as follows:
Consolidated2015
$’0002014
$’000
Bank loans – 4,500
Assets pledged as securityThe bank loans are secured by guarantees over the Group’s assets.
Financing arrangementsThe following financing arrangements were in place at reporting date:
Consolidated2015
$’0002014
$’000
Total facilities
Bank overdraft 2,000 –
Bank loans 3,000 4,500
Guarantee facility 5,000 3,200
10,000 7,700
Used at the reporting date
Bank overdraft – –
Bank loans – 4,500
Guarantee facility 4,325 3,166
4,325 7,666
Unused at the reporting date
Bank overdraft 2,000 –
Bank loans 3,000 –
Guarantee facility 675 34
5,675 34
47Annual Report 2015F
or p
erso
nal u
se o
nly

Note 20. Non-current liabilities - provisionsConsolidated2015
$’0002014
$’000
Employee benefits 646 604
Other 517 486
1,163 1,090
Movements in provisionsMovements in each class of provision during the current financial year, other than employee benefits, are set out below:
Consolidated - 2015Other $’000
Carrying amount at the start of the year 486
Additional provisions recognised 127
Additions through business combinations (Note 33) 481
Payments (481)
Unused amounts reversed (96)
Carrying amount at the end of the year 517
Note 21. Equity - issued capitalConsolidated
2015 Shares
2014 Shares
2015 $’000
2014 $’000
Ordinary shares - fully paid 92,849,622 57,882,550 44,627 9,292
As a result of the reverse acquisition, the number of shares are based on Grays (Aust) Holdings Pty Limited’s shares (GAH) in issue, converted at the exchange ratio of 638 shares to 1.
CONTINUED
Notes to the Financial Statements
Grays eCommerce Group Limited48F
or p
erso
nal u
se o
nly
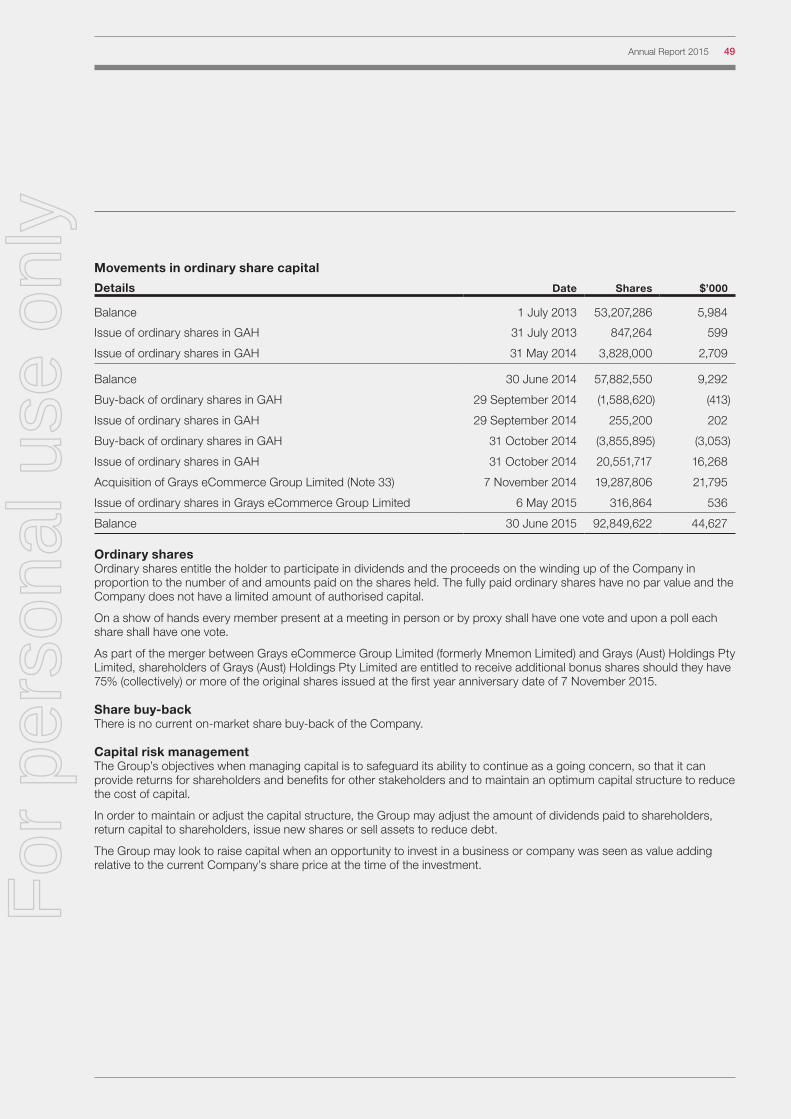
Movements in ordinary share capital
Details Date Shares $’000
Balance 1 July 2013 53,207,286 5,984
Issue of ordinary shares in GAH 31 July 2013 847,264 599
Issue of ordinary shares in GAH 31 May 2014 3,828,000 2,709
Balance 30 June 2014 57,882,550 9,292
Buy-back of ordinary shares in GAH 29 September 2014 (1,588,620) (413)
Issue of ordinary shares in GAH 29 September 2014 255,200 202
Buy-back of ordinary shares in GAH 31 October 2014 (3,855,895) (3,053)
Issue of ordinary shares in GAH 31 October 2014 20,551,717 16,268
Acquisition of Grays eCommerce Group Limited (Note 33) 7 November 2014 19,287,806 21,795
Issue of ordinary shares in Grays eCommerce Group Limited 6 May 2015 316,864 536
Balance 30 June 2015 92,849,622 44,627
Ordinary sharesOrdinary shares entitle the holder to participate in dividends and the proceeds on the winding up of the Company in proportion to the number of and amounts paid on the shares held. The fully paid ordinary shares have no par value and the Company does not have a limited amount of authorised capital.
On a show of hands every member present at a meeting in person or by proxy shall have one vote and upon a poll each share shall have one vote.
As part of the merger between Grays eCommerce Group Limited (formerly Mnemon Limited) and Grays (Aust) Holdings Pty Limited, shareholders of Grays (Aust) Holdings Pty Limited are entitled to receive additional bonus shares should they have 75% (collectively) or more of the original shares issued at the first year anniversary date of 7 November 2015.
Share buy-backThere is no current on-market share buy-back of the Company.
Capital risk managementThe Group’s objectives when managing capital is to safeguard its ability to continue as a going concern, so that it can provide returns for shareholders and benefits for other stakeholders and to maintain an optimum capital structure to reduce the cost of capital.
In order to maintain or adjust the capital structure, the Group may adjust the amount of dividends paid to shareholders, return capital to shareholders, issue new shares or sell assets to reduce debt.
The Group may look to raise capital when an opportunity to invest in a business or company was seen as value adding relative to the current Company’s share price at the time of the investment.
49Annual Report 2015F
or p
erso
nal u
se o
nly

Note 22. Equity - reservesConsolidated2015
$’0002014
$’000
Foreign currency translation reserve (6) (5)
Share-based payments reserve 22 –
Share equity reserve (7,140) (7,140)
(7,124) (7,145)
Foreign currency translation reserveThe reserve is used to recognise exchange differences arising from the translation of the financial statements of foreign operations to Australian dollars. It is also used to recognise gains and losses on hedges of the net investments in foreign operations.
Share-based payments reserveThe reserve is used to recognise the value of equity benefits provided to employees and directors as part of their remuneration, and other parties as part of their compensation for services.
Share equity reserveThe share equity reserve is a result of accounting for an historical transaction in accordance with AASB 3 ‘Business Combinations’.
Movements in reservesMovements in each class of reserve during the current and previous financial year are set out below:
Consolidated
Foreign currency
translation $’000
Share-based payments
$’000
Share equity $’000
Total $’000
Balance at 1 July 2013 (28) – (7,140) (7,168)
Foreign currency translation 23 – – 23
Balance at 30 June 2014 (5) – (7,140) (7,145)
Foreign currency translation (1) – – (1)
Share-based payments – 22 – 22
Balance at 30 June 2015 (6) 22 (7,140) (7,124)
Note 23. Equity - retained profitsConsolidated2015
$’0002014
$’000
Retained profits at the beginning of the financial year 6,325 10,352
Loss after income tax benefit for the year (1,205) (4,027)
Dividends paid (Note 24) (3,594) –
Retained profits at the end of the financial year 1,526 6,325
CONTINUED
Notes to the Financial Statements
Grays eCommerce Group Limited50F
or p
erso
nal u
se o
nly

Note 24. Equity - dividends
DividendsNo dividends have been paid during the year to the shareholders of Grays eCommerce Group Limited (formerly Mnemon Limited), However, prior to the reverse acquisition transaction that occurred on 7 November 2014 Grays (Aust) Holdings Pty Limited, which is the accounting acquirer of the Group, paid a fully franked special dividend totalling $3,594,000 on 22 September 2014 relating to a buy-back of that company’s share capital.
There were no other dividends paid, recommended or declared during the current or previous financial year.
Franking creditsConsolidated2015
$’0002014
$’000
Franking credits available for subsequent financial years based on a tax rate of 30% 3,925 4,322
The above amounts represent the balance of the franking account as at the end of the financial year, adjusted for:
— franking credits that will arise from the payment of the amount of the provision for income tax at the reporting date — franking debits that will arise from the payment of dividends recognised as a liability at the reporting date — franking credits that will arise from the receipt of dividends recognised as receivables at the reporting date
Note 25. Financial instruments
Financial risk management objectivesThe Group’s activities expose it to a variety of financial risks: market risk (including foreign currency risk, price risk and interest rate risk), credit risk and liquidity risk. The Group’s overall risk management program focuses on the unpredictability of financial markets and seeks to minimise potential adverse effects on the financial performance of the Group. The Group may use derivative financial instruments such as forward foreign exchange contracts to hedge certain risk exposures. Derivatives are exclusively used for hedging purposes, i.e. not as trading or other speculative instruments. The Group uses different methods to measure different types of risk to which it is exposed. These methods include sensitivity analysis in the case of interest rate, foreign exchange and other price risks and ageing analysis for credit risk.
Market risk
Foreign currency riskThe Group is not exposed to any significant foreign currency risk.
Price riskThe Group is not exposed to any significant price risk.
Interest rate riskThe Group’s main interest rate risk arises from long-term borrowings. Borrowings issued at variable rates expose the Group to interest rate risk. Borrowings issued at fixed rates expose the Group to fair value interest rate risk.
As at the reporting date, the Group had the following variable rate borrowings and interest rate swap contracts outstanding:
2015 2014
Consolidated
Weighted average
interest rate %
Balance $’000
Weighted average
interest rate %
Balance $’000
Bank overdraft and bank loans –% – 2.81% 4,500
Net exposure to cash flow interest rate risk – 4,500
51Annual Report 2015F
or p
erso
nal u
se o
nly
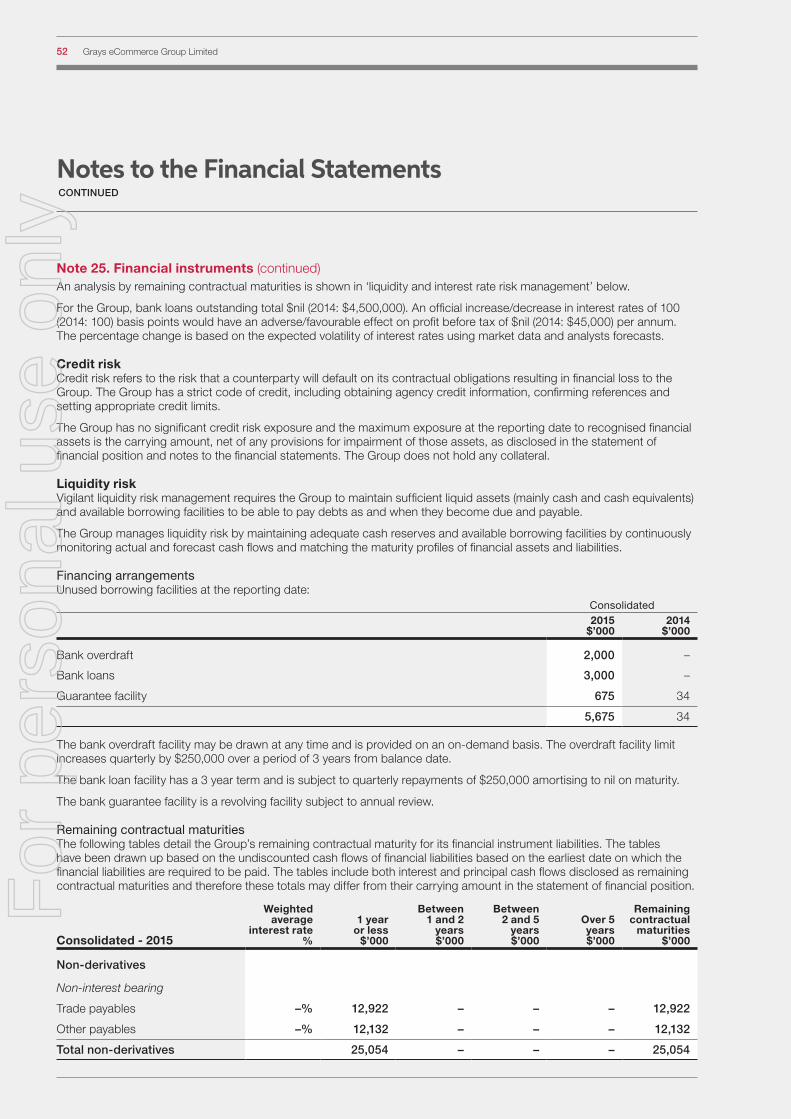
Note 25. Financial instruments (continued)An analysis by remaining contractual maturities is shown in ‘liquidity and interest rate risk management’ below.
For the Group, bank loans outstanding total $nil (2014: $4,500,000). An official increase/decrease in interest rates of 100 (2014: 100) basis points would have an adverse/favourable effect on profit before tax of $nil (2014: $45,000) per annum. The percentage change is based on the expected volatility of interest rates using market data and analysts forecasts.
Credit riskCredit risk refers to the risk that a counterparty will default on its contractual obligations resulting in financial loss to the Group. The Group has a strict code of credit, including obtaining agency credit information, confirming references and setting appropriate credit limits.
The Group has no significant credit risk exposure and the maximum exposure at the reporting date to recognised financial assets is the carrying amount, net of any provisions for impairment of those assets, as disclosed in the statement of financial position and notes to the financial statements. The Group does not hold any collateral.
Liquidity riskVigilant liquidity risk management requires the Group to maintain sufficient liquid assets (mainly cash and cash equivalents) and available borrowing facilities to be able to pay debts as and when they become due and payable.
The Group manages liquidity risk by maintaining adequate cash reserves and available borrowing facilities by continuously monitoring actual and forecast cash flows and matching the maturity profiles of financial assets and liabilities.
Financing arrangementsUnused borrowing facilities at the reporting date:
Consolidated2015
$’0002014
$’000
Bank overdraft 2,000 –
Bank loans 3,000 –
Guarantee facility 675 34
5,675 34
The bank overdraft facility may be drawn at any time and is provided on an on-demand basis. The overdraft facility limit increases quarterly by $250,000 over a period of 3 years from balance date.
The bank loan facility has a 3 year term and is subject to quarterly repayments of $250,000 amortising to nil on maturity.
The bank guarantee facility is a revolving facility subject to annual review.
Remaining contractual maturitiesThe following tables detail the Group’s remaining contractual maturity for its financial instrument liabilities. The tables have been drawn up based on the undiscounted cash flows of financial liabilities based on the earliest date on which the financial liabilities are required to be paid. The tables include both interest and principal cash flows disclosed as remaining contractual maturities and therefore these totals may differ from their carrying amount in the statement of financial position.
Consolidated - 2015
Weighted average
interest rate %
1 year or less
$’000
Between 1 and 2
years $’000
Between 2 and 5
years $’000
Over 5 years $’000
Remaining contractual
maturities $’000
Non-derivatives
Non-interest bearing
Trade payables –% 12,922 – – – 12,922
Other payables –% 12,132 – – – 12,132
Total non-derivatives 25,054 – – – 25,054
CONTINUED
Notes to the Financial Statements
Grays eCommerce Group Limited52F
or p
erso
nal u
se o
nly

Consolidated - 2014
Weighted average
interest rate %
1 year or less
$’000
Between 1 and 2
years $’000
Between 2 and 5
years $’000
Over 5 years $’000
Remaining contractual
maturities $’000
Non-derivatives
Non-interest bearing
Trade payables –% 11,499 – – – 11,499
Other payables –% 8,500 – – – 8,500
Interest-bearing - variable
Bank loans 2.72% 4,500 – – – 4,500
Total non-derivatives 24,499 – – – 24,499
The cash flows in the maturity analysis above are not expected to occur significantly earlier than contractually disclosed above.
Note 26. Fair value measurementUnless otherwise stated, the carrying amounts of financial instruments reflect their fair value. The carrying amounts of trade receivables and trade payables are assumed to approximate their fair values due to their short-term nature. The fair value of financial liabilities is estimated by discounting the remaining contractual maturities at the current market interest rate that is available for similar financial instruments.
Note 27. Key management personnel disclosures
CompensationThe aggregate compensation made to directors and other members of key management personnel of the Group is set out below:
Consolidated2015
$2014
$
Short-term employee benefits 2,682,401 1,769,875
Post-employment benefits 197,981 164,440
Long-term benefits 28,690 33,247
Termination benefits 75,651 –
Share-based payments 21,338 –
3,006,061 1,967,562
53Annual Report 2015F
or p
erso
nal u
se o
nly
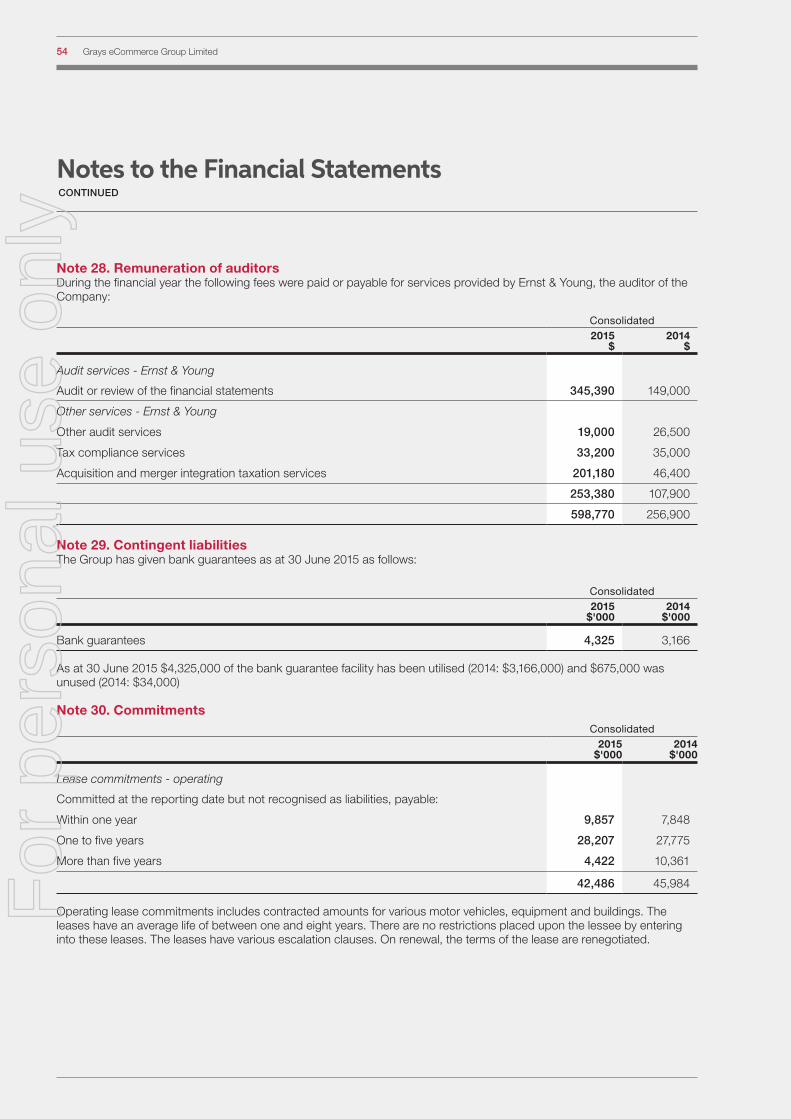
Note 28. Remuneration of auditorsDuring the financial year the following fees were paid or payable for services provided by Ernst & Young, the auditor of the Company:
Consolidated2015
$2014
$
Audit services - Ernst & Young
Audit or review of the financial statements 345,390 149,000
Other services - Ernst & Young
Other audit services 19,000 26,500
Tax compliance services 33,200 35,000
Acquisition and merger integration taxation services 201,180 46,400
253,380 107,900
598,770 256,900
Note 29. Contingent liabilitiesThe Group has given bank guarantees as at 30 June 2015 as follows:
Consolidated2015
$'0002014
$'000
Bank guarantees 4,325 3,166
As at 30 June 2015 $4,325,000 of the bank guarantee facility has been utilised (2014: $3,166,000) and $675,000 was unused (2014: $34,000)
Note 30. CommitmentsConsolidated
2015 $'000
2014 $'000
Lease commitments - operating
Committed at the reporting date but not recognised as liabilities, payable:
Within one year 9,857 7,848
One to five years 28,207 27,775
More than five years 4,422 10,361
42,486 45,984
Operating lease commitments includes contracted amounts for various motor vehicles, equipment and buildings. The leases have an average life of between one and eight years. There are no restrictions placed upon the lessee by entering into these leases. The leases have various escalation clauses. On renewal, the terms of the lease are renegotiated.
Notes to the Financial StatementsCONTINUED
Grays eCommerce Group Limited54F
or p
erso
nal u
se o
nly

Note 31. Related party transactions
Parent entityGrays eCommerce Group Limited is the parent entity.
SubsidiariesInterests in subsidiaries are set out in Note 34.
Key management personnelDisclosures relating to key management personnel are set out in Note 27 and the remuneration report in the directors' report.
Transactions with related partiesLoans to Directors of Grays (Aust) Holdings Pty Limited at the previous reporting date of $2,995,478 were repaid in full to that company prior to the 7 November 2014 reverse acquisition of Grays eCommerce Group Limited (formerly Mnemon Ltd).
Receivable from and payable to related partiesThere were no trade receivables from or trade payables to related parties at the current and previous reporting date.
Loans to/from related partiesAll loans with related parties at the previous reporting date were repaid in full as described above. There were no loans to or from related parties at the current reporting date.
Note 32. Parent entity informationSet out below is the supplementary information about the parent entity.
Statement of profit or loss and other comprehensive incomeParent
2015 $'000
2014 $'000
Loss after income tax (2,247) (669)
Total comprehensive income (2,247) 81
Statement of financial positionParent
2015 $'000
2014 $'000
Total current assets 30 4,358
Total assets 103,731 21,601
Total current liabilities 99 163
Total liabilities 99 163
Equity
Issued capital 110,128 25,687
Share equity reserve 259 259
Accumulated losses (6,755) (4,508)
Total equity 103,632 21,438
Guarantees entered into by the parent entity in relation to the debts of its subsidiariesThe parent entity is a party to a deed of cross guarantee (refer Note 35) which was formed during the financial year, under which it guarantees the debts of its subsidiaries as at 30 June 2015.
55Annual Report 2015F
or p
erso
nal u
se o
nly
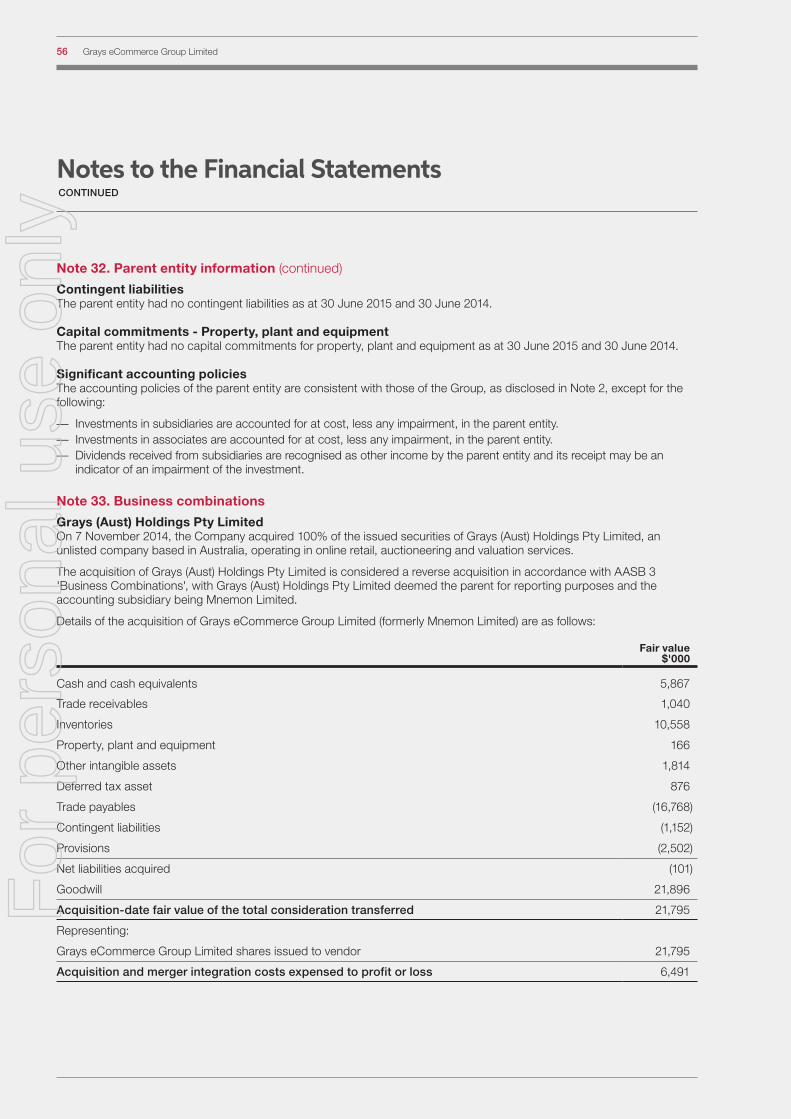
Note 32. Parent entity information (continued)
Contingent liabilitiesThe parent entity had no contingent liabilities as at 30 June 2015 and 30 June 2014.
Capital commitments - Property, plant and equipmentThe parent entity had no capital commitments for property, plant and equipment as at 30 June 2015 and 30 June 2014.
Significant accounting policiesThe accounting policies of the parent entity are consistent with those of the Group, as disclosed in Note 2, except for the following:
— Investments in subsidiaries are accounted for at cost, less any impairment, in the parent entity. — Investments in associates are accounted for at cost, less any impairment, in the parent entity. — Dividends received from subsidiaries are recognised as other income by the parent entity and its receipt may be an
indicator of an impairment of the investment.
Note 33. Business combinations
Grays (Aust) Holdings Pty LimitedOn 7 November 2014, the Company acquired 100% of the issued securities of Grays (Aust) Holdings Pty Limited, an unlisted company based in Australia, operating in online retail, auctioneering and valuation services.
The acquisition of Grays (Aust) Holdings Pty Limited is considered a reverse acquisition in accordance with AASB 3 'Business Combinations', with Grays (Aust) Holdings Pty Limited deemed the parent for reporting purposes and the accounting subsidiary being Mnemon Limited.
Details of the acquisition of Grays eCommerce Group Limited (formerly Mnemon Limited) are as follows:
Fair value $'000
Cash and cash equivalents 5,867
Trade receivables 1,040
Inventories 10,558
Property, plant and equipment 166
Other intangible assets 1,814
Deferred tax asset 876
Trade payables (16,768)
Contingent liabilities (1,152)
Provisions (2,502)
Net liabilities acquired (101)
Goodwill 21,896
Acquisition-date fair value of the total consideration transferred 21,795
Representing:
Grays eCommerce Group Limited shares issued to vendor 21,795
Acquisition and merger integration costs expensed to profit or loss 6,491
Notes to the Financial StatementsCONTINUED
Grays eCommerce Group Limited56F
or p
erso
nal u
se o
nly

Fair value $'000
Cash used to acquire business, net of cash acquired:
Acquisition-date fair value of the total consideration transferred 21,795
Less: cash and cash equivalents (5,867)
Less: scrip-for-scrip issued by as part of consideration (21,795)
Net cash received (5,867)
From the date of acquisition, Grays eCommerce Group Limited (formerly Mnemon Limited) and its subsidiaries have contributed approximately $44,813,000 of revenue and a loss before tax of $1,775,000 (including acquisition and merger integration costs of $798,000 and depreciation and amortisation of $98,000) to the loss from the continuing operations of the Group.
If the combination had taken place at the beginning of the financial year (1 July 2014), revenue from continuing operations would have been approximately $18,000,000 higher and loss from continuing operations for the year would have been approximately $500,000 higher.
The goodwill is attributed to the expected synergies and other benefits combining the activities of Mnemon Limited to the Group. A provisional allocation of intangibles has been undertaken with the remainder allocated to goodwill. This is still provisional as at 30 June 2015 and will be finalised as part of the 31 December 2015 half year report.
Note 34. Interests in subsidiariesThe consolidated financial statements incorporate the assets, liabilities and results of the following subsidiaries in accordance with the accounting policy described in Note 2:
Ownership interest
NamePrincipal place of business/ Country of incorporation
2015 %
2014 %
Grays (Aust) Holdings Pty Limited Australia 100.00% -%
Graysonline (S.A.) Pty Limited Australia 100.00% 100.00%
Grays (NSW) Pty Limited Australia 100.00% 100.00%
Grays Eisdell Timms (WA) Pty Limited Australia 100.00% 100.00%
Grays (Vic) Pty Limited Australia 100.00% 100.00%
Grays Eisdell Timms (Qld) Pty Limited Australia 100.00% 100.00%
Grays Auctions Limited New Zealand 100.00% 100.00%
GLC Fine Wines & Liquor Pty Limited Australia 100.00% 100.00%
CM Pty Limited Australia 100.00% 100.00%
GEM Trust Australia 100.00% 100.00%
DealsDirect Group Pty Limited* Australia 100.00% -%
DealsDirect Pty Limited* Australia 100.00% -%
TopBuy Australia Pty Limited* Australia 100.00% -%
Grays (Intl) Pty Limited** Australia -% 100.00%
Grays Operations Pty Limited** Australia -% 100.00%
Graysonline Automotive Pty Limited** Australia -% 100.00%
Grays Business Sales Pty Limited** Australia -% 100.00%
Office Interior Solutions Pty Limited** Australia -% 100.00%
* Interest in subsidiaries that were acquired as part of the merger with Grays eCommerce Group Limited
** Subsidiaries de-registered during the financial year
57Annual Report 2015F
or p
erso
nal u
se o
nly

Note 35. Deed of cross guaranteeThe following entities are party to a deed of cross guarantee under which each company guarantees the debts of the others:
Grays eCommerce Group Limited
DealsDirect Group Pty Limited
DealsDirect Pty Limited
TopBuy Australia Pty Limited
Grays (Aust) Holdings Pty Limited
Graysonline (S.A.) Pty Limited
Grays (NSW) Pty Limited
Grays Eisdell Timms (WA) Pty Limited
Grays (Vic) Pty Limited
Grays Eisdell Timms (Qld) Pty Limited
GLC Fine Wines & Liquor Pty Limited
CM Pty Limited
By entering into the deed, the wholly-owned entities have been relieved from the requirement to prepare financial statements and directors' report under Class Order 98/1418 (as amended) issued by the Australian Securities and Investments Commission ('ASIC').
The above companies represent a 'Closed Group' for the purposes of the Class Order, and as there are no other parties to the deed of cross guarantee that are controlled by Grays eCommerce Group Limited, they also represent the 'Extended Closed Group'.
The statement of profit or loss and other comprehensive income and statement of financial position of the closed group are substantially the same as the Group's and therefore have not been separately disclosed.
The statement of profit or loss and other comprehensive income and statement of financial position of the ‘Closed Group’ can be found in the consolidated statement of profit or loss and other comprehensive income and statement of financial position along with the note on Grays eCommerce Group Limited as parent found in these financial statements.
Note 36. Events after the reporting period
Acquisition of DMS Davlan Pty Limited's business assets On 3 July 2015, the Group acquired the business assets of DMS Davlan Pty Limited ('DMS Davlan') for an initial consideration of $3,200,000 through a combination of cash and equity. Additionally, earn-out provisions linked to EBITDA contributions by DMS Davlan for the years ending 30 June 2016 and 30 June 2017 are in place. DMS Davlan is a leader in the sale by auction of agricultural machinery and brings recognised expertise in the transport and civil construction industries. DMS Davlan operates through a national network with 15 branches throughout Australia including 7 key regional locations. It is expected that the acquisition will strongly complement the existing B2B business. The fair values of the assets acquired and the liabilities assumed have yet to be determined.
No other matter or circumstance has arisen since 30 June 2015 that has significantly affected, or may significantly affect the Group's operations, the results of those operations, or the Group's state of affairs in future financial years.
Notes to the Financial StatementsCONTINUED
Grays eCommerce Group Limited58F
or p
erso
nal u
se o
nly

Note 37. Reconciliation of loss after income tax to net cash from/(used in) operating activities
Consolidated2015
$'0002014
$'000
Loss after income tax benefit for the year (1,205) (4,027)
Adjustments for:
Depreciation and amortisation 2,632 3,712
Impairment of intangibles – 2,845
Net loss on disposal of property, plant and equipment 29 29
Share-based payments 22 –
Write down of shareholders loans to recoverable amount – 150
Acquisition and merger integration costs 6,491 1,766
Change in operating assets and liabilities:
Decrease/(increase) in trade and other receivables 875 (863)
Decrease in inventories 4,978 1,160
Increase in deferred tax assets (2,505) (603)
Decrease/(increase) in prepayments (1,516) 302
Increase/(decrease) in trade and other payables (12,866) 932
Increase in provision for income tax 1,107 –
Increase/(decrease) in provisions (278) 765
Net cash from/(used in) operating activities (2,236) 6,168
Note 38. Earnings per shareConsolidated2015
$'0002014
$'000
Loss after income tax attributable to the owners of Grays eCommerce Group Limited (1,205) (4,027)
Number Number
Weighted average number of ordinary shares used in calculating basic earnings per share 76,831,724 54,297,221
Weighted average number of ordinary shares used in calculating diluted earnings per share 76,831,724 54,297,221
Cents Cents
Basic earnings per share (1.57) (7.42)
Diluted earnings per share (1.57) (7.42)
The weighted average number of ordinary shares are calculated based on the number of ordinary shares that would have been in existence had the reverse acquisition occurred as at 1 July 2013.
2,400,000 performance rights outstanding as at 30 June 2015 have been excluded from the the above calculations, as they were anti-dilutive. There were no outstanding performance rights as at 30 June 2014.
59Annual Report 2015F
or p
erso
nal u
se o
nly
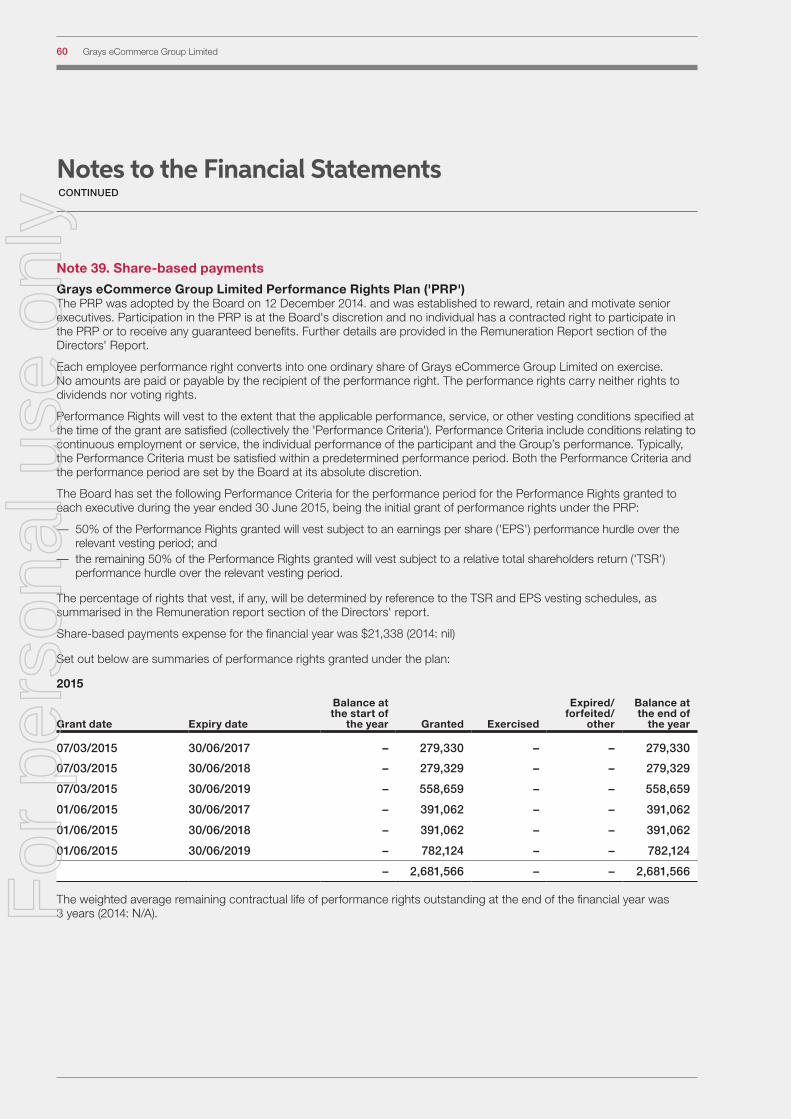
Note 39. Share-based payments
Grays eCommerce Group Limited Performance Rights Plan ('PRP') The PRP was adopted by the Board on 12 December 2014. and was established to reward, retain and motivate senior executives. Participation in the PRP is at the Board's discretion and no individual has a contracted right to participate in the PRP or to receive any guaranteed benefits. Further details are provided in the Remuneration Report section of the Directors' Report.
Each employee performance right converts into one ordinary share of Grays eCommerce Group Limited on exercise. No amounts are paid or payable by the recipient of the performance right. The performance rights carry neither rights to dividends nor voting rights.
Performance Rights will vest to the extent that the applicable performance, service, or other vesting conditions specified at the time of the grant are satisfied (collectively the 'Performance Criteria'). Performance Criteria include conditions relating to continuous employment or service, the individual performance of the participant and the Group’s performance. Typically, the Performance Criteria must be satisfied within a predetermined performance period. Both the Performance Criteria and the performance period are set by the Board at its absolute discretion.
The Board has set the following Performance Criteria for the performance period for the Performance Rights granted to each executive during the year ended 30 June 2015, being the initial grant of performance rights under the PRP:
— 50% of the Performance Rights granted will vest subject to an earnings per share ('EPS') performance hurdle over the relevant vesting period; and
— the remaining 50% of the Performance Rights granted will vest subject to a relative total shareholders return ('TSR') performance hurdle over the relevant vesting period.
The percentage of rights that vest, if any, will be determined by reference to the TSR and EPS vesting schedules, as summarised in the Remuneration report section of the Directors' report.
Share-based payments expense for the financial year was $21,338 (2014: nil)
Set out below are summaries of performance rights granted under the plan:
2015
Grant date Expiry date
Balance at the start of
the year Granted Exercised
Expired/ forfeited/
other
Balance at the end of
the year
07/03/2015 30/06/2017 – 279,330 – – 279,330
07/03/2015 30/06/2018 – 279,329 – – 279,329
07/03/2015 30/06/2019 – 558,659 – – 558,659
01/06/2015 30/06/2017 – 391,062 – – 391,062
01/06/2015 30/06/2018 – 391,062 – – 391,062
01/06/2015 30/06/2019 – 782,124 – – 782,124
– 2,681,566 – – 2,681,566
The weighted average remaining contractual life of performance rights outstanding at the end of the financial year was 3 years (2014: N/A).
Notes to the Financial StatementsCONTINUED
Grays eCommerce Group Limited60F
or p
erso
nal u
se o
nly

For the performance rights granted during the current financial year, the valuation model inputs used to determine the fair value at the grant date, are as follows:
Grant date Expiry date
Share price at grant date
$
Expected volatility
%
Dividend yield
%
Risk-free interest rate
%
Fair value at grant date
$
07/03/2015 30/06/2017 1.17 – – – 0.110
07/03/2015 30/06/2017 1.17 – – – 0.360
07/03/2015 30/06/2018 1.17 – – – 0.170
07/03/2015 30/06/2018 1.17 – – – 0.400
07/03/2015 30/06/2019 1.17 – – – 0.230
07/03/2015 30/06/2019 1.17 – – – 0.440
01/06/2015 30/06/2017 0.84 – – – 0.090
01/06/2015 30/06/2017 0.84 – – – 0.340
01/06/2015 30/06/2018 0.84 – – – 0.150
01/06/2015 30/06/2018 0.84 – – – 0.380
01/06/2015 30/06/2019 0.84 – – – 0.210
01/06/2015 30/06/2019 0.84 – – – 0.420
61Annual Report 2015F
or p
erso
nal u
se o
nly

FOR THE YEAR ENDED 30 JUNE 2015
Directors' Declaration
In the directors' opinion:
— the attached financial statements and notes comply with the Corporations Act 2001, the Accounting Standards, the Corporations Regulations 2001 and other mandatory professional reporting requirements;
— the attached financial statements and notes comply with International Financial Reporting Standards as issued by the International Accounting Standards Board as described in Note 2 to the financial statements;
— the attached financial statements and notes give a true and fair view of the Group's financial position as at 30 June 2015 and of its performance for the financial year ended on that date;
— there are reasonable grounds to believe that the Company will be able to pay its debts as and when they become due and payable; and
— at the date of this declaration, there are reasonable grounds to believe that the members of the Extended Closed Group will be able to meet any obligations or liabilities to which they are, or may become, subject by virtue of the deed of cross guarantee described in Note 35 to the financial statements.
The directors have been given the declarations required by section 295A of the Corporations Act 2001.
Signed in accordance with a resolution of directors made pursuant to section 295(5)(a) of the Corporations Act 2001.
On behalf of the directors
Jonathan PinshawChairman
24 August 2015 Sydney
Grays eCommerce Group Limited62F
or p
erso
nal u
se o
nly
Independent Auditor’s Report
63Annual Report 2015F
or p
erso
nal u
se o
nly

Independent Auditor’s ReportCONTINUED
Grays eCommerce Group Limited64F
or p
erso
nal u
se o
nly

FOR THE YEAR ENDED 30 JUNE 2015
Shareholder Information
The shareholder information set out below was applicable as at 6 August 2015.
Distribution of equitable securitiesAnalysis of number of equitable security holders by size of holding:
Number of holders
of ordinary shares
Number of holders of options
over ordinary
shares
1 to 1,000 2,265 –
1,001 to 5,000 345 –
5,001 to 10,000 122 –
10,001 to 100,000 166 –
100,001 and over 68 3
2,966 3
Holding less than a marketable parcel 2,119 –
Equity security holders
Twenty largest quoted equity security holdersThe names of the twenty largest security holders of quoted equity securities are listed below:
Ordinary shares
Number held
% of total shares issued
Alfred Street Nominees Pty Limited 14,469,202 15.58
Gold Fields House Nominees Pty Ltd 6,783,216 7.31
Poolman Enterprises Pty Ltd 6,762,100 7.28
UBS Nominees Pty Ltd 5,138,612 5.53
Michael Hayes + Tanya Melnychenko (The Hayes Family A/C) 3,289,600 3.54
Mark Bayliss 3,119,182 3.36
Fenton Paul Healy (Cheeky Monkey A/C) 3,098,766 3.34
Mark Stanbridge Kehoe 2,784,447 3.00
Denis Matthews Pty Ltd 2,552,000 2.75
Geoffrey Kelvin Gray 2,392,500 2.58
Adam Scharer 1,993,431 2.15
J P Morgan Nominees Australia Limited 1,930,515 2.08
Alfred Street Nominees Pty Limited (IDD Caledonia A/C) 1,861,684 2.01
Man Holdings Pty Limited (The Nelson Hybrid A/C) 1,861,684 2.01
CVC Limited 1,826,112 1.97
National Nominees Limited 1,758,994 1.89
Mutual Trust Pty Ltd 1,758,681 1.89
CVC Private Equity Limited 1,648,255 1.78
HSBC Custody Nominees (Australia) Limited-GSI EDA 1,641,027 1.77
Bernanne Pty Ltd 1,515,250 1.63
68,185,258 73.45
65Annual Report 2015F
or p
erso
nal u
se o
nly

CONTINUED
Shareholder Information
Unquoted equity securities
Number on issue
Number of holders
Unquoted Fully Paid Ordinary Shares 423,338 3
Options over ordinary shares issued 833,333 3
Performance rights over ordinary shares 2,681,564 6
Substantial holdersSubstantial holders in the Company are set out below:
Ordinary shares
Number held
% of total shares issued
Caledonia (Private) Investments Pty Limited 15,266,445 16.44
Poolman Enterprises Pty Limited 7,559,600 8.14
Bernanne Pty Ltd and Adam Scharer 5,267,362 5.67
Voting rightsThe voting rights attached to ordinary shares are set out below:
Ordinary sharesOn a show of hands every member present at a meeting in person or by proxy shall have one vote and upon a poll each share shall have one vote.
There are no other classes of equity securities.
Restricted securities
Class Expiry dateNumber
of shares
Ordinary shares 24 January 2016 423,338
Grays eCommerce Group Limited66F
or p
erso
nal u
se o
nly

FOR THE YEAR ENDED 30 JUNE 2015
Corporate Directory
Directors Jonathan Pinshaw (Chairman)
Mark Bayliss (Executive Director and Chief Executive Officer)
Naseema Sparks (Non-Executive Director)
Will Vicars (Non-Executive Director)
Bernie Campbell (Non-Executive Director)
Alternate director Bernard Stanton (Alternate to Will Vicars)
Company secretary Leanne Ralph
Notice of annual general meeting The details of the annual general meeting of Grays eCommerce Group Limited are:
Thursday 5th November 2015 at 11am at the offices of
Minter Ellison Level 40, Governor Macquarie Tower 1 Farrer Place Sydney NSW 2000
Registered office Homebush Corporate Park 29-33 Carter Street Lidcombe NSW 2141
Tel: +61 2 9741 9600 Fax: +61 2 9741 9680
Principal place of business Homebush Corporate Park 29-33 Carter Street Lidcombe NSW 2141
Share register Computershare Investor Services Pty Limited Level 4, 60 Carrington Street Sydney NSW 2000
Tel: 1300 787 272 Fax: +61 2 8235 8150
Auditor Ernst & Young Level 33, Ernst & Young Centre 680 George Street Sydney NSW 2000
Solicitors Minter Ellison Level 40, Governor Macquarie Tower 1 Farrer Place Sydney NSW 2000
Stock exchange listing Grays eCommerce Group Limited shares are listed on the Australian Securities Exchange (ASX code: GEG)
Website www.graysecommercegroup.com.au
Corporate Governance Statement The Corporate Governance Statement was approved by the Board of Directors on 24 August 2015 and can be found on the Investor Relations page at www.graysecommercegroup.com.au.
67Annual Report 2015F
or p
erso
nal u
se o
nly

www.graysecommercegroup.com.au
For
per
sona
l use
onl
y